Embed Size (px)
Citation preview
Experimental Results of Performance Tests on a
Four-Port Wave Rotor
NASA/TM—2007-214488
February 2007
Jack Wilson
QSS Group, Inc., Cleveland, Ohio
Gerard E. Welch
U.S. Army Research Laboratory, Glenn Research Center, Cleveland, Ohio
Daniel E. Paxson
Glenn Research Center, Cleveland, Ohio
ARL–TR–4044
U.S. ARMY
RESEARCH LABORATORY

NASA STI Program . . . in Profile
Since its founding, NASA has been dedicated to the
advancement of aeronautics and space science. The
NASA Scientific and Technical Information (STI)
program plays a key part in helping NASA maintain
this important role.
The NASA STI Program operates under the auspices
of the Agency Chief Information Officer. It collects,
organizes, provides for archiving, and disseminates
NASA’s STI. The NASA STI program provides access
to the NASA Aeronautics and Space Database and its
public interface, the NASA Technical Reports Server,
thus providing one of the largest collections of
aeronautical and space science STI in the world.
Results are published in both non-NASA channels and
by NASA in the NASA STI Report Series, which
includes the following report types:
• TECHNICAL PUBLICATION. Reports of
completed research or a major significant phase
of research that present the results of NASA
programs and include extensive data or theoretical
analysis. Includes compilations of significant
scientific and technical data and information
deemed to be of continuing reference value.
NASA counterpart of peer-reviewed formal
professional papers but has less stringent
limitations on manuscript length and extent of
graphic presentations.
• TECHNICAL MEMORANDUM. Scientific
and technical findings that are preliminary or
of specialized interest, e.g., quick release
reports, working papers, and bibliographies that
contain minimal annotation. Does not contain
extensive analysis.
• CONTRACTOR REPORT. Scientific and
technical findings by NASA-sponsored
contractors and grantees.
• CONFERENCE PUBLICATION. Collected
papers from scientific and technical
conferences, symposia, seminars, or other
meetings sponsored or cosponsored by NASA.
• SPECIAL PUBLICATION. Scientific,
technical, or historical information from
NASA programs, projects, and missions, often
concerned with subjects having substantial
public interest.
• TECHNICAL TRANSLATION. English-
language translations of foreign scientific and
technical material pertinent to NASA’s mission.
Specialized services also include creating custom
thesauri, building customized databases, organizing
and publishing research results.
For more information about the NASA STI
program, see the following:
• Access the NASA STI program home page at
http://www.sti.nasa.gov
• E-mail your question via the Internet to
• Fax your question to the NASA STI Help Desk
at 301–621–0134
• Telephone the NASA STI Help Desk at
301–621–0390
• Write to:
NASA Center for AeroSpace Information (CASI)
7115 Standard Drive
Hanover, MD 21076–1320
Experimental Results of Performance Tests on a
Four-Port Wave Rotor
NASA/TM—2007-214488
February 2007
National Aeronautics and
Space Administration
Glenn Research Center
Cleveland, Ohio 44135
ARL–TR–4044
U.S. ARMY
RESEARCH LABORATORY
Prepared for the
45th Aerospace Sciences Meeting and Exhibit
sponsored by the American Institute of Aeronautics and Astronautics
Reno, Nevada, January 8–11, 2007
Jack Wilson
QSS Group, Inc., Cleveland, Ohio
Gerard E. Welch
U.S. Army Research Laboratory, Glenn Research Center, Cleveland, Ohio
Daniel E. Paxson
Glenn Research Center, Cleveland, Ohio
Acknowledgments
This work is obviously the work of many people, to all of whom we are indebted. In particular the efforts of Thomas Jett,
Richard Senyitko, Cleve Horn III, Paulette Adams, Carlos Gomez, and Robert Pastel in the test cell, and the design teams
under Laura Stokely, and later Paul Solana, deserve special recognition. Funding provided by Leo Burkardt under the
Constant Volume Combustion Cycle Engine program was greatly appreciated.
Available from
NASA Center for Aerospace Information
7115 Standard Drive
Hanover, MD 21076–1320
National Technical Information Service
5285 Port Royal Road
Springfield, VA 22161
Available electronically at http://gltrs.grc.nasa.gov
Trade names and trademarks are used in this report for identification
only. Their usage does not constitute an official endorsement,
either expressed or implied, by the National Aeronautics and
Space Administration.
This work was sponsored by the Fundamental Aeronautics Program
at the NASA Glenn Research Center.
Level of Review: This material has been technically reviewed by technical management.
NASA/TM—2007-214488 1
Experimental Results of Performance Tests on a Four-Port Wave Rotor
Jack Wilson
QSS Group, Inc. Cleveland, Ohio 44135
Gerard E. Welch
U.S. Army Research Laboratory Glenn Research Center Cleveland, Ohio 44135
Daniel E. Paxson
National Aeronautics and Space Administration Glenn Research Center Cleveland, Ohio 44135
Abstract A series of tests has been performed on a four-port wave rotor suitable for use as a topping stage on a gas
turbine engine, to measure the overall pressure ratio obtainable as a function of temperature ratio, inlet mass flow, loop flow ratio, and rotor speed. The wave rotor employed an open high pressure loop that is the high pressure inlet flow was not the air exhausted from the high pressure outlet, but was obtained from a separate heated source, although the mass flow rates of the two flows were balanced. This permitted the choice of a range of loop-flow ratios (i.e., ratio of high pressure flow to low pressure flow), as well as the possibility of examining the effect of mass flow imbalance. Imbalance could occur as a result of leakage or deliberate bleeding for cooling air. Measurements of the pressure drop in the high pressure loop were also obtained. A pressure ratio of 1.17 was obtained at a temperature ratio of 2.0, with an inlet mass flow of 0.6 lb/s. Earlier tests had given a pressure ratio of less than 1.12. The improvement was due to improved sealing between the high pressure and low pressure loops, and a modification to the movable end-wall which is provided to allow for rotor expansion.
Nomenclature G leakage parameter = 2δ/h H passage height kloss loss coefficient for heater loop m mass flow rate N rotor speed (rpm) P stagnation pressure T stagnation temperature TR target temperature ratio for T4/T1 U mixed-out value of velocity γ ratio of specific heats
ΔT temperature change due to heat transfer δ gap between rotor and end-wall η efficiency λ loop flow ratio ( )13 mm= ρ mixed-out value of density
NASA/TM—2007-214488 2
Subscripts c compression x expansion 1 Port 1 2 Port 2 3 Port 3 4 Port 4
I. Introduction At NASA, wave rotors have been investigated for use as a topping stage for gas-turbine engines in order to
increase performance while maintaining temperatures in rotating parts at levels used in current technology. The primary application considered is aircraft propulsion or auxiliary power. Calculations have shown that increases in specific power of ~20 percent, and reductions in specific fuel consumption of ~15 percent are possible (refs. 1 and 2). The original intended use of the wave rotor was as a topping stage for ground-based power units (ref. 3) and it has been demonstrated that large increases in efficiency and power are possible for that application (Zauner et al.) (ref. 4). In the configuration used by Zauner et al., the power generated by the topping stage was extracted by an additional power turbine, with its own shaft. Thus this power unit with a wave rotor topping stage is more complex than a power unit without the topping stage.
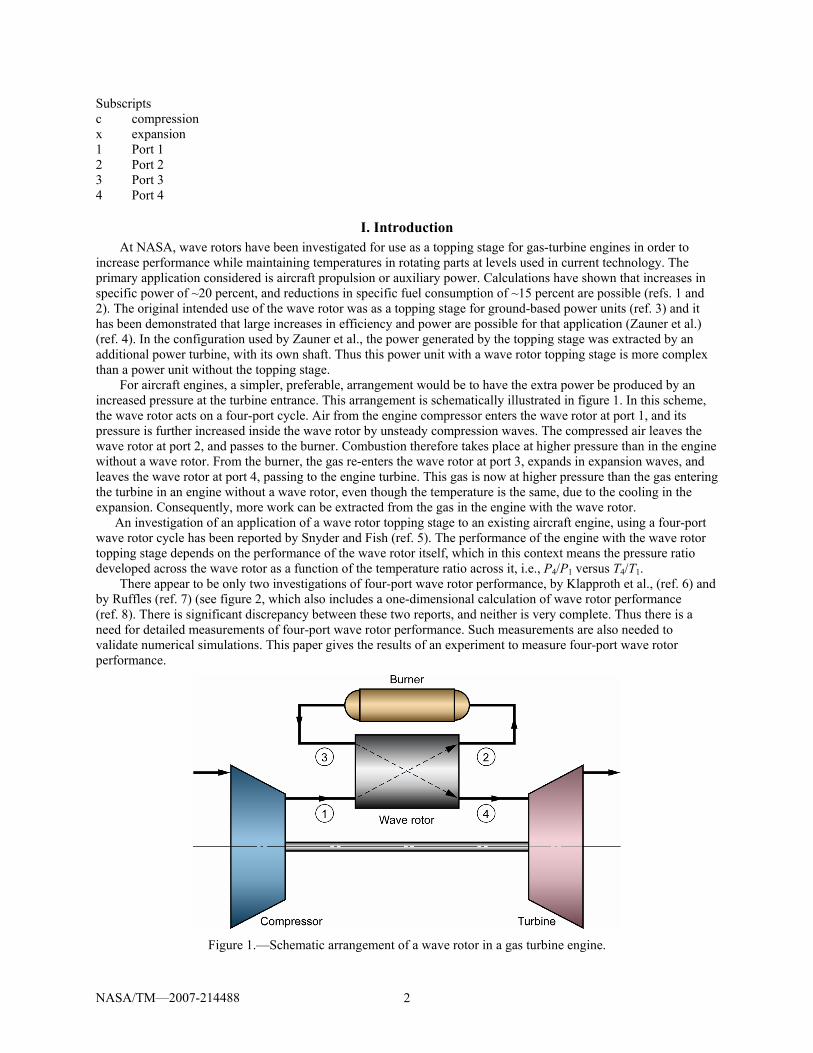
For aircraft engines, a simpler, preferable, arrangement would be to have the extra power be produced by an increased pressure at the turbine entrance. This arrangement is schematically illustrated in figure 1. In this scheme, the wave rotor acts on a four-port cycle. Air from the engine compressor enters the wave rotor at port 1, and its pressure is further increased inside the wave rotor by unsteady compression waves. The compressed air leaves the wave rotor at port 2, and passes to the burner. Combustion therefore takes place at higher pressure than in the engine without a wave rotor. From the burner, the gas re-enters the wave rotor at port 3, expands in expansion waves, and leaves the wave rotor at port 4, passing to the engine turbine. This gas is now at higher pressure than the gas entering the turbine in an engine without a wave rotor, even though the temperature is the same, due to the cooling in the expansion. Consequently, more work can be extracted from the gas in the engine with the wave rotor. An investigation of an application of a wave rotor topping stage to an existing aircraft engine, using a four-port wave rotor cycle has been reported by Snyder and Fish (ref. 5). The performance of the engine with the wave rotor topping stage depends on the performance of the wave rotor itself, which in this context means the pressure ratio developed across the wave rotor as a function of the temperature ratio across it, i.e., P4/P1 versus T4/T1.
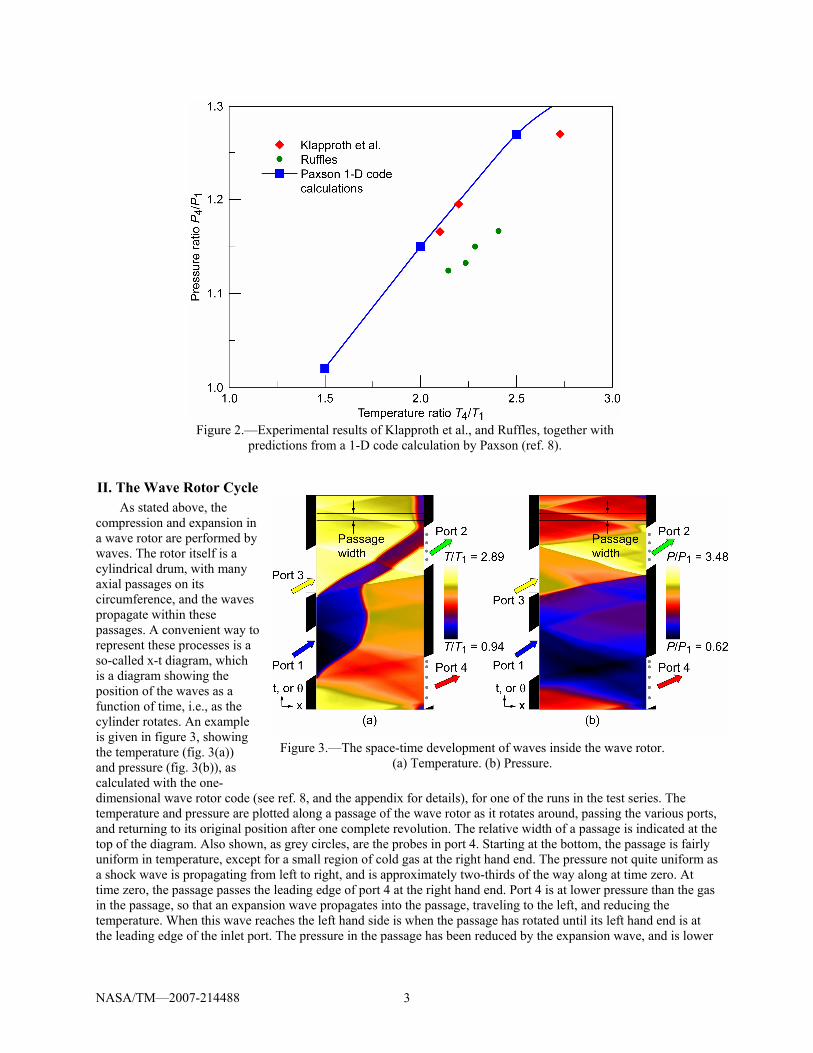
There appear to be only two investigations of four-port wave rotor performance, by Klapproth et al., (ref. 6) and by Ruffles (ref. 7) (see figure 2, which also includes a one-dimensional calculation of wave rotor performance (ref. 8). There is significant discrepancy between these two reports, and neither is very complete. Thus there is a need for detailed measurements of four-port wave rotor performance. Such measurements are also needed to validate numerical simulations. This paper gives the results of an experiment to measure four-port wave rotor performance.
Figure 1.—Schematic arrangement of a wave rotor in a gas turbine engine.
NASA/TM—2007-214488 3
II. The Wave Rotor Cycle As stated above, the
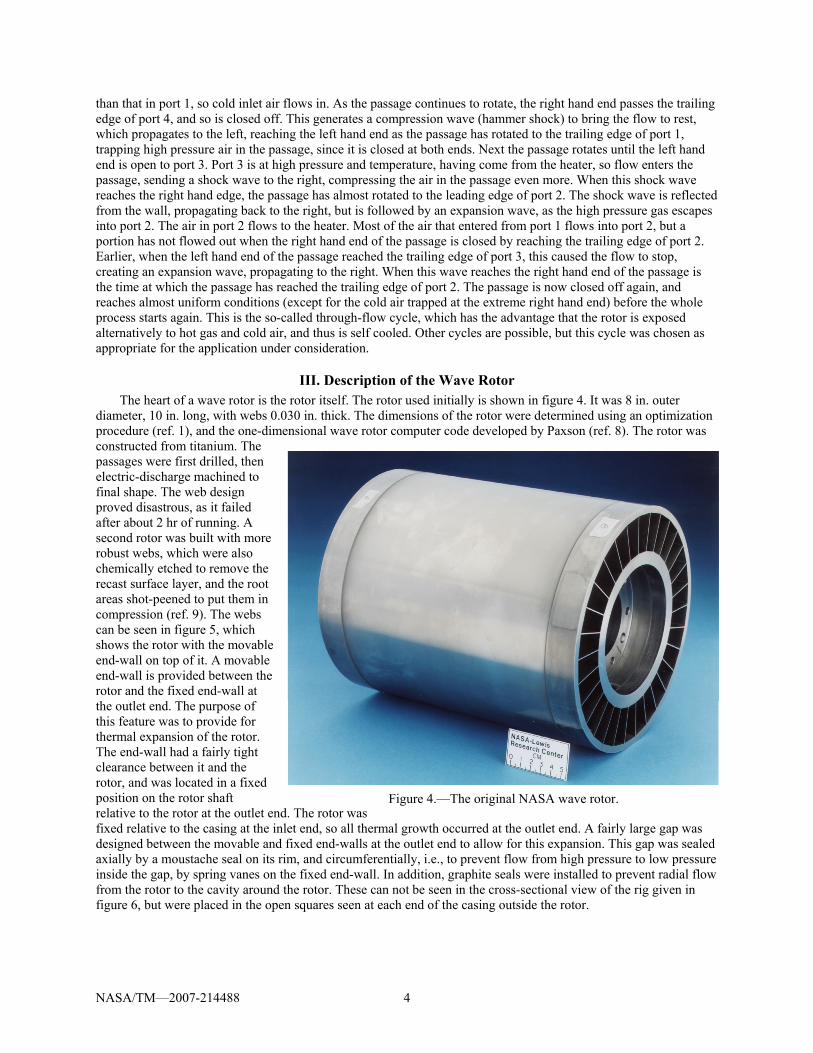
compression and expansion in a wave rotor are performed by waves. The rotor itself is a cylindrical drum, with many axial passages on its circumference, and the waves propagate within these passages. A convenient way to represent these processes is a so-called x-t diagram, which is a diagram showing the position of the waves as a function of time, i.e., as the cylinder rotates. An example is given in figure 3, showing the temperature (fig. 3(a)) and pressure (fig. 3(b)), as calculated with the one-dimensional wave rotor code (see ref. 8, and the appendix for details), for one of the runs in the test series. The temperature and pressure are plotted along a passage of the wave rotor as it rotates around, passing the various ports, and returning to its original position after one complete revolution. The relative width of a passage is indicated at the top of the diagram. Also shown, as grey circles, are the probes in port 4. Starting at the bottom, the passage is fairly uniform in temperature, except for a small region of cold gas at the right hand end. The pressure not quite uniform as a shock wave is propagating from left to right, and is approximately two-thirds of the way along at time zero. At time zero, the passage passes the leading edge of port 4 at the right hand end. Port 4 is at lower pressure than the gas in the passage, so that an expansion wave propagates into the passage, traveling to the left, and reducing the temperature. When this wave reaches the left hand side is when the passage has rotated until its left hand end is at the leading edge of the inlet port. The pressure in the passage has been reduced by the expansion wave, and is lower
Figure 3.—The space-time development of waves inside the wave rotor. (a) Temperature. (b) Pressure.
Figure 2.—Experimental results of Klapproth et al., and Ruffles, together with
predictions from a 1-D code calculation by Paxson (ref. 8).
NASA/TM—2007-214488 4
than that in port 1, so cold inlet air flows in. As the passage continues to rotate, the right hand end passes the trailing edge of port 4, and so is closed off. This generates a compression wave (hammer shock) to bring the flow to rest, which propagates to the left, reaching the left hand end as the passage has rotated to the trailing edge of port 1, trapping high pressure air in the passage, since it is closed at both ends. Next the passage rotates until the left hand end is open to port 3. Port 3 is at high pressure and temperature, having come from the heater, so flow enters the passage, sending a shock wave to the right, compressing the air in the passage even more. When this shock wave reaches the right hand edge, the passage has almost rotated to the leading edge of port 2. The shock wave is reflected from the wall, propagating back to the right, but is followed by an expansion wave, as the high pressure gas escapes into port 2. The air in port 2 flows to the heater. Most of the air that entered from port 1 flows into port 2, but a portion has not flowed out when the right hand end of the passage is closed by reaching the trailing edge of port 2. Earlier, when the left hand end of the passage reached the trailing edge of port 3, this caused the flow to stop, creating an expansion wave, propagating to the right. When this wave reaches the right hand end of the passage is the time at which the passage has reached the trailing edge of port 2. The passage is now closed off again, and reaches almost uniform conditions (except for the cold air trapped at the extreme right hand end) before the whole process starts again. This is the so-called through-flow cycle, which has the advantage that the rotor is exposed alternatively to hot gas and cold air, and thus is self cooled. Other cycles are possible, but this cycle was chosen as appropriate for the application under consideration.
III. Description of the Wave Rotor The heart of a wave rotor is the rotor itself. The rotor used initially is shown in figure 4. It was 8 in. outer
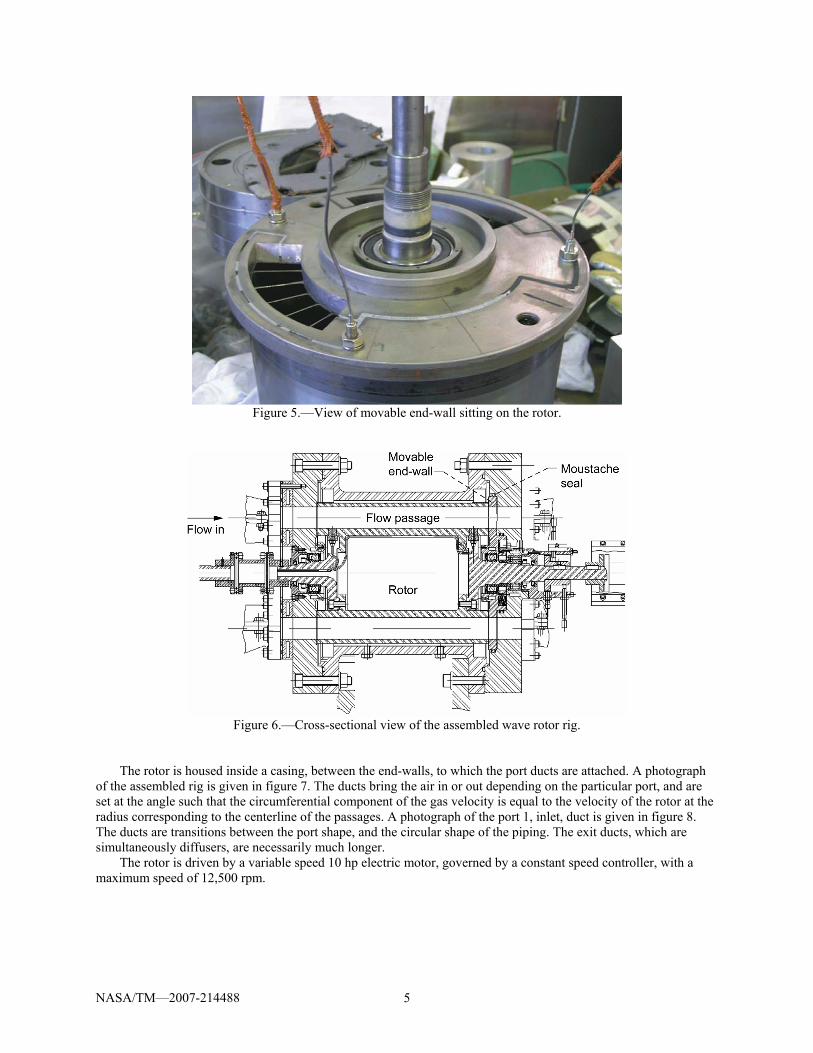
diameter, 10 in. long, with webs 0.030 in. thick. The dimensions of the rotor were determined using an optimization procedure (ref. 1), and the one-dimensional wave rotor computer code developed by Paxson (ref. 8). The rotor was constructed from titanium. The passages were first drilled, then electric-discharge machined to final shape. The web design proved disastrous, as it failed after about 2 hr of running. A second rotor was built with more robust webs, which were also chemically etched to remove the recast surface layer, and the root areas shot-peened to put them in compression (ref. 9). The webs can be seen in figure 5, which shows the rotor with the movable end-wall on top of it. A movable end-wall is provided between the rotor and the fixed end-wall at the outlet end. The purpose of this feature was to provide for thermal expansion of the rotor. The end-wall had a fairly tight clearance between it and the rotor, and was located in a fixed position on the rotor shaft relative to the rotor at the outlet end. The rotor was fixed relative to the casing at the inlet end, so all thermal growth occurred at the outlet end. A fairly large gap was designed between the movable and fixed end-walls at the outlet end to allow for this expansion. This gap was sealed axially by a moustache seal on its rim, and circumferentially, i.e., to prevent flow from high pressure to low pressure inside the gap, by spring vanes on the fixed end-wall. In addition, graphite seals were installed to prevent radial flow from the rotor to the cavity around the rotor. These can not be seen in the cross-sectional view of the rig given in figure 6, but were placed in the open squares seen at each end of the casing outside the rotor.
Figure 4.—The original NASA wave rotor.
NASA/TM—2007-214488 5
Figure 5.—View of movable end-wall sitting on the rotor.
Figure 6.—Cross-sectional view of the assembled wave rotor rig.
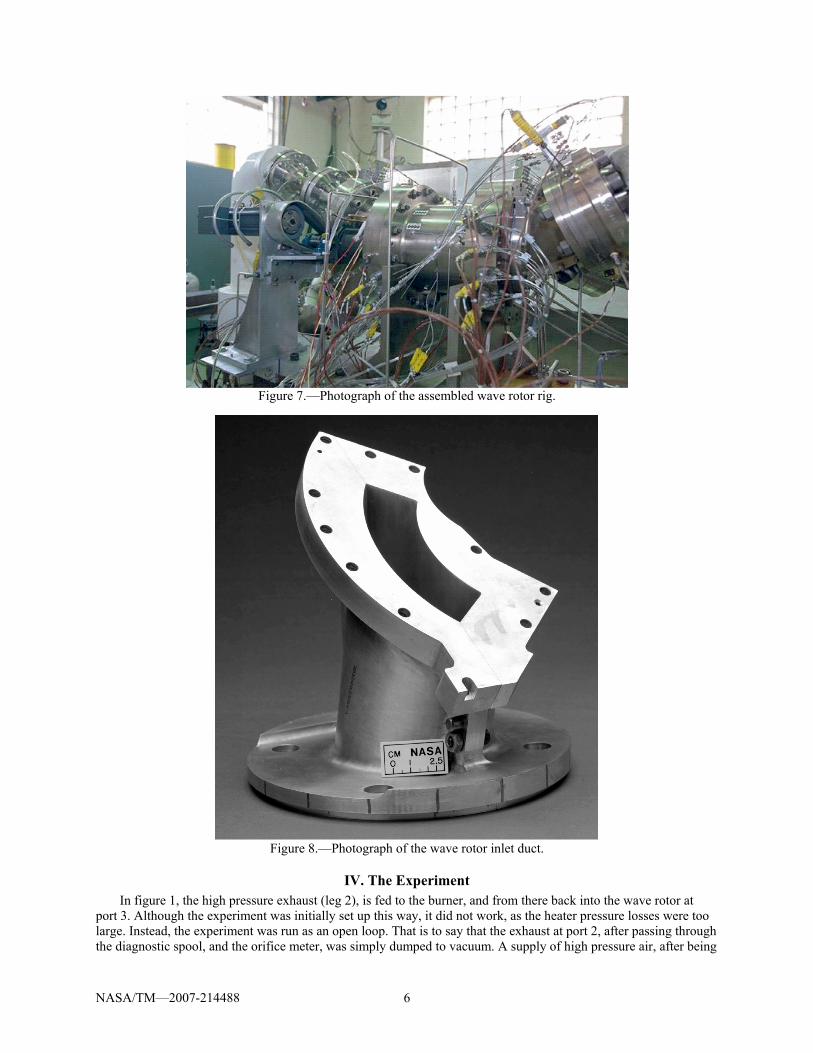
The rotor is housed inside a casing, between the end-walls, to which the port ducts are attached. A photograph of the assembled rig is given in figure 7. The ducts bring the air in or out depending on the particular port, and are set at the angle such that the circumferential component of the gas velocity is equal to the velocity of the rotor at the radius corresponding to the centerline of the passages. A photograph of the port 1, inlet, duct is given in figure 8. The ducts are transitions between the port shape, and the circular shape of the piping. The exit ducts, which are simultaneously diffusers, are necessarily much longer.
The rotor is driven by a variable speed 10 hp electric motor, governed by a constant speed controller, with a maximum speed of 12,500 rpm.
NASA/TM—2007-214488 6
Figure 7.—Photograph of the assembled wave rotor rig.
Figure 8.—Photograph of the wave rotor inlet duct.
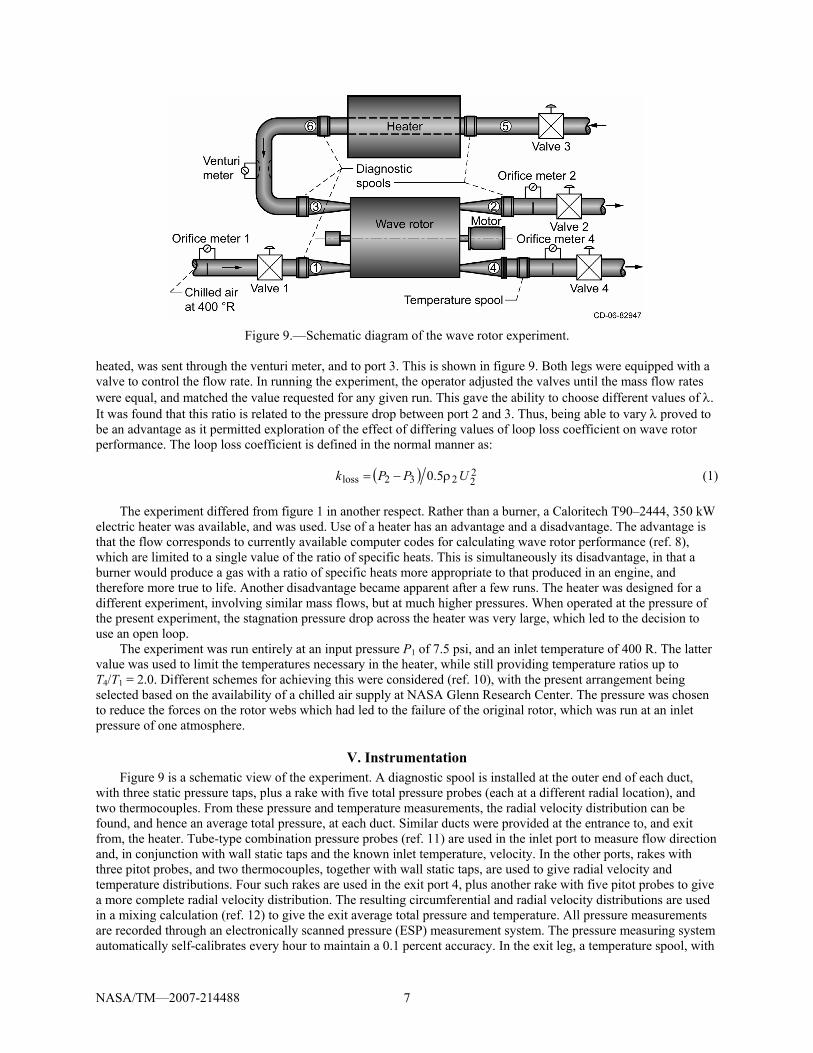
IV. The Experiment In figure 1, the high pressure exhaust (leg 2), is fed to the burner, and from there back into the wave rotor at
port 3. Although the experiment was initially set up this way, it did not work, as the heater pressure losses were too large. Instead, the experiment was run as an open loop. That is to say that the exhaust at port 2, after passing through the diagnostic spool, and the orifice meter, was simply dumped to vacuum. A supply of high pressure air, after being
NASA/TM—2007-214488 7
Figure 9.—Schematic diagram of the wave rotor experiment.
heated, was sent through the venturi meter, and to port 3. This is shown in figure 9. Both legs were equipped with a valve to control the flow rate. In running the experiment, the operator adjusted the valves until the mass flow rates were equal, and matched the value requested for any given run. This gave the ability to choose different values of λ. It was found that this ratio is related to the pressure drop between port 2 and 3. Thus, being able to vary λ proved to be an advantage as it permitted exploration of the effect of differing values of loop loss coefficient on wave rotor performance. The loop loss coefficient is defined in the normal manner as:
( ) 22232loss 5.0 UPPk ρ−= (1)
The experiment differed from figure 1 in another respect. Rather than a burner, a Caloritech T90–2444, 350 kW
electric heater was available, and was used. Use of a heater has an advantage and a disadvantage. The advantage is that the flow corresponds to currently available computer codes for calculating wave rotor performance (ref. 8), which are limited to a single value of the ratio of specific heats. This is simultaneously its disadvantage, in that a burner would produce a gas with a ratio of specific heats more appropriate to that produced in an engine, and therefore more true to life. Another disadvantage became apparent after a few runs. The heater was designed for a different experiment, involving similar mass flows, but at much higher pressures. When operated at the pressure of the present experiment, the stagnation pressure drop across the heater was very large, which led to the decision to use an open loop.
The experiment was run entirely at an input pressure P1 of 7.5 psi, and an inlet temperature of 400 R. The latter value was used to limit the temperatures necessary in the heater, while still providing temperature ratios up to T4/T1 = 2.0. Different schemes for achieving this were considered (ref. 10), with the present arrangement being selected based on the availability of a chilled air supply at NASA Glenn Research Center. The pressure was chosen to reduce the forces on the rotor webs which had led to the failure of the original rotor, which was run at an inlet pressure of one atmosphere.
V. Instrumentation Figure 9 is a schematic view of the experiment. A diagnostic spool is installed at the outer end of each duct,
with three static pressure taps, plus a rake with five total pressure probes (each at a different radial location), and two thermocouples. From these pressure and temperature measurements, the radial velocity distribution can be found, and hence an average total pressure, at each duct. Similar ducts were provided at the entrance to, and exit from, the heater. Tube-type combination pressure probes (ref. 11) are used in the inlet port to measure flow direction and, in conjunction with wall static taps and the known inlet temperature, velocity. In the other ports, rakes with three pitot probes, and two thermocouples, together with wall static taps, are used to give radial velocity and temperature distributions. Four such rakes are used in the exit port 4, plus another rake with five pitot probes to give a more complete radial velocity distribution. The resulting circumferential and radial velocity distributions are used in a mixing calculation (ref. 12) to give the exit average total pressure and temperature. All pressure measurements are recorded through an electronically scanned pressure (ESP) measurement system. The pressure measuring system automatically self-calibrates every hour to maintain a 0.1 percent accuracy. In the exit leg, a temperature spool, with
NASA/TM—2007-214488 8
nine thermocouples, each sampling an equal section of the spool area, with the resulting signals electronically averaged, is used to give the exit temperature T4. Thermocouple readings are corrected to total temperature readings using the recovery correction factor of Glawe, Krause, and Dudzinski (ref. 13). The rotor speed is read by a once-per-revolution proximity counter. All the above signals are fed to a computer, which takes 30 readings for each data point, and then stores the average value.
Mass flow rates are measured by standard orifice meters on the inlet leg 1, and the outlet legs 2 and 4. The mass flow rate from the heater is read by a venturi meter. Since venturi meters are more accurate than orifice meters, each orifice meter was calibrated against the venturi meter, by arranging for flow to pass only through the venturi meter and the orifice meter in calibration. The flows from ports 2 and 4 are very non-uniform in temperature. Each orifice meter uses one thermocouple to monitor the temperature of the air passing through it. It is possible then that the mass flow rate value could vary depending on whether the thermocouple sampled the hot portion of the flow, or the cold portion. After some early runs showed considerable variation in results, a VORTAB© was installed upstream of the leg 2 orifice meter, to provide significant mixing of the flow, thereby ensuring a single value of temperature. This appeared to solve the problem.
VI. Data Corrections Despite the best efforts of the operators, there was inevitably some imbalance in the high pressure loop mass
flows, and also for those runs in which a constant temperature ratio was required, some variation in temperature ratio. Consequently, for any given series of readings, the data was entered into a statistical analysis which included ( )123 −mm , and (T4/T1–TR) as error parameters in addition to the parameters affecting the change in performance being investigated. If the variation due to these errors was significant, the program would provide a multiplying constant, which was then used to correct the data to give a value corresponding to zero error. The variation in rotor speed was so small that there was no need to correct for any variation.
VII. Results The test series consisted of three basic types of tests. These were (a) measurement of the ratio P4/P1 at a fixed
inlet mass flow as the temperature ratio was raised, (b) measurement of the ratio P4/P1 at a fixed value of T4/T1, and fixed values of N and λ, as 1m was changed, for different values of λ, and (c) measurement of P4/P1 at fixed T4/T1,
1m and λ, as N was changed.
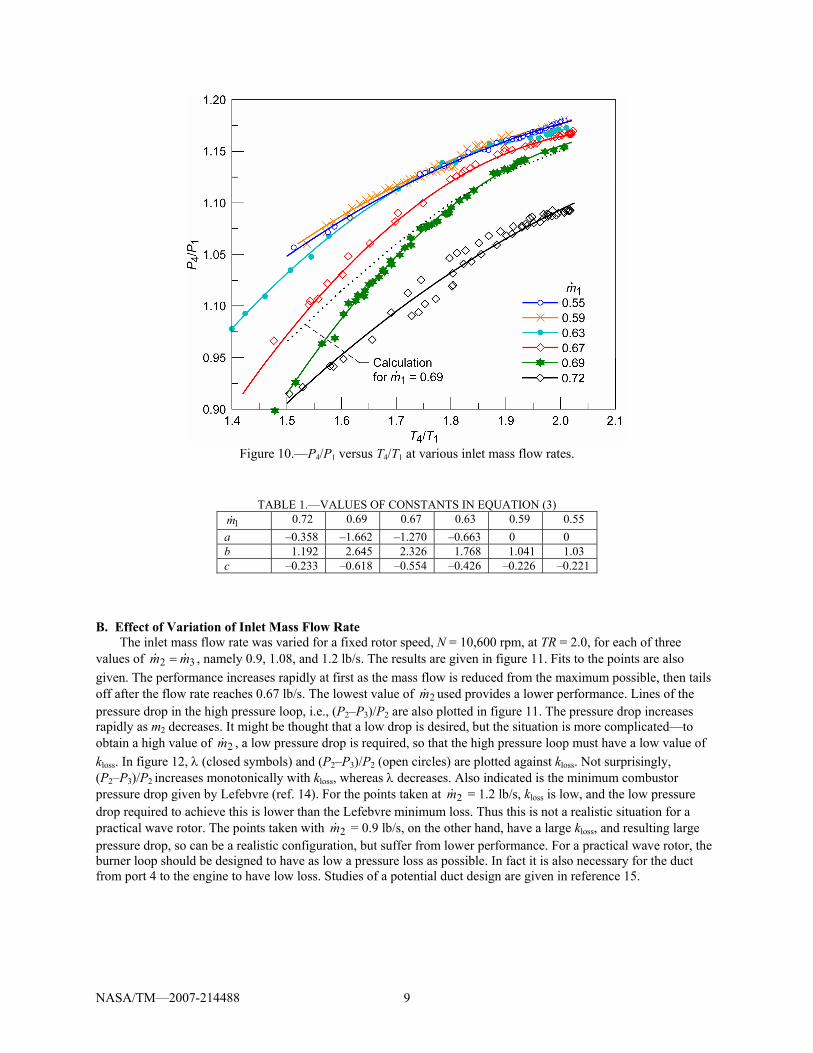
A. Effect of Variation of Temperature Ratio Runs were made in which the pressure ratio P4/P1 was measured as T4/T1 was raised from about 1.6 to 2.0, at
various values of lb/s08.132,1 == mmm , and a fixed N = 10,600 rpm. This is not representative of a real wave rotor with port 2 connected directly to port 3. Such a wave rotor would have a pressure drop in the upper loop determined by the pressure loss factor, i.e., kloss, plus a pressure drop due to heat addition (ref. 14). The latter is given approximately by:
( ) ( )1/5.0 2322223 −=ρ− TTUPP hot (2)
and is typically small compared with the pressure drop due to the pressure loss factor. Running the experiment at constant kloss would therefore correspond roughly to a real wave rotor. This was in fact the procedure for some very early runs made with the present wave rotor. However, it was difficult to do, since this involved setting a different value of λ for each point as the temperature was raised. These runs had shown that the performance did not vary much with variation in λ, and so it was decided to fix the value of 32 mm = in the present tests, as this made the tests much easier to run. The value chosen, 1.08 lb/s, corresponds to the design value of λ = 1.6 for an inlet mass flow of 0.67 lb/s. The results of the tests are given in figure 10. The tests were run for a range of inlet mass flows, from the maximum possible of 0.72 lb/s when the valve V4 is wide open, to the lowest value of 0.55 lb/s. The lines are least square fits to the data points, which are all of the form:
( ) ( )2141413 // TTcTTbaPP ++= (3)
The values of a, b, and c for each inlet mass flow rate are given in table 1. Also given in figure 10 is a curve of
pressure ratio versus temperature ratio for an inlet mass flow of 0.69 lb/s calculated with the one-dimensional wave rotor code, showing remarkably good agreement.
NASA/TM—2007-214488 9
Figure 10.—P4/P1 versus T4/T1 at various inlet mass flow rates.
TABLE 1.—VALUES OF CONSTANTS IN EQUATION (3) 1m 0.72 0.69 0.67 0.63 0.59 0.55
a –0.358 –1.662 –1.270 –0.663 0 0 b 1.192 2.645 2.326 1.768 1.041 1.03 c –0.233 –0.618 –0.554 –0.426 –0.226 –0.221
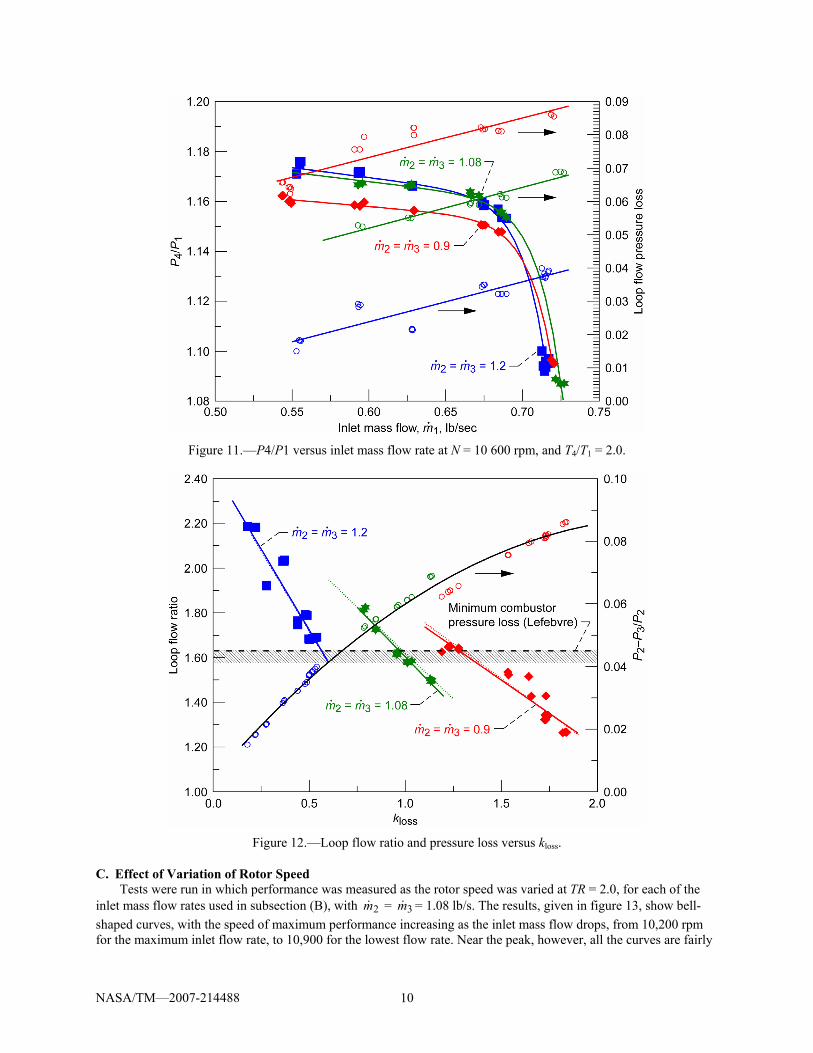
B. Effect of Variation of Inlet Mass Flow Rate The inlet mass flow rate was varied for a fixed rotor speed, N = 10,600 rpm, at TR = 2.0, for each of three
values of 32 mm = , namely 0.9, 1.08, and 1.2 lb/s. The results are given in figure 11. Fits to the points are also given. The performance increases rapidly at first as the mass flow is reduced from the maximum possible, then tails off after the flow rate reaches 0.67 lb/s. The lowest value of 2m used provides a lower performance. Lines of the pressure drop in the high pressure loop, i.e., (P2–P3)/P2 are also plotted in figure 11. The pressure drop increases rapidly as m2 decreases. It might be thought that a low drop is desired, but the situation is more complicated—to obtain a high value of 2m , a low pressure drop is required, so that the high pressure loop must have a low value of kloss. In figure 12, λ (closed symbols) and (P2–P3)/P2 (open circles) are plotted against kloss. Not surprisingly, (P2–P3)/P2 increases monotonically with kloss, whereas λ decreases. Also indicated is the minimum combustor pressure drop given by Lefebvre (ref. 14). For the points taken at 2m = 1.2 lb/s, kloss is low, and the low pressure drop required to achieve this is lower than the Lefebvre minimum loss. Thus this is not a realistic situation for a practical wave rotor. The points taken with 2m = 0.9 lb/s, on the other hand, have a large kloss, and resulting large pressure drop, so can be a realistic configuration, but suffer from lower performance. For a practical wave rotor, the burner loop should be designed to have as low a pressure loss as possible. In fact it is also necessary for the duct from port 4 to the engine to have low loss. Studies of a potential duct design are given in reference 15.
NASA/TM—2007-214488 10
Figure 11.—P4/P1 versus inlet mass flow rate at N = 10 600 rpm, and T4/T1 = 2.0.
Figure 12.—Loop flow ratio and pressure loss versus kloss.
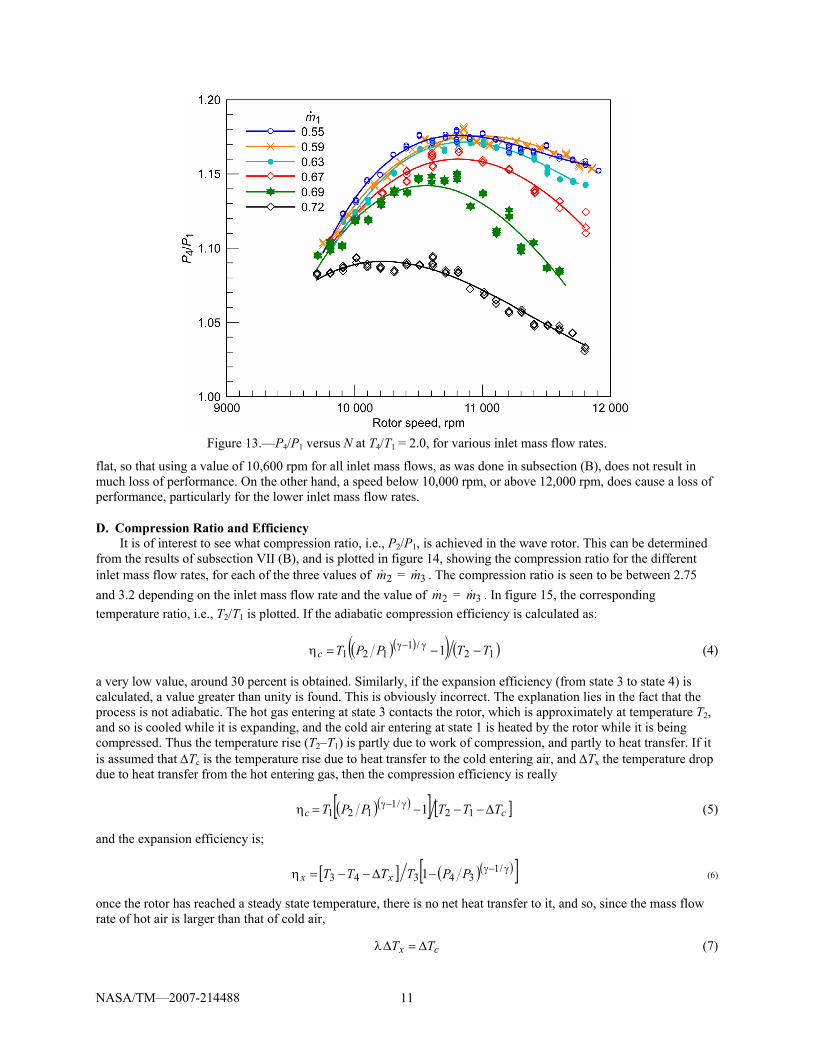
C. Effect of Variation of Rotor Speed Tests were run in which performance was measured as the rotor speed was varied at TR = 2.0, for each of the
inlet mass flow rates used in subsection (B), with 2m = 3m = 1.08 lb/s. The results, given in figure 13, show bell-shaped curves, with the speed of maximum performance increasing as the inlet mass flow drops, from 10,200 rpm for the maximum inlet flow rate, to 10,900 for the lowest flow rate. Near the peak, however, all the curves are fairly
NASA/TM—2007-214488 11
Figure 13.—P4/P1 versus N at T4/T1 = 2.0, for various inlet mass flow rates.
flat, so that using a value of 10,600 rpm for all inlet mass flows, as was done in subsection (B), does not result in much loss of performance. On the other hand, a speed below 10,000 rpm, or above 12,000 rpm, does cause a loss of performance, particularly for the lower inlet mass flow rates.
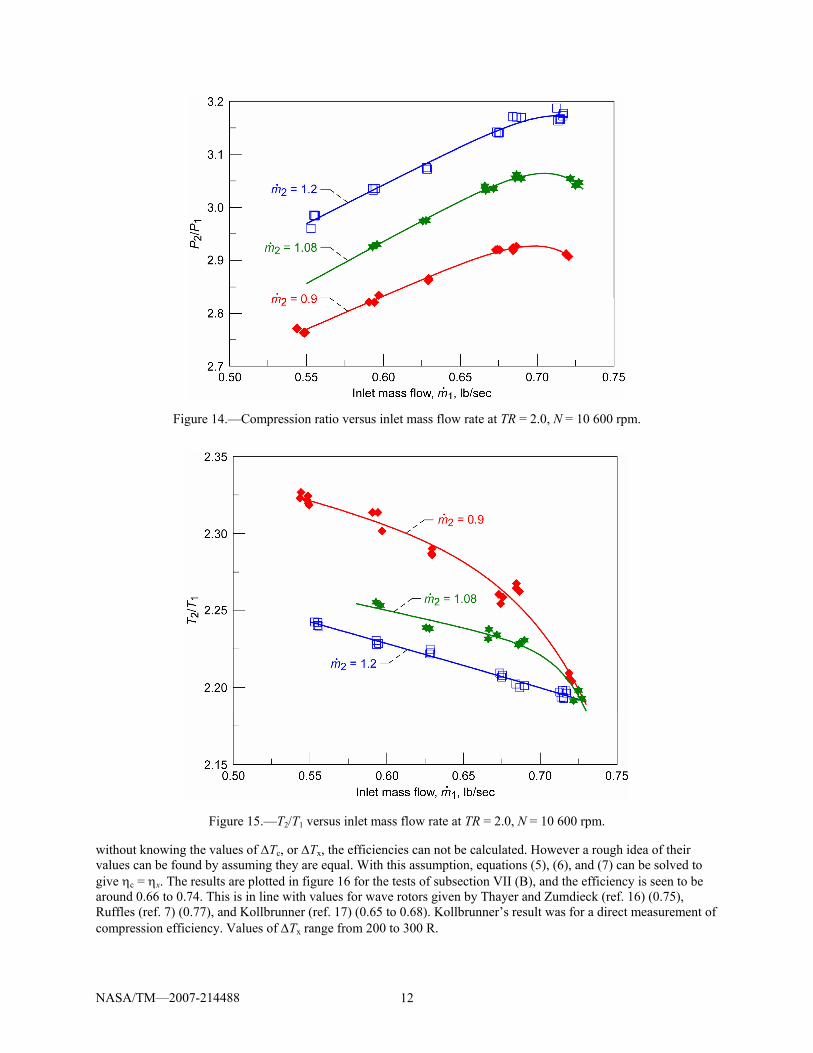
D. Compression Ratio and Efficiency It is of interest to see what compression ratio, i.e., P2/P1, is achieved in the wave rotor. This can be determined
from the results of subsection VII (B), and is plotted in figure 14, showing the compression ratio for the different inlet mass flow rates, for each of the three values of 2m = 3m . The compression ratio is seen to be between 2.75 and 3.2 depending on the inlet mass flow rate and the value of 2m = 3m . In figure 15, the corresponding temperature ratio, i.e., T2/T1 is plotted. If the adiabatic compression efficiency is calculated as:
( )( )( ) ( )12/1
121 1 TTPPTc −−=η γ−γ (4) a very low value, around 30 percent is obtained. Similarly, if the expansion efficiency (from state 3 to state 4) is calculated, a value greater than unity is found. This is obviously incorrect. The explanation lies in the fact that the process is not adiabatic. The hot gas entering at state 3 contacts the rotor, which is approximately at temperature T2, and so is cooled while it is expanding, and the cold air entering at state 1 is heated by the rotor while it is being compressed. Thus the temperature rise (T2–T1) is partly due to work of compression, and partly to heat transfer. If it is assumed that ΔTc is the temperature rise due to heat transfer to the cold entering air, and ΔTx the temperature drop due to heat transfer from the hot entering gas, then the compression efficiency is really
( )( )[ ] [ ]cc TTTPPT Δ−−−=η γ−γ12
/1121 1 (5)
and the expansion efficiency is;
[ ] ( )( )[ ]γ−γ−Δ−−=η /134343 1 PPTTTT xx (6)
once the rotor has reached a steady state temperature, there is no net heat transfer to it, and so, since the mass flow rate of hot air is larger than that of cold air,
cx TT Δ=Δλ (7)
NASA/TM—2007-214488 12
Figure 14.—Compression ratio versus inlet mass flow rate at TR = 2.0, N = 10 600 rpm.
Figure 15.—T2/T1 versus inlet mass flow rate at TR = 2.0, N = 10 600 rpm.
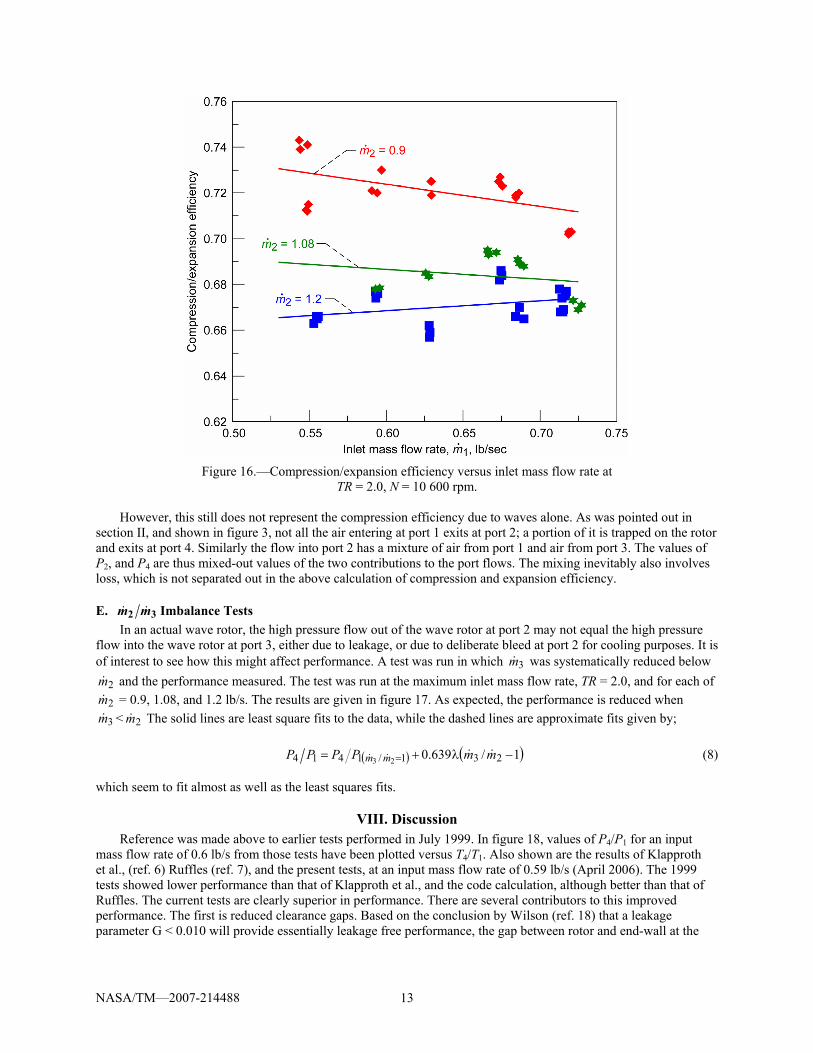
without knowing the values of ΔTc, or ΔTx, the efficiencies can not be calculated. However a rough idea of their values can be found by assuming they are equal. With this assumption, equations (5), (6), and (7) can be solved to give ηc = ηx. The results are plotted in figure 16 for the tests of subsection VII (B), and the efficiency is seen to be around 0.66 to 0.74. This is in line with values for wave rotors given by Thayer and Zumdieck (ref. 16) (0.75), Ruffles (ref. 7) (0.77), and Kollbrunner (ref. 17) (0.65 to 0.68). Kollbrunner’s result was for a direct measurement of compression efficiency. Values of ΔTx range from 200 to 300 R.
NASA/TM—2007-214488 13
Figure 16.—Compression/expansion efficiency versus inlet mass flow rate at TR = 2.0, N = 10 600 rpm.
However, this still does not represent the compression efficiency due to waves alone. As was pointed out in
section II, and shown in figure 3, not all the air entering at port 1 exits at port 2; a portion of it is trapped on the rotor and exits at port 4. Similarly the flow into port 2 has a mixture of air from port 1 and air from port 3. The values of P2, and P4 are thus mixed-out values of the two contributions to the port flows. The mixing inevitably also involves loss, which is not separated out in the above calculation of compression and expansion efficiency.
E. 32 mm Imbalance Tests In an actual wave rotor, the high pressure flow out of the wave rotor at port 2 may not equal the high pressure
flow into the wave rotor at port 3, either due to leakage, or due to deliberate bleed at port 2 for cooling purposes. It is of interest to see how this might affect performance. A test was run in which 3m was systematically reduced below
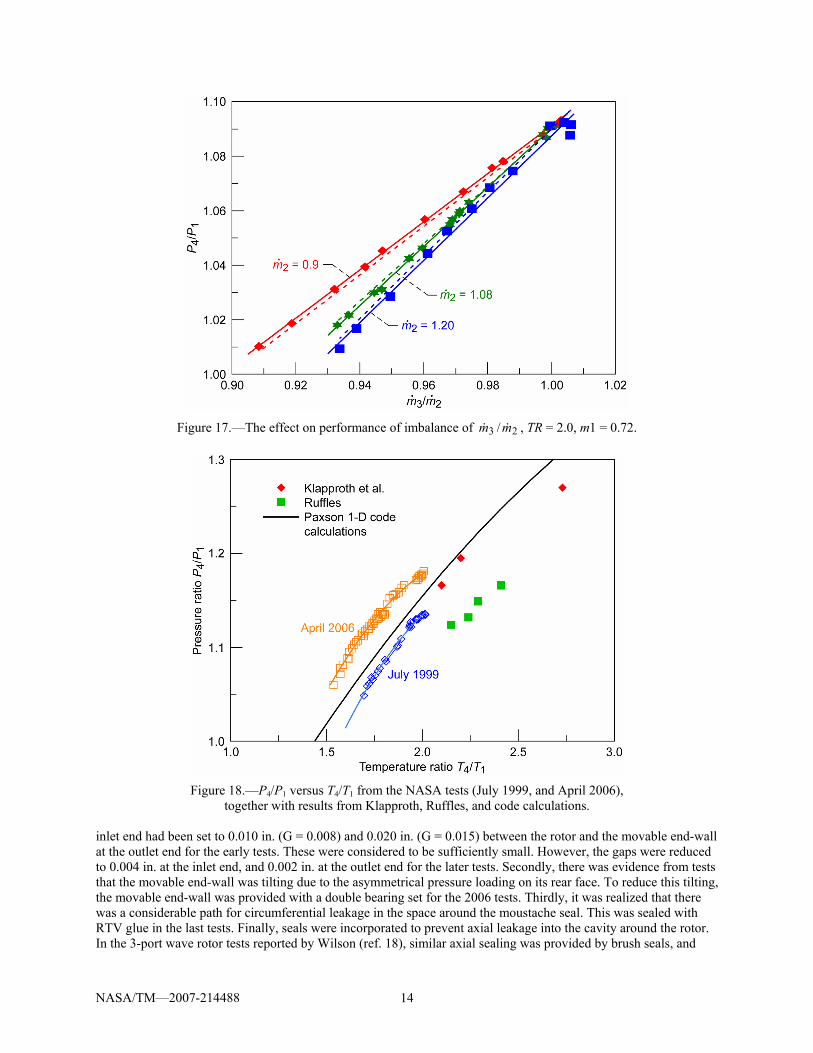
2m and the performance measured. The test was run at the maximum inlet mass flow rate, TR = 2.0, and for each of 2m = 0.9, 1.08, and 1.2 lb/s. The results are given in figure 17. As expected, the performance is reduced when 3m < 2m The solid lines are least square fits to the data, while the dashed lines are approximate fits given by;
( ) ( )1/639.0 231/1414 23 −λ+= = mmPPPP mm (8) which seem to fit almost as well as the least squares fits.
VIII. Discussion Reference was made above to earlier tests performed in July 1999. In figure 18, values of P4/P1 for an input
mass flow rate of 0.6 lb/s from those tests have been plotted versus T4/T1. Also shown are the results of Klapproth et al., (ref. 6) Ruffles (ref. 7), and the present tests, at an input mass flow rate of 0.59 lb/s (April 2006). The 1999 tests showed lower performance than that of Klapproth et al., and the code calculation, although better than that of Ruffles. The current tests are clearly superior in performance. There are several contributors to this improved performance. The first is reduced clearance gaps. Based on the conclusion by Wilson (ref. 18) that a leakage parameter G < 0.010 will provide essentially leakage free performance, the gap between rotor and end-wall at the
NASA/TM—2007-214488 14
Figure 17.—The effect on performance of imbalance of 23 /mm , TR = 2.0, m1 = 0.72.
Figure 18.—P4/P1 versus T4/T1 from the NASA tests (July 1999, and April 2006), together with results from Klapproth, Ruffles, and code calculations.
inlet end had been set to 0.010 in. (G = 0.008) and 0.020 in. (G = 0.015) between the rotor and the movable end-wall at the outlet end for the early tests. These were considered to be sufficiently small. However, the gaps were reduced to 0.004 in. at the inlet end, and 0.002 in. at the outlet end for the later tests. Secondly, there was evidence from tests that the movable end-wall was tilting due to the asymmetrical pressure loading on its rear face. To reduce this tilting, the movable end-wall was provided with a double bearing set for the 2006 tests. Thirdly, it was realized that there was a considerable path for circumferential leakage in the space around the moustache seal. This was sealed with RTV glue in the last tests. Finally, seals were incorporated to prevent axial leakage into the cavity around the rotor. In the 3-port wave rotor tests reported by Wilson (ref. 18), similar axial sealing was provided by brush seals, and
NASA/TM—2007-214488 15
proved very effective. It was not possible to obtain brush seals for the four port wave rotor, so graphite seals were used instead. These were not available for the 1999 tests, but were in place in the 2006 test series.
Although the movable end-wall seemed a good solution to the problem of differential expansion between rotor and casing, in practice it proved troublesome, as explained above. A better solution might be to not use a movable end-wall, but to design a cold clearance equal to the anticipated difference in expansion. If the expansion proves to be greater than anticipated, abradable material on the end-wall can provide the extra space needed. With this technique very tight clearances may prove possible.
The results of subsection VII(B) indicate that wave rotor performance is linked to the losses in the high pressure loop. A cycle designed on wave considerations alone implies a loss in this loop, and the loop must equal this loss or the desired conditions will not be achieved.
IX. Conclusions Wave rotor performance has been shown to be determined by many factors, namely temperature ratio across the
wave rotor, loop flow ratio, inlet mass flow rate, rotor speed, and also leakage paths. Loop flow ratio also affects the pressure loss between ports two and three, and the operating point may be constrained by the loss in this leg. It is important to reduce the leakage as much as possible. The observed pressure ratio of 1.17 at T4/T1 = 2.0 is very good, although it might still be possible to get further improvement if leakage could be reduced more. Higher pressure ratios can obviously be achieved at higher values of T4/T1.
Appendix The CFD code used in this paper to simulate the wave rotor has been documented extensively in the literature
(see for example reference 8), and only a brief description will be provided here. It is a time accurate, quasi-one-dimensional code which numerically integrates the equations of mass, momentum, and energy for a calorically perfect gas, in a single passage of the wave rotor, as it rotates past the various ports governing the cycle. A second order, Lax-Wendroff integration scheme is utilized which incorporates Roe’s approximate Reimann solver and a flux limiter in order to ensure total variation diminishing behavior, while preserving sharp resolution of shock waves and contact discontinuities. Source terms have been added to account for the effects of leakage between the passage and the casing, wall friction, and wall heat transfer. The sub-models which comprise the source terms have been developed using results from previous wave rotor experiments. They contain correlations which link their strength to physical aspects of the experimental rig (e.g., rotor-to-endwall clearances, passage hydraulic diameter, Prandtl number, etc.), and local fluid dynamics. Source terms are applied globally for wall friction and heat transfer, and discretely (i.e., the first and last interior numerical cell) for leakage.
A robust, characteristics-based boundary condition algorithm has been developed which permits inflow or outflow at any port, depending on the status of the passage flow and the specified port pressures. This allows simulation of both on and off-design operation. Inflow losses due to incidence are accounted for using sub-models. The code operates in the passage relative frame, while boundary conditions are specified in the absolute frame. The boundary conditions routines account for this reference frame change as well.
In order to obtain meaningful limit cycle results with which to compare experimental results, two components have been added to the code. The first is a simple cavity representing the casing volume not occupied by the rotor. Leakage flow travels to and from this volume (via the code source terms) as the passage rotates. The amount and direction of leakage depends on the state of the cavity, and the state of the passage cells where leakage is assumed to occur. The gas state in the cavity is updated each revolution, or cycle, of the rotor. When the net flow to the cavity over the course of a cycle is zero, a limit cycle has been reached.
The second additional component is a burner model, which links ports 2 and 3. It is again modeled as a simple cavity; however, there is a heat addition term and a total pressure loss term added. The cavity state is governed by the computed flows from port 2, and to port 3, as well as by the specified heat addition rate. The state is updated each cycle via first order time integration. When the flow into the burner matches the flow out, and the burner state is unchanged from one cycle to the next, a limit cycle has been reached.
For the results presented in this paper, endwall-to-rotor clearances are assumed to be 0.004 in. at the inlet end and 0.002 in. at the exhaust end. Boundary conditions imposed are as follows. The measured stagnation pressure and temperature are specified for port 1. Average static pressure is imposed for port 4. It is adjusted until the computed inlet flow matches the experimentally measured value plus approximately 8 percent to account for blockage due to the passage ‘webs’. These are not modeled in the code. Total conditions for port 3 and static pressure for port 2 are supplied by the burner component model. The heat addition term and the total pressure loss terms are adjusted until the computed and measured values of TR and λ match.
NASA/TM—2007-214488 16
References 1. Wilson, J. and Paxson, D.E., “Wave Rotor Optimization for Gas Turbine Engine Topping Cycles,” Journal of
Propulsion and Power, vol. 12, no. 4, pp. 778–785, 1996. 2. Welch, G.E., Jones, S.M., and Paxson, D.E., “Wave Rotor Enhanced Gas Turbine Engines,” Journal of
Engineering for Gas Turbines and Power, vol. 119, pp. 469–477, 1997. 3. Mayer, A., “Recent Developments in Gas Turbines,” Mechanical Engineering, vol. 69, pp. 273–277, 1947. 4. Zauner, E., Chyou, Y-P., Walraven, F., and Althaus, R., “Gas Turbine Topping Stage based on Energy
Exchangers: Process and Performance,” ASME 93–GT–58, Gas Turbine and Aeroengine Congress, Cincinnati, Ohio, 1993.
5. Snyder, P.H., and Fish, R.E., “Assessment of a Wave Rotor topped Demonstrator Gas Turbine Engine Concept,” ASME Paper 96–GT–41, The International Gas Turbine and Aeroengine Congress and Exhibition, Birmingham, England, 1996.
6. Klapproth, J.F., Perugi, A., Gruszynski, J.S., Stoffer, L.J., and Alsworth, C.C., “A Brief Review of the G.E. Wave Rotor Program (1958–1963),” Proceedings of the 1985 ONR/NAVAIR Wave Rotor Research and Technology Workshop, Shreeve, R.P., and Mathur, A, Editors, Report NPS–67-85–008, Naval Postgraduate School, Monterey, CA, pp. 172–193, 1985.
7. Ruffles, P., in “Rolls-Royce Study of Wave Rotors 1965–1970,” presented by Moritz, R., Proceedings of the 1985 ONR/NAVAIR Wave Rotor Research and Technology Workshop, Shreeve, R.P., and Mathur, A, Editors, Report NPS–67–85–008, Naval Postgraduate School, Monterey, CA, pp. 116–124, 1985.
8. Paxson, D.E., “Comparison between numerically modeled and experimentally measured Wave Rotor Loss Mechanisms,” Journal of Propulsion and Power. vol. 11, no. 5, pp. 908–914, 1985.
9. Carek, G. A., “Shot Peening for Ti–6Al–4V Alloy compressor Blades,” NASA Technical Paper 2711, 1987. 10. Wilson, J., “Design of the NASA Lewis 4-Port Wave Rotor Experiment,” AIAA Paper 97–3139, June, 1997. 11. Glawe, G.E., and Krause, L.N., “Miniature Probes for Use in Gas Turbine Testing,” NASA TMX–71638, 1974. 12. Foa, J.V., Elements of Flight Propulsion, John Wiley & Sons, New York, N.Y. pp. 161–166, 1960. 13. Glawe, G.E., Krause, L.N., and Dudzinski, T.J., “A Small Combination Sensing Probe for Measurement of
Temperature, Pressure and Flow Direction,” NASA TN D 4816, 1968. 14. Lefebvre, A.H., “Gas Turbine Combustion,” Taylor and Francis, Philadelphia, PA, 1999. 15. Welch, G.E., Slater, J. W., and Wilson, J., “Wave Rotor Transition Duct Experiment,” AIAA Paper 2007–1249,
January, 2007. 16. Thayer, W.J. Jr., and Zumdieck, J.F., “A Comparison of Measured and Computed Energy Exchanger
Performance,” Proceedings of the 13th International Symposium on Shock Tubes and Waves, Buffalo, N.Y. pp. 735–743, 1981.
17. Kollbrunner, A.A., “Comprex Supercharging for Passenger Diesel Car Engines,” SAE Paper 800884, SAE West Coast International Meeting, Los Angeles, CA, August, 1980.
18. Wilson, J., “An Experimental Determination of Losses in a 3-Port Wave Rotor,” Journal of Engineering for Gas Turbines and Power, vol. 120, no. 4, pp. 833–842, October, 1998.
This publication is available from the NASA Center for AeroSpace Information, 301–621–0390.
REPORT DOCUMENTATION PAGE
2. REPORT DATE
19. SECURITY CLASSIFICATION OF ABSTRACT
18. SECURITY CLASSIFICATION OF THIS PAGE
Public reporting burden for this collection of information is estimated to average 1 hour per response, including the time for reviewing instructions, searching existing data sources,gathering and maintaining the data needed, and completing and reviewing the collection of information. Send comments regarding this burden estimate or any other aspect of thiscollection of information, including suggestions for reducing this burden, to Washington Headquarters Services, Directorate for Information Operations and Reports, 1215 JeffersonDavis Highway, Suite 1204, Arlington, VA 22202-4302, and to the Office of Management and Budget, Paperwork Reduction Project (0704-0188), Washington, DC 20503.
NSN 7540-01-280-5500 Standard Form 298 (Rev. 2-89)Prescribed by ANSI Std. Z39-18298-102
Form Approved
OMB No. 0704-0188
12b. DISTRIBUTION CODE
8. PERFORMING ORGANIZATION REPORT NUMBER
5. FUNDING NUMBERS
3. REPORT TYPE AND DATES COVERED
4. TITLE AND SUBTITLE
6. AUTHOR(S)
7. PERFORMING ORGANIZATION NAME(S) AND ADDRESS(ES)
11. SUPPLEMENTARY NOTES
12a. DISTRIBUTION/AVAILABILITY STATEMENT
13. ABSTRACT (Maximum 200 words)
14. SUBJECT TERMS
17. SECURITY CLASSIFICATION OF REPORT
16. PRICE CODE
15. NUMBER OF PAGES
20. LIMITATION OF ABSTRACT
Unclassified Unclassified
Technical Memorandum
Unclassified
1. AGENCY USE ONLY (Leave blank)
10. SPONSORING/MONITORING AGENCY REPORT NUMBER
9. SPONSORING/MONITORING AGENCY NAME(S) AND ADDRESS(ES)
National Aeronautics and Space AdministrationWashington, DC 20546–0001andU.S. Army Research LaboratoryAdelphi, Maryland 20783–1145
National Aeronautics and Space AdministrationJohn H. Glenn Research Center at Lewis FieldCleveland, Ohio 44135–3191
Available electronically at http://gltrs.grc.nasa.gov
February 2007
NASA TM—2007-214488ARL–TR–4044
E–15779
22
Experimental Results of Performance Tests on a Four-Port Wave Rotor
Jack Wilson, Gerard E. Welch, and Daniel E. Paxson
Aerodynamics; Unsteady flows; Aircraft propulsion; Power; Aircraft propulsioncomponents system
Unclassified -UnlimitedSubject Categories: 02 and 07
WBS561581.02.07.03.02.01
Prepard for the 45th Aerospace Sciences Meeting and Exhibit sponsored by the American Institute of Aeronautics andAstronautics, Reno, Nevada, January 8–11, 2007. Jack Wilson, QSS Group, Inc., 21000 Brookpark Rd., Cleveland, Ohio44135; Gerard E. Welch, U.S. Army Research Laboratory, NASA Glenn Research Center; Daniel E. Paxson, NASA GlennResearch Center. Responsible person, Jack Wilson, organization code RTT, 216–433–1204.
A series of tests has been performed on a four-port wave rotor suitable for use as a topping stage on a gas turbine
engine, to measure the overall pressure ratio obtainable as a function of temperature ratio, inlet mass flow, loop flow
ratio, and rotor speed. The wave rotor employed an open high pressure loop that is the high pressure inlet flow was not
the air exhausted from the high pressure outlet, but was obtained from a separate heated source, although the mass flow
rates of the two flows were balanced. This permitted the choice of a range of loop-flow ratios (i.e., ratio of high
pressure flow to low pressure flow), as well as the possibility of examining the effect of mass flow imbalance. Imbal-
ance could occur as a result of leakage or deliberate bleeding for cooling air. Measurements of the pressure drop in the
high pressure loop were also obtained. A pressure ratio of 1.17 was obtained at a temperature ratio of 2.0, with an inlet
mass flow of 0.6 lb/s. Earlier tests had given a pressure ratio of less than 1.12. The improvement was due to improved
sealing between the high pressure and low pressure loops, and a modification to the movable end-wall which is
provided to allow for rotor expansion.