Embed Size (px)
Citation preview
S E C U R I T Y I N F O R M A T I O N ( 1 L
RESEARCH MEMORANDUM
PERFORMANCE OF A TURBOJET ENGINE WITH ADJUSTABLE
FIRST-STAGE TURBINE STATOR AND VARIABLE-AREA
EXHAUST NOZZLE
B$ C a r l L. Meyer, Ivan D. Smith, and Har ry E; Bloomer S! k *& Lewis Flight Propulsion Laboratory $ Cleveland, Ohio
4" uc Q'
.
NATIONAL +' ADVISORY COMMITTEE r-.
L' 0 c FOR AERONAUTICS . ..
WASHINGTON August i4,"iQB
https://ntrs.nasa.gov/search.jsp?R=19930087463 2018-05-24T19:51:02+00:00Z

-
NATIONAL ADVISORY COMMTMEE FOR AERONAUTICS
c RESEARCH "3R"
PERFORMANCE OF A T17RBoJET ENGINE WITB ADJUSTABIX FIRST-STAGE
By C a r l L. Meyer , Ivan D. Smith, and Harry E. Bloomer
The performance of a turbojet engine with a two-stage turbine, an ad justable f irst-stage turbine stator, and a variable-area exhaust nozzle was investigated at selected constant engine speeds and two simulated f l i g h t CWditiOnSj various fixed settings of the adjustable turbine s ta tor were used. For the particular component characterist ics of the engine investigated, l i t t l e tqrovement i n thrust or spec i f ic fue l con- sumption could be realized at conditions from 75 percent of normal to m i l i t a r y th rus t by use of an adjustable rather than aa optimum fixed first-stage turbine stator.
c INTRODUCTION
As part of an experimental evaluation of a ful l -scale turbojet . engine with a two-stage turbine i n the NACA Lewis al t f tude wind tunnel, data were obtained to determine the over-all and component performance of the engine when equipped with both an adjustable first-stage turbfne stator and a variable-area exhaust nozzle. The performance of the tur- bine and a discussion of the design and mechanical r e l i a b i l i t y of the adjustable f irst-stage turbine stator are presented i n reference 1. The performance of the compressor and over-all engine are presented herein.
For the engine equipped with the adjustable first-stage turbine stator and variable-area. exhaust nozzle, it was possible to control the matching between the compressor and the turbine; thus, compressor pres- sure r a t i o could be varied independently of turbine-inlet temperature and engine speed within a range limited by the flow-area; variation of the adjustable turbine stator, the maximum turbine-inlet temperature, the compressor surge pressure ratio, o r the area variation of the exhaust nozzle. Through use of various fixed positions of the adjustable first- stage turbine stator, data were obtained to enable selection of an opti- mum f ixed-stator f l o w area f o r the particular engine and t o determine whether o r not there m e performance advantages to be gained by use of adjustable as compared with fixed turbine stators in the given engine.
c
1 The analgrsis of reference 2 indicates possible improvements in specif ic
2 NACA RM E52L04
f u e l consumption at less than maximLrm thkust through use of adjustable, rather than f ixed, turbine stators. in a turbo jet engine equipped with a variable-area exhaust nozzle. d
A t a given sirrmlated flight condition and at various fixed positions of the f i rs t -s tage turbine s ta tor , data were obtained over approximately the available range of turbine-inlet temperatures a t each of v a l o u s constant engine speeds by varying the exhaust-nozzle area. A t simulated conditions corresponding t o a flight Mach nuniber of 0.62 a t an a l t i tude of 30,000 f e e t and a flight Mach nuniber of 0.46 at an a l t i tude of 15,000 feet , data were obtained for a range of first-stage turbine-stator positions which correspond to a . range of effective stator flow areas from 1.13 t o 1 . 2 5 square feet.
!x 4 CD N
Compressor performance maps are presented herein for the simulated flight conditions investigated. Coqosite performance maps a r e presented for selected engine speeds a t the two simulated flight conditions t o show engine performance i n terms of net thrust , specific fuel consumption, turbine-inlet to engine-Wet temperature r a t io , and compressor pressure r a t i o f o r the family of first-stage turbine-stator positions investigated. The r e su l t s of the present investigation me Umited, of course, by the component characterist ics of the engine.
The adjustable f irst-stage turbine stator used in the present inves- t igat ion was not designed as a standard component of the engine but was intended as a means of regulattng the engine operating point for other component investigations such as that of ccqressor surge reported in references 3 and 4; theref ore, high performance of the turbine w a s not a I
primary consideration in the stator design. In addition, the adjustable s ta tor was the f i rs t -s tage s ta tor of a two-stage turbine; the turbine rotors and second-stage s ta tor were designed f o r a fFxed-position f i r s t - stage stator.
'f
APPARATUS
Engine
A prototype J40-WE-6 turbo:jet engine was used f o r the present irrves- t igation. Main components of the engine include an U-stage axial-flow compressor, an annular combustor, a two-stage turbine, an exhaust collec- t o r , and a continuously variable clam-shell-type exhaust nozzle. For the present investigation, a mixer-vane assembly w a s included st the compres- sor out le t to a l leviate turbine- inlet temperature distribution problems; the electronic control was modified t o permit independent control of engine speed and exhaust-nozzle; area; and the fixed-position first- stage turbine stator w a 6 replaced by an adjustable stator.
.r
NACA RM E52LO4 r! 3
. Approximate sea-level tbrust ratLngs of the J40-WE-6 turbojet engine are as follows : -
Operating condition Turbine-inlet gas Engine speed, Thrus t , l b temperature, OF rpm
N 4 (D N
Take-off and mil i tary 6800 Normal 7500
5 m 75 percent normal 6120 90 percent normal
7260 7260 7260 7050
Ad justable Firs t -Stage Turbine Stator
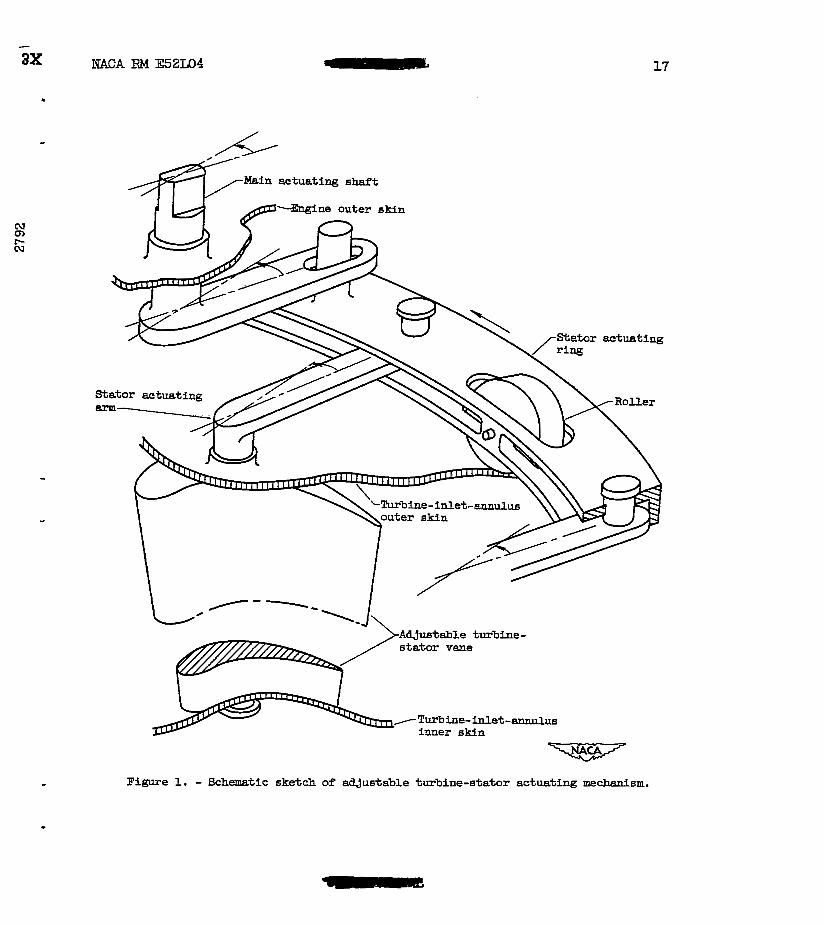
The adjustable f irst-stage turbine stator, w h i c h was supplied by the engfne manufacturer, is illustrated schematically in figure 1. The s ta tor blades were mounted on shafts and could be turned simultaneously between the inner and outer shrouds through the illustrated actuating mechanism by an externally mounted worm-gem drive. Adjustment of the stator settLng varied the flow area of t he s ta tor and also the angle through which the gases were turned in pssslng through the s ta tor . A more detailed description of the turbine and the adjustable s t a to r i s given in reference 1. Independent control of the ad3ustable stator was used in the present investigation to select various fixed s t a to r s e t - tings f o r which the range of effective flow area was from 1.13 t o 1.25 square feet. The method of determining effective stator f low area i s given i n reference 1.
P.
c
The engine was ins ta l led on a wTng segment that was supported i n the 20-foot-diameter tes t sec t ion of the a l t i tude wind tunnel by the tunnel balance frame. Dry refrigerated air was supplied to the engine From the tunnel malce-up air system through a duct connected to the engine inlet. A i r f low through the duct was thro t t led from approxhately sea-level pressure to a tots1 pressure at the engine i n l e t corresponding to the desired flight Mach nuuiber and al t i tude, while the tunnel test-section s ta t ic pressure was maintained a t that corresponding t o the desired altitude. Thrust and drag measurements w i t h the tunnel balance scales were made possible by a s l ip j o in t with a f r ic t ion less seal located in the duct upstream of the engine.
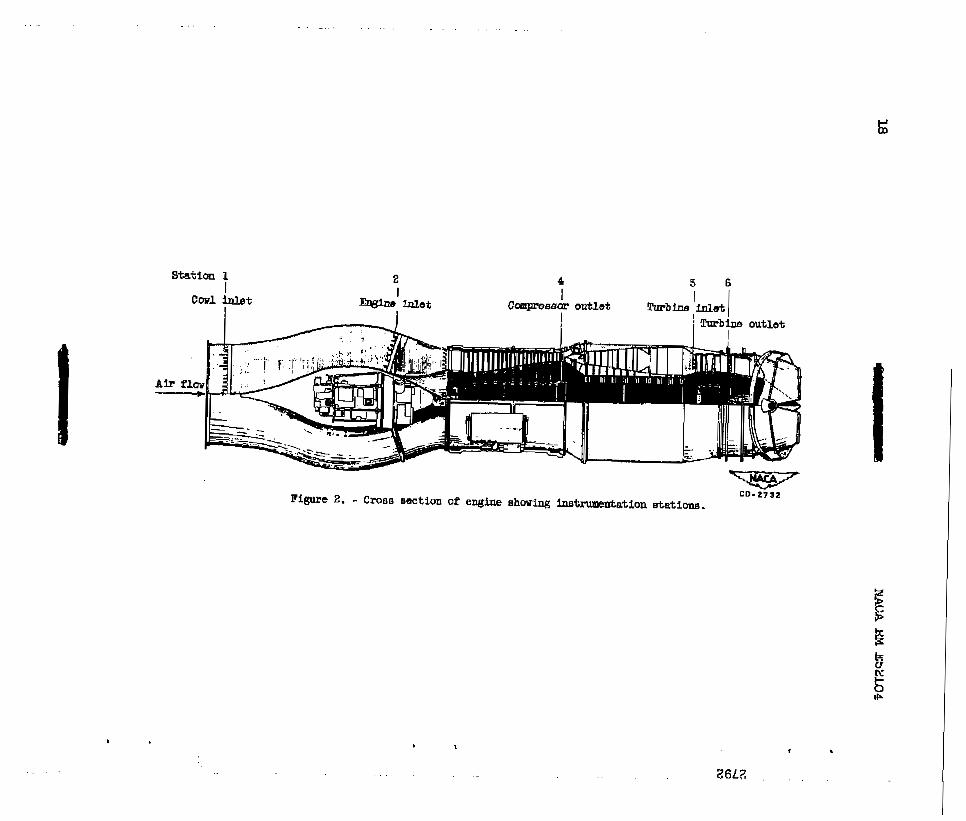
Conventional instrumentation for the measurement of temperatures and pressures w a s ins ta l led at va r ious s ta t ions in the engine (fig. 2) . Pres- smes in the in l e t - a i r duct ahead of the engine (s ta t ion 1) and at the engine inlet (s ta t ion 2) were measured with water-filled manometers, and
-
- those a t the compressor out le t (s ta t ion 4), turbine M e t (s ta t ion 5), and
4 II NACA RM E52L04
turbine outlet (station 6 ) were measured w i t h mercury-filled W o E t W S ; all pressures were photographically recorded. Temperatures in the duct ahead of the engine and a t the compressor out le t were measured w i t h iron- constantan thermocouples, and those at the turbine-outlet were measured w i t h chromel-alumel thermocougles. All temperatures were automatically r recorded by self-balancing potentiometers. Turbine-inlet temperatures were calculated from the turbine-outlet temperatures, with the assmnption that the enthalpy drop across the turbine was equal t o the enthalpy rise across the compressor. Fuel flow w a s measured by means of calibrated rotameters, engine speed by means of a stroboscopic tachometer i n con- Junction with a continuously indicating tachometer, and thrust by means of the tunnel balance scales.
z
- (I P
PROCEDURE
Engine speed, exhaust-nozzle area, and first-stage turbine-stator position were independently controlled throughout the investigation. A t a given simulated flight condition and a t vasious fixed sett ings of the adjustable f i rs t -s tage turbine. s ta tor , data were obtained over approxi- mately the available range of turbine-inlet temperatures at each of various constant engine speeds by varylng exhaust-nozzle area. Maxim turbine-inlet temperature was limited t o 14250 F or to the maximum obtainable without encountering compressor surge. MinFmum turbine-inlet temperature was limited by the. maximum exhaust-nozzle mea. .I
Data are reported herein for simulated conditions corresponding t o a f l i gh t Mach number of 0.62 at an a l t i tude of 30,000 f e e t and a flight d
Mach nunber' of 0.46 a t an altitude of 15,000 feet . Data were obtained w i t h f ive f ixed posit ions of the f irst-stage turbine stator a t the higher altitude condition and with three at the lower altitude condition; at both flight conditions, the.range of' s tator posit ions used corre- sponded t o a range of effect ive s ta tor f l a w a r e a 6 from 1.13 to 1.25 square fee t . A t each turbine-stator position, data were obtained a t constant engine speeds within the range. of 4720 t o 7260 r p m .
RESULTS AND DISCUSSION
Compressor Performance
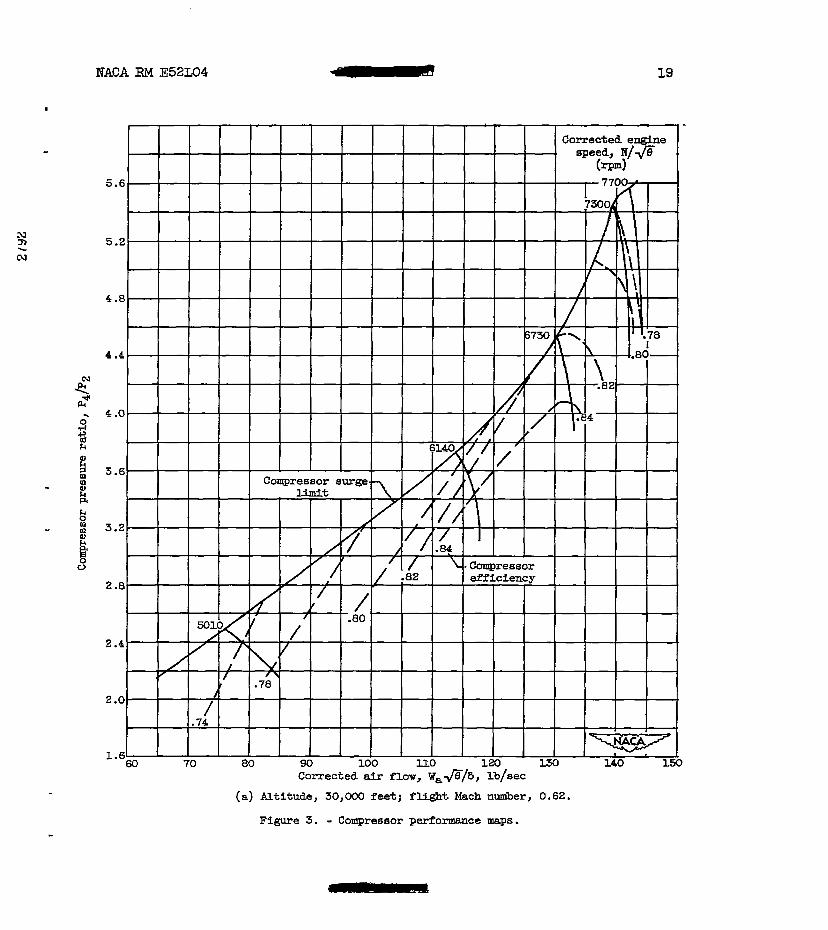
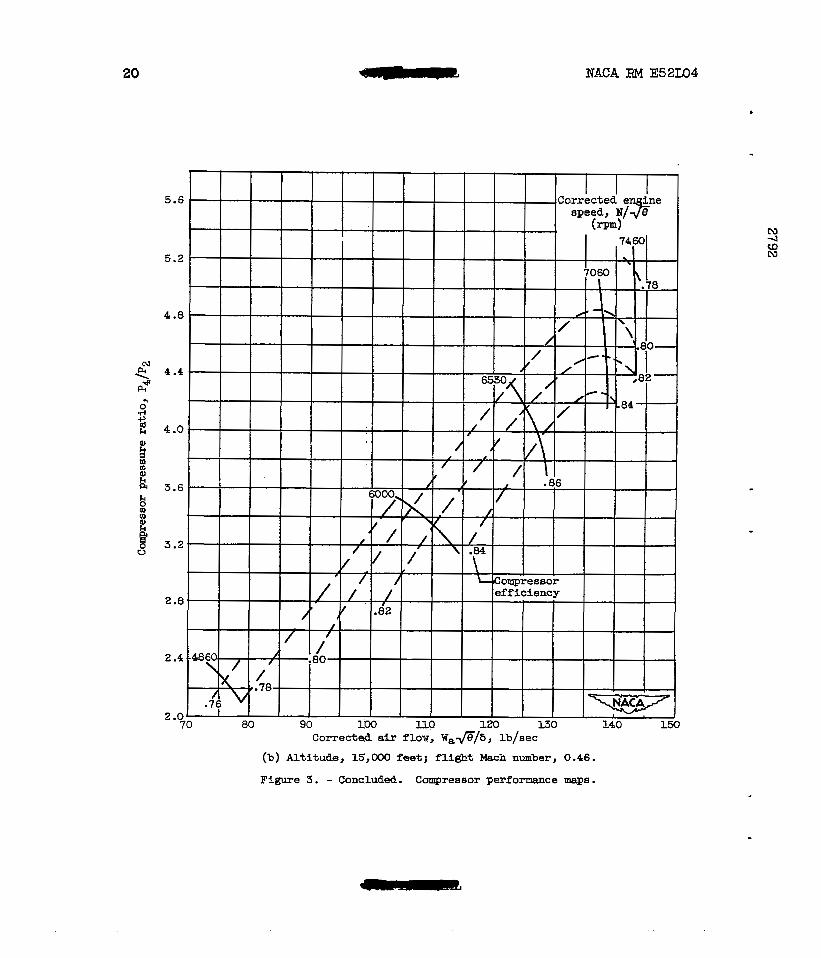
Compressor performance maps for sFmulated conditions corresponding t o a f l i g h t Mach nulTiber of 0.62 at an altitude of 30,000 f e e t and a f l i g h t Mach nuniber of 0.46 at an al t i tude of 15,000 feet are presented in f i gu re 3. On coordinates of compressor pressure ratio and corrected air flow are .+horn lines of constant corrected eaine speed and compres- s o r efficiency. The approximate compressor surge liinit i s shown fo r a f l i g h t Mach number of 0.62 a t an al t i tude of 30,OOO fee t ; adequate data L
were not available t o determine the compressor surge limit at the other simulated flight condition.
.I
MACA RM E5U;04 - 5
. At all corrected engine speeds, compressor efficiency decreased as compressor pressure r a t i o m s increased over the range investigated. In
ciency, the efficiency decreased rapidly as the corrected engine speed was raised. For engine operation from 75 percent of no& thrust t o mi l i tmy thrust, the corrected engine speeds are 7630 and 7855 r p m for the conditions of figure 3(a) a d 7290 and 7510 f o r the conditions of figure 3(b); maximum coqressor efficiency occurred at lower corrected
- the region of corrected a i r flows above tha t f o r maximum compressor e f f i -
4 W
N engine speeds and compressor pressure ratios. In the range of corrected
e\, engine speeds above about 7200 rpm, the corrected air flow changed a comparatively smal l m u n t as corrected engine speed w a s increased, which indicated choking at the compressor Wet .
Engine Performance
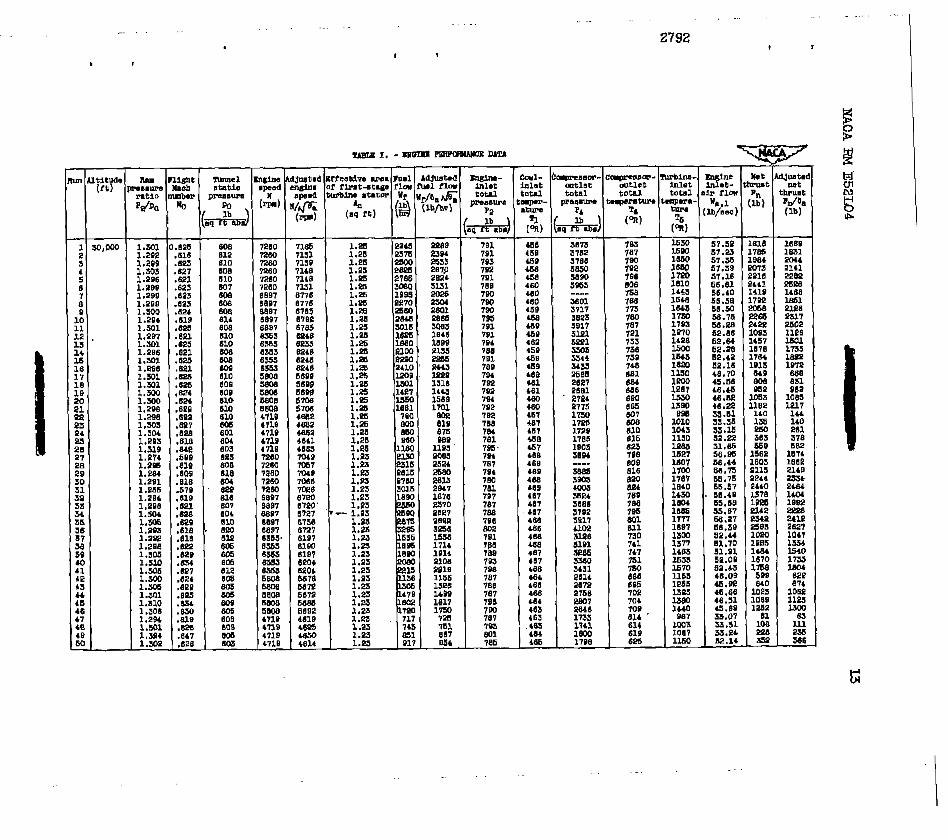
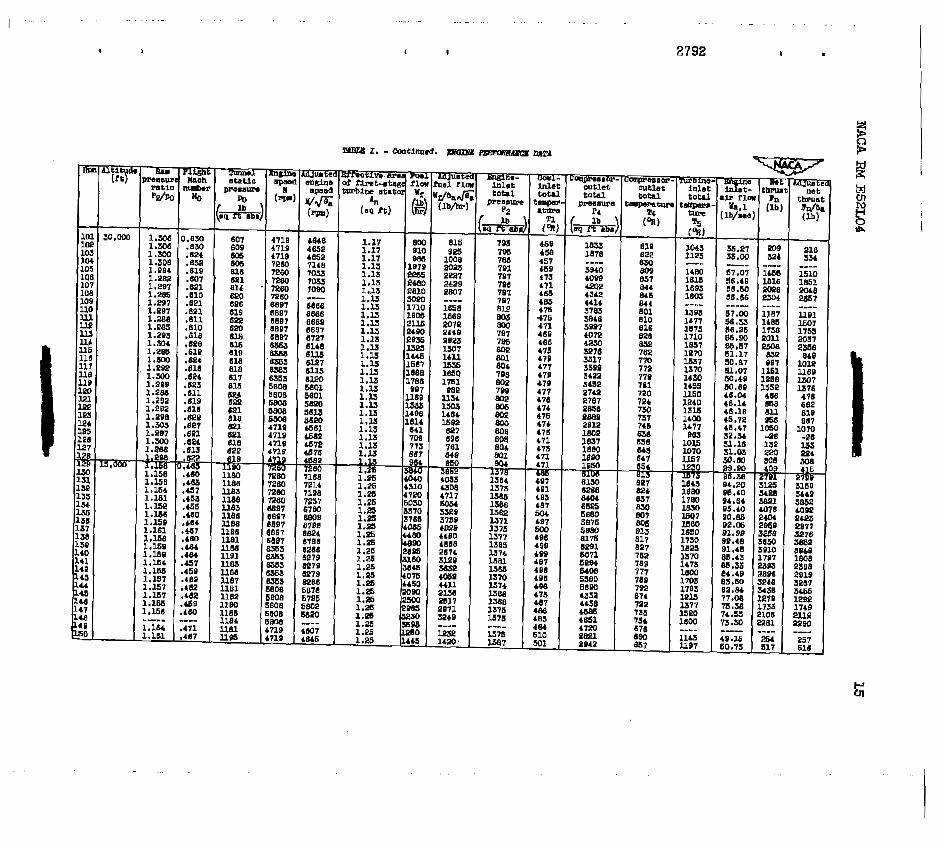
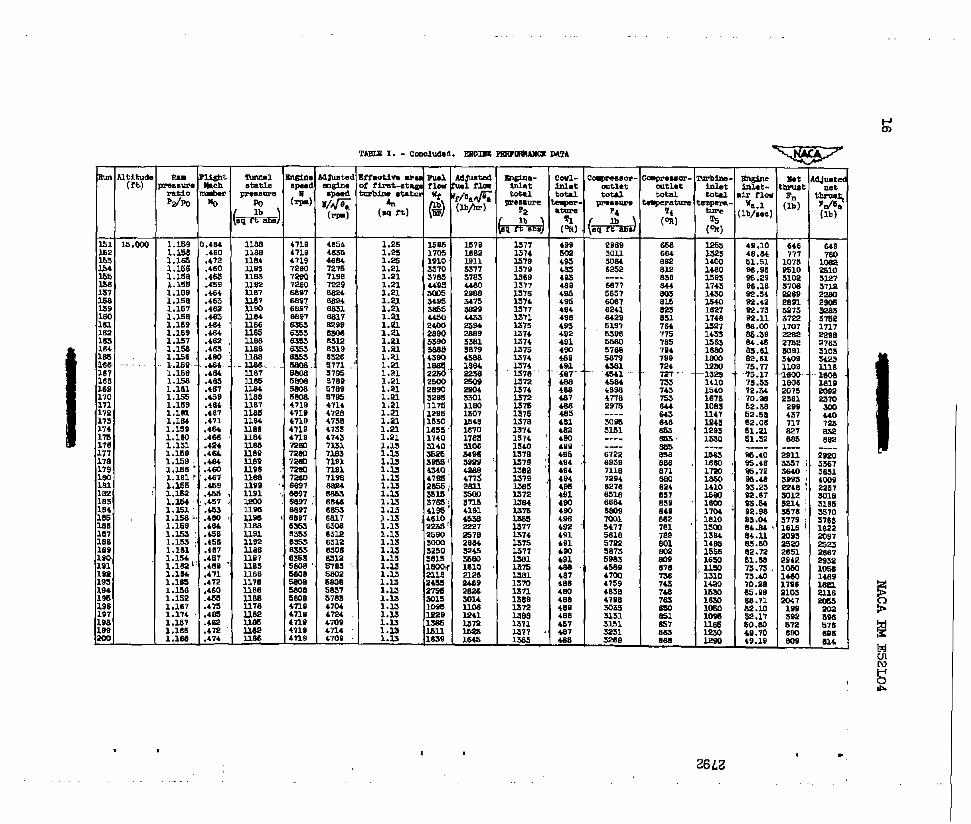
The aaibient s ta t ic pressures and temperatures obtained during the investigation deviated somewhat from NACA standard values; therefore all engine performance pmameters presented Waphically have been adfusted t o NACA standard conditions at the respective altitudes by use of the factors 6, Etnd 8, (defined in amendix A ) . All engine performance data obtained at the two simulated flight conditions for the various fixed positions of the adjustable first-stage turbine s t a to r me pre- sented in table I.
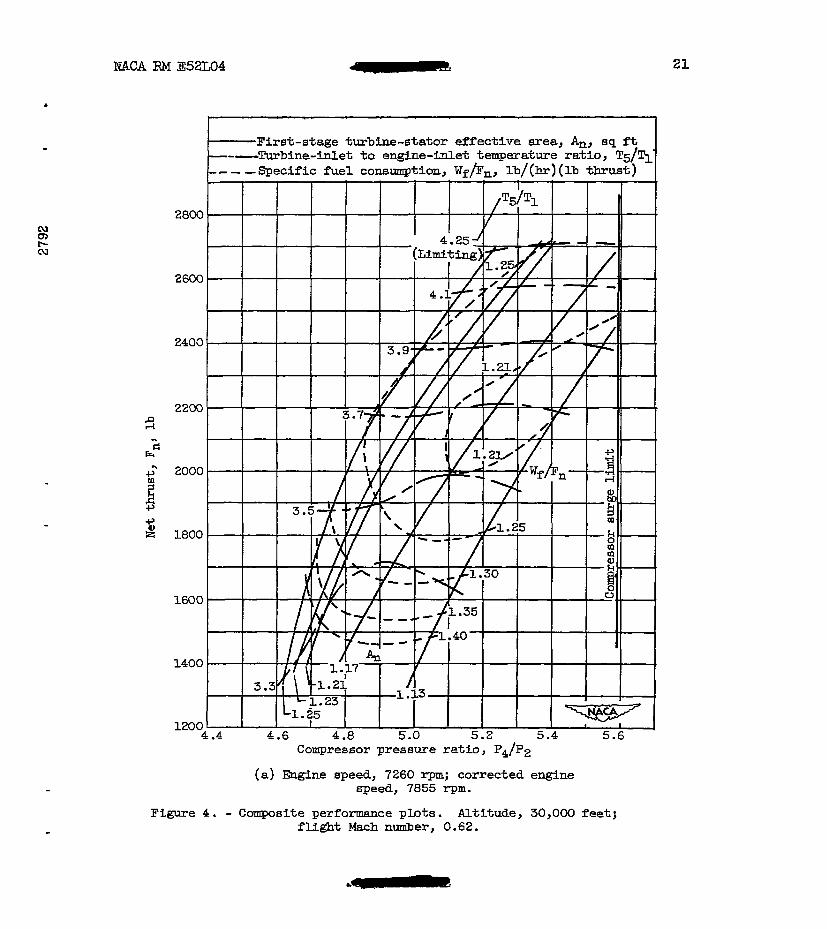
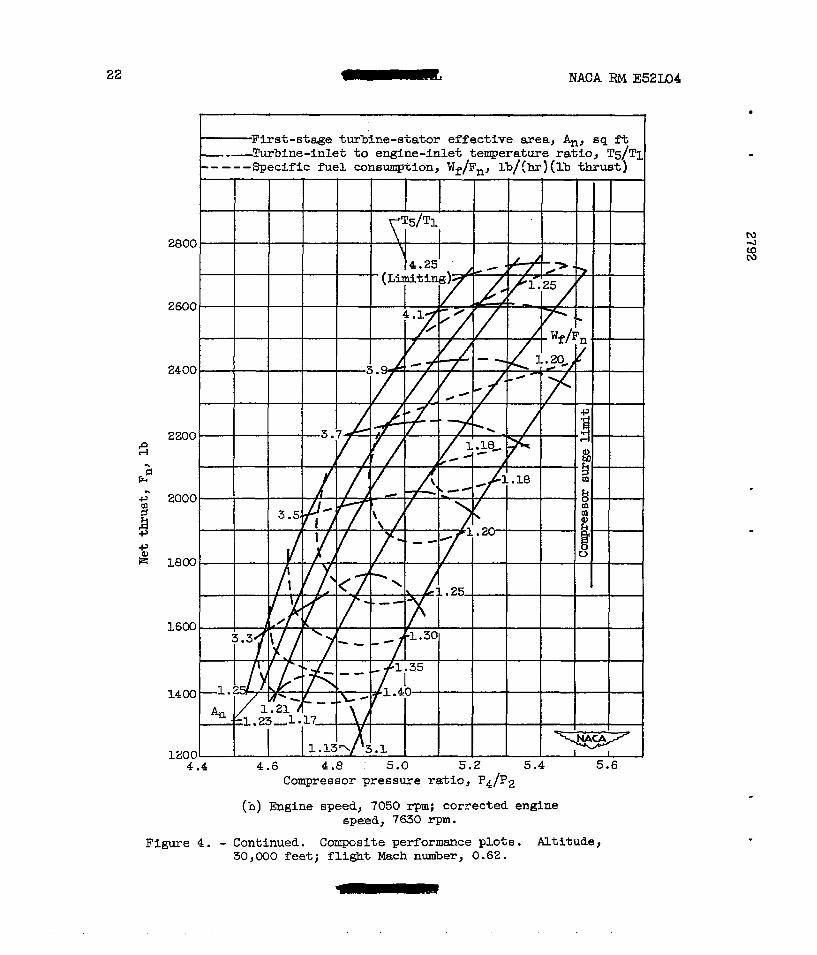
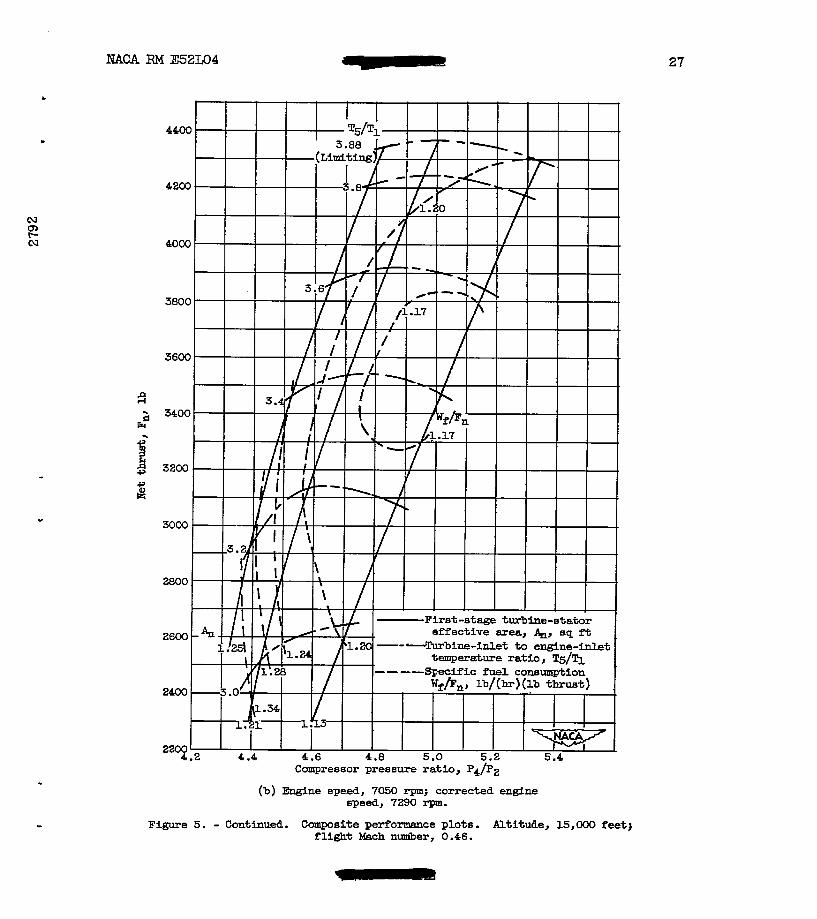
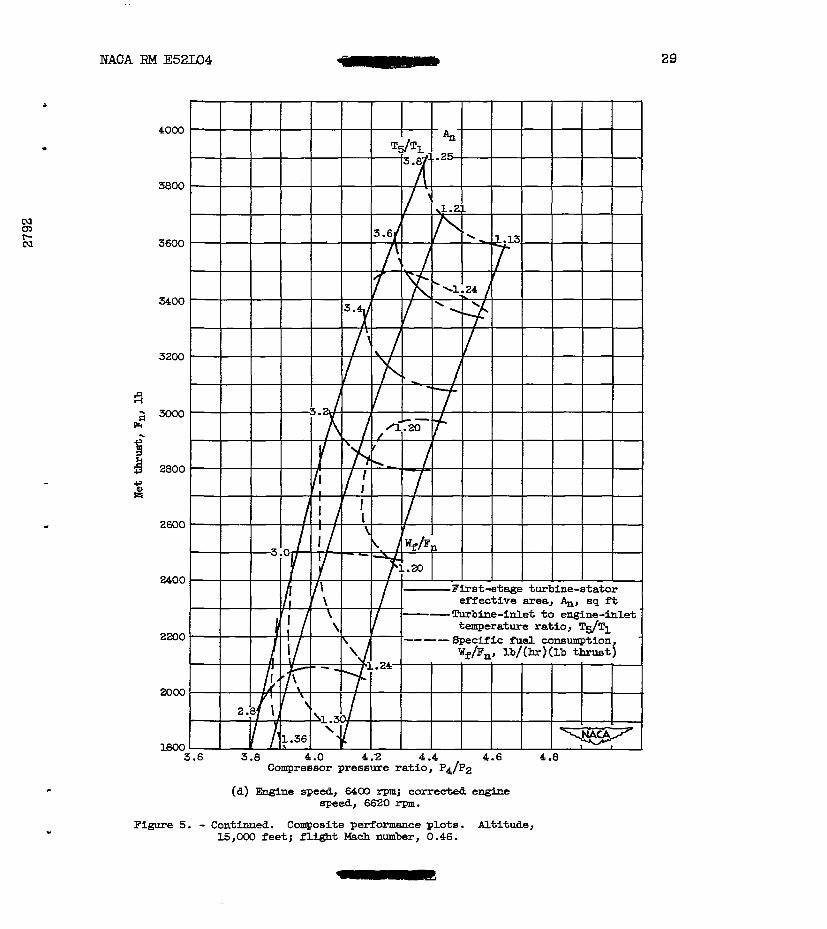
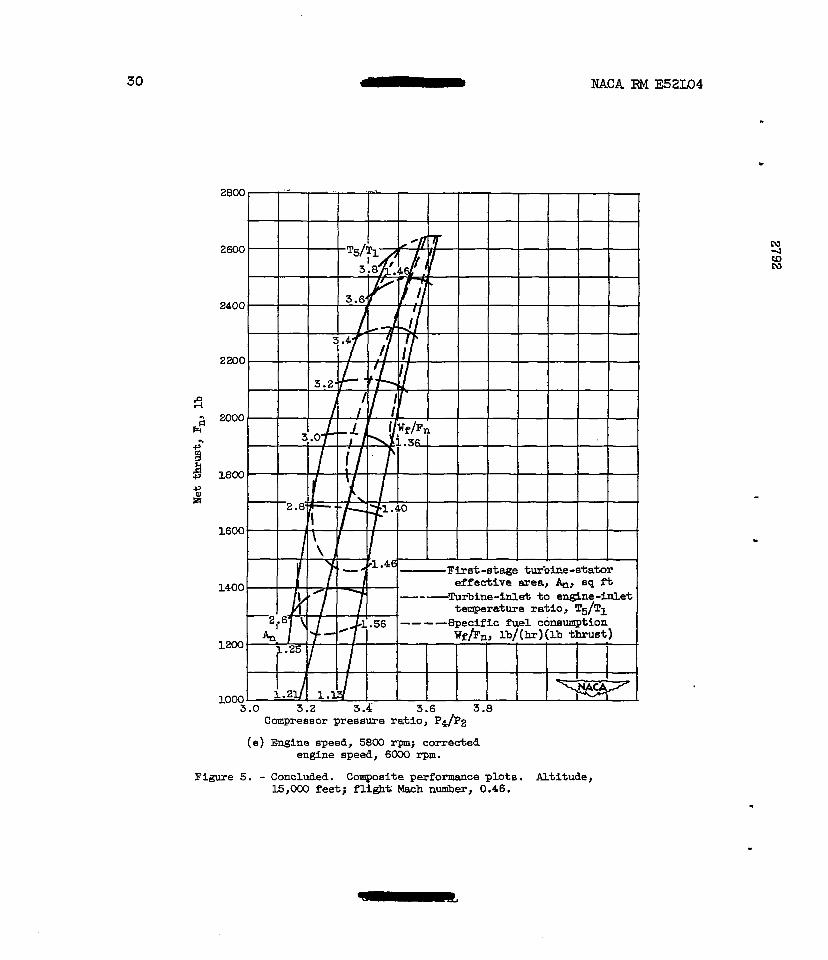
Ad justable f irst-stage turbine stator. - Composite performance plots fo r engine speeds of 7260, 7050, 6800, 6400, and 5800 r p m are presented in f igure 4 f o r a simulated flight Mach nlfmber of 0.62 a t an a l t i tude of 30,000 f ee t , and in figure 5 for a simulated f l i g h t Mach number of 0.46 at a n a l t i tude of 15,000 fee t . The composite performance plots , which were constructed by the method described in appendix B, are presented on coordinates of net thrust against compressor pressure ra t io and include curves f o r the various effective flow axeas of the f irst-stage turbine stator (obtainable by varyFng exhaust-nozzle area), superbposed l ines of constant turbine-inlet to engine-inlet temperature ratio, and contours of specific fuel consumption based on net thrust. Where possible, the approx-te compressor surge pressure r a t i o is indicated. A reliable measurement of exhaust-nozzle area waa not available; therefore, the com- posi te plots could not be completed. to the extent of superinposing l i nes of constant exhaust-nozzle area.
-
By adjusting both the f i rs t -swge turbine-s ta tor and the exhaust- nozzle areas a t a given engine speed t o control the matching between the compressor and turbine, it was possible t o obtain either constant
a range of compressor pressure ratios (f igs. 4 and 5). Similarly, it was possible t o obtain a range of turbine-inlet to engine-inlet temperature
- turbine-inlet to engine-inlet temperature r a t i o or constant thrust over
6 WACA RM E52L04
r a t io s and consequently a range of thrusts at a given compressor pres- sure ratio. Increasing the turbine-stator flow area permitted a given turbine-inlet to engine-inlet temperature ratio -to be obtained a t lower compressor pressure ratio and als.0 permitted increased turbine-inlet to- engine-inlet temperature ratios t o be obtained a t a given compressor pressure ratio. A t a given turbine-inlet temperature, the r a t i o of compressor-outlet pressures at two different turbine-stator f low areas should be approximately inversely proportional t o the r a t i o of the turbine-stator f l o w areas. Small experimental errors i n t h e measurement of effective turbine-stator area; turbine-inlet temperature, and com- pressor pressure ratio caused some deviation from the dorementioned relat ion in figures 4 and 5.
Within the range of first-stage turbine-stator areas investigated, var ia t ions in compressor pressure ratio at constant turbine-inlet to engine-inlet temperature ratio arid engine speed through control of turbine-stator and exhaust-nozzle areas did not have an appreciable e f fec t on thrust ( f igs . 4 and 5). This was par t icular ly true a t t h e higher engine speeds and turbine-inlet to engine-inlet temperature ratios where the thrust change was generally less than 3 percent; greater thrust changes occurred at the lower tewerature ra t ios . Exhaust-system losses aPfect the trends of thrust withjcompressor pressure ratio at constant turbine-inlet to engine-inlet temperature ratio. As the compressor pres- sure r a t i o was increased at a given turbine-inlet to engine-inlet tem- perature ratio, the compressor efficiency decreased somewhat, whereas - the turbine efficiency tended to; increase slightly. A t high turblne- i n l e t t o engine-inlet temperature ra t ios , the exhaust system losses remained relatively constant over the range of compressor pressure ratio8, 4
and at these conditions the thrugt was not appreciably affected by vari- ations in compressor pressure ratio. A t the low turbine- inlet to engine- i n l e t t q e r a t u r e r a t i o s , hawever, the exhaust-system losses tended t o decrease with increased compressor pressme ra t io and caused larger vari- ations i n thrust with coqressor. pressure ratio.
In general, specific fuel consumption based on net thrust at a gfven turbine-inlet to engine-inlet temperature ratio decreased as the colqpres- sor pressure ratio w-as increasea by adjust ing t~bine-s ta tor and exhaust- nozzle area6 (figs. 4 and 5); in many cases, however, there was an opti- mum compressor pressure ratio for minimum specif ic fuel consumption at a given turbine-inlet t o engine-inlet temperature ratio within the range of turbine-stator areas investigated. The specif ic fuel consumption, i n general, decreased on the order,of 1 t o 7 percent as the compressor pres- sure r a t i o was increased at thelhigher turbine-Met to engine-inlet tem- perature ratios. The aforeIllent$oned trend of decreased specific fuel consumption with increased compressor pressure ratio is a t t r ibu ted to the conibined effects of increased thermodynamic efficiency with increased compressor pressure ratio, a trend of increasing turbine efficiency with decreased turbine-stator area, a trend of decreasing exhaust-system .I
*
losses with decreased turbine-stator area (especially at the lower t e m - perature ra t ios) , and decreased compressor efficiency with increased
- coqressor pressure r a t i o .
The composite performance p lo t s of f i gmes 4 and 5 do not show com- p le te agreement with the analysis of reference 2. This analysis, which assumed constant coqonent efficiencies, indicated possible improvement in spec i f ic fuel consumption at less than maxhm thrus t by using &n
adjustable turbine stator and a variable-area e a m t nozzle t o maintain operation a t a constant conpressor pressure ratio as compared w i t h opera- t ion at a constant turbine-stator area. I n general, the trends of the specific fuel consumption contours of figure 4 indicate that a fixed first-stage turbine-stator area may be selected to obtain near optFmum spec i f ic fue l consumption over a range of engine speeds; f o r exaq le , a first-stage turbine-stator effective area of 1.17 square feet w o u l d be near optimum for the conditfom of figure 4. The trends of the specific fuel consumption contours of f igure 5 indicate that the specific fuel consuqtion would be somew-hat lower for operation at constant compressor pressure ratio as compared with operation at a constant turblne-stator area; however, the gains would be small at thrust levels of interest .
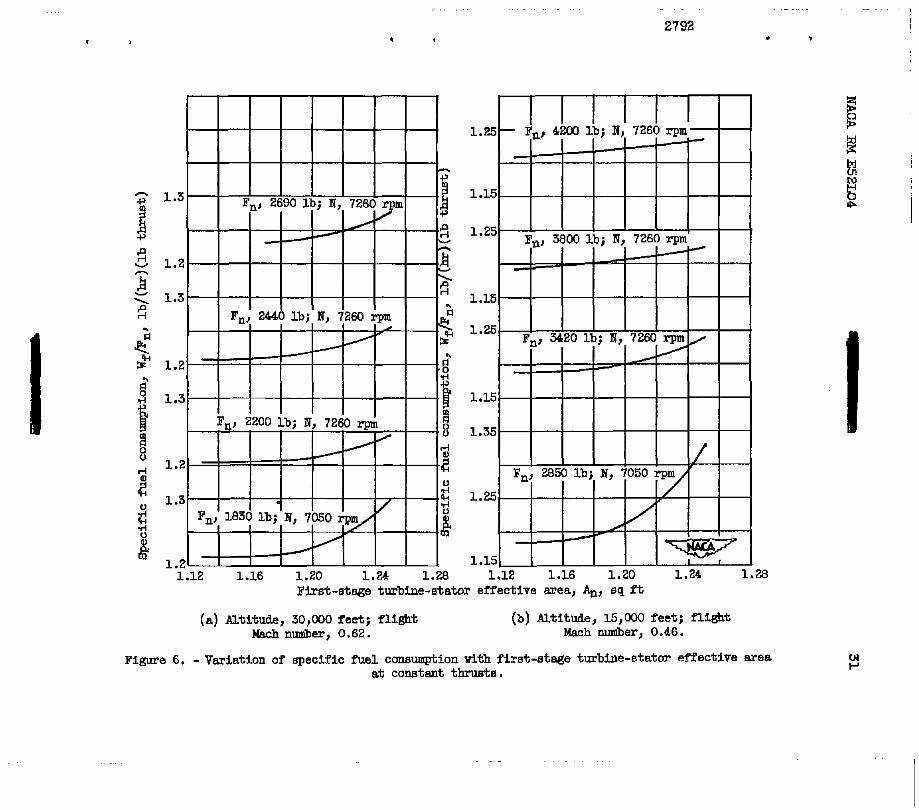
The variat ion of specific fuel consumption with ffrst-stage turbine- stator effective mea at four thrust levels for each of the two simulated flight conditions is shown tn figure 6. The four thrust levels w e r e
- chosen t o approxbate military, normal, 90 percent of normal, and 75 per- cent of normal thrust . A t the four thrust levels noted, the specif ic fuel consumption decreased at a decreasing rate a s the turbine-stator w88
occurred within the range of turbine-stator axeas investigated at these thrust levels. The specific fuel consumption w a s affected only s l igh t ly ( less than l p e r c e n t ) by changes in turbine-stator area between 1.13 and 1.17 s q w e fee t . U s e of turbine-stator areas less than 1.13 square f ee t would result in l i t t l e or no iqroveIllent in spec i f ic fue l consump- t ion, and the operable range at the smaller areas would be limlted by compressor surge.
- closed8 to ta l var ia t ions of specific fuel consmption of 3 t o 1 2 percent
Fixed f irst-stage turbine stator. - Performance data are not avail- able for the engine equipped with a standard first-stage turbine stator; however, the effective f l o w area of the standard first-stage stator was OR the order of 1.17 square feet. This area would r e su l t i n a specif ic fuel. consumption near the optimum values at the thrust levels noted in figure 6. A s shown fn figure 4, however, the limiting turbine-inlet to engine-illlet temgerature ratio at engine speeds of 7260 and 7050 r p m occurred at or near the compressor surge limit f o r an effect ive f i rs t - stage turbine-atator area of 1.17 squerre feet.
Prelim-lnFlry investigation of the engine equipped with the standard first-stage turbine stator revealed a severe compressor surge limitation a t high corrected engine speeds (refs. 3 and 4) . To make the engine
8 NACA RM E52L04
operable without compressor modifications and with R fixed f i r s t - s tage turbine stator, it would be necessary to increase the flow area of the s ta tor a sufficient amount t o reduce the operating compressor pressure r a t i o below the surge .pressure ratio at high corrected engine speeds. Such an increase would r e su l t Fn gomewhat hi&& specific fuel consump- tion. For example, if a compressor pressure ratio margin of 0.15 between N
the 1Fmiting"temperature operating point and the comgressor surge limit were chosen for the conditions of: figure-4(a), the effective stator f low area required would be approximately 1,20 sqikke feet ; for t h i s area, the specWic f u e l consumption would b& on the order of 1 t o 2 percent higher than the minbmn obtained a t the thrust levels noted in figure 6.
.I
4 ul N
An adjustable first-stage turbine stator could be used t o avoid the compressor surge l imitation of the particular engine at high turbine- inlet temperatures and corrected ;engine speeds, and also t o permit opera- t i on at or near optimum compressqr pressure ratios for miziimum specific f u e l consumption at reduced thrusts. "he available inrprovement i n spe- c i f i c f u e l consumption by use of .the adjustable stator as congared with use of a fixed turbine-stator effective area of 1.20 squa~e feet , se lected t o give an arbi t rary margin between the operating and compressor surge pressure ratios, would not warra& the ccanplications of the adjustable s ta tor . Aa increase in the flowlarea of the fixed f irst-stage turbine s ta tor may be considered a temporary method of increasing the margin between the operating and surge compressor pressure ratios of the par- t i cu la r engine; modifications to . the canpressor t o improve the surge l i m i t , such as those discussed in references 3 and 4, would permit use of 8 fixed first-stage turbine-stator-flow area which would result i n near optimum specific fuel cone@Stion at thrust levels cf , interest .
Operational Characteristics
It is possible that an adjustable first-stage turbine stator could be used t o improve the acceleration characteristics of the engine. Fig- ures 4 and 5 illustrate that the.compressor pressure ratio maybe decreased at a gLven steady-state turbine-inlet temperature by increasing the stator flow area; thus the &gin between the operating compressor pressure ratio and the compress+ surge pressure ratio could be increased for acceleration purposes. The present program, however, did not include an investigation of the engine apceleration characteristics.
. .
The performance of a turbojet engine w3th a two-stage turbine, an adjustable f i rs t -s tage turbine s ta tor , and a variable-area exhaust nozzle w a ~ investigated at selected constant engine speeds and two simulated flight conditions; vasious f bed . settings of the ad justable stator were used.
3
2x NACA RM E5ZLO4 - 9
- For the par t icular component characterist ics of the engine investi-
gated, l i t t l e improvement in thrust o r specific fuel consumption could be realized a t conditions from 75 percent of normal t o military thrust by use of an adjust&le, rather than a fixed, first-stage turbine s ta tor . In general, the thrust available a t a given turbine-inlet t o engine-inlet temperature r a t i o was not appreciably affected by variations in coqres - sor pressure ratio through control of f irst-stage turbine-stator and exhaust-nozzle areas . The f l e x i b i l i t y provided by an adfustable first-stage turbine s ta tor and a variable-area. exhaust nozzle may be used to obtain minimum specific fuel consuption at a given thrust; however, the avail- able hprovement in specific fuel consumption by use of an adjustable as conpared with an optimum fixed turbine stator was m a l l ( less than 1 per- cent) at thrust levels of interest.
m
Because of compressor surge limFtations of the par t icular engine investigated, it would be necessaryto use a fixed turbine-stator flow area larger than that f o r mlnhrum spectfic fuel consumption if the engine were t o be made opereble wfthout compressor modifications and with fixed f i r s t - s tage turbine s ta tor . The spectfic fuel consungtion obtainable by me of a given setting of the first-stage turbine stator, selected t o give an arbi t rary compressor pressure r a t i o -gin of 0.15 between the limiting temperature operating point and the compressor-surge 1-t f o r the most critical condition investigated, would be on the order of 1 to 2 percent higher than the minfmm obtained by use of the adjustable s ta tor a t thrusts from 75 percent of normal to military. This penalty in spec i f ic fue l consumption would not w a r r a n t the comglications of the adjustable stator.
-
Lewis Flight Propulsion Laboratory National Advisory Cammittee for Aeronautics
Cleveland, Ohio, November 18, 1952
10
SYMBOLS
The followfng synibols were used i n this report:
effective mea of first-stage turbine stator, sq f t
net thrust , l b
Mach number
engine speed, rpm
t o t a l pressure, lb/sq f t :
static pressure, lb/sq f t
t o t a l temperature, OR
a i r flow, lb/sec
fuel Plow, lb/br
r
6 r a t i o of t o t a l pressure at engine inlet t o absolute static pressure of NACA standard atmosphere at sea level
I
S, r a t i o of ambient static pressure po to the absolute static pres- mre of NaCA standard atmosphere at altitude
8 r a t i o of absolute t o t a l temperature a t engine inlet t o absolute s t a t i c temperature of NACA standard atmosphere at sea level
8, r a t i o of absolute ambient, s t a t i c temperature t o absolute static tem- perature of W A standard atmosphere at a l t i tude
Subscripts :
0 free-stream conditions
1 cowl in l e t
2 engine i n l e t
4 cqre r s so r out le t
5 turbine inlet
NACA RM E52L04
METBOD OF CONSTRUCTLmG COMPOSITE PERFORMANCE PLOT8
Compazable engine performance data adjusted to standard altitude conditions were not directly available f o r the various position8 of the adjustable first-stage turbine s t a to r at constant engine speeds, includ- ing rated engine speed, because of anibient-air teqerature differences and because the ambient-air temperatures were higher than standard at the respective alt i tudes (table I). It was therefore necessaxy to use a method of cross-plotting a d extrapolation of the data to obtain con- parable engine performance f o r the various positions of the first-stage turbine stator. at constant engine speeds and standard a l t i t ude condi- t ions.
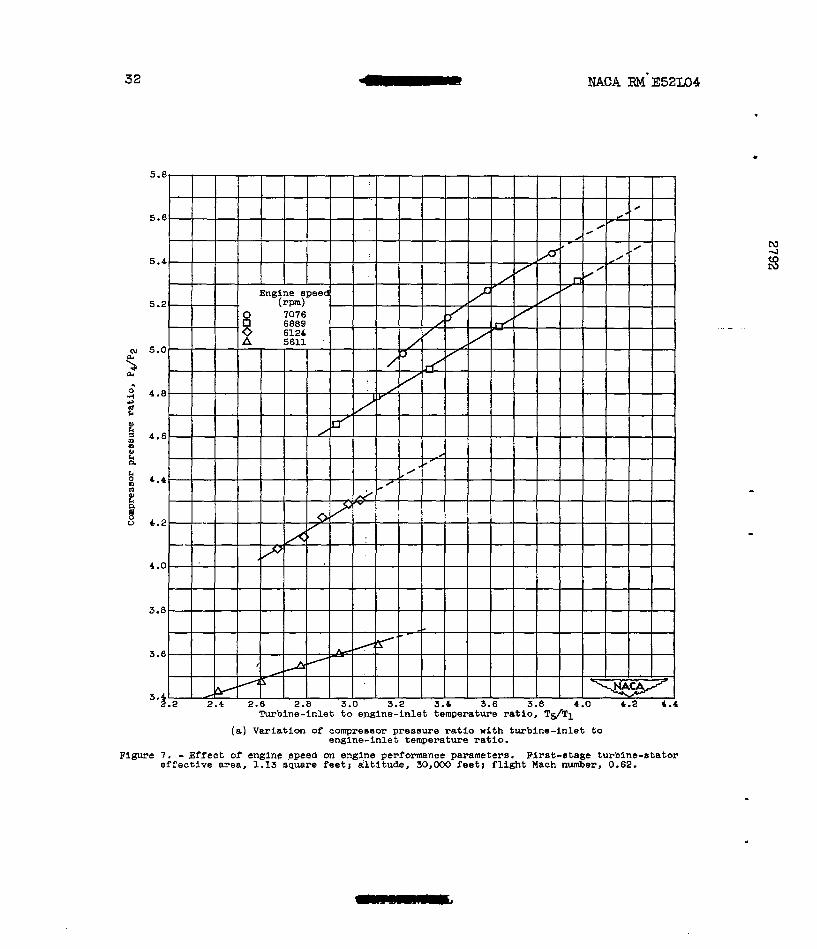
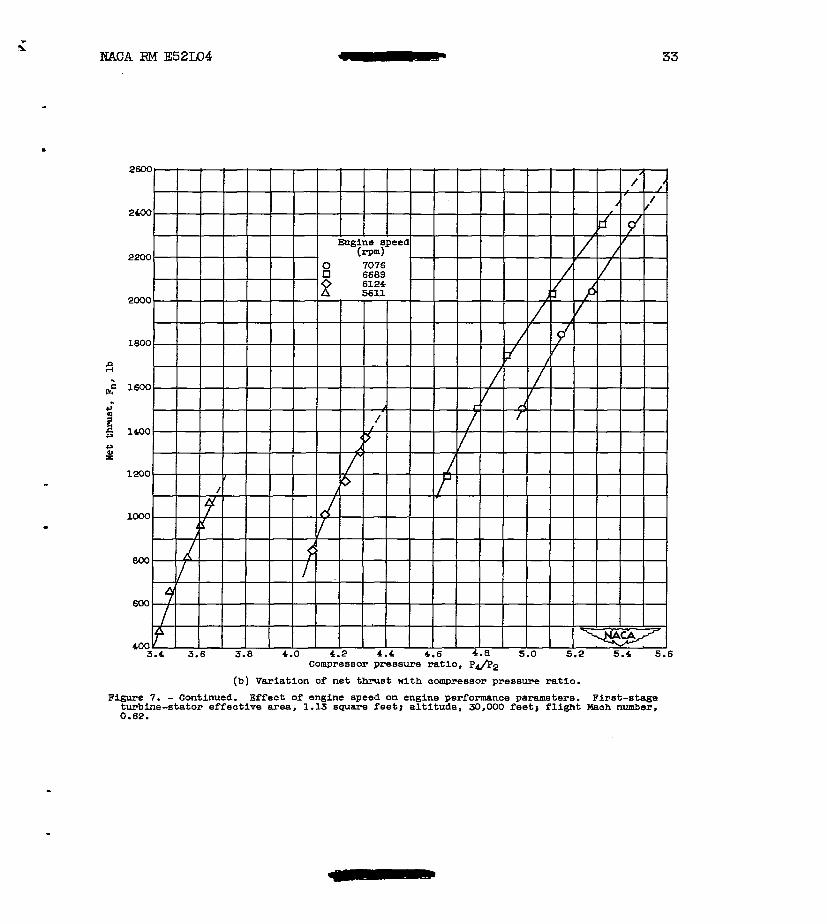
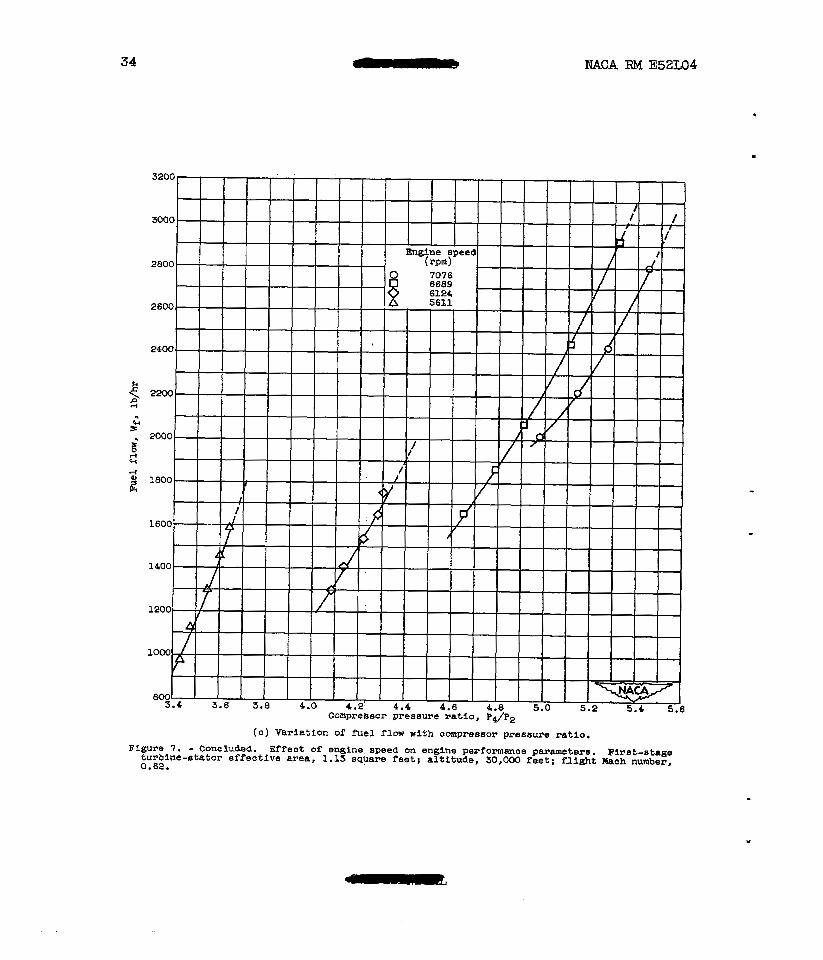
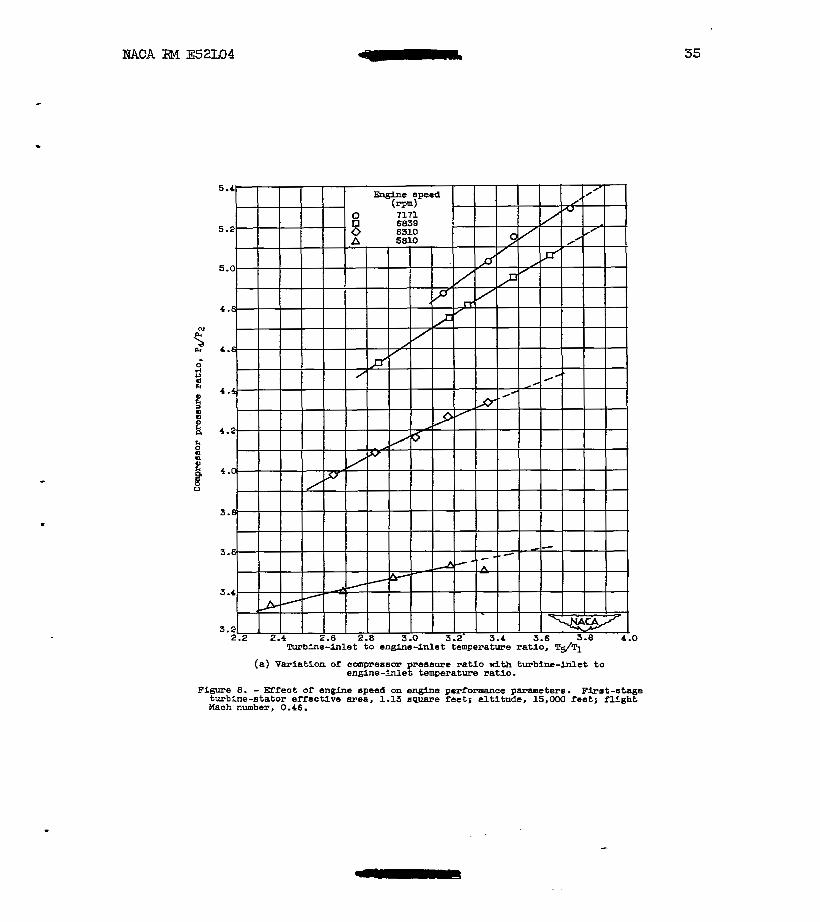
Typical engine performance data f o r a f ixed f i rs t -s tage turbine- stator posi t ion for which the effect ive s ta tor flow area was 1.13 square f e e t &re presented in figure 7 f o r a simulated flight Mach rider of 0.62 a t an altitude of 30,000 f ee t , and Fn f igure 8 f o r a simulated flight Mach number of 0.46 at an a l t i tude of 15,000 f ee t . These figures show compressor pressure ra t io against turbine-inlet to engine-inlet temperature r a t i o , and net thrust and fuel flow against compressor pres- sure r a t i o f o r four engine speeds; at each engine speed, exhaust-nozzle - mea was varied t o obtain the range of compressor pressure ratios. The constant engine speed curves of these figures were extrapolated t o the l b i t i n g t u r b i n e - i n l e t to engine-inlet temperature r a t i o o r to the corn-
- pressor surge pressure ratio.
The data of f igures 7 and 8 and similar data for the other turbine- stator posit ions were cross-plotted t o obtain the performance at selected engine speeds f o r which composite performance plots were to be made. The cross plots used the coordinates of compressor pressure ratio against engine speed and were made for v&rious constant turbine-inlet t o engine- i n l e t temperature ra t ios , net tbrusts, and fuel flows. Extrapolation of these cross plo ts was necessary t o obtain performance at the ra ted engine speed of 7260 rpm. Thus, the variation of turbine-inlet to engine-inlet temperature ra t io , net thrust, and f u e l flow w t t h compressor pressure r a t i o was determined f o r each ffrst-stage turbine-stator position at the selected engine speeds.
1. Campbell, C a r l E. , and Welna, Henry J. : Preliminary Evaluation of Turbine Performance with Variable-Area Turbine Nozzles i n a TurboJet Engine. NACA RM E52J20, 1953.
2. Silvern, David H., and Slivka, William R.: Analytical Investigation of Turbines with Adjustable Stator Blades and Effect of These T u " bines on Jet-Engine Performance. NACA RM E50E05, 1950.
3. Finger, Harold B., Essig, Robert H., and Conrad, E. William: Effect of Rotor - and Stator-Blade Modifications on Surge Performance of an 11-Stage Axial-Flow Comgressor. I - Original Production Com- pressor of XJ40-WE-6 Engine.. NACA RM E52G03, 1953.
4. Conrad, E. William, Finger, Hexold B., and Essig, Robert R. : Effect of Rotor- and Stator-Blade Modifications on Surge Performance of an 11-Stage Axial-Flow Compressor. I1 - Redesigned Colnpressor for XJ40-WE-6 Engine. NACA RE4 E52110, 1953.
" . . . . .
I I
.. .. .. .
2792
" m1.t
p 0 M U I - C t O U
i&
791 191
7pP 70s
780 701
780 I90 7% 701 781 194 781 701 700 704 I82 7p1 7% IS2 7 m IW 784 781 7%.
187 7M
7 m 794
7 u 797 781 7ea 708 Bo2 181
780
;E I98
I88 181
187 188 780 787 IS%
186
795
m1
I

. . . . . . . . . . .
I
I " " "
.. . . . . . . . . .
I
.. . , - . . . . ..
2192 I
. ." ..
I I
1 I
i ) "
e C C f 4 4 4 4
- 1
1
7 1
1 6 C 8 6 I 6 6 8 6 8 5 6 1 6 6 4 4
- r-
n
"
"
P C .o I b
"
8 C 6 0
4 a 7 6 7 7 0 E 3 4 3 3 c
n
"
. .
. , . . . . . . . . . . . . . . .. . .
Brm A l t i h x ( w
151 162
l5.w
EA 1M
165
E57 158
188 159
16l 160
1B1 1@5 104
.lSb . . . lea
167
169 160
170 171 17P 173 174 175 110
,177 178
, 1 8 0 179
1111 1 8 l 183
116 , 184
l a 6 117 188 189 1 9 0 191
193 194 1s 196 197 198 188 am
lm
L
MaauI* Ru
=ti0
PdPO
- 1.189 1.m 1.165 1.156 1.198
1.108 1.198
1.158 1.101 1.l58 1.119 1.169 1.157 1.m 1.156 l..L69. 1.159
1.111 1.158
1.155 1 . m 9
1.159 1.164
1.160 1.131 1.168 1.WB 1.168 1.181
1,lW 1.158
1.151 1.m
1.158 1.159 1.m 1.W
1 . D 1.161
1.182 1.164 1.185 1 . U 8 1.15Q 1 .187
1 . l W 1 . l W
1.166 l . l W
1 . m
-
-
8 uba Ib
- A04
A12 A 8 0
.460 A65 .459 .&4 A83 A81
.w
.a
.a A82
.bW
.4m
,464 AM
.461 A B S
.a8
.I84
. I81 A71 .I04 .I86 .4& . IC4 .a .4a, .km . a 9 .m . u 7
.4w
.a
.I04
.4S6 A56 A11 .I81 .MU .471 A 1 2 ,460 .a A75 .4m .4a .4z? .474 -
. . . . . . . . .
1.25
1.25 1 .a 1.21 1.11
1.21 1.27.
1.23 1 . P
1.9l 1.a
1.91 1.a
1.21 1 .al 1.23 1 . a 1.21 1 2 1 1.a 1.21
1.21 1.21 1.21 1.m l . W
l.U 1.U
1.W 1.U 1.15 l.U 1.13 1 .w 1.1s 1.11
1.11 1 .W 1.11 1.U
1.U l.U
1 . W l . W
1 . U 1.33 l.U l . W 1.U
1 . a
- -0- lnlst
I W 0 . M rotll
lb 1 p2
m - W77 1374 u 7 9 u 7 9 1369
1176 1177
1314 u 7 7 W l l U 7 5 1374 1574 1575 -74
U 7 8 ' ' 1574
Is72
1M w74
1375 L3i%
w 7 4 1378
1374 IS40 1378 1378
U 7 8
u 7 2 -5
lss lw! w 7 7 1574 U15 1577 lssl la76 1381
w 1 1 lS68 U7Q
1371 ljB8
1577 1915
u s a
191s
1sm
-
z6 LZ
- 3% Lr nom "a.1 Lb/s.o)
- 49.10
61.51 48.84
68.29
B2.54 86.18
84.42 B2.73 84.11 88.00 85.39 B4.46 62.61 85.61 75.77 75 :17
W.& 7 s . s
70.91 62.M 6 2 . m 52.08 51 .a 41.52
m.96
m.40 85.46 86.72 m.48 95.2s 92.67 05x4 92.88
04 A 04.U e3.m 02.72 8 1 . 1 7s .n 70.20 73.40
e5 .so 68.71 8z.m 52.11 S0.M
49.18
8s.-
49.70 -
I
. . . . .
322 W A RM E52L04 I7
Figure 1. - schematic sketch of adjustable turbine-stator actuating mechanism.
I I
NACA RM E52L04
N
Corrected air flow, Wa-&/6, lb/sec
(a) Altitude, 30,000 feet; flight Mach number, 0.62 .
Figure 3. - Compressor performance maps.
20 NACA RM E52L04
(b) Altitude, 15,000 feet; flight Mach number, 0.46.
Figure 3. - Concluaed. Compressor performance maps.
EACA RM E52L04 I 21
~onrpressor pressure ratio, P ~ / P Z
(a) Fsglne speed, 7260 rpm; corrected engine speed, 7855 rpm.
Figure 4. - C o m p o s i t e performance plots. Altitude, 30,000 fee t ; flight Mach number, 0.62.
22 - NACA RM E52L04
I I First-stage turbine-stator effective area, &, sq f ' t
--Turbine-inlet to engine-inlet temperature ra t io , Ts/l''ll Specific fuel consumption, Wf/F,, lb/!hr)(lb thrust)
..
(b) Engine speed; 7050 rpm; corrected engine speed, 7630 r p m .
Figure 4. - Continued. Composite performance plots. A l t i t u d e , 30,000 feet; flfght Mach number, 0.62.
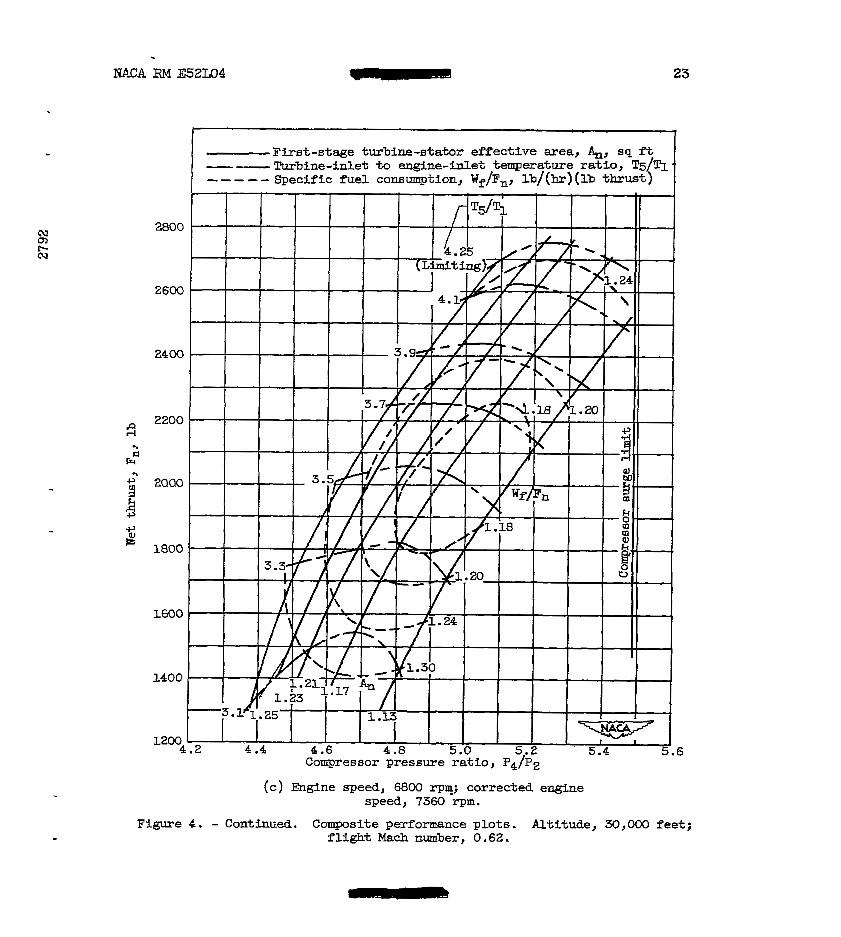
NACA RM ESZL04 23
2800
2600
2400
2200 3
%
Frr tl
4
2 2 0 0
.P
% = 1800
1600
1400
r2m4
First-stage turbine-stator effective mea, &, sq ft --- m b i n e - u e t to e n g i n e - u e t temperature ratio, %/TI -- - -- Specific fuel consmption, Wf/Fn, lb/(hr)(lb thrust)
Compressor pressure ra t io , P~/PZ
(c) -ne speed, 6800 rpm,; corrected engine speed, 7360 rpm.
Figure 4 . - Continued. Composite performance plots . Altitude, 30,oOO feet ; flight Mach number, 0.62. -
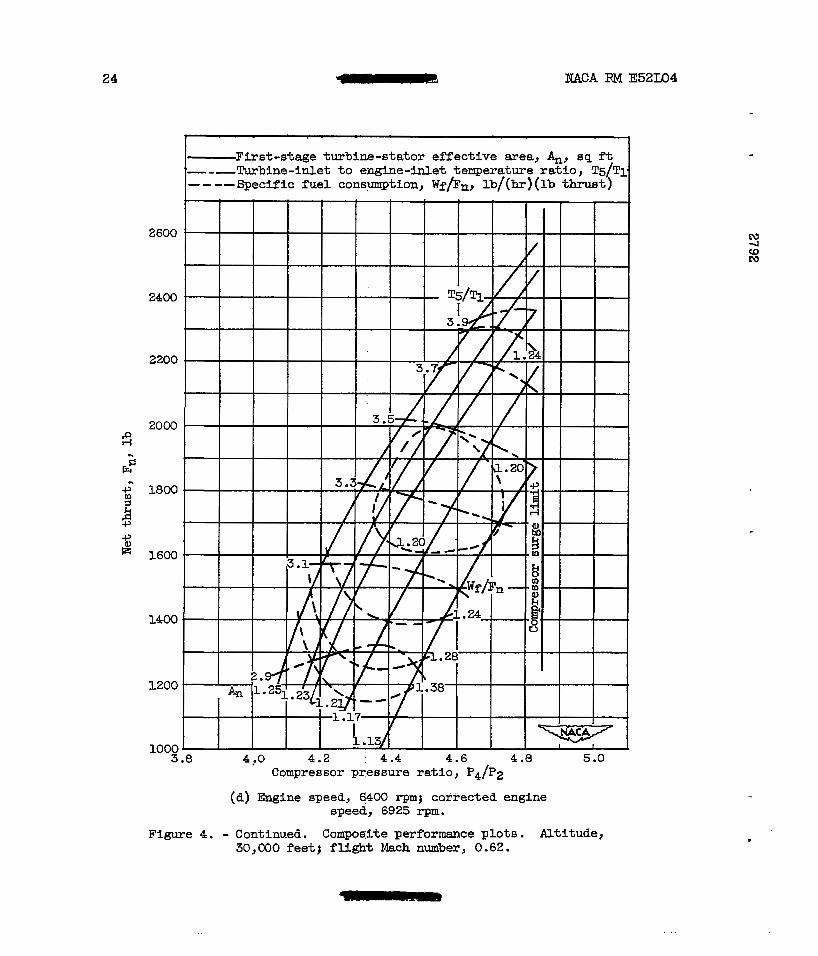
24 "CFY W A RM E52L04
.. El
Fr
2600
2200
2000
1600
1400
1200
1000 3
First-stage turbine-stator ef'fective area, &, sq ft ---Turbine-inlet t o engine-inlet temperature ratlo, T5/Tx - - " Specific fuel consLmzption, Wf/Fnr lb/(hr)(lb thruat)
.8 4 .O 4 . 2 : 4.4 4.6 4 .a 5 .o compressor pressure ratio, P ~ / P ~
(a) Engine speed, 8400 rpm; corrected engine speect, 6925 rpm.
Figure 4. - Continued. Compoaite performance plots. Altitude, 30,000 f e e t i flight Mach number, 0.62.
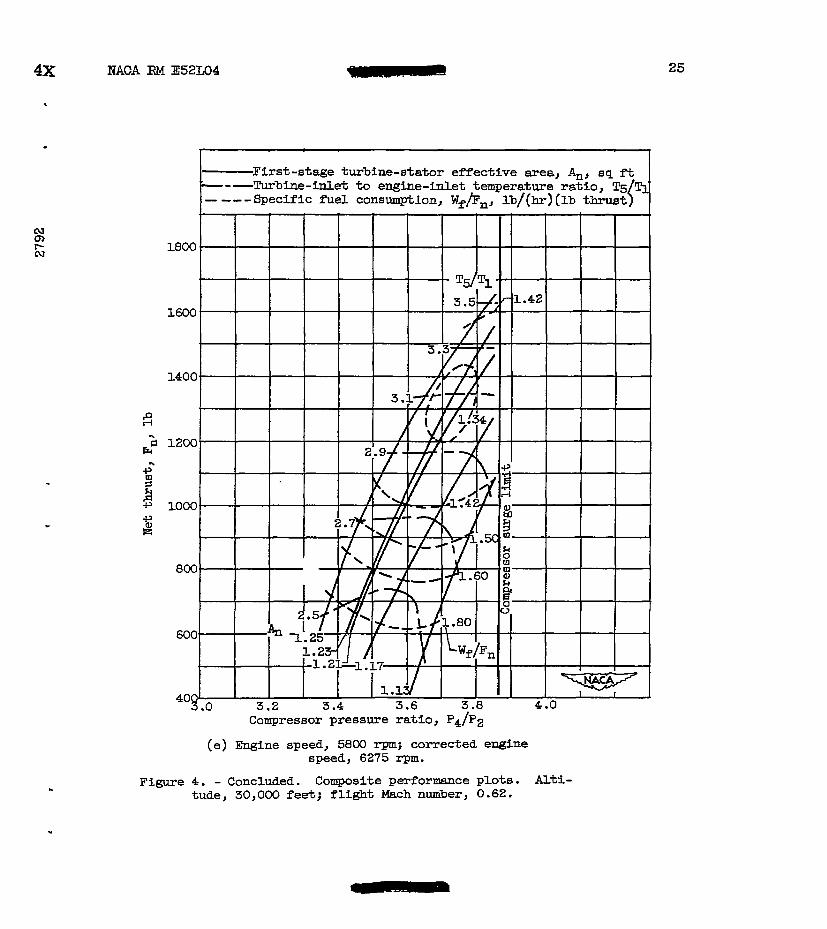
4x NACA RM E52L04
t -First-stage turbine-stator effective area, &, eq ft
- ---Specific fue l consumption, Wf/!Fn, lb/(hr)(lb thrust ” Turbine-inlet t o engine-inlet temperature ratFo, 5
L
25
Compressor pressure ratio, P ~ / P Z
(e) Engine speed, 5800 rpm; corrected engine speed, 6275 rpm.
Figure 4. - Concluded. Composite performance plot0 . Alti- tude, 30,000 feet; flight Mach number, 0.62.
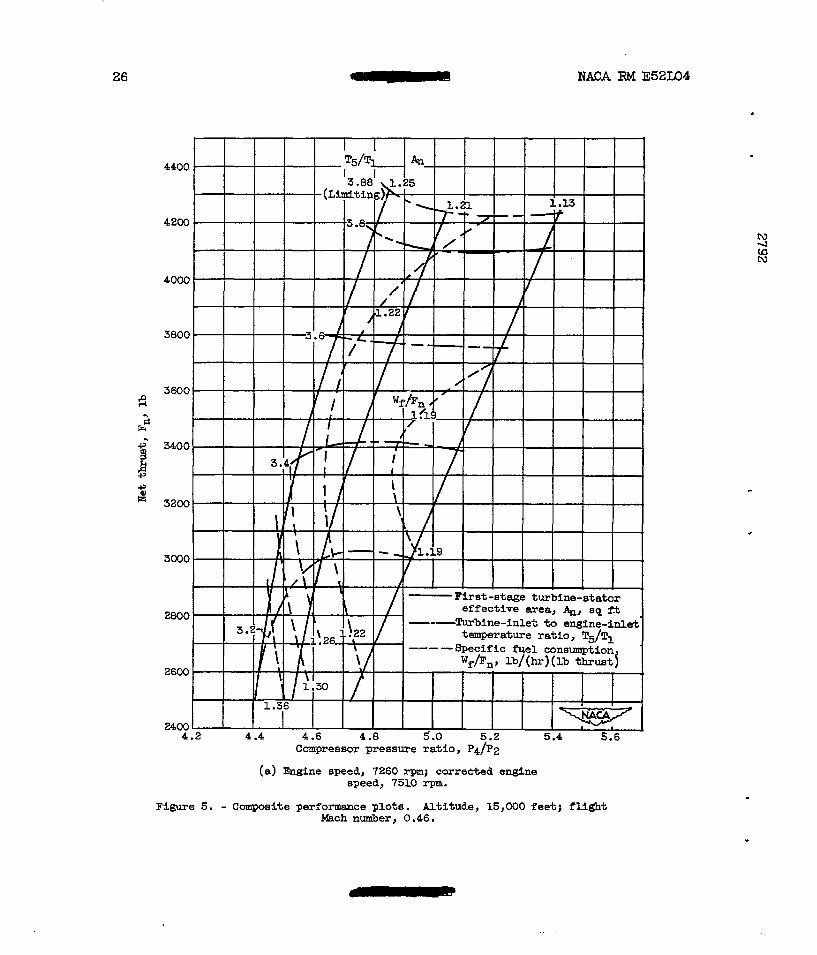
26
Compreesor pressure ratio, P~/PZ
(a) Engine speed, 7260 rpm; corrected engine speed, 7510 rpm.
Figure 5. - Composite performaace plots. Altitude, 15,000 feet; flight Mach number, 0.46 .
NACA RM E52L04
MACA RM E52L04 ”. 27
Compressor preseure ratio, P ~ / P Z
(b) Engine epeed, 7050 rpm; corrected engine speed, 7290 rpm.
Figure 5 . - Continued. Composite performance plots. Altitude, 15,000 feetj flight Mach rimer, 0.46.

28
NACA RM E52L04 - 29
N m t- cu
R ;I ..
.
4000
3800
3600
3400
3200
2800
2600
2400
"
2200
2000
1800 3.6 3.8 4 .o 4.2 4.4 4.6 4.0
Compressor pressure ratio , PJPZ (a) Engine speed, 64400 rpm; corrected engine
speed, 6620 rpm. ure 5. - Continued. Composite performance plots. Altitude,
15,000 feeti flight Mach number, 0.46.
30 NACA FM E52Lo4
.
(e) Engine speed, 5800 rpm; corrected engine speed, 6000 r p m .
Figure 5 . - Concluded. Composite performance plote. Altitude, W,ooO feet ; flight Mach nmiber, 0.46.
. 2792 . . - . . . . . . " . . . . ?
I
+ ,
First-etage turbine-etator effective area, &, aq ft
(a) Altitude, 30,000 feet; flight (b) Altitude, 15,Mx) feet; fllght Mach number, 0.62. Mach Ilmnber, 0.46.
Figure 6. - Variation of specFfic fuel consumption with first-stage turbine-atator effective area w P at constant thruste.
. . . . . . . . .
32 - M C A R”E52L04
.
(a) Variation of compressor pressure ratio with turbine-inlet to engine-inlet temperature ratio.
Figure 7. - Effect of engine speed on engine performance parameters. Firat-stage turbine-stator effective area, 1.13 square feetj altitude, 30,000 feetj flight Mach number, 0.62 .
Compressor pressura ratio, pg/P2
(b) Variation of net thrust with compres~or pressure ratio. Figure 7. - Continued. Effect of engine speed on engine performance parameters. First-stage
turbine-stator effective area, 1.13 sguara feet# altitude, 30,000 feet; flight Mach number, 0.62.
33
34 NACA RPI E52M4
35
(a) Variation of acutpressor pressure ratio nith turbine-inlet to engine-inlet temperature ratio.
Figure 8. - Effect of engine speed on engine performance parameters. First-stage turbine-etator effective area, 1.13 square feet; altitude. 15.000 feet; f l ight Mach number, 0.46.
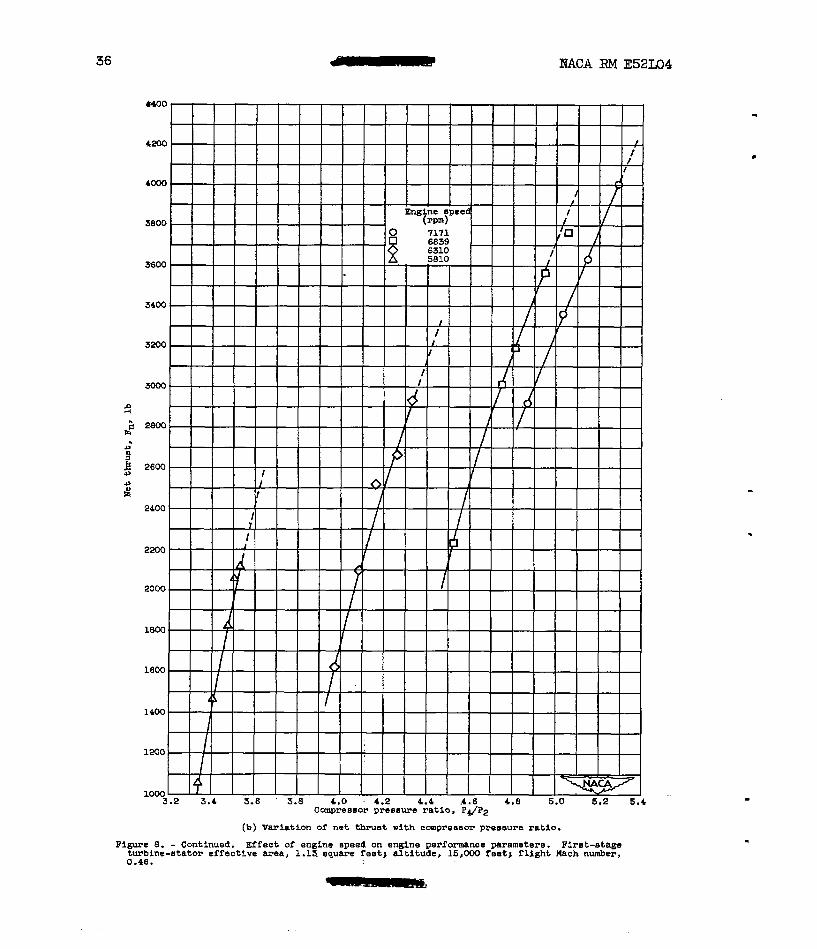
36 llc IiACA RM E52L04
(b) Variation of net thrust with cmpreseor pressure ratio.
F i g u r e 8. - Continued. Effect of engine speed on engine performanae parametere. Flrat-atage
0.46. turbine-stator effective area, 1.11 aquare feet; altitude, 15,ooO reatj flight Mach number, -
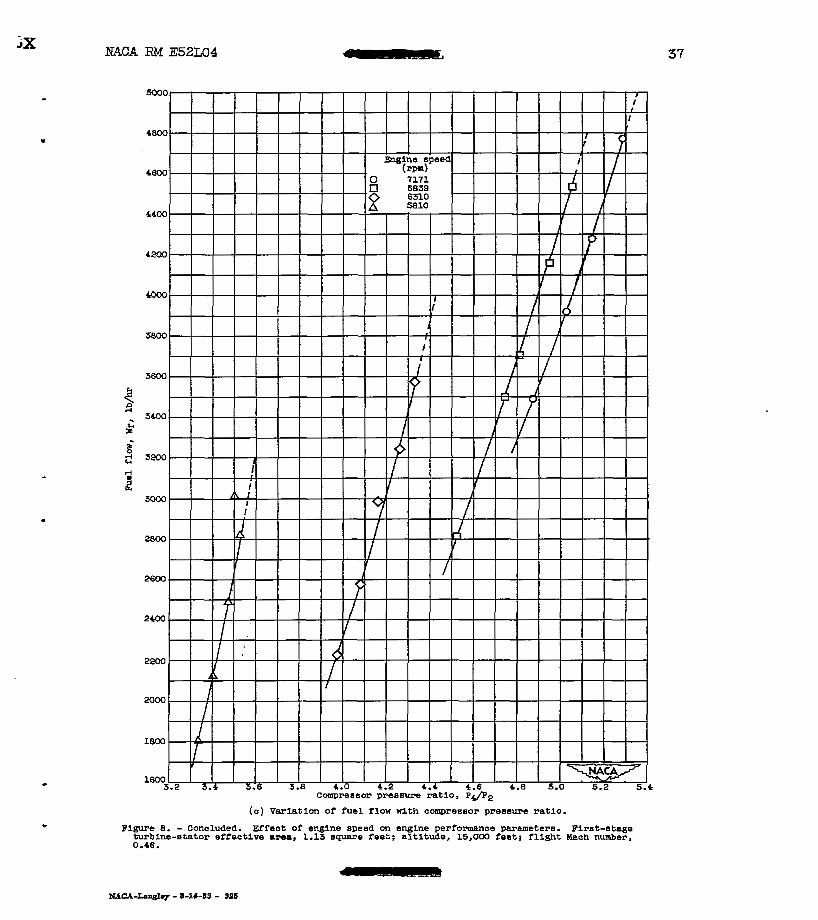
. Figure 8. - Concluded. Effect of engine speed on engine performance parameters. First-atage
0.46. turbine-stator effective L M ~ , 1.13 square feet; altitude, 15,000 feat; flight Mach number, -
WLcA-Lan,qlq - 1-1469 - 915

.-
I