Embed Size (px)
Citation preview

Research Methods and Research Methods and StatisticsStatistics
(The fun stuff)

Nature of Scientific MethodNature of Scientific Method
Modern science is based on the assumption that this is an orderly universe– And it is ruled by the laws of cause and effect– That is, if seemingly identical situations arise,
that seemingly results will occur

Developing a Theoretical Developing a Theoretical FrameworkFramework
Make a statement predicting relationshipsThen clarify what each of the terms in the
statement means within the framework of your research

TheoriesTheories
From our ideas we develop theories– They are attempts to understand how physical,
mental, behavioral and the environmental factors function together, and how they are related to each other
– They are organized set of concepts that explain a phenomenon or set of phenomenon
– They are expected to account for known facts and to generate new ideas and hypotheses

ConstructsConstructs
These are hypothetical concepts that are used in theories to organize observations in terms of the underlying mechanisms

Operational DefinitionsOperational Definitions
Defines a construct in terms of specific operations or procedures and the measurements that result from them
Thus, it consists of two components:– It describes a set of operations or procedures
for measuring a construct– It defines the construct in terms of the resulting
measurements

HypothesisHypothesis
From our theories we develop tentative and testable statement about the relationships between causes and consequences
“if”_____ “then”______ Gives us certain outcomes from specific
conditions– We then conduct research for verification
If the hypothesis is proven untrue, then you must rethink the theory

Theories to Hypotheses to Theories to Hypotheses to TheoriesTheories
There is a continual interaction between hypotheses and theories
Observation
Induction
THEORY
DEDUCTION
Predicted Observation and
Hypothesis
EXPERIMENTATION
Confirmed Observation
Disconfirmed Observation
Induction Deduction
Theory Supported Theory False

Research MethodResearch Method
This is a method for investigating our constructs and causal factors
It consists of running an experiment many times with only one variant– If the results of the experiment are different
The one variant is most likely the cause
VariablesVariables
A characteristic or condition that changes or has different values for different individuals
ConstantsConstants
A characteristic or condition that does not vary, but is the same for individual– It is often identified by its numerical value or
by a letter

Research MethodologiesResearch Methodologies
ExperimentCross-Sectional StudyLongitudinal StudyCorrelational StudyCohort-Sequential StudyEx Post Facto Study

Components of ExperimentsComponents of Experiments
IV DV Controls Extraneous Variables
(confounds)

Independent VariableIndependent Variable
A stimulus or aspect of the environment that the experimenter directly manipulates to determine its influences on behavior
IV is the causal part of the relationship we seek to establish

Dependent VariableDependent Variable
A response or behavior that the experimenter measures. Changes in the dependent variable should be directly related to manipulation of the independent variable.
DV is the effect part of a cause and effect relationship

ControlControl
The cornerstone of research.Limit the effect of unwanted influences.

Extraneous VariablesExtraneous Variables
Undesired variables that may operate to influence the dependent variable.
Can invalidate an experiment.Need to be limited!
– Another use of the term “control”
Populations & SamplingPopulations & Sampling
Population - The complete set of individuals we want to represent
Sample - Representative subset of the population from which it is drawn.– Random– Random w/out replacement– Random w/replacement– Stratified random sampling
RandomRandom
A sample in which every member of the population has an equal likelihood of being included (selected).

Random without replacementRandom without replacement
Once chosen, a score, event, or participant cannot be returned to the population to be selected again.– Ostensibly, jury duty (timed)

Random with replacementRandom with replacement
Once chosen, can go back into the pool to be selected again.– My experience with jury duty.– Phone surveys– Focus groups

Stratified Random SamplingStratified Random Sampling
Random samples are chosen from specific subpopulations or strata of the general population.– Frosh., Soph., Junios, Seniors
if 30% of undergraduates are Freshmen, then 30% of our sample will be Freshmen as well
Gender
– Can be carried too far - generalization for far too specific a population.

Quasi-Experimental DesignsQuasi-Experimental Designs
Cross-Sectional StudyLongitudinal StudyCorrelational StudyCohort-Sequential StudyEx Post Facto Study

Cross-Sectional StudyCross-Sectional Study
Involves the comparison of two or more groups.
Same, limited time period.Stratified SampleEx. Voter preferences (21, 31, 41, 51, 61)
– a sample from each age group

LongitudinalLongitudinal
Follow one group of participants over an extended period of time (years).
Cohort - group of individuals born during the same time period

Differential survivalDifferential survival
The difference (in age) of lifespan.Women live longer
– if following a group from their late 60’s through their 80’s, since women live longer, you need to have a larger sample of men in the beginning to account for “attrition”

CorrelationalCorrelational
Measures the strength and relationship between two variables
Used when data on two variables are available, but we cannot manipulate either one– Smoking cessation programs/decrease in cancer
No cause & effect

Cohort-SequentialCohort-Sequential
Hybrid of cross sectional and longitudinal.– Take a cross-section– instead of a “snapshot”, follow each cross-
section (or cohort) for a period of time.– Yields data similar to longitudinal– Shorter time span

Ex post factoEx post facto
Choose subjects based on pre-existing conditions.– Lung Cancer
Primarily used for ethical considerations

Ethics in ResearchEthics in Research
Human Subjects– 10 Principles APA– Highlights
Informed Consent Debriefing
Animal SubjectsIRB/IACUC

Experiment ExamplesExperiment Examples
StatisticsStatistics
Refers to a set of methods and rules for organizing, summarizing and integrating information
Stats are timesaving and informative because they condense large quantities of information into a few simple figures or statements
Bring order to chaos

Population and SamplesPopulation and Samples
Research typically begins with a general question about a specific group of individuals (depressed people)– This is a Population (individuals of interest in a
particular study) Populations can be quite large (e.g., women)
– This can make the study of the population quite difficult
– So we select individuals from a larger population This is a sample (a group of individuals selected to represent a
population)

ParametersParameters
These are numerical values that describe a population (how many people)
May be obtained from a single measurement, or it may be derived from a set of measurements

StatisticStatistic
This is a numerical value that describes a sample (the sample mean)
It also may be obtained from a single measurement
It also may be derived from a set of measurements

DataData
The measurements or observationsA data set is a collection of measurements
or observations– Datum is a single measurement or observation
(score or raw score)

Descriptive StatisticsDescriptive Statistics
These are statistical procedures used to summarize, organize and simplify data– average

Inferential StatisticsInferential Statistics
Consists of techniques that allow us to study samples then make generalizations about the population from which they were selected

From Samples to PopulationsFrom Samples to Populations
We are interested in generalizations about the population
But we only are able to study samples So we must make generalizations about the
population from our measurements of the sample– With the hope that our sample is representative of the
population– However sampling is not perfect and can never be a
true representation of the population This is called a sampling error

Sampling ErrorSampling Error
This is the discrepancy, or amount of error that exists between a sample statistic and the corresponding population parameter

Random Selection (sampling)Random Selection (sampling)
Used to reduced sampling errorThis is a process for obtaining a sample
from a population that requires that every individual in the population have the same chance of being selected for the sample
Methods for investigating Methods for investigating RelationshipsRelationships
Correlational MethodExperimental MethodQuasi Experimental Method

Correlational MethodCorrelational Method
Two variables are observed as they naturally exist to see if there is a relationship
Does not imply cause and effect


Experimental MethodExperimental Method
Independent Variable (manipulated by the researcher before measurement)– Consists of two or more conditions
Dependent Variable (The observed changes) Constants You manipulate the IV to look for a change in the DV
while all the rest of the conditions remains constant Gives cause and effect


Control ConditionControl Condition
Individuals in the control condition do not receive the experimental treatment
They receive either no treatment or a placebo treatment
It provides a baseline for comparison with the experimental condition (is there an effect of time or an effect of the experimenter)

Experimental ConditionExperimental Condition
The individuals in this group receive the experimental treatment
Confounding VariableConfounding Variable
This is an uncontrolled variable that is unintentionally allowed to vary systematically with the independent variable


Quasi-Experimental MethodQuasi-Experimental Method
They are almost, but not quite true experiments This method uses non-manipulated variables to
define the conditions that are being compared The non-manipulated variable is usually a subject
variable (male versus female) or a time (before versus after treatment) variable
The non-manipulated variable that defines the conditions is called a quasi-independent variable

MeasurementMeasurement
Measurements involve either categorizing events or using numbers to characterize the size of the event
There are several types of scales associated with measurement– Will determine the limitations of your data– Will determine which stats you can use
Nominal ScaleNominal Scale
Consists of a set of categories that have different names
Measurements on a nominal scale label and categorize observations, but do not make any quantitative distinctions between observations (labels…e.g., first round, second round)

The Ordinal ScaleThe Ordinal Scale
Consists of a set of categories that are organized in ordered sequence
Measurements on an ordinal scale rank observations in terms of size or magnitude– For example, 1st place, 2nd place, 3rd place– There is no zero (the starting point is arbitrary)

Interval ScaleInterval Scale
Consists of ordered categories where all of the categories are intervals of exactly the same size
Because there is no absolute zero, ratios of values are not meaningful– A good example of an interval scale is the Fahrenheit
scale for temperature– Equal differences on this scale represent equal
differences in temperature, but a temperature of 30 degrees is not twice as warm as one of 15 degrees.

Ratio ScaleRatio Scale
This is an interval scale with the additional feature of an absolute zero point
With a ratio scale, ratios of numbers do reflect ratios of magnitude– A good example is the Kelvin scale of temperature– This scale has an absolute zero– Thus, a temperature of 300 Kelvin is twice as high as a
temperature of 150 Kelvin

Discrete VariablesDiscrete Variables
Consists of separate, indivisible categoriesNo values can exist between two
neighboring categoriesUsually expressed in whole numbers (7 or
6)– Means there is no 7.1, 7.11, 7.12, etc.

Continuous VariablesContinuous Variables
There are an infinite number of possible values that fall between any two observed values
A continuous variable is divisible into an infinite number of fractional parts
There are real limits (upper and lower real limits)


Statistical NotationStatistical Notation
ScoresSummation

ScoresScores
X Y 1 3 3 5 2 3 5 1
Usually denoted by a letter (X or Y)

SummationSummation
X Y 1 3 3 5 2 3 5 1
ΣX = 11, N = 4
The Notation for sum is “Σ”
The Notation for the number of scores is “N”
So if we wanted to find the ΣX
The N would be?

Order of Mathematical Order of Mathematical OperationsOperations
Any calculation within parentheses is done first Squaring is done second Multiplying or dividing is done third. A series of
multiplications or division operations should be done in order from left to right
Summation using the Σ is done next Finally, any other addition and/or subtraction is
done
Frequency DistributionsFrequency Distributions
This is an organized tabulation of individuals located in each category on the scale of measurement
It can be structured either as a table or as a graph, but in either case the distribution presents the same two elements:– The set of categories that make up the original
measurement scale– A record of the frequency, or number of individuals in
each category


Frequency Dist. TableFrequency Dist. Table
Presents the measurement scale by listing the different measurement categories (X Values) in a column from highest to lowest
Beside each X value we indicate the frequency (f)

Freq. Dist. TableFreq. Dist. Table By adding up the
frequencies you can obtain the number of cases:
Σf = N

Obtaining the “Obtaining the “ΣX” from ΣX” from Frequency TablesFrequency Tables
To obtain this information, you must use the information provided in the frequency table

Proportion MeasuresProportion Measures
This measures the fraction of the total group that is associated with each score

PercentagePercentage
You can also look for the percentage of occurrences of a particular score
First you find the proportion than you multiply by 100

Grouped Frequency Grouped Frequency Distribution TablesDistribution Tables
When data covers a wide range of values, it is unreasonable to list all the individual scores in a frequency table
You can use a grouped frequency distribution table
There are several rules to follow when creating one

Rules (guidelines)Rules (guidelines)
There should be about ten class intervalsThe width of each interval should be a
relatively simple numberThe bottom score in each class interval
should be a multiple of the widthAll intervals should be the same width

ExampleExample
The smallest score is 53
The largest score is 94 This gives a range of
42 rows

Frequency Distribution Bar Frequency Distribution Bar GraphsGraphs
Graphs have a X and Y axis– The X axis is the horizontal line– The Y axis is the vertical Line
Histograms– Used for interval or ratio data– The Bars produce a continuous figure
Bar Graph– Used with ordinal or nominal data– Differences between ranks do not provide information
about the interval

HistogramHistogram

HistogramHistogram

Bar GraphBar Graph

PolygonsPolygons
Instead of bars, this uses a single dot drawn above each score so that– The dot is centered above the score– The height of the dot corresponds to he
frequency

PolygonPolygon

Normal DistributionNormal Distribution
Shape of DistributionShape of Distribution
Distributions can be classified as symmetrical or skewed– Symmetrical
It is possible to draw a vertical line through the middle so that one side of the distribution is a mirror image of the other
– Skewed The scores tend to pile up toward one end of the scale and
taper off gradually at the other end– The section where the scores taper off toward one end of the
scale is called the tail

Shape of DistributionShape of Distribution

Percentiles, Percentile Ranks Percentiles, Percentile Ranks and Interpolationand Interpolation
Frequency distributions can be used to describe the position of an individual with a set
Individual scores are called raw scores– By themselves they do not provide much information
To evaluate a score, you need other information such as:– The average score– The number of scores above and below the score
We must transform the scores into a meaningful form

Rank or Percentile RankRank or Percentile Rank
This is defined as the percentage of individuals in the distribution with scores at or below the particular vale– When it is identified as a percentile rank, it is called a
percentile
If you have a score of 43 And 60% of people have scores lower than you Your score would be called the 60th percentile

Cumulative FrequencyCumulative Frequency
To determine percentiles or percentile ranks– The first step is to find the number of
individuals who are located at or below each point in the distribution
This can be done with a frequency distribution table and counting the number who are in or below each category on the scale
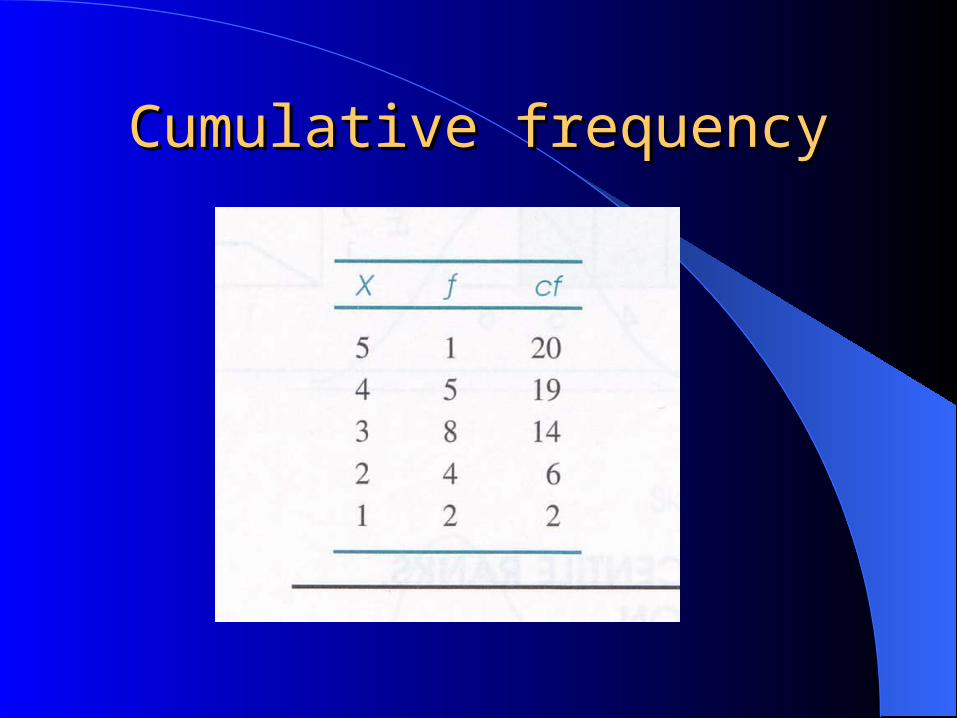
Cumulative frequencyCumulative frequency

Cumulative Frequency Cumulative Frequency PercentagePercentage
InterpolationInterpolation
What if we want to find the rank percentile for a score we don’t have– We can use interpolation
We have to know the interval
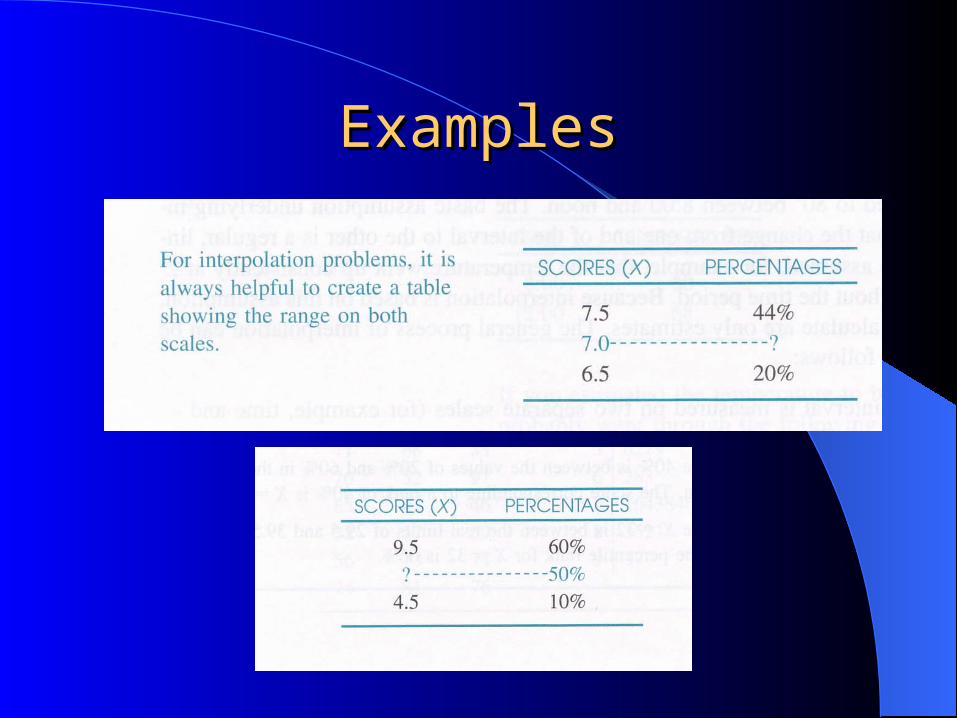
ExamplesExamples