Embed Size (px)
Citation preview

RESEARCH!
Methods, management
and communication
Rotterdam Mainport Institute
Januari 2018
Authors: P.C. van Kluijven
M. van der Drift Rotterdam Mainport Institute

2
RESEARCH! Methods, management
and communication References
Grit, R. (sd). Opgehaald van minicourse ms project: http://www.grit-
projectmanagement.wolters.nl
Herr, A. e. (1999). the new paradigm wars. Is there room for rigorous practitioner knowledge
in schools and universities? Educational Researcher, 28 (5), 12-21.
Lanen, C. v. (2011). Praktijkonderzoek in de school. Bussum: Couthino.
Peter Jan Schellens, R. K. (sd). communicatiekundig ontwerpen, methoden, perspectieven,
toepassingen. Van Gorcum.
Tulder, R. v. (2007). Skill sheets. Pearson Education.
Project management: Roel Grit (Wolters Noordhoff) Dit is onderzoek – D.B. Baarda (Noordhof) Onderzoek door te verbeteren - van Weert en Andriessen Methodologie van Technisch-wetenschappelijk onderzoek - Christiaans, Fraaij, de Graaff, Hendriks
(Lemma) A. Stephen B. Fawcett
Bazeley, P. (2013). Qualitative data analysis: Practical strategies. New York, NY: Brown, M. & Hale, K. (2014). Applied research methods in public & nonprofit organizations. Hoboken, NJ: Wiley.
Alexander de Haan & Pauline de Heer(2012) Solving complex problems - Eleven International Publishing

3
Content RESEARCH! ...................................................................................................................... 1
UNIT 1 - RESEARCH ........................................................................................................ 4
1.1 - Introduction ............................................................................................................ 4
1.2 - Research functionality ............................................................................................ 4
1.3 – Causal research: causes and consequences ............................................................ 5
UNIT 2 – RESEARCH PHASES ....................................................................................... 6
2.1 - Orientation Phase .................................................................................................... 6
2.2 - Research Phase ..................................................................................................... 14
2.2.1 - Research methods .............................................................................. 15
2.2.2 - Analysing data ...................................................................................... 15
2.2.3 - Models and tools .................................................................................. 18
2.2.4 – Reliability, relevance, reproduction and traceability ............ 25
2.3 - Realization Phase .................................................................................................. 25
2.4 - Rounding off Phase .............................................................................................. 25
UNIT 3 – MS PROJECTS ................................................................................................ 27
UNIT 4 – RESEARCH CHECKLISTS AND FORMATS .............................................. 28
THE PLAN OF APPROACH - FORMAT ................................................................... 28
RESEARCH REPORT - FORMAT ................................................................................. 29
UNIT 5 – COMMUNICATION ....................................................................................... 30
5.1 - First Action Plan for starting up a research .......................................................... 30
5.2 - Reporting .............................................................................................................. 30
5.3 - General Recommendations ................................................................................... 30
5.4 - Group Meetings: general ...................................................................................... 31
5.5 - Language .............................................................................................................. 36
5.6 - Reflection report ................................................................................................... 40
UNIT 6 – Assignments ..................................................................................................... 41
6.1 - ASSIGNMENTS: MAKING A MINDMAP AND A CAUSAL DIAGRAM ..... 41
6.2 – TEST: THE USE OF MODELS AND TOOLS .................................................. 44
6.3 - THE PLAN OF APPROACH .............................................................................. 48
6.4 - RESEARCH – LEARNING TESTS .................................................................... 53
UNIT 7 – Video links ....................................................................................................... 59

4
UNIT 1 - RESEARCH
1.1 - Introduction
Applied practical research performed by Bachelor students is aimed at solving a
problem.
The predefined end-product (objective) has been made clear in a problem description
and problem definition, leading to a main question that will solve the problem.
To answer this main question a number of sub questions must be
drawn up.
These questions will be answered by means of a research.
The outcome of the research must be well defined and valid.
The research must refer to current and present
developments regarding the chosen topic, with a complexity that
will contribute to the students’ professional developments and
knowledge.
It is essential that students should take a great interest in the topic
that will be investigated. Students should be given ample time to perform their
research.
Key words are: describe; compare; define; evaluate; explain; design; clarify;
invent; question; detect; solve; improve; refer; innovate; prove; disprove; verify;
falsify; etc..
1.2 - Research functionality
Applied practical research can be related to:
- description: what are properties and characteristics; what does it look
like; contents; who is/are involved.
- comparison: what are differences and similarities;
- defining: what are sizes; what class and character; position; typecasting;
- evaluation: what are values and qualities; advantages and disadvantages;
suitability; desirability;
- explaining: why; what are causes, consequences; reasons; backgrounds;
- design: improvement and innovation; solutions; what are the options;
how to proceed; which measures can and cannot be taken;
Design-research must be aimed at improving a well-defined existing situation.
The outcome of the research must result in a continuative solution that leads to
improvement and/or innovation.
To become a Bachelor of Applied Sciences the function of a research must always be
aimed at the designing of a solution to an existing problem. The problem that must
be solved may well be related to various disciplines, e.g. technical aspects and
management; transport and safety, etc..
Note
Different types of research, e.g. evaluative and design research, can be incorporated
into a design research. As long as the design research will lead to the objective.
The core of a
thesis, paper or
project is the
problem
definition.

5
1.3 – Causal research: causes and consequences
In problem related design research – i.e. research leading to the solutions to a
practical problem by improvement or innovation – the causality of the problem that
is researched must be determined very accurately. What exactly is or are the
cause(s) leading to the consequence(s) that need(s) to be addressed?
This calls for “causal reasoning”, which is a complex process.
Once a cause has been detected the search for so called “root causes” will complicate
things. Root causes can be found by asking “why” several times.
This will lead to an in-depth research into the causality of the research.
Causes are mostly related to the Human Factor (HF), or Human Element.
If the HF leads to failures, or errors, we distinguish two types:
- active failures are failures that form direct causes
- latent failures that create conditions for active failures
These latent failures are the Root Causes.
Examples of root causes are:
1. Inadequate procedures and regulations
2. Bad design
4. Inadequate organization
5. Bad or no communication
6 Insufficient training
7. Error-enforcing circumstances - factors that provoke the making of mistakes and
errors, e.g. pressure of time, fatigue, working conditions, culture gap, etc.
8. Incompatible goals - conflicts of safety and productivity, high demands, etc.
9. Defenses - protection and measures (precautions) to prevent and/or control
hazards.
10. Negligence
Two examples of HF related incidents with active and latent (root) causes
As we do not have any guidelines regarding circumstances and occasions that call for the presence of a lookout on the bridge, our vessel has collided with a container that was jettisoned by a vessel-in-distress. Severe damage; two crew-members were seriously injured.
As our office staff is poorly trained the request from the client for assistance with the transportation of 138 containers with refrigerated fish was ignored. Client has left us.
Both incidents are clearly related to the HF. In the first example the active failure
was the lack of a look-out. The latent failure – root cause – is bad organization.
The second example is clearly related to office procedures, or the lack of them.
The latent failure or root cause is lack of training. Now one could ask the question:
“Why are the employees of this company so poorly trained”.
And then again: “Why …..”. Etc.
Of course there are many more of these root causes that are very much related to
the business or industry that the research relates to.
It is of utmost importance to study the root causes well, and relate them to
the consequences and, most importantly, to the wishes of the assignor/client.
Final recommendations should always contain advices regarding the observed root
causes(s).

6
UNIT 2 – RESEARCH PHASES
The orientation phase, the research phase, the realization phase and
the rounding-off phase
Research sequence: step-by-step plan
- Brainstorm session: what are relevant parameters, characteristics, aspects,
actors, etc..
- Analysis: present and desired situation
- Problem description
- Problem definition
- Objective
- Main question
- Sub questions
- Research borders
- Methodology: quantitative and qualitative methods in desk and field research.
2.1 - Orientation Phase
In this phase the researcher should familiarize him/ herself with the demands and
wishes of the principal or client/assignor.
Making a Mindmap and a Causal Diagram MindTools video
Mind mapping is an analytical tool to initiate a research. It is the very first
orientation of what the research is about, what it will look like, and where it is
heading. A mindmap is about which aspects are related to the research topic.
The first face of the mindmap is a brainstorm session. This is an unstructured
associative phase in which the focus is on every topical aspect one can think of,
related to the causes and consequences that will be dealt with in the research.
This way of reasoning requires creative thinking in finding as many key words as
possible. Important is to be aware of what to find and where to find it.
Doing this properly by using various sources such as manuals, papers and
professional magazines, internet publications (Google Scholar, Narcis, etc.),
electronic databases, will save time!
Mindmapping
• Start in the center of the page with a description (1 or a few words) of
a research item (aspect, objective or problem)
• Branching and twigging: suggestions and ideas are written on the lines
branching off from the description in the center.
These branches are divided into other branches (twigs) representing
related suggestions and ideas.
• Consider all possible aspects, parameters, structures, actors,
stakeholders, categories, dimensions, advantages, disadvantages,
applications, characteristics, etc..
• Write keywords, do not write phrases or sentences. Make full notes on
the side that relate to the branches and twigs.
• Now draw additional lines that interconnect the suggestions and ideas.
7
Mindmapping: reduction of emissions from marine engines
Variables
Variables are key elements in the body of information that is created. They are
characteristics, numbers, or quantities that can be measured or counted.
There are two kinds of variables in research:
an independent variable is an aspect or condition that will create or determine
change and improvement. This could be aspects such as a program, an intervention
to accomplish a change, money, construction, material, legislation;
a dependent variable is what may change as a result of the independent
variable. The amount of NOx and SOx in exhaust gases is a dependent variable that
may change when better filters are installed.
Causal diagram
A causal diagram is the next step, where influences from variables (measurable and
countable aspects) are determined by making use of arrows with plusses and
minuses (+ and -).
A plus (+ indicates a positive influence, a minus (-) a negative influence.
Arrows are used to indicate influence.
This will produce a verifying model where the most logical relations are made visible
to indicate what the causes and consequences are.
With the help of a causal diagram sub questions can be drawn up.
1 - Define variables that play a role in the problem description, e.g. price,
maintenance, pollution, flow of goods, etc..
2 - Define factors that influence the variables, e.g. demand, usage, legislation,
organization, etc...
3 - Define factors that are influenced by the variables, e.g. distance travelled,
life time of an engine, quality of life, efficiency.
4 - Use arrows, pluses and minuses (+ and -) to indicate positive or negative
influences
5 - Make up sub-questions that will lead to the answer to the main question
(be sure to involve the assignor (client).
8
Causal diagram: reduction of harmful emissions
9
The Plan of Approach
Now, with a solid mindmap and causal diagram the Plan of Approach for the
research is made up that will initiate the research and gradually lead the researcher
towards the end goal, or objective.
Research must be aimed at solving a problem, i.e.: it must lead from an existing
situation to a desired new situation. The outcome must be innovative and creative;
existing knowledge must be increased by the outcome of the research.
The problem description and problem definition must clearly be assessed and
described in cooperation with a principal (company, client).
The problem description is an in-depth analysis of what is actually the problem,
with all the aspects, characteristics, parties involved (actors and stakeholders), etc..
Here the 5 “W-questions” Who / What / Where / When / Why will lead to a clear
description of the problem (see also S.M.A.R.T)
This description leads to the problem definition of one or two sentences that
represent the entire problem description.
The objective of a research, and hence the problem definition, may differ for every
actor and stakeholder.
Therefore it is of utmost importance to consider all ins and outs of the problem and
relate the problem to the right objective.
If vessels produce too high values of polluting emissions, the problem definition to
the ship owner might be:
“My vessels are not allowed to sail in SECA areas because emissions of pollutants are
too high”.
To the inhabitants of coastal areas the problem definition will read:
“It is unhealthy to live in this area because the air is polluted by exhaust gases from
ships”.
The Port of Rotterdam will state a different problem definition:
“The Port of Rotterdam suffers economically when vessels that produce too much
pollution are not allowed to enter our port”.
All these different problem definitions are actually related to one and the same
problem: pollution by exhaust gases.
The differences will now also lie with the objectives:
“Reduce emissions from vessels so that vessels can sail through SECA areas”;
“Reduce emissions from vessels so that the air will become clean again”.
“Reduce emissions from vessels so that ships are allowed to enter the Port of
Rotterdam”.
All this will of course affect the formulation of the main question, too, and thus the
sub-questions, and thus, in fact, the entire research with its conclusions and
recommendations.
These different approaches to the problem and objective are caused by so called
dilemmas, i.e. a situation in which a difficult choice has to be made.
It is up to the researcher to construct the right definitions and questions.
It must be obvious now that good communication between the researcher and the
client or assignor is of vital importance. What does the client want?

10
Main question and sub questions
Now the main question that will eventually lead to the final solution to the problem is
made up.
Sub questions related to all aspects in the problem description will answer the main
question.
The main question should be constructed in such a way that the problem as defined
in the problem definition will be solved. The objective of every sub question should
be to gather existing and problem-related knowledge. In design-research the first
sub-questions must have an evaluative and explanatory character.
Sub questions should lead to the answer to the main question, and should at least be
related to present conditions and circumstances, advantages and disadvantages,
applications, developments, technical aspects, etc.
The main questions should be of the open type, beginning with “How can ….”.
Do not start your question with “How to ….”. This will lead to a trick, rather than a
solution.
Sub questions should also be open questions beginning with what, who, how, where,
when.
When composing sub questions the starting point must be a generalization, leading
to specifics. This funnel model will provide the best results when making up research
questions.
DO NOT simply look up the answers.
Findings must be analyzed and interpreted.
The objective
The final objective of the research forms the goal, or aim of the research. Answers to
the sub questions will provide the answer to the main question, which will lead to
conclusions and recommendations, which will lead to the implementation of solutions
found, which must be evaluated.
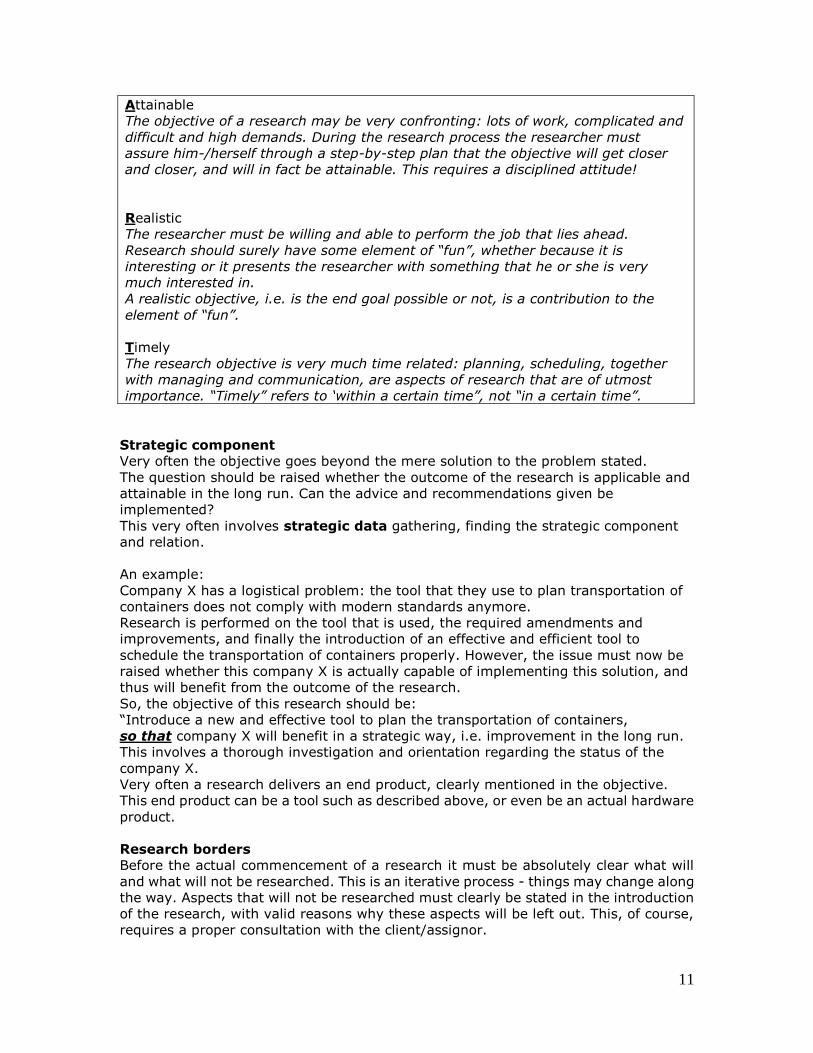
The objective has to be S.M.A.R.T., which stands for:
Specific
A specific objective, or goal, is much easier to accomplish than a general objective.
These “W” questions will lead to a specific objective:
*Who: Who are actors and stakeholders?
An actors is directly involved, he “acts”. A stakeholder will benefit from
the objective that will lead to the solution to the problem.
*What: What is it that the research is supposed to accomplish?
What are requirements, constraints, pitfalls?
*Where: Which location(s) can be identified?
*When: What is the time frame in which the objective is to be accomplished?.
*Why: Why is it important that this research is conducted?
Measurable
To determine if your objective is measurable, ask:
How much/many? How will I know when it is accomplished?
This will allow you to stay on track, work according to schedules, and properly
round off the research.
11
Attainable
The objective of a research may be very confronting: lots of work, complicated and
difficult and high demands. During the research process the researcher must
assure him-/herself through a step-by-step plan that the objective will get closer
and closer, and will in fact be attainable. This requires a disciplined attitude!
Realistic
The researcher must be willing and able to perform the job that lies ahead.
Research should surely have some element of “fun”, whether because it is
interesting or it presents the researcher with something that he or she is very
much interested in.
A realistic objective, i.e. is the end goal possible or not, is a contribution to the
element of “fun”.
Timely
The research objective is very much time related: planning, scheduling, together
with managing and communication, are aspects of research that are of utmost
importance. “Timely” refers to ‘within a certain time”, not “in a certain time”.
Strategic component
Very often the objective goes beyond the mere solution to the problem stated.
The question should be raised whether the outcome of the research is applicable and
attainable in the long run. Can the advice and recommendations given be
implemented?
This very often involves strategic data gathering, finding the strategic component
and relation.
An example:
Company X has a logistical problem: the tool that they use to plan transportation of
containers does not comply with modern standards anymore.
Research is performed on the tool that is used, the required amendments and
improvements, and finally the introduction of an effective and efficient tool to
schedule the transportation of containers properly. However, the issue must now be
raised whether this company X is actually capable of implementing this solution, and
thus will benefit from the outcome of the research.
So, the objective of this research should be:
“Introduce a new and effective tool to plan the transportation of containers,
so that company X will benefit in a strategic way, i.e. improvement in the long run.
This involves a thorough investigation and orientation regarding the status of the
company X.
Very often a research delivers an end product, clearly mentioned in the objective.
This end product can be a tool such as described above, or even be an actual hardware
product.
Research borders
Before the actual commencement of a research it must be absolutely clear what will
and what will not be researched. This is an iterative process - things may change along
the way. Aspects that will not be researched must clearly be stated in the introduction
of the research, with valid reasons why these aspects will be left out. This, of course,
requires a proper consultation with the client/assignor.
12
Research Methodology
The methods that will be used to gain information must clearly be stated and described
in the Plan of Approach. Desk research (building a theoretical framework) and field
research (doing interviews and tests) must relate to the gathering of quantitative
and / or qualitative data and information.
Quantitative analysis is about countable parameters and their characteristics:
- all the amounts, numbers, percentages, dimensions, values, statistics,
graphs etc. that are essential to the research. Analyse these and conclude
using statistics.
Qualitative analysis is about understanding coherences and relations in a specific
situation:
- relevant data in desk and field research. Read, watch, discuss, do
interviews and experiments, in other words: form opinions on facts that
have been gathered, analyzed and interpreted.
An example of a research on alternative berthing methods for sea-going
vessels. Note that every sub question is linked to specific research methods.
(quantitative and/or qualitative in desk and/or field research).
This now has to be made specific: which literature? Who will be interviewed? What
experiment?
Sub questions Research methods
1. Which mooring techniques are available and how do they work?
• Desk: qualitative information by means of Literature.
• Field: qualitative information by means of interviews with Cavotec and Mampaey.
• Field research is also done to gather qualitative information about the conventional mooring system.
Search for information about different mooring techniques and explain the operation of the mooring systems.
2. What is the legislation for bunker barges to moor alongside vessels or mooring in general?
• Desk: quantitative information by literature. • Field: quantitative information by interviews with
the Port of Rotterdam Search which regulations apply on the bunker barges in Rotterdam and their sailing areas.
3. What are the advantages and disadvantages of the mooring techniques?
• Field research by gathering quantitative and qualitative information.
Go to terminals which already use the mooring systems, meet with companies which made the mooring systems, gather information and figures about the magnetic mooring system that is currently tested on the VT Valk. Practicability of using a technique on a new jetty.
4. What will be the design of the best mooring system related to the strength, regulations and emergency procedures?
• Desk and field research: qualitative information Investigate all the needs, regulations and requirements to design a new system for the barges.
5. What are the benefits for this company related to safety, efficiency and speed during
mooring?
• Field research: qualitative information.
Make a financial plan for the principal containing the investment costs, installation costs and benefits. Make a risk analysis of the techniques.
13
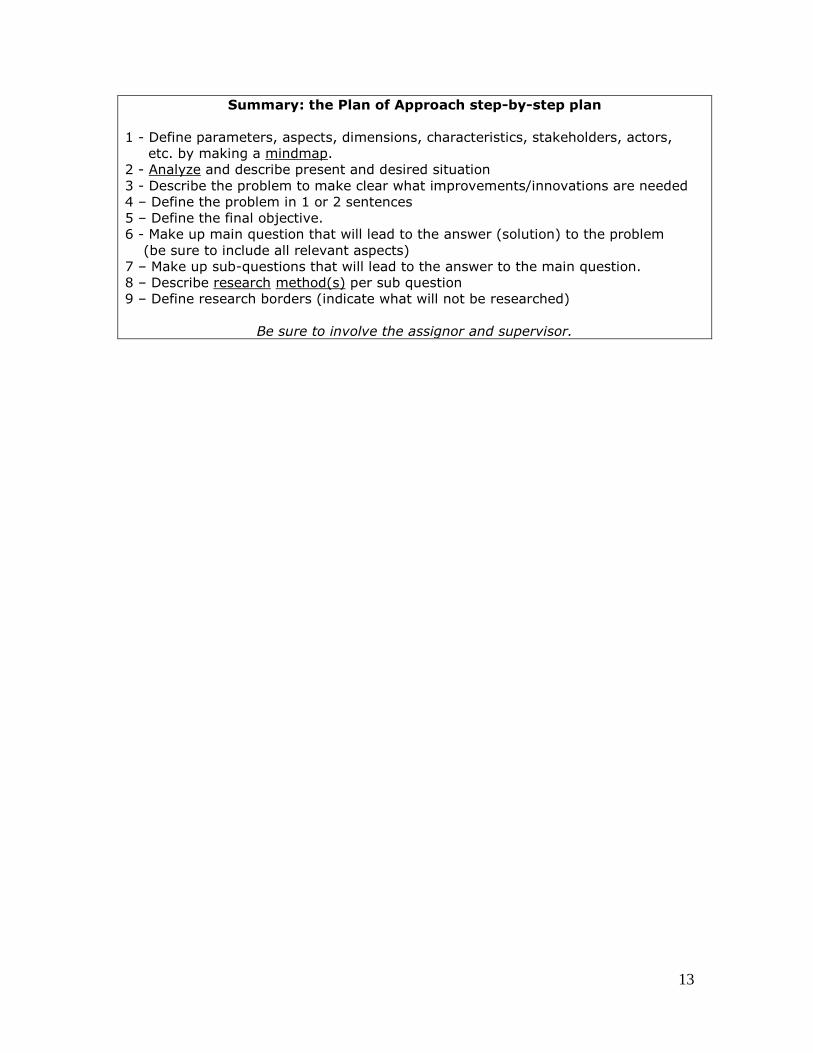
Summary: the Plan of Approach step-by-step plan
1 - Define parameters, aspects, dimensions, characteristics, stakeholders, actors,
etc. by making a mindmap.
2 - Analyze and describe present and desired situation
3 - Describe the problem to make clear what improvements/innovations are needed
4 – Define the problem in 1 or 2 sentences
5 – Define the final objective.
6 - Make up main question that will lead to the answer (solution) to the problem
(be sure to include all relevant aspects)
7 – Make up sub-questions that will lead to the answer to the main question.
8 – Describe research method(s) per sub question
9 – Define research borders (indicate what will not be researched)
Be sure to involve the assignor and supervisor.
14
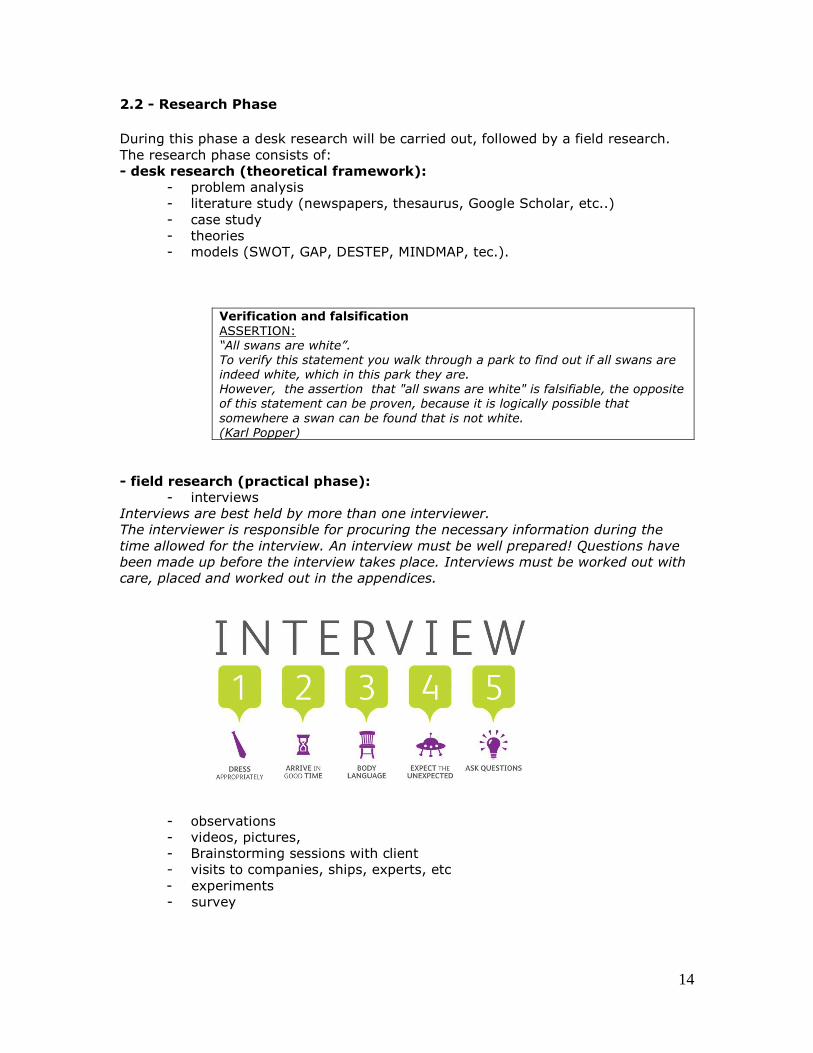
2.2 - Research Phase
During this phase a desk research will be carried out, followed by a field research.
The research phase consists of:
- desk research (theoretical framework):
- problem analysis
- literature study (newspapers, thesaurus, Google Scholar, etc..)
- case study
- theories
- models (SWOT, GAP, DESTEP, MINDMAP, tec.).
Verification and falsification
ASSERTION: “All swans are white”. To verify this statement you walk through a park to find out if all swans are indeed white, which in this park they are. However, the assertion that "all swans are white" is falsifiable, the opposite of this statement can be proven, because it is logically possible that
somewhere a swan can be found that is not white. (Karl Popper)
- field research (practical phase):
- interviews
Interviews are best held by more than one interviewer.
The interviewer is responsible for procuring the necessary information during the
time allowed for the interview. An interview must be well prepared! Questions have
been made up before the interview takes place. Interviews must be worked out with
care, placed and worked out in the appendices.
- observations
- videos, pictures,
- Brainstorming sessions with client
- visits to companies, ships, experts, etc
- experiments
- survey
15
2.2.1 - Research methods
Research must be related to the researcher’s own experiments, observations and
experience. This is called empirical research, which is a way of gaining knowledge
by means of directly gained evidence, i.e. by the researcher himself, versus
indirectly gained evidence, i.e. by other researcher(s). This empirical evidence is the
record of one's direct observations or experiences which must be analyzed by using
quantitative and qualitative methods.
Quantitative analysis is about countable parameters and their characteristics:
- all the amounts, numbers, percentages, dimensions, values, statistics,
graphs etc. that are essential to the research. Analyse these and conclude
by means of statistics.
Qualitative analysis is about understanding coherences and relations in a specific
situation:
- relevant data in desk and field research. Read, watch, discuss, do
interviews and experiments, in other words: form opinions on facts that
have been gathered. Analyse these and conclude.
Data collection
Collected data that has been obtained from books, articles, observations, interviews,
surveys, experiments, testing or other methods requires an accurate recording and
organizing before the analyses of all the information can be properly carried out.
Recording and organizing data may take different forms, depending on the kind of
information that is being collected. Recording of information should be done
concurrent with data collection if possible, or soon afterwards, so that nothing gets
lost and memory doesn’t fade.
Gathering information and data involves:
- objectivity and impartialness
- sufficient and appropriate sources that can be traced back
- making accurate and detailed observations
- mentioning and description of sources according to APA rules
- making copies of written tests, records, graphs, pictures, etc.
- numerical observations, charts, tables, spreadsheets,
- transcriptions of interviews, i.e. making an exact, word-for-word text version
of the contents of audio or video recordings
Next step then is to group all the data and information logically and into relevant
categories in order to answer the question(s).
2.2.2 - Analysing data
Now that all the relevant information has been gathered and properly recorded the
analyses of data can commence.
This is a most important aspect in research, since it will determine the outcome.
Analysing information involves relationships, patterns, trends, methods, working
principles, parties involved, places, times, etc..
In other words: ask how/why/who/what/where/when, so that correlations between
various variables will become clear. It also involves comparing information with that
from other researches and papers.
16
Analysis of data leads to the making of choices. In most cases, alternatives will be
available and the best one should be chosen. In order to select the best option,
relevant information is needed.
To solve the problem alternatives have to be developed and consequences of each
alternative have to be assessed in a S.M.A.R.T way (see there).
Triangulation
The validity of a research will be enhanced by triangulation.
Triangulation involves a three-way method of assessment of sources and data –
it’s looking at ways in multiple perspectives in mostly qualitative research.
There are five methods of triangulation:
1 – triangulation of source: data collection using (at least) three sources
2 – methodological triangulation: data collection using (at least) three methods, such
as quantitative and qualitative methods
3 – triangulation of theory: data collection using (at least) three theories that stem
from different disciplines
4 – triangulation of researchers: data collection using more than 1 researcherS
5 – triangulation of location: data collection using multiple locations related to
the field research.
Deductive reasoning
Deductive reasoning, also called “top-down reasoning”, is a way of thinking where
one starts off on a general bases and works towards the specific.
It is based on “narrowing down”.
Example:
All ships have Diesel engines that pollute the environment.
This ship has a Diesel engine.
So this ship pollutes the environment
Inductive reasoning
Inductive reasoning, also called “bottom-up reasoning”, works the opposite way.
It is a way of thinking where one starts off from the specific and works towards the
general. It is based on “broadening”.
Example:
This ship uses a 2 stroke trunk marine engine and it pollutes the environment
This ship uses a 2 stroke crosshead marine engine and it pollutes the environment
All ships with 2 stroke crosshead marine engines pollute the environment
Interpretation of the results
It is important to be able to assess whether the outcome of the data collection will be
effective and will in fact lead to improvement and/or innovation and thus will provide
a solution to the problem stated in the problem definition.
If the analysis shows that the solution(s) found are ineffective or negative, the
iterative process of doing research becomes obvious: the barriers that are in the way
to come up with useful solutions must be determined, researched and unravelled.
Very often these barriers relate to aspects such as finance, culture, experience,
personal characteristics, education, etc..
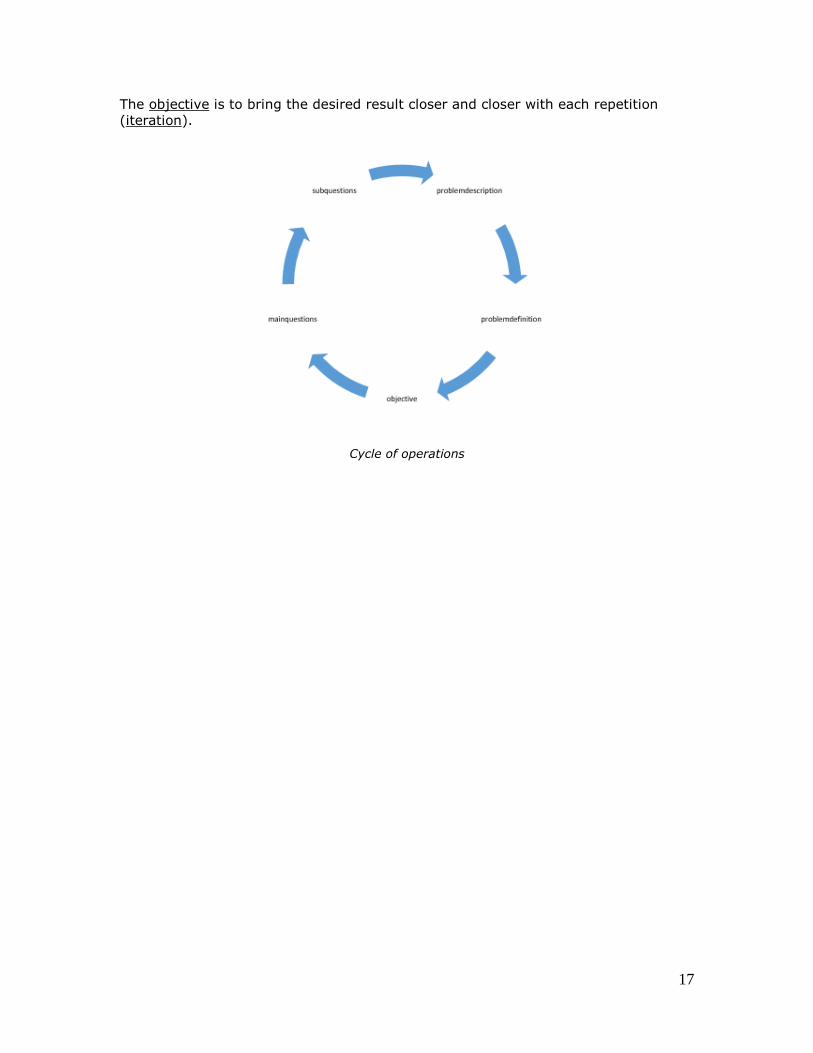
Iterative process
The making of a plan of approach and performing the research itself involves an
iterative process. Definitions, questions and borders are subject to reconsideration
during the entire process, with repeatedly included rounds of repetitions regarding
the right track. This calls for frequent rounds of analysis - a cycle of operations.
17
The objective is to bring the desired result closer and closer with each repetition
(iteration).
Cycle of operations

18
2.2.3 - Models and tools
A number of techniques and tools can be used to help make effective decisions.
Having tested all the options, the one that seems to solve the problem best is the
one to select. However, the consequences of choosing one alternative over another
have to be compared. The likely effects of each option must be estimated. This
involves weighing the positive and negative aspects of each: a crucial stage of the
final selection process.
In case alternatives are not available, decision-making tools and techniques and
decision-supporting systems can be used to simplify or accelerate the process of
finding the right solutions to the research-problem.
The flow chart MindTools video
A flow chart is a graphical representation of a process. Each step in the process is
represented by shape and contains a short description of the process step.
The flow chart symbols are linked together with arrows showing the process flow
direction.
These symbols are graphics:
Start and ending of a process
A step in a process
Decision
Data
Documents, reports, etc..

19
Plan-Do-Check-Act Cycle
The Plan-Do-Check-Act Cycle, or Deming Cycle, is a process that allows the
researcher to implement a change, or indeed solve a problem.
The four phases in the Plan-Do-Check-Act Cycle comprise the following steps:
- Plan: Identifying and analysing the problem.
The “5 Whys” are used here ( MindTools video):
ask “why” 5 times to get to the root cause of the problem.
- Do: Generate and test possible solutions.
- Check: Measuring how effective the test solution was, and analysing whether
it could be improved in any way.
- Act: Implementing the improved solution fully.
The Bow-tie Diagram MindTools video
A bow-tie diagram is an effective tool for risk assessment.
The diagram shows relations between potential causes and consequences of an
incident
It allows the researcher to decide what preventions must be taken (proactive control
measures) to prevent incidents from happening.
20
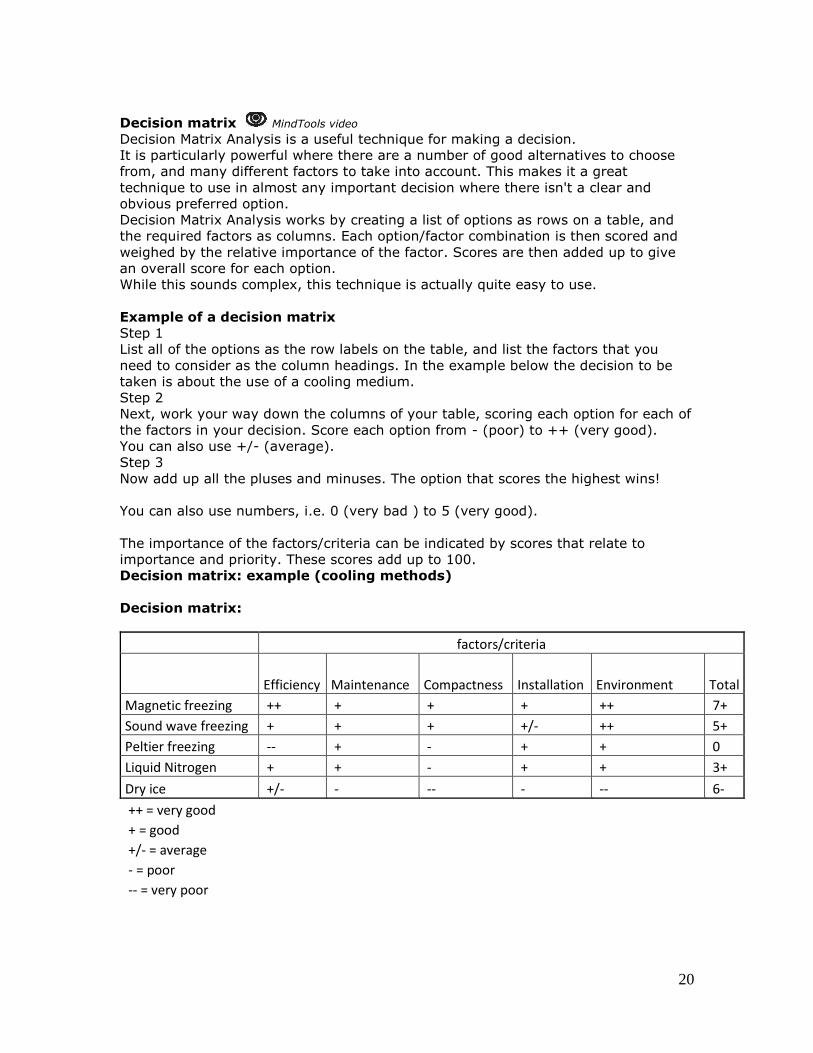
Decision matrix MindTools video
Decision Matrix Analysis is a useful technique for making a decision.
It is particularly powerful where there are a number of good alternatives to choose
from, and many different factors to take into account. This makes it a great
technique to use in almost any important decision where there isn't a clear and
obvious preferred option.
Decision Matrix Analysis works by creating a list of options as rows on a table, and
the required factors as columns. Each option/factor combination is then scored and
weighed by the relative importance of the factor. Scores are then added up to give
an overall score for each option.
While this sounds complex, this technique is actually quite easy to use.
Example of a decision matrix
Step 1
List all of the options as the row labels on the table, and list the factors that you
need to consider as the column headings. In the example below the decision to be
taken is about the use of a cooling medium.
Step 2
Next, work your way down the columns of your table, scoring each option for each of
the factors in your decision. Score each option from - (poor) to ++ (very good).
You can also use +/- (average).
Step 3
Now add up all the pluses and minuses. The option that scores the highest wins!
You can also use numbers, i.e. 0 (very bad ) to 5 (very good).
The importance of the factors/criteria can be indicated by scores that relate to
importance and priority. These scores add up to 100.
Decision matrix: example (cooling methods)
Decision matrix:
factors/criteria
Efficiency Maintenance Compactness Installation Environment Total
Magnetic freezing ++ + + + ++ 7+
Sound wave freezing + + + +/- ++ 5+
Peltier freezing -- + - + + 0
Liquid Nitrogen + + - + + 3+
Dry ice +/- - -- - -- 6-
++ = very good
+ = good
+/- = average
- = poor
-- = very poor
21
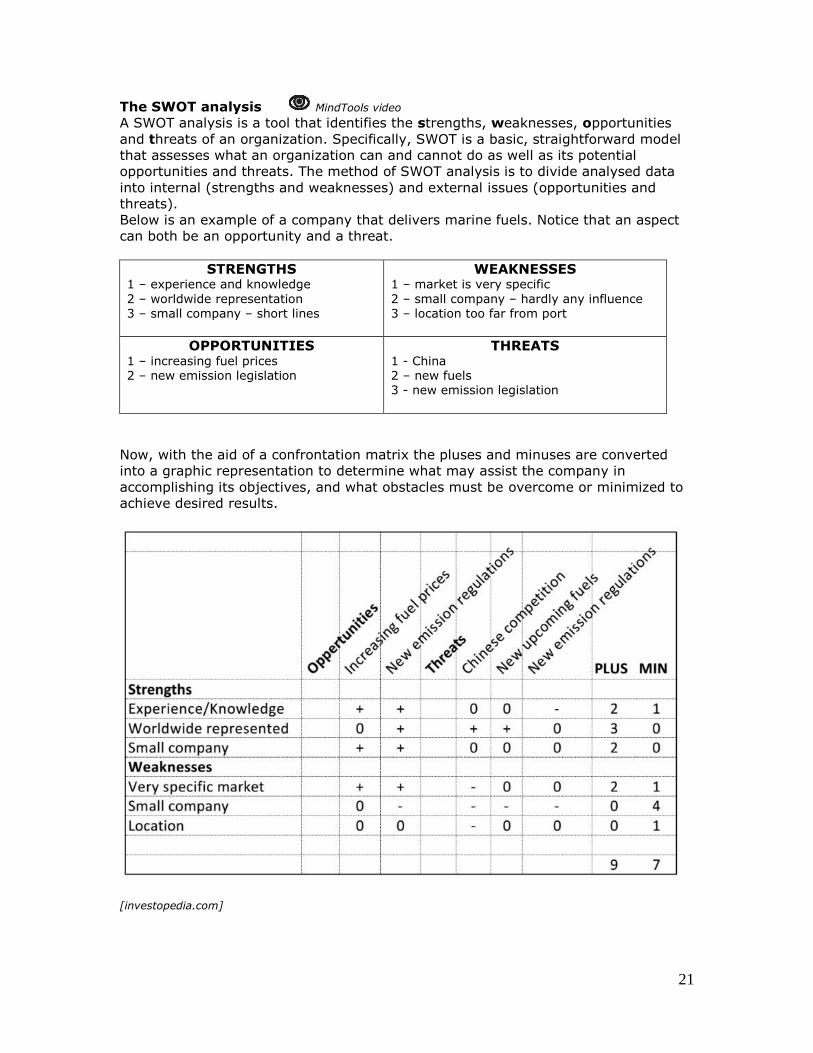
The SWOT analysis MindTools video
A SWOT analysis is a tool that identifies the strengths, weaknesses, opportunities
and threats of an organization. Specifically, SWOT is a basic, straightforward model
that assesses what an organization can and cannot do as well as its potential
opportunities and threats. The method of SWOT analysis is to divide analysed data
into internal (strengths and weaknesses) and external issues (opportunities and
threats).
Below is an example of a company that delivers marine fuels. Notice that an aspect
can both be an opportunity and a threat.
STRENGTHS 1 – experience and knowledge
2 – worldwide representation
3 – small company – short lines
WEAKNESSES 1 – market is very specific
2 – small company – hardly any influence
3 – location too far from port
OPPORTUNITIES 1 – increasing fuel prices 2 – new emission legislation
THREATS 1 - China 2 – new fuels 3 - new emission legislation
Now, with the aid of a confrontation matrix the pluses and minuses are converted
into a graphic representation to determine what may assist the company in
accomplishing its objectives, and what obstacles must be overcome or minimized to
achieve desired results.
[investopedia.com]

22
DESTEP and STEP analysis MindTools video
A DESTEP analysis is a model that will allow a company to determine strategic
opportunities and threats. It is the acronym for six factors:
- Demographic aspects – this factor addresses the composition of the
population; greater understanding of this factor could be of crucial importance
for an organization
- Economic aspects – these are all factors that have to do with economic
growth, inflation, purchasing power, etc
- Social (cultural) aspects – these are characteristics in the area of culture
and way of life
- Technological aspects – this is about all developments and innovations an
organization has to respond to in order to keep up with the times
- Ecological aspects – this includes all factors in the area of the physical
surroundings and the environment
- Political-legal aspects – these are all political measures at a decision-
making, provincial and municipal level.
A STEP* analysis only deals with four aspects:
- Social (cultural) aspects
- Technological aspects
- Economic aspects
- Political-legal aspects
*Sometimes also referred to as PEST
STEP ANALYSIS: the manning of tugboats
Social and cultural factors: • There are few sailing employees available.
• Crew wants shorter sailing periods, better social working Technology:
• Technology within the shipping sector is developing very fast. The reason is the fast upcoming number of transported cargo by ships and the rapidly changing legislation.
Economics: • Free market, other companies are free to get in the “tug business” .
• It is a fact that fuel prices are getting higher. • Despite the economic crisis, more vessel enter the port. • Economic growth in the future.
Politics and laws: • There are more upcoming laws and rules to protect the environment
• New legislation will lead to a demand for more employees.
[toolshero.com]
23
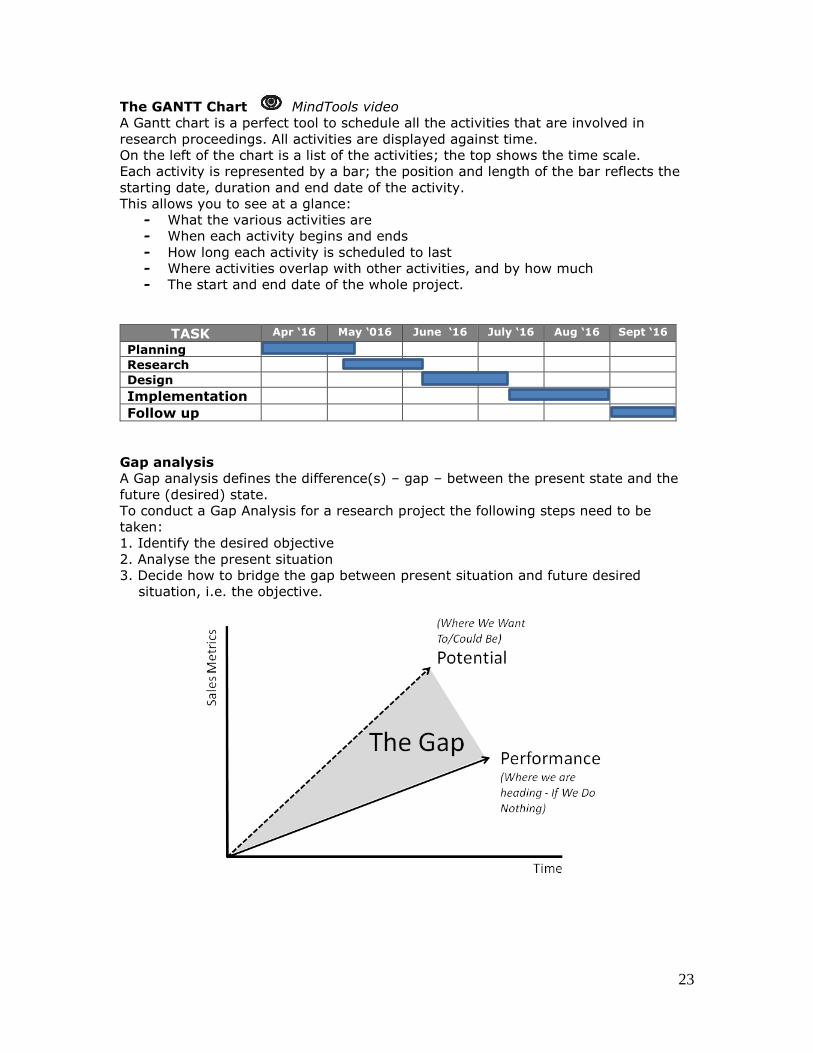
The GANTT Chart MindTools video
A Gantt chart is a perfect tool to schedule all the activities that are involved in
research proceedings. All activities are displayed against time.
On the left of the chart is a list of the activities; the top shows the time scale.
Each activity is represented by a bar; the position and length of the bar reflects the
starting date, duration and end date of the activity.
This allows you to see at a glance:
- What the various activities are
- When each activity begins and ends
- How long each activity is scheduled to last
- Where activities overlap with other activities, and by how much
- The start and end date of the whole project.
TASK Apr ‘16 May ‘016 June ‘16 July ‘16 Aug ‘16 Sept ‘16
Planning
Research
Design
Implementation
Follow up
Gap analysis
A Gap analysis defines the difference(s) – gap – between the present state and the
future (desired) state.
To conduct a Gap Analysis for a research project the following steps need to be
taken:
1. Identify the desired objective
2. Analyse the present situation
3. Decide how to bridge the gap between present situation and future desired
situation, i.e. the objective.
24
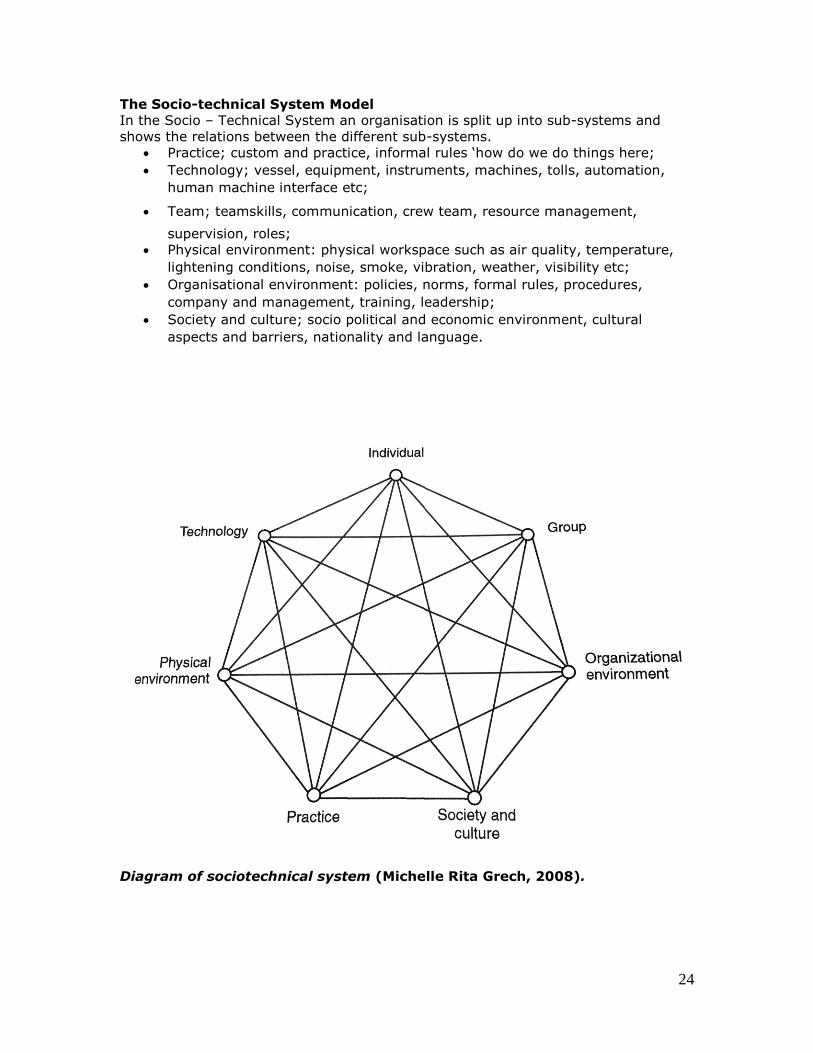
The Socio-technical System Model
In the Socio – Technical System an organisation is split up into sub-systems and
shows the relations between the different sub-systems.
• Practice; custom and practice, informal rules ‘how do we do things here;
• Technology; vessel, equipment, instruments, machines, tolls, automation,
human machine interface etc;
• Team; teamskills, communication, crew team, resource management,
supervision, roles;
• Physical environment: physical workspace such as air quality, temperature,
lightening conditions, noise, smoke, vibration, weather, visibility etc;
• Organisational environment: policies, norms, formal rules, procedures,
company and management, training, leadership;
• Society and culture; socio political and economic environment, cultural
aspects and barriers, nationality and language.
Diagram of sociotechnical system (Michelle Rita Grech, 2008).

25
2.2.4 – Reliability, relevance, reproduction and traceability
The collected data and information must be reliable and relevant.
Information must be verified and/or falsified.
Verification is proving the correctness of a theory, statement or research.
Falsification is proving the incorrectness of a theory, assertion, statement or
research.
All the data that has been gathered during the research must be traceable and
reproducible – the same research when repeated must produce the same results.
2.3 - Realization Phase
According to the results of the research phase, conclusions regarding solutions,
findings, advantages, disadvantages, applications, pitfalls, methods, tools, etc..
will be made and recommendations will be given.
Conclusions
With the final conclusion(s) the answer to the main question is given.
Conclusions are based on logic reasoning and facts that have immersed and have
been explained and proven during the research. Valid and sound reasoning is of
utmost importance.
Conclusions and recommendations will render the research worthless when false
facts, statistics, definitions and arguments have been used.
One of the biggest mistakes that can be made is that of the “early conclusion”.
Also the “steering” of the outcome of the research by the assignor/client is a
dangerous development that should be avoided.
Recommendations
Recommendations follow the conclusions and are aimed at future short-run and
long-run decision taking and developments. What decisions must be taken by the
assignor to solve the problem that has been researched? What scenarios are given
with references to advantages, disadvantages and applications? What further
research is advised? How are suggested solutions going to be implemented?
2.4 - Rounding off Phase
During this final phase the following aspects should be checked:
- structure of the paper: textual aspects (fonts, lay-out, etc.), grammar
and spelling
- validity and reliability of data, sources, etc..
- analysis of all the findings
- solutions
- account for conclusions and recommendations
- references
o in the text: names of experts, researchers (see APA rules).
o at the bottom of the page: definitions
o separate reference page with all references used
The critical attitude
Research demands a critical attitude. Taking things for granted will lead to disaster.
- question theories, results of other researches, statements and
conclusions.
- determine usefulness of solution(s)
26
- combine theory and practice: is a theory possible in real practical
surroundings?
- evaluate your findings, approve and/or disprove
- include references
- determine reliability and validity
References.
Research must be traceable and reproducible. This can only be the case when
proper references are made throughout the entire research. References form the
most important validation of any research!
Using data from other researches and publications without using references is
regarded as fraud.
Copy/paste is not allowed.
You must clearly indicate why the referred information is reliable and valid.
Do not question, criticize or disprove facts.
“The earth is round” is an unquestionable fact.
Do not insert personal “emotions”, such as
“This was a very difficult task”, or
“We had to work very hard”.
Do not use “I” or “We” or “You”
in a report.
27
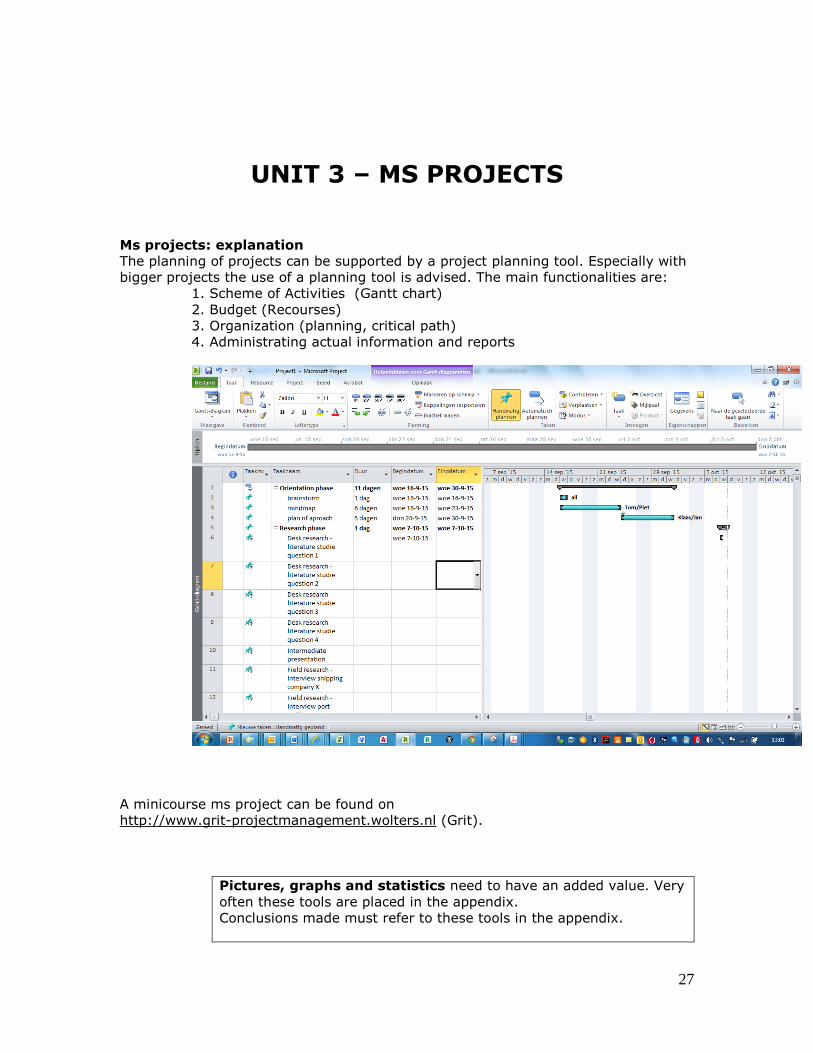
UNIT 3 – MS PROJECTS
Ms projects: explanation
The planning of projects can be supported by a project planning tool. Especially with
bigger projects the use of a planning tool is advised. The main functionalities are:
1. Scheme of Activities (Gantt chart)
2. Budget (Recourses)
3. Organization (planning, critical path)
4. Administrating actual information and reports
A minicourse ms project can be found on
http://www.grit-projectmanagement.wolters.nl (Grit).
Pictures, graphs and statistics need to have an added value. Very
often these tools are placed in the appendix.
Conclusions made must refer to these tools in the appendix.

28
UNIT 4 – RESEARCH CHECKLISTS AND FORMATS
THE PLAN OF APPROACH - FORMAT Item V
1 - TITLE PAGE
bears the words “Plan of Approach” + version
bears the project title, theme and related topic
bears the name of the principal / organization
bears the group name/code
bears the names of the group members + email
bears the names of the group managers + email
2 – LAY OUT
content page
numbering and sub-numbering of chapters / units
numbering of pages (right bottom)
font: Verdana 10 / Calibri 10
3 – LANGUAGE
language is concise, transparent and well-structured
is correct (grammar / spelling), no Is and yous
explanation of relevant terms and abbreviations
4 – BACKGROUND
Title and explanation, assignor, assignee(s), stakeholders
5 –PROBLEM DEFINITION & AIM (OBJECTIVE)
reason for writing this project via problem analysis
what is it that we wish to know
problem that will be solved via problemdefinition
(summary in one sentence of problemdescription)
Problem objective
6 – PROJECT ASSIGNMENT
description of desired outcome: main- and sub questions
relation main- and sub-questions and theme/ topic
research methods per subquestion
7 – PROJECT BORDERS
what will not be investigated?
8 – PROJECT ACTIVITIES & PLANNING
action points: who / what / when / how + phases
9 - PRODUCTS
reports, agendas. minutes, PoA, interviews, schedules,
10 – ORGANIZATION
names, addresses, tel. numbers, etc.
meetings: frequency / chairpersons / minutes takers
communication with assignor/client: how/when/who
internal communication: how/when/who
hour registrations
scheduling of group activities and individual activities
11 – QUALITY
assessment of quality standards
intermediate quality checks
final quality checks (end product)
feedback from principal
sanctions for disfunctioning
12 – EXPENSES (estimated & actual / Expenses = hours Benefits = ects (1 ects = 28 hours)
13 – RISKS (internal and external)
29
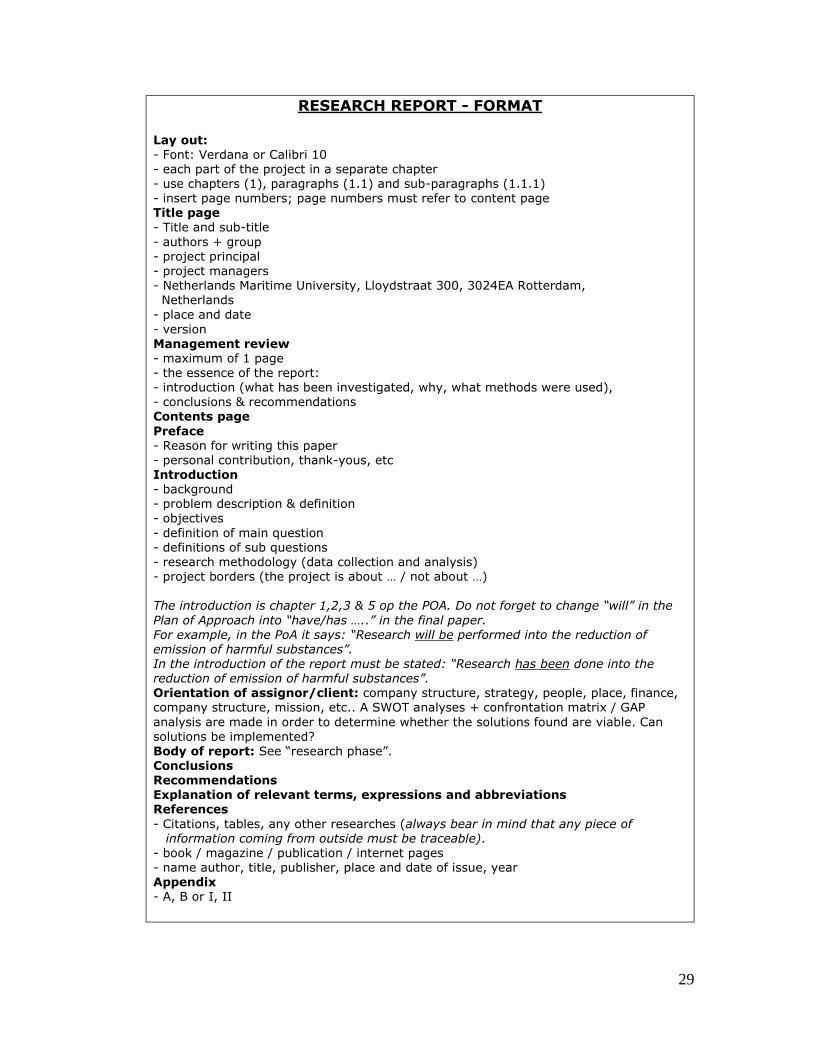
RESEARCH REPORT - FORMAT
Lay out: - Font: Verdana or Calibri 10 - each part of the project in a separate chapter - use chapters (1), paragraphs (1.1) and sub-paragraphs (1.1.1) - insert page numbers; page numbers must refer to content page Title page - Title and sub-title
- authors + group - project principal - project managers - Netherlands Maritime University, Lloydstraat 300, 3024EA Rotterdam, Netherlands
- place and date
- version Management review - maximum of 1 page - the essence of the report: - introduction (what has been investigated, why, what methods were used), - conclusions & recommendations Contents page
Preface - Reason for writing this paper - personal contribution, thank-yous, etc Introduction - background - problem description & definition - objectives
- definition of main question - definitions of sub questions - research methodology (data collection and analysis) - project borders (the project is about … / not about …) The introduction is chapter 1,2,3 & 5 op the POA. Do not forget to change “will” in the
Plan of Approach into “have/has …..” in the final paper. For example, in the PoA it says: “Research will be performed into the reduction of emission of harmful substances”. In the introduction of the report must be stated: “Research has been done into the reduction of emission of harmful substances”. Orientation of assignor/client: company structure, strategy, people, place, finance, company structure, mission, etc.. A SWOT analyses + confrontation matrix / GAP
analysis are made in order to determine whether the solutions found are viable. Can
solutions be implemented? Body of report: See “research phase”. Conclusions Recommendations Explanation of relevant terms, expressions and abbreviations References
- Citations, tables, any other researches (always bear in mind that any piece of information coming from outside must be traceable). - book / magazine / publication / internet pages - name author, title, publisher, place and date of issue, year Appendix - A, B or I, II
30
UNIT 5 – COMMUNICATION
5.1 - First Action Plan for starting up a research
- draw up lists of names + addresses (group members, project management,
principals)
- draw up a group-schedule for meetings
- chairpersons
- minutes takers
- administrators
STUDY THE READER!! (Project Management, Proceedings and Communication).
STUDY THE COURSE INSTRUCTION MANUAL!!
5.2 - Reporting
Reporting must be done through:
- Minutes of group meetings
- Agendas for meetings
- Hours recording
- List of sub-questions
- Plan of Approach
- Research report
- Final evaluative and reflective group- and individual
assessment
5.3 - General Recommendations
• Make clear agreements and arrangements with group members, principals and
supervisors
• Keep to the time schedule; adjust time schedule if nec.
• Be sure to work towards the result that has been described
• Always bear in mind what results your actions may have
• Do not postpone, but keep a steady pace.
• Keep in mind what level is required by your co-members and the assignor.
• Keep in close contact with your assignor/client. Provide update every fortnight.
31
5.4 - Group Meetings: general
Types and purposes of meetings
1 - Informative meetings – reporting, training;
2 - problem solving meetings - problem analysis, decision making, resolving of
conflicts;
3 - inventive meetings – concepts, products, creations.
The combination of the various types of meetings calls for good leadership by the
chairperson.
The purpose of the meeting should be stated at the top of the agenda.
The chairperson should send the agenda (printed version) to all participants,
stating all the names of the participants, the objective of the meeting, place and
time, the minutes of the former meeting and necessary background information.
Leadership
The supervisory chairperson leads a meeting allowing views and discussions on a
specific topic without interfering too much and puts the demands and needs of the
group in the center.
The participating chairperson has an active part in the group’s discussions. This calls
for group’s discipline and a certain predominance in leadership.
The authoritarian chairperson is dominant and inflexible, which generally results in a
counterproductive meeting. However, in crisis situations when decisions or quick
solutions have to be taken this type of leadership may prove to be productive.
The “laisser-faire” chairperson expects group members to be self-directed.
There is hardly any structure in the meeting that is meant to be a gathering to clarify
matters without taking decisive measures.
Group members should
- Keep to the agenda
- Contribute (ask questions / give answers / comment)
- Evaluate
- Make notes
- Encourage others to participate
32
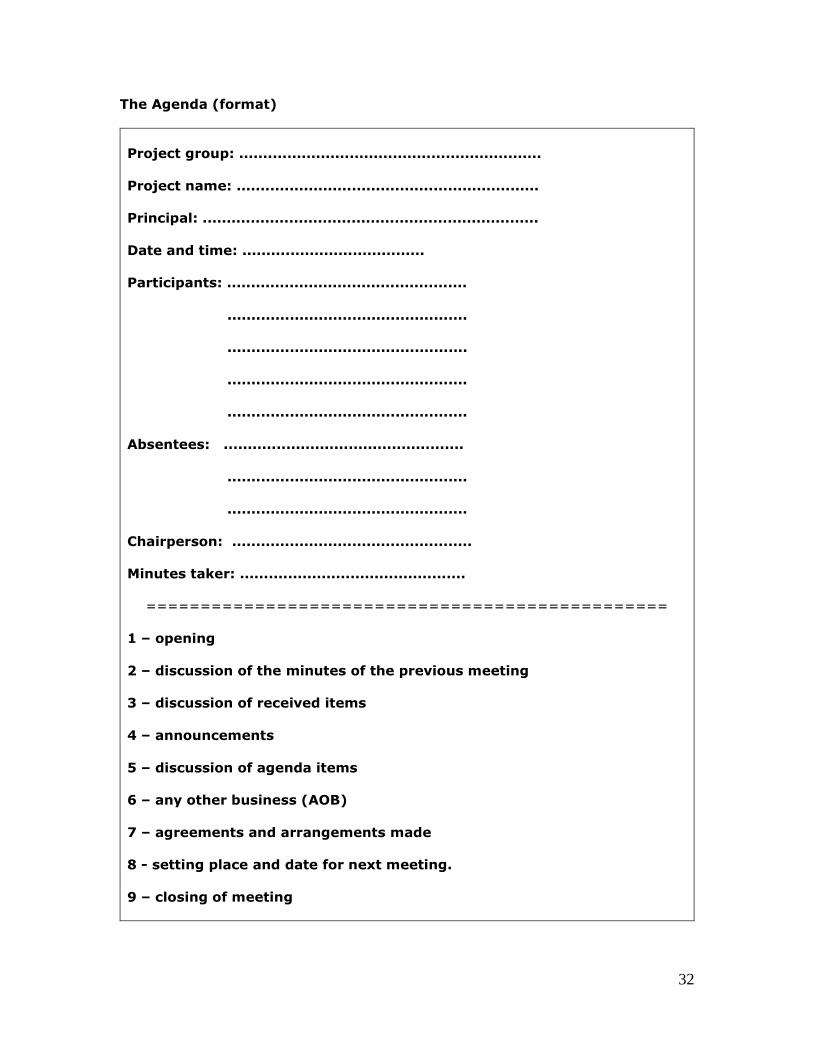
The Agenda (format)
Project group: ...............................................................
Project name: ...............................................................
Principal: ......................................................................
Date and time: ......................................
Participants: ..................................................
..................................................
..................................................
..................................................
..................................................
Absentees: ..................................................
..................................................
..................................................
Chairperson: ..................................................
Minutes taker: ...............................................
================================================
1 – opening
2 – discussion of the minutes of the previous meeting
3 – discussion of received items
4 – announcements
5 – discussion of agenda items
6 – any other business (AOB)
7 – agreements and arrangements made
8 - setting place and date for next meeting.
9 – closing of meeting
33
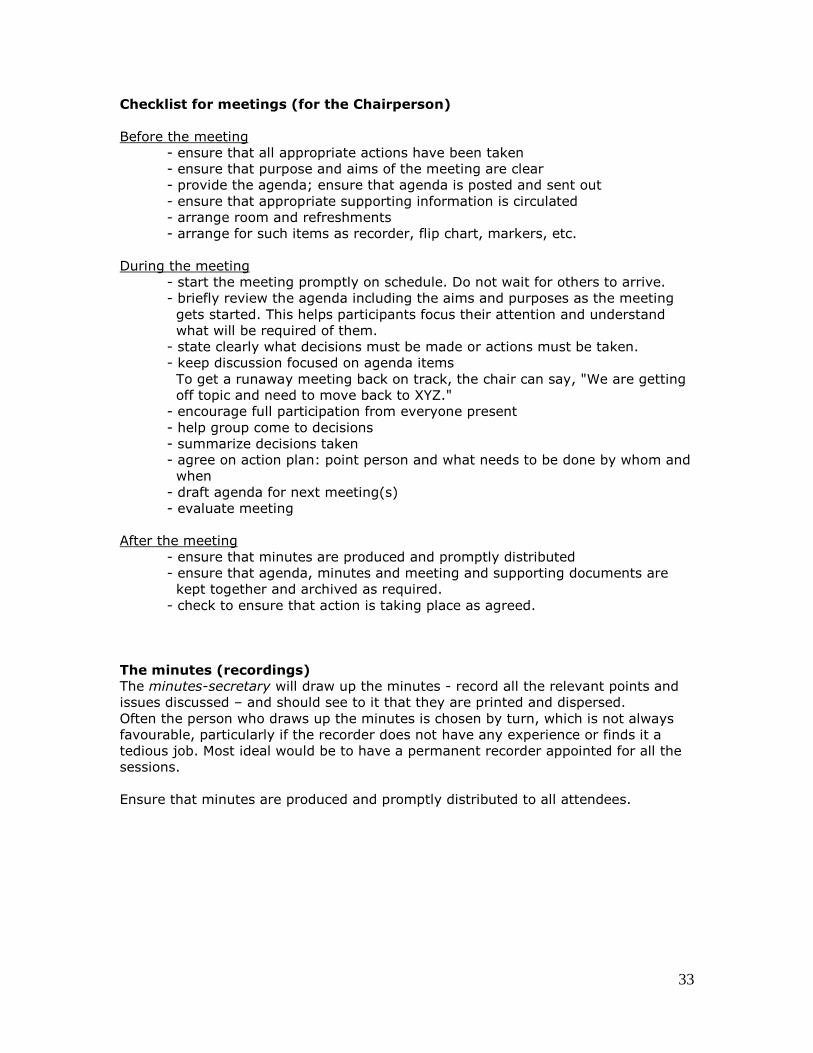
Checklist for meetings (for the Chairperson)
Before the meeting
- ensure that all appropriate actions have been taken
- ensure that purpose and aims of the meeting are clear
- provide the agenda; ensure that agenda is posted and sent out
- ensure that appropriate supporting information is circulated
- arrange room and refreshments
- arrange for such items as recorder, flip chart, markers, etc.
During the meeting
- start the meeting promptly on schedule. Do not wait for others to arrive.
- briefly review the agenda including the aims and purposes as the meeting
gets started. This helps participants focus their attention and understand
what will be required of them.
- state clearly what decisions must be made or actions must be taken.
- keep discussion focused on agenda items
To get a runaway meeting back on track, the chair can say, "We are getting
off topic and need to move back to XYZ."
- encourage full participation from everyone present
- help group come to decisions
- summarize decisions taken
- agree on action plan: point person and what needs to be done by whom and
when
- draft agenda for next meeting(s)
- evaluate meeting
After the meeting
- ensure that minutes are produced and promptly distributed
- ensure that agenda, minutes and meeting and supporting documents are
kept together and archived as required.
- check to ensure that action is taking place as agreed.
The minutes (recordings)
The minutes-secretary will draw up the minutes - record all the relevant points and
issues discussed – and should see to it that they are printed and dispersed.
Often the person who draws up the minutes is chosen by turn, which is not always
favourable, particularly if the recorder does not have any experience or finds it a
tedious job. Most ideal would be to have a permanent recorder appointed for all the
sessions.
Ensure that minutes are produced and promptly distributed to all attendees.
34
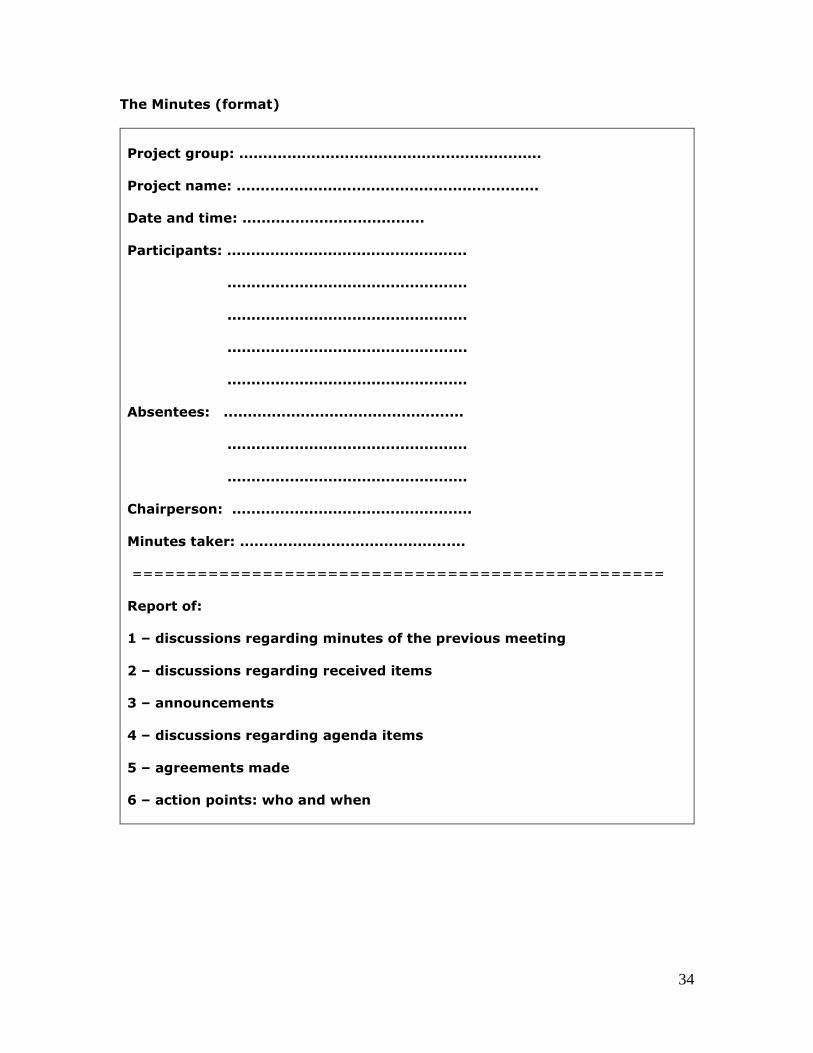
The Minutes (format)
Project group: ...............................................................
Project name: ...............................................................
Date and time: ......................................
Participants: ..................................................
..................................................
..................................................
..................................................
..................................................
Absentees: ..................................................
..................................................
..................................................
Chairperson: ..................................................
Minutes taker: ...............................................
=================================================
Report of:
1 – discussions regarding minutes of the previous meeting
2 – discussions regarding received items
3 – announcements
4 – discussions regarding agenda items
5 – agreements made
6 – action points: who and when

35
Dos AND Don’ts in meetings and public speech (presentations)
- Be aware of your appearance,
- DO NOT insert premeditated jokes and wisecracks in your speech, but show a
sound sense of humour (if humour is appropriate for the situation/discussion)
- DO NOT focus on one or two listeners in the audience, but direct your words
to the entire audience
- DO NOT turn your back on the audience
- DO NOT put your hand(s) in your pocket(s)
- DO NOT show arrogance
- DO NOT show insecurity, unless you are really insecure about a topic and
have indicated this to your audience
- DO NOT show off, but don’t be too modest
- Better to wear no tie than one that will distract the audience’s attention
- Smile, do not smirk, remain calm and understanding
- If you are “lost” tell the audience and ask for assistance, rather than put up
an act
- A presentation should be an additional tool to your “story”, not the other way
around.
- Fonts, colours, animations and pictures should not distract the audience’s
attention!
- DO NOT look at your presentation all the time; look at your audience!
36
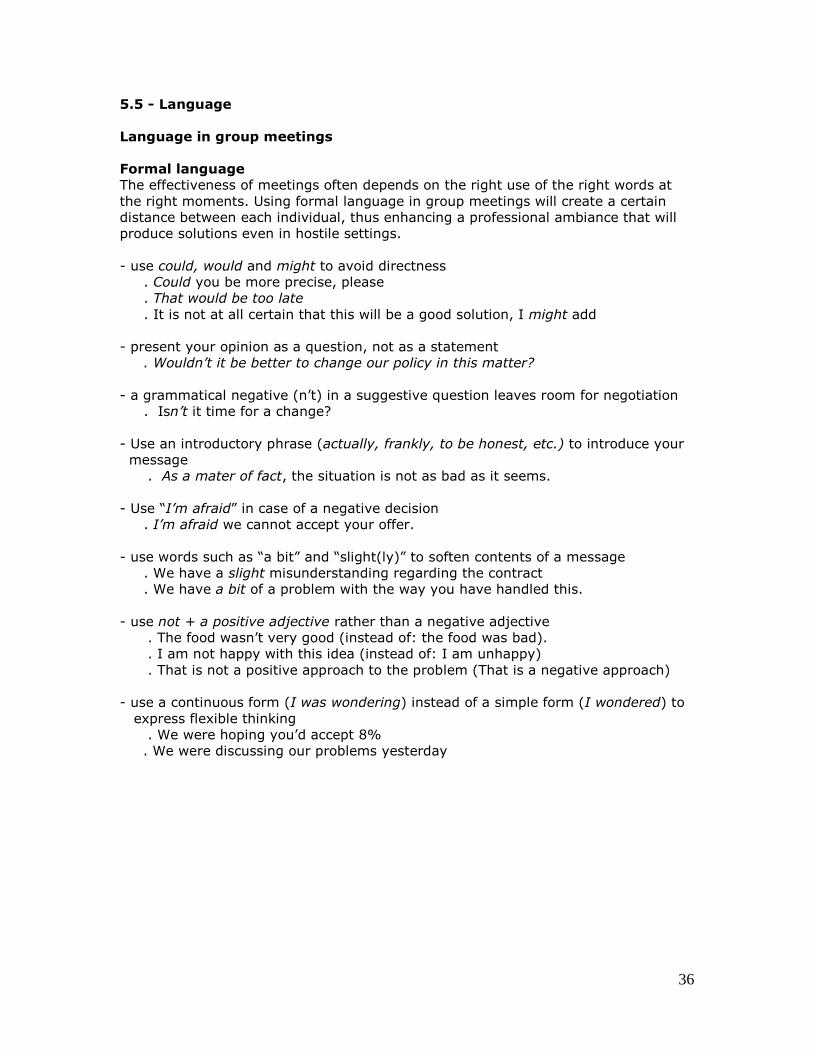
5.5 - Language
Language in group meetings
Formal language
The effectiveness of meetings often depends on the right use of the right words at
the right moments. Using formal language in group meetings will create a certain
distance between each individual, thus enhancing a professional ambiance that will
produce solutions even in hostile settings.
- use could, would and might to avoid directness
. Could you be more precise, please
. That would be too late
. It is not at all certain that this will be a good solution, I might add
- present your opinion as a question, not as a statement
. Wouldn’t it be better to change our policy in this matter?
- a grammatical negative (n’t) in a suggestive question leaves room for negotiation
. Isn’t it time for a change?
- Use an introductory phrase (actually, frankly, to be honest, etc.) to introduce your
message
. As a mater of fact, the situation is not as bad as it seems.
- Use “I’m afraid” in case of a negative decision
. I’m afraid we cannot accept your offer.
- use words such as “a bit” and “slight(ly)” to soften contents of a message
. We have a slight misunderstanding regarding the contract
. We have a bit of a problem with the way you have handled this.
- use not + a positive adjective rather than a negative adjective
. The food wasn’t very good (instead of: the food was bad).
. I am not happy with this idea (instead of: I am unhappy)
. That is not a positive approach to the problem (That is a negative approach)
- use a continuous form (I was wondering) instead of a simple form (I wondered) to
express flexible thinking
. We were hoping you’d accept 8%
. We were discussing our problems yesterday

37
Informal vs. formal language
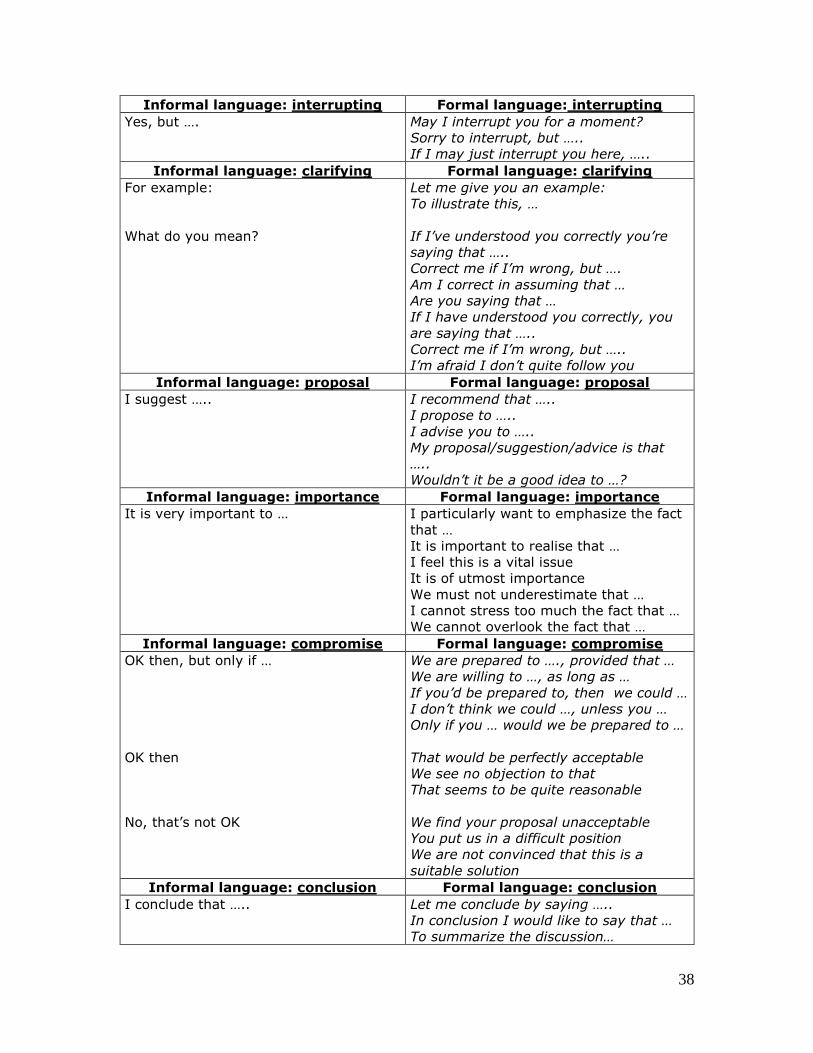
Informal language: opinion Formal language: opinion
I think that …
Perhaps ……
Besides, I think that ….
What do you think?
In my opinion …
It is my firm believe that …
To me it seems that …
As far as I’m concerned I believe that ….
I am convinced that …
From my point of view I think that …..
Firstly .., secondly …, and thirdly …
I firmly believe that …..
I am absolutely convinced that …..
It seems to me that …..
I tend to think that …..
In addition ….
I might add that …
What is your opinion?
How do you feel about it?
Where do you stand in this issue?
I wonder if you’d like to comment.
Informal language: commenting Formal language: commenting
My opinion is ….. I wonder if I could comment on this
point.
I’d like to add something here, if I may
May I draw your attention to the fact
that
May I point out that …
Informal language: (dis)agreeing Formal language: (dis)agreeing
I think you are right
I think you are wrong
That’s OK with me
That’s not OK with me
I agree
I entirely agree with your point of view
I am of the same opinion
I disagree
I totally disagree
I disagree entirely
Frankly I think that ….
With all due respect, but I think that …..
Well, to be quite frank I think …..
I do not share your view
I can’t help but feeling that …..
This has my full support
I am fully in favour of that
I see no objection to that
I would not be opposed to that
I am totally opposed to that
That’s out of the question
This leaves a great deal to be desired
I am opposed to that
I can’t support that proposal
38
Informal language: interrupting Formal language: interrupting
Yes, but …. May I interrupt you for a moment?
Sorry to interrupt, but …..
If I may just interrupt you here, …..
Informal language: clarifying Formal language: clarifying
For example:
What do you mean?
Let me give you an example:
To illustrate this, …
If I’ve understood you correctly you’re
saying that …..
Correct me if I’m wrong, but ….
Am I correct in assuming that …
Are you saying that …
If I have understood you correctly, you
are saying that …..
Correct me if I’m wrong, but …..
I’m afraid I don’t quite follow you
Informal language: proposal Formal language: proposal
I suggest ….. I recommend that …..
I propose to …..
I advise you to …..
My proposal/suggestion/advice is that
…..
Wouldn’t it be a good idea to …?
Informal language: importance Formal language: importance
It is very important to … I particularly want to emphasize the fact
that …
It is important to realise that …
I feel this is a vital issue
It is of utmost importance
We must not underestimate that …
I cannot stress too much the fact that …
We cannot overlook the fact that …
Informal language: compromise Formal language: compromise
OK then, but only if …
OK then
No, that’s not OK
We are prepared to …., provided that …
We are willing to …, as long as …
If you’d be prepared to, then we could …
I don’t think we could …, unless you …
Only if you … would we be prepared to …
That would be perfectly acceptable
We see no objection to that
That seems to be quite reasonable
We find your proposal unacceptable
You put us in a difficult position
We are not convinced that this is a
suitable solution
Informal language: conclusion Formal language: conclusion
I conclude that ….. Let me conclude by saying …..
In conclusion I would like to say that …
To summarize the discussion…
39
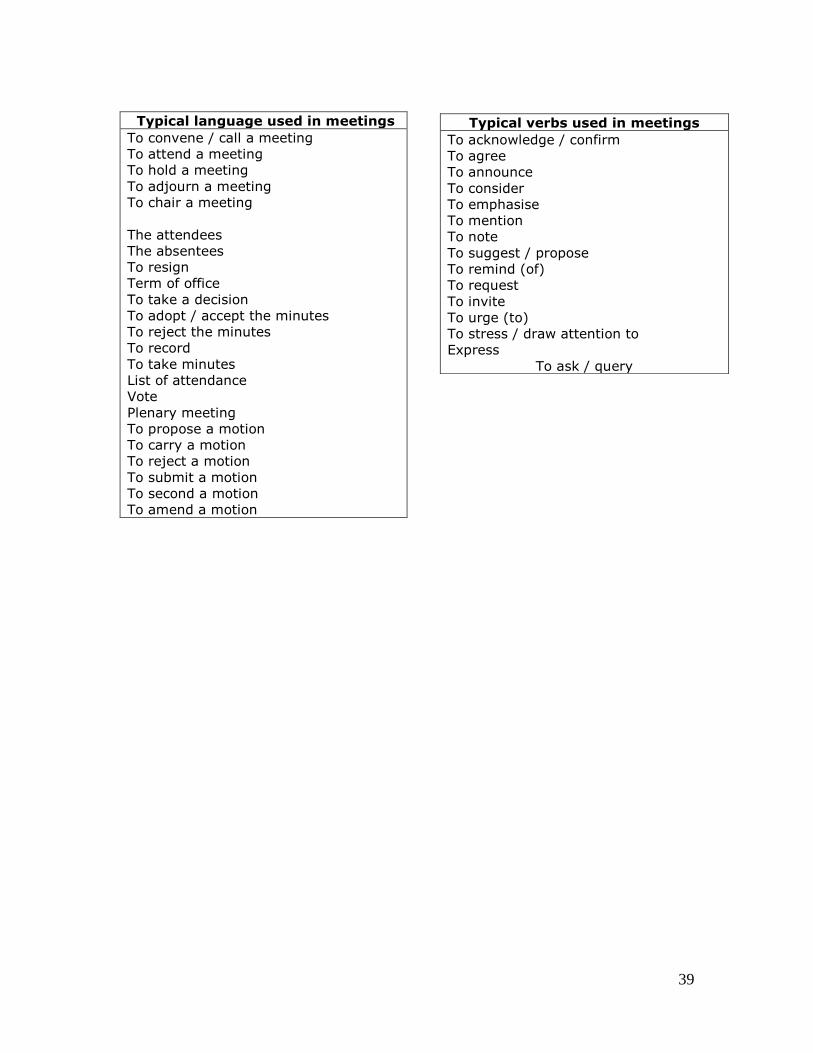
Typical language used in meetings
To convene / call a meeting
To attend a meeting
To hold a meeting
To adjourn a meeting
To chair a meeting
The attendees
The absentees
To resign
Term of office
To take a decision
To adopt / accept the minutes
To reject the minutes
To record
To take minutes
List of attendance
Vote
Plenary meeting
To propose a motion
To carry a motion
To reject a motion
To submit a motion
To second a motion
To amend a motion
Typical verbs used in meetings
To acknowledge / confirm
To agree
To announce
To consider
To emphasise
To mention
To note
To suggest / propose
To remind (of)
To request
To invite
To urge (to)
To stress / draw attention to
Express
To ask / query

40
5.6 - Reflection report
The personal reflection forms an important part of the learning process.
A reflection report is an evaluation of the learning process during a specific
assignment, a period or the entire education programme.
In a reflection report a clear overview is created of personal learning skills developed
in conjunction with behavior, communication and cooperation
It aims to provide an introspection to improve learning skills.
An in-depth strengths/weaknesses analyses is an important part of the reflection
report.
The reflection report must contain the following elements and aspects:
- learning objectives: what is it that I want(ed) to accomplish
- learning styles and methods: when, where, how, what
- retrospection of behaviour: what went right/what went wrong
Why did it go right/wrong
- input in cooperative matters
communication and cooperation: what was my influence (positive/negative)
on my own achievement and that of others.
- alternatives to come to better results and cooperation
Action plan: next step(s) to improve results
- new insights regarding learning proficiencies
- strengths and weaknesses
UNIT 6 – Assignments
6.1 - ASSIGNMENTS: MAKING A MINDMAP AND A CAUSAL DIAGRAM
Underwater noise Port Congestion Oil Spillage in the Arctic
RESEARCH – LEARNING TESTS - Underwater noise
Brainstorm session
Problem description:
To preserve the marine life, the IMO has introduced new legislation. The vessels
must comply with this new legislation within 15 years. The problem with this new
legislation is that the current vessels do not comply with the guidelines set by the
IMO, so to this problem a solution is required. There are several researches
ongoing concerning noise reduction, but there is not a practical solution yet for
existing vessels (Welfare, 2009)
The sound the vessels create nowadays have a severe impact on the marine
environment. Particularly the northern hemisphere regions, experience an increase
in low-frequency (<1000 Hz) sounds. The source of these sounds are mostly the
vessels used for our transport of goods around the world.
The ship’s noise is created mostly by the cavitation of the propeller. Other causes
are the wake created by the hull and the vibration caused by the machinery that is
needed for the propulsion and the life onboard the ship (Inc, 2014).
Public awareness of how sounds affect animals is driven by dramatic but rare
events like whale beachings following sonar events. Ship-radiated noise presents
less obvious but continuous, broadly-distributed issues. These sounds can affect
marine animals in non-lethal yet significant ways, reducing communication ranges
particularly for species reliant on low-frequency sounds to socialize and navigate
like sea mammals (whales, dolphins) and even fish.
Now make a list of all the parameters, aspects, characteristics, actors,
stakeholders, dimensions, etc..
Do this according to the problem description above, but also include your own.
Make a clear distinction between quantitative data and qualitative data.
Ask who / what / where / why / when / how
Now with the data collected make up a mindmap and causal diagram.

42
RESEARCH – LEARNING TESTS – Port Congestion
Brainstorm session
Problem description
The usage of the container as a cargo unit has been on the rise since 1970 leading
to a total of 11.6 million handled TEU
containers in 2013. These numbers underline the importance of having a
streamlined container handling process.
Port congestion has played, and is going to play a major role in the Port of XXX.
Seeing that other port can also handle container carriers up to 18,000 TEU, big
container carriers now have attractive alternatives instead of waiting in queue
before the port of XXX. Container carriers waiting in queue or in the port will cost
the ship owner a great amount of money without moving any cargo.
Container ports are complex pieces of infrastructure hosting a broad number of
activities besides container loading and unloading, e.g., mending, pilotage,
tugging, etc. With container cargo being a major part of today’s transport means
and container carriers still increasing in size, one delayed ship can now disrupt the
entire port schedule and thus congesting it due to the inflexibility of the port. This
inflexibility is the effect of container terminals only being able to handle a couple of
ships at a time and the time schedules being made months in advance.
The port of XXX has to come up with solutions to the port congestion to stay the
most important and flexible container port. Possible solutions, besides logistical
solutions inside the harbour, are: LASH type loading and unloading, complete
redesign of the carrier or the usage of techniques derived from other sectors, for
example: offshore installations such as a Spud-system, floating docks or ship-ship
container handling.
Now make a list of all the parameters, aspects, characteristics, actors,
stakeholders, dimensions, etc..
Do this according to the problem description above, but also include your own.
Make a clear distinction between quantitative data and qualitative data.
Ask who / what / where / why / when / how
Now with the data collected make up a mindmap and causal diagram.

43
RESEARCH – LEARNING TESTS – Oil Spillage in the Arctic
Problem description
In Arctic conditions the response to an oil spill brings forth a lot of challenges, such
as: accessibility,
oil will stick under the ice, oil will have a higher viscosity, due to the lack of
infrastructure, skimmers
do not work as well as in “normal” conditions and due to the weather conditions.
The damage to the marine and coastal environment is the biggest problem of an
oil spill of this kind.
The environment is mostly inflicted by the poisonous chemicals oil contains, such
as sulphur, nitrogen, oxygen and other detrimental elements.
But there are also many other factors in play, such as: the spreading of the oil by
the wind and the fact that oil floats on water due to its high density .
After an oil spill has taken place it has to be contained and cleaned up.
The materials and methods for this response have a number of big disadvantages.
Support ships are not always available in every place of the world
and do not have enough equipment on board to contain a big oil spill.
Because of this it is impossible to situate an oil reaction force around every oilrig,
which leads to a long reaction time.
Now make a list of all the parameters, aspects, characteristics, actors,
stakeholders, dimensions, etc..
Do this according to the problem description above, but also include your own.
Make a clear distinction between quantitative data and qualitative data.
Ask who / what / where / why / when / how
Now with the data collected make up a mindmap and causal diagram.

44
6.2 – TEST: THE USE OF MODELS AND TOOLS
- The flow chart
- The decision matrix
- SWOT analysus
The flow chart
Main question
How can the fastening between tug and vessel be made more effective and safer?
Assignment
Draw up a flow chart of the fastening between tug and vessel.
45
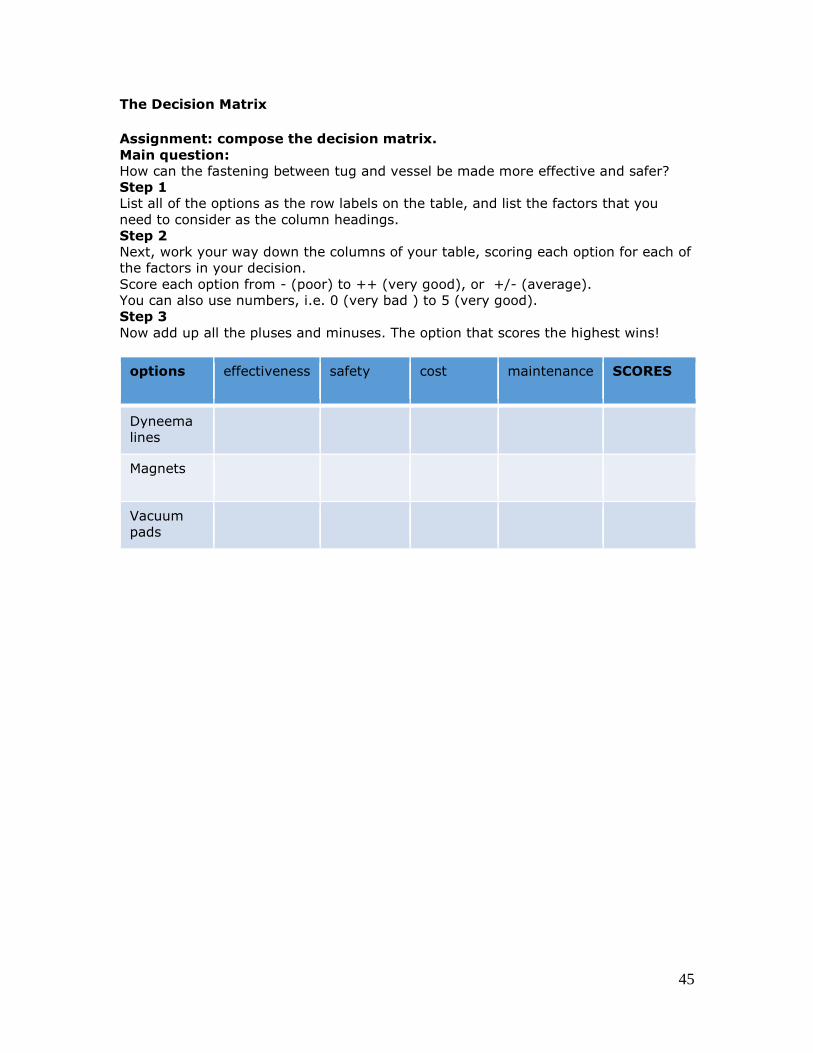
The Decision Matrix
Assignment: compose the decision matrix.
Main question:
How can the fastening between tug and vessel be made more effective and safer?
Step 1
List all of the options as the row labels on the table, and list the factors that you
need to consider as the column headings.
Step 2
Next, work your way down the columns of your table, scoring each option for each of
the factors in your decision.
Score each option from - (poor) to ++ (very good), or +/- (average).
You can also use numbers, i.e. 0 (very bad ) to 5 (very good).
Step 3
Now add up all the pluses and minuses. The option that scores the highest wins!
options effectiveness safety cost maintenance SCORES
Dyneema
lines
Magnets
Vacuum
pads

46
The SWOT analysis
Company orientation
Company X is an international maritime service provider that wants to offer its
clients a high quality service and to work safely and efficiently. The start of the
company began four generations back in when the first ship was built.
With now more than a century of experience combined with modern fleet the
company has gained a reputation as a competitive and innovative player in the
services they provide. These services include port towing, coastal and deep sea
salvage and emergency response, tug management, chartering, brokerage,
offshore services and assistance to dredging industry. The innovative component
within the company can be seen in the self-designed propulsion system. The
company is renowned for its “green” policy and holds multiple certificates
regarding environmental friendly policies.
The vision of the company is to become a leader by constant improvement and
innovation.
The company makes use of the latest technology and equipment combined with
well-trained personnel.
During the past decades the company has expanded its innovative activities to
several other European Ports and gradually expanded its services to international
ports and terminals.
The company presents its maritime spirit and 24/7 "can do" mentality during daily
operations.
With a growing market its share in business areas is expected to grow.
Competition in the market is fierce. Other companies in the same line of business
are developing strategies to expand.
However, the company is active in multiple markets, and therefore has a lead over
other competitors.
Growth of turnover is very much dependent on fuel prices, which are extremely
high.
The company provides its clients with the highest levels of service, with a safe,
efficient and environment friendly operation.
The company has a high standards of technology; therefore the crewing of vessels
forms a problem since there are too few highly trained seafarers.
Also the ageing of present personnel will present problems in the near future.
Technological developments are enormous, and call for expansion of the fleet.
Also new legislation calls for the introduction of low emission vessels. There are
new upcoming laws and rules to protect the environment and safety. The company
will have to anticipate these changes.
If the company can anticipate to these changes in regulations it will have a huge
advantage.
These new demands will call for the training of the staff and crew, and will also
lead to a higher quality delivered. It will also result in a demand for more
employees.
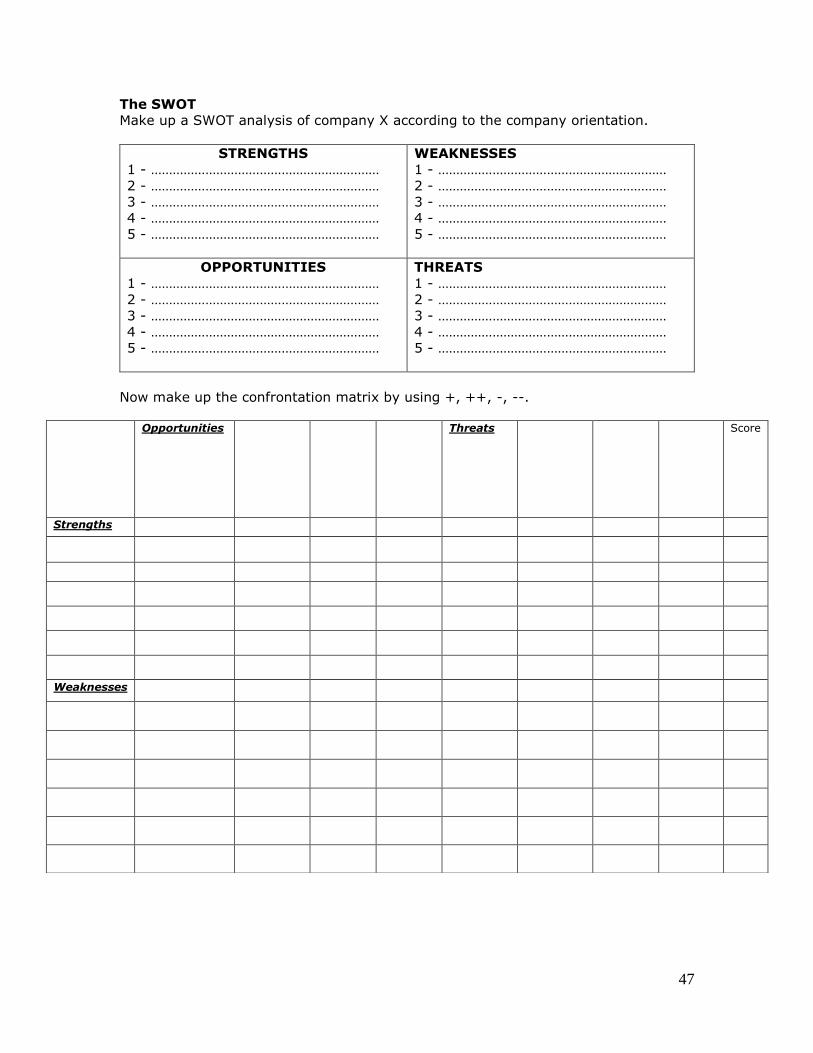
47
The SWOT
Make up a SWOT analysis of company X according to the company orientation.
STRENGTHS
1 - ………………………………………………………
2 - ………………………………………………………
3 - ………………………………………………………
4 - ………………………………………………………
5 - ………………………………………………………
WEAKNESSES
1 - ………………………………………………………
2 - ………………………………………………………
3 - ………………………………………………………
4 - ………………………………………………………
5 - ………………………………………………………
OPPORTUNITIES
1 - ………………………………………………………
2 - ………………………………………………………
3 - ………………………………………………………
4 - ………………………………………………………
5 - ………………………………………………………
THREATS
1 - ………………………………………………………
2 - ………………………………………………………
3 - ………………………………………………………
4 - ………………………………………………………
5 - ………………………………………………………
Now make up the confrontation matrix by using +, ++, -, --.
Opportunities Threats Score
Strengths
Weaknesses
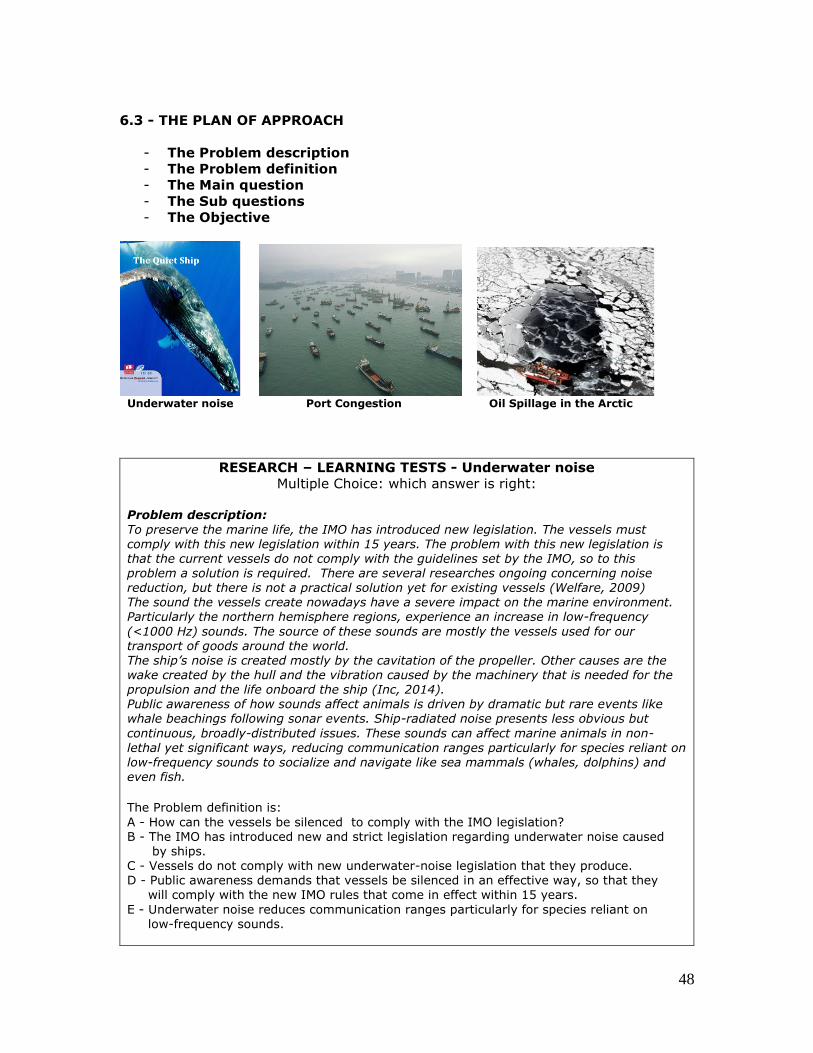
48
6.3 - THE PLAN OF APPROACH
- The Problem description
- The Problem definition
- The Main question
- The Sub questions
- The Objective
Underwater noise Port Congestion Oil Spillage in the Arctic
RESEARCH – LEARNING TESTS - Underwater noise
Multiple Choice: which answer is right:
Problem description:
To preserve the marine life, the IMO has introduced new legislation. The vessels must comply with this new legislation within 15 years. The problem with this new legislation is that the current vessels do not comply with the guidelines set by the IMO, so to this problem a solution is required. There are several researches ongoing concerning noise reduction, but there is not a practical solution yet for existing vessels (Welfare, 2009) The sound the vessels create nowadays have a severe impact on the marine environment. Particularly the northern hemisphere regions, experience an increase in low-frequency
(<1000 Hz) sounds. The source of these sounds are mostly the vessels used for our transport of goods around the world. The ship’s noise is created mostly by the cavitation of the propeller. Other causes are the wake created by the hull and the vibration caused by the machinery that is needed for the propulsion and the life onboard the ship (Inc, 2014). Public awareness of how sounds affect animals is driven by dramatic but rare events like whale beachings following sonar events. Ship-radiated noise presents less obvious but
continuous, broadly-distributed issues. These sounds can affect marine animals in non-
lethal yet significant ways, reducing communication ranges particularly for species reliant on low-frequency sounds to socialize and navigate like sea mammals (whales, dolphins) and even fish.
The Problem definition is:
A - How can the vessels be silenced to comply with the IMO legislation? B - The IMO has introduced new and strict legislation regarding underwater noise caused by ships. C - Vessels do not comply with new underwater-noise legislation that they produce. D - Public awareness demands that vessels be silenced in an effective way, so that they will comply with the new IMO rules that come in effect within 15 years.
E - Underwater noise reduces communication ranges particularly for species reliant on low-frequency sounds.

49
RESEARCH – LEARNING TESTS – Port Congestion
Multiple Choice: which answer is right:
Problem description The usage of the container as a cargo unit has been on the rise since 1970 leading to a total
of 11.6 million handled TEU containers in 2013. These numbers underline the importance of having a streamlined container handling process. Port congestion has played, and is going to play a major role in the Port of XXX. Seeing that other port can also handle container carriers up to 18,000 TEU, big container carriers now have attractive alternatives instead of waiting in queue before the port of XXX. Container carriers waiting in queue or in the port will cost the ship owner a great amount of money
without moving any cargo.
Container ports are complex pieces of infrastructure hosting a broad number of activities besides container loading and unloading, e.g., mending, pilotage, tugging, etc. With container cargo being a major part of today’s transport means and container carriers still increasing in size, one delayed ship can now disrupt the entire port schedule and thus congesting it due to the inflexibility of the port. This inflexibility is the effect of container
terminals only being able to handle a couple of ships at a time and the time schedules being made months in advance. The port of XXX has to come up with solutions to the port congestion to stay the most important and flexible container port. Possible solutions, besides logistical solutions inside the harbour, are: LASH type loading and unloading, complete redesign of the carrier or the usage of techniques derived from other sectors, for example: offshore installations such as a Spud-system, floating docks or ship-ship container handling.
The objective of this research is: A – The port of XXX does not have the means to handle container carriers fast and
flexibly to keep up with demand. B – In what area of the port does the congestion problem begin? C – Solving port congestion caused by container container handling system through a technical solution.
D – How can the port congestion, caused by container handling, be solved through a technical solution? E – What is the best new container handling system?
50
RESEARCH – LEARNING TESTS – Oil Spillage in the Arctic
Multiple Choice: which answer is right: Problem description In Arctic conditions the response to an oil spill brings forth a lot of challenges, such as: accessibility, oil will stick under the ice, oil will have a higher viscosity, due to the lack of
infrastructure, skimmers do not work as well as in “normal” conditions and due to the weather conditions. The damage to the marine and coastal environment is the biggest problem of an oil spill of this kind. The environment is mostly inflicted by the poisonous chemicals oil contains, such as sulphur, nitrogen, oxygen and other detrimental elements. But there are also many other factors in play, such as: the spreading of the oil by the wind
and the fact that oil floats on water due to its high density .
After an oil spill has taken place it has to be contained and cleaned up. The materials and methods for this response have a number of big disadvantages. Support ships are not always available in every place of the world and do not have enough equipment on board to contain a big oil spill. Because of this it is impossible to situate an oil reaction force around every oilrig, which
leads to a long reaction time.
The main question of this research is: A – How can oil spillage in the Arctic be prevented?. B – How does offshore oil drilling cause oil spills? C – How can oil spills in the Arctic be contained and cleaned up effectively?
D – What are non-Arctic oil drilling procedures to prevent major oil spills regarding, cleaning up, containment and response? E – What are Arctic oil drilling procedures to prevent major oil spills regarding, cleaning up,
containment and response? F – How can oil spillage be cleaned in Arctic conditions? G - What are the advantages and disadvantages of existing ways of cleaning spilled oil in the Arctic ?

51
RESEARCH – LEARNING TESTS – Red Tape
Make up the problem definition, the main question, the objective and as many
sub questions as you can.
Management Review In this report research has been done on how to reduce the administrative burden on the master of the vessel. The name of this project is called ‘Red Tape, removing the administrative burden on the master of the vessel’. Red tape means bureaucracy, which is related to the administrative burden. The problem can be answered by looking from five different angles of view. The causes of the administrative burden on the Master and crew of the vessel are high
amounts of paperwork and the high amount of regulations. Alongside these problems the technology used during these administrative tasks is lacking.
The administrative burden causes a lowered level of safety on board, a higher work pressure, a drop in motivation for the seafarer and a decrease in the amount of young seafarers. To take away some of the administrative pressure on the master of the vessel, a solution
has to be found for this problem. So, the second angle of view is looking at distributing the load more equally along the other crewmembers, officers and the master. Some documents can be distributed from the master to the officers. These documents are simple documents like the crew list or the rest hour’s document. Also the documents for entering a port, which are often the standard ship data and certificates, can be done by officers instead of the Master. Single payment orders from deck mates could be made by the deck mates their selves on a joint computer. After
that they could send them to the Master, who will check it and send it to the office. Multiple organisations need information from the vessel. The agent, authorities and the ship itself all require different forms to be filled in. The ship also needs different certificates to operate safely. These documents could be combined, although this would take a lot of co-
operation between all parties involved and it would not solve the real problem. When a computer system distributes the information to the right parties the burden would be lessened.
Finish these by using the following guiding aspects: The problem definition …………… administrative burden ………………...
The main question: …………… administrative burden ………………... ? The sub questions: ………… consequences / crew ……………..
………… distribution of work load / ship / ship – office ………………
............efficiency / combination ……………
............automation……………
............Port Authorities…………… …………………………………………………………………………………………………………………………………………… The objective: …………………………………………………………..
52
RESEARCH – LEARNING TESTS – The Polar Code
Make up the problem definition, the main question, the objective and as many
sub questions as you can.
Management review: Sailing the oceans dates back as early as the Middle Ages. Many sailors attempted to cross oceans without sufficient equipment. Through the year new routes, for example the Suez Canal and new equipment have been developed to decrease transit time and increase the safety for crew, vessel, environment and its cargo as well. The increasing water temperature has resulted in a faster and bigger melting process of the ice caps, on the North and South pole, and opened a shorter route between Europe and Asia
ports. If in the upcoming years more ice will melt, the easier the passage for merchant vessels will get.
The growing movement of vessels has a logical consequence, there will be more pollution and debris in the Polar Region. Therefore precautions have to be taken. The IMO has adopted new legislation for all vessels operating in the Polar Regions called the International Code for Ships Operating in Polar waters (Polar Code). The Polar Code is to
decrease the environmental footprint of vessels and crew operating in these areas. The Polar Code is additional legislation on top of the International Convention for the Prevention of Pollution from Ships (MARPOL) and Safety of Life at Sea (SOLAS). Existing vessels built before this date, January 1st 2017, need to be retrofitted to meet the standards of the Polar Code. Retrofitting needs to be done required of equipment, design, construction, operations, manning and protection of the environment. Before the introduction of the Polar Code in 2009, a guideline for ships operating in polar
waters was published by the IMO. This guideline provides a good impression how vessels should operate in Polar Regions under upcoming Polar Code. Etc..
Problem definition: …………… non-compliance………………...
Main question: …………… existing vessels………………... Subquestions: …………… Polar Code………………... …………… compliance………………... …………… retrofitting………………...
…………………………………………………………………………………………………………………………………………… The objective: …………… comply ………………...

53
6.4 - RESEARCH – LEARNING TESTS
Make up the problem definition and objective according to the main question.
Main question:
How can air lubrication underneath the sailing vessel influence maneuverability
and stability?
Problem definition:
Objective:
Main question:
How can the fastening between tug and vessel be made more effective and safer?
Problem definition:
Objective:
Main question:
How can residual heat be used to prevent icing on a vessel in arctic conditions?
Problem definition:
Objective:
Main question:
How can waste energy from the main-engines be used for air-conditioning
systems?
Problem definition:
Objective:

54
Make up the main question and objective according to the problem definition.
Then make up 4 subquestions and decide on research methods for each subquestion.
Main question:
Problem definition:
Bunkering of marine fuels is not efficient and presents dangers to crew and
environment.
Objectives (use 2 dilemmas)
Subquestion 1:
Research methods:
Subquestion 2:
Research methods:
Subquestion 3:
Research methods:
Subquestion 4:
Research methods:
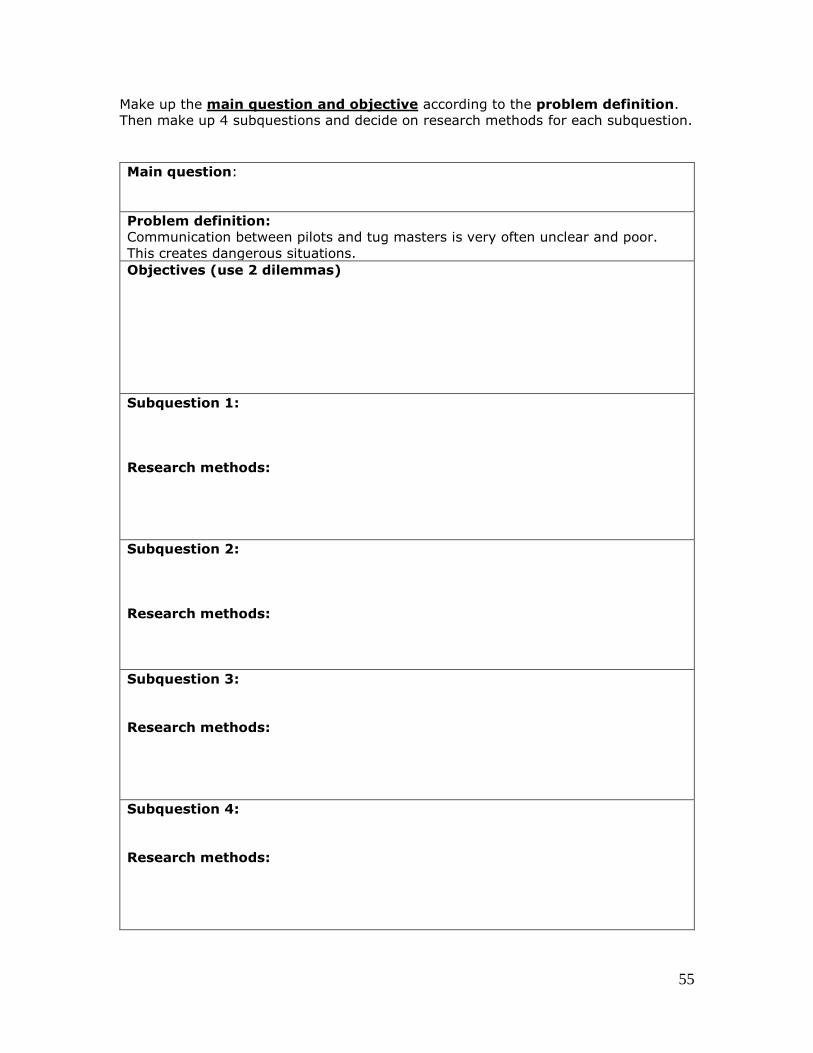
55
Make up the main question and objective according to the problem definition.
Then make up 4 subquestions and decide on research methods for each subquestion.
Main question:
Problem definition:
Communication between pilots and tug masters is very often unclear and poor.
This creates dangerous situations.
Objectives (use 2 dilemmas)
Subquestion 1:
Research methods:
Subquestion 2:
Research methods:
Subquestion 3:
Research methods:
Subquestion 4:
Research methods:

56
Make up the main question and problem definition according to the objective.
Then make up 4 subquestions and decide on research methods for each subquestion.
Main question:
Problem definition:
Objective:
Use magnets to improve efficiency and safety in mooring procedures of vessels.
Subquestion 1:
Research methods:
Subquestion 2:
Research methods:
Subquestion 3:
Research methods:
Subquestion 4:
Research methods:
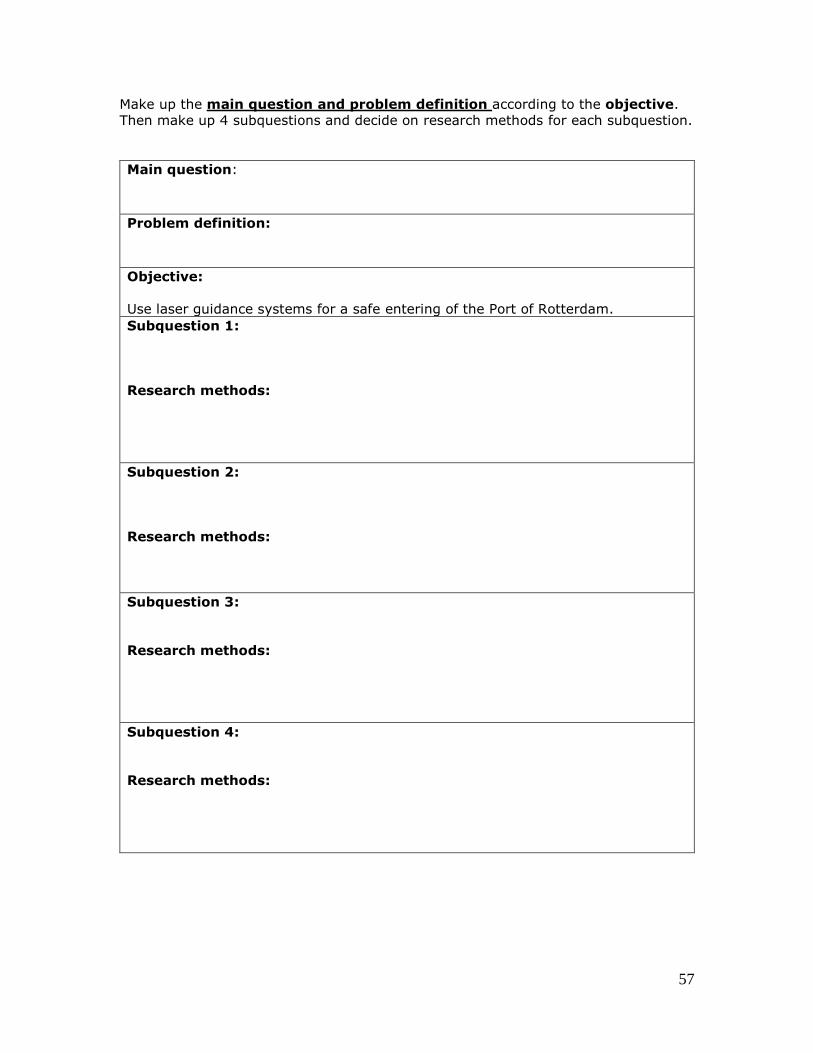
57
Make up the main question and problem definition according to the objective.
Then make up 4 subquestions and decide on research methods for each subquestion.
Main question:
Problem definition:
Objective:
Use laser guidance systems for a safe entering of the Port of Rotterdam. Subquestion 1:
Research methods:
Subquestion 2:
Research methods:
Subquestion 3:
Research methods:
Subquestion 4:
Research methods:
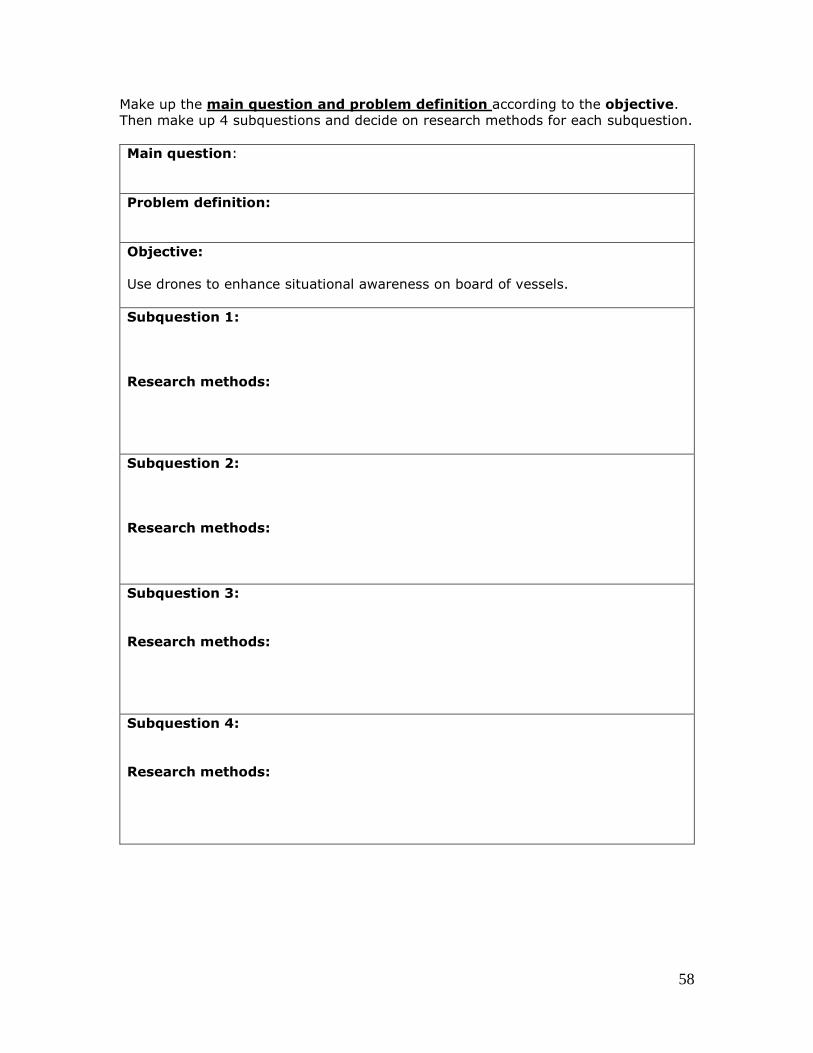
58
Make up the main question and problem definition according to the objective.
Then make up 4 subquestions and decide on research methods for each subquestion.
Main question:
Problem definition:
Objective:
Use drones to enhance situational awareness on board of vessels.
Subquestion 1:
Research methods:
Subquestion 2:
Research methods:
Subquestion 3:
Research methods:
Subquestion 4:
Research methods:

59
UNIT 7 – Video links
Video links: RESEARCH!
Research - Orientation phase
Research - Models and tools used in research
Research - Plan of approach
Research - methodology used in research
Research - Rounding off
Video lectures: models and tools
Brainstorming techniques
Mindmapping
Causal diagram/fishbone diagram
Flowchart
Plan do check act cycle
The 5 whys problem solving method
The decision matrix analysis
SWOT analysis
DESTEP analysis
Gantt chart