Embed Size (px)
Citation preview
Research Methods
Unit 2

Hindsight Bias• “I knew it all along phenomenon”• Example: 9/11• Overconfidence along with hindsight bias– Can lead to overestimate our institution
The Scientific Attitude
• Curiosity, skepticism, and humility• Copernicus and Newton—religious convictions
made them humble before nature and skeptical of human authority

Critical Thinking
• Examines assumptions• Discerns hidden values• Evaluates evidence• Assesses conclusions
The Scientific Method
• Theory-predicts behavior or events– At theory simplifies, organizes isolated facts
• Hypothesis-a good theory that produces testable predictions
• Operational definitions-describes concepts with precise measures– Replication is key
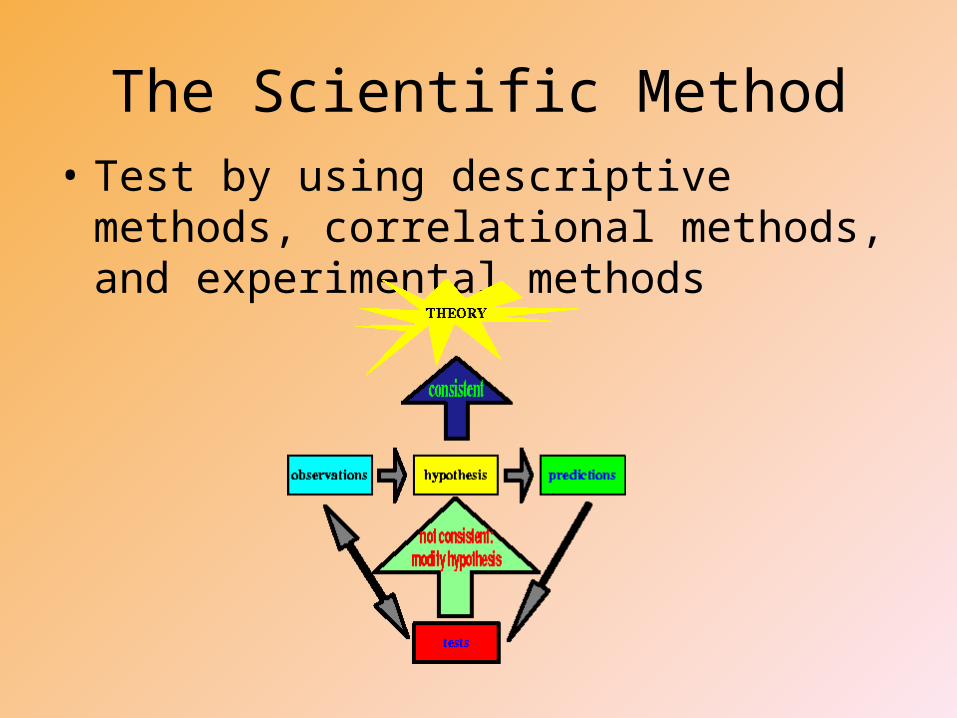
The Scientific Method• Test by using descriptive methods,
correlational methods, and experimental methods
Operational Definition
• It defines what the researcher will be observing and manipulating
• Need to be 1) measurable and 2) manageable• If not measurable or manageable then the
research will be difficult to conduct
Description
• Case study– Examines one individual in depth– Can mislead us if individual is atypical
• Survey– Many cases in less depth– Wording effects, Random sampling– Need representative sample of cases
• Naturalistic observation– Only describes behavior does not explain it
• Replication is the main goal of all research

Survey
• People are asked to RESPOND to a series of QUESTIONS about a particular subject
• Does it matter what order the questions are asked?
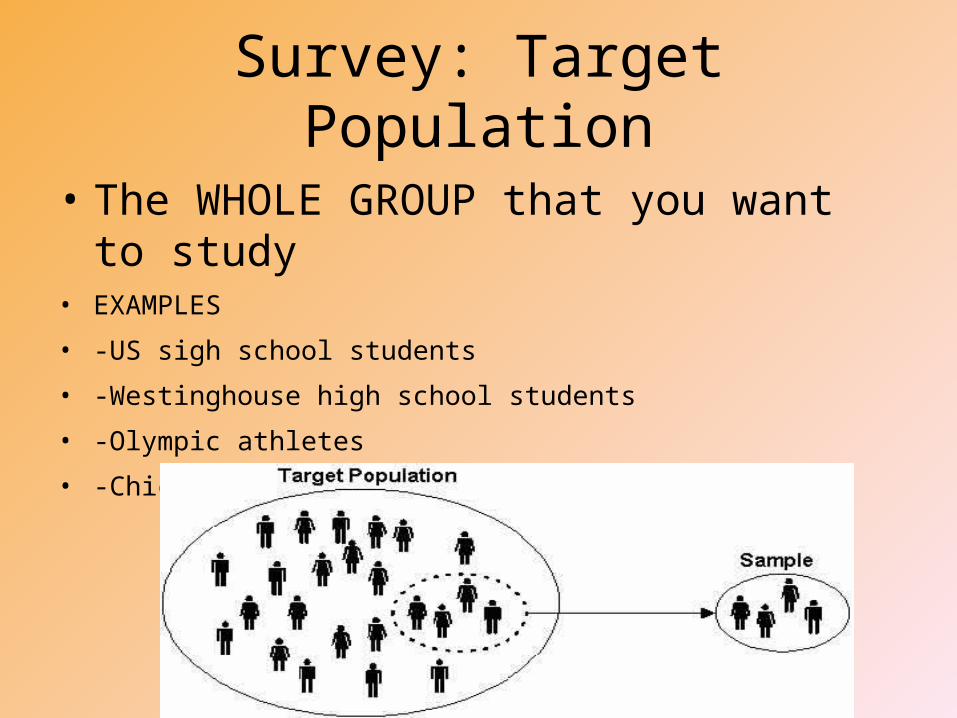
Survey: Target Population
• The WHOLE GROUP that you want to study• EXAMPLES
• -US sigh school students
• -Westinghouse high school students
• -Olympic athletes
• -Chicago Firefighters
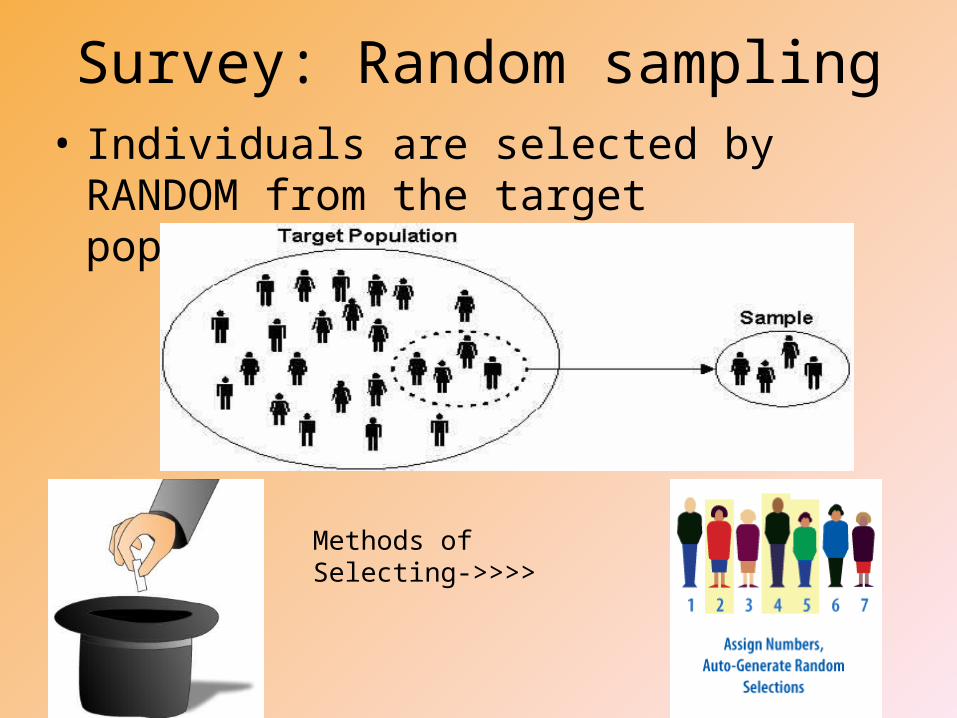
Survey: Random sampling• Individuals are selected by RANDOM from the
target population
Methods of Selecting->>>>
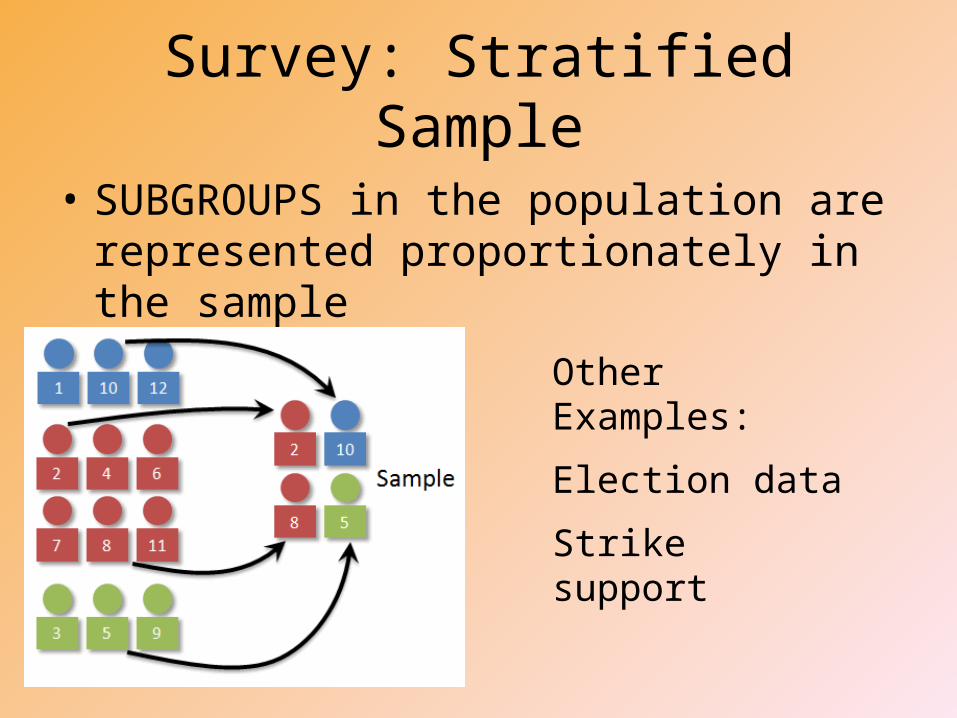
Survey: Stratified Sample
• SUBGROUPS in the population are represented proportionately in the sample
Other Examples:
Election data
Strike support

Survey: Volunteer Bias
People who CHOOSE (volunteer) to participate in research studies often DIFFER from people who do not
Examples:
PETA

Case Study
• An IN DEPTH investigation of an INDIVIDUAL or small group
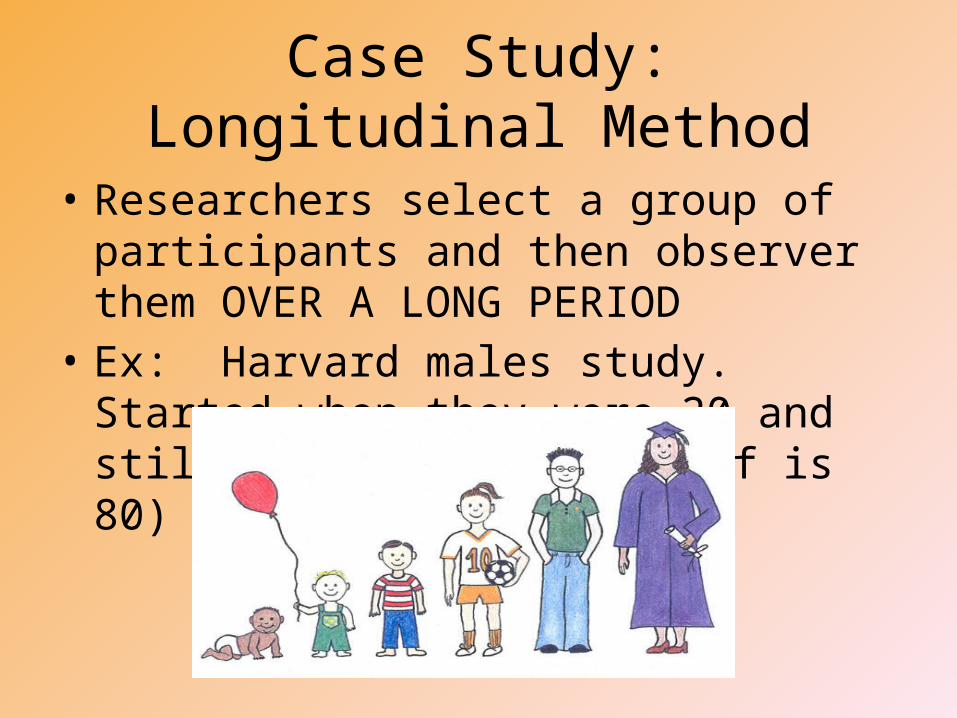
Case Study: Longitudinal Method
• Researchers select a group of participants and then observer them OVER A LONG PERIOD
• Ex: Harvard males study. Started when they were 20 and still going today (my prof is 80)
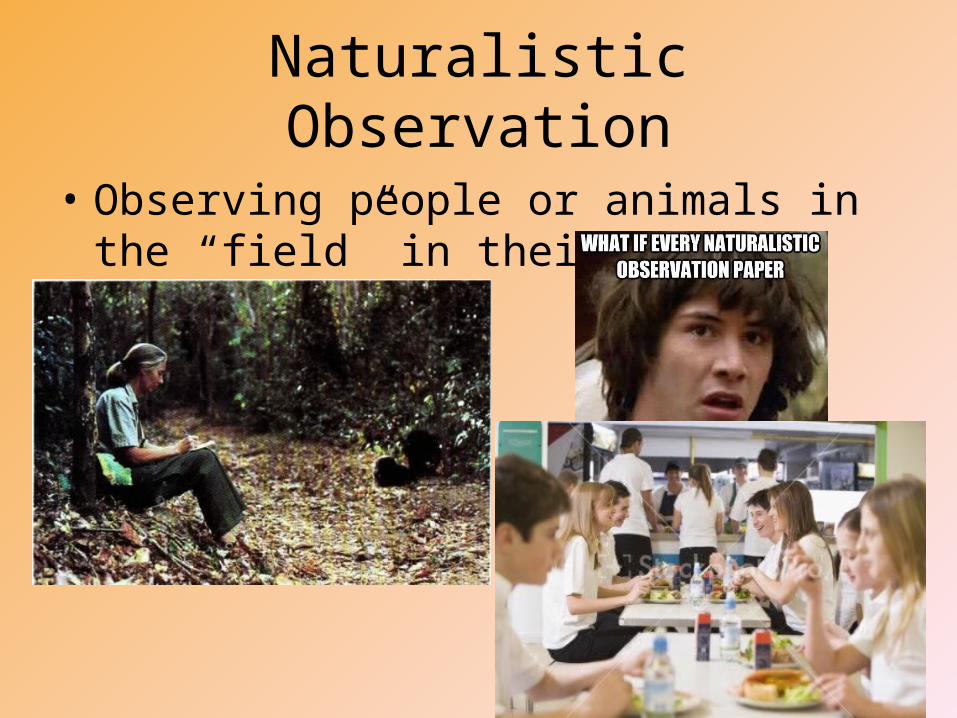
Naturalistic Observation
• Observing people or animals in the “field” in their NATURAL HABITATS
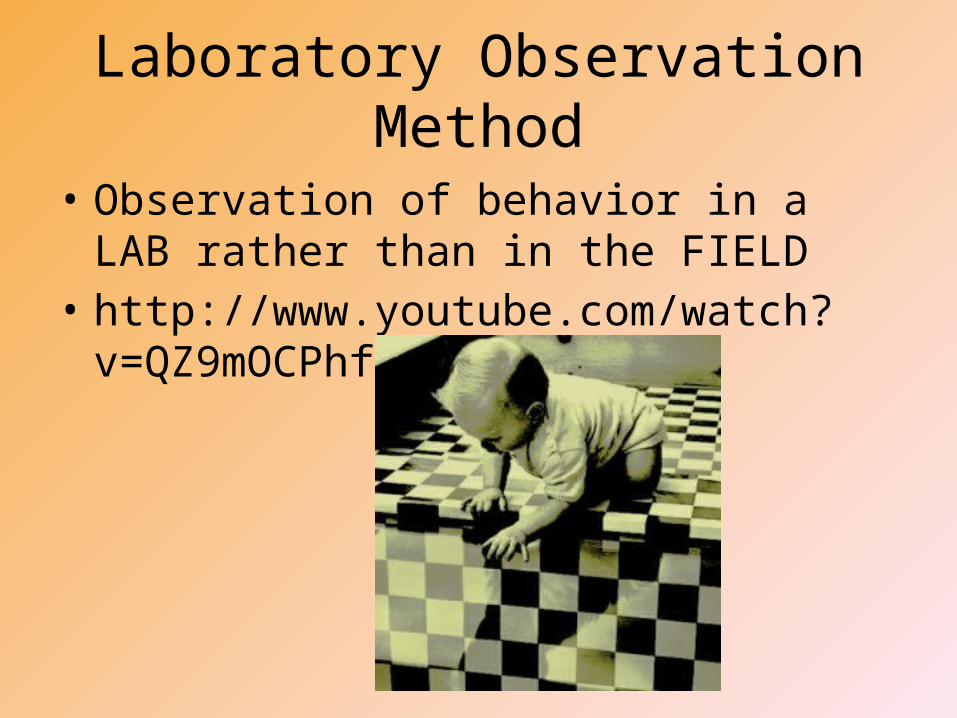
Laboratory Observation Method
• Observation of behavior in a LAB rather than in the FIELD
• http://www.youtube.com/watch?v=QZ9mOCPhfAc

Correlation
• A measure of how closely one thing is RELATED to another
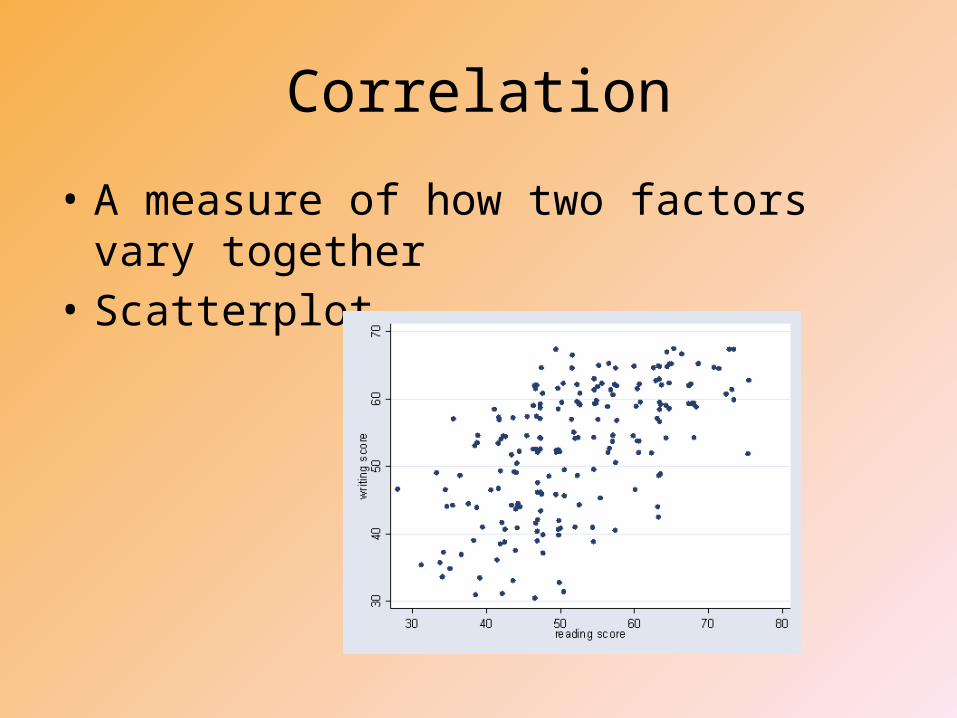
Correlation
• A measure of how two factors vary together• Scatterplot

Positive Correlation
A relationship between variables in which one variable GOES UP as the GOES UP (increases)
*Direct
Ex: People who have a greater need to achieve, earn more money
(not always, but often)

Negative Correlation
• Two variables in which one variable GOES UP the other GOES DOWN
• Inverse
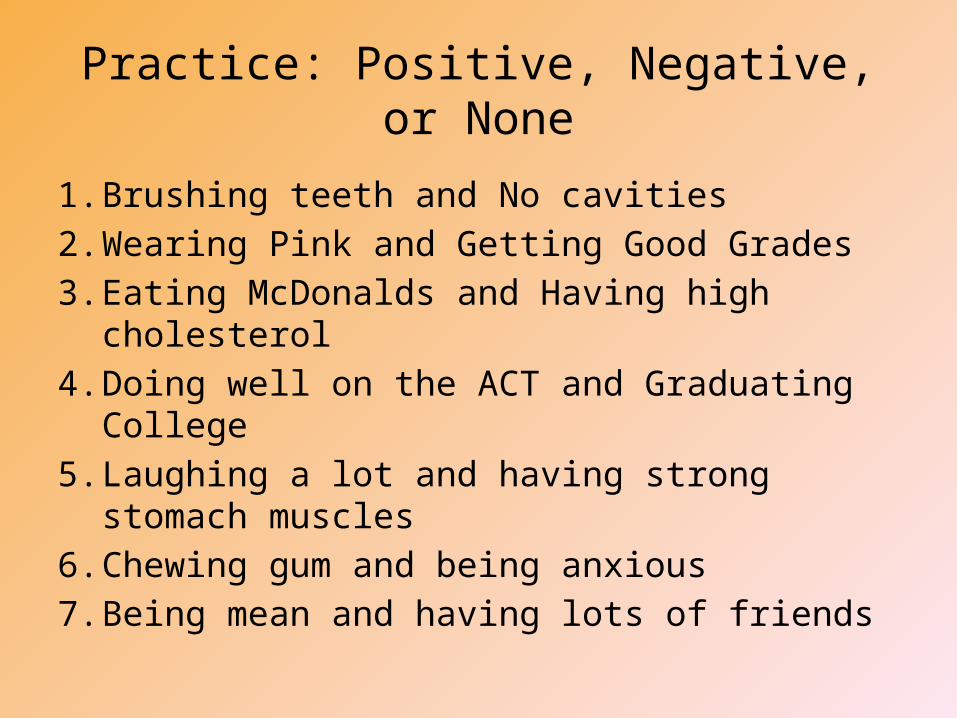
Practice: Positive, Negative, or None
1. Brushing teeth and No cavities2. Wearing Pink and Getting Good Grades3. Eating McDonalds and Having high cholesterol4. Doing well on the ACT and Graduating College5. Laughing a lot and having strong stomach muscles6. Chewing gum and being anxious7. Being mean and having lots of friends
Correlation and Causation
• Correlation DOES NOT mean causation– Ex: low self-esteem causes depression
• Correlation indicates the POSSIBILITY of a cause-effect relationship– Doesn’t prove anything
Correlation coefficient
• A relationship between two things (-1 to +1)• The number represents the strength or
weakness• The sign represents the direction of the
correlation• Practice: -.70 vs. +.65 (which is stronger? And
which relationship is inverse and which is direct?)
Illusory Correlations
• When we believe there is a relationship between two thing, we are likely to notice and recall instances that confirm our belief
• I.E. superstitutions• Influenced by confirmation bias: look for
evidence that confirms our beliefs

Perceiving Order in Random Events
• Chance-related explanation• Patterns and streaks occur more often than
people expect
Experimental Method
• Focus on one or more factors by manipulating the factors of interest and holding constant other factors
• The method researchers use to answer questions about cause and effect
Variables
• Factors that can vary and change
Ex: temperature of room, option to leave room, how crowded it …
Independent and Dependent Variables
Independent Variable• The factor that
researchers MANIPULATE so they can determine its effect
Dependent Variable• In an experiment, the
factor being MEASURED and that may change in response to manipulations of the independent variable
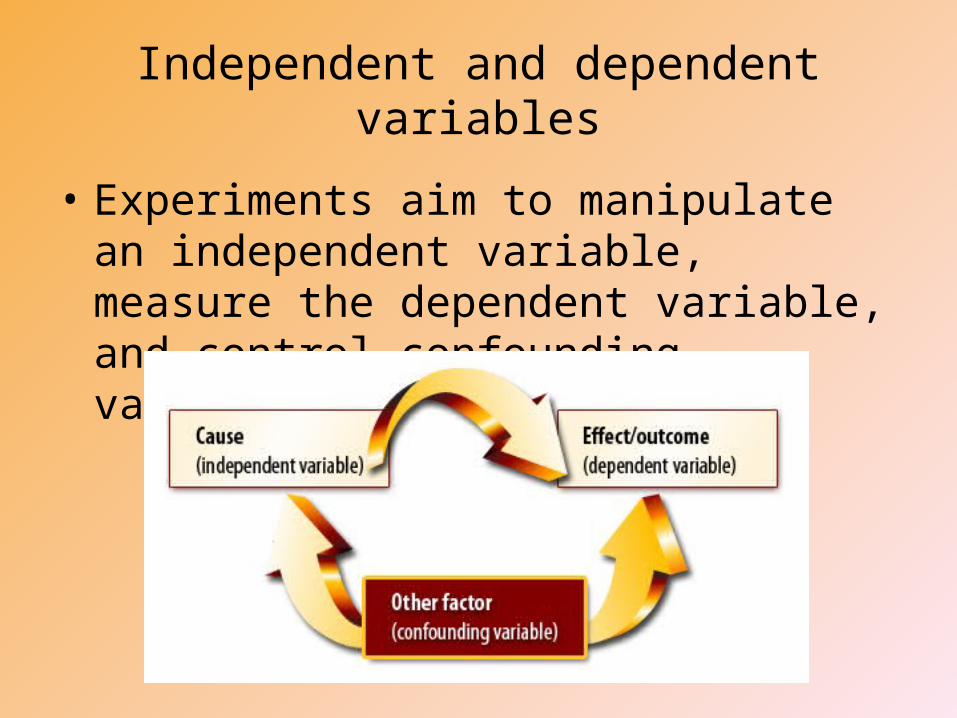
Independent and dependent variables
• Experiments aim to manipulate an independent variable, measure the dependent variable, and control confounding variables

Confounding Variable
• Other factors that can influenced the results of the experiment
• Random assignment controls for possible confounding variables
Controlled Experiment
When an experiment uses EXPERIMENTAL groups as well as CONTROL groups
Experimental group: in a study, the people that RECEIVE the treatment
Control Group: in a study, the people that DO NOT receive the treatment
Examples: ACT Class, Teeth brushing, Resumes
Single Blind Study
• Participants do not know if they are receiving the TREATMENT or not. They do not know if they are in the experiment or control group.
Ex.: Experimental group receiving a drug and control group receiving a placebo
Placebo Effect
• A substance treatment that has NO EFFECT apart from a person’s belief in it
• Ex: Receiving a tablet that appears to contain a real drug but that actually has no medicinal value
• All patients must participate in some sort of treatment even if it means it is not meaningful
• Trusted source: derives a health benefit
Random Assignment• An experiment manipulates a factor to
determine its effect• Double-blind procedure• Placebo effect
DOUBLE BLIND STUDY
A study in which both RESEARCHER and PARTICIPANT are unaware of who has obtained the treatment To reduce researchers bias, influence due to
expectations “Are you SURE your knee doesn’t hurt anymore?”
Ex.: D.B.S. required by the FDA before new drugs can be put on the market
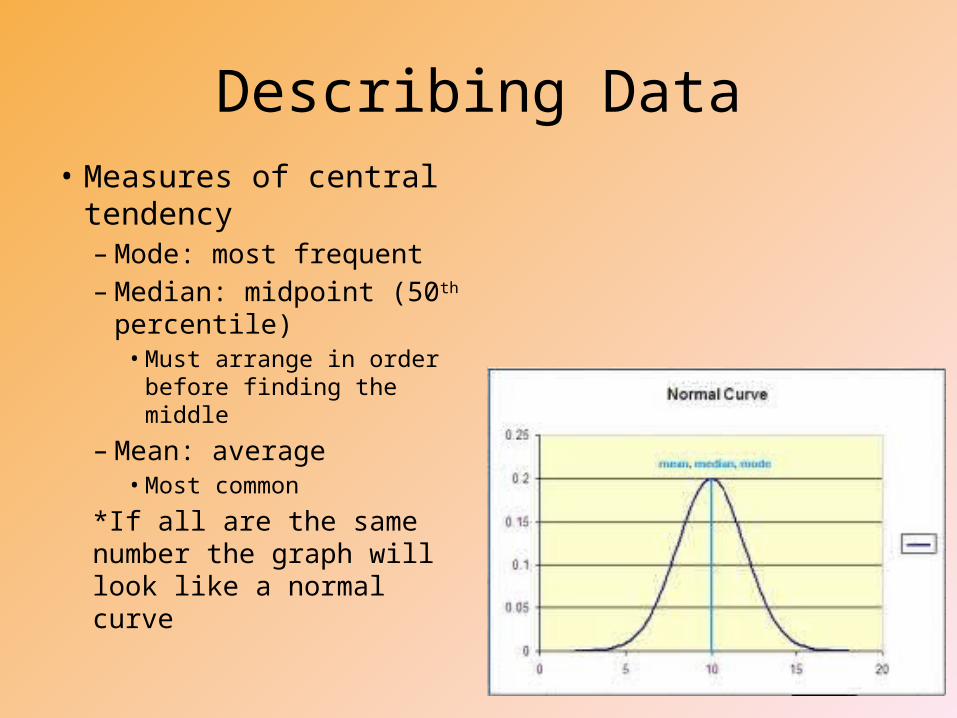
Describing Data• Measures of central
tendency– Mode: most frequent– Median: midpoint (50th
percentile)• Must arrange in order
before finding the middle
– Mean: average• Most common
*If all are the same number the graph will look like a normal curve
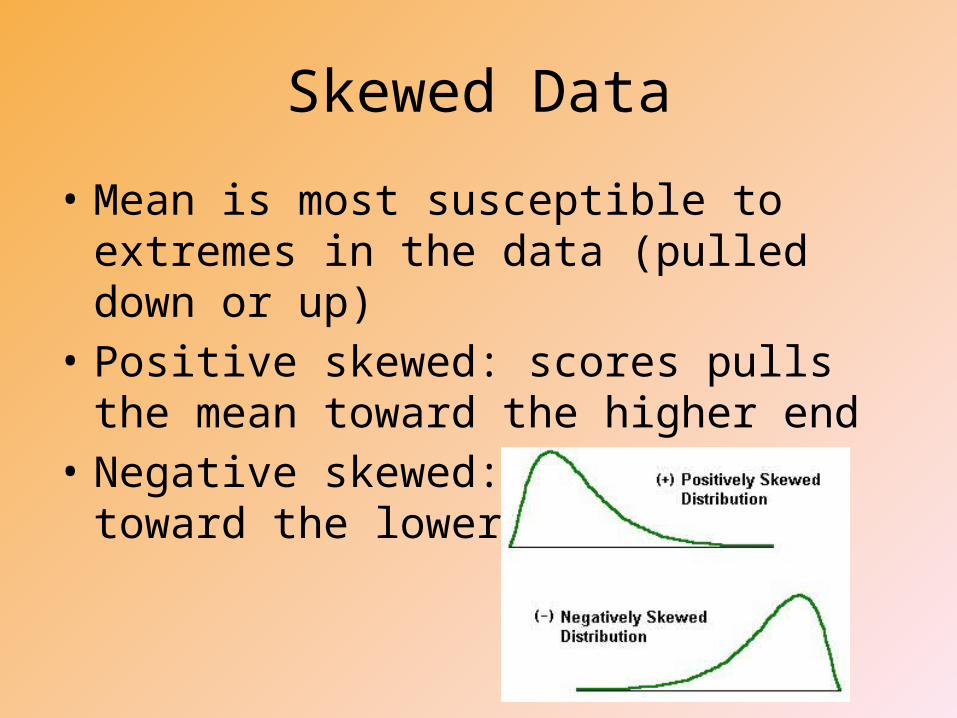
Skewed Data
• Mean is most susceptible to extremes in the data (pulled down or up)
• Positive skewed: scores pulls the mean toward the higher end
• Negative skewed: pull downed toward the lower end
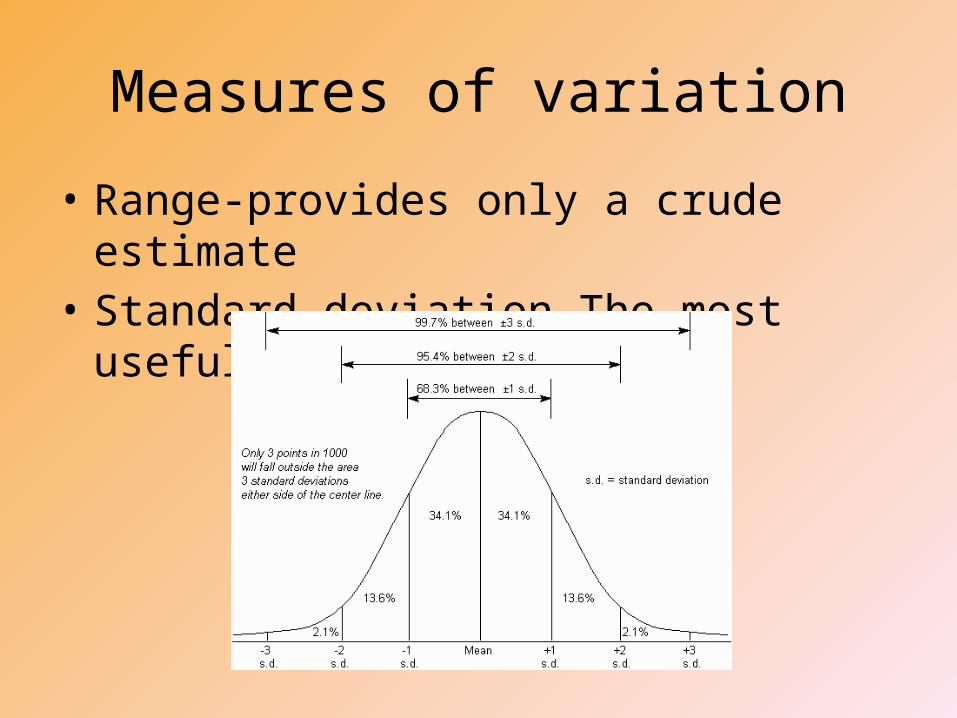
Measures of variation
• Range-provides only a crude estimate• Standard deviation-The most useful
Standard Deviation
• The higher the standard deviation, the less similar the scores are
• Standard deviation and variability– Smaller standard deviation then more stable
conclusions

Making inferences
• When an observed difference is reliable…..• Representative sample: not just random
sampling. Keep in mind the population• Less-variable observation (less is more)• More cases: averages based on many cases
are more reliable
Statistical significance
• When the sample averages are reliable and when the difference between them is relative large
• Not due to chance variation• Psychologists are very conservative when
considering statistical significance• Only indicates a likelihood that a result will
happen by chance not the importance of the result
Statistical significance (practice)
• If you graphed the data from two groups and the graphs did not overlap or only overlapped a little then the difference would be ______________?
• If the graphs overlapped a lot, then the difference would not be________________.
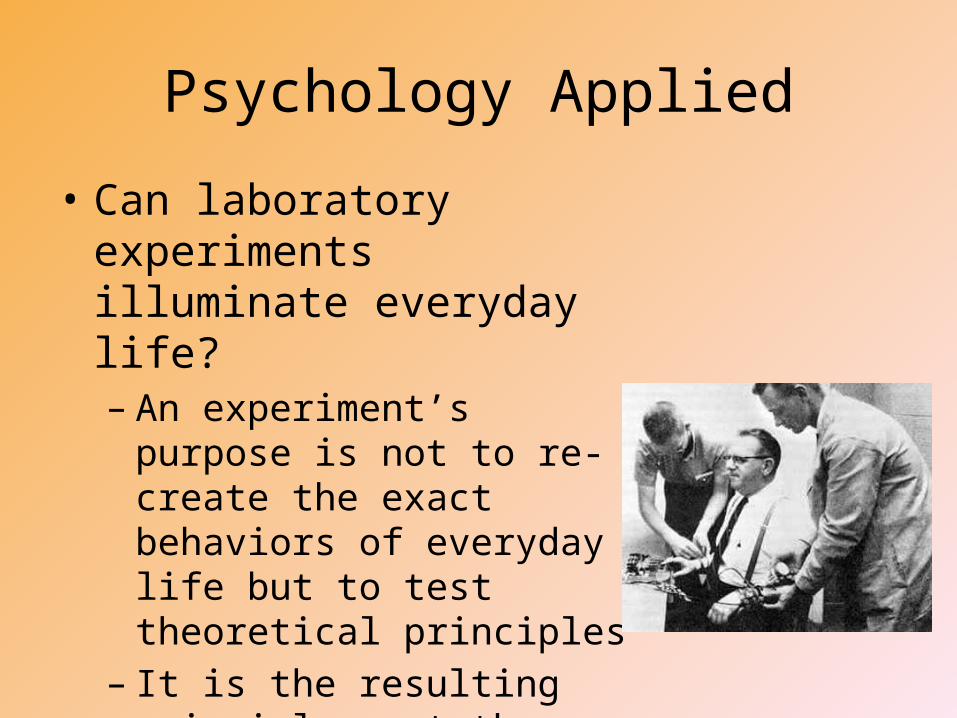
Psychology Applied
• Can laboratory experiments illuminate everyday life?– An experiment’s purpose is not
to re-create the exact behaviors of everyday life but to test theoretical principles
– It is the resulting principles-not the specific findings that help explain everyday behaviors
Psychology Applied
• Does behavior depend on one’s culture and gender?– Culture matters: awareness is key– Even when specific attitudes and behaviors vary by
gender or across cultures, the underlying processes are much the same
Ethics in Research
• Why study animals and is it ok to experiment on them?– We humans are animals:
animal experiments have led to treatments for human diseases
– Animal protection: replace with naturalistic observation
– Well being of humans above that of animals?
Ethics in Research
• How about experimenting on people?– Informed consent– Protect from harm or discomfort– Confidentiality: keeping info private• Anonymity: without providing identification info
– Debrief on experiment– Universities typically have a ethics committee
Ethics in Research
• Is psychology free of value judgments?– Values affect what we study, how we study it, and
how we interpret results– Applications of psychology’s principles have been
used mainly in the service of humanity