Embed Size (px)
Citation preview

Tehnički vjesnik 27, 2(2020), 435-443 435
ISSN 1330-3651 (Print), ISSN 1848-6339 (Online) https://doi.org/10.17559/TV-20190804140256 Original scientific paper
Research on Fault Diagnosis Based on Dynamic causality diagram and Fuzzy Reasoning Fusion Method
Yinkai WANG, Hongguo CHEN, Zhiming ZHAN
Abstract: With the progress of urbanization, the demand for elevators has upgraded from safe operation to comfortable, efficient, and all-round demand. The abnormal operation of the elevator is difficult to diagnose due to the complexity of the fault. This paper proposes a fault diagnosis method based on dynamic causality diagram and fuzzy reasoning. The dynamic causality diagram is extended, the intermediate module nodes are added, the description of the intermediate process of the elevator control system is solved, and the complete expression of knowledge is realized. The control timing of the elevator operation is introduced into the network structure of the dynamic causality diagram, which enhances the dynamic characteristics of the network. The causal cycle logic of the dynamic causality diagram is used to represent input and output signals and faults in elevator control systems. In the update of fuzzy rules, the real-time of fuzzy reasoning is enhanced, the search space of fuzzy rule matching is reduced, and the efficiency is improved. This paper combines actual field measurements and experimental data for fault diagnosis. Finally, the simulation, diagnosis and maintenance decision of the fault are realized, and an intelligent solution for elevator fault diagnosis is further proposed. Keywords: dynamic causality diagram; elevator; Fault Diagnosis; fuzzy reasoning; safe operation 1 INTRODUCTION
In recent years, with the steady growth of China's economy, the acceleration of urbanization and construction, and further development of the real estate industry, the elevators have become more and more popular in people's daily lives. Although the safety and reliability of the elevators have increased significantly, people have put forward higher requirements for the safety and comfort of the elevators, as well as the real-time fault diagnosis and prediction [1]. Elevators are electromechanical devices. The faults are characterized by diversity, uncertainty and complexity. Fault diagnosis of elevator is to collect all kinds of feature information of each component, extract the fault features, and find out the cause of the fault [2]. Accidental positioning of fault points in elevator control systems is made more difficult. Therefore, it is of great practical significance to clarify the input and output relationships of various control signals in elevator control systems, and to clarify the causal logic between each control signal, fault phenomenon and each basic fault mode for dealing with fault diagnosis of elevator control system.
Many problems are widespread in the fault diagnosis of modern control systems. Experts and scholars have proposed a variety of methods, such as: probability-based methods by Belief network [3], Markov Network [4], Dynamic causality diagram [5], fuzzy logic [6], neural network [7], evidence theory of dempster-Shafer [8], and so on. The dynamic causal map and fuzzy reasoning fusion method is to take the same object, use multiple sensors to comprehensively obtain various types of fault information, and finally make fault diagnosis. At present, the information fusion methods for fault diagnosis are different according to their fusion algorithms, mainly as follows: Bayesian theorem information fusion fault diagnosis method; fuzzy information fusion fault diagnosis method; DS evidence theory information fusion fault diagnosis method. Neural network information fusion fault diagnosis method, etc. Multi-sensor information fusion fault diagnosis has an advantage in the diagnostic accuracy of elevator system faults, but there are certain limitations in
the specific fusion algorithm. The weight selection of each sensor in fuzzy algorithm has certain subjectivity. There are also human factors in the determination of fault reliability function in DS evidence theory. Neural network information fusion algorithm exists and not only the fault membership value is difficult to determine, but there are still problems in obtaining training samples [9]. The methods have achieved certain success in their respective application fields. The reliability network cannot only deal with a wide range of control systems. The causal cycle and multi-connectivity problems exist, and it is very difficult to use the conditional probability to quantify the causal intensity in this case and it is easy to cause misunderstanding. With more and more elevator motors used, the failure forms of elevator motor are becoming more and more diverse. Therefore, it is significant to study the fault diagnosis system of elevator [10].
In the elevator fault diagnosis system, there are some unfavourable factors such as the small number of sensors, and there are problems between elevator equipment and fault generation mechanism. This paper chooses dynamic causal map and fuzzy inference fusion method. The dynamic causality diagram has obvious advantages in the causal diagram of elevator systems, but it is difficult for the basic event failure probability. The determined system cannot be diagnosed. In this paper, a fault diagnosis method based on improved dynamic causal graph and fuzzy inference is proposed. The intermediate module nodes are added, the description of the intermediate process in the elevator control system is solved, and the completeness of knowledge is realized. The control timing of the elevator control system is introduced into the dynamic causal graph, which enhances the dynamic characteristics of the network. The causal loop logic of the dynamic causal graph is used to express the input and output signals and the faults in the elevator control system. In the update of fuzzy rules, the real-time of fuzzy reasoning is enhanced, the search space of fuzzy rule matching is reduced, and the efficiency is improved. The rest of this paper is organized as follows. Section 2 discusses related work, followed by the models for Dynamic causality diagram and fuzzy neural network. In

Yinkai WANG et al.: Research on Fault Diagnosis Based on Dynamic causality diagram and Fuzzy Reasoning Fusion Method
436 Technical Gazette 27, 2(2020), 435-443
addition, the Fault Characteristic Analysis of elevator is introduced in Section 3, the fault phenomenon is composed of many reasons, and there are cross-effects among different reasons. The Realization of Fault Diagnosis is discussed in Section 4, such as Troubleshooting process. Section 5 presents the troubleshooting application examples. Moreover, Section 6 concludes the paper with summary and future research directions. 2 RELATED THEORETICAL RESEARCH AND WORK 2.1 Dynamic Causality Diagram
In 1994, a method of knowledge expression reasoning combining qualitative and quantitative analysis was proposed, that is, probabilistic reasoning based on dynamic causality diagram, which is expressing the cause by direct causality. As a probabilistic reasoning method, causal graph theory cannot only perform reliability analysis on elevator systems, but also it performs maintenance and fault diagnosis on the system. For many elevator systems, it is very difficult to obtain the exact occurrence of an event. In response to this problem, this paper combines the basic theory of fuzzy mathematics to introduce the triangular fuzzy number into the causal graph, and the probability of the basic event. Fuzzy conditional probability is quantified. In the traditional dynamic causality diagram [11], the propagation path of the interaction among intermediate event variables is difficult to express. In elevator control systems, a large number of control signals propagate between components and modules, and only the causal intensity is expressed between two signals. Interrelationship and neglect of the middle process is not conducive to the comprehensive diagnosis of faults. Therefore, this paper expands the traditional dynamic causality diagram and increases the intermediate process module of signal transmission in elevator control systems. At the same time, combined with the multi-work state of elevator control system, it is introduced. Working conditions can effectively enhance the dynamic characteristics of the network.
The improved dynamic causality diagram is shown in Fig. 1.
Xi: For the monitorable signal, the monitor signal node is connected to the basic fault and the intermediate module node, and is represented by a circle (i is the node number).
Bj: A basic fault that causes a signal failure or failure phenomenon to be connected to a corresponding signal or fault phenomenon node in the system, is represented by a rectangular box (j is the fault number).
Sm: the fault phenomenon corresponding to the basic fault, connected to the basic fault node, represented by a hexagonal box (m is the fault phenomenon number). Mk is the intermediate module for receiving the signal transmission and conversion process, and the two ends are connected to the input and output. Signal node is represented by a diamond box (k is the module number).
Gn: is a logic gate, connected with multiple signals of logical relationship, usually "AND gate", "OR gate", etc. (n is the logic gate number).
i jPX B→ : is the degree of causality, indicating the closeness of the relationship between the basic fault and the
fault information, which is given by experts based on knowledge.
{ }1 2 :, , ..., nLtN t t t the logic of this signal participating in the system control under certain working conditions, the participation control is "1", and vice versa is "0". The subscript {t1, t2, ..., tn} is the signal set of all working conditions, the superscript tn is the specific working condition of the signal participating in the current control process of the system.
"—" is an undirected edge, which is used to connect Xi, Sm and Bj to indicate their mutual relationship. The assignment value PXi → Bj, PSm → Bj is given by experts.
"→" is a directed edge, indicating the transmission relationship of the signal, and its assignment is
{ }1 2, , ..., nLtN t t t (unlabeled for all cases).
Figure 1 Dynamic causal diagram example
In the improved dynamic cause-effect diagram, fault
phenomena and control signals can be used as fuzzy antecedents, and fault phenomena can be directly used as antecedents to participate in fuzzy inference. Because different signal states correspond to different fault phenomena and basic faults, control signals are many states such as "0", "too small", "normal", and "too large". Among them, the division of states is based on the actual needs of the diagnosed object, which is not unique. When there is a certain fault and a certain signal state, there is a more detailed correspondence relationship; a more detailed description can be made in the state division. At the same time, this paper uses Gaussian MF to describe the membership of each state of each control signal, and uses this membership value as the conditional confidence in fuzzy reasoning to participate in fuzzy reasoning. 2.2 Construction Method of Fuzzy Neural Network
Constructing the fuzzy neural network is to adjust the parameters of the fuzzy system by using the learning method of the neural network, so that the control system cannot only achieve adaptive adjustment, but also process the fuzzy information.
(1) Determining membership function Let the input x of the fuzzy model be the element in the
universe U, take the normalized value, and give a mapping on the domain U as shown in Eq. (1).
[ ] ( ): 0, 1 , A U x A x (1)
Where: A is a fuzzy subset on the domain U; A(x) is the correspondence between the elements x and the fuzzy subset A in the domain U, called the membership function.
When x takes a certain value x0, A(x0) is the degree to which the element x0 belongs to the fuzzy subset A, called

Yinkai WANG et al.: Research on Fault Diagnosis Based on Dynamic causality diagram and Fuzzy Reasoning Fusion Method
Tehnički vjesnik 27, 2(2020), 435-443 437
the membership degree. Membership is objective, which requires stability, continuity, and symmetry.
There are many methods to determine membership function, one of which is to use the strong self-learning ability of neural network to determine the type of membership function, then input a large number of measured data into the network, through a specific algorithm, and fine-tune some of the parameters to obtain the best results. Because the objective reality is mostly continuous and symmetrical, the membership function usually chooses convex type and single peak shape. Gauss function is one of the most common and applicable membership functions. Its expression is shown in Eq. (2) and the shape of the curve is shown in Fig. 2.
( )2
2e( )
2
x baA xc
− −
= (2)
In the formula, a is the peak value of the Gauss curve,
b is the symmetrical axis, and c is the width of the standard deviation control curve. a, band c are real constants, and these parameters can be adjusted by the self-learning function of the neural network.
Figure 2 Gauss function shape
(2) Determining fuzzy rules If the fuzzy model used for elevator diagnosis is set to
single input-single output system, the fuzzy rule j is set to "if xi is Aj then yj = ajxi + kj". Where xi represents the input i (the input can be one or more), the output yj is a polynomial, and aj, kj are the parameters associated with the membership function Ax. Based on a large amount of input-output data, the function can be determined. Usually a linear function is chosen (polynomial), and then the parameters fit by the "least squares" method.
When the input quantity xi activates the fuzzy rule i, the output is yj. When n fuzzy rules are activated, the total output Y of the system can be obtained by the weighted average method shown in Eq. (3).
1
1
n
j jj
n
jj
yY
ω
ω
=
=
=∑
∑ (3)
Where: ωj is the proportion (weight) of the rule j in the total output. If the system has only one input variable, ωj = Aj(x).
3 ELEVATOR FAULT CHARACTERISTIC ANALYSIS 3.1 Elevator Fault Characteristic
In engineering practice, abnormal changes in elevator control parameters are related to elevator failures. Some researchers collected elevator inspection data samples including five aspects of mechanical, electric power, speed control and safety protection, including temperature, tension, speed, current and speed. In this paper, the dynamic causal map and fuzzy inference fusion method are optimized, and these different kinds of data are synthesized to diagnose elevator faults [12]. However, because the collected data types are very limited, and the amount of various types of data is also small, the relationship between each type of data and faults established based on this is not high, and when various types of data are diagnosed. When there is a big difference, the weight of the final diagnosis result is not easy to allocate. The fault of Elevator can be diagnosed by the performance characteristics embodied in the working process of elevator. That is to say, by monitoring the operation of Elevator, the characteristic data are measured and sent to the neural network of fault features, filtering out interference signals, and then evaluating and processing them through the fuzzy neural network [13, 14]. Single or multiple faults may occur at a certain time. The causes of these faults are diverse and different in degree. In addition, a fault cause may also cause a variety of phenomena. To establish a fault diagnosis model, the mapping relationship between the fault phenomena and causes is shown in Fig. 3.
Figure 3 Mapping relationship between fault phenomena and causes
Fault phenomenon is composed of many reasons, and
there are cross-effects among different reasons. In fault diagnosis, engineers need to list all possible causes of failure. Even experienced engineers find it difficult to troubleshoot in a short time. Therefore, a model describing the degree of connection between phenomena and causes is needed in engineering. Its input is the combination and strength of different failure phenomena and its output is the fault cause of elevator. By consulting a large number of documents and maintenance records of Elevator, the author obtains the common fault phenomena of Elevator. Taking horizontal axis as the fault reason and vertical axis as the fuzzy number, the author establishes the cause histogram of several common fault phenomena of Elevator, as shown in Fig. 4 - Fig. 8.
In Fig. 4 and Fig. 5, failure cause y1 indicates that the enabling signal is not connected properly. Failure cause y3 indicates that the electrical circuit is not connected properly; failure cause y4 indicates that the motor is not working properly. y13 indicates that the frequency converter is faulty, y14 indicates that the power supply is faulty, y22 indicates

Yinkai WANG et al.: Research on Fault Diagnosis Based on Dynamic causality diagram and Fuzzy Reasoning Fusion Method
438 Technical Gazette 27, 2(2020), 435-443
that the protective switch is not pressed or failed, y23 indicates that the rotary encoder is disturbed, y24 indicates that the motor bearing is damaged, and y25 indicates that the motor magnet is damaged.
Figure 4 Abnormal speed of Elevator motor
Figure 5 Elevator motor without motion
Figure 6 Damage to electrical components
From Fig. 4 to Fig. 8, it can be seen that different fault
phenomena are caused by the same fault, which causes trouble in judging the fault. For example, the degree that y1 causes the spindle motor to be inactive is 0,8, the degree that y4 causes the motor to be inactive is 0,4; the degree that y4 causes both is 0,8.
Figure 7 Insufficient oil supply to the system
Figure 8 Communication failure
3.2 Elevator Fault of Dynamic Causality Diagram
Combining with the basic theory of fuzzy mathematics, this paper introduces the triangular fuzzy number into the causal graph, and quantifies the probability of the basic event and the fuzzy conditional probability.
The calculation of the causal map is mainly divided into the following four steps:
1) Find the first-order cut set expression of the intermediate (node) event;
2) Find the final cut set expression of the intermediate (node) event;
3) Find the non-intersecting cut set expression of the intermediate (node) event;
If 1
m
ii
X C=
=
, and 1
ni
i ijj
C V=
=
,Ci is a cut set, then the
X non-intersecting cut set expression is
1 2 1 3 1 2 1 2 1, …, , …, m mX C C C C C C C C C C −= + + + + (4)
4) Calculate the posterior probability P(Vi/E) of any event given the evidence E.
Fault phenomena and control signals can be used as fuzzy frontware, and fault phenomena can directly participate in fuzzy reasoning as an antecedent. Because different signal states correspond to different fault phenomena and basic faults, the control signals may have

Yinkai WANG et al.: Research on Fault Diagnosis Based on Dynamic causality diagram and Fuzzy Reasoning Fusion Method
Tehnički vjesnik 27, 2(2020), 435-443 439
various states such as "0", "small", "normal", and "large". Among them, the state is divided according to the actual needs of the object to be diagnosed. When there is a more detailed correspondence between a certain fault and a certain signal state, the state division can be described in more detail. At the same time, Gauss MF is used to describe the state membership of each control signal [15], and this membership value is used as fuzzy confidence in the conditional confidence in fuzzy reasoning.
212( , , ) e
x c
Gaussian x c σσ−
= (5)
Gauss MF is represented by two parameters {c, σ}: c
is the center of the MF, and σ is the MF. The width of the two parameters is selected based on the statistical analysis of the historical maintenance data of the object being diagnosed. In the area where the data distribution is concentrated, the parameters should be designed so that the signal obtains a greater degree of membership in this state, which ensures that the diagnosis result is more in line with the actual situation.
Figure 9 Workflow of troubleshooting process
4 REALIZATION OF FAULT DIAGNOSIS 4.1 The Troubleshooting Process
The common fault phenomena and causes of an elevator motor equipment are summarized. The correlation degree between phenomena and causes is made. Then, the data were transformed into the fault fuzzy data of Elevator, and used as input of the fuzzy neural network classifier to complete the fault diagnosis. In the system fault diagnosis, firstly the control signals of the system were collected in real time, the current disclosure of the system determined,
the fuzzy value speech items of the monitoring signal under the current working conditions obtained, the membership degree of the state obtained, and the fuzzy premise generated. Then, according to the working condition, the update space of the multiple herder rules is determined, and the confidence of the fuzzy rule included in the space is updated to the current time, and then the fuzzy front ware is searched according to the priority, and the fuzzy front ware and the dynamic update are blurred. The rules are matched using a fuzzy algorithm [16]. If the match fails, the output signal, the predecessor status information and the confidence level are analyzed by the fault diagnosis combined with the actual situation of the system. If it is reasonable, the fuzzy rule base is updated. If it is unreasonable, it shields the previous part and ends the diagnosis. If the match is successful, the fuzzy part is obtained, and the calculation formula is adopted.
x ya a a= ⋅ helps to obtain the confidence of the conclusion. The ax is sorted from large to small, which is scheduled for troubleshooting in this order. The troubleshooting process is shown in Fig. 9. 4.2 Fusion Method of Fault Diagnosis
The basic process of fault diagnosis can be expressed as follows. Firstly, establish a fault symptom set of the diagnostic object (including all the symptoms that may be displayed when the fault occurs) and a set of fault causes (including all the causes that may cause the fault), and then determine the fault symptom set and fault. The mapping relationship between the reason sets. When the diagnosis object fails, the cause of the failure of the diagnosis object is determined according to the displayed failure symptom and the mapping relationship between the failure symptom sets and the failure cause sets. The information generated by a system under different operating conditions has different characteristics. The multi-sensor is used to collect the original data of the diagnosed system in various states, and the symptom space after pre-processing and feature extraction, and then fault diagnosis is performed. The network structure is shown in Fig. 10.
Figure 10 Schema of fuzzy neural network classifier
In the fault diagnosis unit, if a single fuzzy neural
network is selected, the network remembers the characteristics of the fault by learning the input fault samples. If the input is not the fault sample data, the network can approach the memory by means of memory association. The closest type of fault, the ultimate fault diagnosis, so the single fuzzy neural network fault diagnosis can be regarded as the fault pattern recognition process. In Fig. 10, the first layer is the fuzzification layer. The activation function of the node in this layer is the

Yinkai WANG et al.: Research on Fault Diagnosis Based on Dynamic causality diagram and Fuzzy Reasoning Fusion Method
440 Technical Gazette 27, 2(2020), 435-443
membership function of each fuzzy subset defined in the fuzzy rules, and the output of the first sample is Eq. (6).
( )2i i iO A x= (6)
The second layer is the rule layer. The output is the
product of input, and the output of nodes represents the matching degree of input samples and rules. If the input is an M-dimensional eigenvector, the output rule of the node is Eq. (7).
( )3 2M M
i i i ij j
O O A x= =∏ ∏ (7)
The third layer is the clarification layer. This layer
realizes the de-fuzzification, and the link weight value with the rule layer is ωij, which represents the value of the central point of the membership function of the first output fuzzy set of rule j. The algorithm uses "weighted average". The node output of the clarification layer is Eq. (8).
3
14
1
n
ij ij
i n
ijj
OO
ω
ω
=
=
=∑
∑ (8)
Formula: n is the number of rules in the clarification
layer. The fourth layer is the normalized treatment layer. In
this layer, the output data are transformed into the interval [0, 1], and the Eq. (9).
54
1
1+i
OiO
e−= (9)
Based on experience and consulting a large number of
data, the common faults and causes are summarized, and the letters x1, x2, x3, …, xm are used to express the fault phenomenon, y1, y2, y3, …, yn is used to express the cause of the fault. 4.3 Inductive Fuzzy Grade
The probability of elevator failure varies, so it is difficult to use accurate data representation. Therefore, the possibility of each failure is described by using fuzzy language, which is summarized as shown in Fig. 9. Fig. 9 corresponds to Fig. 1 to Fig. 6. For example, Fig. 5 is the failure phenomenon of insufficient oil supply in the system. The foreign body in the hydraulic cylinder is the cause of accidental release, and the ambiguity number is 0,3, while the excessive viscosity or oil temperature is the frequent cause, and the ambiguity number is 0,6.
The corresponding input of sample vector form is( )T1 0 0 0 1 0 0 m=T . The fourth element of the vector is 1,
because the model stipulates that the fault of insufficient oil supply in the system is No. 4. In addition, if the spindle motor does not work, the first element of the vector can be
located at 1. Because the model ranks the spindle motor inactivity as No. 1, that is to say, the elevator has such a fault, the position 1 has an input signal. This is also done to facilitate computer processing of data. N stands for n common fault phenomena.
The target output vector of the model is( )T1 0 0 0 0 0, ..., 0 8, ..., 0 0 6 0 6, ..., 0 m, , ,=T . Among them,
m means that the vector has m elements, representing m kinds of fault phenomena. For example, the fuzzy number of oil channeling or internal leakage of shift cylinder is 0,8. The corresponding fault reason is y33, so the 33rd element of vector is set to 0,8. Other fault phenomena and causes are all made into the same vector form, forming the fault phenomena vector sets P1, P2, …, Pn and fault cause vector sets T1, T2, …, Tn, as input and output samples, to train the model. In this paper, the fault diagnosis model of Elevator is built by using MATLAB software, and the training and simulation tasks of the model are realized. The numerical Sugeno fuzzy model is more convenient for output. 5 TROUBLESHOOTING APPLICATION EXAMPLES
In this paper, the fault diagnosis of the elevator motor controlled by a control box is taken as an example to construct an improved dynamic causality diagram model for the control process of the vertical elevator motor. Multiple fuzzy rules and rule confidence, fuzzy front ware and pre-confidence are obtained. In the process, the fuzzy rules combined with the fuzzy inference process are combined with the system condition to perform fault diagnosis. 5.1 Troubleshooting Background Description
In the elevator motor control process, the control box generates control signals under three operating conditions [17]. Stabilization image is not touched frame, the vertical angle signal VJT is transmitted by the gyroscope, and then the vertical elevator motor control signal VGF is generated by the high and low control panel. The loading frame is: the vertical movement speed of the transmission mirror by the scope under this condition Signal VVEL, then generate a vertical elevator motor control signal VGF via the high and low control panels. Stabilized image frame: Under this condition, the vertical gyro rate signal VSL is generated by the scope perpendicular to the gyro, and then superimposed by the high and low control board and the vertical composite aiming signal VFHMZ to generate a vertical elevator motor control signal VGF. 5.2 Vertical Elevator Motor Control Process Dynamic
Causal Graph
The state and fault phenomenon of each detection signal in the fault diagnosis of the vertical elevator motor control process fully reflects the basic faults of its occurrence, conversion module and controlled components. The vertical elevator motor control process improvement dynamic causality diagram knowledge representation is shown in Fig. 11.
Yinkai WANG et al.: Research on Fault Diagnosis Based on Dynamic causality diagram and Fuzzy Reasoning Fusion Method
Tehnički vjesnik 27, 2(2020), 435-443 441
Figure 11 Vertical motor control process causality diagram
The definition of each symbol is shown as follows. B1 - Gyro failure. B2 - Vertical solver failure. B3 - vertical gyro failure. B4 - console failure. B5 - elevator encoder failure. B6 - Left power distribution box fault. B7 - J1 relay failure. X1 - Gyro Vertical Angle Signal VJT. X2 - mirror vertical speed signal VVEL. X3 - vertical gyro rate signal VSL. X4 - vertical composite aiming signal. X5 - elevator control signal VGF. X6 - power signal 26V. X7 - power signal 5V. X8 - power signal 15V. X9 - power signal -15V. X10 - power signal 27V. S1 -Power distribution box power indicator is off. S2 - The upper lens body rotates abnormally. M1 -high and low control board. M2 - 5V power board. M3 - 15V power board. M4 - 15V power board. M5 - 27V power board. G1 - AND gate. t1 - image stabilization without touching the frame. t2 - watch box. t3 - image stabilization.
5.3 Initial Dynamic Causality Diagram Model Structure
Sample vectors in Fig. 12 are needed to generate the initial dynamic causality diagram model. Some sample data are used in the graph, abscissa is used to indicate the cause of the fault, ordinate is a fuzzy number, and the same graph is used to represent the fault phenomenon. According to the sample data, the initial dynamic causality diagram is generated by mesh segmentation method [18]. Among them, the number of fuzzy subsets is chosen as 5, which means: very low (VL), low (L), medium (M), high
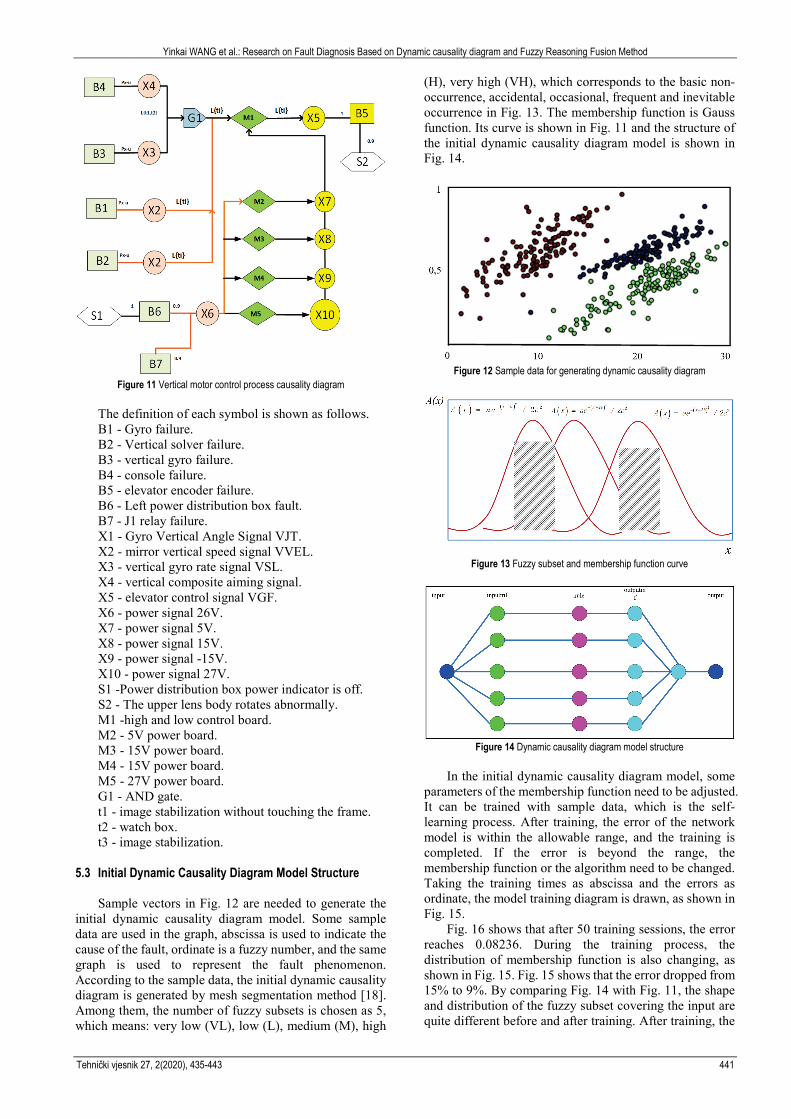
(H), very high (VH), which corresponds to the basic non-occurrence, accidental, occasional, frequent and inevitable occurrence in Fig. 13. The membership function is Gauss function. Its curve is shown in Fig. 11 and the structure of the initial dynamic causality diagram model is shown in Fig. 14.
Figure 12 Sample data for generating dynamic causality diagram
Figure 13 Fuzzy subset and membership function curve
Figure 14 Dynamic causality diagram model structure
In the initial dynamic causality diagram model, some
parameters of the membership function need to be adjusted. It can be trained with sample data, which is the self-learning process. After training, the error of the network model is within the allowable range, and the training is completed. If the error is beyond the range, the membership function or the algorithm need to be changed. Taking the training times as abscissa and the errors as ordinate, the model training diagram is drawn, as shown in Fig. 15.
Fig. 16 shows that after 50 training sessions, the error reaches 0.08236. During the training process, the distribution of membership function is also changing, as shown in Fig. 15. Fig. 15 shows that the error dropped from 15% to 9%. By comparing Fig. 14 with Fig. 11, the shape and distribution of the fuzzy subset covering the input are quite different before and after training. After training, the

Yinkai WANG et al.: Research on Fault Diagnosis Based on Dynamic causality diagram and Fuzzy Reasoning Fusion Method
442 Technical Gazette 27, 2(2020), 435-443
middle is narrow and wide on both sides, and the right side is wider than the left side. This result is more in line with people's thinking habits.
Figure 15 Training error of initial dynamic causality diagram model
Figure 16 Membership function curve after training
Click on each fuzzy subset and the parameters of each
membership function are shown in Eq. (10).
[ ][ ][ ][ ][ ]
0 1216 1 13
0 172 0 5197
0 06278 0 0995
0 247 0 519
0 21131 124
VH , ,
H , ,
M , ,
L , ,
VL , ,
−
− −
(10)
( )( )
( )( )
( )( )
( )( )
( )( )
2
2
2
2
2
2
2
2
2
2
1 13( ) exp
2 0 1216
0 5197( ) exp
2 0 172
0 0995( ) exp
2 0 06278
0 519( ) exp
2 0 247
1 124( ) exp
2 0 2113
x ,VH x
,
x ,H x
,
x ,M x
,
x ,L x
,
x ,VL x
,
+ = − + = − + = −
+ = −
+ = −
(11)
According to the formula of Gauss function, the expression of membership function after parameter adjustment is obtained as Eq. (11).
According to the above formulas, the fuzzy rules of the model are obtained. When the real-time variables are different, the exact output can be given.
Using the same method, the output function expression as shown in Eq. (12) can be obtained.
1
2
3
4
5
4 729 4 9640 1067 0 43843 24 0 44190 8986 0 77415 284 5 279
y , x ,y , x ,y , x ,y , x ,y , x ,
= − − = − − = − − = − + = − +
(12)
5.4 Discussion
Based on the causes of elevator vibration, this paper continuously increases the nodes to expand the network branch, making the fuzzy inference system closer to reality, and finally able to cope with most vibration failure situations found in reality. This paper analyzes the establishment of a relatively complex network structure under the same order of magnitude and the same system complexity, intelligently diagnoses elevator vibration faults, which recommends the best maintenance plan. In order to reflect the superiority of the method proposed in this paper in the diagnosis of complex control systems, this article increases the system complexity by gradually increasing the diagnostic objects in the controlled system (such as elevator motors, gyroscopes, gyro torque devices, and so on.). The fuzzy inference system is a comparison object. The analysis is based on the same order of magnitude and the same system complexity, using the same search strategy, and the advantages and disadvantages of the two systems in terms of matching time and effective matching rate. When diagnosing a system of the same complexity, the fault diagnosis method using the fusion of dynamic cause-effect graph and fuzzy inference takes less time and has a higher accuracy rate than traditional fuzzy inference methods, which can avoid system misdiagnosis. 6 CONCLUSION
In this paper, the causality diagram is applied to the reliability analysis of elevator control systems, and the causal graph model that causes the elevator control system to be unable to open normally is established. By fuzzy method, the difficulty of obtaining the exact value of the event occurrence probability has been overcome to some extent. The author summarizes the common failure phenomena and causes of elevator. Based on the fuzzy logic reasoning and causality diagram, a fault diagnosis model of elevator based on causality diagram is constructed. The probability of the basic event is quantified to obtain the fuzzy conditional probability of each event when the evidence condition occurs. Practice has proved that the model saves time and improves efficiency compared with manual checking, the error dropped from 15% to 9%, and achievesd expected results. It has good

Yinkai WANG et al.: Research on Fault Diagnosis Based on Dynamic causality diagram and Fuzzy Reasoning Fusion Method
Tehnički vjesnik 27, 2(2020), 435-443 443
reference value for equipment maintenance. The fuzzy causality diagram cannot only analyse the fault, but also analyse the reliability of the system. The shortcomings of the fault tree analysis have been overcome, which has the advantages of fuzzy fault diagnosis and fault tree fault diagnosis, which has certain practical significance. 6 REFERENCES [1] Shen, W. W., Wang, C. L., Cheng, K., et al. (2004).
Algorithm to Transform Dynamic Causality Diagram Into Belief Network. Journal of Chongqing University, 27(10), 33-36.
[2] Zheng, N., Zhang, L., Wang, W., et al. (2017). Research on Fault Diagnosis Method Based on Rule Base Neural Network. Journal of Control Science and Engineering, 2017, 1-7.
[3] Zhang, C. Y. & Wu, X. Q. (2014). Intrusion Scenario Dynamic Correlation Algorithm Based on Single Value Causality Diagram. Advanced Materials Research, 2014, 926-930:5. https://doi.org/10.4028/www.scientific.net/AMR.926-930.3063
[4] Mabin, V. J., Davies, J., & Cox, J. F. (2010). Using the theory of constraints thinking processes to complement system dynamics' causal loop diagrams in developing fundamental solutions. International Transactions in Operational Research, 13(1), 33-57. https://doi.org/10.1111/j.1475-3995.2006.00532.x
[5] Gong, M. (2017). Research and application of credit rating model in small and micro enterprises based on fuzzy neural network. Journal of Discrete Mathematical Sciences and Cryptography, 20(4), 817-834.
https://doi.org/10.1080/09720529.2017.1364042 [6] Setianto, N. A., Cameron, D., & Gaughan, J. B. (2015).
Identifying Archetypes of an Enhanced System Dynamics Causal Loop Diagram in Pursuit of Strategies to Improve Smallholder Beef Farming in Java, Indonesia. Systems Research & Behavioral Science, 31(5), 642-654. https://doi.org/10.1002/sres.2312
[7] Deng, S., Pei, J., Wang, Y., et al. (2017). Research on drilling mud pump fault diagnosis based on fusion of acoustic emission and vibration technology. Insight - Non-Destructive Testing and Condition Monitoring, 59(8), 415-423. https://doi.org/10.1784/insi.2017.59.8.415
[8] Zhang, T., Ye, W., & Shan, Y. (2015). Application of sliced inverse regression with fuzzy clustering for thermal error modeling of Elevatormotor. International Journal of Advanced Manufacturing Technology, 85(9-12), 2761-2771. https://doi.org/10.1007/s00170-015-8135-6
[9] Kenzie, E. S., Parks, E. L., Bigler, E. D., et al. (2018). The Dynamics of Concussion: Mapping Pathophysiology, Persistence, and Recovery with Causal-Loop Diagramming. Frontiers in Neurology, 9, Article 203. https://doi.org/10.3389/fneur.2018.00203
[10] Mcquire, C., Daniel, R., Hurt, L., et al. (2019). The causal web of foetal alcohol spectrum disorders: a review and causal diagram. European Child & Adolescent Psychiatry, 1-20. https://doi.org/10.1007/s00787-018-1264-3
[11] Chang, Y., Han, Z., & Zou, Y. (2017). On-line evaluation of operational state of complex industrial processes based on improved dynamic causal graph inference algorithm. Control Theory and Applications, 34(3), 345-354.
[12] Luo, B., Wang, H., Liu, H., et al. (2018). Early Fault Detection of Elevator Based on Deep Learning and Dynamic Identification. IEEE Transactions on Industrial Electronics, PP(99), 1-1.
[13] Li, L. & Yue, W. (2020). Dynamic uncertain causality graph based on Intuitionistic fuzzy sets and its application to root cause analysis. Applied Intelligence 50, 1-15.
https://doi.org/10.1007/s10489-019-01520-6 [14] Cui, Q., Chen, S. J., Ding, H., et al. (2016). An Investigation
on the Workpiece Roundness Generation in Centerless Grinding Based on the Integration of Virtual Elevator and Workpiece Material Removal Mechanism. Key Engineering Materials, 667(9), 588-594. https://doi.org/10.4028/www.scientific.net/KEM.667.588
[15] Qian, X., Zhang, Y., & Gendeel, M. (2019). State Rules Mining and Probabilistic Fault Analysis for 5 MW Offshore Wind Turbines. Energies, 12(11), 2046. https://doi.org/10.3390/en12112046
[16] Wang, W., Zhang, X., Li, Y., et al. (2016). Open CNC Machine Tool's State Data Acquisition and Application Based on OPC Specification. Procedia CIRP, 56, 384-388. https://doi.org/10.1016/j.procir.2016.10.061
[17] Chai, E., et al. (2019)… Artificial Intelligence Approaches to Fault Diagnosis in Power Grids: A Review. In: 2019 Chinese Control Conference (CCC). IEEE, 7346-7353. https://doi.org/10.23919/ChiCC.2019.8865533
[18] Gu, Y. K., Zhang, M., & Zhou, X. Q. (2019). Fault Diagnosis of Gearbox Based on Improved DUCG with Combination Weighting Method. IEEE Access, 7, 92955-92967. https://doi.org/10.1109/ACCESS.2019.2927513
Contact information: Yinkai WANG (Corresponding author) School of Electrical and Information Engineering, Tianjin University, China TianJin Special Equipment Inspection Institute, China Email: [email protected] Hongguo CHEN TianJin Special Equipment Inspection Institute, China Zhiming ZHAN TianJin Special Equipment Inspection Institute, China