Embed Size (px)
Citation preview
Master’s Dissertation 2014
Research on Layered 3D Display System
based on the combination of
Transparent LCD and Traditional LCD
熊迪
Xiong Di
(Student ID: 81234593)
Supervisor: Professor Ogi Tetsuro
September 2014
Graduate School of System Design and Management,
Keio University
Major in System Design and Management

2
Summary of Master’s Dissertation
Student
Identification
Number
81234593 Name
Xiong Di
熊迪
Title: Research on Layered 3D Display System based on the
combination of Transparent LCD and Traditional LCD
Abstract:
As computational power and the interest in 3D graphics have increased dramatically
in recent years, 3D display technology has become an attractive field. Until now, there
have been several kinds of 3D display devices. However, some factors like additional
devices, complex structure and high cost have become the main reasons that why 3D
display is still not being widely popularized. Considering the problems of current 3D
display systems, we proposed and successfully built a new layered 3D display system
by combining the transparent LCD and the traditional LCD.
In this research, based on the special structure of our system, we put forward a
combination of two methods (motion parallax and Depth-fused 3D) to realize 3D
effect in our system. We made the experiments to prove the feasibility of the two
methods in our system. And we also gave an application example of Ukiyoe to
evaluate the 3D performance of our system.
Keywords:
3D, Transparent LCD, Traditional LCD, motion parallax, Depth-fused 3D, Depth
perception

3
Table of contents
1 Introduction ........................................................................................................ 9
1.1 Background ................................................................................................. 9
1.1.1 Summary of 3D display system ........................................................... 10
1.1.2 Problems of current 3D display system................................................ 15
1.2 Purpose ...................................................................................................... 16
1.3 Structure of this thesis ................................................................................ 16
2 Proposal ........................................................................................................... 18
2.1 Concept of this research ............................................................................. 18
2.2 Related research on layered 3D system ...................................................... 23
3 System building ................................................................................................ 26
3.1 Hardware design ........................................................................................ 26
3.2 Software design ......................................................................................... 29
4 Motion parallax (MP) experiment ..................................................................... 34
4.1 Experimental purpose (MP) ....................................................................... 34
4.2 Experimental principle (MP) ...................................................................... 34
4.3 Experimental procedure (MP) .................................................................... 36
4.3.1 Preparation (MP) ................................................................................. 36
4.3.2 Execution (MP) ................................................................................... 38
4.4 Experimental result (MP) ........................................................................... 39
5 Depth-Fused 3D (DFD) experiment .................................................................. 48
5.1 Experimental purpose (DFD) ..................................................................... 48
5.2 Experimental principle (DFD) .................................................................... 48
5.3 Experimental procedure (DFD) .................................................................. 50
5.3.1 Preparation (DFD)............................................................................... 50
4
5.3.2 Execution (DFD) ................................................................................. 53
5.4 Experimental result (DFD) ......................................................................... 54
6 Motion parallax and Depth-fused 3D experiment .............................................. 59
6.1 Experimental purpose (MP+DFD) ............................................................. 59
6.2 Experimental procedure (MP+DFD) .......................................................... 59
6.2.1 Preparation (MP+DFD) ....................................................................... 59
6.2.2 Execution (MP+DFD) ......................................................................... 61
6.3 Experimental result (MP+DFD) ................................................................. 61
7 Application example ......................................................................................... 64
8 Discussion ........................................................................................................ 73
9 Conclusion ....................................................................................................... 75
Acknowledge .......................................................................................................... 76
Reference ................................................................................................................ 77
Conference attendance............................................................................................. 79
Appendix................................................................................................................. 80

5
List of figures
Fig.1-1: 3D Prospect on 3D Industry Applicable Fields .................................... 9
Fig.1-2: Principle of glasses type 3D display system ....................................... 11
Fig.1-3: Principle of non-glasses type 3D display system ............................... 13
Fig.1-4: Principle of light source rotation type 3D display system .................. 14
Fig.1-5: Principle of volumetric type 3D display system ................................ 14
Fig.1-6: Principle of holography type 3D display system ............................... 15
Fig.2-1: Image of Transparent LCD ............................................................... 18
Fig.2-2: Transparent LCD market forecast ..................................................... 19
Fig.2-3: Schematic diagram of layered 3D display system ............................. 20
Fig.2-4: Special structure of our layered 3D display system ........................... 21
Fig.2-5: Speculated effect of motion parallax in our layered 3D display system
.................................................................................................................. 21
Fig.2-6: Speculated effect of depth-fused 3D in our layered 3D display system
.................................................................................................................. 22
Fig.2-7: Speculated effect of motion parallax and depth-fused 3D in our system
.................................................................................................................. 23
Fig.2-8: Half-mirror type layered 3D display system ...................................... 24
Fig.2-9: Projection type layered 3D display system ........................................ 24
Fig.2-10: Immaterial DFD display using two fog screens ............................... 25
Fig.3-1: Real image of transparent LCD and traditional LCD ......................... 26
Fig.3-3: Front view of our system .................................................................. 27
Fig.3-2: Top view of our system..................................................................... 27
Fig.3-4: Side view of our system .................................................................... 28
Fig.3-5: Polarization phenomenon ................................................................. 28

6
Fig.3-6: Measurement board .......................................................................... 29
Fig.3-7: Parameters to set glFrustum .............................................................. 31
Fig.4-1: Principle of motion parallax.............................................................. 35
Fig.4-2: Schematic of motion parallax experiment ......................................... 36
Fig.4-3: Scene of motion parallax experiment ................................................ 38
Fig.4-4: Variance of data for 0cm (1LCD) ...................................................... 40
Fig.4-5: Variance of data for 4cm (2LCD) ...................................................... 40
Fig.4-6: Variance of data for 8cm (2LCD) ...................................................... 40
Fig.4-7: Variance of data for 12cm (2LCD) .................................................... 41
Fig.4-8: Contrast of setting depth and experimenters’ perceived depth (0cm,
1LCD) ....................................................................................................... 43
Fig.4-9: Contrast of setting depth and experimenters’ perceived depth (4cm,
2LCD) ....................................................................................................... 43
Fig.4-10: Contrast of setting depth and experimenters’ perceived depth (8cm,
2LCD) ....................................................................................................... 44
Fig.4-11: Contrast of setting depth and experimenters’ perceived depth (12cm,
2LCD) ....................................................................................................... 44
Fig.4-12: Contrast of the 4 situations in MP experiment ................................. 46
Fig.5-1: Principle of DFD .............................................................................. 49
Fig.5-2: Schematic of DFD experiment .......................................................... 50
Fig.5-3: Final effect of color compensation .................................................... 52
Fig.5-4: Scene of DFD experiment................................................................. 53
Fig.5-5: Average result and variance of 10 people for the DFD experiment .... 54
Fig.5-6: Regression curve of the data for the DFD experiment ....................... 55
Fig.5-7: Result of the situation that the sum of luminance percentages is not
7
100%. ........................................................................................................ 56
Fig.6-1: Schematic of MP+DFD experiment .................................................. 60
Fig.6-2: Image of MP+DFD experiment ........................................................ 60
Fig.6-3: Average result of 10 people for the MP+DFD experiment ................. 62
Fig.6-4: Variance of the data for the MP+DFD experiment ............................ 63
Fig.7-1: Separation of Ukiyoe ........................................................................ 65
Fig.7-2: Schematic diagram of displaying 3D Ukiyoe in 2 LCDs ................... 66
Fig.7-3: Schematic diagram of displaying 3D Ukiyoe in 1 LCD ..................... 67
Fig.7-4: Real pictures of Ukiyoe in two situations .......................................... 68
Fig.7-5: Result of Q1 ..................................................................................... 69
Fig.7-6: Result of Q2 ..................................................................................... 70
Fig.7-7: Result of Q3 ..................................................................................... 70
Fig.7-8: Result of Q4 ..................................................................................... 71
Fig.8-1: An idea to realize free viewpoint for our system in the future ........... 73
Fig.8-2: Image of an advanced layered 3D display system ............................. 74

8
List of tables
Table. 3-1: Speciafication contrast of transparent LCD and traditional LCD... 26
Table. 4-1: Parameters of the objects we prepared to display .......................... 37
Table. 4-2: Average results of 10 people for the MP experiment ..................... 39
Table. 4-3: ANOVA for the data of MP experiment ........................................ 42
Table. 5-1: Combinations of luminance for DFD experiment ......................... 51
Table. 5-2: Color compensation table ............................................................. 52
Table. 5-3: ANOVA for the data of DFD experiment ...................................... 55
Table. 5-4: ANOVA the situation (sum of luminance percentages is not 100%)
.................................................................................................................. 57

9
1 Introduction
1.1 Background
As computational power and the interest in 3D graphics have increased dramatically
in recent years, 3D display technology has become an attractive field [Lee, 2009].
Compared with 2D display devices, 3D display devices are considered to be able to
increase the sense of reality significantly. They are also being highly expected to
improve the easiness and accuracy in the fields of remote control, design, medical
care and so on.
Fig.1-1: 3D Prospect on 3D Industry Applicable Fields
[Kim, 2010]

10
Until now, there have been already several kinds of 3D display devices. For example,
Glasses type (Anaglyph type, polarization type, time-division type…): Observers
will wear 3D glasses and then different images will be showed into their left eye and
right eye, which will trigger 3D Perspective [Ohkoshi, 1980]. Non-glasses type
(parallax barrier type, lenticular lens type…): instead of using glasses, the display
surface will be covered by special structure which separates the light for left eye and
right eye [Travis, 1997]. Depth-sampling and multiplexing type (light source rotation
type, volumetric type…): integrating multiple layers with different depth by special
mechanical structure. Holography: creating stereopsis of high quality by recording
and releasing the light [Gabor, 1948].
However, some factors like additional devices, complex structure and high cost have
become the main reasons that why 3D display is still not being widely popularized.
Besides the impact of surprising and newness, it is still fairly difficult to apply the 3D
display into some industrial fields or even as a consumer product in normal life.
1.1.1 Summary of 3D display system
Here we make a brief summary of current main 3D display systems.
1.1.1.1 Glasses type
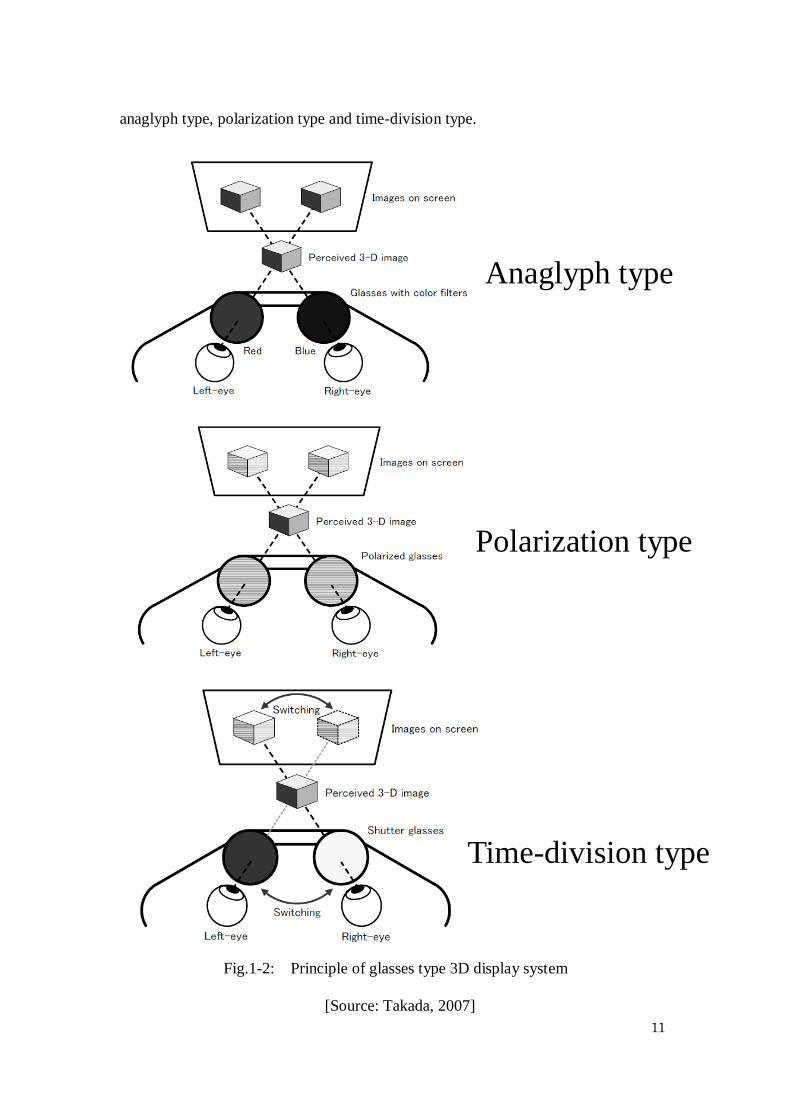
There are mainly 3 kinds of methods in glasses type. As figure1-2 shows that, they are
11
anaglyph type, polarization type and time-division type.
Fig.1-2: Principle of glasses type 3D display system
[Source: Takada, 2007]
Anaglyph type
Polarization type
Time-division type
12
Glasses type is the most popular 3D display system now. It uses one of the
physiological characteristics of human beings called binocular disparity. Binocular
disparity refers to the difference in image location of an object seen by the left and
right eyes, resulting from the eyes’ horizontal separation. The brain uses binocular
disparity to extract depth information from the two-dimensional retinal images in
stereopsis [Qian, 1997]. Observers will have to wear a pair of 3D glasses which can
separate the original images by color, polarization, or time. Through the 3D glasses,
different images into left and right eye will stimulate binocular disparity and then
create stereopsis.
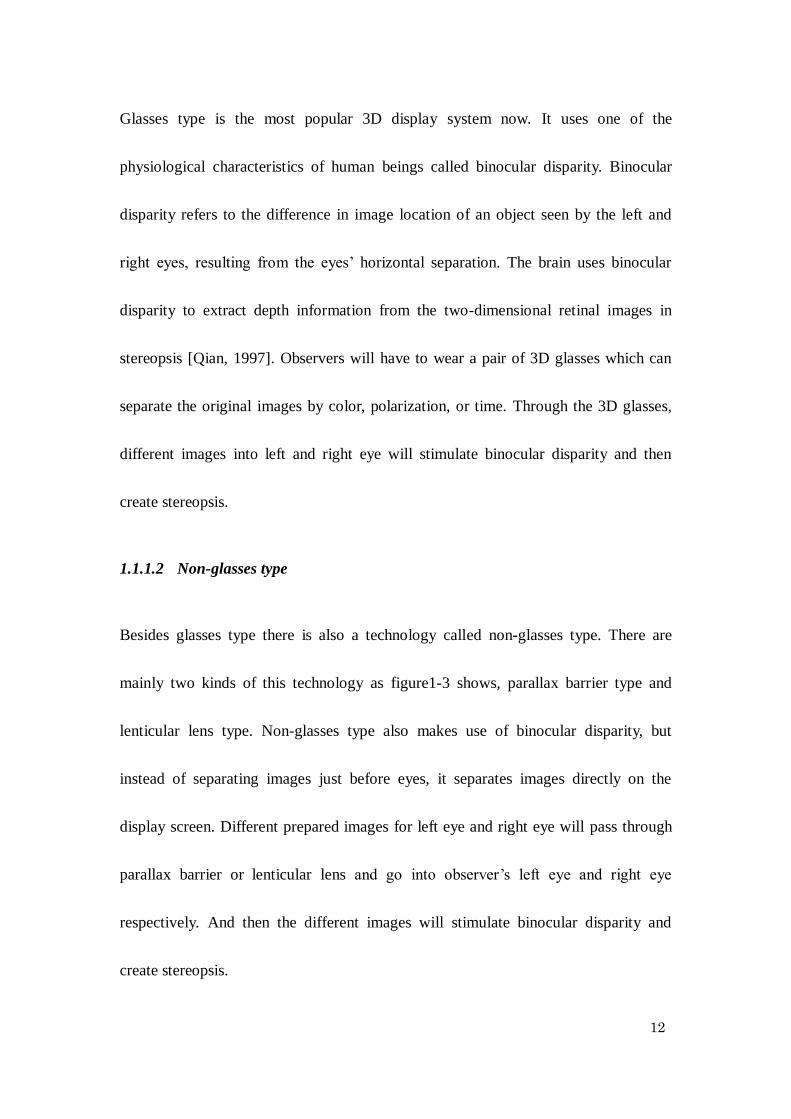
1.1.1.2 Non-glasses type
Besides glasses type there is also a technology called non-glasses type. There are
mainly two kinds of this technology as figure1-3 shows, parallax barrier type and
lenticular lens type. Non-glasses type also makes use of binocular disparity, but
instead of separating images just before eyes, it separates images directly on the
display screen. Different prepared images for left eye and right eye will pass through
parallax barrier or lenticular lens and go into observer’s left eye and right eye
respectively. And then the different images will stimulate binocular disparity and
create stereopsis.

13
Fig.1-3: Principle of non-glasses type 3D display system
[Source:http://convert-to-3d.com/blog/3d_without_glasses_the_future_of_3d_technol
ogy.html]
Depth-sampling and multiplexing type integrates multiple layers with different depth
by special mechanical structure to create 3D. Here we introduce two kinds of
depth-sampling and multiplexing types. Figure1-4 shows the light source rotation type.
Parallax barrier type
Lenticular lens type

14
Rotating light source arrays will stimulates the retention of vision and then creates 3D.
Figure1-5 shows the volumetric type. Volumetric displays create 3D imagery via the
emission, scattering, or relaying of illumination from well-defined regions in real
space.
Fig.1-5: Principle of volumetric type 3D display system
[Source: http://www.aist.go.jp/aist_e/latest_research/2006/20060210/20060210.html]
Fig.1-4: Principle of light source rotation type 3D display system
[Source: Takada, 2007]

15
1.1.1.3 Holography
Holography is said to be the ultimate method of 3D. It first records the interference
patterns of incident light and reference light. And then play the interference patterns to
create 3D. However, it seems like this technology still needs a long time to be applied.
Fig.1-6: Principle of holography type 3D display system
[Takada, 2007]
1.1.2 Problems of current 3D display system
We already have a lot of 3D display systems until now, but why 3D display is still not
being widely popularized? That is because they also have a lot of problems. For the
glasses type, we need additional device – glasses, which will increase fatigue. For the
non-glasses type, the available view point is very limited. For the depth-sampling and
multiplexing type we need a complicated mechanical structure. For the holography,
16
we still have a lot of technical restrictions and cost problems.
1.2 Purpose
Considering the problems of current 3D display systems above, we are looking
forward for a new 3D display system which can be easily used for a long time for
anyone without additional devices. And also simple structure and reasonable cost are
being expected. In this research we will try to realize these expectations by proposing
a new layered 3D display system.
Furthermore, our ultimate goal is to change the current situation that 3D device isn’t
being popularized. We are looking forward to a future that our layered 3D display
system can take the place of TV in every home and make all the people can easily
enjoy the charm of 3D.
1.3 Structure of this thesis
In chapter one, we have given a general background of this research. We have
identified the problems of current 3D display system. We also stated the general
purpose of this research.
In chapter two, we will introduce the proposal of our layered 3D display system. We
will introduce the concept of our research and the method to do it. Also we will make
a brief comparison with existed layered 3D display systems.
17
In chapter three, we will talk about the system building. We will explain the design
including both hardware and software.
In chapter four, we will conduct the first experiment, motion parallax experiment, to
explore whether or in what way our system can change the ability to convey depth
perception through this method.
In chapter five, we will do the second experiment, Depth-fused 3D experiment, to
verify the phenomenon of DFD in our system and then explore how the depth
perception will be changed by using DFD in a quantitative way.
In chapter six, we will integrate motion parallax and Depth-fused 3D and explore how
these two methods can make contributions to the 3D performance of our system
together.
In chapter seven, we will give out an example by using the two methods we have
verified in the above chapters. We will use the famous Japanese painting “Ukiyoe” as
our content and collect the feedback from experimenters.
In chapter eight, we will make discussion about the insufficient part of this research
and the future issues.
Lastly in chapter nine, we will recap the results of this research once again and make
a conclusion of this research.
18
2 Proposal
2.1 Concept of this research
We got an inspiration for 3D display research from a brand-new technology which is
called transparent LCD. Transparent LCD is a new type LCD which you can not only
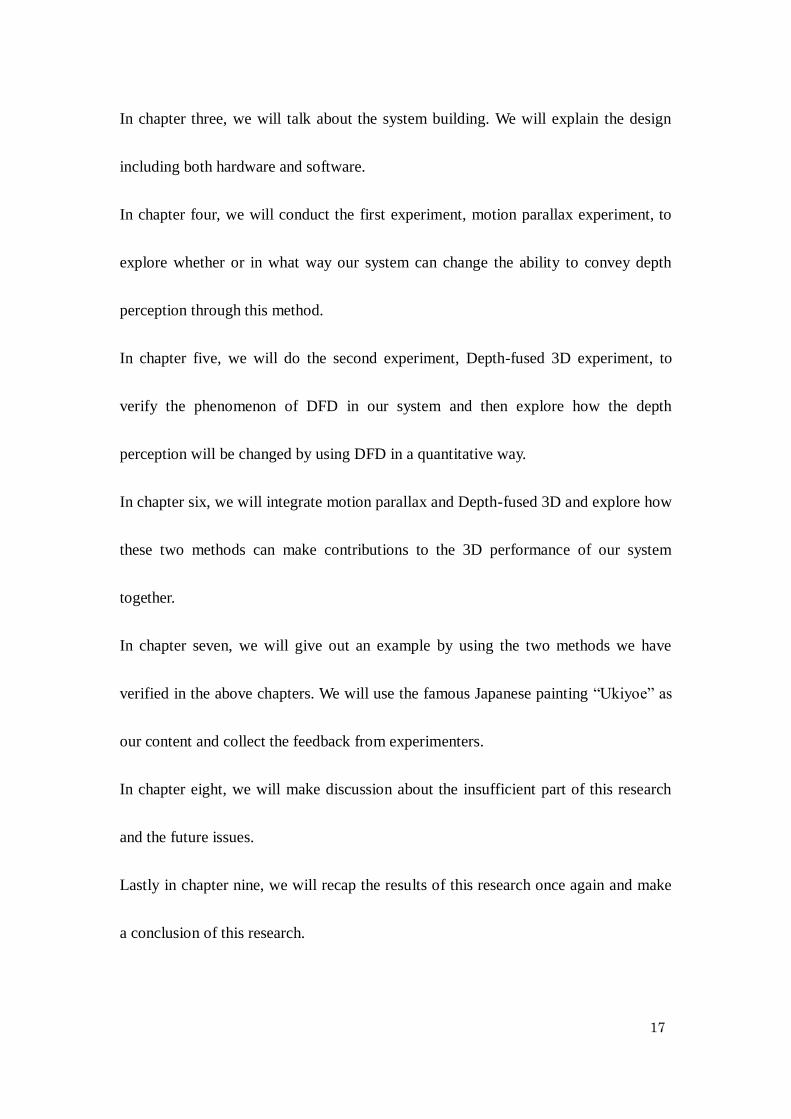
use it as the traditional LCD but also you can see through it. Figure2-1 shows an
example of transparent LCD. Samsung, the giant in the electronic field claimed that
they had begun the mass production of transparent LCD in 2012. It makes the cost of
transparent LCD be decreasing. Based on the decreasing cost and exclusive
transparent function, Display Bank, a display researching organization, has published
a market forecast of transparent LCD which shows it will be highly probable for the
transparent LCD to bring a huge market in recent years.
Fig.2-1: Image of Transparent LCD
[Source: http://fringeskill.blogspot.jp/2011/11/samsung-transparent-lcd-panels-we-see.html]
19
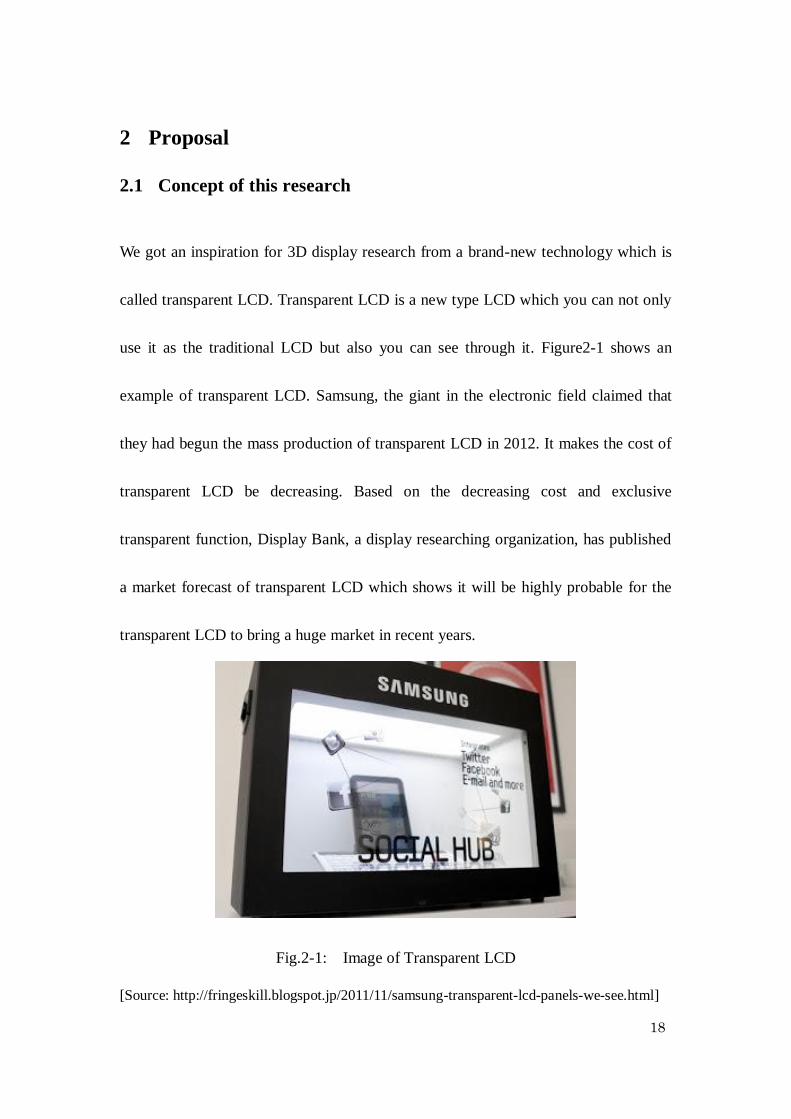
Fig.2-2: Transparent LCD market forecast
[Source: Display Bank, 2011]
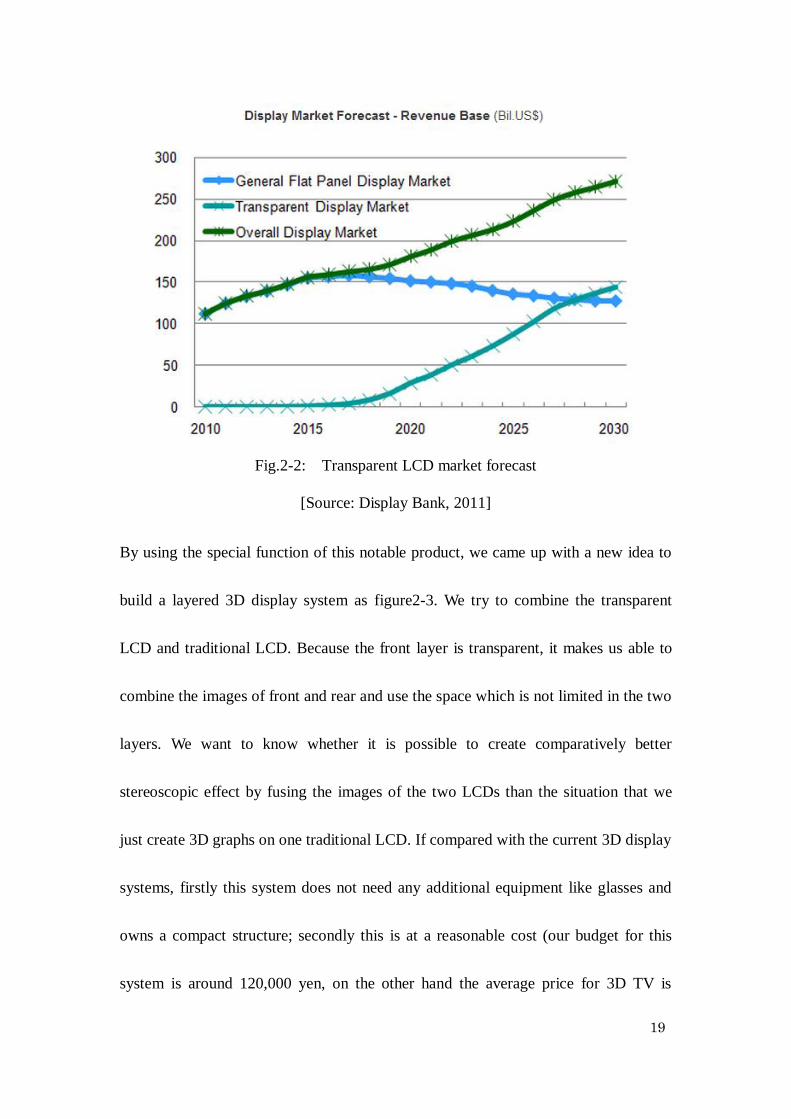
By using the special function of this notable product, we came up with a new idea to
build a layered 3D display system as figure2-3. We try to combine the transparent
LCD and traditional LCD. Because the front layer is transparent, it makes us able to
combine the images of front and rear and use the space which is not limited in the two
layers. We want to know whether it is possible to create comparatively better
stereoscopic effect by fusing the images of the two LCDs than the situation that we
just create 3D graphs on one traditional LCD. If compared with the current 3D display
systems, firstly this system does not need any additional equipment like glasses and
owns a compact structure; secondly this is at a reasonable cost (our budget for this
system is around 120,000 yen, on the other hand the average price for 3D TV is
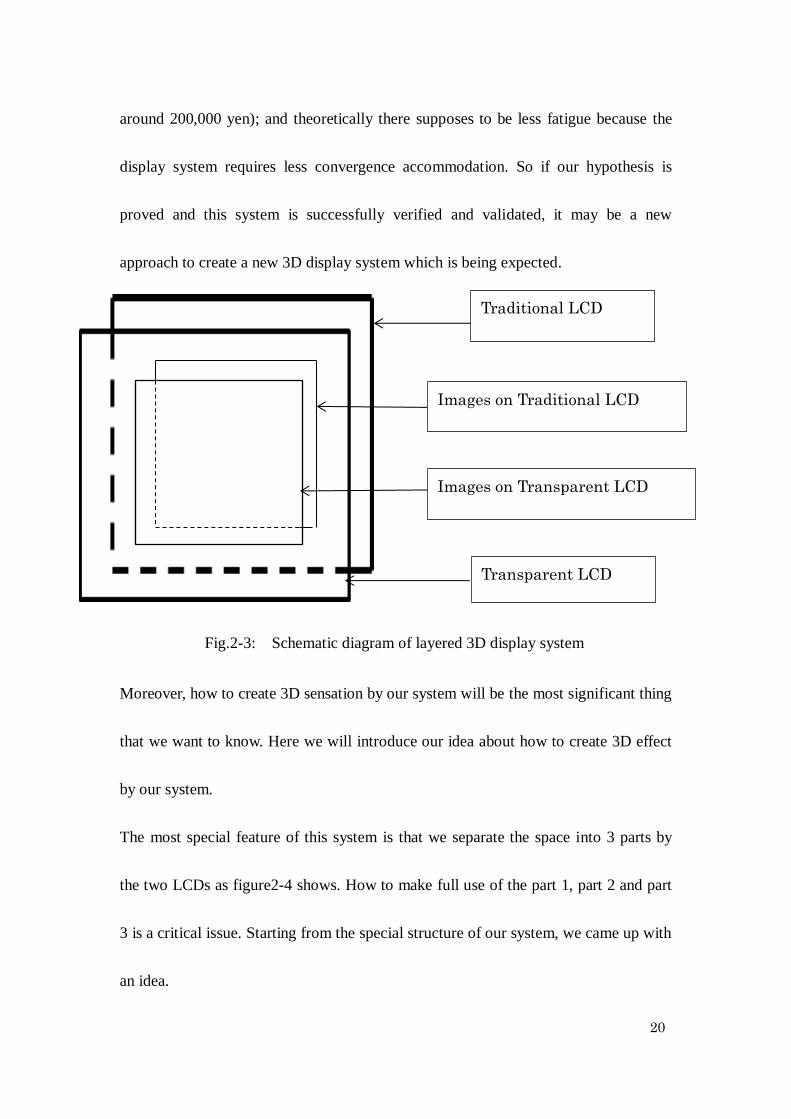
20
around 200,000 yen); and theoretically there supposes to be less fatigue because the
display system requires less convergence accommodation. So if our hypothesis is
proved and this system is successfully verified and validated, it may be a new
approach to create a new 3D display system which is being expected.
Moreover, how to create 3D sensation by our system will be the most significant thing
that we want to know. Here we will introduce our idea about how to create 3D effect
by our system.
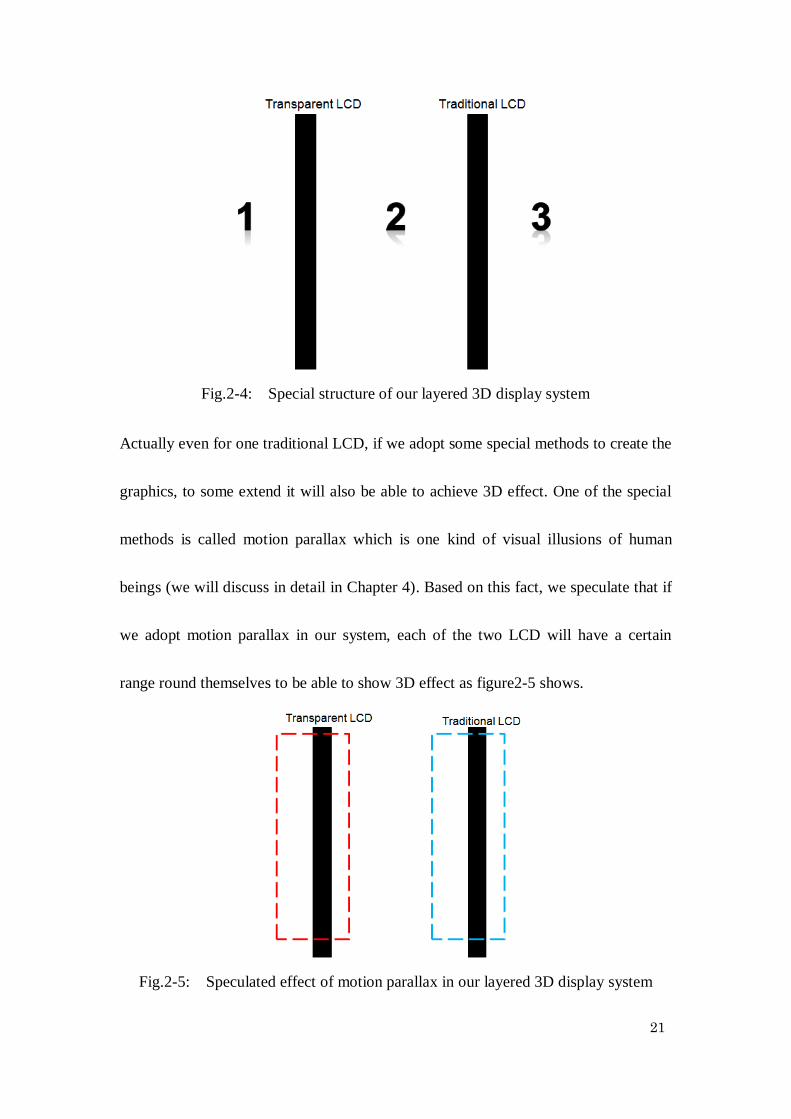
The most special feature of this system is that we separate the space into 3 parts by
the two LCDs as figure2-4 shows. How to make full use of the part 1, part 2 and part
3 is a critical issue. Starting from the special structure of our system, we came up with
an idea.
Traditional LCD
Transparent LCD
Images on Traditional LCD
Images on Transparent LCD
Fig.2-3: Schematic diagram of layered 3D display system
21
Fig.2-4: Special structure of our layered 3D display system
Actually even for one traditional LCD, if we adopt some special methods to create the
graphics, to some extend it will also be able to achieve 3D effect. One of the special
methods is called motion parallax which is one kind of visual illusions of human
beings (we will discuss in detail in Chapter 4). Based on this fact, we speculate that if
we adopt motion parallax in our system, each of the two LCD will have a certain
range round themselves to be able to show 3D effect as figure2-5 shows.
Fig.2-5: Speculated effect of motion parallax in our layered 3D display system
22
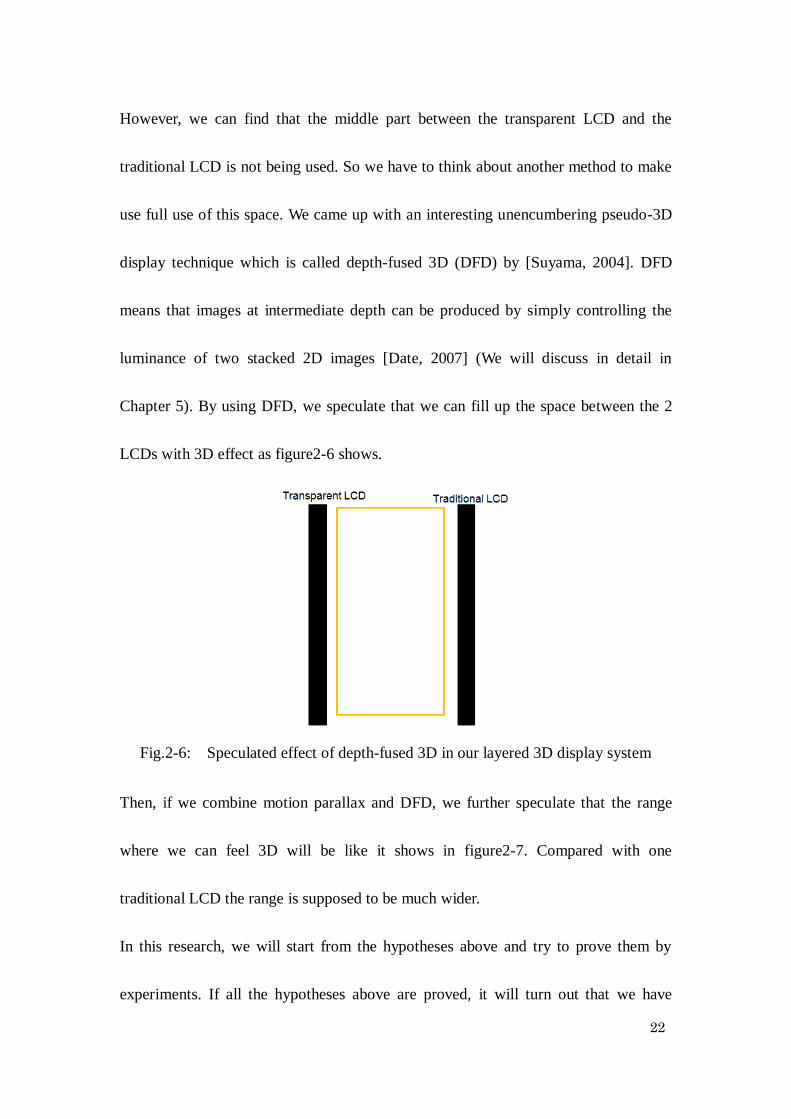
However, we can find that the middle part between the transparent LCD and the
traditional LCD is not being used. So we have to think about another method to make
use full use of this space. We came up with an interesting unencumbering pseudo-3D
display technique which is called depth-fused 3D (DFD) by [Suyama, 2004]. DFD
means that images at intermediate depth can be produced by simply controlling the
luminance of two stacked 2D images [Date, 2007] (We will discuss in detail in
Chapter 5). By using DFD, we speculate that we can fill up the space between the 2
LCDs with 3D effect as figure2-6 shows.
Fig.2-6: Speculated effect of depth-fused 3D in our layered 3D display system
Then, if we combine motion parallax and DFD, we further speculate that the range
where we can feel 3D will be like it shows in figure2-7. Compared with one
traditional LCD the range is supposed to be much wider.
In this research, we will start from the hypotheses above and try to prove them by
experiments. If all the hypotheses above are proved, it will turn out that we have
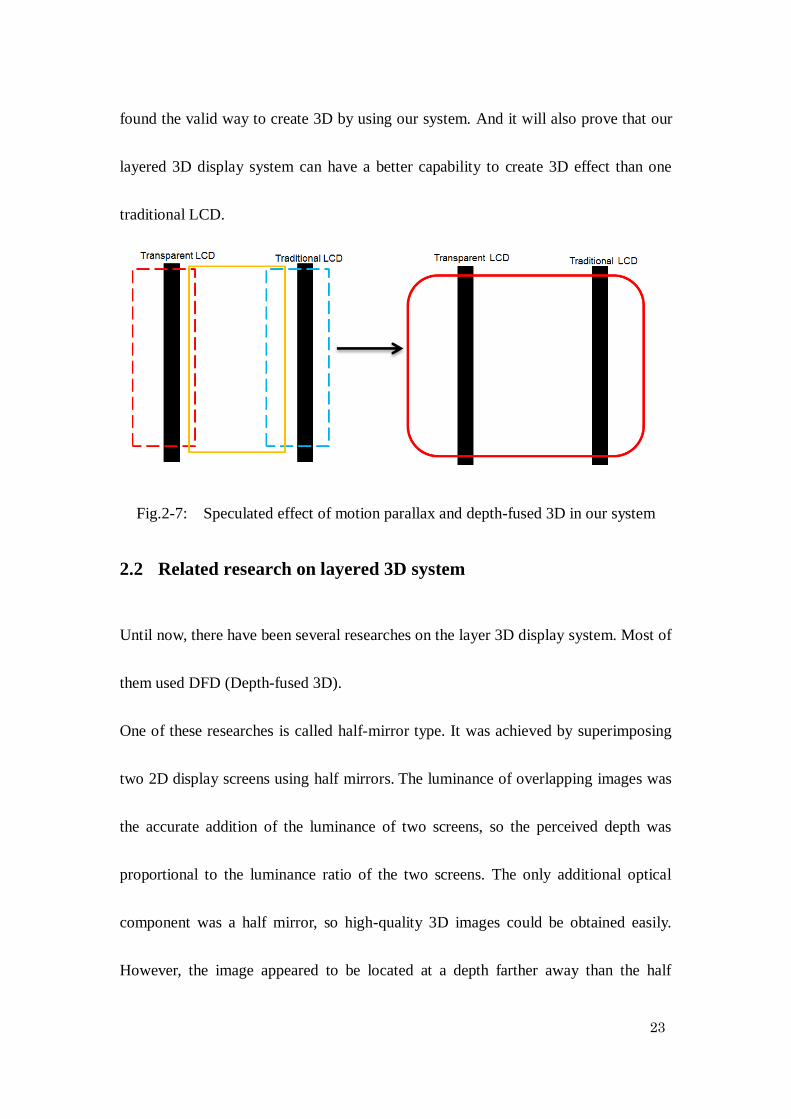
23
found the valid way to create 3D by using our system. And it will also prove that our
layered 3D display system can have a better capability to create 3D effect than one
traditional LCD.
Fig.2-7: Speculated effect of motion parallax and depth-fused 3D in our system
2.2 Related research on layered 3D system
Until now, there have been several researches on the layer 3D display system. Most of
them used DFD (Depth-fused 3D).
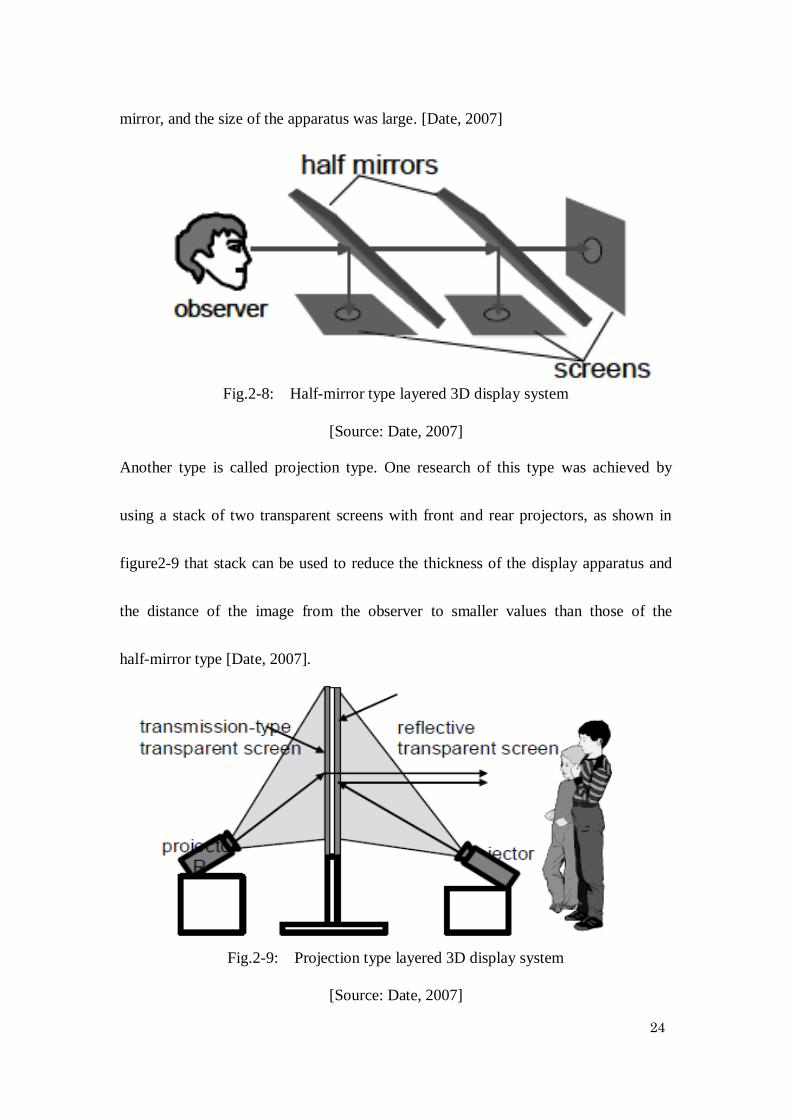
One of these researches is called half-mirror type. It was achieved by superimposing
two 2D display screens using half mirrors. The luminance of overlapping images was
the accurate addition of the luminance of two screens, so the perceived depth was
proportional to the luminance ratio of the two screens. The only additional optical
component was a half mirror, so high-quality 3D images could be obtained easily.
However, the image appeared to be located at a depth farther away than the half
24
mirror, and the size of the apparatus was large. [Date, 2007]
Fig.2-8: Half-mirror type layered 3D display system
[Source: Date, 2007]
Another type is called projection type. One research of this type was achieved by
using a stack of two transparent screens with front and rear projectors, as shown in
figure2-9 that stack can be used to reduce the thickness of the display apparatus and
the distance of the image from the observer to smaller values than those of the
half-mirror type [Date, 2007].
Fig.2-9: Projection type layered 3D display system
[Source: Date, 2007]
25
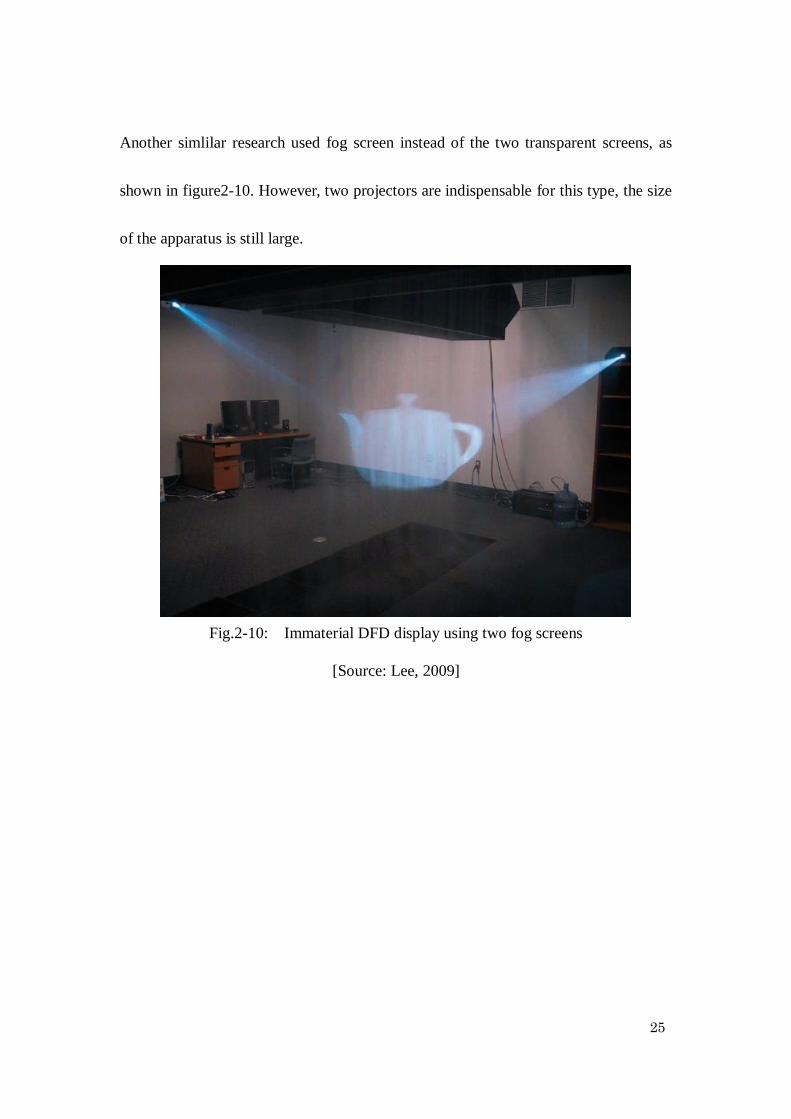
Another simlilar research used fog screen instead of the two transparent screens, as
shown in figure2-10. However, two projectors are indispensable for this type, the size
of the apparatus is still large.
Fig.2-10: Immaterial DFD display using two fog screens
[Source: Lee, 2009]

26
3 System building
3.1 Hardware design
We chose the 22 inches transparent LCD (Samsung) and the traditional LCD (HP
2209t). Table3-1 is a simple contrast of their specifications.
Table. 3-1: Speciafication contrast of transparent LCD and traditional LCD
Specification Transparent LCD
(Samsung)
Traditional LCD
(HP 2209t)
Module Size 22 inches 21.5 inches
Weight 1.3kg 6.4kg
Pixel Pitch 0.282mm 0.250mm
Display Colors 16.7M 1677M
Numbers of Pixels 1680*1050 1920*1080
Fig.3-1: Real image of transparent LCD and traditional LCD

27
We built a frame to fix these two LCDs and also added some lighting equipment. The
transparent LCD is in the front and the traditional one is at the back. Figure 3-3, figure
3-4 and figure 3-5 show the front view, top view and side view of this system.
Fig.3-3: Front view of our system
Fig.3-2: Top view of our system

28
Fig.3-4: Side view of our system
Because of the polarization, actually we cannot see the back LCD through the front
transparent LCD. So in order to solve this problem, we added a kind of plastic
material to break the polarization and make it possible to see through the front LCD to
the back LCD. Figure3-5 shows the polarization phenomenon.
Fig.3-5: Polarization phenomenon
29
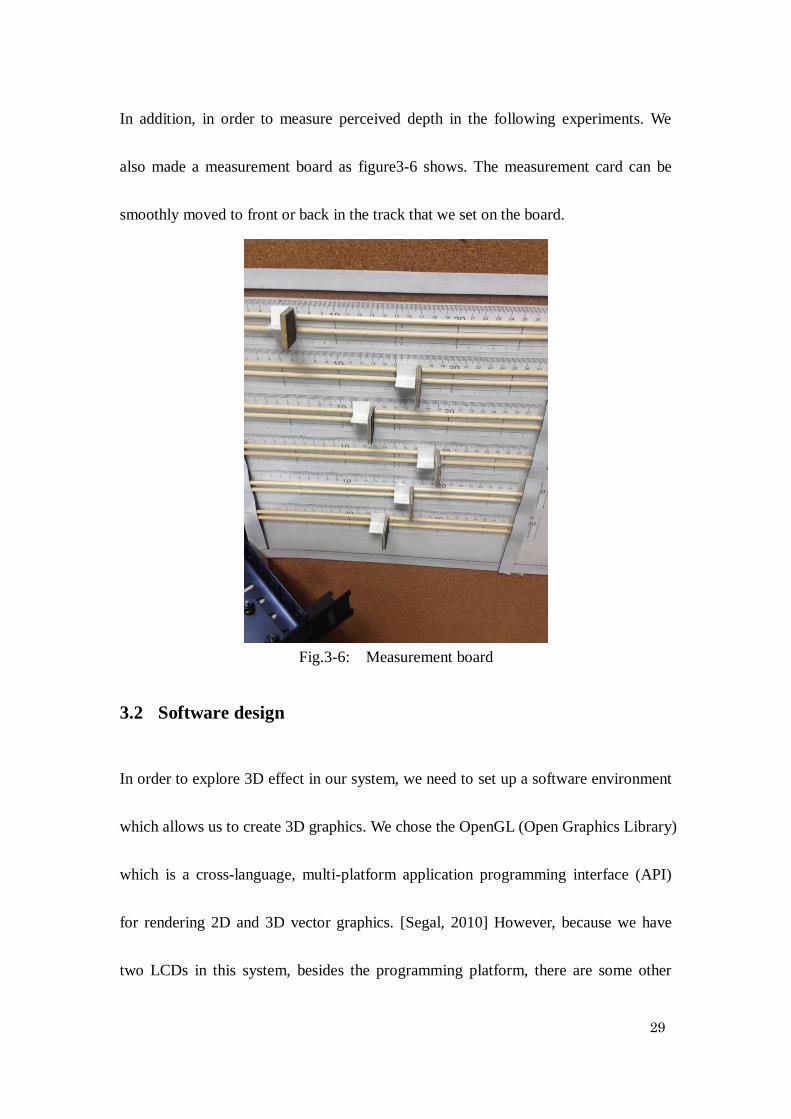
In addition, in order to measure perceived depth in the following experiments. We
also made a measurement board as figure3-6 shows. The measurement card can be
smoothly moved to front or back in the track that we set on the board.
Fig.3-6: Measurement board
3.2 Software design
In order to explore 3D effect in our system, we need to set up a software environment
which allows us to create 3D graphics. We chose the OpenGL (Open Graphics Library)
which is a cross-language, multi-platform application programming interface (API)
for rendering 2D and 3D vector graphics. [Segal, 2010] However, because we have
two LCDs in this system, besides the programming platform, there are some other
30
problems that we have to consider.
We have to make sure that from the front view no matter the situation we only watch
at one traditional LCD or the situation we watch trough the transparent LCD to the
traditional LCD in our system, the pattern, the size, the location and the movement of
the images should be completely the same.
To make sure this, the first problem we have to solve is the desynchronization. When
we display on two LCDs, we actually input the signals by two channels. If we use two
different PCs to offer the input signals, because of the different specifications the
desynchronization seems to be hardly avoided. We made it possible to output two
viewports from one application using one PC, which eliminated the problem of
desynchronization.
Another significant problem is that we have to keep the location and size unchanged
(when seen from the front). By using the function called glFrustum() in OpenGL,
which produces a perspective projection, we made it possible to draw objects which
are with the real world coordinates in our system. Simply speaking, by using
glFrustum(), we can simulate the movement of an object of real size and at real
location. The size we see on the LCD will be totally the same as the objects in real
world coordinates.
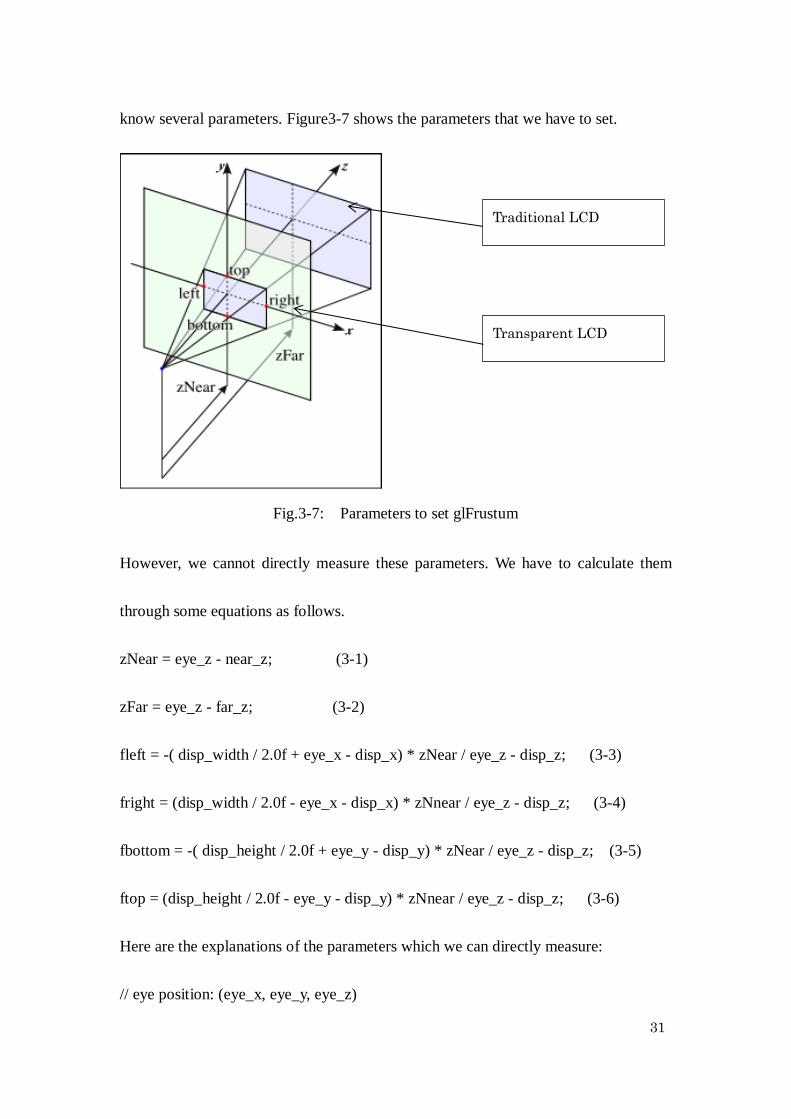
To set the function of glFrustum (fleft, fright, fbottom, ftop, zNear, zFar), we need to
31
know several parameters. Figure3-7 shows the parameters that we have to set.
Fig.3-7: Parameters to set glFrustum
However, we cannot directly measure these parameters. We have to calculate them
through some equations as follows.
zNear = eye_z - near_z; (3-1)
zFar = eye_z - far_z; (3-2)
fleft = -( disp_width / 2.0f + eye_x - disp_x) * zNear / eye_z - disp_z; (3-3)
fright = (disp_width / 2.0f - eye_x - disp_x) * zNnear / eye_z - disp_z; (3-4)
fbottom = -( disp_height / 2.0f + eye_y - disp_y) * zNear / eye_z - disp_z; (3-5)
ftop = (disp_height / 2.0f - eye_y - disp_y) * zNnear / eye_z - disp_z; (3-6)
Here are the explanations of the parameters which we can directly measure:
// eye position: (eye_x, eye_y, eye_z)
Traditional LCD
Transparent LCD
32
// center of the display: (disp_x, disp_y, disp_z)
// real size of the display(viewport): disp_width, disp_height
// z value of transparent LCD: near_z
// z value of traditional LCD: far_z
What we have to do to set the function glFrustum() is just to measure the parameters
above and fill the configuration table below. Here we give an example of our
configuration table.
// ==================================================
// configuration
// --------------------------------------------------
#define WINDOW_WIDTH 3350
#define WINDOW_HEIGHT 1010
// eye position in global coordinate system (cm)
#define EYE_X 0.0f
#define EYE_Y 0.0f
#define EYE_Z 212.0f
// --------------------------------------------------
// display 1: normal LCD
// --------------------------------------------------
#define VIEWPORT1_X_PIXEL 0
#define VIEWPORT1_Y_PIXEL 0
#define VIEWPORT1_WIDTH_PIXEL 1665
#define VIEWPORT1_HEIGHT_PIXEL 1100
// real size of display1 (cm)
33
#define DISPLAY1_WIDTH 47.0f
#define DISPLAY1_HEIGHT 26.2f
// display1 center position in global coordinate system (cm)
#define DISPLAY1_X 0.0f
#define DISPLAY1_Y 0.0f
#define DISPLAY1_Z 0.0f
#define DISPLAY1_NEAR_Z (DISPLAY1_Z + DEFAULT_FRUSTUM_NEAR_Z)
#define DISPLAY1_FAR_Z (DISPLAY1_Z + DEFAULT_FRUSTUM_FAR_Z)
// --------------------------------------------------
// display 2: transparent LCD
// --------------------------------------------------
#define VIEWPORT2_X_PIXEL 1675
#define VIEWPORT2_Y_PIXEL 0
#define VIEWPORT2_WIDTH_PIXEL 1675
#define VIEWPORT2_HEIGHT_PIXEL 1100
// real size of display2 (cm)
#define DISPLAY2_WIDTH 47.2f
#define DISPLAY2_HEIGHT 29.5f
// display2 center position in global coordinate system (cm)
#define DISPLAY2_X 0.0f
#define DISPLAY2_Y -0.4f
#define DISPLAY2_Z 6.0f
#define DISPLAY2_NEAR_Z (DISPLAY2_Z + DEFAULT_FRUSTUM_NEAR_Z)
#define DISPLAY2_FAR_Z (DISPLAY2_Z + DEFAULT_FRUSTUM_FAR_Z)
Until now, we have successfully set up a software environment which allows us to
create 3D graphics in our system.
34
4 Motion parallax (MP) experiment
4.1 Experimental purpose (MP)
By using motion parallax which is one of the methods to create 3D sensation, we try
to measure and compare the depth perceptions in the situation of one LCD and the
situation of two LCDs to explore that comparing with one traditional LCD, whether or
in what way our system can change the ability to convey depth perception. In
additional to that, we also want to explore that which is the best interval for the
transparent LCD and traditional LCD.
4.2 Experimental principle (MP)
Motion Parallax means as the viewpoint moves side to side, the objects in the distance
appear to move slower than the objects close to our eyes [Yokozawa, 2010]. Because
of the relativity, inversely if our viewpoint keeps static and we make the objects
which have different distances from our eyes move at the same speed, we can still feel
the objects in the distance appear to move slower than the objects close to our eyes.
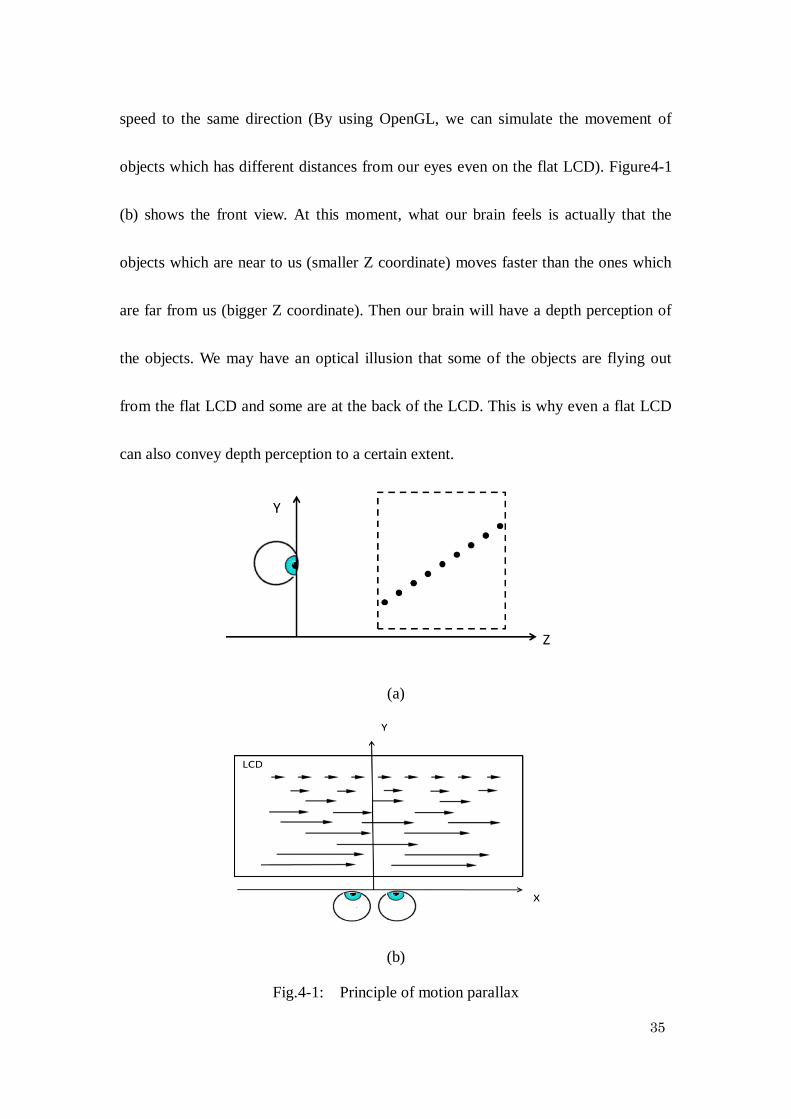
As a result, by using the principle of motion parallax, actually even one simple
traditional LCD can also convey a certain depth perception. For example, in Figure
4-1 we simulate the motion parallax. Figure4-1 (a) shows the side view. We draw
several rows of objects with different Z coordinates and give them the same moving
35
speed to the same direction (By using OpenGL, we can simulate the movement of
objects which has different distances from our eyes even on the flat LCD). Figure4-1
(b) shows the front view. At this moment, what our brain feels is actually that the
objects which are near to us (smaller Z coordinate) moves faster than the ones which
are far from us (bigger Z coordinate). Then our brain will have a depth perception of
the objects. We may have an optical illusion that some of the objects are flying out
from the flat LCD and some are at the back of the LCD. This is why even a flat LCD
can also convey depth perception to a certain extent.
(a)
(b)
Fig.4-1: Principle of motion parallax

36
So, what about our system? Compared with one traditional LCD, can our system have
better performance? We will introduce the details of experiment in the following
section.
4.3 Experimental procedure (MP)
4.3.1 Preparation (MP)
Figure4-2 shows the schematic of our experiment. In situation 1 we display some
black rectangles only on the rear traditional LCD. Each line of these rectangles has
different Z coordinate. In the situation 2, we separate the original rectangles into two
groups. We display one group with smaller z coordinates (back 3 layers) on the
Fig.4-2: Schematic of motion parallax experiment
37
traditional LCD and another group with bigger coordinates (front 3 layers) on the
transparent LCD. For both situation 1 and situation 2, we make all the rectangles do
the horizontal moving at the same speed.
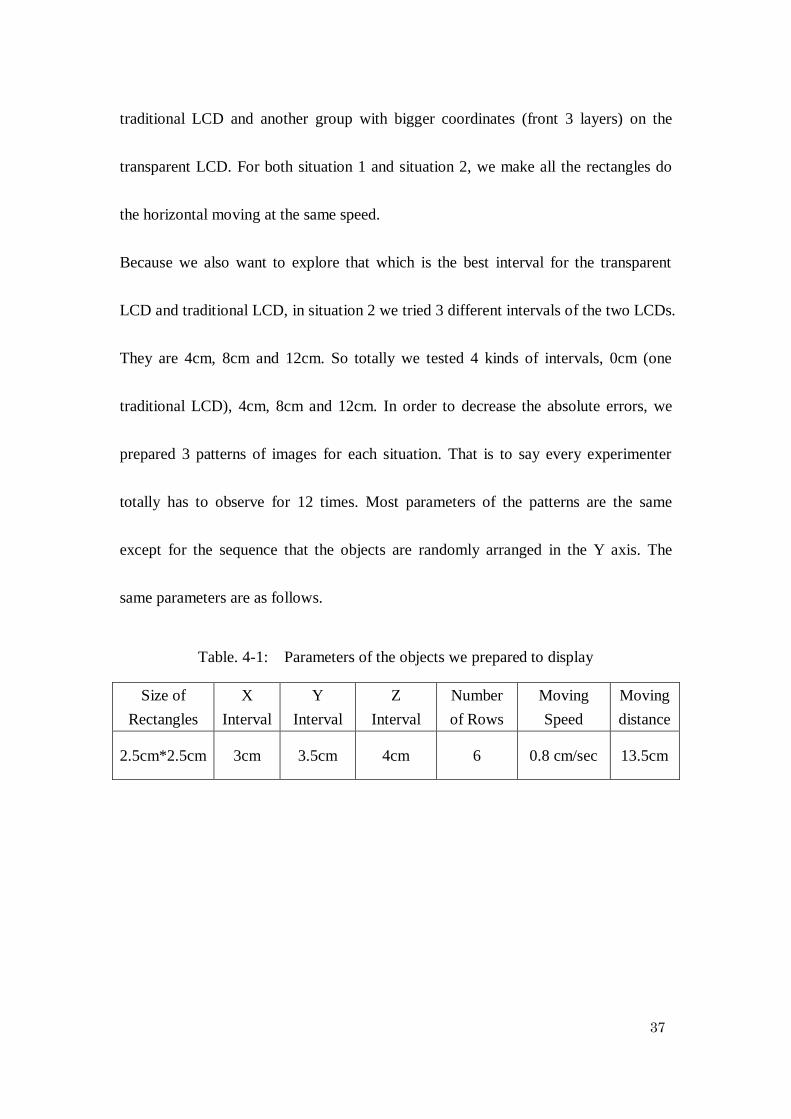
Because we also want to explore that which is the best interval for the transparent
LCD and traditional LCD, in situation 2 we tried 3 different intervals of the two LCDs.
They are 4cm, 8cm and 12cm. So totally we tested 4 kinds of intervals, 0cm (one
traditional LCD), 4cm, 8cm and 12cm. In order to decrease the absolute errors, we
prepared 3 patterns of images for each situation. That is to say every experimenter
totally has to observe for 12 times. Most parameters of the patterns are the same
except for the sequence that the objects are randomly arranged in the Y axis. The
same parameters are as follows.
Table. 4-1: Parameters of the objects we prepared to display
Size of
Rectangles
X
Interval
Y
Interval
Z
Interval
Number
of Rows
Moving
Speed
Moving
distance
2.5cm*2.5cm 3cm 3.5cm 4cm 6 0.8 cm/sec 13.5cm

38
4.3.2 Execution (MP)
Fig.4-3: Scene of motion parallax experiment
Figure4-3 shows the scene of motion parallax experiment. The experimenter sat on
the chair in a certain position and put his jaw on the edge of the top part of a tripod
which is also fixed in a certain position (2m from the front LCD). Ask him to watch at
our system. Then show him the card we prepared and tell him there will be a lot of
rectangles which has the same size of this card moving in our system.
Alternately we changed the intervals of two LCDs with the movable track, display the
whole images just on the traditional LCD and then separated images on both
traditional LCD and transparent LCD correspondently. At the same time, we used the
measurement board that we mentioned in section 3.1 to measure experimenters’ depth
perception. The measurement card can be smoothly moved to front or back in the
track that we set on the board. We moved the card in the first row to different
39
positions in the Z direction. Ask the experimenter at which point he can feel the card
is at the same depth with the first row of our rectangles. When the position was
decided we retain our card in that position. Then pick up another card and move to the
next row below. Finally we recorded the positions of 6 cards.
4.4 Experimental result (MP)
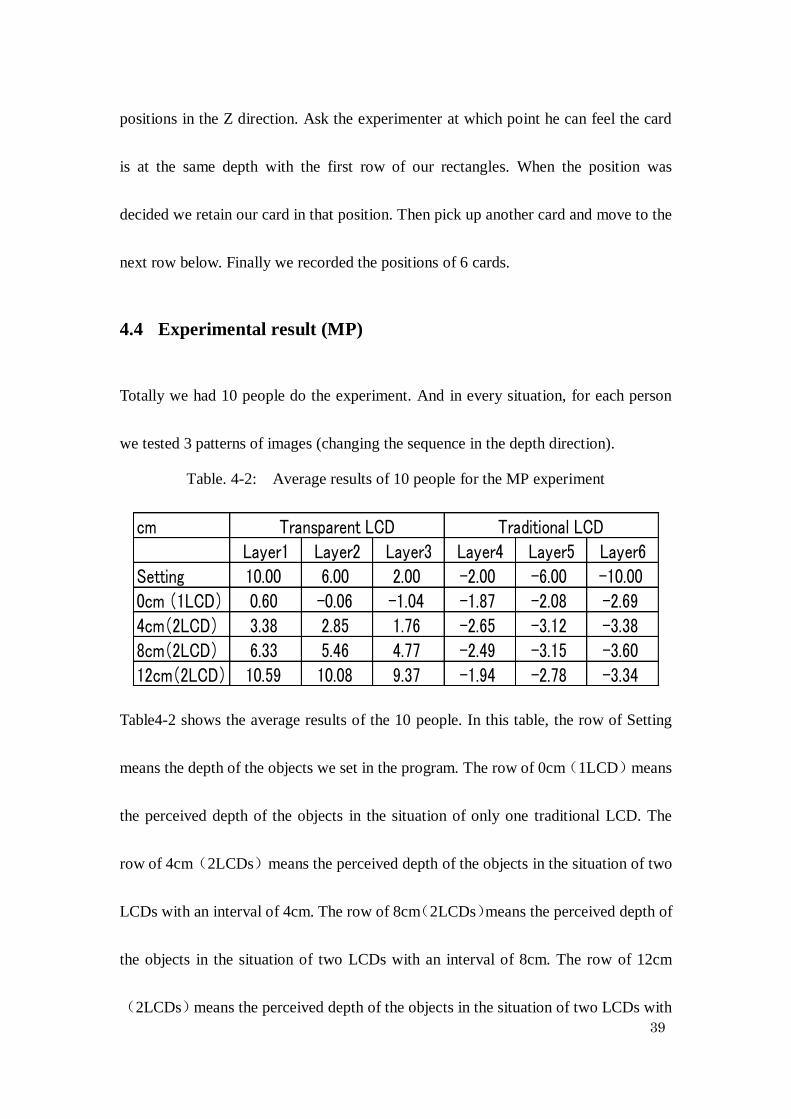
Totally we had 10 people do the experiment. And in every situation, for each person
we tested 3 patterns of images (changing the sequence in the depth direction).
Table. 4-2: Average results of 10 people for the MP experiment
Table4-2 shows the average results of the 10 people. In this table, the row of Setting
means the depth of the objects we set in the program. The row of 0cm(1LCD)means
the perceived depth of the objects in the situation of only one traditional LCD. The
row of 4cm(2LCDs)means the perceived depth of the objects in the situation of two
LCDs with an interval of 4cm. The row of 8cm(2LCDs)means the perceived depth of
the objects in the situation of two LCDs with an interval of 8cm. The row of 12cm
(2LCDs)means the perceived depth of the objects in the situation of two LCDs with
cmLayer1 Layer2 Layer3 Layer4 Layer5 Layer6
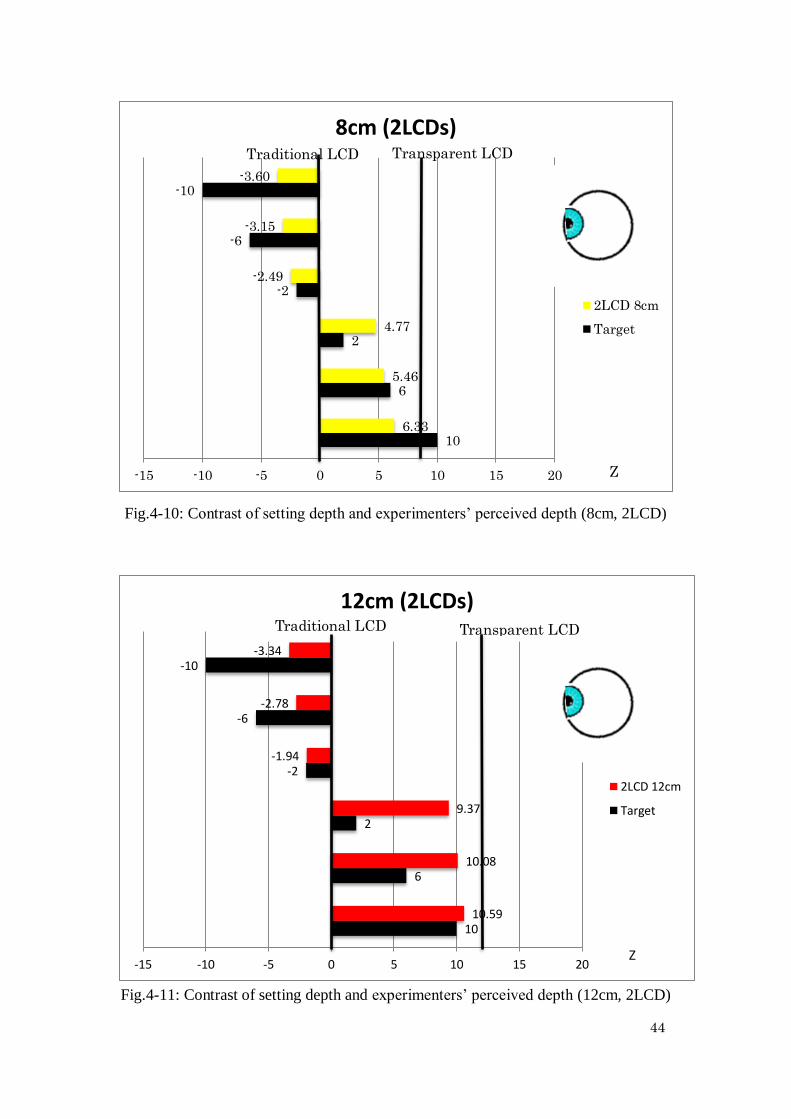
Setting 10.00 6.00 2.00 -2.00 -6.00 -10.000cm (1LCD) 0.60 -0.06 -1.04 -1.87 -2.08 -2.694cm(2LCD) 3.38 2.85 1.76 -2.65 -3.12 -3.388cm(2LCD) 6.33 5.46 4.77 -2.49 -3.15 -3.6012cm(2LCD) 10.59 10.08 9.37 -1.94 -2.78 -3.34
Transparent LCD Traditional LCD

40
Fig.4-4: Variance of data for 0cm (1LCD)
Fig.4-5: Variance of data for 4cm (2LCD)
Fig.4-6: Variance of data for 8cm (2LCD)
-12.00 -7.00 -2.00 3.00 8.00 13.00
1
2
3
4
5
6
Variance of data for
0cm(1LCD)
-12.00 -7.00 -2.00 3.00 8.00 13.00
1
2
3
4
5
6
Variance of data for
4cm(2LCDs)
-12.00 -7.00 -2.00 3.00 8.00 13.00
1
2
3
4
5
6
Variance of data for
8cm(2LCDs)

41
Fig.4-7: Variance of data for 12cm (2LCD)
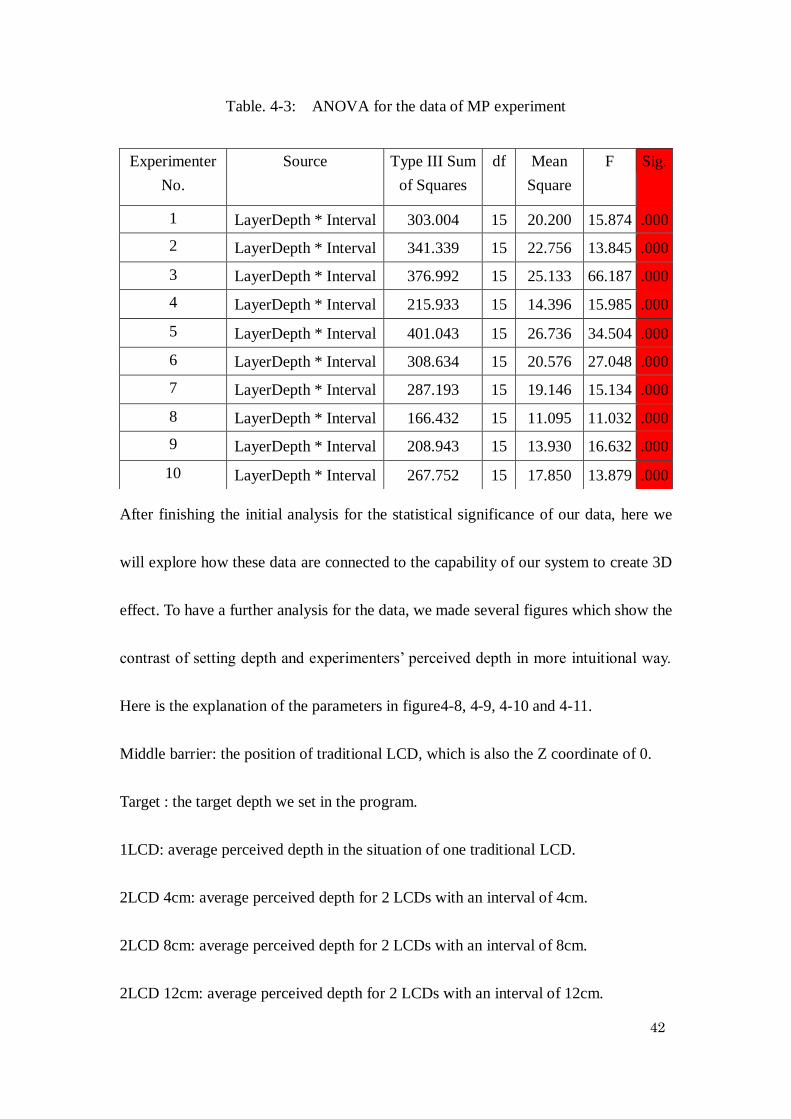
an interval of 12cm. Figure4-4, 4-5, 4-6 and 4-7 show the variance for each situation.
Since this experiment is based on the perception of different people, we can find from
figure4-4, 4-5, 4-6 and 4-7 that the variance is not so stable. As a result, before we
start the further analysis of these data, we should first make sure the significance level
of our data. We held analysis of variance (ANOVA) test for everyone’s data and got
the result which is showed in table4-3. In table4-3 , it shows that for every
experimenter, the significance level (Sig) is under 0.05. It is indicated that there is
statistical significance in the 4 groups of data for 0cm(1LCD), 4cm(2LCDs), 8cm
(2LCDs), 12cm(2LCDs), which proves that in our system different interval has
different influence on the experimenters’ perceived depth.
-12.00 -7.00 -2.00 3.00 8.00 13.00
1
2
3
4
5
6
Variance of data for
12cm(2LCDs)
42
Table. 4-3: ANOVA for the data of MP experiment
After finishing the initial analysis for the statistical significance of our data, here we
will explore how these data are connected to the capability of our system to create 3D
effect. To have a further analysis for the data, we made several figures which show the
contrast of setting depth and experimenters’ perceived depth in more intuitional way.
Here is the explanation of the parameters in figure4-8, 4-9, 4-10 and 4-11.
Middle barrier: the position of traditional LCD, which is also the Z coordinate of 0.
Target : the target depth we set in the program.
1LCD: average perceived depth in the situation of one traditional LCD.
2LCD 4cm: average perceived depth for 2 LCDs with an interval of 4cm.
2LCD 8cm: average perceived depth for 2 LCDs with an interval of 8cm.
2LCD 12cm: average perceived depth for 2 LCDs with an interval of 12cm.
Experimenter
No.
Source Type III Sum
of Squares
df Mean
Square
F Sig.
1 LayerDepth * Interval 303.004 15 20.200 15.874 .000
2 LayerDepth * Interval 341.339 15 22.756 13.845 .000
3 LayerDepth * Interval 376.992 15 25.133 66.187 .000
4 LayerDepth * Interval 215.933 15 14.396 15.985 .000
5 LayerDepth * Interval 401.043 15 26.736 34.504 .000
6 LayerDepth * Interval 308.634 15 20.576 27.048 .000
7 LayerDepth * Interval 287.193 15 19.146 15.134 .000
8 LayerDepth * Interval 166.432 15 11.095 11.032 .000
9 LayerDepth * Interval 208.943 15 13.930 16.632 .000
10 LayerDepth * Interval 267.752 15 17.850 13.879 .000

43
Fig.4-8: Contrast of setting depth and experimenters’ perceived depth (0cm, 1LCD)
Fig.4-9: Contrast of setting depth and experimenters’ perceived depth (4cm, 2LCD)
10
6
2
-2
-6
-10
3.38
2.85
1.76
-2.65
-3.12
-3.38
-15 -10 -5 0 5 10 15 20
4cm (2LCDs)
2LCD 4cm
Target
Traditional LCD Transparent LCD
Z
44
Fig.4-10: Contrast of setting depth and experimenters’ perceived depth (8cm, 2LCD)
Fig.4-11: Contrast of setting depth and experimenters’ perceived depth (12cm, 2LCD)
10
6
2
-2
-6
-10
6.33
5.46
4.77
-2.49
-3.15
-3.60
-15 -10 -5 0 5 10 15 20
8cm (2LCDs)
2LCD 8cm
Target
Traditional LCD Transparent LCD
Z
10
6
2
-2
-6
-10
10.59
10.08
9.37
-1.94
-2.78
-3.34
-15 -10 -5 0 5 10 15 20
12cm (2LCDs)
2LCD 12cm
Target
Z
Traditional LCD Transparent LCD
45
Figure4-8 shows the situation of only traditional LCD. Through figure4-8, we can
find that compared with the setting range of depth, the range of depth that the
experimenter perceived is much more narrow. It indicates that even though one LCD
can convey a certain depth perception, but it is limited. Another interesting
phenomenon we find from figure4-8 is that there are 5 layers which we feel them
going backward the trditional LCD. And among these 5 layers, there are actually 2
layers which we set should be in front of the traditional LCD. It seems like instead of
feeling the object flying out from the LCD, the feeling of moving backward is much
stronger.
Figure4-9, 4-10, 4-11 show the situation of two LCDs. We can find that in the
situations of two LCDs, objects are perceived to be in some new positions which are
not perceived in the situation of one LCD. And if you pay attention to the front 3
layers, you will find in these situations they are all perceived to be in front of the
traditional LCD. It means by using two LCDs, we can make the objects which we
thought should be at the back of the traditional LCD in situation of one LCD to fly out
to new positions. However, if we compare the front 3 layers in figure4-9, figure4-10
figure4-11 with the transparent LCD correspondingly. We can figure out that in the 3
situations of two LCDs, all the front 3 layers are perceived backward to the
transparent LCD. It seems like even for the transparent LCD, the feeling of moving

46
backward is also much stronger.
Another important point is that if we compare the ranges of the depth we perceived in
the situations of two LCDs, you can apparently find the ranges in the situation of two
LCDs are much bigger than situation of one LCD. This indicates that the perceived
range of depth was expanded by two LCDs. It can be a significant support for that our
system can enhance the capability of conveying depth perception comparing with one
traditional LCD.
Fig.4-12: Contrast of the 4 situations in MP experiment
Figure4-12 shows the contrast of the 4 situations, and the correlation coefficients of
perceived depth and setting depth in the 3 situations of two LCDs. The correlation
coefficients are gradually increasing according to the sequence of 12cm(2LCD), 8cm

47
(2LCD), 4cm(2LCD). Condsidering the experimental error, we may say that
4cm~8cm could be a better inteval for the 2 LCDs because that they have higher
correlation coefficients with the setting depth.
In conclusion, through motion parallax experiment, we find that each of the two LCD
have a certain range around themselves to be able to show 3D effect. Because of this
effect, our system expanded the range of depth we perceived, which further supports
the hypothesis that our system can enhance the capability of conveying depth
perception comparing with one traditional LCD. Moreover, the data indicates that the
best interval of the two LCDs should be between 4cm and 6cm.
Nevertheless, the results also reflect a problem. If you pay attention to the depth we
perceived for Layer 3 and Layer 4 (middle two layers), you will find there is actually
a gap between the two layers which makes the images be not continuous. To solve this
problem, we will introduce another method to create 3D sensation in the following
chapter.
48
5 Depth-Fused 3D (DFD) experiment
5.1 Experimental purpose (DFD)
By using DFD (Depth-fused 3D) which is another method to create 3D sensation, we
try to solve the problem that there is a discontinuous representation gap between the
two LCDs in the last experiment using motion parallax. In this experiment, we will
verify the phenomenon of DFD in our system and then explore how the depth
perception will be changed by using DFD in a quantitative way.
5.2 Experimental principle (DFD)
The DFD effect was originally found during a study on interpolating the layers of
discrete 2D images. Images at intermediate depth can be produced by simply
controlling the luminance of two stacked 2D image [Date, 2007]. DFD perception
occurs when two 2D images are displayed such that they are superimposed on two
transparent screens with varying luminance and the observer perceives a 3D image.
[Lee, 2009]
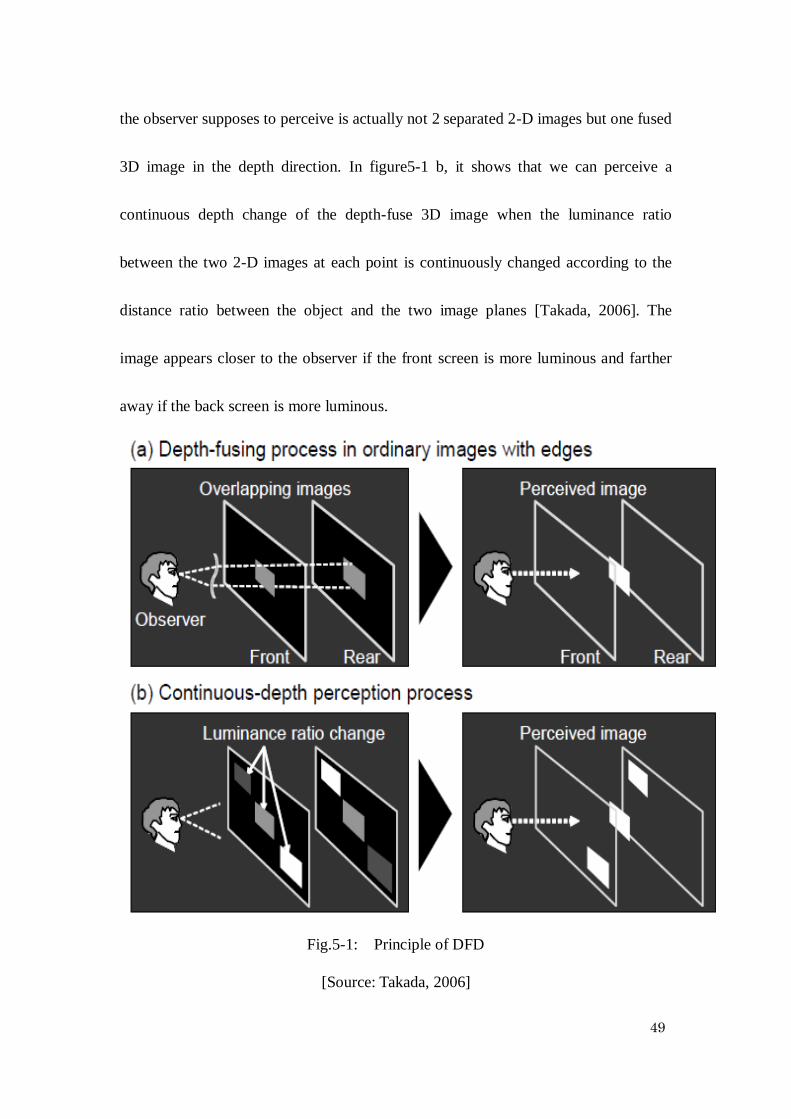
Figure5-1 explains the fundamental of DFD. In figure5-1 a, in the depth direction as
viewed from the observer, there are two 2-D images being displayed on two
transparent planes. The two 2-D images are at the same height with our eyes. What
49
the observer supposes to perceive is actually not 2 separated 2-D images but one fused
3D image in the depth direction. In figure5-1 b, it shows that we can perceive a
continuous depth change of the depth-fuse 3D image when the luminance ratio
between the two 2-D images at each point is continuously changed according to the
distance ratio between the object and the two image planes [Takada, 2006]. The
image appears closer to the observer if the front screen is more luminous and farther
away if the back screen is more luminous.
Fig.5-1: Principle of DFD
[Source: Takada, 2006]

50
5.3 Experimental procedure (DFD)
5.3.1 Preparation (DFD)
Fig.5-2: Schematic of DFD experiment
Figure5-2 shows the schematic of this DFD experiment. Firstly based on the result
from last chapter, we found that the best interval for the 2 LCDs is between 4~8cm.
Here we make the interval be 6cm. As Figure shows, we display several lines of
squares with different luminance to each LCD. We keep the front and the rear lines of
squares being with different luminance. For example we set the front line of squares’
luminance to be 80% and set the rear line of squares’ luminance to be 20%. Then we
overlap the two lines of squares and create the DFD effect. In order to explore how
the depth perception will be changed by using DFD in a quantitative way, we tried to
test as many combinations of luminance as possible. We designed several
51
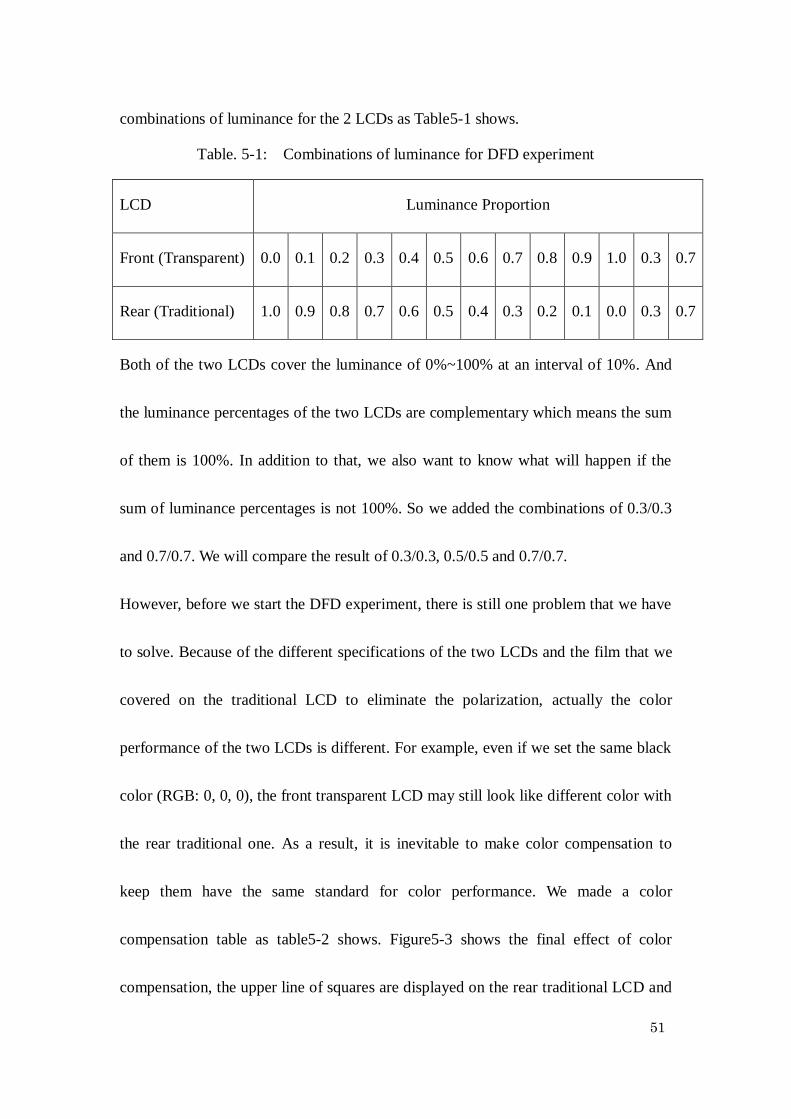
combinations of luminance for the 2 LCDs as Table5-1 shows.
Table. 5-1: Combinations of luminance for DFD experiment
LCD Luminance Proportion
Front (Transparent) 0.0 0.1 0.2 0.3 0.4 0.5 0.6 0.7 0.8 0.9 1.0 0.3 0.7
Rear (Traditional) 1.0 0.9 0.8 0.7 0.6 0.5 0.4 0.3 0.2 0.1 0.0 0.3 0.7
Both of the two LCDs cover the luminance of 0%~100% at an interval of 10%. And
the luminance percentages of the two LCDs are complementary which means the sum
of them is 100%. In addition to that, we also want to know what will happen if the
sum of luminance percentages is not 100%. So we added the combinations of 0.3/0.3
and 0.7/0.7. We will compare the result of 0.3/0.3, 0.5/0.5 and 0.7/0.7.
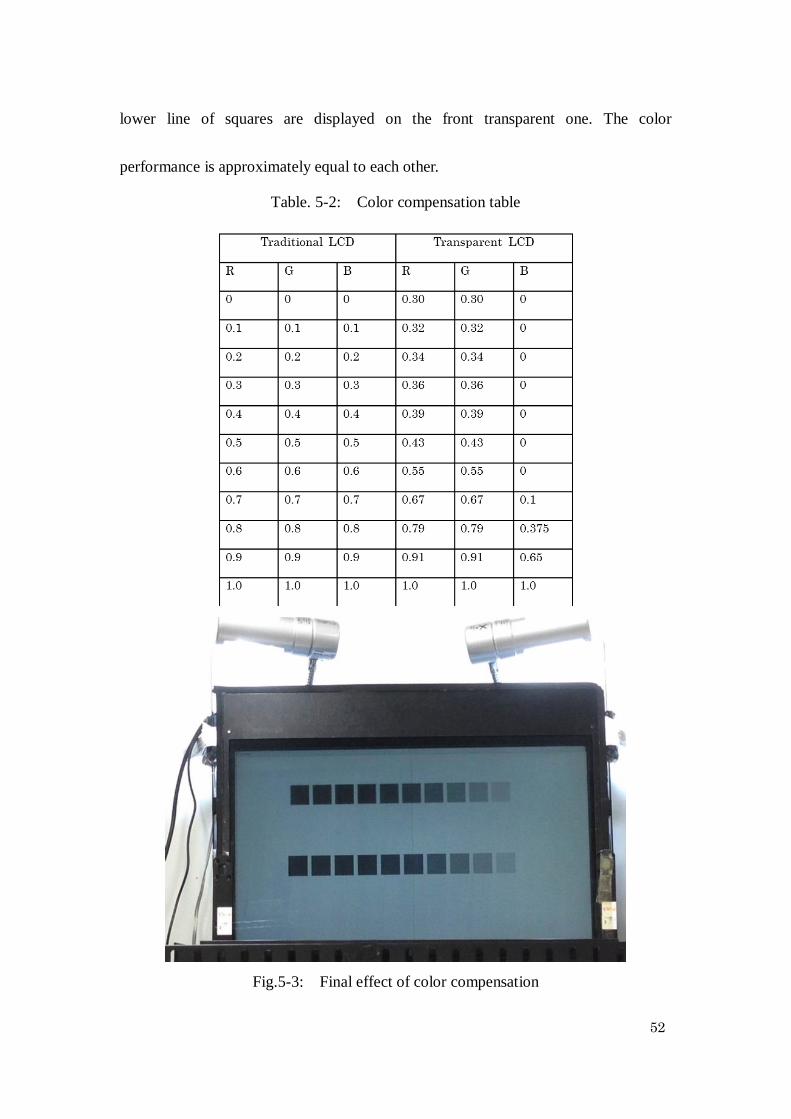
However, before we start the DFD experiment, there is still one problem that we have
to solve. Because of the different specifications of the two LCDs and the film that we
covered on the traditional LCD to eliminate the polarization, actually the color
performance of the two LCDs is different. For example, even if we set the same black
color (RGB: 0, 0, 0), the front transparent LCD may still look like different color with
the rear traditional one. As a result, it is inevitable to make color compensation to
keep them have the same standard for color performance. We made a color
compensation table as table5-2 shows. Figure5-3 shows the final effect of color
compensation, the upper line of squares are displayed on the rear traditional LCD and
52
lower line of squares are displayed on the front transparent one. The color
performance is approximately equal to each other.
Table. 5-2: Color compensation table
Fig.5-3: Final effect of color compensation

53
5.3.2 Execution (DFD)
Figure5-4 shows the scene of DFD experiment. The experimenter sat on the chair in a
certain position and put his jaw on the edge of the top part of a tripod which is also
fixed in a certain position (2m from the front LCD). Ask him to watch at our system.
Then show him the card we prepared and tell him there will be a lot of rectangles
which has the same size of this card. But this time they will not move.
We displayed lines of squares with different combinations of luminance to
corresponding LCD. We used the same measurement board that we mentioned in
section 3.1 to measure the experimenters’ depth perception. And the following
experimental procedures were the same as mentioned in the Section 4.3.2.
Fig.5-4: Scene of DFD experiment

54
5.4 Experimental result (DFD)
Totally we had 10 people do the experiment. And for each person we tested 3 patterns
of images (changing the sequence in the depth direction). Figure5-5 shows the
average results and the standard deviation of the 10 people. X axis represents the
combinations of luminance of rear and front LCD.Y axis represents the perceived
depth (Z coordinate).
Firstly we should make sure that whether different combinations of luminance will
result in different perceived depth or not. So we held the analysis of variance
(ANOVA) test to check the significance level of our data. In table5-3, it shows that
the significance level (Sig) is under 0.05. It is indicated that there is statistical
Fig.5-5: Average result and variance of 10 people for the DFD experiment
55
significance in different combinations of luminance, which proves that combinations
of luminance has different influence on the experimenters’ perceived depth.
Table. 5-3: ANOVA for the data of DFD experiment
Sum of
Squares df
Mean
Square F Sig.
Between
Groups 326.698 10 32.670 51.963 .000
Within
Groups 62.242 99 .629
Total 388.940 109
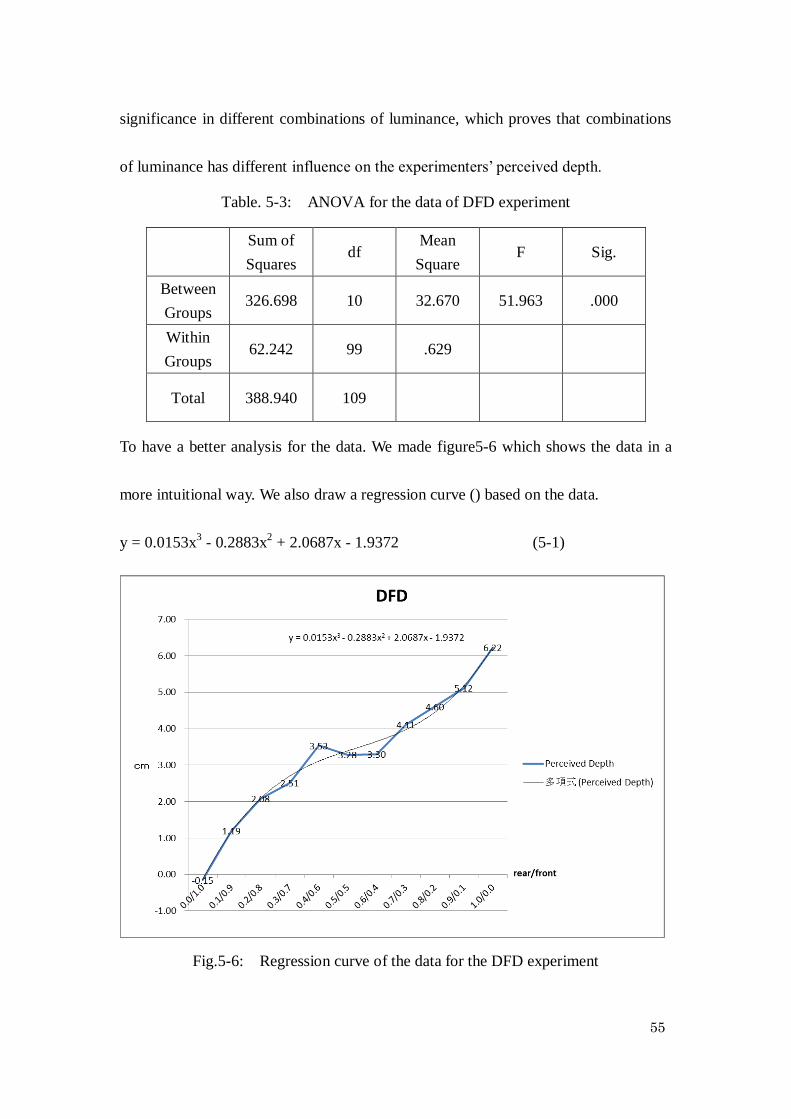
To have a better analysis for the data. We made figure5-6 which shows the data in a
more intuitional way. We also draw a regression curve () based on the data.
y = 0.0153x3 - 0.2883x
2 + 2.0687x - 1.9372 (5-1)
Fig.5-6: Regression curve of the data for the DFD experiment
56
Focusing on the regression curve which indicates the trend of perceived depth, we can
find that as the combinations of luminance changes the perceived depth also changes.
The image appears closer to the observer if the front LCD is more luminous and
farther away if the back LCD is more luminous. For example, the result for
combination of 0.2/0/8 is around 2.0cm (away from the traditional LCD), on the other
side, the result for combination of 0.8/0/2 is around 4.5cm (away from the traditional
LCD), which appears closer to the observer. And the curve continuously crosses the
whole interval between the two LCDs, making the discontinuous part be filled up. We
have successfully verified the DFD phenomenon by our layer 3D display system. We
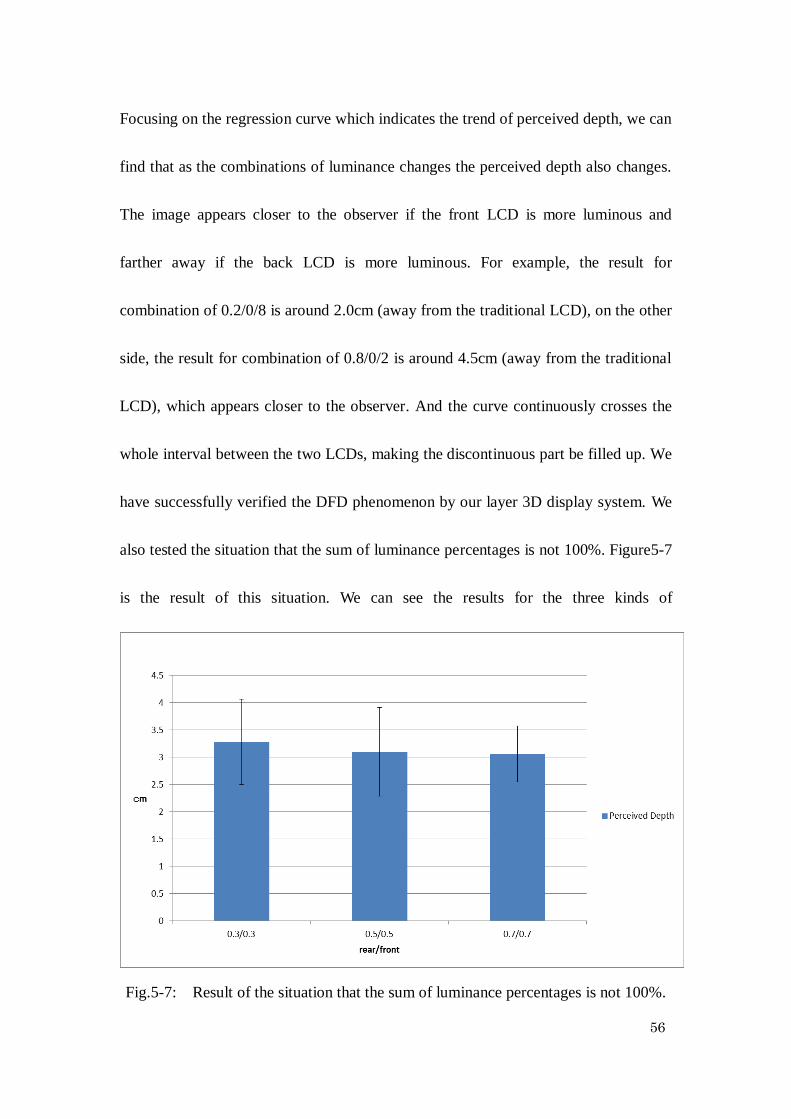
also tested the situation that the sum of luminance percentages is not 100%. Figure5-7
is the result of this situation. We can see the results for the three kinds of
Fig.5-7: Result of the situation that the sum of luminance percentages is not 100%.

57
combinations are all around 3cm (away from the traditional LCD). We also analyzed
the statistical significance of the data for three combinations. Table5-4 shows that the
significance level (Sig) is above 0.05 which means there is no statistical significance
among the three kinds of combinations. From the data we can say that if the
proportion of luminance is the same, no matter the sum of the luminance percentages
is 100% or not, there will be same effect on the perceived depth.
Table. 5-4: ANOVA the situation (sum of luminance percentages is not 100%)
In conclusion, through DFD experiment, we successfully verified the DFD
phenomenon in our system and found that we can smoothly fill up the discontinuous
interval between the two LCDs which had been a problem in the last motion parallax
experiment. We also deduced one regression curve to be a reference for how we can
realize a certain depth perception by using DFD in a quantitative way. For the
problem that whether the sum of luminance percentages is 100% will have different
Sum of
Squares df
Mean
Square F Sig.
Between
Groups .824 2 .412 .621 .540
Within
Groups 57.720 87 .663
Total 58.544 89
58
influence on perceived depth, our data shows that there is no significant difference..
Until now we have finished the motion parallax and DFD experiment respectively. We
have found the way to create 3D effect around the two LCDs and between them. What
effect will we get if we combine these two methods together? We will introduce that
in the following chapter.

59
6 Motion parallax and Depth-fused 3D experiment
6.1 Experimental purpose (MP+DFD)
By combining motion parallax and DFD, we try to fuse the range (around the two
LCDs) where can represent the 3D effect by using motion parallax and the range
(between the two LCDs) where can represent the 3D effect by using DFD. We want to
verify that whether the two methods of creating 3D can integrate the space outside the
two LCDs and between them, and make it possible to convey 3D sensation.
6.2 Experimental procedure (MP+DFD)
6.2.1 Preparation (MP+DFD)
Figure6-1 shows the schematic of this combination experiment. We still keep the
interval of the two LCDs be 6 cm. Here we have 6 lines of squares with 6 different z
coordinates of -2, 0, 2, 4, 6 and 8. The traditional LCD is at the position of z=0 and
the transparent LCD is at the position of z=6. For the middle two lines of squares
which are in the yellow frame, we applied DFD. And we made all the 6 lines of
squares in the green frame do the same horizontal moving like we did in the motion
parallax experiment, which means we applied motion parallax to all of them.
Figure6-2 gives an example of the images displayed on the two LCDs for this
experiment. As you can see that the upper two lines are being displayed only on the

60
rear LCD, the lower two lines are being displayed only on the front LCD, and the
middle two lines are being displayed on both of the two LCDs with different
luminance.
Fig.6-1: Schematic of MP+DFD experiment
Fig.6-2: Image of MP+DFD experiment
61
In addition, because we want to apply DFD, we have to think about the color. For the
upper two lines and the lower two lines, we made them be black based on the color
compensation table5-2 in Chapter 5. For the middle two lines, we have to decide the
luminance combinations to make them approach to the positions of Z=2 and Z=4.
From the regression curve which indicates the trend of perceived depth in Figure, we
found that the luminance combinations for the positions of Z=2 and Z=4 should be
0.2/0.8 and 0.7/0.3 (rear/ front).
6.2.2 Execution (MP+DFD)
On the whole, we used the same measurement method as we did in the Chapter 4 and
5. We measured all the 6 lines of squares’ perceived depth.
6.3 Experimental result (MP+DFD)
Totally we had 10 people do the experiment. And for each person we tested 3 patterns
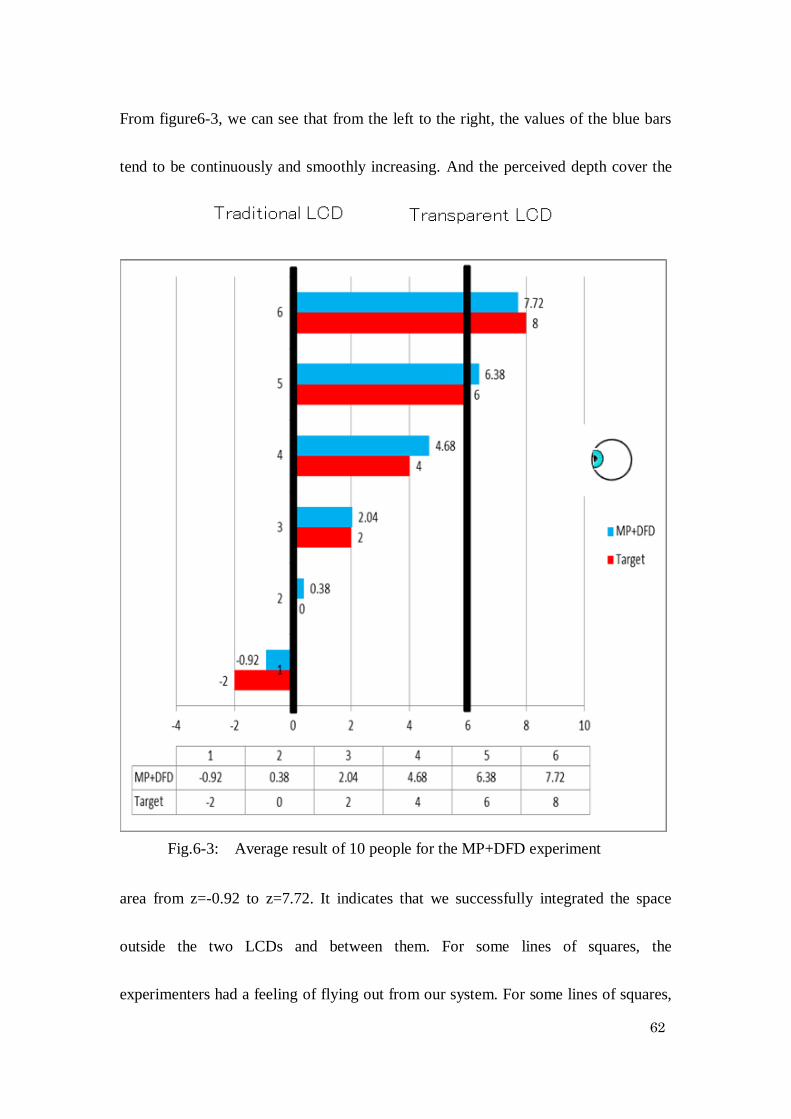
of images (changing the sequence in the depth direction). Figure6-3 shows the
average result and figure6-4 shows the variance of the data. Figure6-3 is also the side
view of our system, the horizontal axis shows the perceived depth of the lines and the
longitudinal axis shows the vertical position of the lines. The red bar is the target
depth we set in the program and the blue bar is the real perceived depth by the
experimenters.
62
From figure6-3, we can see that from the left to the right, the values of the blue bars
tend to be continuously and smoothly increasing. And the perceived depth cover the
Fig.6-3: Average result of 10 people for the MP+DFD experiment
area from z=-0.92 to z=7.72. It indicates that we successfully integrated the space
outside the two LCDs and between them. For some lines of squares, the
experimenters had a feeling of flying out from our system. For some lines of squares,
63
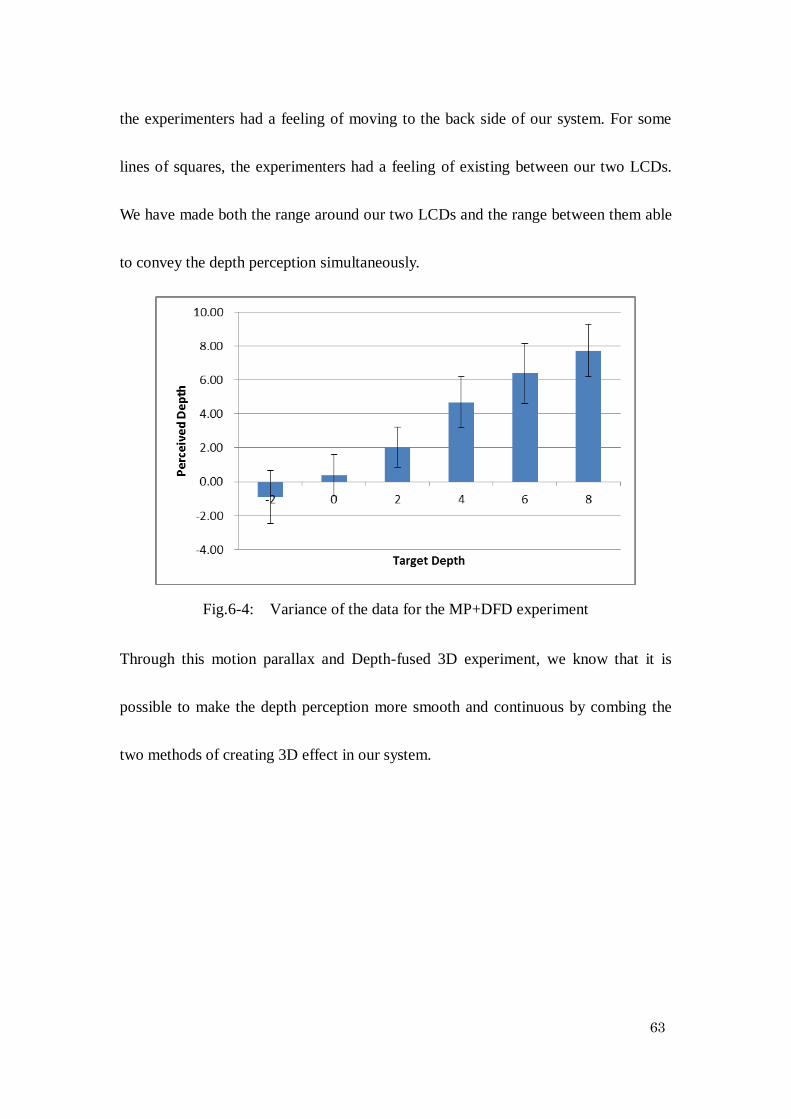
the experimenters had a feeling of moving to the back side of our system. For some
lines of squares, the experimenters had a feeling of existing between our two LCDs.
We have made both the range around our two LCDs and the range between them able
to convey the depth perception simultaneously.
Fig.6-4: Variance of the data for the MP+DFD experiment
Through this motion parallax and Depth-fused 3D experiment, we know that it is
possible to make the depth perception more smooth and continuous by combing the
two methods of creating 3D effect in our system.

64
7 Application example
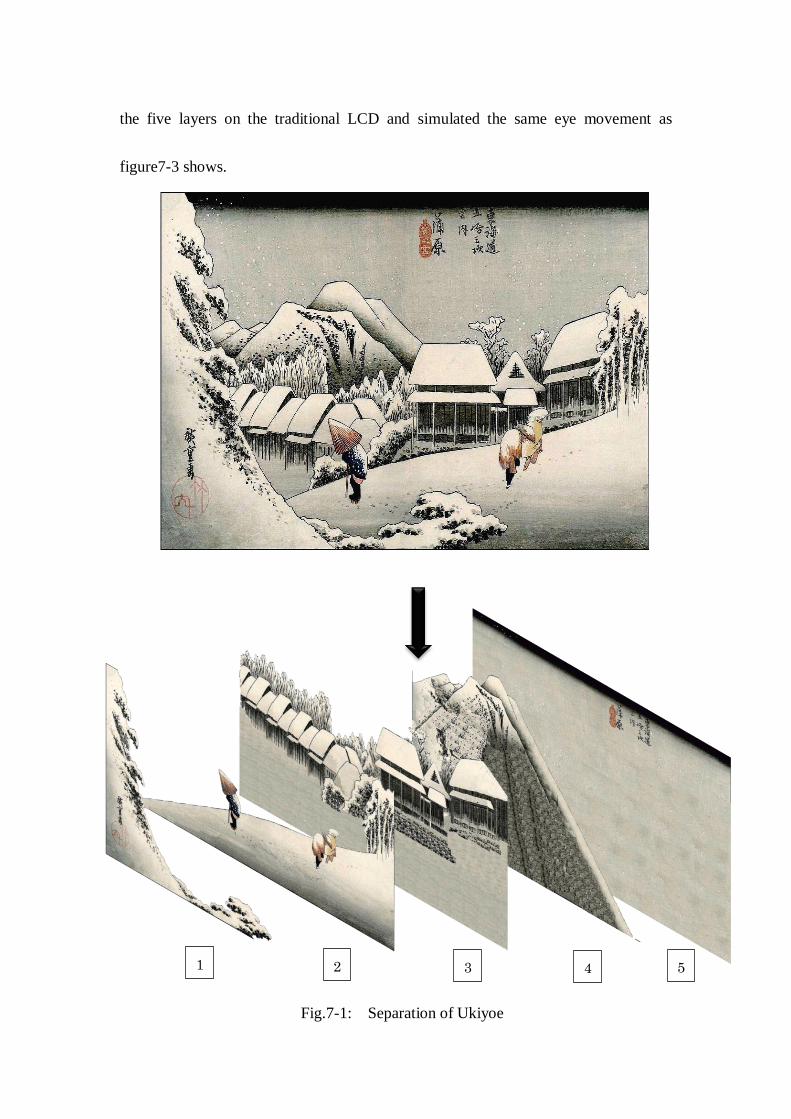
Through the three experiments in chapter 4, chapter 5 and chapter 6, we have found
that the combination of motion parallax and Depth-fused 3D is a valid way to create
3D effect in our layer 3D display system. In this chapter, we will introduce one
application example and discuss about the feedback from people who have watched
that.
We used one of the famous Japanese traditional paintings called Ukiyoe as our
application example. Figure7-1 shows the schematic diagram of how we displayed
Ukiyoe in our layered 3D display system. Firstly, as shown in Figure7-1, we separated
Ukiyoe into five layers of pictures based on the depth of different objects. We
displayed the first three layered onto the front transparent LCD and the last three
layered onto the rear traditional LCD as shown in figure7-2. Then we simulated the
movement of our eyes to make the five layered do horizontal moving, which means
conducting motion parallax. For the middle layer (No. 3), because it is displayed both
on the two LCDs and with the same luminance, based on the result of DFD
experiment, it should be perceived just in the middle of the two LCDs. Combined
with the effect of motion parallax, the five layers of pictures will finally be presented
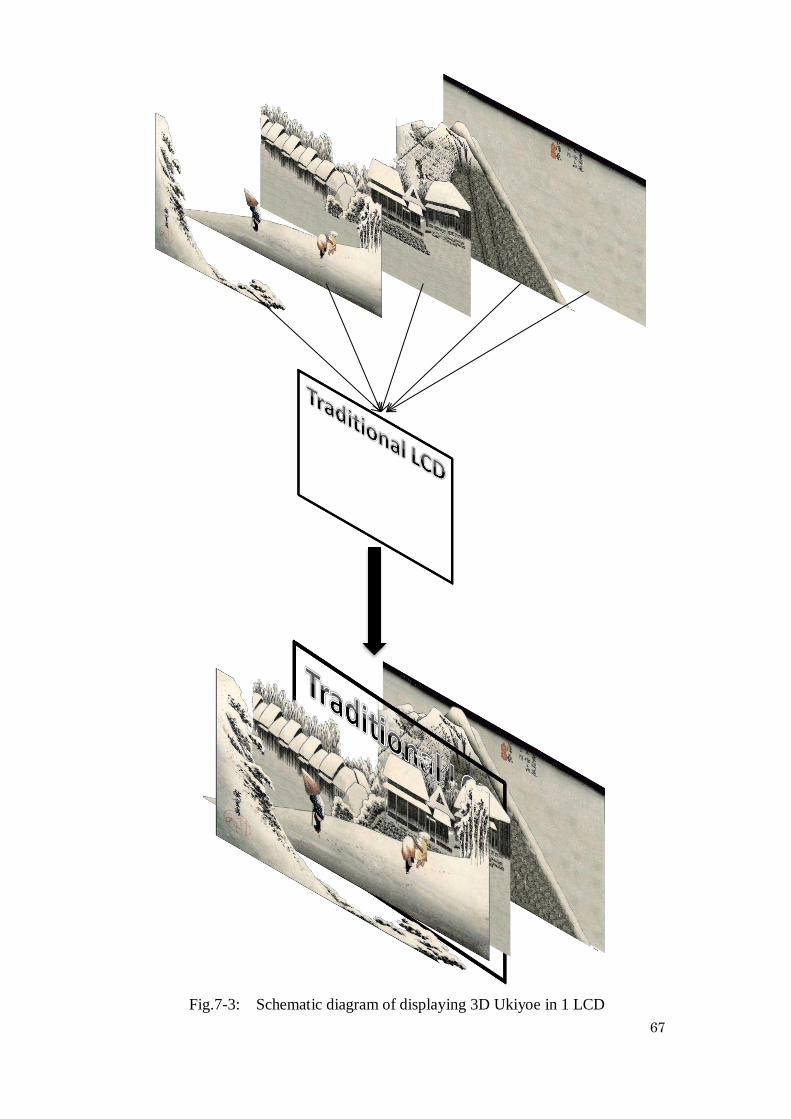
in a stereoscopic way as shown in figure7-2. As a comparison, we also displayed all
65
the five layers on the traditional LCD and simulated the same eye movement as
figure7-3 shows.
1 2 3 4 5
Fig.7-1: Separation of Ukiyoe

66
Fig.7-2: Schematic diagram of displaying 3D Ukiyoe in 2 LCDs
67
Fig.7-3: Schematic diagram of displaying 3D Ukiyoe in 1 LCD
68
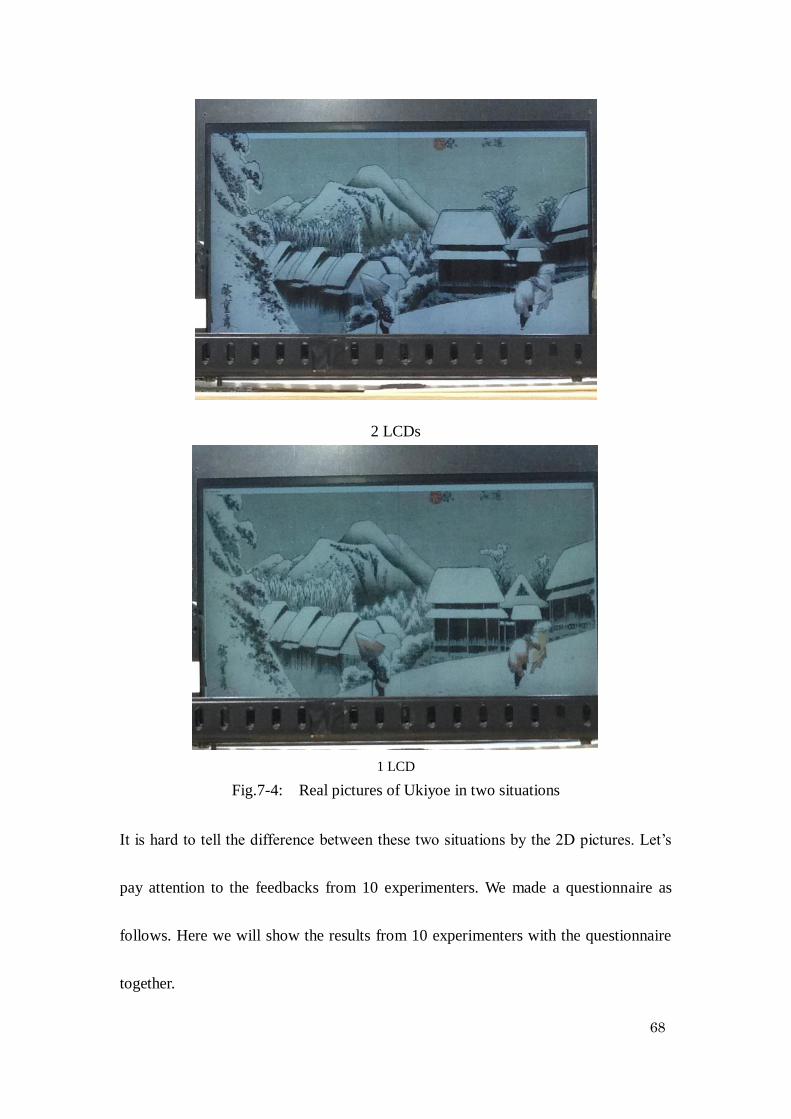
2 LCDs
1 LCD
Fig.7-4: Real pictures of Ukiyoe in two situations
It is hard to tell the difference between these two situations by the 2D pictures. Let’s
pay attention to the feedbacks from 10 experimenters. We made a questionnaire as
follows. Here we will show the results from 10 experimenters with the questionnaire
together.

69
Questionnaire
You will see two short videos, please pay attention to the sense of depth and
answer Q1~Q4 by comparing the two videos. (Video1: 1 LCD, Video2: 2 LCDs)
Question 1
If the range of depth perception in the Video1 is 10, how much do you think it should
be in Video2? (Examples: 2 times—20, half―5)
Answer 1:
Fig.7-5: Result of Q1
Question 2
Between the object that you think farthest away from you and the object that you
think nearest to you, how long do you think the distance should be? Please choose the
closest answer for each video.
2cm, 4cm, 6cm, 8cm, 10cm, 12cm, 14cm, 16cm, 18cm, 20cm, 22cm, 24cm, above
0
5
10
15
20
25
30
Question 1
2LCDs
1LCD

70
Answer 2:
Fig.7-6: Result of Q2
Question 3
How many layers in the depth direction do you think there are? Please choose the
closest answer for each video.
1, 2, 3, 4, 5, 6, 7, 8, 9, 10, Above
Answer 3:
Fig.7-7: Result of Q3
0
2
4
6
8
10
12
14
16
18
20
Cm Question 2
2LCDs
1LCD
0
1
2
3
4
5
6
7
8
Question 3
2LCDs
1LCD
71
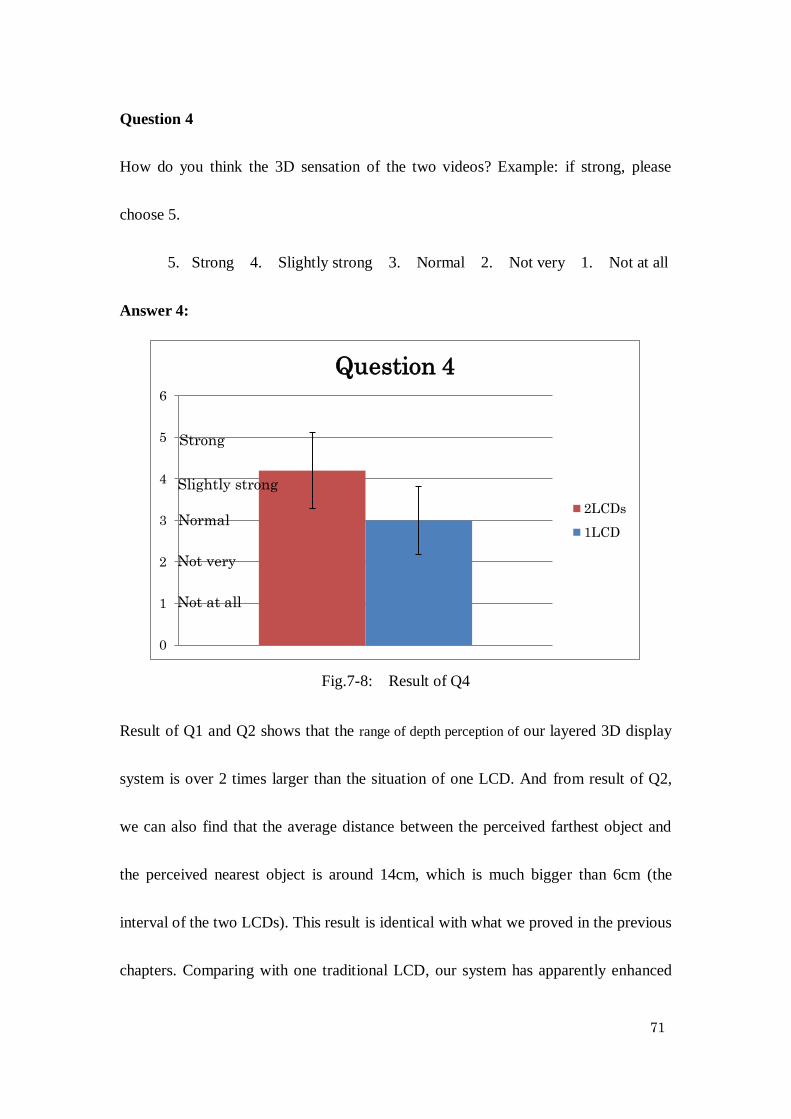
Question 4
How do you think the 3D sensation of the two videos? Example: if strong, please
choose 5.
5. Strong 4. Slightly strong 3. Normal 2. Not very 1. Not at all
Answer 4:
Fig.7-8: Result of Q4
Result of Q1 and Q2 shows that the range of depth perception of our layered 3D display
system is over 2 times larger than the situation of one LCD. And from result of Q2,
we can also find that the average distance between the perceived farthest object and
the perceived nearest object is around 14cm, which is much bigger than 6cm (the
interval of the two LCDs). This result is identical with what we proved in the previous
chapters. Comparing with one traditional LCD, our system has apparently enhanced
0
1
2
3
4
5
6
Question 4
2LCDs
1LCD
Strong
Slightly strong
Normal
Not very
Not at all

72
the capability of conveying depth perception. Furthermore, from result of Q3, we can
find another interesting thing. In the situation of two LCDs, averagely the
experimenters can figure out more than 5 layers. However in the situation of one LCD,
they can only figure out less than 3 layers. This result indicates that our system even
increased the resolution of depth perception. And lastly, result of Q4 shows the
difference of overall 3D sensation in the two situations. Most of the experimenter
thinks that our system has a comparatively strong 3D sensation. On the other hand,
most of them think that one LCD’s 3D sensation is just normal.
Through this Ukiyoe example, the experimenters admitted the 3D performance of our
layered 3D display system.

73
8 Discussion
In this chapter, we will discuss the future issues and future prospects of our system.
Until now in all the experiments that we have conducted, we simulated the eye
movement when adding motion parallax. In that situation, our viewpoint was fixed.
However in fact, it is possible to realize free viewpoint in our system. Figure8-1
introduces one possible way by using Kinect. Kinect is a device developed by
Microsoft, which can detect the motion of humans by collecting the depth information.
By using Kinect, we can trace the movement of our eyes and make the contents in our
Fig.8-1: An idea to realize free viewpoint for our system in the future
74
system able to change as our viewpoint changes. If this idea is realized in the future,
our system will become a more free style 3D system.
Another issue is about the color. As we know that the transparent LCD is still not a
mature product yet. There are some still problems or technical restrictions. One of the
problems we care about is the color performance. As you can see in figure7-4, even
though we present better 3D effect by using our system, the color performance is not
so perfect. Because the transparent LCD only has 16.7M display colors, inevitably
there will be influence on restoring the color. Nevertheless, we believe that as the
technology of transparent LCD develops there will be much high quality transparent
LCD coming soon in the future. The problem of color distortion will be solved.
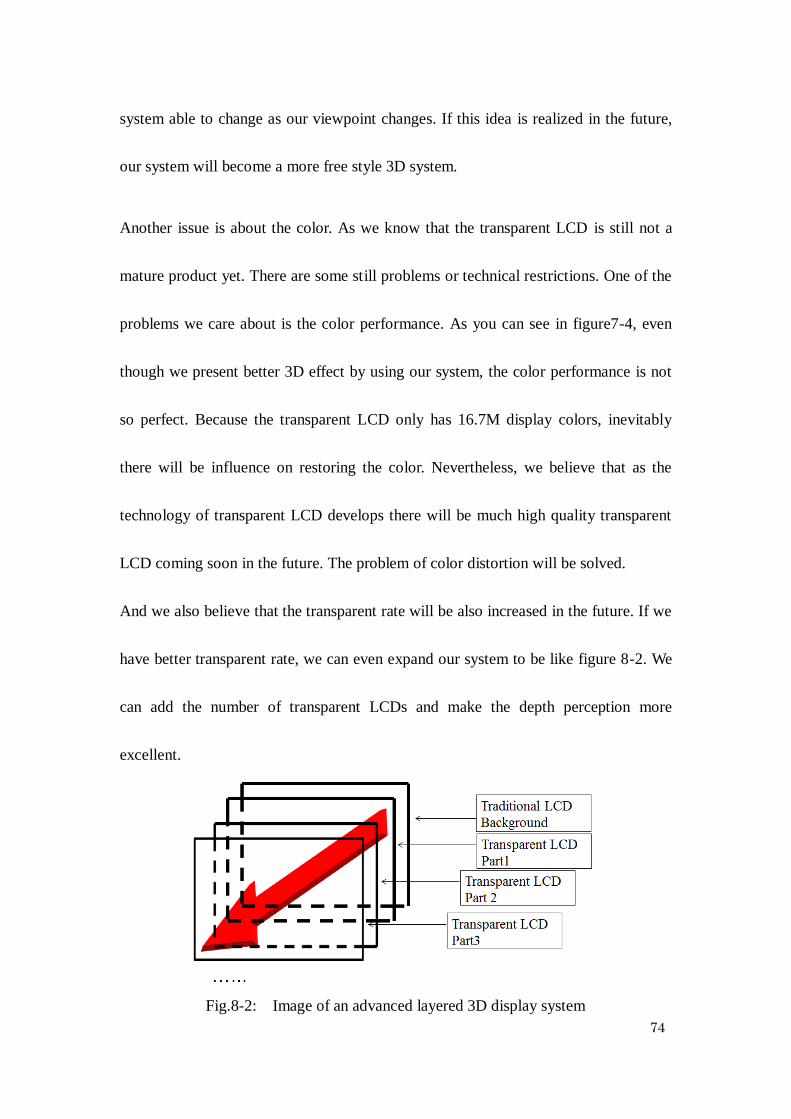
And we also believe that the transparent rate will be also increased in the future. If we
have better transparent rate, we can even expand our system to be like figure 8-2. We
can add the number of transparent LCDs and make the depth perception more
excellent.
Fig.8-2: Image of an advanced layered 3D display system
75
9 Conclusion
In this research, concerning the problems of current 3D display system, we proposed
and successfully built a new layered 3D display system by combining the transparent
LCD and the traditional LCD. Based on the special structure of our system, we put
forward two methods (motion parallax and DFD) to realize 3D effect. We made the
experiments to prove the feasibility of the two methods in our system and the
application example to evaluate the 3D performance of our system.
Through a large number of experiments, we have obtained several significant
conclusions. Firstly, the combination of motion parallax and DFD is a valid method to
create 3D effect in our system. Secondly, through the combination of motion parallax
and DFD, we successfully expanded the range of depth perception and increased the
resolution of depth perception comparing with the situation of one traditional LCD.
And finally, from the feedback from experimenters, the overall 3D performance of our
system has been highly evaluated.
All in all, we have successfully built a simple structured layered 3D display system
which does not need any additional device at a reasonable cost. And we have proved
the 3D performance of this system.
76
Acknowledge
First of all I would like to thank Professor Ogi Tetsuto, my supervisor. He has
provided me with an incredible amount of knowledge, advices and encouragement
over my two years in Keio University. Professor Ogi guided me step by step and
provided me with countless suggestions regarding the direction and contents of my
research. I am very grateful for his patience and understanding.
I would like to thank the former associate teacher Tateyama Yoshisuke for his
supports. He gave me great help especially in the programming part of my research. I
am very grateful for his enthusiastic attitude.
I would also like to thank associate Professor Ioki Makoto, my secondary supervisor.
Professor Ioki provided me with advices on the logic of my research. I am very
grateful for his precious advices.
I would then like to thank my fellow classmates, for their assistance, and
encouragement. Especially Leo and Rob, they have helped the experiments for me for
countless times and give me incredible amount of advices.
I would also like to thank the members in Ogi laboratory and students in SDM who
tested my system, took my questionnaire, and provided useful feedbacks and
suggestions.
Finally, I want to thank my families who have kept supporting me for these two years.
77
Reference
Date, M., & Takada, H. (2007). Small-Depth-Error Display Using Depth Fused 3D
(DFD). Taiwan-Japan Joint Conference on Communications Technology 2007.
Display Bank. (2011). Transparent Display Technology and Market Forecast.
Gabor, D. (1948). A new microscopic principle. Nature, Vol. 161, pp. 777-779.
Kim, H. (2010). Trend and Prospect on 3D Industry and R&D. Hyundai IT
Corporation.
Lee, C., DiVerdi, S., & Hollerer, T. (2009). Depth-Fused 3D Imagery on an
Immaterial Display. IEEE Transactions On Visualization And Computer
Graphics January/February 2009, VOL. 15, NO. 1.
Ohkoshi, T. (1980). Three-dimensional displays. Proceedings of the IEEE, Vol. 68, No.
5, pp. 548-564.
Qian, N. (1997). Binocular Disparity and the Perception of Depth. Neuron, 18,
359-368.
Segal, M., & Akeley, K. (2010). The OpenGL Graphics System: A Specification. The
Khronos Group Inc.
Suyama, Y. I. (2004). Apparent 3-D Image Perceived from Luminance-Modulated
Two 2-D Images Displayed at Different Depths. Vision Research.

78
Takada, H. (2007). Research on Clarification of Depth-Fused 3-D Visual Illusion and
its Application to 3-D Display. Waeda Univeristy.
Takada, H. S. (2006). Front and Rear Image Generation Module for Depth-fused 3-D
Display. IEEE Transactions on Consumer Electronics, AUGUST 2006, Vol. 52,
No. 3.
Travis, A. (1997). The display of three-dimensional video images. Proceedings of the
IEEE, vol. 85, pp. 1817-1832.
Yokozawa, K. (2010). Visual Science. Keisoshobo Co.Ltd.

79
Conference attendance
1. Di Xiong, Yoshisuke Tateyama, Tetsuro Ogi: Layered 3D Display System Based
on the Combination of Transparent LCD and Traditional LCD, Design
Engineering Workshop in Kitakyushu, 2013
2. Di Xiong, Yoshisuke Tateyama, Tetsuro Ogi: Depth Representation in Layered 3D
Display Using Transparent LCD, Tele-Immersion Technology Committee, The
Virtual Reality Society Japan, 2014
80
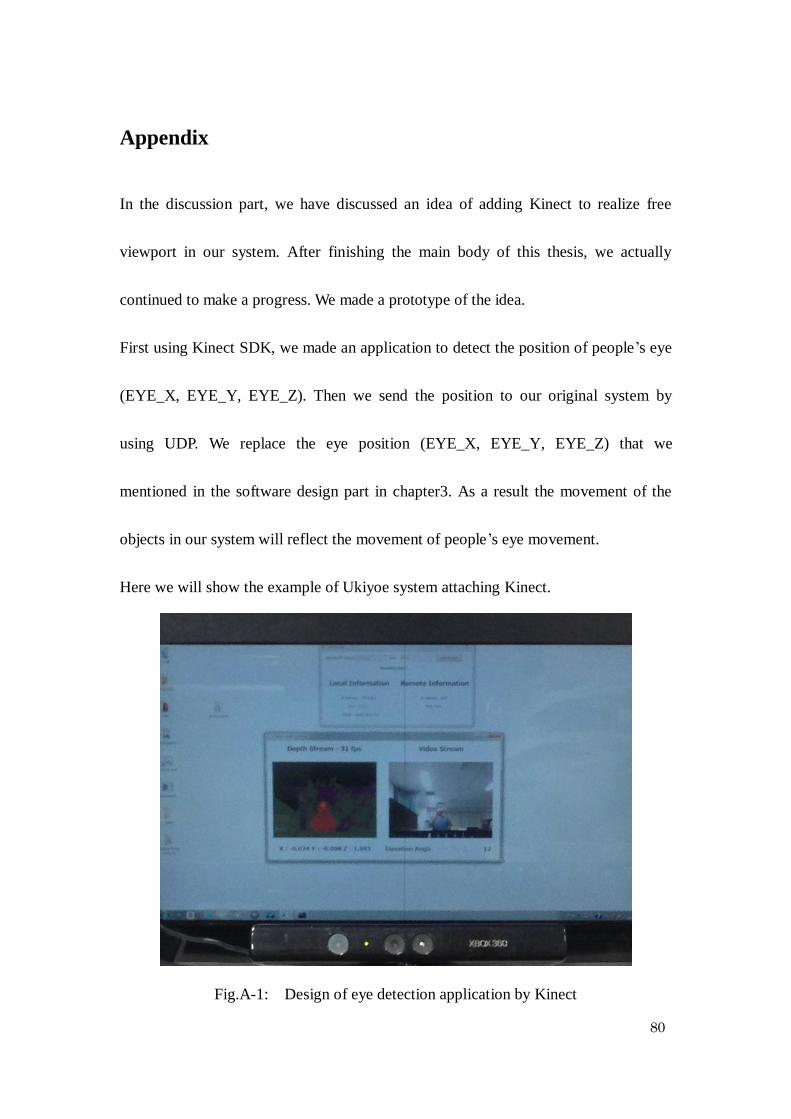
Appendix
In the discussion part, we have discussed an idea of adding Kinect to realize free
viewport in our system. After finishing the main body of this thesis, we actually
continued to make a progress. We made a prototype of the idea.
First using Kinect SDK, we made an application to detect the position of people’s eye
(EYE_X, EYE_Y, EYE_Z). Then we send the position to our original system by
using UDP. We replace the eye position (EYE_X, EYE_Y, EYE_Z) that we
mentioned in the software design part in chapter3. As a result the movement of the
objects in our system will reflect the movement of people’s eye movement.
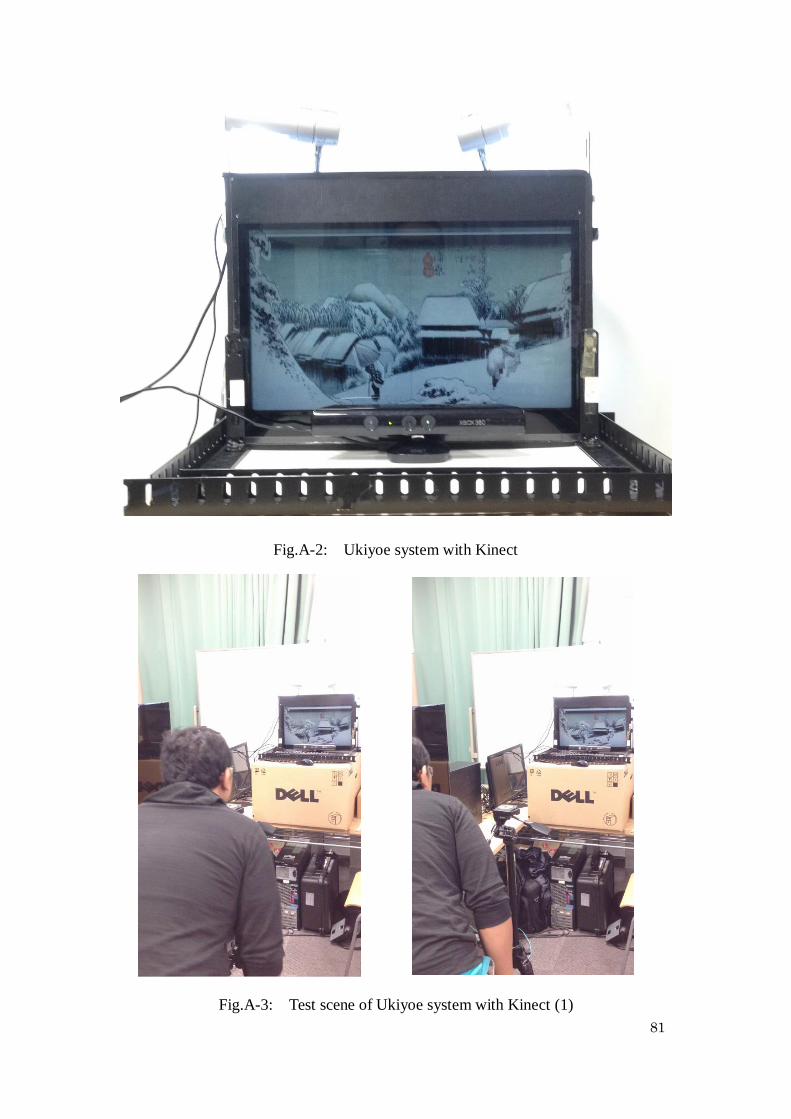
Here we will show the example of Ukiyoe system attaching Kinect.
Fig.A-1: Design of eye detection application by Kinect
81
Fig.A-2: Ukiyoe system with Kinect
Fig.A-3: Test scene of Ukiyoe system with Kinect (1)

82
Fig.A-3: Test scene of Ukiyoe system with Kinect (2)
Fig.A-4: Test scene of Ukiyoe system with Kinect (3)