Embed Size (px)
Citation preview

International Journal of All Research Education and Scientific Methods (IJARESM)
ISSN: 2455-6211, Volume 5, Issue 3, March 2017, Impact Factor: 2.287
1
Research on Similarity Nodes Query Algorithm
Based on the Snapshots for Large Dynamic
Graph
Jin Ran1,2,3
, Hu Lingze1, Meng Zhouqing
1, Peng Guoce
1, Jiang Chao
1
1School of Electronics and Computer, Zhejiang Wanli University, Ningbo, China
2School of Computer Science and Technology, Zhejiang University, Hangzhou, China 3Sesame Research Center, National University of Singapore, Singapore
ABSTRACT
In the evolution of dynamic graph topology, in order to quantify the change of the change of the relation between the
nodes within a certain time, a concept, namely ubiquitous similarity node, was defined, and the level of ubiquitous
similarity with the current node was measured by the frequent degree of interaction with the current node and the
uniformity of distribution, and a similarity node query processing algorithm for large dynamic graph based on the
snapshots was proposed. The concrete content includes: the snapshot expression of the dynamic evolution of graph,
namely evolution dynamic graph; the semantic representation and its formal representation of the nodes` ubiquitous
similarity in the dynamic evolution of graph, which was characterized by the frequent degree of interaction and
uniformity coefficient of distribution; the matrix representation and processing method of the semantic of the nodes`
ubiquitous similarity; the query algorithm for ubiquitous similarity nodes. The experimental results on the synthetic
dataset and the real dataset show that the proposed algorithm can deal with the nodes` ubiquitous similarity query on the
large dynamic graph, and be implemented in the practical applications.
Keywords: Large Scale Graph, Dynamic Graph, Time Snapshot, Data Query
I. INTRODUCTION
Graph, as a data structure, does better in expression capacity of universality than linear table and tree do. With the
application of Graph structure in those describe the complex association between the large scale entities, such as
social network analysis, biology information, computer network and Web knowledge discovery, the scale of graph
appears explosive increase, the realistic connotations that graph represented become more diversified and more
complicate, thus, plenty of researchers chose graph to model various complicated network system[1-4]. For instance,
the literature [5] abstracts the cooperative relationship among authors in DBLP (www.informatik.uni-trier.de/ ~ley/deb, which lists the scholarly papers in the field of computer science in chronological order) into a graph
structure, the nodes in the figure represent the author, and the edges between the nodes represent the partnership
between the authors. The large-scale graphs that describe real-world applications change over time, that is, the
dynamic evolution of a graph (called an evolving or dynamic graph).Evolving graph scan be divided into two types
according to their changes: one is the change of topological relations in the graph; the other is the content of the data
objects represented by vertices and edges in the graph, or the changes of evaluation mode of a particular object in
the graph.
In recent years, more and more researches have focused on the similarity query[6-11].The similarity query is to find a
set of graphs or nodes similar to a query graph or node in a given graph. Usually, in the practical application of
graph similarity query, the conceptual application problem is transformed into a suitable graph which can represent
the problem, and the similarity calculation of the graph is done by different methods. The existing researches focus on similar sub graph queries[12-21], and focus on static large-scale graphs or dynamic cumulative graphs for sub graph
similarity query.
In practical application, people often pay attention to the change and maintain of the connection between nodes in a
certain time domain during the evolution of evolving graph topology. For example, which nodes are in contact with
the current node, that is, the connection of the node to the current node in the entire time domain may not always
exist, but at most moments the association exists, and how to measure the strength of the connection, and so on.

International Journal of All Research Education and Scientific Methods (IJARESM)
ISSN: 2455-6211, Volume 5, Issue 3, March 2017, Impact Factor: 2.287
2
Because people pay attention to the connection between the other nodes and the current node in the process of
evolution, it can be understood as a kind of concomitant situation in some sense. So, this node is called the similar
node of the current node. Whether the current nodes are connected frequently, whether the links are evenly
distributed over the whole time domain, and so on. In practical applications, such as the cooperation between the
DBLP authors, people will query for a period of time with this author or cooperation between the author, query the
length of time between collaborators and how close the cooperation is and so on.
In this paper, we study the query problem of similar nodes on large scale evolving graphs, and propose a query
processing method based on snapshot. The article including: snapshot representation of evolving graphs, the
semantic and formal representation of the similarity of the evolving graph nodes during the evolution of the graph,
the matrix representation and processing of the similarity of the evolving graphs nodes, and the similarity query
processing algorithm.
II. RELATED WORK
The similar query of the graph has always been the hotspot in the data processing, many scholars have done a lot of
research on this issue, and most of the existing research results are based on similar sub-graphs for query processing.
A similar subgraph query is a subgraph that is similar to a given query topology, and these subgraphs are similar to the structure of the query graph, except that there are differences in the number of edges or nodes.
Early studies are mostly similar to sub graphic queries on static graphs, including precision matching similar
subgraph queries and approximate matching similar subgraph queries. About accuracy matching, the literature [12]
proposed a sub-graph query feature index model, which uses the tree as an index term, and then based on the tree
code for subgraph query is NP complete Problem, the query time complexity is high. In [13], a method is proposed
to include the idea of searching, which means that the two graphs are similar in that the query graph and some
similar graphs in the database contain exactly the same structure. Moreover, its biggest problem is that its similarity
degree is relatively high, the result set is smaller, in practical application can only meet the requirements of precise
semantics, but not applicable to the requirements of ubiquitous semantics.
For approximate matching, it is usually to set up the similarity measure of graphs, such as based on Similarity
measure of maximal common subgraph, Similarity measurement of edit distance, and then the similarity calculation
of the graph is carried out using different methods to find the nodes satisfying the metric and Side, resulting in a
similar match with the query results[14]. The researchers put forward some methods of graph approximate matching
from different points of view, based on the similarity of the approximate graph matching method, such as C-tree
[15], TALE [16], and SAGA [17] etc. These methods pre-process the graph data by pre-setting the thresholds,
leaving only the nodes and edges that satisfy the threshold range, taking into account only the characteristics of the
individual nodes. In addition, the similarity calculation in the structure, such as LeRP (Length-R Path) [18]
algorithm and SF (Similarity Flooding) [19] algorithm. LeRP is the square of the isomorphism of the approximate
subgraph, the method is based on calculating the path and the number of loops of length r associated with a node to
obtain the largest approximate isomorphic subgraph of the two graphs. SF is a general graph with the algorithm,
applied to the pattern matching, the use of similarity of the node spread, through the fixed-point iterations to get the mapping of the nodes. These two methods have a higher degree of matching than the previous class. The above
research results are based on the static structure model. However, due to the dynamic characteristics of the graph,
the above research results cannot describe the similarity of nodes or subgraphs in the whole evolution of the graph,
and cannot effectively deal with the evolving graph structure.
In addition, similar queries based on evolving graphss in the existing literature are focused on attention similar
subgraph structure, this similar query is from the perspective of the dynamic accumulation of the figure, that is, from
the evolving graph in a period accumulated changes in the situation, find the desired query results. At present, there
are some results on subgraph similarity of evolving graphs. In [20], an algorithm for mining sub graphic evolution
pattern mining on an evolution graph is proposed. Using the overlapping sub-structure of the optimal similar piece
set of the connected subgraphs, the dynamic programming algorithm is used to find the evolution pattern of the connected subgraph Set, this method uses the overlapping sub-structure, cannot accurately characterize the evolving
graph with time and the time complexity of the intermediate process is high. In [21], a method of using frequent
subgraphs as query index keywords is introduced. The frequent subgraph is organized into a tree-like index structure
from small to large, decomposing the query into a number of sub-graphs, and use these sub-graphs in the index of
information to filter. The use of indexes on rapidly changing evolving graphs results in a large amount of query

International Journal of All Research Education and Scientific Methods (IJARESM)
ISSN: 2455-6211, Volume 5, Issue 3, March 2017, Impact Factor: 2.287
3
processing overhead, in practical application is not convenient. The above similar subgraph query is engraved from
different angles. In this paper, the subgraph query on large-scale evolving graphs is focused on the semantic
representation and query validity of the cumulative change trend in the query, and the semantic study in the process
of dynamic evolution is less, not in the figure The similarity between the evolutionary processes of nodes is obtained
directly during the process of structural change.
In practical applications, this paper found that people are often concerned about large-scale evolving graph, in the
process of evolution of the topology. The relationship between the nodes in the graphs is kept within a certain time
domain, and how strong the relationship is. It pays more attention to the description and description of the change of
the similarity of the nodes in the process of the evolution of the evolving graph instead of instantaneous results of
state cumulative change.
In this paper, we combined with the existing static diagram, cumulative evolving graph similarity subgraph query
related research results, considering the relationship between the nodes of evolving graph evolution process, studied
the nodes in the similar semantic of the large-scale evolving graph and dynamic semantic similarity definition of
similarity query processing method of effective nodes.
III. UBIQUITOUS SIMILARITY NODES AND THEIR QUERY
While evolving graph topology evolution, the relationship between the nodes with time dynamic changes. Time
domain, some nodes and the current node or keep in touch, the frequency of contact between nodes is different, each
time the duration of the different nodes that the similarity of different degrees. This chapter presents a similarity
semantics and its query method to describe and calculate the node similarity in the evolution process. This semantics
indicates that nodes with frequent contact with the current node in the whole time domain and high degree of
similarity with nodes distributed over the whole time domain.
A. Node Aggregation
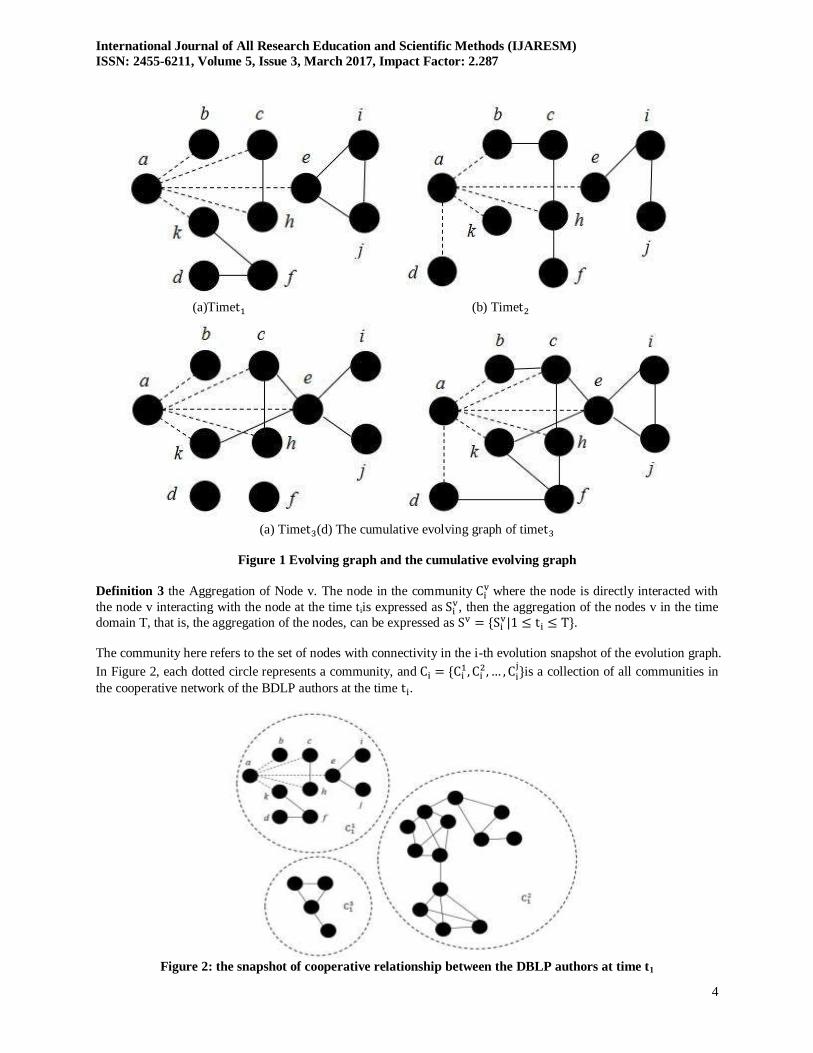
Definition 1 Interaction Diagram. G: (V, E) is an interactive graph, V is the node, representing each entity; E is the
edge between the nodes, representing the interaction between entities.
Figure 1 is an interaction diagram, where the entity node represents the author, representing the interaction between
the entities that the interaction between the author.
Definition 2 Evolution Evolving Graph (Evolution Graph). The evolving graph of the interaction graph G in the
time domain is shown as a snapshot of the n time , formalized as .
Graph G shows the interaction between all nodes and nodes during the time period from time to time . With
the dynamic evolution of the graph, new nodes and edges are constantly appearing in the graph, and the original
nodes and edges also disappear from the graph. Over time, the dynamic behavior of the graph can be described as a
group of non-overlapping snapshots.
Evolutionary evolving graphs emphasize the process of dynamic evolution rather than the result. In order to describe this conveniently, this paper will be the traditional meaning of the evolving graph called cumulative evolving graph.
Cumulative evolving graphs focus on the result of dynamic evolution rather than the process.
In Fig. 1, (a) to (c) show the snapshot at time ~ , respectively. The snapshots on the time domain shows the
evolution of the interaction graph G over time, that is, the evolution of the evolving graph, as shown in Figure 1 (a),
(b) and (c). Different time snapshots are mutually exclusive, and they do not contain any common information that
only shows the interaction between entities and entities that are included at time . The snapshot of the snapshot on
the time domain shows the evolution of the interaction graph G over time.
Figure 1 (d) depicts the cumulative changes from the time to the time , that is, the cumulative evolving graph. It shows that the evolution of time with the cumulative accumulation, can not be intuitively reflected with the specific
changes over time, it is difficult to support the evolution of time granularity over time with the query processing
operations.
International Journal of All Research Education and Scientific Methods (IJARESM)
ISSN: 2455-6211, Volume 5, Issue 3, March 2017, Impact Factor: 2.287
4
(a)Time (b) Time
(a) Time (d) The cumulative evolving graph of time
Figure 1 Evolving graph and the cumulative evolving graph
Definition 3 the Aggregation of Node v. The node in the community where the node is directly interacted with
the node v interacting with the node at the time tiis expressed as , then the aggregation of the nodes v in the time
domain T, that is, the aggregation of the nodes, can be expressed as .
The community here refers to the set of nodes with connectivity in the i-th evolution snapshot of the evolution graph.
In Figure 2, each dotted circle represents a community, and
is a collection of all communities in
the cooperative network of the BDLP authors at the time .
Figure 2: the snapshot of cooperative relationship between the DBLP authors at time t1

International Journal of All Research Education and Scientific Methods (IJARESM)
ISSN: 2455-6211, Volume 5, Issue 3, March 2017, Impact Factor: 2.287
5
Figure 3 shows the aggregation of the author a in the time domain in the cooperative graph of the DBLP
author, and the aggregation of the node a at time is extracted from the community with node a in Fig 2.
(a) Time (b) Time (c) Time (d) Time
(e) Time (f) Time (g) Time (h) Time
Figure 3: the aggregation of node a in the cooperative relationship between the DBLP authors
B. Ubiquitous Similarity Nodes
Ubiquitous similarity Nodes describes a kind of similar semantics of evolutionary evolving graphs in the
evolutionary process, which pay more attention to the process of evolving evolution rather than the result.
1) Ubiquitous Similarity Nodes
Definition 4 Ubiquitous similarity node. On the time domain , the node w is concerned with most of the
time (considering the number of times the node w appears in the n dynamic snapshots and the time interval on the entire time domain) Then the node w is the ubiquitous similarity node of node v.
The concern here is that there is a connected edge between node w and node v.
For example, in the evolution of the relationship between DBLP authors, the author c cooperates with author a
frequently (see Figure 3), and this cooperation is more evenly distributed throughout the time domain, which could
name author c is the ubiquitous similarity node to author a.
This kind of similarity can be given different meaning with the application field, such as in the social network, the
user's attention can be expressed among the users have a common topic and so on.
2) Description of Node’s Similarity
In order to quantify the node w in the time domain T most of the time are concerned about the degree of node v, in
this paper, we give a node similarity function, which depicts the cumulative sum of the proportion of nodes w in the
node of all nodes v over time. The concern node of node v is the node that the aggregation of node v directly
interacted with node v.

International Journal of All Research Education and Scientific Methods (IJARESM)
ISSN: 2455-6211, Volume 5, Issue 3, March 2017, Impact Factor: 2.287
6
The cumulative sum represents the degree of ubiquitous similarity between node w and node v. The more the
number of occurrences of the node w in the snapshot of the evolution evolving graph, the bigger the cumulative sum
and the higher the degree of similarity between the nodes w and v; When the two nodes and appear the same
number of times in the snapshot of the evolution evolving graph, it is necessary to consider both the snapshot
distribution containing the node and the snapshot distribution containing the node . If the snapshot containing
the node is distributed evener than that of the node over the time domain, the accumulative sum of node is
greater than that of , and the similarity between node and node v is greater.
According above, the similarity function of the ubiquitous similarity nodes can be formalized as the following:
In this formation: |LCC| is the number of the same connection between and
while node w exists at the time . |
| is the number of aggregated edges of node v at the time .
We can easily conclude it that the more frequent node w appears on the whole time domain, the shorter time interval
of appearance and the higher the degree of similarity with node v.
C. Matrix Representation and Operation of Ubiquitous Similarity Node
Using the calculation method of Eq. (1), we can get a series of nodes sorted in the whole time domain with the
current ubiquitous similarity node, but this method needs to repeat the scanning of the aggregation of nodes at all times in the whole time domain. This aggregation is stored using adjacency lists, each of which takes up storage
space as v + 2e, and the storage space required for node aggregation at n time is large. Thus, as for the aggregation
of nodes in n moments, this section gives its corresponding matrix representation and calculation method.
This article uses the 01 sequence to represent the aggregation of nodes. If the node w exists in the aggregation of
node v at time , then the corresponding value in the sequence is set to 1, otherwise it is set to 0.For example, in Fig.
3, the sequence at time is 11111 and at time is 10111, and so on, the sequence at is 1000111010.
Whereas the abscissa represents the evolution of a node wj in the aggregation of node v in n times, that is, ,
which the abscissa of the matrix can be formally expressed as ,the ordinate represents the
aggregation state of the node v at time , that is, node , the aggregation of the node v at time ti in the matrix
can be formally expressed as . At this point, the aggregation of node v can be further
expressed as a two-dimensional matrix, which is formally expressed as:
When the nodes are aggregated using a two-dimensional matrix, | | can be formally expressed as , that is,
Since the |LCC | in the formula (1) shows that the node wji exists on the aggregation of the node v at time ti, the
same number of connections exists in and
, that is, in the two-dimensional matrix A, the number of nodes in the i-1 column and the i column are both 1.We can get the |LCC| value of current snapshot by ANDing the value of
the i column and the i-I column in the two-dimensional matrix and accumulating the result, that is:
)
According to the semantic finding of Eq. (3), we can directly transform the matrix A, and the result of the operation is denoted as matrix B, which the accumulated sum of each column represents the value of |LCC| at that moment. As

International Journal of All Research Education and Scientific Methods (IJARESM)
ISSN: 2455-6211, Volume 5, Issue 3, March 2017, Impact Factor: 2.287
7
the time t1 is the first moment and there is no former moment exist, doesn’t exist at time t1. Therefore,
the first column of the matrix B is 0, which can be formally represented as following:
We can easily get it in matrix B that, when wj exist in the current snapshot at time ti, |LCC| can be represented as
following:
Then, formula (1) can be represented as following:
IV. THE QUERY ALGORITHM FOR UBIQUITOUS SIMILARITY NODES
In the large-scale evolving graphs that describe the complex relationships between entities, the ubiquitous similarity
node query algorithm can query nodes that are similar to the current nodes during the whole time domain evolution
and can be distinguished by similarity.
A. Algorithm
In this paper, the generalized query processing method is as follows. Firstly, we find the community of the node v
where the node is located from the time domain T evolution evolving graphG, and then find the aggregation of the
node v from the community at time to get the aggregation of the node v from the time domain T, then transform it into a representation of the two-dimensional matrix. Next, we use the node similarity function of ubiquitous
similarity node, which represented as sim (v, w), to calculate the similarity of the focused node wj and node v.
Finally, sorting the similarity value from high to low, which was function calculation result of the focused nodes in
. The value larger, indicating that the node is more similar to the node, and the specific algorithm is shown in
Algorithm 1, which is based on the algorithm.
Algorithm 1 Query Algorithm of Ubiquitous Similarity Node Usimilarity ().
Input: interaction graph G = (V, E), time domain T, query point v;
Output: the SIM collection.
1) convert graph G = (V,E) into T temporal snapshots 2) FOR i=1 to n DO
3) cluster EG // divide the interaction diagram into communities.
4) = { | 1 ti T} // get the aggregation of node v
5) get array // the aggregation of node v is stored in the matrix A
6) get array // AND matrix A to get matrix B
7) ENDFOR // end for
8) FORj = 1 to m DO
9) get |LCC| in B // get |LCC| from matrix B
10)
( )
11) save in the SIM set // store the results.
12) ENDFOR
13) sort in the SIM set // sort the ubiquitous similarity nodes
END // end algorithm

International Journal of All Research Education and Scientific Methods (IJARESM)
ISSN: 2455-6211, Volume 5, Issue 3, March 2017, Impact Factor: 2.287
8
B. Examples
Considering the eight successive graphs of the aggregation of node a in Fig. 3, we can get the degree of similarity
between node a and nodes b, c, d, e, f, g, h, I, j, k according to the similarity function of equation (5).
First, the matrix A is used to represent the aggregation of node a in eight successive graphs according to the definition:
Then use the arithmetic transformation matrix A to obtain a new matrix B
Finally, we use equation (5) to get the degree of pan-node of node a and sort it:
According to the size of the calculated values, the similar sequences of these nodes and node a are b, k, g, d, f, e, c, h,
i, j, which the degree of similarity decreases, and the similarity between node b and node is highest, because node b
appears the most, and the time interval is 0. In this time domain, the node d appears four times, the time interval is 1,
that is to say that the node d containing the is evenly distributed in the eight graphs; the node e also appears four
times, the time interval within the time interval is 0, the time interval occurring in time period is 4,
that is to say that the distribution of containing node e is not uniform throughout the time domain. So the degree
of similarity between node d and node a is stronger than that of node e and node a.
From the example that the dynamic diagram of the evolution of partnership relationship among DBLP Authors, we
can see that the similarity degree of nodes is a kind of common semantics between the common nodes of the
evolution of the graph. This semantics focuses on the cooperation of other authors and the author, whether this
cooperation is more evenly distributed throughout the evolution of the entire evolving graph of the time domain. The
more frequent the cooperation, the more evenly distributed, the more similar to the research interests of author a.

International Journal of All Research Education and Scientific Methods (IJARESM)
ISSN: 2455-6211, Volume 5, Issue 3, March 2017, Impact Factor: 2.287
9
The semantic description of the similarity with respect to the frequency of interest and the time interval of attention
is given above, the ubiquitous similarity nodes. In addition, people are also concerned with the current node to keep
in touch with the node, that is, these nodes in the time domain for a period of time with the current node relationship
is stable, concerned about the different duration of the node that the degree of similarity, which can be called nodes
directly similar, because of its processing and the node is similar to the ubiquitous node, so do not repeat them.
V. EXPERIMENTAL RESULTS AND ANALYSIS
Experimental operating environment: clocked at 3.40GHz CPU; 128GB of memory, 1TB hard drive. Operating
system is Linux, development tools are VC6.0, programming language C++.
A. Experimental Configuration
In this paper, the real-time data set DBLP and synthetic data set Web Graph (as shown in Table 1) on the snapshot-
based similar node query processing algorithms to evaluate the test algorithm running time and storage space
occupancy rate, and by setting the size of the graph to test the robustness and efficiency of the algorithm.
Table 1 Data Set DBLP and Data Set Web Graph
Data Set the Number of Nodes the Number of Edges
DBLP 684,911 7,764,604
WebGraph 10,000,000 213,000,000
DBLP integrated database system in accordance with the chronological order listed in the field of computer science
researchers, which can be downloaded from www.informatik.uni-trier.de/~ley/de/. The graph has more than 680,000 different authors and more than 7 million cooperation between them.
Web Graph is a collection of web pages, which can be downloaded from webgraph.dsi.unimi.it. The nodes in the
graph represent the web page and the edges between the nodes represents the links to web pages. This paper extracts
a subgraph using it, which consists of 10 million web nodes and 21.3 million links.
In order to describe the evolution of the evolving graph, each experiment using 20 snapshot graph. For the DBLP
dataset, a snapshot represents the research collaboration between authors within a year, this paper selected 20
snapshots from 1993 to 2003 as the algorithm required for the real evolution of evolving graph. As for WebGraph
data set, a snapshot represents the link status between web pages in a month, this paper simulates the change of web
page link status for 20 consecutive months as the synthetic evolving graph.
There are two parts in the experiment. The first part is to test the relationship between the number of nodes
participating in the ubiquitous similarity node query and the running time of the algorithm in the evolving graph of
the two data sets. 5 sets of experiments were performed on each data set. The number of nodes involved in the
processing is increased at a rate of 10 times each time. Each of which is compared with the original query node is
similar to the method and the matrix is used to query the node similar to the method. Each group of experiments was
compared between the two were the original methods to query similar nodes and the methods to query that by using
the matrix representation. The second part is to test the evolving graph of two data sets respectively, and compare
the relationship between the number of node that participating the query of the ubiquitous similarity node and the
storage space required by query. 5 sets of experiments were performed on each data set. The scale of nodes involved
in the processing is increased at a rate of 5 times each time. Every experiment compares the original methods to
Each group of experiments was compared between the two were the original methods to query the similar nodes and the methods to query that by using the matrix representation.
The query algorithm of the ubiquitous similarity node Usimilarity() in Section 3.1 is the algorithm using matrix
representation, corresponding to the original method is a kind of simple query processing method, which was
represented by naïve U similarity() in this experiment. Because the simple query method is similar to the method of
query processing, the difference is only the storage mode and the number of scanning the difference, so the text is
given only after the use of matrix algorithm.

International Journal of All Research Education and Scientific Methods (IJARESM)
ISSN: 2455-6211, Volume 5, Issue 3, March 2017, Impact Factor: 2.287
10
B. Experimental Results and Analysis
Experiment 1 examines the relationship between the number of nodes participating in the query and the query speed
of similar nodes. Figure 4 lists the processing time for both methods on the DBLP dataset and the WebGraph dataset.
In the experiment, the nodes of the initial DBLP dataset changed from 60 to 6000, and the nodes of the initial
WebGraph dataset changed from 10 to 10000, and their running time increased with the increase of nodes. The experimental results show that the run time of the ubiquitous similarity node query algorithm is shorter than that of
the two-dimensional matrix, which indicates that the representation of the matrix can shorten the query time and
improve the query efficiency effectively.
Figure 4: Running Time
Experiment 2 examines the relationship between the size of the nodes participating in the query and the required
storage space. The results are shown in Figure 5. In the five experiments, the size of the nodes participating in the
query processing on the two data sets was expanded from 10 to 62500, and the storage space was increasing as the
number of nodes participating in the query increased.
The experimental results show that the storage space of the ubiquitous similarity node query algorithm using matrix
is much smaller than that of the simple algorithm.

International Journal of All Research Education and Scientific Methods (IJARESM)
ISSN: 2455-6211, Volume 5, Issue 3, March 2017, Impact Factor: 2.287
11
Figure 5: Occupied Storage Space
According to the above two kinds of test results, it’s found that the processing method to query snapshot-based
large-scale evolving graph similar node is feasible. The computational complexity of this method is small and the
time complexity is O (n2).
Compared with the simple query algorithm about ubiquitous similarity node, the node query processing algorithm, which based on matrix, about ubiquitous similarity node is short, the storage space is small, and it has good
processing performance.
CONCLUSION
In this paper, we focus on the similarity problem of nodes in the dynamic evolution of large-scale evolving graphs,
and propose a similar query method for large-scale evolving graphs based on snapshots.
From the perspective of the evolution of evolving graphs, it depicts the dynamics of the graphs, depicts the
semantics of the ubiquitous similarity nodes that are widespread in the evolutionary process, and gives the
corresponding functions of similarity of the ubiquitous similarity node, and representation and computational methods of matrix and query algorithm to the ubiquitous similarity node. Experimental results on synthetic data sets
and real data sets show that the computational complexity of the algorithm is low and the time complexity is low
and the efficiency is high. The query results are of practical significance in real application.

International Journal of All Research Education and Scientific Methods (IJARESM)
ISSN: 2455-6211, Volume 5, Issue 3, March 2017, Impact Factor: 2.287
12
The snapshot in the evolving graph depicts the process of dynamic evolution, but its storage also has a large space
overhead. In the next step, we will further study the incremental storage technology in the evolutionary evolving
graphs and the optimization query method of node ubiquitous similar semantics on incremental snapshot storage.
ACKNOWLEDGMENT
This work was supported by the Ningbo Natural Science Foundation under grant No. 2015A610141, and by the
Zhejiang Science and Technology Program under grant No. 2016C33195 and by the Zhejiang Postdoctoral Project,
and by the National Undergraduate Training Programs for Innovation and Entrepreneurship under grant No.
201610876004, and by the new-shoot Talents Program of Zhejiang Province under grant No. 2016R420021.
REFERENCES
[1]. ZHANG Q. Research of subgraph query on social network [D]. Xuzhou: China University of Mining and Technology, 2014:
1 – 12. [2]. SUN J, FALOUTSOS C, PAPADIMITRIOUS S, et al. Graph scope: parameter-free mining of large time-evolving graphs
[C] // KDD ’07: Proceedings of the 13th ACM SIGKDD International Conference on Knowledge Discovery and Data Mining. New York: ACM, 2007: 687-696.
[3]. TANTIPATHANANANDH C. BERGER-WOLF T, KEMPE D, A framework for community identification in dynamic social networks [C] // KDD ’07: Proceedings of the 13th ACM SIGKDD International Conference on Knowledge Discovery
and Data Mining. New York: ACM, 2007: 717-726. [4]. BACKSTROM L, HUTTENLOCHER D, KLEINDERG J, et al. Group formation in large social networks: membership,
growth, and evolution [C] // KDD ’07: Proceedings of the 12th ACM SIGKDD International Conference on Knowledge Discovery and Data Mining. New York: ACM, 2006: 44-54.
[5]. ASUR S, PARTHASARATHY S, UCAR D. An event-based frame-work for characterizing the evolutionary behavior of interaction graphs [C] // KDD ’07: Proceedings of the 13th ACM SIGKDD International Conference on Knowledge Discovery and Data Mining. New York: ACM, 2007: 913-921.
[6]. WANG N, WANG B, LI X H, et al. Subgraph queries over dynamic graph data [J]. Journal for Frontiers of Computer Science and Technology, 2014, 8(2): 139-149.
[7]. YAN X, YU P S, HAN J. Substructure similarity search in graph databases [C] // SIGMOD ’05: Proceedings of the 13th ACM SIGMOD International Conference on Management of Data. New York: ACM, 2005: 766-777.
[8]. YAN X, ZHU F, YU P S, et al. Feature-based similarity search in graph structures [J]. ACM Transactions on Database Systems, 2006, 31(4): 1418-1453.
[9]. YAN X, ZHU F, HAN J, et al. Searching substructures with superimposed distance [C] // ICDE ’06: Proceedings of the 22nd International Conference on Data Engineering. Washington, DC: IEEE Computer Society, 2006: 88-97.
[10]. YANG Y J. Research on mining and query processing algorithms on dynamic graph [D]. Harbin: Harbin Institute of Technology, 2013: 1 – 14.
[11]. MONDAL J, DESHPANDE A. Managing large dynamic graphs efficiently [C] // SIGMOD ’12: Proceedings of the 2012 ACM SIGMOD International Conference on Management of Data. New York: ACM, 2012: 145-156.
[12]. GUO C M. Research on algorithms for sub graph query based on graph database [D]. Qinhuangdao: Yanshan Univeristy, 2011: 1 – 6.
[13]. CHEN C, YAN X, YU P S, et al. Towards graph containment search and indexing [C] // VLDB ’07:Proceedings of the 33rd International Conference on Very Large Data Bases. New York: ACM, 2007: 926-937.
[14]. ZHONG X Y. The application of approximate matching algorithm in ontology matching based on graph [D]. Nanjing: Southeast University, 2006: 1-5.
[15]. HE H, SINGH A K. Closure-tree: an index structure for graph queries [C] // ICDE ’06: Proceedings of the 22nd International Conference on Data Engineering. Washington, DC: IEEE Computer Society, 2006: 38-47.
[16]. TIAN Y, PATEL J M. Tale: a tool for approximate large graph matching [C] // ICDE ’08: Proceedings of the 24th International Conference on Data Engineering. Washington, DC: IEEE Computer Society, 2008: 963-972.
[17]. TIAN Y, MCEACHIN R C, et al. Saga: a sub graph matching tool for biological graphs [J]. Bioinformatics, 2007, 23(2): 232 – 239.
[18]. DEPIERO F, KROUT D. An algorithm using length-r paths to approximate sub graph isomorphism [J]. Pattern Recognition Letters, 2003, 24(1/2/3): 33 – 46.
[19]. MENIK S, GARCIA-MOLINA H, RAHM E. Similarity flooding: a versatile graph matching algorithm [C] // ICDE 2002: Proceedings of the 18th International Conference on Data Engineering. London: dblp Computer Science Bibliography, 2002: 1 – 12.
[20]. ZOU Z N, GAO H, LI J Z, et al. Mining evolving patterns of connection subgraphs over evolving graphs [J]. Journal of Software, 2010, 21(5): 1007 – 1019.
[21]. YAN X, YU P S, HAN J. Graph indexing: a frequent structure-based approach [C] // SIGMOD ’04: Proceedings of the 2004 ACM SIGMOD International Conference on Management of Data. New York: ACM, 2004: 335-346.


![Similarity Measures for Query Expansion in TopX€¦ · 1 Chapter 1 Introduction Top-k query processing is an "important building block for ranked retrieval" [25] and is also used](https://img.pdfslide.net/doc/110x75/5f0b8fa67e708231d4311f07/similarity-measures-for-query-expansion-in-topx-1-chapter-1-introduction-top-k-query.jpg)


![Deep Character-Level · 2017. 10. 10. · Related Work Deep Similarity Learning Deep Intent: Zhai et al.[2] aimed to solve query-ad relevance problem. Query and Ad vectors are learnt](https://img.pdfslide.net/doc/110x75/60095cf7c5908231461b6fea/deep-character-level-2017-10-10-related-work-deep-similarity-learning-deep.jpg)