Embed Size (px)
Citation preview

Procedia Environmental Sciences 10 ( 2011 ) 1513 – 1518
doi: 10.1016/j.proenv.2011.09.241
Available online at www.sciencedirect.com
Conference Title
Research on the model of Nam Co lake water level evolution based on GIS
Liu Bing1,2 ,Jin Yao1,2,Qin Liqing1,2 1. Shandong Provincial Key Laboratory of Geomatics and Digital Technology
2. Geomatics College, Shandong University of Science and technology a [email protected]
Abstract
The earth is warming in recent decade, most glaciers in western China have retreated. The Qinghai-Tibet Plateau is a closed lake basin, so glacier changes will directly affect the water balance and hydrological cycle of basin. According to principles of river basin water balance, considering the lakes, glaciers, streams of basin as a whole, based on Baingoin, Nakqu, Xainza, Damxung four weather stations data in nearly a decade of date, we build the Nam Co basin water balance model aiming with GIS technology to simulate changes of Nam Co Lake in recent years, and the results uses the expression of three-dimensional dynamic image to show the evolution of the Nam Co lake water level.
Key words: GIS; Glacier; Nam Co; lake evolution; model
1. Instruction
The earth is warming in recent decades, most glaciers in western China has retreated[1]. The lake which main supply comes from glacier melt water has been gradually expanded. But the most lake districts in Qinghai-Tibet plateau have sparsely inhabitant and bad natural condition. Affected by various factors, it is very difficult to quickly and effectively get the information of dynamic changes in regional lakes [3,4]. Considering the basin of the lakes, glaciers, streams as a whole, the research of the dynamic relationship between research and its response to climate, will has a far-reaching significance. Chinese scholars also developed a batch of large-scale global change research program about lakes, ice core, and historical records, especially the research on the Qinghai-Tibet plateau distinctive.
In this paper, we use GIS technology to research the process of the dynamical change of water level in Nam Co Lake. Based on the principles of river basin water balance, etc, we use the spatial analysis of GIS
2011 3rd International Conference on Environmental Science and Information Application Technology (ESIAT 2011)
© 2011 Published by Elsevier Ltd. Selection and/or peer-review under responsibility of Conference ESIAT2011 Organization Committee.
Open access under CC BY-NC-ND license.
1878-0296 © 2011 Published by Elsevier Ltd. Selection and/or peer-review under responsibility of Conference ESIAT2011 Organization Committee.
Open access under CC BY-NC-ND license.

1514 Liu Bing et al. / Procedia Environmental Sciences 10 ( 2011 ) 1513 – 1518
technology and tools,map algebra language [5] to build the Nam Co basin water balance model according to the weather station data of Baingoin,Nakqu,Xainza,Damxung in nearly a decade of meteorological data ,aiming to simulate changes of Nam Co Lake in recent years, at the same time ,we dynamically demonstrate the evolution situation of Nam Co lake water level in three-dimensional space.
2. Study Area and data source
2.1 Study Area
Nam Co is the largest lake in Tibet, and is the second-largest saltwater lake in China. The elevation of the lake surface is 4718m by measured in 1979, and area of which is 1920 km2.The whole lakes watershed geographic area is 10610 km2. This river is located in the northern Vatican, belonging to the Nyainqentanglha northern southern Changthang plateau, which is a closed basin. Nyainqentanglha is located in the southeaster of the river, which has average altitude of approximately 5500 m and a peak of 7162 m. There has developed many modern glaciers, but which generally are short, and the water injected the lake in a braided shape when it comes through piedmont region in a short distance. Human activities has less affected on Nam Co region, the evolution of the glaciers and lakes is generally comes from the natural conditions and climate change[6]. In recent years in Nam Co region, people have established observatories to research the change of glacier end, material balance and routine meteorological change.
2.2 Data source and processing
We get four stations (Bangor, Nagqu, Xainza, Dangxiong) between 1996 and 2005 of average temperature, rain through the statistical yearbook 1995 to 2005 from related literature and the reference[4,6-9],Through Scanning to Nam Co basin of cartographical registration, vector optimization, we can be derived cashier fault basin wood range, Nam Co watershed DEM, Nam Co southern Nyainqentanglha glacier scope data. All data using WGS_1984 coordinate system, and unified adopted UTM_Zone_46N for projection. We interpolate the Air temperature, precipitation data of four stations using GIS analysis tool, to get the whole basin, temperature, precipitation figure. Because of influence by altitude temperatures, at an altitude of about four stations in 4600m around while Nam Co basin, the difference of elevation is very big, the complex terrain of meltwater and evaporation temperatures factor also have a big effect, so it is necessary to amend temperature data [9].
2.3 Research method
Principle of water balance In a closed river basin, the water follows such balance principle: all kinds of input water is equal to the sum of various output water and the changes of saved water in the region[10] .Nam Co is a typical inland closed lake water , the main export of this water is evaporation. Its water has follow balance equation:
Recharge(I)-Evaporation(E)=Pondage change (S ). (1) The rainfall in southeastern Nyainqentanglha along the glaciers will converge consumption into the
lake Nam Co. The equation is as follows Eq.2, Eq.3, Eq.4, Eq.5: Wr - Wc = train W. (2)
Wr = P + R. (3) The Wc = Z. (4) Train h = train W/s. (5)
In the equations:

1515 Liu Bing et al. / Procedia Environmental Sciences 10 ( 2011 ) 1513 – 1518
Wr: certain time input equilibrium zone within the sum total of input of water Wc: certain output equilibrium zone phase-specific sum total quantity of water Train W: balance zone time stored variables occupied P: watershed rainfall; R: melting glaciers net water; Z: watershed evaporation; S: lakes area; Train h:
lake level changes Principle of Temperature correction Considering of the temperature has a great influence on
evaporation and melt-water in this model, and of the complex terrain and high altitude of four weather stations, it is necessary to amend temperature data.
Because the temperature monitors are rare in the basin the site, and we can't explore the temperature changes in space by direct interpolation method, we introduced temperature reduction rate while determining each grid temperature. We take 0.65 / 100m as average in temperature straight minus rate in this model . The monthly mean temperature of each grid is estimated by Eq.6 [12]
Tp = T Ti Hi H0 (6) In the equation: T means monthly average temperatures of the basic stations ( ), Hi means average
height of grid center (m), H0 means the elevation of basic stations (m), Ti means represents lapse rate (/100m).
3. Result and discussion
3.1 Model structure
1) Evaporation module Takahashi evaporation module Nam Co is an internal flow lake, evaporation is the main way to
consume water and divide the whole valley into the lake and land surface. Firstly, we use the Koichiro Takahashi equation to calculate the evaporation from land surface. Then reverse calculate the evaporation from the lake surface in terms of the relationship between evaporations from land and lake surface.
E=TT
eP
P
5.234.34
28.13100
3100 (7)
In Eq.7, E means monthly ground evaporation; T means mean of monthly temperature, P means monthly rainfall.
Eh=k El (8) In Eq.8, Eh means the evaporation of lake surface El means the evaporation from land surface ,and K
means relevant parameter. From the relevant information, we can see that the evaporation of water surface of this region is about 1000 1110mm/a, which is almost 5.5 times of the evaporation of land surface of the same region calculated by Koichiro Takahashi equation. So we define K is the value of 5.5 here.
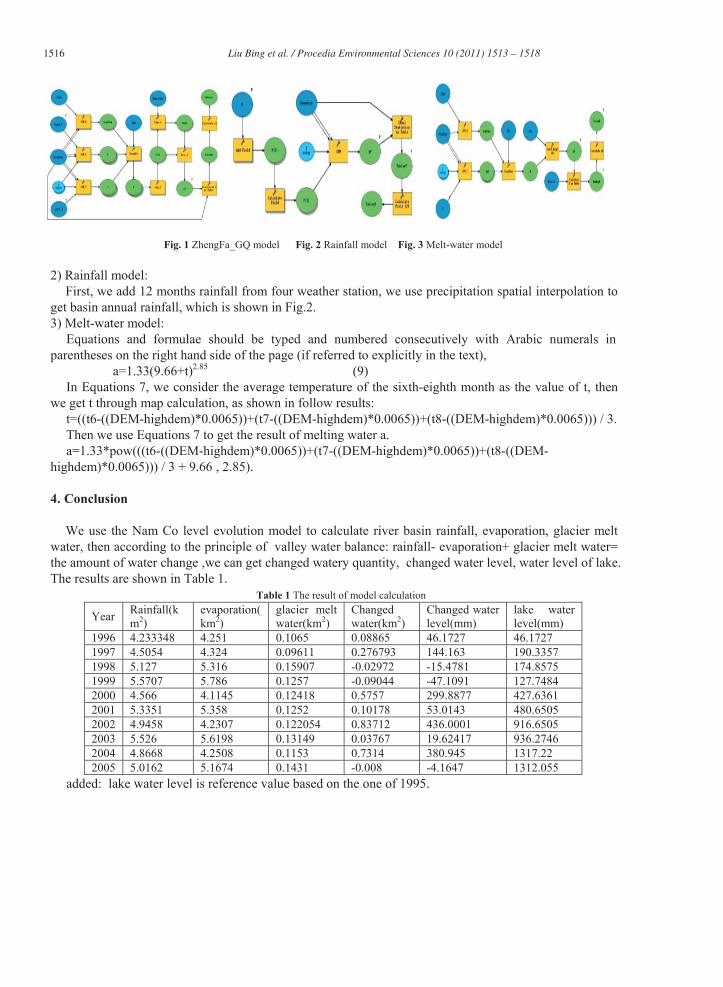
After correction to temperature, we proceed spatially interpolate on the temperature and precipitation of twelve months, and use the Koichiro Takahashi equation to calculate the evaporation from land surface of this valley, as shown in Eq.7.Then reverse calculate the evaporation from lake surface based on this, as shown in Eq.8.Finally we put evaporations from land and lake surface stack up to get the whole evaporation of the valley, as shown in Fig. 1 .
1516 Liu Bing et al. / Procedia Environmental Sciences 10 ( 2011 ) 1513 – 1518
Fig. 1 ZhengFa_GQ model Fig. 2 Rainfall model Fig. 3 Melt-water model
2) Rainfall model: First, we add 12 months rainfall from four weather station, we use precipitation spatial interpolation to
get basin annual rainfall, which is shown in Fig.2. 3) Melt-water model:
Equations and formulae should be typed and numbered consecutively with Arabic numerals in parentheses on the right hand side of the page (if referred to explicitly in the text),
a=1.33(9.66+t)2.85 (9) In Equations 7, we consider the average temperature of the sixth-eighth month as the value of t, then
we get t through map calculation, as shown in follow results: t=((t6-((DEM-highdem)*0.0065))+(t7-((DEM-highdem)*0.0065))+(t8-((DEM-highdem)*0.0065))) / 3. Then we use Equations 7 to get the result of melting water a. a=1.33*pow(((t6-((DEM-highdem)*0.0065))+(t7-((DEM-highdem)*0.0065))+(t8-((DEM-
highdem)*0.0065))) / 3 + 9.66 , 2.85).
4. Conclusion
We use the Nam Co level evolution model to calculate river basin rainfall, evaporation, glacier melt water, then according to the principle of valley water balance: rainfall- evaporation+ glacier melt water= the amount of water change ,we can get changed watery quantity, changed water level, water level of lake. The results are shown in Table 1.
Table 1 The result of model calculation
Year Rainfall(km2)
evaporation(km2)
glacier melt water(km2)
Changed water(km2)
Changed water level(mm)
lake water level(mm)
1996 4.233348 4.251 0.1065 0.08865 46.1727 46.1727 1997 4.5054 4.324 0.09611 0.276793 144.163 190.3357 1998 5.127 5.316 0.15907 -0.02972 -15.4781 174.8575 1999 5.5707 5.786 0.1257 -0.09044 -47.1091 127.7484 2000 4.566 4.1145 0.12418 0.5757 299.8877 427.6361 2001 5.3351 5.358 0.1252 0.10178 53.0143 480.6505 2002 4.9458 4.2307 0.122054 0.83712 436.0001 916.6505 2003 5.526 5.6198 0.13149 0.03767 19.62417 936.2746 2004 4.8668 4.2508 0.1153 0.7314 380.945 1317.22 2005 5.0162 5.1674 0.1431 -0.008 -4.1647 1312.055
added: lake water level is reference value based on the one of 1995.

1517 Liu Bing et al. / Procedia Environmental Sciences 10 ( 2011 ) 1513 – 1518
1) Referencing the 1995 lake water level, we use graph of coordinates to vividly express Nam Co water level changes and trends. From table 2 we can see that: Except that 1998, 1999 and 2005 the water level slightly declined, other years have a rising trend which water level is a growing. According to the reality, which basically comply with the result, can think that our model can accurately simulate lake water level changes.
2) We overlay water level DEM figures of the year of 1995 and 2005 to get the resu lt, as shown in Fig. 4 and Fig. 5. From the figures we can get the information that the area in southeast of lakes has become lager from 1995 to 2005, the result is that the water level has elevated and the water submerged the near land.
Fig. 4 1995 water level Fig. 5 2005 water level
Conclusions
This study applies the Model Builder of ArcGIS to constructs a lake level evolution space model, with which we use the data about temperature, precipitation and other relevant data, can quickly simulate the basin of water balance, so as to calculate the lakes of change, at the same time we can use computed water level data to generate the lake water level value vector diagram, then we use the animation tools in ArcGIS to display the dynamic evolution about the lakes water level, and we can get a very good visual ef fect. Research shows that using the existing GIS technology to build space model, can effectively simulate the evolution process of lakes water level.
Acknowledgements
This work is supported by Special Projects in the National Science & Technology Pillar Program.
References
[1] Liu Shi yin, Ding Yong jian, Shang guan Dong hui, et al. Glaciers in response to Recent climate warming in western China [J].Quaternary Sciences,26-5(2006),p.762-771.
[2] Pu Jian chen,Yao Tan dong, Wang Ning lian, et al. Fluctuations of the glaciers on the Qinghai-Xizang (Tibet) Plateau during the past century [J]·Journal of Glaciology and Geocryology,,20-4(2004),p.408-412.
[3] MA Xiao bo, LI Dong liang.Analyses on Air Temperature and Its Abrupt Change over Qinghai Xizang Plateau in Modern Age[J]. Plateau Meteorology. 22-05(2003),p.507-511
1518 Liu Bing et al. / Procedia Environmental Sciences 10 ( 2011 ) 1513 – 1518
[4] Chen Feng, Kang Shichang,Zhang Yongjun, You Qinglong. Glaciers and Lake Change in Response to Climate Change in the Nam Co Basin Tibet [J].Journal of Mountain Science,27-6( 2009), p.641-647.
[5] Jill McCoy. The Geoprogressing in ArcGIS. [Z]Beijing ESRI China (Beijing Co. Ltd(1999). [6] Wu Yanhong,Zhu Liping,Ye Qinghua,et al . The response of lake-glacier area change to climate variations in Nam Co
basin ,central Tibetan Plateau during the last hreedecades [J] .Acta Geographica Sinica,62-3(2007) ,p.301-311. [7] XU Heye, LI Xiaoyan,SUN Yongliang Climatic Change in the Lake Qinghai Watershed in Recent 47 Years[J]. Arid
Meteorology,25-2(2007),p.50-54. [8] Liang Hong,Liu Jing Miao,Zhang Jian cheng; Bi Yan meng,Wan Kaicun.Researchon Retrieval of the Amount of
Atmospheric Water Vapor over Qinghai-Xizang Plateau[J] .Plateau Meteorology,25-06(2006),p.1055-1062 [9] Gao Tanguang,Kang Shichang,Zhou Shiqiao,Liu Jing shi, Han Wen wu. A Study of the Summer Hydrological Features of
Glaciers in the Qugaqie River,Nam Co Basin[J].Journal of Glaciology and Geocryology,27-2(2005) : p.262 - 268. [10] He Xiao bo , Ding Yong jian , Liu Shi yin , et al. Observation analysis of hydrological process of the Kaltamak Glacier in
Muztag Ata [ J ] . Journal of Glaciology and Geocryology,27-2(2005),p.262 - 268. [11] Song Zheng shan Yang Hui, Zhang Qing yun .The characteristics of temporal and spatial variation of water resource
components over north China. PLATEAU METEOROLOGY,18-4(1999) ,p. 552O566. [12] Cao Li qing, Ge Zhao xia; Xue Mei. Climate change and its relationship with water resources in Xinjiang Uygur
Autonomous Region from 1951 to 2006[J]. Journal of Hehai University(Natural Sciences,37-3(2009),p.281-283. [13] Xie Zi chu, Feng Qing hua; Liu Chao hai. Modeling the Variation of Glacier
System-Taking the Southern Tibet Region as an Example [J].Journal of Glaciolgy and Geocryology,24-1(2002),p.16-24. [14] Shi Tie yu. Research on Methods of PMF with Thaw Military Supplies Calculation in Western of Tianshan Mountains[D]. [15] Saeed Nadi, Mahmoud R Delabar. Spatial-Temporal Modeling of Dynamic Phenomena in GIS [D].www. scangis.
org/scangis2003/papers/11.pdf. [16] Hu Shun jun, Tian Chang yan ,Zhou Hong fei .Estimation of land evaporation in The Weigan irrigated area of Xinjiang.
ARID LAND GEOGRAPHY. 23-1(2003),p.67-71.