Embed Size (px)
Citation preview

RESEARCH ON THE SAFETY IMPLICATIONS OF TAXI AND HIRE
CAR AGE LIMITS
by
Stuart NewsteadChristine Mulvihill
Laurie BuddCampbell Andrea
Masha FridmanNatalina NheuSjaan Koppel
April, 2015
Report No. Final

ii MONASH UNIVERSITY ACCIDENT RESEARCH CENTRE

MONASH UNIVERSITY ACCIDENT RESEARCH CENTREREPORT DOCUMENTATION PAGE
Report No. Date ISBN ISSN PagesFinal March 2015 1835-4815 (online) 79 + Appendices
Title and sub-title: Research on the safety implications of taxi and hire car age limits
Author(s): Newstead, S., Mulvihill, C., Budd, L., Andrea, C., Fridman, M., Koppel, S. and Nheu, N.
Sponsoring Organisation(s):This project was funded through a contract with the Taxi Services Commission (TSC).Abstract:
In response to recommendations from the review of the Victorian taxi industry, the objective of this project was to evaluate the appropriateness of current taxi and hire car age limits in ensuring safety of the taxi and hire car fleets. The aim was also to identify and analyse all associated issues including safety that the Taxi Services Commission (TSC) should consider in setting age limits for taxis and hire cars into the future. The project used a two phase methodology to meet these objectives. Phase one involved extensive consultation with relevant stakeholders in the taxi and hire car industries to determine issues relevant to the choice and operation of vehicles as taxis and hire cars. The second phase involved extensive analysis of the safety performance of the taxi and hire car fleet including the risk of crash involvement and injury outcomes related to vehicle choice in the event of a crash. The analysis then examined the relationship between these factors, taxi or hire car type and vehicle age. The safety performance was then used to construct an analytical model to test the influence of various scenarios not only for changes in taxi and hire car age limits but also scenarios related to safer vehicle choice and reduced vehicle crash risk related to improvements in driving standards. Finally, the economic worth of each of the scenarios considered was estimated in order to identify the most cost-effective strategies for improving the future safety of the taxi and hire car fleet. Recommendations for future policy on taxi and hire car age limits, vehicle choice and driver focused interventions were made and priorities for further research identified.
Key Words: Disclaimertaxi, vehicle safety, crash risk, injury outcome, statistical analysis, policy
This report is disseminated in the interest of information exchange. The views expressed here are those of the authors, and not necessarily those of Monash University
Reproduction of this page is authorised.
www.monash.edu.au/muarc
Monash University Accident Research Centre, Building 70, Clayton Campus, Victoria, 3800, Australia.
Telephone: +61 3 9905 4371, Fax: +61 3 9905 4363
SAFETY IMPLICATIONS OF TAXI AND HIRE CAR AGE LIMITS iii

iv MONASH UNIVERSITY ACCIDENT RESEARCH CENTRE

Preface
Project Manager / Team Leader:
Associate Professor Stuart Newstead
Research Team:
Ms Christine Mulvihill
Ms Laurie Budd
Mr Campbell Andrea
Dr Mash Fridman
Dr Sjaan Koppel
Ms Natalina Nheu
Contributorship Statement
Project design - SN
Survey design – SK, NN, CM, CA, SN
Survey administration and analysis – CM, CA
Data preparation and analysis – MF, LB, SN
Report preparation – SN, CM, LB
Ethics Statement
This project was approved by the Monash University Human Research Ethics Committee (Project Number: CF14/2641 – 2014001430).
Acknowledgements
We are grateful to the taxi and hire car customers and industry stakeholders for their time and insightful input in responding to surveys and semi-structured interviews.
SAFETY IMPLICATIONS OF TAXI AND HIRE CAR AGE LIMITS v

vi MONASH UNIVERSITY ACCIDENT RESEARCH CENTRE

GLOSSARY
aggressivity the risk of a vehicle killing or seriously injuring a person (vehicle occupant, pedestrian, bicyclist or motorcyclist) with which it collides
crashworthiness the risk of a vehicle’s own occupants being killed or seriously injured in a crash
ANCAP Australian New Car Assessment Program. A laboratory based program to assess the relative safety of vehicles through crash testing and assessment of fitted safety features (see www.ancap.com.au). ANCAP is similar to New Car Assessment Programs (NCAP) run in other countries, particularly EuroNCAP from which it takes a range of test results to publish locally.
primary safety the risk of being involved in a crash per unit of exposure (generally time or distance travelled
road trauma deaths or injuries resulting from road crashes
secondary safety the risk of being injured to some degree in the event of a crash
serious injury injury resulting in admission to hospital
total secondary safety the combined crashworthiness and aggressivity performance of a vehicle reflecting the average risk of death or serious injury to all people involved in the crash
vehicle telematics are in-vehicle technologies that continually monitor driver behaviour and vehicle state and report on dangerous behaviours such as speeding and sudden heavy braking.
SAFETY IMPLICATIONS OF TAXI AND HIRE CAR AGE LIMITS vii

Contents
GLOSSARY VI
EXECUTIVE SUMMARY IX
1 BACKGROUND AND AIMS 21.1 BACKGROUND 21.2 CURRENT REGULATIONS CONCERNING TAXI AND HIRE CAR AGE LIMITS 21.3 PROJECT OBJECTIVES AND SCOPE 5
2 DATA 72.1 TAXI AND HIRE CAR FLEET DATA 72.2 TSC COMPLIANCE INSPECTION DATA AND VICROADS ROADWORTHINESS
DATA 82.3 REGISTRATION DATA 92.4 CRASH DATA 102.5 VEHICLE SECONDARY SAFETY DATA 102.6 CRASH COST AND EMISSIONS ESTIMATES FOR ECONOMIC ANALYSIS
11
3 METHODS 143.1 PHASE 1: STAKEHOLDER CONSULTATION 14
3.1.1 Development of questionnaires and structured interviews 153.1.2 Stakeholder recruitment and survey administration 15
3.2 PHASE 2: QUANTITATIVE ANALYSIS 163.2.1 Quantifying vehicle primary safety (crash risk) performance 173.2.2 Quantifying vehicle secondary safety performance 183.2.3 Age limit restrictions and vehicle safety feature scenario setting and modelling
193.2.4 Economic analysis of scenarios 223.2.5 Analysis of emissions effects of scenarios 233.2.6 Analysis of roadworthiness inspections data and licensing breaches related to
vehicle age and roadworthiness 23
4 RESULTS: PHASE 1 STAKEHOLDER CONSULTATION 254.1 SURVEY RESPONSES 25
4.1.1 Taxi and hire car operator survey 254.1.2 Taxi and hire car customers survey 254.1.3 Taxi and hire car industry stakeholder survey 25
4.2 SURVEY DATA ANALYSIS 254.3 SUMMARY OF SURVEY OUTCOMES BY KEY THEME 25
4.3.1 Justification for the current age limit restrictions on taxis and hire cars 254.3.2 Identification of methods and motivations for selection and purchase of the current
taxi and hire car fleet including consideration of purpose modified vehicles (e.g., wheelchair accessibility). 28
4.3.3 Anticipated changes in profile of the taxi and hire car fleet with the closure of Australian vehicle manufacturing 29
4.3.4 Identification of economic and utility constraints on vehicle purchase, maintenance, repair and replacement 31
4.3.5 Safety related issues identified by enforcing authorities including common trends in roadworthiness issues related to operation and age based trends 32
4.3.6 Operation, efficiency and effectiveness of the current inspection regime 33
viii MONASH UNIVERSITY ACCIDENT RESEARCH CENTRE

4.3.7 Comfort and presentation of the taxi and hire car fleet related to vehicle age34
5 RESULTS: PHASE 2 QUANTITATIVE ANALYSIS 355.1 PRIMARY SAFETY ESTIMATES 355.2 SECONDARY SAFETY ESTIMATES 395.3 SCENARIO MODELLING 45
5.3.1 Scenarios Considered 455.3.2 The Baseline Scenario 475.3.3 Crash Savings Estimates505.3.4 Emissions analysis 515.3.5 Economic analyses 56
5.4 ANALYSIS OF COMPLIANCE DATA 64
6 SUMMARY AND CONCLUSIONS 696.1 PHASE 1: STAKEHOLDER CONSULTATION 696.2 PHASE 2: QUANTITATIVE ANALYSIS 72
7 RECOMMENDATIONS 777.1 DATA ISSUES 777.2 VEHICLE AGE LIMITS 777.3 VEHICLE SAFETY SPECIFICATION 787.4 DRIVER TRAINING AND MONITORING 787.5 THE ROLE OF THE COMPLIANCE REGIME 79
8 FURTHER RESEARCH AND EVALUATION 80
9 REFERENCES 81
APPENDIX 1: LETTER OF INVITATION TO STAKEHOLDERS 83
APPENDIX 2: TAXI AND HIRE CAR OPERATOR SURVEYS 85
APPENDIX 3: INTERSTATE TAXI REGULATOR SURVEY 86
APPENDIX 4: DETAILED ANALYSIS OF STAKEHOLDER SURVEY RESPONSES87
A4.1 JUSTIFICATION FOR THE CURRENT AGE LIMIT BASED RESTRICTIONS ON TAXIS AND HIRE CARS 87
A4.2 IDENTIFICATION OF METHODS AND MOTIVATIONS FOR SELECTION AND PURCHASE OF THE CURRENT TAXI AND HIRE CAR FLEET 93
A4.3 ANTICIPATION OF CHANGES IN PROFILE OF THE TAXI AND HIRE CAR FLEET WITH THE CLOSURE OF AUSTRALIAN VEHICLE MANUFACTURING
110A4.4 IDENTIFICATION OF ECONOMIC AND UTILITY CONSTRAINTS ON
VEHICLE PURCHASE, MAINTENANCE, REPAIR AND REPLACEMENT 112A4.5 SAFETY RELATED ISSUES IDENTIFIED BY ENFORCING AUTHORITIES
INCLUDING COMMON TRENDS IN ROADWORTHINESS ISSUES RELATED TO OPERATION AND AGE BASED TRENDS 133
A4.6 OPERATION, EFFICIENCY AND EFFECTIVENESS OF THE CURRENT INSPECTION REGIME 150
a4.7 Comfort and presentation of the taxi and hire car fleet related to vehicle age 168
SAFETY IMPLICATIONS OF TAXI AND HIRE CAR AGE LIMITS ix

x MONASH UNIVERSITY ACCIDENT RESEARCH CENTRE

EXECUTIVE SUMMARY
Aims
In September 2012, the results of an extensive inquiry into the Victorian taxi industry were published (TSC, 2012). Two of the recommendations relate to vehicle age limits and recommended further research into the prescribed age limits of the Victorian taxi and hire car fleets. Vehicle age limits and other specifications for taxis are prescribed under Regulation 12 of the Transport (Taxi-Cabs) Regulations 2005. Entry and exit age limits for taxis vary depending on the zone of operation and the type of taxi (conventional and wheelchair accessible taxi (WAT)). Hire car entry and exit age limits are specified in the age and type requirements which form part of hire car licence conditions. Special Purpose Vehicles and Restricted Hire Cars were not considered as part of the study due to difficulty in identifying these vehicles in the available data.
The project aimed to analyse the evidentiary basis of current age limits and produce a set of recommendations that will inform the Taxi Services Commission (TSC) to set policy based on links between the maximum operating life of a taxi or hire car and safety outcomes. In addition to age limits, this includes the provision of links to vehicle maintenance and roadworthiness to provide a robust evidence base for achieving safety outcomes.
Data
Key databases and their sources to underpin this research were:
A snapshot of the current registered taxi and hire car fleet as at July 2014 detailing taxi and hire car type and vehicle type including age (provided by the TSC).
Annual snapshots on all registered vehicles in Victoria from 2000 to 2012 from which taxis and hire cars could be identified (provided by VicRoads).
Records of all police reported casualty crashes (crashes involving at least one person being injured) in Victoria from January 2000 to December 2012 from which crashes involving taxis and hire cars could be identified (provided by VicRoads).
Data on outcomes of all taxi and hire car roadworthiness inspections carried out by TSC compliance staff on a random or targeted basis over the period 1 May 2014 to 21 November 2014 and recorded in the TSC iFacts database (provided by the TSC).
Data on relative vehicle secondary safety performance (risk of injury given crash involvement) from the Used Car Safety Ratings (UCSRs [Newstead et al., 2013] available from Monash University research).
Average unit cost to the Australian community of road crashes estimated based on the human capital approach (sourced from the Commonwealth Bureau of Transport and Regional Economics).
Data on vehicle emissions (sourced from the Commonwealth Government Green Vehicle Guide).
Methods
The project was undertaken in two key phases.
SAFETY IMPLICATIONS OF TAXI AND HIRE CAR AGE LIMITS xi

Phase 1 involved consultation with stakeholders in the taxi and hire car industry using a survey based approach. Stakeholders surveyed included taxi and hire car operators, licensed vehicle testers (LVTs), VicRoads, RACV, vehicle conversion companies, taxi equipment manufacturers and installers, new vehicle manufacturers (through the Federal Chamber of Automotive Industries), taxi and hire car customers and interstate taxi regulators. The following themes were considered in the consultation phase:
1. Justification for the current age limit based restrictions on taxis and hire cars
2. Identification of methods and motivations for selection and purchase of the current taxi and hire car fleet including consideration of purpose modified vehicles (e.g. wheelchair accessibility)
3. Anticipated changes in profile of the taxi and hire car fleet with the closure of Australian vehicle manufacturing
4. Identification of economic and utility constraints on vehicle purchase, maintenance, repair and replacement including consideration of purpose modified vehicles (e.g. wheelchair accessibility)
5. Safety related issues identified by enforcing authorities including common trends in roadworthiness issues related to operation and age based trends
6. Operation, efficiency and effectiveness of the current inspection regime
7. Comfort and presentation of the taxi and hire car fleet related to vehicle age.
Phase 2 of the project comprised a number of key analytical tasks to quantify the safety performance of the current taxi and hire car fleets based on the current entry and exit age requirements. Safety performance has been considered in terms of the risk of crash involvement (primary safety) and the risk of someone being injured given crash involvement (secondary safety). Once the base safety profile was established the safety implications of changing the entry and exit criteria was examined as a first consideration. Then the likely implications of changing the types of vehicles used by the taxi and hire car fleet as well as the inclusion of various emerging safety features was examined, particularly those features targeted at crash avoidance such as intelligent speed adaptation and forward collision warning and mitigation.
The general methodology applied to examine the potential safety effects of changing the age based entry and exit criteria included the following steps:
Identification of registered taxis and hire cars in the Victorian fleet including the make and model details of these vehicles. Identification was informed by registration plate details (using defined taxi and hire car formats) supplemented by information on plates allocated to taxi and hire car licence holders held by the TSC. Vehicles identified were classified into groups according to mandated vehicle age limits based on the type of taxi or hire car licence (metro, peak service or substitute, urban, country or hire car).
Matching the identified registered taxis and hire cars to the police-reported crash data and estimating crash risk per registered vehicle year by usage type and vehicle age. Trends in crash risk by vehicle age were then analysed for each taxi and hire car type.
Matching vehicle secondary safety characteristics to each registered and crashed vehicle to estimate a secondary safety profile of the vehicle fleet by taxi and hire car licence type in terms of crashworthiness (protection of the taxi or hire car
xii MONASH UNIVERSITY ACCIDENT RESEARCH CENTRE

occupants from injury in a crash), aggressivity (protection from injury of other road users colliding with the taxi or hire car) and total secondary safety (protection from injury of all people involved in a crash involving a taxi or hire car).
Calculation of the base primary and secondary safety profile of the taxi and hire car fleet by age of vehicle and vehicle usage category calibrated against the observed recent police reported crash profile for the most recently available years.
Based on the stakeholder consultation in Phase 1 of the project, a range of fleet change scenarios were formulated. These included modified vehicle age profile scenarios, change in vehicle safety performance scenarios, vehicle crash avoidance technology fitment scenarios and changed crash risk scenarios.
Each scenario was applied to the base safety profile to determine the net road trauma effects of each in terms of expected net changes in the number of reported crashes and corresponding road trauma (number of deaths, serious injuries and minor injuries). These changes were then calculated in terms of economic benefits using the estimated average crash costs to the community to derive benefit to cost ratio (BCR) and net annual worth estimates. In addition to the safety benefits, the vehicle emissions effects of each scenario were also estimated and translated into community costs using an assumed dollar value for carbon emissions. Modified BCR estimates were then calculated incorporating both trauma saving and emissions savings as benefits.
Phase 1: Results of Stakeholder Consultation
The stakeholder consultation phase revealed a number of important insights into the operational practices, beliefs and business imperatives of the taxi and hire car industry relevant to the aims of the study.
Over 60% of taxi and hire car operators thought the current taxi and hire car age limits were necessary and appropriate but not sufficient for achieving minimum standards in vehicle safety, condition, presentation and comfort. Safety was the most important factor identified by respondents as the basis for the age limit restrictions. The most important safety related factor identified by those in support of the current age based restrictions was that newer vehicles have a higher standard of safety and safety related features compared to older vehicles.
Those who were not in support of the age restrictions believed that other factors impacted on safety independently of vehicle age including vehicle condition, the standard and frequency of maintenance and servicing and vehicle mileage. Respondents with these views comprised only a small proportion of the sample.
Whilst respondents recognised that factors other than vehicle age can still impact on safety, the opinion of respondents was that these factors were harder to enforce, monitor, and or measure compared to age based restrictions.
As most vehicle operators were unable to specify their anticipated vehicle purchasing choices in the future and anticipate the impacts of closure of the Australian vehicle manufacturing, there is scope for the TSC to provide guidance or set boundaries around the types of vehicles that could be introduced in future, particularly with respect to improved safety standards.
To maximise economic benefits, most operators indicated that initial vehicle purchasing costs needed to be weighed against the likely return on investment that could be achieved over the lifetime of the vehicle as a taxi or hire car. As most operators purchased their
SAFETY IMPLICATIONS OF TAXI AND HIRE CAR AGE LIMITS xiii

vehicles between 0-18 months of age, extending the maximum entry age limits is unlikely to be economically important for most operators, particularly those operating in metropolitan zones with a high annual vehicle mileage. Although purchase price was rated as highly important in vehicle purchasing choices, other economic and utility constraints were also rated as highly important by respondents including vehicle size and type, familiarity with the vehicle, servicing and maintenance costs and reliability. Customer satisfaction with style, look and preference was also rated as highly important with respondent hire car operators and they were less likely than taxi operators to set a limit on the purchase price of their vehicles.
Most taxi operators retired their vehicles an average of six months prior to the maximum exit age, having clocked an average of 720,000 kilometres. This suggests economic viability drives vehicle turnover, rather than the existing regulation. Increasing maintenance and servicing costs were rated as being highly important in the decision to retire a vehicle from the fleet, along with other economic factors including the vehicle being off the road too often and/or too long and the vehicle being no longer economic to run.
Whilst most respondents believed the annual and random vehicle inspection regime was both important and effective in maintaining the safety of vehicles, a large proportion thought that the inspections only provide a ‘snapshot in time’ of the safety of a vehicle, potentially allowing operators to overlook problems that arise at other times. As such, the random vehicle inspection process was deemed to be much more important for ensuring a minimum standard of safety and maintenance at times outside of the annual inspection. A number of suggestions were made to improve the process including: increasing the frequency and diversity of locations in which random inspections are conducted and implementing a more targeted regime to focus on vehicles with previously identified safety issues.
Overall, vehicle age limits were considered by respondents to be appropriate criterion to improve or ensure safety, but needed to be considered along with other factors including the standard and frequency of vehicle maintenance and servicing; the implementation of objective and targeted vehicle inspection regimes and, most importantly, vehicle safety performance as reflected through consumer safety ratings. In addition to age limits, a number of stakeholders suggested the potential for introducing a set of standards relating to minimum safety levels, based on Australian New Car Assessment Program (ANCAP), (reflecting that higher ratings in EuroNCAP tests, which are very similar to ANCAP, have been shown to correlate to lower real world injury risk in a crash - Lie and Tingvall, 2002), or similar criteria including a phase-in timetable of desirable safety features or ratings along with incentives for their adoption.
Phase 2: Results of quantitative analysis
The analytical phase of this study has been able to quantify safety performance of current taxi and hire car fleets in terms of both the risk of a vehicle being involved in a crash (primary safety) as well as the contribution of the design and specification of the vehicle to the likelihood of the crash resulting in death or serious injury to those involved (secondary safety). Quantification of the safety performance of taxis and hire cars revealed a number of key attributes of the taxi and hire car fleet relevant to the objectives of the study.
Vehicle crash risk (primary safety):
xiv MONASH UNIVERSITY ACCIDENT RESEARCH CENTRE

Analysis of crash risk data identified no clear relationship between the age of a given vehicle and its risk of being involved in a crash.
Analysis of data on targeted and random roadworthiness inspections of taxis and hire cars by the TSC showed a clear increase in the rate of vehicle defects and un-roadworthy vehicles as the vehicle ages. However, since analysis of crash risk identified no association between crash risk and vehicle age, this suggests that either the TSC’s inspection regime is effective at identifying vehicle defects before they lead to crashes and that these defects are promptly rectified, or that vehicle defects have a weak association with crash risk which has been identified in previous research (van Schoor et al., 2001).
Crash risk throughout their operating life was found to be much higher for taxis compared to hire cars, particularly in the case of metropolitan taxis. The higher crash risk in taxis could not be explained purely by the greater number of kilometres taxis travel compared to hire cars, suggesting there are factors beyond vehicle exposure that contribute to crash risk in taxis. Relevant factors could include the unique travel patterns of taxis, the overall driving standard of taxi drivers and taxi driver shift demands. This highlights a clear opportunity to better understand those factors and develop targeted policies to reduce crash risk in taxis. A scenario was modelled to quantify the benefits of reducing the crash risk of taxis to the same level as that of hire cars. This scenario showed the greatest economic benefit of all scenarios modelled.
Injury mitigation (secondary safety) in crashes related to vehicle specification:
Like the wider light vehicle fleet, analysis identified a consistent long term trend of improvement in secondary safety of the taxi and hire car fleet with the risk of being killed or seriously injured in a crash involving a taxi or hire car improving by around 2% each year.
The analysis showed that the secondary safety for a given vehicle does not change with the age of that vehicle. Secondary safety improvements in the taxi fleet were observed over time resulting from adoption of new technology or better designs in new vehicles entering the fleet. Regeneration of the taxi and hire car fleet under the current age restrictions has resulted in the continual adoption of new technology and better designs in the fleet with associated secondary safety benefits.
If the rate of regeneration of the taxi and hire car fleet to was to slow down, the rate of reduction in deaths and serious injury would also slow down. The converse is also true, meaning a faster regeneration of the fleet would have benefits in reducing road trauma associated with taxi and hire car crashes.
Three types of scenarios were modelled to estimate economic impacts of various potential policy measures. The first type relates to targeting different rates of fleet regeneration by imposing different vehicle age limits. The second type relates to targeting secondary safety improvements more directly, through specification of vehicles with higher secondary safety performance. The third type considers the benefits of reducing the crash risk of taxis to the same level as hire cars.
Safety and economic effects related to vehicle age limit scenarios:
SAFETY IMPLICATIONS OF TAXI AND HIRE CAR AGE LIMITS xv

Changing maximum exit vehicle age limits will impact secondary safety outcomes to the extent that the age limits influence operators’ decisions on when to retire their vehicles. Stakeholder consultation suggests that the current age limits have limited influence on most operators’ decisions, as the age limits generally coincide with the timing of vehicle retirement due to economic considerations such as escalating maintenance and servicing costs. This indicates that reducing maximum exit age limits is likely to increase fleet regeneration rates and result in secondary safety benefits. Increasing maximum exit age limits may slow down fleet regeneration rates, but possibly only by a very small amount given other economic reasons to retire vehicles earlier.
Modelling of a scenario to set exit age limits at 10 years for all vehicles, compared to the current variable age limits (which for most vehicles are between 5 and 6.5 years), assumed operators currently constrained to lower age limits would retain their vehicles up to the new maximum age limit. This assumption will likely overestimate resulting reduction in secondary safety benefits, providing a conservative estimate of the increase in road trauma from a 10 year exit age limits.
Applying the established scenario model demonstrated that changing taxi and hire car age limits is estimated to have only modest impacts on the secondary safety of the fleet and hence road trauma. Setting the maximum operating age of taxis and hire cars to five years for all vehicles would save around six (2%) of around 300 crashes involving taxis and hire cars resulting in injury annually. Based on the current injury severity profile of crashes involving taxis this translates to around 1.5 fatal and serious injury crashes and 4.5 minor injury crashes. Setting the maximum age limit at one year was estimated to save 19 (6%) of crashes resulting in injury per annum, with 4.7 of these estimated to be fatal or serious and 14.3 minor. Setting the maximum age limit for all taxis and hire cars at 10 years was estimated to result in up to an additional 16 (5%) crashes involving injury (4 fatal or serious injury and 12 minor injury) per annum assuming all operators retain their vehicles to the maximum age limit.
Changes to the rate of regeneration of the taxi and hire car fleet also has cost implications. Faster regeneration of the fleet will result in increased vehicle costs, while slower regeneration will result in vehicle cost savings. Again, the extent to which changes in maximum vehicle age limits influences this cost depends on the extent to which the age limits influence operators’ decisions to retire their vehicles. Modelling of changes to maximum age limit scenarios assumes operators will retain their vehicles up to the new limits. This assumption is likely to overestimate the cost savings in the scenario where the maximum age limit is increased to 10 years. Given these assumptions, the additional annual vehicle costs, annual road trauma savings to the community and net annual costs to the community are summarised as follows for each age change scenario compared to the base scenario which is calculated from the current variable age limits:
Scenario Additional Annual Vehicle Costs
Annual Trauma Cost Savings
Net annual worth
A1- All Max 6.5 Years $5,155,897.44 $392,137.29 -$4,763,760.15
A2 - All Max 5 Years $11,386,321.20 $683,339.19 -$10,702,982.01
A3 - All Max 3 Years $39,349,828.86 $1,311,101.79 -$38,038,727.07
A4 - All Max 1 Years $96,019,934.88 $2,156,997.90 -$93,862,936.98
xvi MONASH UNIVERSITY ACCIDENT RESEARCH CENTRE

A5 - All Max 10 Years -$14,323,270.57 -$1,788,630.81 $12,534,639.76
The relationship between the uniform maximum age limit for all taxis and hire cars and net annual worth is summarised in Figure E.1. The estimates give the net annual worth relative to the current variable age limits.
Figure E.1: Difference between scenario benefits and costs by maximum age of taxi or hire car
y = 5E+07ln(x) - 9E+07R² = 0.992
-$100,000,000.00
-$80,000,000.00
-$60,000,000.00
-$40,000,000.00
-$20,000,000.00
$0.00
$20,000,000.00
$40,000,000.00
0 2 4 6 8 10 12
Diffe
renc
e be
twee
n be
nefit
s and
cost
s
Maximum vehicle age
Benefits-Costs
Log. (Benefits-Costs)
Whilst increasing vehicle age limits showed positive estimated economic benefits, it is important to understand the assumptions underpinning the modelling, including the dollar values assigned to road trauma which are detailed in Section 2.6 and the vehicle cost assumptions detailed in Section 5.3.5.
Safety and economic effects related to specification of a higher level of secondary safety in vehicles to reduce the risk of injury in the event of a crash through use of resources such as ANCAP and encouraging uptake of identified effective secondary safety technologies:
Modelling of improved secondary safety performance in the taxi and hire car fleet assumed the current fleet is replaced by similar sized vehicles with the highest secondary safety performance available on the market. This provides an upper-bound estimate of the potential economic benefits of policy measures to lift secondary safety levels of the fleet.
Ensuring all vehicles used as taxis and hire cars have the best possible secondary safety performance identified potential savings in crashes resulting in injury of 23% (70 per year – 17 fatal and serious injury, 53 minor injury). This would equate to benefits to the community of up to $7,000 per vehicle. Previous studies have shown that often superior secondary safety performance can be achieved for no extra vehicle expenditure and in some cases for less money. All that is required is to make vehicle secondary safety the top priority in vehicle selection. The UCSRs of Newstead et al. (2013) show that vehicles with excellent secondary safety performance exist in all market groups but particularly in medium and large vehicles, many with very moderate purchase price, which are generally the types of
SAFETY IMPLICATIONS OF TAXI AND HIRE CAR AGE LIMITS xvii

vehicles used as taxis and hire cars. On this basis, very high cost benefit figures could be achieved in reality for this scenario.
Safety and economic effects related to policy measures to reduce crash risk of taxis and hire cars:
Modelling of the benefits of countermeasures to reduce crash risk of taxis and hire cars considered the benefits of emerging vehicle crash avoidance technologies based on the best current evidence of their effectiveness. It also considered the general benefits of other behavioural and enforcement based approaches that might improve driver behaviour such as stricter accreditation criteria, and continuous monitoring of driver behaviour via automated electronic systems (telematics).
Inclusion of emerging driver assistance technology aimed at crash avoidance on all taxis and hire cars showed potential for crash reduction and economic benefits. For example, including Autonomous Emergency Braking on all taxis was estimated to reduce injury crash numbers by around 24% with expenditure of up to $7,000 per vehicle to include the technology producing positive economic benefits to the community. Up to $1,500 per vehicle could be spent on technologies reducing crash risk by only 5% and produce positive economic benefits to the community.
Countermeasures effective in reducing the crash risk on a distance travelled basis of regular taxi drivers relative to that of hire car drivers could achieve around a 50% reduction in taxi crash rates. Up to $15,000 per vehicle could be invested on countermeasures to achieve this goal with positive economic benefits to the community. Further research would be needed to identify the specific countermeasures which would be most effective in producing this outcome although they may include a stricter accreditation process and the use of vehicle telematics to continuously monitor driver behaviour.
Recommendations
Listed below is a summary of recommendations for consideration by the TSC in formulating a package of policy options to improve safety outcomes. These should be read in conjunction with the full recommendations as set out in Section 7:
TSC consider policy options to maintain or increase the rate of regeneration of the taxi and hire car fleet to ensure sustained secondary safety improvement of the fleet over time. If the rate of regeneration of the taxi and hire car fleet was to slow down, the rate of reduction in deaths and serious injury would also slow down. The converse is also true, meaning a faster regeneration of the fleet would have benefits in reducing road trauma associated with taxi and hire car crashes.
TSC consider applying a five (5)-star ANCAP (the Australian New Car Assessment Program) rating for all vehicles being licensed as taxis or hire cars for the first time reflecting the established relationship between higher NCAP scores and reduced injury risk in a crash (Lie and Tingvall, 2002).
TSC identify new vehicle crash avoidance technologies which will be beneficial for improving taxi and hire car safety and encourage uptake of these technologies in the fleet both directly with operators and through key fleets supplying second hand vehicles purchased by taxi and hire car operators such as Government, corporate and rental car fleets.
xviii MONASH UNIVERSITY ACCIDENT RESEARCH CENTRE

TSC implements enhanced ongoing performance monitoring and measurement of safety through:
o data collection and archiving for TSC registered field and compliance databases and establishment of an electronic database of periodic roadworthiness inspection outcomes
If, after the analysis presented in this report, the TSC considers vehicle age limits relevant, setting of any future age limits should be made having regard to the safety and economic impacts highlighted in the report.
TSC investigates countermeasures to reduce the identified high crash risk associated with taxi drivers including:
o On-road competency testing of taxi drivers at the time of accreditation, and
o The use of vehicle telematics to allow permit holders to continuously monitor and report on driver behaviour.
SAFETY IMPLICATIONS OF TAXI AND HIRE CAR AGE LIMITS xix

RESEARCH ON THE SAFEY IMPLICATIONS OF TAXI AND HIRE CAR AGE LIMITS
SAFETY IMPLICATIONS OF TAXI AND HIRE CAR AGE LIMITS 1

1 BACKGROUND AND AIMS
1.1 BACKGROUND
In September 2012, the results of an extensive inquiry into the Victorian taxi industry were published (TSC, 2012). The inquiry made a raft of recommendations about reforms to the Victorian taxi industry, the majority of which have been accepted by the Victorian Government. Two of the recommendations, 3.6 & 6.2, relate to vehicle age limits and recommended further research into the prescribed age limits of the Victorian taxi fleet should be carried out. The specific recommendations are:
Recommendation 3.6 Age limits for other taxi vehicles and luxury PBO vehicles should remain unchanged at this time (subject to the Taxi Services Commission undertaking further research on the impact of age on vehicle safety, as per recommendation 6.2). These age limits should be applied to PBO vehicles that do not meet the luxury vehicle tax threshold:
maximum vehicle age: 6.5 years maximum vehicle age for entry into the taxi and non-luxury PBO fleet: 2.5
years.
Recommendation 6.2 Consistent with recommendations 3.2, 3.3 and 3.5, superior designed, purpose-built taxi vehicles should be encouraged to operate in the Victorian fleet to improve safety as well as accessibility. The Taxi Services Commission should conduct further research into the influence of the age of vehicles on safety to determine whether to retain and/or amend other taxi and PBO car age limits in the future.
In the recommendation, PBO means a pre-booked only vehicle (i.e. a hire car displaying VHA, VHB, VHC registration plates). The recommendation applies to both taxis and hire cars.
The Taxi Services Commission (TSC) regulates the taxi and hire car industry in Victoria having replaced the Victorian Taxi Directorate (VTD) as the industry regulator on 1 July 2013. The TSC is responsible for implementing the Victorian Government’s taxi reform program. The TSC engaged the Monash University Accident Research Centre (MUARC) to provide research services to address recommendations 3.6 and 6.2 of the Taxi Industry Inquiry (TSC, 2012).
1.2 CURRENT REGULATIONS CONCERNING TAXI AND HIRE CAR AGE LIMITS
Regulation 12 of the Transport (Taxi-Cabs) Regulations 2005 provides that the licensing authority may determine and publish in the Victorian Government Gazette specifications for all taxi-cabs or for a class of taxi-cab. Under these regulations, taxi age limits have been gazetted which align with VicRoads standards for taxis (documented in “Licenced Passenger Vehicle Standards – Taxis, December 2005”) which are referred to by Licenced Vehicle Testers when inspecting taxis. Random on-road vehicle inspections can also be conducted to verify that checks are being completed in line with licensing requirements.
Entry age limits (the time the vehicle first becomes a taxi or hire car) and / or maximum operating age limits for taxis and hire vehicles apply. All vehicle ages are calculated from the
2 MONASH UNIVERSITY ACCIDENT RESEARCH CENTRE

build date shown on the compliance plate on the vehicle. These vary according to vehicle type (luxury, people mover, hybrid etc.), region of operation, type of operator (taxi, hire car), purpose of vehicle (e.g. wheelchair access) and the type and level of luxury of vehicle. For example, in the case of taxis, the following applies:
• The entry age limit at which vehicles can be introduced into service is 2.5 years for metropolitan taxis with no entry age limit for country areas.
• The maximum operating age limit applicable to conventional taxis is 6.5 years (metropolitan and urban) and 7.5 years (regional and country). The maximum operating age limit for all wheelchair accessible taxis (WATs) is 10.5 years.
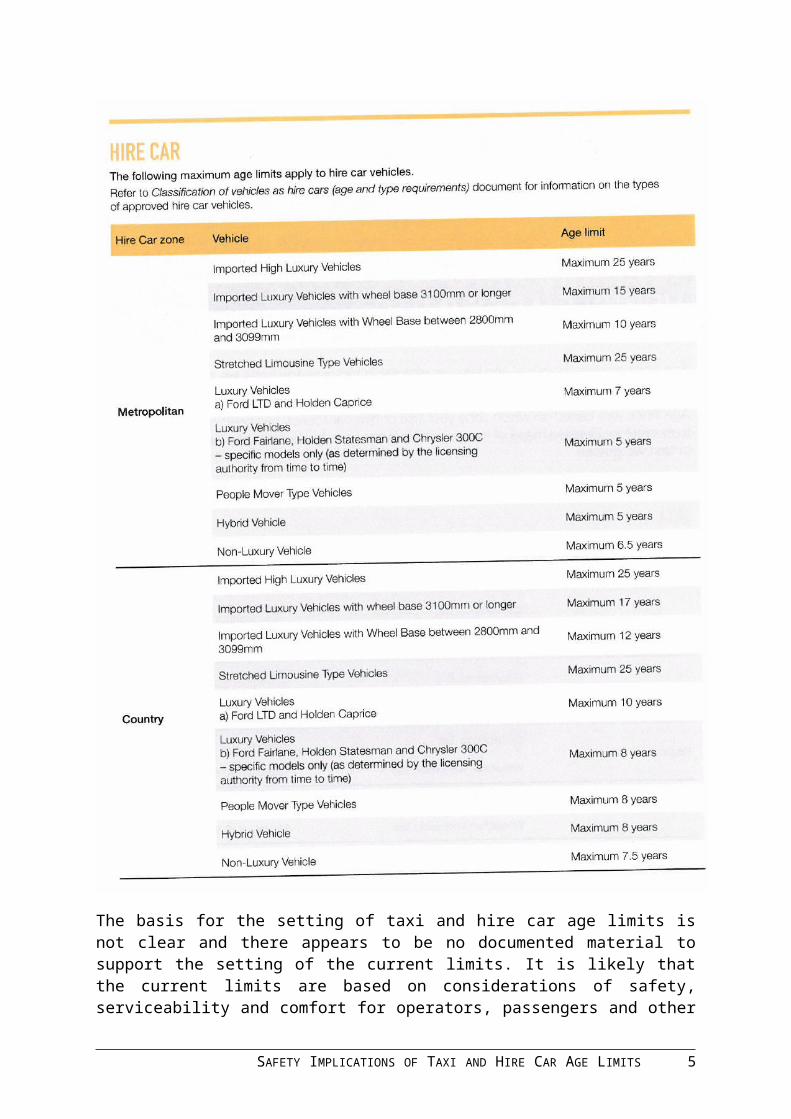
Figures 1 and 2 give full details of the taxi and hire car age limits currently in force.
Figure 1.1: Current Taxi Age Limits in Victoria
Figure 1.2: Current Hire Car Age Limits in Victoria
SAFETY IMPLICATIONS OF TAXI AND HIRE CAR AGE LIMITS 3

The basis for the setting of taxi and hire car age limits is not clear and there appears to be no documented material to support the setting of the current limits. It is likely that the current limits are based on considerations of safety, serviceability and comfort for operators, passengers and other road users balanced against economic imperatives for the operators.
4 MONASH UNIVERSITY ACCIDENT RESEARCH CENTRE

The TSC applies the Luxury Car Tax Threshold (LCTT - under the ‘A New Tax System (Luxury Car Tax) Act 1999 (Commonwealth) to distinguish between luxury and non-luxury vehicles to calculate age limits. The LCTT is currently $61,884. For example, a new vehicle with a recommended retail price (RRP) equal to or greater than the LCTT is deemed 'luxury’ whereas a vehicle with a RRP less than the LCTT is deemed 'non-luxury'.
The TSC implemented the non-luxury hire car category in December 2013 as part of taxi industry reforms. Further, the TSC applied a 6.5 year operating age limit on non-luxury vehicles.
Consequently, there are views that hire car age limits could be simplified across the vehicle range, particularly having regard to recent changes to include non-luxury and hybrid vehicles.
The recommendations in this report provide scope for TSC to ensure the appropriate policy settings are applied to the operating life of hire cars in the longer term.
Most other states and territories of Australia apply the same or similar taxi and hire car age limits although, like Victoria, there does not appear to be any specific evidence to justify the limits set.
To further ensure the safety and serviceability of taxis and hire cars, various schemes for assessing the roadworthiness of vehicles are in place in Victoria. Taxis and hire cars must be inspected annually for roadworthiness or in the case of WATs, inspected annually until 6.5 years, then inspected six-monthly between 6.5 years and 10.5 years. In addition, a certificate of roadworthiness may also be requested by an authorised officer – this can be an Industry Compliance Officer (ICO) within the TSC or a member of Victoria Police. Inspections are carried out by Licenced Vehicle Testers with a label affixed to the windscreen to verify compliance.
1.3 PROJECT OBJECTIVES AND SCOPE
The objective of this project was to evaluate current taxi and hire car age limits consistent with recommendations set out in the Taxi Industry Inquiry’s Final Report (TSC, 2012) and to make recommendations based on the completed research.
The scope of the project was to:
a) Develop a methodology that evaluates the appropriateness of existing age limits for taxis and hire cars in metropolitan and regional Victoria
b) Identify and analyse all associated issues (including any safety links) that the TSC should consider in setting age limits for taxis and hire cars into the future
c) Undertake extensive consultations with, and collect data where possible, from relevant stakeholders
d) Analyse the information available, and
e) Prepare an interim and final report on the appropriateness of existing age limits and make recommendations.
The focus is limited to age limits for taxis and hire cars in terms of entry and maximum operating age limits. Special Purpose Vehicles and Restricted Hire Cars are not part of this research. The project aimed to produce a set of recommendations that will enable the TSC to:
SAFETY IMPLICATIONS OF TAXI AND HIRE CAR AGE LIMITS 5

Assess the appropriateness of existing age limits
Establish whether there are links between the maximum operating life of a taxi or hire car and safety (including whether these vehicles are over represented in vehicle crashes and/or are subject to serious maintenance issues)
Provide a basis for setting vehicle age limits on the research undertaken, and
Take into account the applicable age limits for taxis and hire cars in other jurisdictions
6 MONASH UNIVERSITY ACCIDENT RESEARCH CENTRE

SAFETY IMPLICATIONS OF TAXI AND HIRE CAR AGE LIMITS 7

2 DATA
2.1 TAXI AND HIRE CAR FLEET DATA
The TSC provided a snapshot of the registered taxi and hire car fleet as of July 2014. A record was supplied for each taxi and hire car licence on issue along with other details of the vehicle. Data fields provided were:
Licence type (Taxi, Hire Car – Metro Hire, Country Hire, Urban Hire, Metro Hire Stretched, Metro Hire Hybrid)
Licence Number Vehicle Registration Plate Number Vehicle Make Vehicle Model Data of Manufacture as per Vehicle Compliance Plate Engine Number Vehicle Identification Number, and Seating Capacity (Hire Cars only)
Records show that there are 6770 taxi and hire car licences on issue, with 5550 taxi licences and 1220 hire car licences. In some cases, information relating to the vehicle attached to the licence was incomplete as it was not captured correctly at the time of vehicle registration.
Based on the vehicle registration plate number format, taxis could be further classified by taxi licence type. These are listed in Table 2.1 with the number of licences in the snapshot.
Table 2.1: Taxi Licences by Licence Type (as at July 2014)
Licence Type Number of Licences
Metropolitan (M) 3804
Peak Service (PS) 589
Urban 239
Country 707
Unknown plate and vehicle details or incorrect plate format
211
Total 5550
Inaccuracies in the vehicle registration data related mainly to the recording of vehicle makes and models. For example, there were five different spellings of the make Toyota in the data and seven different spellings of the model Carnival. Although these could be largely rectified with manual intervention, this was not required due to the way in which the data was used in conjunction with the crash and registration data described later in this report.
A further limitation of the TSC database on registered taxis and hire cars was that it was only able to provide a snapshot of the current taxi and hire car fleet. It was not possible to
8 MONASH UNIVERSITY ACCIDENT RESEARCH CENTRE
interrogate the database to determine the composition of the taxi and hire car fleet at times in the past. This meant that this data was not useful for identifying taxis and hire cars in the crash and registration data. It was however useful for quantifying the broad composition of the taxi and hire car fleet and verifying the taxis and hire cars identified in the crash and registration data using the methods described later.
2.2 TSC COMPLIANCE INSPECTION DATA AND VICROADS ROADWORTHINESS DATA
The TSC provided data on outcomes of taxi and hire car roadworthiness inspections carried out by TSC compliance officers over the period 1 May 2014 to 21 November 2014 and recorded in the TSC iFacts database. These are either random or targeted inspections and are distinct from the periodic roadworthiness inspections carried out by VicRoads Licenced Vehicle Testers. Data provided covered 7109 vehicle inspections carried out over the data period. Data fields provided included
Vehicle type (Taxi, Hire Car) Taxi Quality Rating Inspection type (targeted, random) Inspection outcome Indicators of issuance of various notices including penalty notice, official warning,
rectification notice, defect notice, and Notes on inspection summarising outcome.
Further data tables linking to specific inspection records in the iFacts data were also provided covering:
Rectification notices (including defect type) – 6375 records Official warnings (including offence description) – 119 records Notices of un-roadworthiness (including defect type) – 223 records Infringement notices (including offence description) – 499 records
Data from each of these tables could be linked with the main iFacts table via the inspection identifier code, vehicle registration number and date of offence.
Data on periodic roadworthiness inspections of taxis and hire cars was requested from VicRoads. It was established that no electronic database of these inspections exists with inspection results instead being stored on hard copy forms. Due to the way in which the forms are stored, VicRoads was unable to provide a copy of a sample of forms for taxi and hire car inspections for analysis in this study. This was not considered a particular limitation for the study given the TSC inspections database was of a high quality and the results from random inspections are likely to give a more representative view of the roadworthiness of the taxi and hire car fleet on the road. This is because operators are generally unable to prepare vehicles specifically for random or targeted inspections in the same manner as for periodic inspections.
2.3 REGISTRATION DATA
For the purpose of producing the vehicle secondary safety ratings presented as the Used Car Safety Ratings (Newstead et al, 2013), MUARC holds annual snapshots of the Victorian
SAFETY IMPLICATIONS OF TAXI AND HIRE CAR AGE LIMITS 9

vehicle register. The snapshots include de-identified data on all registered vehicles in Victoria at the time of the snapshot with data fields covering the following fields critical for this project:
Vehicle registration plate number Vehicle identification number (VIN) Date of manufacture, and Date of first registration by current owner
As noted, the TSC database on registered taxis and hire cars only covered taxis and hire cars registered as at July 2014. For the analysis undertaken in this study it was necessary to identify all taxis and hire cars registered at any time from January 2000 to December 2012. Taxis and hire cars were identified in the registration database through the formats of the registration plate which are unique for taxis and hire cars. The plate format also identified taxi and type for the purpose of grouping. Plate format and taxi type groupings used were as follows where n represents a numeric character:
Mnnnn – Metropolitan taxis Unnnn – Urban taxis Cnnnn – Country taxis nnnnPS – Peak service taxis STnnnn – Substitute taxis (plates issued to "spare" vehicles which replace licenced
taxis when they are off the road for repairs) VHAnnn, VHBnnn, VHCnnn – Hire cars
Since late 2014, there are now regional taxis (displaying ‘R’ prefix number plates) licensed to operate in the newly created ‘regional’ taxi-cab zone – this zone was established under recent taxi industry reforms. These taxis were previously zoned ‘country’. Reflecting the time period of the study data, no regional taxi registrations were available for analysis.
Some commercial passenger vehicles (CPVs) operate as special purpose vehicles (SVs). These vehicles are permitted to operate only in the pre-booked market and only for weddings and/or tours. These vehicles display standard registration plates and hence could not be identified in the data. Furthermore, Peak Service and Substitute Taxis are subject to limited use and were combined for analysis. It should be noted that stretched limousines and WATs were not able to be identified in the registration data. Consequently, explicit analysis of these vehicle types was not possible apart from restricted analyses where vehicle age was used to identify certain vehicle types based on current age restrictions (e.g. metropolitan taxis over 6.5 years of age are all likely to be WATs).
In order to track vehicles through the fleet over time, each of the registration snapshots were merged and collapsed so that each record in the collapsed data corresponded to a unique VIN (unique vehicle) and registration plate combination for every vehicle registered over the period. This allowed each re-registration of a vehicle with a different registration plate to be tracked. Taxis and hire cars were identified using the registration plate formats described above and the data set further filtered to include vehicles that had been taxis or hire cars at some stage during their operational life. This was achieved using VINs of vehicles which had been at some stage associated with a taxi or hire car plate. This allowed identification of the vehicle potentially before and after it was in service as a taxi or hire car as well as during its service as a taxi or hire car.
10 MONASH UNIVERSITY ACCIDENT RESEARCH CENTRE

Whilst vehicle make, model and year of manufacture information are included in the vehicle register the resolution and accuracy of the information is generally inadequate for the purpose of studying vehicle safety performance. Instead, a process of VIN decoding developed by MUARC in conjunction with the NRMA and used in the production of the UCSRs (Newstead et al, 2013) was applied.
Using the VIN in conjunction with details of the vehicle make and year of manufacture, the decoding process accurately identifies the make and model of the majority of light passenger vehicles in the Australian fleet and places them in model series and year of manufacture groupings with homogeneous safety attributes. The VIN decoding process only covers light passenger vehicles which are defined as regular passenger vehicles including sedans, coupes, station wagons and 4 wheel drive / sport utility vehicles, as well as light commercial vehicles (under 3.5t tare mass) including utilities, vans and mini buses. Interrogation of the registration data revealed that nearly all vehicles used as taxis or hire cars are classed as light passenger vehicles.
2.4 CRASH DATA
Information on all crashes reported to police in Victoria and involving at least one person being injured to some degree in the crash are held in the VicRoads Road Crash Information System (RCIS). Information from RCIS is accessible publicly through the CrashStats portal on the VicRoads web site. VicRoads provided an extract of all crashes reported in RCIS over the period January 2000 to December 2012, a period matching that of the registration data assembled for the study. Information in the crash data covered crash circumstances (including date, time, location, environmental conditions, number of vehicles and types of road users involved), vehicles involved (including registration number, broad vehicle type and damage location) and people involved (including road user type, age, gender, injury level, licensing details).
Crash data was merged onto the registration data for taxis and hire cars assembled through matching via registration plate number. Since registration plate numbers could appear in the registration data in multiple records (i.e. against a number of unique vehicles), the crash data was compared to the valid date of the registration record in order to identify the vehicle in the registration data involved in the crash. Vehicle make and model details for crashed vehicles decoded using the VIN decoding process were then automatically assigned to the crashed vehicles through the link with the registration record.
2.5 VEHICLE SECONDARY SAFETY DATA
Measures of vehicle secondary safety performance were taken from the UCSRs (Newstead et al, 2013). The UCSRs cover vehicle safety performance in three key dimensions:
Crashworthiness: measures the risk of death or serious injury to the driver of a vehicle when involved in a crash as a function of the vehicle driven.
Aggressivity: measures the risk of death or serious injury to other road users (other vehicle occupants, pedestrians, motorcyclists and cyclists) as a function of the vehicle colliding with them in a crash.
Total Secondary Safety: measures the combined crashworthiness and aggressivity performance of a vehicle based on the relevance of each measure to all injury
SAFETY IMPLICATIONS OF TAXI AND HIRE CAR AGE LIMITS 11

outcomes in crashes involving the vehicle. In Australia, crashworthiness is relevant in injury outcomes in 90% of crashes (all crashes except those with unprotected road users where the occupants of the vehicle are generally not a risk) whilst aggressivity is relevant in around 55% of crashes (all crashes involving collision with another road user). Since total secondary safety measures the impact of the vehicle on all road users and hence the whole of society, it is the most relevant measure for investigating the government policy decisions on society.
As far as possible, the UCSRs measure the relative crashworthiness, aggressivity and total secondary safety of vehicles related only to vehicle design and safety feature specification. This is achieved through a process of statistically adjusting the estimates for the effects of non-vehicle related factors such as driver characteristics (age, gender, etc.) and crash circumstances (speed limit, number and type of vehicles involved etc.). In the context of this study, use of the UCSRs for analysis led to the consideration of only the effects of taxi and hire car vehicle choice on safety outcomes and not the influence of driver characteristics that might change over time.
UCSRs are estimated for each specific make, model and year of manufacture grouping of vehicles derived from the VIN decoding process. These were merged onto the crash and registration data for taxis and hire cars based on the make and model groupings identified from applying the VIN decoder to the registration data. For a small number of taxis and hire cars in the analysis, specific UCSRs were not available primarily because the vehicle model was relatively rare and hence sufficient real world crash data was not available for a UCSR to be estimated. Where a UCSR for a previous model in the same series was available, this was assigned. In other cases, the average UCSR across the whole fleet was assigned.
2.6 CRASH COST AND EMISSIONS ESTIMATES FOR ECONOMIC ANALYSIS
Average costs to the community of motor vehicle crashes in Australia have been estimated by the Commonwealth Government’s Bureau of Infrastructure, Transport and Regional Economics based on the human capital methodology (BITRE, 2010). Average estimates of total cost per crash have been derived separately for crashes based on the injury severity of the most seriously injured person in the crash (fatal, injury requiring hospitalisation, other injury, no injury). Crash costs estimates provided by BITRE are based on 2006 dollar values. These have been converted into 2014 dollar values for the analysis by inflating the 2006 dollar figures by the change in the Australian consumer price index between June 2006 and June 2014. Resulting estimates of crash costs to the community in 2014 dollars and the CPI changes used to calculate these are shown in Table 2.2.
As noted, Victorian crash data in the RCIS database only includes crashes where someone is injured. Consequently, assessment of economic benefits can only be carried out on the cost of casualty crashes in Victoria. It is acknowledged that this will produce a conservative estimate of the economic benefits associated with the taxi and hire car fleet change scenarios considered. However, it should be noted that a large proportion of the economic benefits come from savings in fatal and serious casualty crashes, as shown by the costs in Table 2.2.
Table 2.2 shows the number of crashes involving taxis and hire cars in Victoria over the period 2001-12 by crash severity. On average there were in the order of 1.3 fatal crashes, 67 serious injury crashes and 206 minor injury crashes involving taxis and hire cars each year over the period. The annual number of fatal and serious injury crashes was too small to facilitate analysis by specific crash severity. Instead, the analysis has focused on all casualty
12 MONASH UNIVERSITY ACCIDENT RESEARCH CENTRE
crashes combined. In order to value all casualty crashes combined for the economic analyses presented, an average was taken across the three crash severity levels represented in the Victorian crash data weighted by the relative prevalence of each crash severity for taxi and hire car involved crashes. The estimated average cost to the community of each taxi and hire car involved casualty crash was $109,665.
Table 2.2 Crash cost estimates
Crash Severity Community costs by crash
severity A$2006
Community costs by crash
severity A$2014
Number of taxi and hire car crashes by severity 2001-12
Distribution of taxi and hire car crashes by severity 2001-12
Distribution of taxi and hire car crashes by community cost A$2014
Average cost per taxi or hire car involved casualty crash
Fatal $2,666,5110 $3,287,351 16 0.48% 14.53%$109,665Hospital $265,7700 $327,649 807 24.45% 73.04%
Minor Injury $14,7280 $18,157 2478 75.07% 12.43%No Injury $9,942 $12,257
Relative CPI (%) 1.00 1.23
CPI 85.90 105.9
Emissions data was collated from the Commonwealth Government Green Vehicle Guide (GVG) web site. The GVG gives Australian Standards tested fuel consumption for vehicles on sale in Australia from 1986 onwards The vehicle register information for taxis and hire cars does not nominate the fuel type for each vehicle although in some instances a fuel type is specific to a particular model. Consequently it has been necessary to make assumptions about the likely fuel type used in certain vehicles.
In the main, regular sedan and station wagon taxis in Victoria are run on LPG which can be supplied factory fitted for Ford Falcons and Holden Commodores or fitted after market for most other vehicles. The only exception to this is hybrid vehicles including the Toyota Prius and Camry. In assigning emissions information to taxis it has been assumed that all Falcon and Commodore vehicles are LPG powered, all Toyota Camry vehicles are hybrid and all other vehicles are petrol or diesel powered as per factory specifications. Emissions for LPG powered vehicles are taken from the factory LPG specifications in the Green Vehicle Guide. Holden Statesman / Caprice vehicles are predominant in the hire car fleet and can be 6 or 8 cylinders and LPG or petrol powered although this cannot be easily determined for registered vehicles. The emissions for the 6 cylinder petrol vehicles have been assumed. Other popular hire cars with difficult to determine emissions are the BMW 7 Series which has been assumed to be petrol powered, the Ford Fairlane which has similar engine configurations to the Caprice so the 6 cylinder emissions have been assumed and the Chrysler 300C which can be diesel or petrol but the petrol emissions have been assigned.
Based on the make, model and year of manufacture of the vehicle along with the most likely fuel type, an average emission in grams of carbon dioxide per kilometre was assigned to each vehicle in the analysis. More recent vehicle figures are available separately for the urban and
SAFETY IMPLICATIONS OF TAXI AND HIRE CAR AGE LIMITS 13

rural cycles as well as combined but for older vehicles often only the combined cycle is available. Reflecting this, the analysis has been based on the combined cycle.
14 MONASH UNIVERSITY ACCIDENT RESEARCH CENTRE

SAFETY IMPLICATIONS OF TAXI AND HIRE CAR AGE LIMITS 15

3 METHODS
The project comprised two phases: Phase 1 - a qualitative phase involving stakeholder consultation, and Phase 2 - a quantitative phase to assess the safety performance of the current taxi and hire car fleets based on the current entry and exit age limit restrictions.
3.1 PHASE 1: STAKEHOLDER CONSULTATION
Phase 1 involved consultation with a range of key stakeholders in the taxi and hire car industry. The objectives of the consultation phase were to:
Establish the evidence and motivations underpinning the current age based entry and exit criteria for vehicles and how this impacts on practices and enforcement, and
Set the operational parameters for consideration of the safety impacts of variations to the current vehicle age limit restrictions for modelling in Phase 2 of the project.
The following themes were considered in the stakeholder consultation phase:
1. Justification for the current age limit restrictions on taxis and hire cars
2. Identification of methods and motivations for selection and purchase of the current taxi and hire car fleets including consideration of purpose modified vehicles (e.g. wheelchair accessibility)
3. Anticipated changes in profile of the taxi and hire car fleet with the closure of Australian vehicle manufacturing
4. Identification of economic and utility constraints on vehicle purchase, maintenance, repair and replacement including consideration of purpose modified vehicles (e.g. wheelchair accessibility)
5. Safety related issues identified by enforcing authorities including common trends in roadworthiness issues related to operation and age based trends
6. Operation, efficiency and effectiveness of the current inspection regime, and
7. Comfort and presentation of the taxi and hire car fleet related to vehicle age.
The list of stakeholders to be consulted in Phase 1 was generated by the TSC in consultation with MUARC and is shown in Table 3.11. The key themes (derived from the list above) relevant for each group are also outlined in Table 3.11.
16 MONASH UNIVERSITY ACCIDENT RESEARCH CENTRE

Table 3.1 Stakeholders identified for consultation and relevant themes addressed
Stakeholder Relevant themes
VicRoads (Vehicle Standards Group) 1, 4, 6, 7
Road Safety Inspections 1, 4, 5, 6, 7
Victoria Police 1, 5, 6
RACV 1, 2, 3, 4, 6
Victorian Taxi Association 1-7
Individual taxi operators (country and metropolitan) 1-7
Individual hire car operators (country and metropolitan) 1-7
Interstate Taxi Regulators 1-7
Taxi and hire car customers 1, 4, 7
Taxi Services Commission
Compliance Services Branch, Operations Division, and Accreditation and Licensing Branch, Operations Division.
2, 4, 5, 6
1-4
Equipment Installers/Taxi modifiers 1-4, 7
Manufacturers (via the Federal Chamber of Automotive Industries)
1-4, 7
3.1.1 Development of questionnaires and structured interviews
A survey was designed for each stakeholder to collect information on the key themes relevant to each group as identified in Table 3.11. The survey questions were developed by MUARC in consultation with the TSC, and minor refinements were made following telephone piloting of five taxi/hire car operators (See Appendix 2).
3.1.2 Stakeholder recruitment and survey administration
Representatives of each stakeholder group were invited to participate in the survey (See Appendix 1). Individual taxi and hire car operators were randomly invited to participate. One representative per stakeholder group was targeted for most groups excluding Road Safety Inspections (n=3), Equipment Installers (n=4), hire car operators (n=4) and taxi operators (n=16).
The taxi and hire car customer and operator surveys were developed and administered by the MUARC Project Team using the online SurveyMonkey software. The surveys were reviewed by the TSC and then posted on the MUARC and TSC websites on 3 December, 2014. In
SAFETY IMPLICATIONS OF TAXI AND HIRE CAR AGE LIMITS 17

addition, hard copies of the taxi and hire car operator surveys along with reply paid envelopes were packaged by the MUARC Project Team and posted by the TSC on December 8, 2014. The surveys were closed on 5 January, 2015.
The on-line surveys were publicised by means of an advertisement in the Monash Memo (a weekly newsletter emailed to all Monash University staff and students) and via emails sent to Monash staff members and other contacts known to the MUARC Project Team. The Victorian Taxi Association (VTA) also emailed the survey links to its members and publicised details of the surveys in their newsletter. Taxi and hire car operators who were not included in the pilot phase (n=16) were emailed the link to the survey and invited to complete it on-line. Operators were also given the opportunity to complete the survey in hard copy format.
A specific short survey was also derived for taxi and hire car regulating authorities in other states (See Appendix 3). The purpose of this survey was to ascertain if taxi and hire car age limits in other states and territories are similar to those in Victoria, the basis for setting age limits and their perceived effects on safety, supporting activities to ensure vehicle roadworthiness and their effects on safety and any future plans for changing the current regulations.
3.2 PHASE 2: QUANTITATIVE ANALYSIS
Phase 2 of the project comprised a number of key analytical tasks to quantify the safety performance of the current taxi and hire car fleets based on the current entry and exit age limit restrictions. Once the base safety profile was established, the safety implications of changing the entry and exit criteria were examined. Then the likely implications of changing the types of vehicles used by the taxi and hire car fleet as well as the inclusion of various emerging safety features was examined, particularly those features targeted at crash avoidance such as intelligent speed adaptation and forward collision warning and mitigation. The analysis utilised various data sources available to MUARC outlined in the Data section including:
Snapshots of the Victorian vehicle register which include information on all taxis and hire cars registered in Victoria.
Data on all police-reported crashes in Victoria including those involving registered taxis and hire cars linked to specific injury outcome data.
Data on the secondary safety performance of the majority of popular vehicle makes and models in the Australian fleet from the UCSRs including measures of own occupant protection (crashworthiness) and collision partner protection (aggressivity) and combined crashworthiness and aggressivity performance.
Estimates of the safety benefits of emerging vehicle safety technologies taken from published literature and reports.
The general methodology applied to examine the potential safety effects of changing the age based entry and exit criteria included the following steps:
Identification of registered taxis and hire cars in the Victorian fleet including the make and model details of these vehicles. Identification was informed by registration plate details (using defined taxi and hire car formats) supplemented by information on plates allocated to taxi and hire car licence holders held by the TSC. Vehicles identified were classified into groups according to mandated vehicle age limits
18 MONASH UNIVERSITY ACCIDENT RESEARCH CENTRE

relating to the type of taxi or hire car licence (metro, peak service or substitute, urban, country or hire car).
Matching the identified registered taxis and hire cars to the police-reported crash data and estimating crash risk per registered vehicle year by usage type and vehicle age. Trends in crash risk by vehicle age were then analysed for each taxi and hire car licence type considered.
Matching vehicle secondary safety characteristics to each registered and crashed vehicle to estimate a secondary safety profile of the vehicle fleet by taxi or hire car licence type in terms of crashworthiness, aggressivity and total secondary safety.
Calculation of the base primary and secondary safety profile of the taxi and hire car fleet by age of vehicle and vehicle usage category calibrated against the observed recent police reported crash profile for the most recently available years.
Based on the stakeholder consultation in Phase 1, a range of fleet change scenarios were formulated. These included modified vehicle age profile scenarios, modified vehicle safety performance scenarios, vehicle crash avoidance technology fitment scenarios and modified crash risk scenarios.
Each scenario was applied to the base safety profile to determine the net road trauma effects of each in terms of expected net changes in the number of reported crashes and corresponding serious road trauma (number of deaths and serious injuries). These changes were then calculated in terms of economic benefits using the estimated average crash costs to the community to derive benefit to cost ratio (BCR) and net annual worth estimates. In addition to the safety benefits, the vehicle emissions effects of each scenario were also estimated and translated into community costs using an assumed dollar value for carbon emissions. Modified BCR estimates were then calculated incorporating both trauma saving and emissions savings as benefits.
3.2.1 Quantifying vehicle primary safety (crash risk) performance
Primary safety performance of taxis and hire cars related to vehicle age was estimated from the vehicle register snapshots linked to the police reported crash data. Each record in the linked data represented a unique vehicle registration plate and VIN combination linked to any crashes occurring during the time of ownership. Whilst there was registration information for vehicles that had been taxis or hire cars at some stage during their life before and after being registered as a taxi or hire car, analysis was focused only on crash risk of the vehicle when serving as a taxi or hire car. Hence the data was limited to vehicles serving as a taxi or hire car by selecting the appropriate registration plate formats corresponding to taxis and hire cars. Each record in the data then represents a specific VIN and taxi or hire car plate combination.
Analysis required the data to be partitioned into discrete time periods for analysis of crash risk related to vehicle age. For each unique taxi or hire car in the data, a separate record was generated for each VIN-registration plate combination for each year from recorded manufacture of the vehicle whilst in service as a taxi or hire car. Crash records associated with each vehicle were then assigned to the corresponding year after manufacture partitions. An indicator (yes / no) of whether a taxi or hire car had been involved in a police reported crash in each year after manufacture was then derived for each record based on the presence or not of a matched crash record. A vehicle might have been involved in more than one crash in a particular year after manufacture but, since these instances were very rare, no differentiation was made in assigning the crash involvement indicator.
SAFETY IMPLICATIONS OF TAXI AND HIRE CAR AGE LIMITS 19

One limitation in assembling the data was that the full vehicle compliance plate date of vehicle manufacture was not given. Only the year of vehicle manufacture was provided. This led to an unavoidable error in defining the year since manufacture partitions particularly affecting the definition of the first and last years of service as a taxi or hire car which may not have been full years. As a result, crash risk estimates in the first and last years of service as a taxi or hire car are likely to be biased with risk likely to be over-estimated. Although this represents a slight problem for assessing absolute risks it is not a problem for comparing crash risk between taxi/hire car types since the bias will equally affect each taxi/hire car type.
From the assembled data, crash risk estimates by taxi type and year were obtained using a logistic regression analysis. A model of the form of Equation 3.1 was fitted to the data.
…Equation 3.1
In Equation 3.1:
t is the vehicle category indicator (metro, peak service or temporary, urban, country, hire car)
y is the year since manufacture (1= first year, 2 = second year, etc.) Rty is the probability of taxi or hire car of type t being involved in a crash in year y
after manufacture
The form of Equation 3.1 allows the level of risk to differ between taxi and hire car types and the relationship between crash risk and age to vary between taxi and hire car types through inclusion of the interaction term (δ). Logistic regression analysis were estimated using STATA version 11
3.2.2 Quantifying vehicle secondary safety performance
Secondary safety performance of the taxi and hire car fleet was quantified using records on crashed taxis and hire cars. Crash records were used instead of registration records since secondary safety performance refers to injury mitigation given crash occurrence hence secondary safety performance assessment is most relevant for vehicles involved in crashes.
Using the linked crash and registration data, all crashes involving taxis or hire cars were identified and classified by year of crash, age of crash and type of taxi or hire car. Using the VIN decoding process described in Section 2.3, the specific make and model details of each crashed vehicle were identified and each was then grouped according to make, model and year of manufacture ranges with homogeneous vehicle specifications with respect to secondary safety performance. Vehicle groupings used were consistent with those used in estimating the UCSRs which provided the data on vehicle secondary safety performance. Using the unique code assigned to each homogeneous make, model and year of manufacture group, crashworthiness, aggressivity and total secondary safety ratings from the UCSRs were assigned to each crashed vehicle. In some instances a specific model grouping could not be assigned to a vehicle due to missing or incorrectly recorded VIN information on the vehicle register. Generally these vehicles had a valid year of manufacture so an average total secondary safety estimate for vehicles of the same year of manufacture was assigned.
Average crashworthiness, aggressivity and total secondary safety estimates for crashed taxis and hire cars by age of vehicle and taxi group were estimated by averaging the secondary safety measures for each individual vehicle within a classification. Analysis by year of crash
20 MONASH UNIVERSITY ACCIDENT RESEARCH CENTRE

was also performed in order to measure how the secondary safety performance of the taxi and hire car fleet has changed year on year. It should be noted that the analysis by age of vehicle reflects the change in secondary safety related to year of manufacture rather than any deterioration in secondary safety of the vehicle as it ages. Previous research (Cameron et al., 1994) has established that vehicle secondary safety changes improve with increasing year of manufacture and that vehicle secondary safety does not deteriorate as a vehicle ages. The average secondary safety of the vehicle fleet is driven by the age profile of vehicles in the cohort at that time. Estimates of secondary safety differences estimated in this study reflect the age profile of vehicles at a time point which intrinsically reflects the difference in year of manufacture profile of vehicles.
In order to test whether any trends in vehicle secondary safety by age of vehicle (representing year of manufacture) and taxi or hire car type were statistically significant an exponential regression analysis was also undertaken. Exponential regression was chosen on the basis of previous research (Keall et al., 2006) which has successfully used this model form to represent trends in vehicle crashworthiness. A model of the form of Equation 3.2 was fitted to the data series.
…Equation 3.2
In Equation 3.2, SSty is the average secondary safety estimate for taxis or hire cars of type t and age y at time of crash where t is the taxi or hire car type and y is the age of the vehicle at year of crash. Again, this allows each taxi or hire car type to have a different level of secondary safety and trend with age at time of crash.
Although secondary safety estimates have been presented for each of the specific secondary safety measures, the total secondary safety measure is the one used for the safety scenario modelling described in the next section. This is based on the assumption that consideration of taxi and hire car age limits on safety outcomes should not only reflect the impact of the vehicle on its own occupants (crashworthiness) but also the impact of the vehicle on road users with which it collides (aggressivity). Total secondary safety encompasses both these outcomes.
3.2.3 Age limit restrictions and vehicle safety feature scenario setting and modelling
Scenario SettingThe primary aim of this study was to estimate the effects of varying taxi and hire car age limits on safety outcomes relating to primary and secondary safety performance. Reflecting this, the primary set of scenarios modelled considered changing the age limits for taxis and hire cars. The taxi operator and stakeholder survey was used to inform the set of scenarios considered although generally those scenarios considered focused on the effects of changing the maximum taxi and hire car age limits since the scope for varying the entry criteria was relatively small and somewhat constrained by the exit age limits. Furthermore, the large distances typically travelled by taxis, and the costs associated with modification of a WAT or stretched hire car, were considered to make it unlikely that operators would choose to shift to purchasing much older vehicles for service as a taxi.
It is difficult to anticipate exactly how changing the maximum vehicle age limits would alter the vehicle age profile. For the purposes of modelling the age limit reduction scenarios, it was assumed that when a vehicle reached its new maximum age limit it would be replaced by a vehicle of the typical age that vehicles had historically entered the fleet. For example, if the age limit for metropolitan taxis was reduced from the current 6.5 years to three years, a
SAFETY IMPLICATIONS OF TAXI AND HIRE CAR AGE LIMITS 21

vehicle that was four years old would be replaced with a one year old vehicle, a vehicle that was five years old would have been replaced with a one year old vehicle a year previously so would now be two years old and so on. In other words the age of vehicles over the new age limit would be reduced by integer multiples of the difference between the old and the new age limit until the vehicle was then in range. For vehicle age limit increase scenarios, the existing vehicle fleet age distribution was instead spread out to cover the new expanded limits assuming that vehicles would be kept up to the new maximum age. Note that this is a conservative approach to estimating the impact of higher maximum age limits. It will tend to overestimate the average age of the fleet given the propensity for older vehicles to be replaced earlier than the age limit for other reasons (economic, etc.).
As well as considering fleet change scenarios related to age limits, scenarios changing the secondary safety profile of vehicles entering the taxi or hire car fleet were considered. These scenarios involved assessing the secondary safety performance of vehicles currently being used as taxis or hire cars and considering the safety benefits of replacing these with comparable types of vehicles with better safety performance.
The final type of scenarios considered the potential safety benefits of reducing crash risk associated with taxis or hire cars. Crash risk can be reduced in two ways. The first is to fit taxis or hire cars with existing or emerging vehicle safety technologies that assist drivers in avoiding crashes. Potential risk reductions associated with these technologies has been estimated by Anderson et al. (2011) and have been calibrated for Victoria from the national estimates. The results are show in Table 3.2. It is likely that new crash avoidance technologies will continue to emerge in the future, so the scenario analysis has considered generic effects of crash avoidance technologies achieving between 5% and 25% reduction in crash risk at 5% intervals. This allows consideration of the likely benefits of any of the technologies listed in Table 3.2.
Table 3.2: Estimated fatal and serious injury reductions associated with various vehicle driver assist technologies
Estimated % Reduction in Fatal and Serious Injury Crash Risk
Technology Effective Environment All States VictoriaAutonomous Emergency Braking (AEB)
All speeds 23 24
Speeds >=80 km/hr 7 8Lane Change Warning 3 3Lane Departure Warning All speeds 9 9
+80 km/hr or greater zones +no illegal alcohol/speeding
5 4
Fatigue Warning Systems Loss of Control crashes with no illegal alcohol
8 7
Electronic Stability Control Commercial Vans
7 6
A related set of crash risk reduction scenarios considered relate to driver behaviour and performance generally. The Used Car Safety Ratings of Newstead et al. (2013) show that injury risk associated with vehicle secondary safety can vary by a factor of 10 or more between vehicles. Driver behaviour can vary risk by similar or greater orders of magnitude.
22 MONASH UNIVERSITY ACCIDENT RESEARCH CENTRE

For example, driving with a blood alcohol concentration of 0.15 can increase fatal crash risk by 25 times (Keall et al. 2001). Travelling at 80km/h in a 60km/h speed zone is estimated to increase crash risk by a factor of 16 (Kloeden et al., 1997).
The final scenarios consider the potential for lowering crash risk through countermeasures such as more intensive driver training and performance monitoring. Scenarios considered are based on identifying a benchmark crash risk for taxi drivers and identifying the safety benefits resulting from all drivers achieving that benchmark. The benchmark used has been set by examining the resulting estimates of crash risk for drivers of each taxi type, adjusted for relative mileage in each vehicle type estimated from the operator survey and identifying the lowest risk.
The Scenario ModelThe most tractable way of investigating the safety effects of changes in specification and age limits within the taxi and hire car fleet was to consider a cohort of taxi and hire cars as it existed in a particular year and the crashes involving that cohort in the same year. This approach has been used successfully by Budd et al. (2013) in modelling the safety effects of changes to the Western Australian light vehicle fleet. It effectively measures the annual change in expected crashes and associated crash costs associated with hypothetical changes in the profile of the registered vehicle fleet including changing the age, type and safety performance of the vehicles in the fleet.
To construct the scenario model a number of key inputs were required:
1. The number of registered taxis and hire cars by type (t) and age of vehicle (y) in the year (Nty)
2. Crash risk by taxi and hire car type and age of vehicle (Rty) estimated from Equation 3.1
3. Relative secondary safety by taxi and hire car type and age of vehicle (SSty) estimated from Equation 3.2
4. Observed number of crashes by taxi and hire car type and age of vehicle (Cty)
A baseline scenario model was then formulated to predict the expected number of annual crashes by taxi and hire car type and vehicle age as a function of the registered fleet size, crash risk and secondary safety estimates according to Equation 3.3.
…Equation 3.3
The final term in Equation 3.3, Ft, is a correction factor to ensure the expected number of crashes involving each taxi and hire car type was equal to the observed number, that is:
The need for a correction factor primarily reflects the fact that crash risk estimates were derived on average over a 12 year period and may differ within the crash year chosen for analysis due to changes in the absolute and relative travel exposure between taxi and hire car types as well as the general changes in road safety for the state of Victoria as a whole.
Effects of each scenario considered on observed crash outcomes were then modelled by varying the factors in the model according to the dictates of the scenario being considered.
SAFETY IMPLICATIONS OF TAXI AND HIRE CAR AGE LIMITS 23

Vehicle age limits scenarios altered the Rty and SSty parameters of the model according to the age substitutions dictated by the new age limits.
Vehicle secondary safety scenarios altered the SSty parameters of the model proportionately based on the vehicle model substitutions dictated by the scenario.
Vehicle and driver based crash risk scenarios altered the Rty parameters of the model proportionately based on the risk reduction dictated by the scenario.
Estimates of net crash savings associated with each scenario, s, considered were derived by first estimating the expected crash numbers in each cell by applying the modified Rty and SSty
parameters to Equation 3.3 where the s superscript refers to the scenario parameters and estimates
…Equation 3.3
The net crash savings resulting from the scenario, Δs, are then estimated by taking the difference between the aggregate expected crash risk across all vehicle types and ages between the scenario and the baseline as per Equation 3.4.
…Equation 3.4
This process was repeated for each scenario.
3.2.4 Economic analysis of scenarios
Outputs from the scenario model described in the previous section are estimates of the number of casualty crashes saved per annum as a result of implementing each scenario considered. Crash savings were converted to community cost savings through multiplying the number of crashes saved by the average community cost per casualty crash shown estimated in Table 2.2. The other main source of cost saving resulting from each scenario was in vehicle emissions. The method for estimating the change in annual vehicle emissions associated with each scenario is described in the next section.
The primary economic costs associated with each scenario are the increase in vehicle purchase costs to taxi and hire car operators. Increased costs are expected when the maximum vehicle age limit is reduced due to the requirement of operators to purchase vehicles more often and absorb the subsequent depreciation on the replacement vehicle which is generally higher in the early years of vehicle life. When a scenario proposed an increased average vehicle life it was expected that a saving in vehicle costs would be accrued by the taxi and hire car operators. Note that this is potentially an upper-bound on cost reduction of increasing age limits if operators are likely to replace their vehicles before the maximum age limit anyway.
In order to compare the economic costs of vehicle replacement against the community costs of crash savings which were estimated on an annual basis, it was necessary to estimate changes in vehicle purchase costs on an annual basis also. In order to calculate annual costs, an average purchase price for each type of taxi and hire car was assigned based on information collected in the operator survey. An operational lifetime for each vehicle type was then assigned based on the average age of vehicle purchases identified in the operator survey and the maximum age limits for the vehicle by type based on the assumption that vehicles are generally kept up to their operating limit. Analysis of the effects of each scenario considered on annual vehicle costs was carried out using a modification of the scenario model for crashes. The model was modified by substituting an estimate of the vehicle purchase price
24 MONASH UNIVERSITY ACCIDENT RESEARCH CENTRE

by vehicle type for the crash risk factor (Rty) in the model and the reciprocal of the average vehicle lifetime as a taxi or hire car by vehicle type for the secondary safety term (SSty) in the model. Annual cost changes associated with the scenario were estimated by comparing aggregate annual costs for the scenario across all vehicle types and ages with aggregates from the baseline scenario.
It has been assumed while modelling the vehicle costs that the residual value of a taxi or hire car at the end of its life is zero. This seems reasonable based on the high distances travelled by taxis and hire cars each year (over 120,000km per year for metropolitan taxis). For scenarios where the vehicle maximum age limit was reduced significantly, it is likely that the vehicle will have a residual value upon retirement as a taxi or hire car. For these scenarios, residual values were sourced from vehicle sales information documented in Redbook (redbook.com.au) for vehicles of the same type currently used as taxis and hire cars and based on the total distance travelled by the vehicle. For taxis, distance travelled was considered likely to be more representative of residual vehicle value than the vehicle age. Residual values were factored into the analysis model for the scenarios where it was deemed relevant.
3.2.5 Analysis of emissions effects of scenarios
Analysis of the effects of each scenario regarding annual emissions was carried out using a modification of the scenario model for crashes but substituting an estimate of total annual travel by vehicle type for the crash risk factor (Rty) in the model and estimates of average carbon emissions per kilometre by vehicle type and age for the secondary safety term (SSty) in the model. Change in emissions resulting from the scenario were estimated by comparing the total emissions for the scenario with the total emissions for the baseline situation
Estimates of average vehicle mileage by taxi and hire car type were taken from the taxi operator survey response presented in Chapter 4. Different mileages were assigned for regular taxis, WATs, regular hire cars and modified hire cars based on the survey responses but were assumed to be constant across all age vehicles since variation in travel by age of vehicle was not collected in the survey. Where current age limits dictated a mix of regular and WAT / modified vehicles were present in any age group, a weighted average of mileage was used based on the proportionate mix of regular and modified vehicles in the fleet.
The total change in emissions estimated for each scenario was converted to a dollar value using a fixed dollar value of carbon emissions per unit. At the time of conducting this project, Australia had a fixed carbon emissions price of $23 per metric ton. Since then the carbon pricing scheme has been abolished by the Commonwealth Government. For the purposes of the analysis however, the fixed price of $23/t has been used.
3.2.6 Analysis of roadworthiness inspections data and licensing breaches related to vehicle age and roadworthiness
Analysis of roadworthiness inspection data provided an interim measure of vehicle safety to potentially explain the trends in crash risk measured. Analysis aimed to estimate the average number of faults detected at each periodic inspection by age of vehicle and taxi or hire car licence category and correlate these against estimated trends in crash risk.
Data available for the analysis was provided by TSC from the iFacts database on targeted and random vehicle inspections by TSC compliance officers. As noted in the Section 2.2, data on periodic inspections by VicRoads was not available. The iFacts database included records of all inspections undertaken and specific information on rectifications required to vehicles (rectifications), official warnings issued (official warnings), notices of un-roadworthiness
SAFETY IMPLICATIONS OF TAXI AND HIRE CAR AGE LIMITS 25

issued (NOUs) and infringements issued (infringements) to vehicles inspected. Vehicle age was matched to each of these cases from the base inspection record. Using the statistical package SPSS v.11 and registration plates to identify the vehicles, vehicle age at the month of inspection was identified for each case.
Vehicle age, as years and months, was provided, where applicable, for 99% of inspections. For 5.4% of inspections, recording vehicle age was considered ‘not applicable’. As vehicle age was recorded to the month level, a list of vehicle ages for each vehicle registration plate at each available month of inspection was compiled from the inspection data. 7% of the vehicle ages for the unique month-plate inspection data were missing or ‘N/A’. Vehicles identified by plate could have inspections over several months which could be associated both missing and non-missing vehicle ages. Thus some vehicle ages for the months missing could be estimated from vehicle inspection months where they were not missing. Some vehicles from cases of rectifications, official warnings, NOUs and infringements could not be matched to vehicles in the inspection data (0.8, 21.0, 0, 7.4% respectively of issues and 1.2, 20.4, 0, 8.0% respectively of vehicles) and for some months, some vehicles could only be matched to inspection data with missing age (6.3, 6.7, 10.3, 21% respectively of issues and 4.9, 6.3, 7.0, 20.5% of vehicle-month cases).
Frequency tables were then generated, using SPSS v.11, for counts of rectifications, official warnings, NOUs and infringements issued by age of vehicle in years (truncated) and by vehicle type: Metro-Taxi, Country/Rural Taxi, U-type Taxi, ST-type Taxi, Peak Service Taxi, VH-plate Hire Cars, other unclassified vehicle types. One inspected vehicle had no registration plate recorded so was not assigned a taxi category; the data described this vehicle as a WAT type. Inspection data recorded unique vehicles (identified by registration plate) in each category as follows.
Table 3.3: Number of unique vehicles in the TSC iFacts database sampleVehicle Type Unique
Vehicles
Percent
Taxi-Metro 2583 81.3
Taxi-Country/Rural 93 2.9
Taxi-U 90 2.8
Taxi-ST 21 0.7
Taxi-Peak service 199 6.3
Hire Car- VH 89 2.8
Other unclassified vehicle types 100 3.2
Total 3175 100.0
As evident, the vast majority of inspections related to metro taxis. In order to have sufficient data for analysis, all other classes of vehicle were combined for analysis. From the data, tables were prepared from which rates of total issued rectifications, official warnings, NOUs and infringements per inspection were calculated and graphed. In the calculation of rates only one inspection per vehicle per day was counted.
26 MONASH UNIVERSITY ACCIDENT RESEARCH CENTRE

4 RESULTS: PHASE 1 STAKEHOLDER CONSULTATION
4.1 SURVEY RESPONSES
4.1.1 Taxi and hire car operator survey
In total 42 vehicle operators responded to the survey on-line (28 taxi operators and 14 hire car operators). As the survey responses are anonymous it is not possible to differentiate between the proportion of those who responded to the TSC letter; email; or via the web links posted on the MUARC and TSC websites. The total includes the five operators who completed the survey via telephone as part of the pilot process.
4.1.2 Taxi and hire car customers survey
A total of 55 taxi and hire car customers completed the on-line survey.
4.1.3 Taxi and hire car industry stakeholder survey
Seventy-eight percent of taxi and hire car industry stakeholder groups (n=11) completed the survey. In total, there were 16 respondents, 87.5% of whom completed the survey via telephone and 12.5% in person. Just over 57% of interstate taxi stakeholders (n=4) responded to the study, all of whom provided their responses via email.
4.2 SURVEY DATA ANALYSIS
Survey responses completed on-line were exported for analysis from SurveyMonkey into the Statistical Package for Social Sciences (SPSS) Version 22. Data from respondents who completed the survey via telephone or in hard copy form were entered directly into SPSS.
4.3 SUMMARY OF SURVEY OUTCOMES BY KEY THEME
Full analysis of the survey responses can be found in Appendix 4. The following sections provide a summary of survey responses related to each of the key themes identified in the Methods section.
4.3.1 Justification for the current age limit restrictions on taxis and hire cars
In Victoria, as in other Australian jurisdictions, there is currently no objective evidence-based justification for age limit restrictions on taxis and hire cars. Discussions with Victorian taxi and hire car operators and a range of industry stakeholders however, provided anecdotal evidence to suggest that the age limits are generally perceived to be appropriate and necessary, but not sufficient, for achieving minimum standards in a number of important criteria, including vehicle safety, vehicle condition, and vehicle comfort and presentation.
Safety was deemed to be the most important criteria with respect to the standard and condition of vehicles. Most modern vehicles are manufactured to meet higher minimum safety standards in terms of their structural integrity and crashworthiness. A well maintained vehicle becomes relatively less safe as it ages due to the absence of modern safety features which are fitted as standard in newer, modern vehicles. Vehicle condition was also deemed to deteriorate with age, particularly in situations where the standard and/or frequency of servicing and maintenance was low. Newer vehicles were perceived to be in better mechanical condition and less likely to experience a technical failure that could contribute to a crash. Vehicle comfort and presentation were perceived to deteriorate with age, and it was
SAFETY IMPLICATIONS OF TAXI AND HIRE CAR AGE LIMITS 27

deemed important to uphold a positive image of the service being offered, particularly in the case of hire car operations where a higher standard of customer service is expected.
Some taxi and hire car operators indicated that the age criteria appeared to be designed for pragmatic rather than safety reasons, and/or as a financial incentive for operators, citing the inconsistencies in exit age criteria between some categories of vehicle, particularly between standard taxis and WATs and some types of hire car. With the exception of hire car operators, most respondents did not support age limits for hire car vehicles being variable according to the type or value of the vehicle. They argued that unless there are inherent differences in the safety standards/ratings of hire vehicles then the exit limits should only vary according to differences in vehicle condition, including the standard and frequency of maintenance they have received.
Hire car customers pointed out that expensive and/or more luxurious vehicles are not necessarily safer, and most stakeholders argued that vehicles would likely deteriorate at exactly the same rate regardless of their value or type. Those who supported variable age limit restrictions cited economic constraints as the key driving force, noting that it is more cost effective for an operator to keep some types of expensive and/or luxurious hire vehicles in service for longer in order to recoup the high purchasing costs. Some respondents thought that less restrictive age limits would allow operators to offer customers a greater degree of vehicle quality / trip price combinations. Not surprisingly, most respondents, excluding hire car operators, were more likely to disagree that the more expensive a vehicle is to purchase the longer it should be kept working in the fleet.
Feedback from interstate taxi/hire car stakeholders also indicated that there is no evidence-based justification for the current age limits set in their states/territories. Some stakeholders reported that their limits were set to be consistent with those in other jurisdictions and/or were based on consultation with industry on what were deemed to be ‘acceptable standards’, although no details were provided about what these standards were and how they were derived. Consistent with Victorian stakeholders, most interstate stakeholders believed the age limits were generally appropriate to ensure the safety of vehicles, and cited the same anecdotal evidence regarding the basis for the age limit criteria for ensuring vehicle safety, comfort and presentation.
Those who perceived the age limit restrictions to be inappropriate, and particularly hire car operators, reported an opinion that factors such as vehicle safety standards and ratings; vehicle condition including the standard and frequency of servicing and maintenance, and vehicle mileage influenced safely independently of age and/or had a greater bearing on safety than age. Some operators thought that vehicles currently coming into the market should be decommissioned later than the current exit age limits due to the higher safety standards of modern vehicles. Others expressed the view that an older, low mileage vehicle that has been regularly serviced and maintained is much safer than a new vehicle that has been poorly serviced and maintained, and should be able to be retained within the fleet as long as it is deemed compliant at annual and random roadworthy inspections.
However these respondents were generally in the minority since most operators reported that they retired their vehicles an average of six months before the maximum age limits. With respect to vehicle condition, some of the stakeholders pointed out that, since most mechanical defects are not implicated in serious crashes, there is currently no basis for age criteria apart from the fact that newer vehicles are inherently safer. They felt that the criteria were largely in place to maintain a public perception that safety is being upheld and suggested that more
28 MONASH UNIVERSITY ACCIDENT RESEARCH CENTRE
frequent and targeted vehicle inspections that track operators with a history of safety related vehicle defects and/or poor driving records could potentially address safety more effectively.
Just under a third of taxi operators indicated that the maximum entry age limit for taxi vehicles was unnecessary for safety purposes. Most argued that the current age-based restrictions should be based on the total period of time the vehicle is operational as a taxi, in addition to vehicle condition and mileage. As long as the vehicle is retired when it becomes ‘unsafe for service’ then operators felt that they should be free to decide the age at which the vehicle is commissioned. This decision was deemed by most operators to be based on financial constraints including the balance between costs to purchase the vehicle and predicted returns on investment to vehicle retirement age, taking into consideration maintenance and running costs. Only a small proportion of operators felt that it would be more cost effective to purchase a vehicle one or two years above the current maximum age limit and were generally also in favour of raising the exit age limits to maximise return on investment. However the survey data indicated that 75% of taxi operators purchased their vehicles well before the maximum entry age limit between 0-18 months of age. Most of these operators were metropolitan taxi operators. Not surprisingly, the few respondents in favour of modifying the entry and/or exit age criteria were regionally-based operators whose vehicles generally had lower mileage than those running in metropolitan areas.
Most Victorian and interstate stakeholders believed that factors other than vehicle age such as standard of maintenance and type of vehicle used were important for safety. However these factors were deemed to be harder to enforce, monitor, and/or measure than age-based restrictions, particularly in cases where the stringency of vehicle inspections varies and is not subject to auditing. Age was also deemed to be easier to assess than vehicle mileage since it is not subject to falsification like an odometer reading and was generally thought to correlate well with vehicle mileage and wear and tear, particularly in busy metropolitan taxi operations. For example, the current survey data indicated that a standard taxi had clocked an average of 720,000 kilometres by the time it was decommissioned at an average age of 5.9 years, approximately six months prior to the maximum retirement age.
A large proportion of respondents from Victoria and some of the interstate taxi stakeholders suggested that the appropriate decommissioning point for vehicles should be based on either or both their level of safety by contemporary standards and the condition they are in. Some of the Victorian respondents suggested that a set of standards relating to minimum safety levels would be appropriate, based on ANCAP (the Australian New Car Assessment Program) or similar criteria, and that a phase-in timetable of desirable safety features or ratings could be set out and incentives put in place for their adoption. With the exception of the ACT, however, none of the interstate taxi stakeholders were planning to review their current age limit restrictions, and none had recommended criteria other than or in addition to age for limiting the operation of a vehicle as a taxi or hire car.
Overall, age was deemed by most respondents to be appropriate as a safety criterion, but needed to be considered along with other factors including vehicle safety standards/ratings; the standard and frequency of vehicle maintenance and servicing; and the implementation of objective and targeted vehicle inspection regimes.
Finally, respondents were asked if they would like to provide any other feedback in relation to the safety of taxis and or hire cars. Of those who provided relevant comments, just over half felt that driver care and competency were more important than vehicle age in ensuring the safety of passengers and the general public. Some of these respondents were of the
SAFETY IMPLICATIONS OF TAXI AND HIRE CAR AGE LIMITS 29

opinion that driver skill is related to the presentation and safety of the vehicle, with more competent drivers generally taking greater pride in, and care of, their vehicles. Some respondents also suggested that drivers should be banned from using mobile phones and navigational systems whilst driving. Others suggested that driver training requirements should be stricter to raise the current low level of driving skills and attention displayed by some drivers, as well as their route knowledge.
4.3.2 Identification of methods and motivations for selection and purchase of the current taxi and hire car fleet including consideration of purpose modified vehicles (e.g., wheelchair accessibility).
Vehicle purchasing methods
Three quarters of taxi operators purchased their vehicles between the ages of 0-18 months of age, with most purchasing new or pre-owned vehicles aged between 13-18 months. Hire car operators were more likely to purchase younger vehicles which is consistent with the higher standard of customer service offered. Eighty percent of vehicles were purchased between 0-12 months of age, with most operators buying their vehicles new. The largest proportion of taxi operators purchased their vehicles from an auction house, whilst hire car operators were most likely to purchase their vehicles from a new car dealership.
The most common method of financing the purchase of standard and modified vehicles for both taxi and hire car fleets was to obtain finance through a loan from a financial institution. Some of the taxi industry stakeholders noted that modified vehicles and WATs were generally financed over a longer period than standard vehicles within the fleet.
Motivations for selection and purchase of vehicles
The most important high priority factors influencing vehicle purchasing choices for taxi operators in general were:
vehicle size and type; familiarity with the vehicle; servicing and maintenance costs; and reliability.
The lowest priorities when making vehicle purchases in general and for the last vehicle purchase for taxi operators were:
re-sale value; vehicle warranty; and customer look/style/preference
Hire car operators rated the following as being their most important high priority factors when purchasing vehicles in general:
customer style/look/customer preference; fuel economy; purchase price; and reliability.
30 MONASH UNIVERSITY ACCIDENT RESEARCH CENTRE

The lowest priorities in decision-making when purchasing hire car vehicles in general and for the last vehicle purchase were:
Re-sale value; vehicle warranty; and country of manufacture
Just over half of all WAT operators stated that they chose their own vehicles when making a purchase, with the remainder obtaining guidance from a vehicle conversion/modification company. The key criteria for selecting a WAT were:
passenger comfort; wheelchair carrying capacity; safety; convenience of access and loading and unloading including the condition of the hoist; reliability including reputation of vehicle and supplier of modification; age of vehicle; vehicle operating costs; and purchase price.
Both taxi and hire car operators were more likely to set a limit on the purchase price of an unmodified vehicle in their fleet, but hire car operators were less likely to do so than taxi operators. Most taxi operators who did not set a limit on the purchase price of an unmodified taxi indicated that there is limited price variability because the market dictates the cost of vehicles according to purpose of use. Some respondents were of the view that purchase price does not reflect the suitability of a vehicle for use as a taxi, citing other reasons as being more important including safety; comfort; and fuel efficiency.
The reasons given by hire car operators who did not set a limit were that factors other than price are more important, including the typical lifespan of the vehicle; the cost of maintenance, servicing and repairs (and the trade-offs between both of these factors); safety; customer satisfaction; and meeting the Australian Design Rules (ADRs). Just under half of all WAT operators set a limit on the purchase price of a WAT. WAT operators were less likely to set a limit on the purchase price of their vehicles than standard taxi operators because WATs are typically purchased new and the prices do not vary greatly across the market.
4.3.3 Anticipated changes in profile of the taxi and hire car fleet with the closure of Australian vehicle manufacturing
Anticipated vehicle purchasing choices following closure of the Australian vehicle manufacturing industry
Most taxi and hire car operators were unable to specify their anticipated vehicle purchasing choices following the closure of Australian vehicle manufacturing industry. Some operators indicated that they will likely purchase Toyota vehicles, whilst others indicated that diesel powered vehicles would be their primary choice. Those who thought that closure of the Australian vehicle manufacturing industry would not change their purchasing choices indicated that the main vehicle in their fleet is already imported or that they have a preference for vehicles manufactured overseas, particularly luxury vehicles used for hire car purposes.
SAFETY IMPLICATIONS OF TAXI AND HIRE CAR AGE LIMITS 31

Approximately one quarter of taxi operators and most stakeholders predicted that the medium sized Toyota Camry Hybrid would be the predominant vehicle in about ten years’ time. About half of all operators felt that there would be greater diversity in vehicle makes and models, with most vehicles being smaller, more fuel efficient and running on electric, or hybrid or diesel hybrid technology. However, some respondents, and particularly hire car operators, felt that they would be negatively impacted by the changes because smaller, lower standard, less prestigious vehicles would not adequately meet the higher needs and expectations of hire car customers. Similar views were expressed by the taxi industry stakeholders.
Perceived advantages and disadvantages of purpose built taxis
Most operators indicated that they would not consider purchasing a purpose built taxi such as the London Taxi. The key reasons for this were:
the relatively high purchase price; the likelihood that only new vehicles would be available for purchase; their high running costs including difficulty in obtaining reasonably priced parts and
services; the poor suitability of the vehicles for Australian driving conditions; and negative customer feedback including the necessity for luggage to be stowed in the
cabin.
Similar disadvantages were expressed by the taxi stakeholders. Some stakeholders also reported their belief that purpose built taxis currently do not comply with ADRs and highlighted concerns that compliance plates may not be legal. For example, they highlighted that the London cabs are not required to have Electronic Stability Control (ESC) due to their import under the low volume concessional vehicle scheme where ESC is mandatory in Australia for high volume vehicles. They believed that if the vehicles were imported second hand then they would also not need to meet ADRs. Under this regime, stakeholders were concerned that taxi fleets would not be as safe as they could be when compared with ADR certified high volume options. The main advantages of purpose built taxis highlighted by both taxi operators and stakeholders were that the vehicle is purpose built and has great design features including extra space for passengers, wheelchair accessibility on all vehicles, and a segregated cabin for the driver for improved security.
Just under two thirds of taxi operators and half of all stakeholders thought a purpose built taxi would be safer than a regular vehicle used as a taxi although the definition of personal safety might have been confused with crash related safety. The key reasons for this included that the vehicles are specifically manufactured for taxi purposes, providing additional security for the driver with the segregated driver cabin. The reasons given by respondents who thought purpose built vehicles would be less safe were generally vehicle and crash focused and included their higher centre of gravity, poorer handling and performance characteristics, and the possibility that vehicle maintenance would decrease due to a predicted lower return on investment. Some of the stakeholders also held the opinion that purpose built taxis are structurally less sound than regular taxis and that it would take years for purpose built vehicles to meet the equivalent safety standards of regular vehicles.
32 MONASH UNIVERSITY ACCIDENT RESEARCH CENTRE

4.3.4 Identification of economic and utility constraints on vehicle purchase, maintenance, repair and replacement
Identification of economic and utility constraints on vehicle purchase
Purchase price was rated as being of high importance for most taxi operators. Three quarters of taxi operators set a limit on the purchase price of their vehicles, with most electing to purchase from auction houses over new or used car dealerships. However, economic constraints were not the only factors influencing vehicle purchasing choices. Vehicle size and type; familiarity with the vehicle; servicing and maintenance costs; and reliability were also rated as being of high importance, and were more important than vehicle cost in making purchasing choices.
A very small proportion of regional taxi operators argued that the maximum entry age limits should be raised to minimise vehicle purchasing costs. However, it was also pointed out that initial vehicle purchasing costs needed to be weighed against the likely return on investment that could be achieved over the lifetime of the vehicle as a taxi. The data, however, shows that three quarters of taxi operators purchased their vehicles between 0-18 months, one year younger than the maximum 2.5 entry age limit. It appears then, that most operators elect to purchase their vehicles earlier and potentially at a higher price and relatively low mileage, in order to maximise the return on investment that can be made over the lifetime of the vehicle as a taxi. As such, extending the maximum entry age limits is unlikely to be economically important for most taxi operators, particularly those operating in metropolitan zones.
For hire car operators, purchase price was rated as being of equally high importance in vehicle purchasing choices, along with customer style/look/customer preference; fuel economy and reliability. However, a comparatively lower proportion of hire car operators (just over half) set a limit on the purchase price of their vehicles, with most electing to purchase their vehicles new or younger than 12 months of age. These choices appear to be consistent with the higher standard of customer service expected of hire car operations, and the fact that, unlike taxi operators, hire car operators were more likely to agree that expensive/luxurious vehicles should be retained in service longer than standard vehicles.
Identification of economic and utility constraints on vehicle maintenance, repair and replacement
Vehicle servicing and maintenance occurred more frequently in taxis than in hire cars. This was true both for regular vehicle services as well as for maintenance required outside of regular servicing. The estimates show that, on average, taxis were serviced more than twice as frequently over a one year period than hire cars (11 versus 4.9 respectively) and were more likely to require maintenance outside of regular vehicle services for some vehicle components. These findings most likely reflect the higher annual average vehicle mileage covered by taxis compared to hire cars (118,000 kilometres versus 75,000 kilometres). Not surprisingly, for taxi operators, but not hire car operators, servicing and maintenance costs were rated as being one of the most highly important factors influencing vehicle purchasing choices. As such, it is likely that maintenance and servicing imposes a higher cost on taxi operators compared to hire car operators.
Most operators and stakeholders indicated that on average, maintenance and servicing requirements increased for taxis at 4.6 years and 429,000 kilometres and for hire cars at 3.7 years and 358,000 kilometres. For a large proportion of taxi and hire car operators, increasing maintenance and servicing costs were rated as being highly important in the decision to retire a vehicle from the fleet, particularly for hire car operators. Other highly important economic
SAFETY IMPLICATIONS OF TAXI AND HIRE CAR AGE LIMITS 33

factors included the vehicle being off road too often and/or too long and the vehicle being no longer economic to run. Safety was rated by a larger proportion of operators as being of high importance compared to economic constraints but it is potentially impacted by economic factors as well.
Hire car operators also rated ‘vehicle being perceived by customers as being too old’ as highly important in the decision to retire a vehicle from the fleet. In contrast, most taxi operators rated this factor as being one of their lowest priorities in retiring a vehicle from the fleet. These differences likely reflect a greater level of investment by hire car operators in maintaining what was identified in the current study as a higher standard of vehicle comfort and presentation expected by their customers.
Maximising vehicle re-sale value was rated by nearly all taxi and hire car operators as being the least important factor in the decision to retire a vehicle from the fleet, and is consistent with the finding that most operators retired their vehicles close to the maximum age limits. The average retirement age for all categories of taxis except conventional taxis operating in urban zones was slightly lower than the maximum exit age limit. Not surprisingly, metropolitan taxi operators retired their vehicles an average of six months before the maximum limit, which was slightly earlier than that reported by taxi operators in other zones and likely reflects the higher mileage and wear and tear endured by these vehicles. The interstate taxi stakeholders reported generally consistent findings with those evident in Victoria, with most of their vehicles being retired at or within 6-12 months of the maximum age limit.
4.3.5 Safety related issues identified by enforcing authorities including common trends in roadworthiness issues related to operation and age based trends
Some operators reported that their vehicles were found to be compliant at the last annual vehicle inspection (about 20% of taxi vehicles and just over a third of hire car vehicles). Of note however, is that the taxi vehicle inspectors reported higher levels of non-compliance than vehicle operators (between 60-85%). Overall, there were few issues identified in taxis following annual inspections apart from those most prone to wear and tear including tyres, brakes, bodywork, lights and other electrical equipment, and WAT specific equipment. A similar pattern was evident following hire car annual inspections, although generally fewer vehicle components were identified and across a smaller proportion of the vehicle fleet. Although vehicle operators reported little difficulty in rectifying the defects, two thirds of stakeholders reported problems with taxi operators including some disputing the defects and others ‘shopping around’ for an inspector who would be less likely to fail the vehicle. Stakeholders indicated that these issues were less common among hire car and modified hire car operators.
Most vehicle operators, particularly hire car operators, reported that their vehicles would likely be found compliant in a random vehicle inspection. Taxi vehicle inspectors, however reported the opposite, indicating that most vehicles would likely be found non-compliant. No major issues were reported either in taxis or hire cars following random inspections apart from those subject to wear and tear (including in taxis lights, bodywork, tyres and seat belts which were commonly identified, and in hire cars, tyres and lights which were sometimes identified), and no difficulties were reported by vehicle operators or stakeholders in rectifying the defects.
34 MONASH UNIVERSITY ACCIDENT RESEARCH CENTRE

4.3.6 Operation, efficiency and effectiveness of the current inspection regime
Annual vehicle inspections
Most thought the annual vehicle inspection regime was both important and effective for ensuring the safety of taxis and hire cars. Some respondents felt that without the inspection process some operators would fail to adhere to minimum safety standards, contributing to a reduction in passenger safety and/or to a poor public perception of the industry’s commitment to customer safety and satisfaction. A small proportion of stakeholders felt that annual inspections are more about providing a public perception that safety is being monitored because there is currently no evidence for their effectiveness in terms of maintaining and/or improving safety. A large proportion of respondents thought that the inspections only provide a ‘snapshot in time’ of the safety of a vehicle, potentially allowing operators to overlook problems that arise at other times. This view was more common among hire car operators and taxi/hire vehicle inspectors who were of the opinion that annual inspections are unnecessary for operators who service and maintain their vehicles on a regular basis. It was suggested that more frequent targeted inspections should replace annual inspections to allow continuous monitoring of vehicles, particularly those with previously identified safety issues. With respect to this issue, some operators felt that the inspection process needed to be more efficient as there was a tendency for some inspectors to focus on non-safety related issues (such as a missing sticker or moisture in the camera) and/or to find faults where they did not exist.
Some hire car operators and taxi industry stakeholders, including those interstate, expressed the opinion that the frequency of the current annual inspection process should increase. All stakeholders indicating that the frequency of inspections should increase with vehicle age.
Some of the taxi industry stakeholders thought that the level of stringency and objectivity applied during inspections varies between licenced vehicle testers, with some testers failing to adequately inspect vehicles to the required standard. A large proportion of respondents suggested that a more standardised annual inspection process would help eliminate inconsistencies in vehicle testing procedures and do better to uphold TSC standards. It was felt that a more ‘standardised/centralised’ testing process would eliminate the potential for vehicle operators to ‘shop around’ for the most lenient inspectors, although it was acknowledged that supplementing annual inspections with more frequent random inspections would remove some of the problems associated with this practice.
Non-periodic (random / targeted) vehicle inspections
Taxi operators reported an average of 2.6 random vehicle inspections annually, whilst none of the hire car operators including those with modified vehicles had experienced a random inspection in the last year. This estimate is consistent with that reported in Tasmania; however it is not possible to compare the Victorian estimates with those in other states or territories because most stakeholders did not provide the required data. Not surprisingly, most hire car operators indicated that a typical taxi vehicle would likely be inspected on-road in any one year whilst most hire car operators indicated that this would be unlikely.
Most respondents thought the random vehicle inspection regime was both important and effective for ensuring the safety of taxis and hire cars, although the process was deemed to be less important for hire car operators. Similar views were expressed by the interstate taxi stakeholders. Most respondents thought that random inspections are important for ensuring a minimum standard of safety and maintenance by vehicle operators at times outside of the annual inspection period. It was felt that the process would be more effective if licenced vehicle testing procedures were more rigorous and inspectors were more competent. It was
SAFETY IMPLICATIONS OF TAXI AND HIRE CAR AGE LIMITS 35

suggested that vehicles should be pulled into a workshop or hoisted to allow more rigorous testing and assessment. A number of respondents had experienced difficulties with TSC inspectors, stating that they were inexperienced or unqualified to carry out the inspections safely and that there needed to be an improvement in the level of training and or attitudes of these personnel.
Some respondents, particularly hire car operators and stakeholders including those from interstate, suggested that the frequency of random inspections and the diversity of locations in which they are conducted could be increased and should become more frequent as the vehicle ages. It was also suggested that random inspections could be implemented more consistently across the year, as they currently seem to be carried out in waves.
As noted for annual inspections, some respondents suggested that targeted inspections should be favoured over random (and annual) inspections to allow continuous monitoring of vehicles with previously identified safety issues and/or vehicles that appear to be poorly maintained and/or reaching retirement age. They argued that targeted inspections would likely represent an improvement over random inspections which were thought to be inefficient and disruptive to current operations, particularly when conducted at locations such as the airport.
4.3.7 Comfort and presentation of the taxi and hire car fleet related to vehicle age
Overall, most respondents, particularly hire car operators, were of the view that vehicle presentation is influenced by the age of the vehicle. These findings are consistent with the factors rated by hire car operators as being most important in vehicle purchasing and replacement decisions, including customer style/look/customer preference, and concern about the vehicle being perceived by customers as being too old. With the exception of taxi/hire car customers and hire car operators, most respondents were in general agreement that vehicle age does not impact on the level of comfort of the vehicle.
36 MONASH UNIVERSITY ACCIDENT RESEARCH CENTRE

5 RESULTS: PHASE 2 QUANTITATIVE ANALYSIS
5.1 PRIMARY SAFETY ESTIMATES
Table 5.1 gives the estimates of crash risk per registered year by taxi or hire car type and age resulting from the logistic regression analysis of the linked crash and registration data. It should be noted that here and in the following results of the quantitative analysis, age of vehicle equal to one refers to vehicles up to one year old, vehicles age two refer to vehicles between one and two years old and so on. Each estimate can be interpreted as the risk of a taxi or hire car of the type listed being involved in a crash in any year. Graphical presentation of the crash risk estimates by vehicle age and taxi or hire car type are shown in Figures 5.1a-d along with the 95% confidence limits on the estimates. The width of the confidence limits reflects the amount of data from which the estimates are derived.
Table 5.1: Crash risk per registered vehicle year by taxi and hire car type
Age of Vehicle
M taxis ST and PS taxis
C Taxis U taxis Hire Cars
1 0.034 0.022 0.018 0.022 0.0112 0.052 0.037 0.033 0.046 0.0143 0.080 0.039 0.054 0.043 0.0164 0.075 0.053 0.036 0.035 0.0165 0.064 0.044 0.051 0.040 0.0156 0.043 0.031 0.039 0.044 0.0087 0.022 0.028 0.022 0.018 0.0088 0.033 0.020 0.029 0.0139 0.037 0.040 0.042 0.010
10 0.01111 0.03112 0.08313 0.029
Overall Average
4.53% 3.64% 3.46% 3.55% 1.23%
SAFETY IMPLICATIONS OF TAXI AND HIRE CAR AGE LIMITS 37
Figure 5.1a: Crash risk by vehicle age: Metropolitan Taxis
0.00
0.01
0.02
0.03
0.04
0.05
0.06
0.07
0.08
0.09
0.10
1 2 3 4 5 6 7 8 9 10 11 12 13
Prob
abili
ty o
f Cra
sh
Age of Vehicle (years)
Lower 95% CLM taxisUpper 95% CL
Figure 5.1b: Crash risk by vehicle age: Peak Service and Substitute Taxis
0.00
0.01
0.02
0.03
0.04
0.05
0.06
0.07
0.08
0.09
0.10
1 2 3 4 5 6 7 8 9 10 11 12 13
Prob
abili
ty o
f Cra
sh
Age of Vehicle (years)
Lower 95% CLST and PS taxisUpper 95% CL
38 MONASH UNIVERSITY ACCIDENT RESEARCH CENTRE

Figure 5.1c: Crash risk by vehicle age: Country Taxis
0.00
0.01
0.02
0.03
0.04
0.05
0.06
0.07
0.08
0.09
0.10
1 2 3 4 5 6 7 8 9 10 11 12 13
Prob
abili
ty o
f Cra
sh
Age of Vehicle (years)
Lower 95% CLC TaxisUpper 95% CL
Figure 5.1d: Crash risk by vehicle age: Urban Taxis
0.00
0.01
0.02
0.03
0.04
0.05
0.06
0.07
0.08
0.09
0.10
1 2 3 4 5 6 7 8 9 10 11 12 13
Prob
abili
ty o
f Cra
sh
Age of Vehicle (years)
Lower 95% CL
U taxis
Upper 95% CL
SAFETY IMPLICATIONS OF TAXI AND HIRE CAR AGE LIMITS 39

Figure 5.1e: Crash risk by vehicle age: Hire Cars
0.00
0.01
0.02
0.03
0.04
0.05
0.06
0.07
0.08
0.09
0.10
1 2 3 4 5 6 7 8 9 10 11 12 13
Prob
abili
ty o
f Cra
sh
Age of Vehicle (years)
Lower 95% CL
Hire CarsUpper 95% CL
There are a number of salient features of the crash risk charts that are relevant to the objectives of the study. The most important is that there is no evidence of a trend to increasing crash risk with increasing vehicle age for any of the taxi or hire car types. For the metropolitan taxis, crash risk is lowest at the beginning and end of the vehicle operating lifetime and highest in the mid years. Results of the operator survey showed that most metropolitan taxis are not first registered as a taxi when they are new. Instead they are purchased second hand and registered as a taxi at a median age of between 12 and 18 months old. Because exact compliance data of the vehicle is not recorded in the registration data, the year of compliance was used to estimate vehicle age. This means that a proportion of vehicles will not have been taxis for the full year in their first year of service as a taxi consequently leading to apparently lower risk estimates in the early years as observed in figures. Similarly, maximum operating age for non-WAT metropolitan taxis is 6.5 years meaning again the taxi will not have been registered for the full year in its seventh year of operation leading to lower estimated risk. Discounting the end points of the risk curve shows even less evidence of any age based trend in the crash risk estimates. Trends in crash risk by vehicle age in the peak service, country and urban taxi and hire car fleets are similar to those observed in the metropolitan taxi fleet.
Estimates of risk past eight years for taxis will relate to WATs. Although based on a short time period, there is no evidence of age based trends for these vehicles in their later years of operation. Since WATs could not be identified in the crash and registration data (since they are indistinguishable from other vehicles of the same type also used as regular taxis), it was not possible to study trends in the risk of WATs relative to regular vehicles but it is likely that the lack of age based crash risk trend in their later years of operation would be mirrored in earlier years of operation.
One clear limitation in estimating vehicle crash risk is the lack of data on vehicle travel exposure. Variation in the estimates of crash risk per registered vehicle year is likely to be driven by differential travel by vehicle type and age to some degree. Collecting vehicle odometer readings at times of random and periodic inspections of taxis and hire cars would
40 MONASH UNIVERSITY ACCIDENT RESEARCH CENTRE

allow vehicle travel to be estimated and included in the calculation of crash risk. This data enhancement is recommended for the future.
Some vehicle ages in Figure 5.1a-d have no crash risk estimated. These are vehicle types and ages where there were no recorded crashes in the police data. This in combination with the width of confidence limits for crash risk estimates on vehicle over seven years old show that crashes involving taxis and hire cars over seven years old are rare. This is particularly important for WATs, high luxury and stretched hire car vehicles when considering the safety impacts of changing age limits since these vehicle types are rarely involved in serious crashes. This will be further explored in the scenario analysis.
The final notable feature of the crash risk analysis is the difference in crash risk between hire cars and each taxi type and in particular the high average crash risk for metropolitan taxis. The average crash risk for each taxi type is provided in Table 5.1 above and shows the crash risks for metropolitan taxis is nearly four times higher than a hire car. As noted, this is in part due to the different travel exposures between taxi types.
The operator survey response provides estimates of relative mileage between taxi types which is summarised in Table 5.2 along with the annual crash risks per registered vehicle. From these, the exposure adjusted crash risk for each taxi and hire car type has been estimated relative to hire car crash risk. It should be noted that in Table 5.2 there were no specific travel estimates by taxi type so an average has been assigned based on the survey responses. It is likely that ST and PS taxi exposure is lower than that estimated which would mean the estimated relative exposure adjusted crash risk is under estimated. Table 5.2 shows that crash risk per kilometre travelled for each taxi type is around twice that of hire cars, with metropolitan taxis being the highest at 2.28 times the crash risk of a hire car.
Although the vehicle types used as hire cars are different to those used as taxis, although not substantially different with both dominated by large passenger sedans, these results suggest that there are driver based issues affecting crash risk in taxis compared to hire cars. Results suggest the crash risk associated with drivers of taxis is much higher than that for hire car drivers. The potential safety benefits of mitigating these differences are investigated in the scenario modelling.
Table 5.2: Travel adjusted relative risk estimates: taxis vs hire cars
Taxi or Hire Car Type M taxis ST and PS taxis
C Taxis U taxis Hire Cars
Average Annual Crash Risk per Registered Vehicle
0.045 0.036 0.035 0.036 0.012
Annual Mileage 115800 115800 115800 115800 72,063Exposure adjusted relative crash risk compared to hire cars
2.28 1.84 1.75 1.79 1.00
5.2 SECONDARY SAFETY ESTIMATES
A total of 2407 taxis and hire cars were involved in police reported crashes over the period 2000-2010, 2011 and 2012. The breakdown of crash numbers by taxi or hire car type and year of crash is given in Table 5.3.
SAFETY IMPLICATIONS OF TAXI AND HIRE CAR AGE LIMITS 41

Table 5.3: Number of crash involved taxis and hire cars by type and year of crash
Taxi and hire Car Type
Crash_Year M ST & PS C UHire Cars Total
2000 264 2 23 2 13 3042001 180 2 13 2 3 2002002 204 2 26 9 6 2472003 194 6 14 7 1 2222004 219 2 18 10 4 2532006 190 13 27 6 4 2402007 109 11 11 2 8 1412008 159 17 17 3 2 1982011 238 28 27 10 15 3182012 199 34 25 11 15 284Total 1956 117 201 62 71 2407
All but 7.7% of the crashed vehicles could be assigned to a makes and model grouping in order to then assign vehicle secondary safety performance from the UCSR data. The 7.7% with no identified make and model were all assigned the average safety rating for vehicle of that year of manufacture. Each crashed vehicle was assigned a crashworthiness, aggressivity and total secondary safety rating from the UCSRs. In order to quantify changes in the secondary safety of the fleet by year of crash, averages of each secondary safety measure were calculated by taxi and hire car type and year of crash, the results shown in Figures 5.2a-c.
Crashworthiness represents the risk of a vehicle’s occupants being killed or seriously injured in a crash. Figure 5.2a shows a clear trend of this risk reducing over time for all taxi and hire car types as the vehicle fleet is regenerated. The declining risk is driven by improvements in crashworthiness of newer vehicles entering the fleet.
Figure 5.2a: Average taxi and hire car Crashworthiness by year of crash
0.000
0.005
0.010
0.015
0.020
0.025
0.030
0.035
0.040
0.045
0.050
1999 2001 2003 2005 2007 2009 2011 2013
Cras
hwor
thin
ess
Year of Crash
M
ST & PS
C
U
Hire Cars
All Vehicels
42 MONASH UNIVERSITY ACCIDENT RESEARCH CENTRE

Aggressivity represents the risk of death or serious injury to a third party with which the vehicle collides (vehicle occupant, pedestrian, cyclist or motorcyclist). In contrast to crashworthiness trends, trends in aggressivity have been relatively flat only showing some downward movement in the two most recent years of data.
Figure 5.2b: Average taxi and hire car Aggressivity by year of crash
0.000
0.010
0.020
0.030
0.040
0.050
0.060
1999 2001 2003 2005 2007 2009 2011 2013
Aggr
essiv
ity
Year of Crash
M
ST & PS
C
U
Hire Cars
Total
Total secondary safety combines crashworthiness and aggressivity, representing the risk of being injured to come degree in the event of a crash. Figure 5.2c shows a clear trend to improving total secondary safety by year of crash. This is driven by the improving safety of new vehicles entering the fleet and the removal of older, less safe vehicles as the fleet regenerates. This is similar to the trend found for all light passenger vehicles in the Australian fleet by Newstead and Scully (2009).
Figure 5.2c: Average taxi and hire car Total Secondary Safety by year of crash
0.000
0.005
0.010
0.015
0.020
0.025
0.030
0.035
0.040
0.045
0.050
1999 2001 2003 2005 2007 2009 2011 2013
Tota
l Sec
onda
ry S
afet
y
Year of Crash
M
ST & PS
C
U
Hire Cars
Total
SAFETY IMPLICATIONS OF TAXI AND HIRE CAR AGE LIMITS 43

Improvement in total secondary safety with crash year has been consistent between taxi and hire car types with the absolute level of safety being similar between taxi and hire car types reflecting the similar types of vehicle used in each vehicle fleet type.
Exponential regression analysis was used to examine the trend in vehicle secondary safety by age of vehicle within each crash year. Separate models were fitted to each of the three secondary safety measures considered. The regression analysis was able to assess the statistical significance in the difference in average secondary safety between taxi and hire ca types, the trend in average secondary safety by age of vehicle and whether the age based trends differed by taxi and hire car type.
A summary of the results of the statistical significance tests are present in Table 5.4. Tests are based on the chi-squared statistic generated from the regression model with the significance probability calculated from the chi-squared statistic and degrees of freedom. Results in Table 5.4 show that each secondary safety measure does not differ between taxi and hire car types (as indicated by the significance probabilities above 0.05) nor are there significant differences in age based secondary safety trends between taxi and hire car types. For each measure, however, there was significant overall age based trends in secondary safety. As noted in the methods section, this does not mean the secondary safety of vehicles deteriorates with age, rather it means that at a point in time, older vehicles have significantly inferior secondary safety due to their earlier year of manufacture dictating generally poorer safety design and specification.
Table 5.4: Test of homogeneous average secondary safety, age-based trends and trend differences between taxi and hire car types
Secondary Safety Measure
Test of homogeneity between taxi and hire
car types
Test of age based trends
Test of homogeneous age based trends
between taxi and hire car types
Chi-sq d.f. Sig. Prob. Chi-sq d.f. Sig.
Prob. Chi-sq d.f. Sig. Prob.
CWR 6.669 4 .154 4.622 1 .032 2.318 4 .678
Agg 1.028 4 .905 6.983 1 .008 1.596 4 .809
TSS 5.553 4 .235 6.580 1 .010 1.223 4 .874
Given the lack of statistically significant difference between taxi and hire car types in terms of absolute and age based trends in secondary safety, for each secondary safety measure an average trend in secondary safety by vehicle age was estimated. The estimated trends are depicted in Figure 5.3a-c for crashworthiness, aggressivity and total secondary safety respectively. In each instance the age based trends were statistically significant as shown in Table 5.4. The trend in crashworthiness showed 2.2% deterioration in vehicle crashworthiness on average for each additional year of vehicle age at time of crash. The
44 MONASH UNIVERSITY ACCIDENT RESEARCH CENTRE

comparative annual deterioration in aggressivity and total secondary safety were 1.2% and 1.8% respectively.
Figure 5.3a: Change in average crashworthiness by vehicle age at crash
0.00
0.20
0.40
0.60
0.80
1.00
1.20
1.40
1.60
0 2 4 6 8 10 12 14
Cras
hwor
thin
ess r
elati
ve to
0-1
yea
r old
veh
icle
s
Vehicle age at crash
Figure 5.3b: Change in average aggressivity by vehicle age at crash
SAFETY IMPLICATIONS OF TAXI AND HIRE CAR AGE LIMITS 45

0.00
0.20
0.40
0.60
0.80
1.00
1.20
1.40
0 2 4 6 8 10 12 14
Aggr
essiv
ity re
lativ
e to
0-1
yea
r old
veh
icle
s
Vehicle age at crash
Figure 5.3c: Change in average total secondary safety by vehicle age at crash
0.00
0.20
0.40
0.60
0.80
1.00
1.20
1.40
1.60
0 2 4 6 8 10 12 14
Tota
l sec
onda
ry sa
fety
rela
tive
to 0
-1 y
ear o
ld v
ehic
le
Vehicle age at crash
46 MONASH UNIVERSITY ACCIDENT RESEARCH CENTRE

Identifying trends in the total secondary safety of vehicles at time of crash is important in the context of examining the effects of vehicle age limits on road trauma. The significant improvement in average secondary safety for each newer year of manufacture means that limiting the age of taxis will have a positive impact through reducing road trauma. Trends in relative secondary safety presented in Figure 5.3, and in particular the trend in total secondary safety shown in Figure 5.3c form a key input to the scenario model considered in the next section. In applying this result it has been assumed that secondary safety will continue to improve with year of manufacture as it has in the past. This is considered likely given improvement has been constant over a 40 year period.
5.3 SCENARIO MODELLING
5.3.1 Scenarios Considered
Scenarios considered in the analysis fell into three categories:
age limit change, secondary safety focused vehicle choice and crash risk vehicle technology, and driver behaviour scenarios.
Analysis of the responses from the operator survey did not provide strong guidance on choosing the vehicle age limit scenarios to consider. The majority of operators reported that their vehicles were nearing the end of their serviceable life by the time they hit the current age limits reflecting the large annual travel distances. Based on this, it is unlikely that extending the current age limits for retirement from service as a taxi or hire car would necessarily result in taxis or hire cars being kept in service for longer. Nonetheless, a scenario of capping the maximum operating life of all taxis and hire cars to a uniform 10 years was considered as an upper boundary on what might be considered. This will increase the maximum age limit for most taxis and hire cars although will be a lower maximum limit for a small number of vehicles (such as high luxury hire cars).
The following age limit based scenarios were considered:
Scenario A1 – cap the maximum age of all taxis and hire cars regardless of cost and type to 6.5 years.
Scenario A2 - cap the maximum age of all taxis and hire cars regardless of cost and type to five years.
Scenario A3 - cap the maximum age of all taxis and hire cars regardless of cost and type to three years.
Scenario A4 - cap the maximum age of all taxis and hire cars regardless of cost and type to one year.
Scenario A5 - cap the maximum age of all taxis and hire cars regardless of cost and type to 10 years.
In reality, scenario A4 is unrealistic given the survey identified that most taxis are purchased second hand between six months and 2.5 years old. The scenario would mean all taxis would have to be purchased new which would add significant cost. Both Scenario A4 and A5 have been included to articulate the boundaries on road trauma outcomes that can be achieved through policy change on vehicle age limits. The upper boundary was set at 10 years reflecting that most taxis and hire cars currently have a maximum age limit of between 5 and
SAFETY IMPLICATIONS OF TAXI AND HIRE CAR AGE LIMITS 47

6.5 years. Although some vehicles have a current age limit of more than 10 years, these represent a small proportion of the fleet so a 10 year maximum would represent an increase in the average maximum age of the fleet.
Modifying vehicle age limits is not the only policy option for improving the safety of the taxi and hire car fleet for operators, customers and other road users. Previous research (Newstead et al., 2004) has identified that choosing a vehicle with the best possible secondary safety performance can significantly reduce road trauma. Improving the secondary safety of vehicles used as taxis and hire cars through choosing the safest possible vehicle available was also investigated in the following scenario:
Scenario S – substitute the vehicles in the current taxi and hire car fleet for the vehicle of the same size and type currently available with the best possible total secondary safety rating as identified in the UCSRs.
Scenario analysis was based on the profile of vehicles in the taxi and hire car fleet crashing during 2011-12. The UCSRs were interrogated to the safest vehicle in each class of vehicle currently used as taxis and hire cars and the total secondary safety ratings for these vehicles substituted for those currently being used in the scenario analysis. The vehicles identified were:
Large vehicle – Ford Falcon FG (TSS=2.81, substituting for vehicles such as the Holden Caprice {TSS=2.88} and Chrysler 300C {TSS=3.45}).
Medium vehicle – Audi A5 (TSS=1.20, substituting for vehicles such as the Toyota Camry {TSS=3.00}).
People Mover – Toyota Tarago (TSS=2.43, substituting for vehicles such as the Mercedes Viano {TSS=3.90} and Kia Carnival {TSS=3.28}).
Large SUV – Lexus RX (TSS=1.69, substituting for vehicles such as the Ford Territory {TSS=2.44}).
Commercial Van – Mercedes Sprinter (TSS=2.19, substituting for vehicles such as the Toyota Hiace {TSS=3.51}).
In comparing with the average TSS of taxis and hire cars in 2012 in Figure 5.2c which range between 3.2 and 3.5, the TSS of the substitute vehicles listed above are all well less than this average, showing the degree of improvement that can be achieved. In practice, the best available vehicle will vary over time. The intention of this scenario is not to be prescriptive on the vehicles that should be used but rather to show the boundaries of benefits that can be achieved by prioritising vehicle secondary safety in specifying vehicles that can be used as taxis and hire cars. Consumer programs such as the Australasian New Car Assessment Program (ANCAP) can be used as sources of information to specify vehicles with the best possible safety performance that could be used as taxis and hire cars.
The next scenarios considered the road safety benefits of mandating emerging crash avoidance technologies in all taxis and hire cars. As noted in the Section 3.2.3, there are a range of current technologies that are likely to be augmented by new technologies in the future. Estimated benefits of current technologies range from crash reductions of 5% through to 25%. In order to cover the full range of current and future technologies, the scenarios considered estimate the benefits of mandating fitment of these technologies to taxis and hire cars for a range of crash reduction effects. They are:
48 MONASH UNIVERSITY ACCIDENT RESEARCH CENTRE

Scenario T1 – all vehicles fitted with a crash avoidance technology reducing overall crashes by 5%
Scenario T2 – all vehicles fitted with a crash avoidance technology reducing overall crashes by 10%
Scenario T3 – all vehicles fitted with a crash avoidance technology reducing overall crashes by 15%
Scenario T4 – all vehicles fitted with a crash avoidance technology reducing overall crashes by 20%
Scenario T5 – all vehicles fitted with a crash avoidance technology reducing overall crashes by 25%
When current and future technologies have been fully evaluated, they can be assessed against these scenarios based on estimated crash reductions to infer the likely benefits to the taxi and hire car fleet.
The final scenario analysed considered the benefits of reducing the crash risk of taxi drivers to that measured for hire car drivers corrected by relative travel exposure (Table 5.2).
Scenario D: crash risk of taxi drivers is reduced to that of hire car drivers on a travel corrected basis
This scenario quantifies the potential benefits of reducing taxi driver crash risk through either enhanced driver training or monitoring and mitigating risk behaviour though the use of technologies such as vehicle telematics. Vehicle telematics are in-vehicle technologies that continually monitor driver behaviour and report on dangerous behaviours such as speeding and sudden heavy braking.
5.3.2 The Baseline Scenario
The first step in undertaking the scenario modelling was to estimate the baseline scenario against which all the change scenarios will be compared. The baseline scenario represents crash outcomes in the taxi and hire car fleet as it currently exists. As detailed in Section 3.2, the baseline scenario is constructed from information on the current registered taxi and hire car fleet, crash risk by vehicle type and age estimated in Section 5.1 and vehicle secondary safety performance by vehicle type and age estimated in Section 5.2.
To ensure the baseline scenario is representative of the current crash population, it was calibrated against the most recently available crash data. The average across the two most recent years of crash data available has been taken in order to smooth out random variation in the counts. The data used are presented in Table 5.5. The correction factors used in the baseline scenario were derived through calibration with this data.
SAFETY IMPLICATIONS OF TAXI AND HIRE CAR AGE LIMITS 49

Table 5.5: Crash involvement by taxi and hire car type and age: 2011-12
Taxi and Hire Car TypeM ST & PS C U Hire Cars
Age 2011 2012 2011 2012 2011 2012 2011 2012 2011 20121 60 56 14 19 11 6 2 2 8 62 104 104 13 12 11 7 5 8 2 23 43 20 1 3 4 5 2 54 18 8 4 2 0 15 10 10 1 3 1 1 16 3 1 17 28910111213Total 238 199 28 34 27 25 10 11 15 15Average per year 218.5 31 26 10.5 15Average total per year 301
Details of the registered taxi fleet provided by TSC as at July 2014 were used in the baseline model. The number of registered taxis by taxi type and age are shown in Table 5.6. As noted, this does not align with the crash data period used although this is not considered a problem given road trauma trends in Victoria have been relatively constant over the period 2011-14.
50 MONASH UNIVERSITY ACCIDENT RESEARCH CENTRE

Table 5.6: Number of registered taxis and hire cars by type and age: July 2014
Taxi TypeAge M PS&ST C U Hire Cars
1 59 17 6 3 452 165 33 36 13 1343 431 52 48 23 1214 739 85 76 51 1475 807 127 129 44 1526 734 142 136 45 1207 658 96 130 45 928 99 26 84 5 1209 56 5 25 5 34
10 45 5 14 5 2611 2 1 6 0 612 0 0 3 0 13
13+ 3 2 3 0 31Total by Type 3798 591 696 239 1041
Total 6365
Table 5.7 gives the expected annual crash frequency by taxi and hire car type and age based on the baseline scenario model. Again Table 5.7 highlights the low crash involvement numbers for older taxis and hire cars. Crashes for taxis and hire cars over seven years old represent less than 5% of the total crash population. Already this points to the limited road trauma impacts that policy focusing on older WATs and high luxury or modified hire cars can potentially have.
SAFETY IMPLICATIONS OF TAXI AND HIRE CAR AGE LIMITS 51

Table 5.7: Expected annual casualty crash frequency from the baseline scenario model by taxi and hire car type and age
Taxi and Hire Car TypeAge M PS&ST C U Hire Cars
1 2.17 0.57 0.11 0.08 0.532 9.16 1.84 1.28 0.76 2.033 36.78 3.05 2.77 1.26 2.234 59.50 6.65 2.90 2.27 2.645 55.20 8.33 6.99 2.19 2.556 33.69 6.53 5.62 2.48 1.147 15.77 4.03 3.01 1.02 0.778 3.47 0.00 1.78 0.18 1.739 2.21 0.00 1.07 0.26 0.39
10 0.55 0.00 0.00 0.00 0.0011 0.00 0.00 0.20 0.00 0.0012 0.00 0.00 0.27 0.00 0.00
13+ 0.00 0.00 0.00 0.00 0.99Total by Type 218.5 31 26 10.5 15
Total 301
5.3.3 Crash Savings Estimates
Application of the scenario model to each of the taxi and hire car fleet change scenarios produced the estimated number of crashes saved summarised in Table 5.8. Estimates are given in total and for each taxi and hire car type. The estimates for scenario A5 are negative indicating an estimated increase in casualty crashes resulting from implementation of the scenario. The estimates represent the expected annual savings in casualty crashes compared to continuing the baseline scenario.
52 MONASH UNIVERSITY ACCIDENT RESEARCH CENTRE

Table 5.8: Expected annual casualty crashes saved through implementing each scenario on the 2014 taxi and hire car fleets
Taxi and Hire Car Type
Scenario M taxisST and PS taxis C Taxis U taxis
Hire Cars Total
A1- All Max 6.5 Years 2.01 0.35 0.60 0.13 0.48 3.58A2 - All Max 5 Years 3.93 0.74 0.87 0.28 0.42 6.23A3 - All Max 3 Years 8.21 1.27 1.32 0.45 0.70 11.96A4 - All Max 1 Years 13.83 2.06 2.00 0.71 1.06 19.67A5 - All Max 10 Years -12.00 -1.72 -1.34 -0.57 -0.67 -16.31
S - Best in Class TSS 50.26 7.13 5.98 2.42 4.35 70.13
T1 - Tech Reduction 5% 10.93 1.55 1.3 0.53 0.75 15.05T2 - Tech Reduction 10% 21.85 3.1 2.6 1.05 1.50 30.10T3 - Tech Reduction 15% 32.78 4.65 3.9 1.58 2.25 45.15T4 - Tech Reduction 20% 43.70 6.2 5.2 2.10 3.00 60.20T5 - Tech Reduction 25% 54.63 6.2 5.2 2.10 3.00 71.12
D - Taxi Risk = Hire car Risk 122.85 14.141 11.11 4.64 0 152.75
Table 5.8 shows the casualty crash savings associated with the scenarios reducing the maximum vehicle service age are modest, saving 20 crashes per year, or around 6% of the total crash population, when limiting the maximum age of taxis and hire cars to 1 year. Changing the maximum age limits to 10 years for all vehicles would increase the expected number of crashes by 16 per year.
Casualty crash reductions associated with improving vehicle secondary safety through optimising safer vehicle choices or having all vehicles fitted with new technologies to reduce crash risk are estimated to have a much greater effect on expected annual crash numbers. Choosing the safest vehicle in class was estimated to reduce crashes by 70 per annum. A similar estimated crash reduction result was found for the best performing crash avoidance technology currently available in Autonomous Emergency Braking (AEB) (see Table 3.2).
Exceeding all these though was the scenario where taxi drivers achieve the same crash risk as hire car drivers with this scenario estimated to reduce total crashes by 50%. This is far greater than the 25% achieved by the current best crash avoidance vehicle technology suggesting there are other factors that could be investigated to reduce crash risk, beyond those that can be expected to be addressed by vehicle based technology. This would require understanding the underlying reasons for the difference in crash risk between taxis and hire cars.
5.3.4 Emissions analysis
Analysis of the effects of each scenario on vehicle emissions was carried out using a modification of the scenario model constructed for examining scenario crash effects. As noted in Section 3.2, the model was modified by substituting the estimates of crash risk for
SAFETY IMPLICATIONS OF TAXI AND HIRE CAR AGE LIMITS 53

estimates of annual travel by taxi and hire car type and vehicle age and substituting estimates of secondary safety for estimates of vehicle emissions by vehicle type and age.
Estimates of annual kilometres travelled by taxi and hire car type and age were not available directly so were estimated from the responses from the taxi operator survey. Estimated travel from the operator survey were available for regular taxis, WATs, hire cars and modified hire cars however the taxis were not broken down by metro, peak service, country and urban so it was assumed that each taxi class travelled similar distances. The 2014 taxi fleet snapshot was also used to estimate the approximate percentage of WATs in the taxi fleet and modified hire cars in the hire car fleet. The estimates derived from the operator survey and registered vehicle snapshot were:
Regular taxis 120,000km/yr (92.5% of regular taxi fleet) WAT 64,000km/yr (7.5% of regular taxi fleet) Regular hire cars 75,000km/yr (95.3% of regular hire car fleet) Modified hire cars 12,500km/yr (4.7% of regular hire car fleet)
Based on this data and the current age limits for various taxi types, estimates of average annual per vehicle travel were assigned by taxi and hire car type and vehicle age for use in the baseline emissions scenario model. These are shown in Table 5.9.
Table 5.9: Average annual per vehicle travel (km) by taxi and hire car type and age estimated from operator survey
Taxi and Hire Car TypeAge M taxis ST and PS Taxis C Taxis U taxis Hire Cars
1 115800 115800 115800 115800 72,0632 115800 115800 115800 115800 72,0633 115800 115800 115800 115800 72,0634 115800 115800 115800 115800 72,0635 115800 115800 115800 115800 72,0636 115800 115800 115800 115800 72,0637 115800 115800 115800 115800 125008 64000 64000 115800 64000 125009 64000 64000 64000 64000 12500
10 64000 64000 64000 64000 1250011 64000 64000 64000 64000 1250012 64000 64000 64000 64000 12500
13+ 64000 64000 64000 64000 12500
Average carbon emissions per vehicle by age were sourced from the Commonwealth Government Green Vehicle Guide. An emission value was assigned to each vehicle in the 2014 snapshot of registered taxis and hire cars from which average emissions by taxi and hire car type and vehicle age calculated. These estimates are shown in Table 5.10.
54 MONASH UNIVERSITY ACCIDENT RESEARCH CENTRE

Table 5.10: Average per vehicle carbon emissions per kilometre by taxi and hire car type and age
Taxi and Hire Car TypeAge M taxis ST and PS taxis C taxis U taxis Hire Cars
1 239.580 239.580 239.580 239.580 239.5802 241.552 241.552 241.552 241.552 241.5523 243.541 243.541 243.541 243.541 243.5414 245.546 245.546 245.546 245.546 245.5465 247.568 247.568 247.568 247.568 247.5686 249.606 249.606 249.606 249.606 249.6067 251.661 251.661 251.661 251.661 251.6618 253.732 253.732 253.732 253.732 253.7329 255.821 255.821 255.821 255.821 255.821
10 257.927 257.927 257.927 257.927 257.92711 260.051 260.051 260.051 260.051 260.05112 262.192 262.192 262.192 262.192 262.192
13+ 264.350 264.350 264.350 264.350 264.350
Average emissions for the crashed vehicle fleet were also calculated in order to establish long term trends in emissions by age of vehicle and vehicle type and to test difference in trend between type of taxi and hire car. These were used to estimate average per vehicle emissions from the taxi and hire car fleet by year of operation which is graphed in Figure 5.4.
Figure 5.4: Average per vehicle taxi and hire car fleet emissions by year of travel
Figure 5.4 showed an immediate problem with the emissions data assembled for the analysis. There is an apparent discontinuity in the series between 2004 and 2008. Closer inspection of the source of emissions data showed a significant change in the Australian Standards test for vehicle emissions in 2004 (ADR 81/02). Emissions data for vehicles manufactured before 2004 is available on the Green Vehicle Guide but is not directly comparable with the information published for vehicles manufactured from 2004 onwards. The lack of
SAFETY IMPLICATIONS OF TAXI AND HIRE CAR AGE LIMITS 55

comparability is evident in Figure 5.4. To overcome this problem, trends in vehicle emissions by age at time of travel were estimated based only on data from 2008 onwards. As applied to the secondary safety estimates, an exponential regression model was fitted to the data to estimate age based trends and to test differences in the trends and average emissions levels between taxi and hire car types.
Results of the exponential modelling of the vehicle emissions data showed there was no statistically significant difference in average emissions between taxi and hire car types (chi-square(4)=6.878, p=0.142). Analysis showed there was a statistically significant association (chi-square(1)=6.360, p=0.012) between vehicle age at time of travel and emissions with each additional year of age associated with a 0.8% increase in average emissions. This trend did not differ significantly between taxi and hire car types (chi-square(4)=2.862, p=0.581). The estimated average trend in vehicle emissions by vehicle age at time of travel is shown in Figure 5.5. Like the analysis of the secondary safety effect, this analysis does not imply that vehicle emissions increase with age of vehicle. Rather they measure the improvement in emissions of more recent year of manufacture vehicles relating to increased drivetrain efficiency and increasingly strict emissions standards. It has been assumed that the identified trend in improved emissions will continue into the future in applying them to the scenario models
Figure 5.5: Relative per vehicle taxi and hire car fleet emissions by age of vehicle at time of travel
0.98
1
1.02
1.04
1.06
1.08
1.1
1.12
0 2 4 6 8 10 12 14
Emiss
ions
rela
tive
to 0
-1 y
ear o
f veh
icle
Age of vehicle at time point
Using the data assembled, the baseline scenario model for vehicle emissions was constructed. Estimated total annual emissions by taxi and hire car type and vehicle age are summarised in Table 5.11. It estimates the total annual carbon emissions from the 2014 taxi and hire car fleet to be in the order of 162,000 metric tonnes.
56 MONASH UNIVERSITY ACCIDENT RESEARCH CENTRE

Table 5.11: Total annual emissions (metric ton) by taxi and hire car type and age used in the baseline scenario
Taxi and Hire Car TypeAge M PS&ST C U Hire Cars
1 1636.86 471.64 166.46 83.23 776.912 4615.34 923.07 1006.98 363.63 2332.523 12155.08 1466.51 1353.70 648.65 2123.574 21012.89 2416.91 2161.00 1450.15 2601.115 23135.33 3640.88 3698.21 1261.41 2711.736 21215.78 4104.42 3930.99 1300.70 2158.467 19175.63 2797.66 3788.50 1311.40 289.418 1607.65 422.21 2468.11 81.19 380.609 916.86 81.86 409.31 81.86 108.72
10 742.83 82.54 231.10 82.54 83.8311 33.29 16.64 99.86 0.00 19.5012 0.00 0.00 50.34 0.00 42.61
13+ 50.76 33.84 50.76 0.00 102.44Total by taxi and hire car type
106298.30 16458.16 19415.32 6664.75 13731.42
Grand total 162567.96
Effects of each of the maximum age limit scenarios on vehicle emissions were estimated using the scenario model. The results are shown in Table 5.2 giving the saving in both metric tonnes and in dollars based on a per metric ton carbon price of $23. The negative values in Table 5.12 indicate an increase in expected carbon emissions and are related to the scenario increasing vehicle age. Effects of the remaining scenarios concerned with improving the primary and secondary safety of vehicle have not been considered since they are not concerned with changing the age and type of vehicles used as taxis and hence are not expected to significantly change emissions.
Table 5.12: Expected annual emission savings and emissions cost saved by each scenario
Scenario Annual Emissions Savings (T)
Annual Emissions Savings ($)
A1- All Max 6.5 Years 1,444.42 $33,221.64A2 - All Max 5 Years 2,259.17 $51,960.87A3 - All Max 3 Years 3,409.80 $78,425.40A4 - All Max 1 Years 5,331.82 $122,631.76A5 - All Max 10 Years -3,902.29 -$89,752.64
Estimates of the cost of annual emissions savings estimated in Table 5.12 against the maximum vehicle age proposed in each scenario are plotted in Figure 5.6. The relationship between maximum vehicle age in service as a taxi and hire car and emissions is roughly
SAFETY IMPLICATIONS OF TAXI AND HIRE CAR AGE LIMITS 57
linear in the age range considered. Again note that the estimate for a maximum age limit of 10 years assumes vehicles will be kept in service until this age limit and not retired early.
Figure 5.6: Annual emissions savings by maximum age of taxi or hire car
-$150,000.00
-$100,000.00
-$50,000.00
$0.00
$50,000.00
$100,000.00
$150,000.00
0 2 4 6 8 10 12
Annu
al e
miss
ions
savi
ngs
Maximum vehicle age
5.3.5 Economic analyses
To estimate the economic benefits of each scenario considered, the costs and benefits must be defined and the economic value of each estimated. Benefits associated with each scenario considered are the expected reduction in casualty crashes and the expected reduction in vehicle emissions. The economic value of vehicle emissions estimated for the scenarios to which it is relevant are presented in the previous section. The economic value of crash savings will be estimated later in this section. The economic cost of implementing each scenario will be in terms of increased vehicle costs to the taxi and hire car operators. The dollar value of these costs will be related to the purchase price of the vehicle and the length of time over which it is operated as a taxi and hire car. For the scenario considering increasing average vehicle age, the benefits and costs for the economic analysis will be reversed since the benefit will now be from reduced vehicle depreciation and the costs will be increased road trauma and emissions. This is reflected in the economic analysis.
Changes in vehicle costs associated with each scenario were estimated by further modification of the scenario model. In this instance, the key inputs to the model are the registered fleet profile, the average vehicle lifetime and the average residual value of the vehicle at the end of its lifetime, each categorised by taxi and hire car type and vehicle age. Average purchase price for taxis and hire cars were estimated from the operator survey and are:
Regular taxi - $27,000 WAT - $63,500
58 MONASH UNIVERSITY ACCIDENT RESEARCH CENTRE

Regular hire car - $59,000 Modified hire car - $200,000
Using the proportion of standard and modified vehicle types from the registration snapshot and the current maximum age limits, average vehicle purchase costs by taxi and hire car type and age of vehicle were assigned and are summarised in Table 5.13. Also using information from the operator survey on average purchase age and age limits by vehicle type, the average lifetime as a taxi or hire car by taxi or hire car type and vehicle age were calculated and are summarised in Table 5.14.
Table 5.13: Average vehicle purchase price by taxi and hire car type and age from the operator survey
Taxi and Hire Car TypeAge M PS&ST C U Hire Car
1 $29,700.000 $29,700.000 $29,700.000 $29,700.000 $65,100.002 $29,700.000 $29,700.000 $29,700.000 $29,700.000 $65,100.003 $29,700.000 $29,700.000 $29,700.000 $29,700.000 $65,100.004 $29,700.000 $29,700.000 $29,700.000 $29,700.000 $65,100.005 $29,700.000 $29,700.000 $29,700.000 $29,700.000 $65,100.006 $29,700.000 $29,700.000 $29,700.000 $29,700.000 $65,100.007 $29,700.000 $29,700.000 $29,700.000 $29,700.000 $200,0008 $63,000 $63,000 $29,700.000 $63,000 $200,0009 $63,000 $63,000 $63,000 $63,000 $200,000
10 $63,000 $63,000 $63,000 $63,000 $200,00011 $63,000 $63,000 $63,000 $63,000 $200,00012 $63,000 $63,000 $63,000 $63,000 $200,000
13+ $63,000 $63,000 $63,000 $63,000 $200,000
Table 5.14: Average vehicle lifetime as a taxi or hire car by taxi and hire car type and age
Taxi and hire Car TypeAge M PS&ST C U Hire Car
1 5.375 5.375 5.375 5.375 62 5.375 5.375 5.375 5.375 63 5.375 5.375 5.375 5.375 64 5.375 5.375 5.375 5.375 65 5.375 5.375 5.375 5.375 66 5.375 5.375 5.375 5.375 67 5.375 5.375 5.375 5.375 108 10.5 10.5 5.375 10.5 109 10.5 10.5 10.5 10.5 10
10 10.5 10.5 10.5 10.5 1011 10.5 10.5 10.5 10.5 1012 10.5 10.5 10.5 10.5 10
13+ 10.5 10.5 10.5 10.5 10
SAFETY IMPLICATIONS OF TAXI AND HIRE CAR AGE LIMITS 59

Residual vehicle values at the end of taxi and hire car service expected under each scenario were estimated using Redbook (in information resource on new and used vehicle prices) based on the types of vehicles used as taxis and hire cars and the expected mileage of the taxi and hire car when it reaches its maximum age limit under each scenario. The residual vehicle values estimated for each scenario are:
Base scenario – 0% Scenario A1 (Max age 6.5 years all vehicles) – 0% Scenario A1 (Max age five years all vehicles) – 10% Scenario A1 (Max age three years all vehicles) – 25% Scenario A1 (Max age one year all vehicles) – 50% Scenario A1 (Max age 10 years all vehicles) – 0%
Applying each of the key inputs to the baseline scenario model, the total annual depreciation costs for vehicles by taxi and hire car type and age were calculated and are summarised in Table 5.15. Table 5.15 estimates total annual vehicle depreciation cost across the taxi and hire car fleet of around $44M or just under $7,000 per registered taxi and hire car.
Table 5.15: Average annual vehicle depreciation cost for the baseline scenario by taxi and hire car type and current age
Taxi and Hire Car TypeAge M PS&ST C U Hire Car
1 $326,009.30 $93,934.88 $33,153.49 $16,576.74 $488,250.002 $911,720.93 $182,344.19 $198,920.93 $71,832.56 $1,453,900.003 $2,381,525.58 $287,330.23 $265,227.91 $127,088.37 $1,312,850.004 $4,083,404.65 $469,674.42 $419,944.19 $281,804.65 $1,594,950.005 $4,459,144.19 $701,748.84 $712,800.00 $243,125.58 $1,649,200.006 $4,055,776.74 $784,632.56 $751,479.07 $248,651.16 $1,302,000.007 $3,635,832.56 $530,455.81 $718,325.58 $248,651.16 $1,840,000.008 $594,000.00 $156,000.00 $464,148.84 $30,000.00 $2,400,000.009 $336,000.00 $30,000.00 $150,000.00 $30,000.00 $680,000.00
10 $270,000.00 $30,000.00 $84,000.00 $30,000.00 $520,000.0011 $12,000.00 $6,000.00 $36,000.00 $0.00 $120,000.0012 $0.00 $0.00 $18,000.00 $0.00 $260,000.00
13+ $18,000.00 $12,000.00 $18,000.00 $0.00 $620,000.00Total by taxi and hire car type $21,083,413.95 $3,284,120.93 $3,870,000.00 $1,327,730.23 $14,241,150.00
Grand total $43,806,415.12
Using the scenario model, the additional annual vehicle depreciation costs expected under each scenario were estimated. Results are summarised in Table 5.15 where again, the negative value indicates a cost saving for the age increase scenario. Like the emissions scenarios, additional vehicle costs have only been calculated for scenarios considering modified age limits. It is difficult to anticipate differential vehicle costs for the other
60 MONASH UNIVERSITY ACCIDENT RESEARCH CENTRE

scenarios so a different approach to economic worth has been taken for these scenarios, which is explained later.
Table 5.16: Expected additional annual vehicle depreciation costs for each scenario
Scenario Additional Annual Vehicle Costs
A1- All Max 6.5 Years $5,155,897.44A2 - All Max 5 Years $11,386,321.20A3 - All Max 3 Years $39,349,828.86A4 - All Max 1 Years $96,019,934.88A5 - All Max 10 Years -$14,323,270.57
Figure 5.7 presents the results in Table 5.16 graphically against the maximum age limit for the scenario. The graphical presentation highlights clearly the exponential increase in vehicle costs with decrease in maximum vehicle age reflecting that vehicle value depreciation as estimated in Redbook are not linear but are much higher in the early years of a vehicle life.
Figure 5.7: Addition annual vehicle depreciation costs by maximum age of taxi and hire car
-$20,000,000.00
$0.00
$20,000,000.00
$40,000,000.00
$60,000,000.00
$80,000,000.00
$100,000,000.00
$120,000,000.00
0 2 4 6 8 10 12
Addi
tiona
l ann
ual v
ehic
le c
osts
Maximum vehicle age
The final cost information required for the economic analysis was the annual value of road trauma costs to the community. These were calculated by multiplying the estimates of annual crashes involving taxi and hire cars by type and age in the baseline scenario and in each of the scenario change estimates by the unit community cost per casualty crash estimated from the BITRE data and shown in Table 2.2. Total annual casualty crash costs to the community resulting from crashes involving taxis and hire cars are shown in Table 5.17. Across all vehicles, the total figure was estimated to be about $33M per year or around $5000 per registered taxi or hire car per annum.
SAFETY IMPLICATIONS OF TAXI AND HIRE CAR AGE LIMITS 61

Table 5.17: Expected annual casualty crash costs for the baseline scenario by taxi and hire car type and age
Taxi and Hire Car TypeAge M PS&ST C U Hire Car
1 $238,209.14 $62,091.13 $12,403.68 $9,017.97 $58,165.082 $1,004,630.16 $201,526.80 $140,300.15 $82,969.10 $223,003.103 $4,033,552.49 $334,694.26 $303,598.78 $137,674.18 $244,227.234 $6,525,383.85 $729,348.54 $318,572.34 $249,192.87 $289,919.565 $6,053,734.04 $913,669.42 $766,307.98 $239,748.79 $279,583.446 $3,694,350.51 $715,965.13 $616,051.06 $272,322.03 $124,727.607 $1,729,131.84 $442,314.56 $329,764.00 $111,627.50 $84,979.538 $380,048.87 $0.00 $195,710.37 $20,246.21 $189,504.419 $242,844.19 $0.00 $117,271.19 $28,682.12 $42,461.40
10 $59,881.09 $0.00 $0.00 $0.00 $0.0011 $0.00 $0.00 $21,988.35 $0.00 $0.0012 $0.00 $0.00 $29,317.78 $0.00 $0.00
13+ $0.00 $0.00 $0.00 $0.00 $108,401.15$23,961,766.18 $3,399,609.85 $2,851,285.68 $1,151,480.75 $1,644,972.51
Total $33,009,114.97Average Cost Per Taxi and Hire Car $5,186.04
The corresponding estimated savings in casualty crash costs associated with each scenario are summarised in Table 5.18 by taxi and hire car type and overall. The estimated annual crash cost savings for each scenario summarised in Table 5.8.
62 MONASH UNIVERSITY ACCIDENT RESEARCH CENTRE

Table 5.18: Expected annual casualty crash cost savings for each scenario by taxi and hire car type and overall
Taxi and Hire Car Type
Scenario M taxis ST and PS taxis
C taxis U taxis Hire Cars Total
All Max 6.5 Years $220,376.95 $38,358.47 $66,171.33 $14,727.16 $52,503.40 $392,137.29
All Max 5 Years $431,344.19 $81,081.08 $95,048.98 $30,302.01 $45,562.93 $683,339.19
All Max 3 Years $900,251.88 $139,631.00 $144,985.48 $49,347.27 $76,886.15 $1,311,101.79
All Max 1 Years $1,517,133.91 $225,856.54 $219,436.07 $77,800.99 $116,770.39 $2,156,997.90
All Max 10 Years -$1,316,137.68 -$188,987.10 -$146,820.09 -$62,776.17 -$73,909.77 -$1,788,630.81
Best in Class TSS $5,511,206.22 $781,910.26 $655,795.71 $264,840.57 $477,042.03 $7,690,794.79
Tech Reduction 5% $1,198,088.31 $169,980.49 $142,564.28 $57,574.04 $82,248.63 $1,650,455.75
Tech Reduction 10% $2,396,176.62 $339,960.98 $285,128.57 $115,148.08 $164,497.25 $3,300,911.50
Tech Reduction 15% $3,594,264.93 $509,941.48 $427,692.85 $172,722.11 $246,745.88 $4,951,367.25
Tech Reduction 20% $4,792,353.24 $679,921.97 $570,257.14 $230,296.15 $328,994.50 $6,601,822.99
Tech Reduction 25% $5,990,441.55 $679,921.97 $570,257.14 $230,296.15 $328,994.50 $7,799,911.30
Taxi Risk = Hire Car Risk $13,472,796.28 $1,550,816.07 $1,218,507.98 $509,558.14 $0.00 $16,751,678.47
Using the estimated annual cost savings associated with crashes and emissions and the cost increases associated with vehicle depreciation, net annual worth and benefit to cost ratios (BCRs) for each of the maximum age change scenarios have been calculated and are presented in Table 5.19. As noted previously the benefits and costs are reversed for the BCR calculation of the age increase scenario A5. BCRs have been calculated both including and excluding the cost of emissions. This reflects that since the carbon tax was abolished in mid-2014 by the Commonwealth Government, there is no longer an accepted price for carbon and hence no direct emissions costs to taxi and hire car operators. As evident from Table 5.19 however, the cost of emissions saving is far less than the estimated crash cost savings for each scenario and hence makes little difference to the estimated BCR.
Table 5.19: Estimated economic benefit for maximum age change scenariosScenario Additional
Annual Vehicle Costs
Annual Trauma Cost Savings
BCR - No Emissions
Net Annual Worth - No Emissions
A1- All Max 6.5 Years $5,155,897.44 $392,137.29 0.08 -$4,763,760.15
A2 - All Max 5 Years $11,386,321.20 $683,339.19 0.06 -$10,702,982.01
A3 - All Max 3 Years $39,349,828.86 $1,311,101.79 0.03 -$38,038,727.07
A4 - All Max 1 Years $96,019,934.88 $2,156,997.90 0.02 -$93,862,936.98
A5 - All Max 10 Years -$14,323,270.57 -$1,788,630.81 8.01 $12,534,639.76
SAFETY IMPLICATIONS OF TAXI AND HIRE CAR AGE LIMITS 63

Scenario Additional Annual Vehicle Costs
Annual Trauma Cost Savings
Annual Emissions Savings
BCR - With Emissions
Net Annual Worth - With Emissions
A1- All Max 6.5 Years $5,155,897.44 $392,137.29 $33,221.64 0.08 -$4,730,538.51
A2 - All Max 5 Years $11,386,321.20 $683,339.19 $51,960.87 0.06 -$10,651,021.14
A3 - All Max 3 Years $39,349,828.86 $1,311,101.79 $78,425.40 0.04 -$37,960,301.67
A4 - All Max 1 Years $96,019,934.88 $2,156,997.90 $122,631.76 0.02 -$93,740,305.22
A5 - All Max 10 Years -$14,323,270.57 -$1,788,630.81 -$89,752.64 7.63 $12,444,887.12
Table 5.19 shows that the BCRs for the maximum age change scenarios are very low. In each instance of lowering the maximum age limit of the taxi and hire car fleet, the increased costs in vehicle depreciation borne by the operator far exceed the savings in road trauma. In contrast, increasing the age limits of taxis and hire cars shows a net economic benefit however this should be treated with some caution before recommending this scenario as a valid option in reality. In effect, what this scenario promotes is economic gain for taxi and hire car operators through reduced vehicle depreciation costs at the expense of increased death and injury in the community.
The difference between the costs and the benefits (net annual worth) for each of the age change scenario is illustrated in graphically in Figure 5.9. It highlights again that age limits of less than four years for taxis and hire cars accelerates costs rapidly against the benefits obtained. This is largely due to significant vehicle depreciation costs in the early years of vehicle life, as well as minimal expected trauma cost savings.
Figure 5.9: Difference between scenario benefits and costs by maximum age of taxi or hire car
y = 5E+07ln(x) - 9E+07R² = 0.992
-$100,000,000.00
-$80,000,000.00
-$60,000,000.00
-$40,000,000.00
-$20,000,000.00
$0.00
$20,000,000.00
$40,000,000.00
0 2 4 6 8 10 12
Diffe
renc
e be
twee
n be
nefit
s and
cost
s
Maximum vehicle age
Benefits-Costs
Log. (Benefits-Costs)
Calculation of BCRs for scenarios S, T1-5 and D, concerned with improving vehicle primary and secondary safety performance as well as driver crash risk, is difficult due to uncertainty in quantifying the likely costs of the scenarios. For example, Autonomous Emergency
64 MONASH UNIVERSITY ACCIDENT RESEARCH CENTRE

Braking can cost as little as $400 as an option on a vehicle, to over $10,000 if specifying a different model variant to obtain the feature required. It can also cost effectively nothing through choosing a different same priced vehicle that has the feature. Similarly, choosing a vehicle with better secondary safety performance can result in anything from a cost saving to a large cost increase. Costs can also change dramatically over time.
Instead of calculating a BCR for these scenarios, an economic cost break-even point has been calculated that would result in a BCR of 1. This gives the maximum per vehicle expenditure to implement the scenario before its economic worth is not justified. Table 5.20 gives the estimated cost break-even point for each of the scenarios both on an annual basis per vehicle and on a vehicle lifetime basis based on the average operational lifetime of taxis and hire cars.
Table 5.20: Break even costs for primary and secondary safety change scenarios
Scenario Annual Cost Per Vehicle
Lifetime Cost Per Vehicle
S - Best in Class TSS $1,208.29 $7,164.20
T1 - Tech Reduction 5% $259.30 $1,537.45
T2 - Tech Reduction 10% $518.60 $3,074.90
T3 - Tech Reduction 15% $777.91 $4,612.34
T4 - Tech Reduction 20% $1,037.21 $6,149.79
T5 - Tech Reduction 25% $1,225.44 $7,265.84
D - Taxi Risk = Hire Car Risk $2,631.84 $15,604.68
Table 5.20 shows that the break even points for each of the scenarios considered on a vehicle lifetime basis are all very high. It shows that just over $7000 per vehicle could be spent to improve vehicle secondary safety. This is much higher than found for the rest of the commercial vehicle fleet in studies such as Budd et al. (2013) reflecting the very high travel exposure of taxis as well as the high crash risk for metropolitan taxis.
One point noted in previous studies is that often superior secondary safety performance can be achieved for no extra vehicle expenditure and in some cases for less money. All that is required is to make vehicle secondary safety the top priority in vehicle selection. The UCSRs of Newstead et al (2013) show that vehicles with excellent secondary safety performance exist in all market groups but particularly in medium and large vehicles, many with very moderate purchase price, which are generally the types of vehicles used as taxis and hire cars. On this basis, very high cost benefit figures could be achieved in reality for this scenario.
Break even points for the vehicle technology scenarios are similarly high showing significant investment can be made in these technologies before the point of diminishing return is reached. Maximum estimates investment per vehicle ranged from $1,500 to just over $7,000
SAFETY IMPLICATIONS OF TAXI AND HIRE CAR AGE LIMITS 65

per vehicle. On an economic basis, nearly all of the crash avoidance technologies listed in Table 3.2 are viable considerations for taxis and hire cars.
One of the most effective technologies in Table 3.2 is autonomous emergency braking (AEB), which is estimated to produce crash savings of around 23%. Economic analysis estimates up to $7000 can be spent on this technology to produce benefit to cost outcomes of greater than 1. As noted previously, AEB can be optioned on some vehicles for as little as $400 whilst on other vehicles it comes part of a broader safety package from between $2,000 to $4,000, still well within the range of economic viability. Many moderate priced vehicles such as the Subaru Liberty which might be suitable for service as a taxi currently have AEB as standard (the Subaru also has many other features listed in Table 3.2 as standard). The same observations on availability and price are true for other safety features listed in Table 3.2.
The scenario with the highest economic break-even cost is reducing crash risk of taxi drivers to be equivalent to that of hire car drivers with up to $15,000 able to be spent on achieving this scenario whilst achieving positive economic benefits. Including some or all of the crash avoidance technologies in vehicles will partly contribute to achieving this scenario. There are a number of other countermeasures that could be investigated to reduce driver crash risk. One is more stringent on road skill testing of drivers for accreditation as a taxi driver, mandating skills beyond those for the regular driving test. Another could be greater penalties for driving offences, particularly for more severe offences such as drink and drug driving, speeding, failing to comply with traffic control signals (red light running, etc.) and distracted driving behaviour such as mobile phone use.
Use of vehicle telematics may be a further, more encompassing but also more invasive, means of ensuring improved driving performance. Telematics are electronic systems installed in the vehicle that measure and log key driving behaviours such as speeding, heavy braking, hours of continuous driving, engine speed and fuel economy through interfacing with the vehicle electronic systems and the addition of other sensors such as GPS and accelerometers.
The systems have dynamic feedback to a central data system that continually monitors driver behaviour. From this, drivers displaying dangerous behaviour can be rapidly identified and timely interventions to curb dangerous behaviour implemented. The systems can also have broader occupational health and safety benefits through monitoring vehicle location, useful to track a stolen vehicle, and including collision notification systems to quickly notify and direct emergency services.
Telematics can also have advantages for business optimisation by encouraging more fuel efficient driving practices and monitoring vehicle stationary time and location both of which can reduce costs. A number of companies with large truck fleets such as Boral have embraced the use of telematics to improve safety and reduce vehicle running costs. The National Transport Commission has been developing a strategy for vehicle telematics in the trucking industry for some time (NTC, 2010). The potential for the application of telematics in the taxi industry seems high.
5.4 ANALYSIS OF COMPLIANCE DATA
The TSC provided records on 7110 compliance inspections undertaken by TSC Industry Compliance Officers between 1/5/2014 and 21/11/2014. These inspections resulted in the
66 MONASH UNIVERSITY ACCIDENT RESEARCH CENTRE

issue of 6375 rectification notices, 119 official warnings, 223 notices of un-roadworthiness and 499 infringement notices.
Analysis estimated the rate of issuance of each of these warnings and notices per inspection undertaken by age of vehicle and taxi and hire car type. Over 80% of inspections were of metropolitan taxis and a correspondingly high proportion of warnings and notices also related to these vehicles. In order to undertake meaningful analysis of the data, all non-metropolitan taxis were grouped together for analysis (labelled as non-metro taxis in the figures) and compared to the data on metropolitan taxis. Figures 5.10, 5.11, 5.12 and 5.13 show the rate of rectification notices, official warnings, notices of un-roadworthiness and infringement notices respectively per inspection by age of vehicle.
Figure 5.10: Rate of rectifications per vehicle inspection: metro taxis vs all other taxis and hire cars
0.00
0.50
1.00
1.50
2.00
2.50
3.00
0 2 4 6 8 10
Rate
of r
ectifi
catio
ns p
er in
spec
tion
Age of vehicle (years)
Taxi-Metro
Non metro taxi
Figure 5.11: Rate of official warnings per vehicle inspection: metro taxis vs all other taxis and hire cars
SAFETY IMPLICATIONS OF TAXI AND HIRE CAR AGE LIMITS 67

0.00
0.05
0.10
0.15
0.20
0.25
0 2 4 6 8 10
Rate
of o
ffici
al w
arni
ngs p
er in
spec
tion
Age of vehicle (years)
Taxi-Metro
Non metro taxi
Figure 5.12: Rate of notices of un-roadworthiness per vehicle inspection: metro taxis vs all other taxis and hire cars
0.00
0.05
0.10
0.15
0.20
0.25
0 2 4 6 8 10
Rate
of N
OUs
per
insp
ectio
n
Age of vehicle (years)
Taxi-Metro
Non metro taxi
Figure 5.13: Rate of infringements per vehicle inspection: metro taxis vs all other taxis and hire cars
68 MONASH UNIVERSITY ACCIDENT RESEARCH CENTRE

0.00
0.02
0.04
0.06
0.08
0.10
0.12
0 2 4 6 8 10
Rate
of i
nfrin
gem
ents
per
insp
ectio
n
Age of vehicle (years)
Taxi-MetroNon metro taxi
Figure 5.10 shows a clear increase in the rate of rectifications per vehicle inspection for all taxi types with the trends and absolute rates being similar for metro taxis and all other taxis and hire cars. Over the life of the vehicle the rectification rate per inspection increases nearly three-fold most likely related to wear and tear on the vehicle as it ages.
Similar trends are seen in the rates of un-roadworthiness shown in Figure 5.12 although the rates of un-roadworthiness are much lower than the rates of defects with only around 5% of vehicles inspected found to be un-roadworthy on average. Although the inspection regime often targets inspections so the data may not be representative of the broader fleet, the trend to increasing rate with age still suggests vehicle deterioration. The other notable feature is the rates of un-roadworthiness drop off dramatically after seven to eight years where the inspections will largely relate to WATs and modified or high luxury hire cars. This suggests that although these specialist vehicles record defects, they appear to be less serious and therefore rarely leading to an un-roadworthy condition implying reasonably good maintenance of these vehicles with higher allowable age limits.
Of the measures examined, defects and un-roadworthiness are the ones that are most likely to be related to poorer vehicle safety and in particular crashes caused by vehicle defects. Official warnings and infringements are generally issued for non-vehicle safety related issues such as operating a taxi without a permit or refusing to take a passenger. Comparing the rates of defects and un-roadworthiness by vehicle age to trends in crash risk be vehicle age show little correlation. There is no marked trend towards increasing crash risk with vehicle age seen in the vehicle condition trends. The observed lack of association suggests that although vehicle condition deteriorates with time, the inspection regime is effective in identifying the defects before they lead to crashes and that they are subsequently rectified. Another possibility is that vehicle defects have a relatively minor role to play in crash causation which has been found in previous studies (van Schoor et al, 2001). A combination of both these possibilities is likely although the observed trend to increasing vehicle defects with age gives some support to the need for random and targeted inspection of taxis for defects and roadworthiness.
SAFETY IMPLICATIONS OF TAXI AND HIRE CAR AGE LIMITS 69

The continuous increasing trend in defects implies that if age limits of taxis were increased, and this resulted in less frequent regeneration of the fleet, the need for the compliance regime would become greater as the rate of vehicle defects continued to increase.
There are no discernible trends in the other compliance based methods examined. The rates of official warnings per inspection shown in Figure 5.11 are very low and have no trend with vehicle age. Rates of infringements are also very low and show no consistent trends with vehicle age.
70 MONASH UNIVERSITY ACCIDENT RESEARCH CENTRE

SAFETY IMPLICATIONS OF TAXI AND HIRE CAR AGE LIMITS 71

6 SUMMARY AND CONCLUSIONS
6.1 PHASE 1: STAKEHOLDER CONSULTATION
Justification for the current age limit based restrictions on taxis and hire cars
In Victoria, as in other Australian jurisdictions, there is currently no objective evidence-based justification for age limit restrictions on taxis and hire cars. Discussions with Victorian vehicle operators and customers and a range of industry stakeholders noted the widely held opinion that the age limits are generally appropriate and necessary, but not sufficient, for achieving minimum standards in a number of important criteria, including safety, condition, comfort and presentation. Safety was deemed to be the most important criteria with respect to the standard and condition of the vehicle. Most respondents, particularly, stakeholders, were aware that a vehicle becomes relatively less safe with age due to the absence of modern vehicle safety features which are fitted as standard in most newer, modern vehicles. Newer vehicles were also perceived to be in better mechanical condition, being less likely to experience a technical failure that could contribute to a crash.
Feedback from interstate taxi and hire car stakeholders also indicated that there is no evidence-based justification for the current age limits set in their states/territories. Some stakeholders reported that their limits were set to be consistent with those in other jurisdictions and/or were based on consultation with industry on what were deemed to be ‘acceptable standards’, although no details were provided about what these standards were and how they were derived. Consistent with Victorian stakeholders, most interstate stakeholders believed the age limits were generally appropriate to ensure the safety of vehicles, and cited the same anecdotal evidence regarding the basis for the age limit criteria for ensuring vehicle safety, comfort and presentation.
Those who perceived the age limit restrictions to be inappropriate were generally in the minority. This is consistent with the finding that most operators retired their vehicles about six months before the maximum age limit and commissioned them one year earlier than the maximum entry limit. Those who disagreed with the current age limit restrictions thought that the standard and frequency of servicing and maintenance and vehicle mileage influenced safety independently of age, particularly the small proportion of regional operators in favour of extending the maximum vehicle age limit restrictions. However, few respondents were aware that mechanical defects rarely feature in serious road trauma, and were generally unaware that vehicle safety standards and features impact on safety performance independently of vehicle condition.
Some operators indicated that the age criteria were designed for pragmatic rather than safety reasons, and/or as a financial incentive for operators, citing the inconsistencies in exit age criteria between some categories of vehicle, particularly between standard taxis, WATs and some types of hire car. As such, most respondents, with the exception of hire car operators, did not support age limits for hire vehicles being variable according to the type or value of the vehicle unless there were inherent differences in the safety standards/ratings of the vehicles.
Some taxi operators indicated that the maximum entry age limit for taxi vehicles was unnecessary for safety, pointing out that age-based restrictions should be based on the total period of time the vehicle is operational as a taxi. The age at which the vehicle is commissioned was a decision deemed by most operators to be based on financial constraints including the balance between costs to purchase the vehicle and predicted returns on
72 MONASH UNIVERSITY ACCIDENT RESEARCH CENTRE

investment to vehicle retirement age, taking into consideration maintenance and running costs.
While most respondents agreed that factors other than age were also important for ensuring vehicle safety (such as vehicle mileage, standard and frequency of maintenance), these factors were deemed to be harder to enforce, monitor, and or measure than age-based restrictions. As such, age was deemed by the majority of respondents to be the most effective and efficient method for measuring and ensuring the safety of vehicles. Whether age based limits remain relevant in the event of implementing alternative policies to ensure the safety of taxis and hire cars is discussed further in the Section 6.2.
Future vehicle purchasing choices
Overall, most taxi and hire car operators were unable to specify their anticipated vehicle purchasing choices following closure of the Australian vehicle manufacturing industry, and most were generally not in favour of considering purpose built taxis. Indeed, most operators made opportunistic vehicle choices based on the types of vehicle readily available and for which repair and maintenance was cheap and efficient. This suggests that there is scope for setting boundaries around the types of vehicles that could be introduced in future particularly, and most importantly, with respect to safety standards.
Factors influencing vehicle purchase, maintenance, repair and replacement
For most taxi operators, purchase price was rated as highly important in vehicle purchasing choices, with 75% setting a limit on the purchase price of vehicles. However, economic constraints were not the only factors influencing vehicle purchasing choices - vehicle size and type; familiarity with the vehicle; servicing and maintenance costs; and reliability were also rated as being highly important. Safety of the taxi was one of the criteria listed for rating but rated around 6th in importance after the other factors described. Around 90% of respondents ranked safety as important but not as important as the other factors listed which 100% of respondents listed as important (see Table A4.18 in the Appendix).
A very small proportion of regional taxi operators argued that the maximum entry age limits should be raised to minimise vehicle purchasing costs. However, it was also pointed out that initial vehicle purchasing costs needed to be weighed against the likely return on investment that could be achieved over the lifetime of the vehicle as a taxi. The data, however, show that three quarters of taxi operators purchased their vehicles between 0-18 months, one year younger than the maximum 2.5 entry age limit.
It appears then, that most operators elect to purchase their vehicles earlier and potentially at a higher price in order to maximise the return on investment that can be made over the lifetime of the vehicle as a taxi. As such, the currently regulated maximum entry age limits are unlikely to be relevant as in practice the economic decisions of taxi operators results in relatively newer entry age for vehicles, particularly those operating in metropolitan zones.
For hire car operators, purchase price was rated as being of equally high importance in vehicle purchasing choices, along with customer style/look/customer preference; fuel economy and reliability. However, a comparatively lower proportion of hire car operators (just over half) set a limit on the purchase price of their vehicles, with most electing to purchase their vehicles new or younger than 12 months of age. These choices appear to be consistent with the higher standard of customer service expected of hire car operations, and the finding that hire car operators were more likely to agree that expensive/luxurious vehicles should be retained in service longer than standard vehicles.
SAFETY IMPLICATIONS OF TAXI AND HIRE CAR AGE LIMITS 73

The factors influencing vehicle retirement generally suggest that the current exit age limits are fairly consistent with operators’ economic decisions since the data show that it is not economically viable for operators to retain their vehicles at or beyond the current maximum age limits. This was particularly the case for taxis which were serviced, on average, twice as frequently as hire cars, and were more likely to require maintenance and servicing outside of regular service intervals for some vehicle components.
Most taxi operators retired their vehicles an average of six months prior to the maximum exit age, having clocked an average of 720,000 kilometres. In contrast, hire car operators kept their cars close to the maximum operating age at which they had averaged nearly 400,000km. Not surprisingly, for a large proportion of vehicle operators, increasing maintenance and servicing costs were rated as being highly important in the decision to retire a vehicle from the fleet, particularly for hire car operators. Other highly important economic factors included the vehicle being off road too often and/or too long and the vehicle being no longer economic to run.
Operation, efficiency and effectiveness of the current inspection regime and safety related issues identified by enforcing authorities
Overall, most operators reported that vehicles were found to be compliant at both annual and random vehicle inspections. Few issues were identified as requiring attention, particularly in hire cars, and most included wear and tear of tyres, lights, brakes and electrical equipment. Although stakeholders reported few difficulties in rectifying these defects, there was a level of resistance among some taxi operators including ‘shopping’ around for an inspector who would be less likely to fail the vehicle.
Most respondents believed that both the annual and random vehicle inspection regimes were important and effective in maintaining the safety of vehicles. However, a large proportion of respondents thought that the inspections only provide a ‘snapshot in time’ of the safety of a vehicle, potentially allowing operators to overlook problems that arise at other times. As such, the random vehicle inspection process was deemed to be much more important for ensuring a minimum standard of safety and maintenance by vehicle operators at times outside of the annual inspection period.
Some respondents, particularly hire car operators and stakeholders including those from interstate, suggested that the frequency of random inspections and the diversity of locations in which they are conducted could be increased and should become more frequent as the vehicle ages. This is not surprising since no hire cars were subjected to a random inspection over the past year compared to an annual average rate of 2.6 for taxis. It was also suggested that random inspections could be implemented more consistently across the year, as they currently are perceived to be carried out in waves.
Some stakeholders suggested that targeted inspections should replace random (and annual) inspections to allow continuous monitoring of vehicles with previously identified safety issues and/or vehicles that appear to be poorly maintained and/or reaching retirement age. Targeted inspections were perceived to represent an improvement over random inspections which were thought to be inefficient and disruptive to current operations, particularly when conducted at locations such as the airport.
Summary of Identified Issues
A large proportion of respondents from Victoria and some of the interstate taxi stakeholders suggested that the appropriate decommissioning point for vehicles should be based on either or both their level of safety by contemporary standards and the condition they are in. Some
74 MONASH UNIVERSITY ACCIDENT RESEARCH CENTRE

of the Victorian respondents suggested that a set of standards relating to minimum safety levels would be appropriate, based on ANCAP or similar criteria, and that a phase-in timetable of desirable safety features or ratings could be set out and incentives put in place for their adoption. With the exception of the ACT, however, none of the interstate taxi stakeholders were planning to review their current age limit restrictions, and none had recommended criteria other than or in addition to age for limiting the operation of a vehicle as a taxi or hire car.
Just over half of all respondents who provided additional feedback in relation to the safety of taxis and hire cars suggested that greater improvements in driver training, route knowledge, care and competency by taxi drivers would do more to improve the safety of vehicles and the general public than the current age limit restrictions.
Overall, vehicle age was deemed by most respondents to be appropriate as a safety criterion, but needed to be considered along with other factors including vehicle safety standards/ratings; the standard and frequency of vehicle maintenance and servicing; and the implementation of objective and targeted vehicle inspection regimes.
6.2 PHASE 2: QUANTITATIVE ANALYSIS
Quantifying Current Taxi and Hire Car Safety
This study has been able to quantify the safety performance of the current taxi and hire car fleet in terms of both the risk of a vehicle being involved in a crash (primary safety) as well as the contribution of the age and specification of the vehicle to the likelihood of the crash resulting in death or serious injury to those involved (secondary safety). Based on this information, a model was constructed that allowed the investigation of the effects varying the attributes of vehicles used as taxis and hire cars would have on road trauma outcomes and their associated economic costs. Using the model the road safety impacts of a number of scenarios for changing the vehicle age requirements for taxis and hire cars were investigated. In addition, the model was also used to investigate other potential policy options concerning the safety performance of vehicles that could be used as taxis and hire cars as well as potential benefits from improving driver performance to reduce crash risk.
Quantification of the safety performance of taxis and hire cars revealed a number of key attributes of the taxi and hire car fleets relevant to the objectives of the study. Despite analysis of data on targeted and random roadworthiness inspections of taxis and hire cars by the TSC showing a clear increase in the rate of vehicle defects and un-roadworthy vehicles over time, no association between crash risk per vehicle, year of exposure and vehicle age was identified. This suggests that, within the current operating age limits, the TSC random and targeted inspection regime is effective at identifying vehicle defects before they potentially lead to crashes albeit noting the likely weak relationship between vehicle defects and crash risk.
One clear result from the analysis of vehicle crash risk was the much higher crash risk of taxis compared to hire cars and in particular the high crash risk of metropolitan taxis. On a per vehicle year of exposure, metropolitan taxi crash risk was over four times that of a hire car. Even when relative distance travelled in a year was accounted for, metropolitan taxi crash risk was still over twice that of a hire car. This result points to a clear need to understand the reason for the increased crash risk of metropolitan taxis in order to develop
SAFETY IMPLICATIONS OF TAXI AND HIRE CAR AGE LIMITS 75

effective countermeasures to reduce the elevated crash risk. The potential benefits of countermeasures directed at this problem were considered in the scenario modelling.
Like the wider light vehicle fleet, analysis in this study identified a consistent long term trend to improving secondary safety of the taxi and hire car fleet. Based on the current age limit restrictions for taxis and hire cars, each year the risk of being killed or seriously injured in a crash involving a taxi and hire car reduces by around 2%.Over a 10 year period, this equates to around a 20% reduction. This trend is consistent and expected to continue into the future. Altering vehicle age limits for taxis and hire cars could have an impact on this trend. Increasing maximum age limits could slow down the rate of regeneration of the taxi and hire car fleet to newer vehicles and hence slow down the rate of reduction in deaths and serious injuries related to fleet regeneration. The converse is also true meaning reducing age limits for taxis and hire cars would have benefits in reducing road trauma associated with taxi and hire car crashes. However, faster regeneration of the vehicle fleet comes at a cost to operators who must change their cars more frequently.
Identifying these potential benefits and costs provided the impetus for undertaking the scenario analysis to quantify trauma savings and economic benefits associated with various change possibilities.
Effects of Changing Age Limits
Applying the scenario model established in the research identified that changing taxi and hire car age limits is estimated to have only modest impacts on road trauma. Changing the maximum operating age of all taxis and hire cars to five years would save around six (2%) of around 300 crashes involving taxis and hire cars resulting in injury annually. Based on the current injury severity profile of crashes involving taxis this translates to around 1.5 fatal or serious injury crashes and 4.5 minor injury crashes. Changing the maximum age limit to a uniform 1 year was estimated to save 19 (6%) of crashes resulting in injury, with 4.7 of these estimated to be fatal or serious and 14.3 minor. Changing the maximum age limit for all taxis and hire cars to 10 years was estimated to result in an additional 16 (5%) crashes involving injury (4 fatal or serious injury and 12 minor injury) per annum assuming operators retain their vehicles to the maximum age limit.
Expanding these results to consider the relative economic costs and benefits in changing vehicle age limits provided further evidence to inform the impact of different policy settings around vehicle age limits. For decreased maximum vehicle age limits, the value of road trauma savings achieved for each reduction considered was far outweighed by the additional costs of vehicle depreciation imposed on the taxi industry. Although benefits of reduced vehicle emissions were considered in the economic analysis, their value was small compared to the road trauma savings. Regardless of their inclusion, the estimated benefit to cost ratio for each maximum age reduction was less than 0.1 (i.e. for each additional dollar in vehicle depreciation born only 10c or less in road trauma costs were saved).
Although increasing vehicle age limits showed positive economic benefits, these benefits come at the expense of increased road trauma. It should be noted that these economic benefits and road trauma increases would only be realised if setting the maximum age limit at 10 years caused an increase in the average time vehicles are kept in service. Operators reported that many vehicles currently reach the limit of their serviceable life before the current age limits, which for the majority of vehicles is between 5 and 6.5 years, suggesting that keeping
76 MONASH UNIVERSITY ACCIDENT RESEARCH CENTRE

them longer is simply not viable form a wear and maintenance perspective. Hence a maximum age limit of 10 years may not alter the current age to which vehicles are kept.
Effects of Safer Vehicle Choices
Scenario modelling identified other options for improving the safety of the taxi and hire car fleet that will potentially be much more effective than age limits. The first of these is to introduce vehicle safety performance based standards for vehicles entering service as a taxi or hire car. Ensuring vehicles have the best available secondary safety performance is the first area of focus. Scenario modelling identified potential savings in crashes resulting in injury of 23% (70 per year) through choosing vehicles with the best available secondary safety performance. Furthermore the economic analysis identified that up to $7000 per vehicle in addition to the purchase price could be justified on the basis of benefits returned to the community. Inclusion of emerging driver assistance technology aimed at crash avoidance showed similar crash reduction and economic benefits. For example, including Autonomous Emergency Braking (AEB) on all taxis and hire cars was estimated to reduce injury crash numbers by around 24% justifying a potential expenditure of just over $7000 per vehicle to include the technology. Even technologies reducing crash risk by only 5% could justify expenditure of over $1500 per vehicle reflecting the high exposure and crash risk of taxis and hire cars.
Improving vehicle safety performance through vehicle choice prioritising safety often comes at very little real cost in which case the benefit to cost outcomes for this countermeasure can be very high. Often achieving the scenario simply involves changing the selection of vehicle from one with poorer secondary safety or without crash avoidance technologies to one with. For example, the current Subaru Liberty with AEB and lane departure warning systems amongst other safety features could be purchased in preference to a Toyota Camry without these systems, both vehicles have a similar purchase price.
With regards to policy setting, the question becomes how the policy wording can be formulated to stipulate appropriate safe vehicle choices. The ANCAP (www.ancap.com.au) rates the secondary safety of new vehicles through a series of standardised tests, awarding a star rating out of a possible five for performance. Higher ratings in NCAP tests have been shown to correlate to lower real world injury risk in a crash (Lie and Tingvall, 2002). A safe vehicle policy could stipulate that only five-star ANCAP rated vehicles should be used as taxis and hire cars. Specifying vehicle crash avoidance technologies is perhaps simpler since it is a matter of identifying effective technologies and mandating that they be fitted to vehicles used as taxis and hire cars. The issue then becomes selecting which technologies to consider and deciding the timeframe for any introduction.
The process used for setting ADRs for safety related items on vehicles could serve as a model for this decision making process. A first requirement is that scientific evaluation evidence exists for the effectiveness of the technology in the local context. The second is that the technology is currently available in a sufficient number of vehicles in the fleet to make it generally accessible. The third is that sufficient lead time is given for operators to prepare for the mandate. The order in which technologies are mandated to some degree depends on the first two steps of this process and requires monitoring the vehicle fleet to understand what is being fitted and monitoring the scientific safety literature for evidence of effectiveness.
Stakeholder consultation in this study identified that the majority of taxis are purchased on the second hand vehicle market at around 12-18 months old. It is likely that the primary
SAFETY IMPLICATIONS OF TAXI AND HIRE CAR AGE LIMITS 77

source of these vehicles is from Government and rental car fleets and to a lesser degree other large corporate fleets. Through working in partnership with the agencies responsible for managing these fleets, the TSC could play a role in ensuring the adequate supply of vehicles with the best possible safety performance for use as taxis by ensuring that the fleet managers prioritise safety in their purchases.
The economic evidence provided in the analysis of this study will assist in helping to convince partner fleet managers on the value of this strategy, particularly for the government fleet given the government will benefit directly from the resulting road trauma savings. Another selling feature of the strategy for partner fleet owners might also be assisting to guarantee a second hand market for their vehicles, particularly if the features they are specifying for their vehicle are mandated for taxis. A final consideration that might be made in achieving a safer vehicle fleet is to offer incentives or rebates to operators for safe vehicle choices. The break even points calculated for these scenarios give the maximum incentive or discount that could be offered.
If vehicle safety standard based policies are introduced for taxis and hire cars, a question arises as to whether age based restrictions are still relevant. As demonstrated by the analysis in this study and through observation of the vehicle fleet, vehicle safety performance continues to improve steadily with the refinement of vehicle design and the introduction of new technologies. The content and requirements of vehicle safety standards based policy will have to be continually reviewed as new technologies and better designs emerge. There may still be a role for age based limits in this process to ensure the ongoing regeneration of the taxi and hire car fleet to include the latest improvement in a reasonable time frame. Alternatively this could be achieved through a lead time process for fitment of safety features or meeting a safety performance requirement nominated by the regulator.
The major focus of the scenario analysis has been on examining the effects of changing the maximum age limits of taxis and hire cars. Assessing the role of minimum age limits is more difficult since it is intrinsically related to the maximum age limits set. The taxi and hire car operator survey highlighted that operators need to run the vehicles they purchase for a certain length of time to ensure return on their investment. The current age limits dictate that operators buy their vehicles at 12-18 months old to ensure this return with relatively few currently exploiting the 2.5 year maximum entry limit. If increased age limits for vehicle retirement are not ultimately adopted, the results of this study suggest the setting of maximum entry age limits could reasonably be dropped from the requirements without any change in safety.
Effects of Reducing Crash Risk
The final area with potential to significantly improve taxi safety is in reducing the crash risk on a distance travelled basis of regular taxi drivers to that of hire car drivers. Modelling this scenario estimated around a 50% reduction in taxi crash rates with up to $15,000 per vehicle invested on countermeasures to achieve this goal with positive economic benefits to the community. This scenario represents the one with the highest potential although could also be combined with the vehicle safety standards based policy to provide even greater benefits.
There are a number of countermeasures that could be considered to reduce taxi driver crash risk. Further research would be required to quantify driver factors affecting crash risk (such as driver behaviour and experience, shift length, hazard perception and risk management), so that countermeasures could be specifically targeted to address those factors and behaviours.
78 MONASH UNIVERSITY ACCIDENT RESEARCH CENTRE
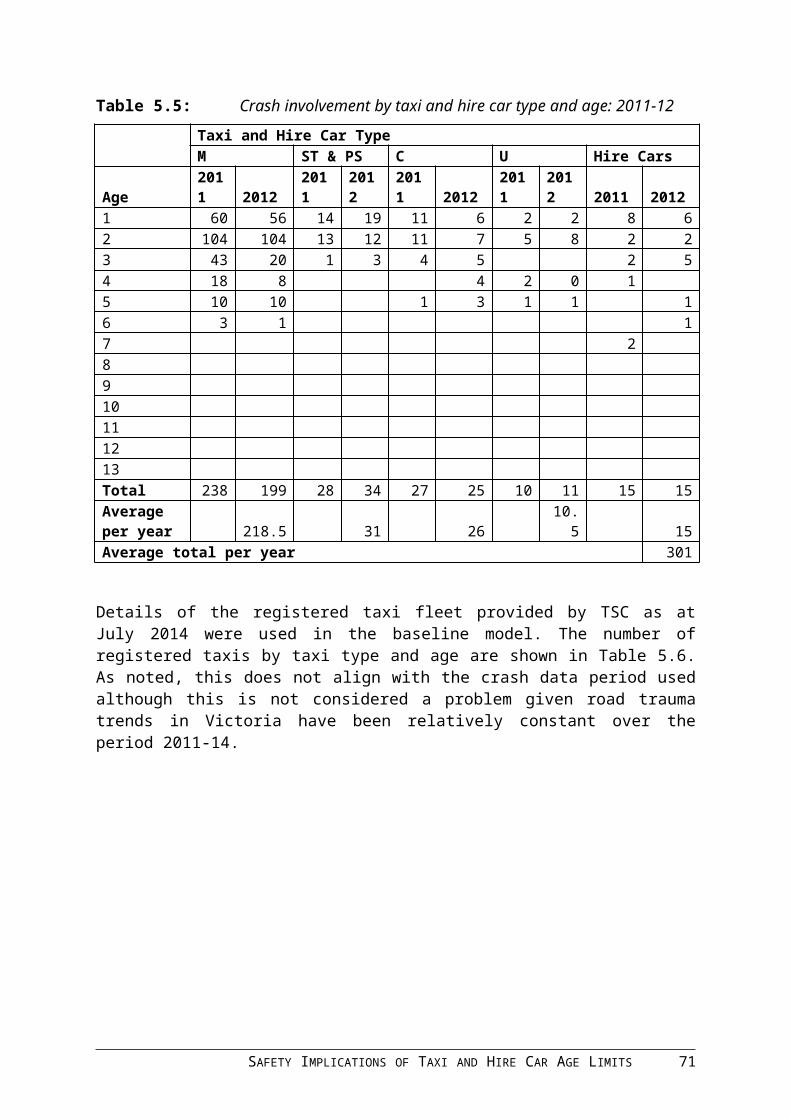
The first is more rigorous on-road driver skill assessment at time of accreditation as a taxi driver. Current licensing assumes that the regular driving licence test is adequate to ensure driving skills with the taxi licence assessment being a knowledge-based test. Given the high travel exposure of taxi drivers it could be argued that higher on-road skills in terms of hazard perception and risk mitigation should be required. Although it is not clear what a more rigorous on-road testing regime for taxi drivers should assess, this is an area possibly worth investigation through further research based on in-depth investigation of current crash causation factors for taxi drivers. Advanced driver training is difficult to recommend in this area given the lack of success of advanced driver training generally in improving road safety outcomes.
A further option for reducing taxi crash risk might be to review the penalty system associated with traffic infringements for taxi drivers. This might include higher fines for major safety infringements such as speeding, alcohol and drug use, ignoring traffic controls and mobile phone use, greater demerit points associated with these infringements or lower number of demerit points before licence loss. Specific examination of the type and rate of traffic infringements committed by taxi drivers was not possible in this study but might be researched in the future to inform consideration and development of this potential countermeasure.
A final potential countermeasure for reducing driver crash risk is the use of telematics. Telematics are electronic systems installed in the vehicle that measure and log key driving behaviours such as speeding, heavy braking, hours of continuous driving, engine speed and fuel economy through interfacing with the vehicle electronic systems and the addition of other sensors such as GPS and accelerometers. Since the systems have dynamic feedback to a central data system to continually monitor driver behaviour, drivers displaying dangerous behaviour can be rapidly identified and action to curb their behaviour implemented. In the trucking industry where these systems are now in common use, action can include warnings, suspension or termination of employment or even licence cancellation.
Consideration needs to be given on how telematics might be introduced into the taxi fleet, such as who would have access to the data and how the data would be used. Initial implementation as a cooperative trial with large taxi operators might be a feasible way to start demonstrating the potential benefits of the system not only on road safety but also driver personal safety and reduced operating costs. The cooperative trial could serve the basis of rolling out the technology on a wider basis after the specific benefits have been established. A trial would be most beneficial if tested on the metropolitan taxi fleet where the majority of benefits from a wide rollout would be accrued.
Scope of Benefits
Strategies to increase the safety of the taxi and hire car fleets will only be effective for vehicles under the authority of the TSC. The emergence of ride share and other commercial passenger vehicle services outside of TSC authority poses a threat to the potential benefits that might be achieved through the safety vehicle and driver strategies identified in this study unless they can be applied equally to these emerging services.
SAFETY IMPLICATIONS OF TAXI AND HIRE CAR AGE LIMITS 79

80 MONASH UNIVERSITY ACCIDENT RESEARCH CENTRE

7 RECOMMENDATIONS
7.1 DATA ISSUES
Evaluation and monitoring taxi and hire car fleet safety and subsequent monitoring of the effects of policy change could be improved through the enhancement of supporting data systems. The following recommendations are made regarding data systems:
1. The database on taxis and hire cars associated with operator licences has vehicle details recorded against all operator licences. Furthermore, vehicle details need to include the vehicle identification number (VIN) to accurately identify the vehicle.
2. The TSC archives regular snapshots of the registered taxi and hire car fleets in order to facilitate longitudinal analysis of changes in the profile of the taxi and hire car fleets.
3. VicRoads establishes and maintains an electronic database of periodic vehicle inspection results for taxis and hire cars so the value of periodic inspections for these vehicles for improving road safety can be evaluated.
4. The TSC iFacts database be assessed for quality to ensure rectifications, official warnings, NOUs and infringements issued all match with a base inspection record that includes all vehicle details including registration plate number and, if possible, VIN.
5. Vehicle odometer readings should be taken at the time of periodic and random inspections to provide data on vehicle travel exposure which would enhance the potential to study taxi crash risk in greater detail.
7.2 VEHICLE AGE LIMITS
From the analysis of the current maximum entry and exit age limits for taxis and hire cars as well as the analysis assessing the potential changes to the maximum entry and exit age limits is recommended that:
The retention of vehicle age limits should be considered as part of a broader range of measures (including vehicle safety standards and technology) aimed at ensuring primary and secondary safety outcomes. There seems to be general acceptance of the current age limits by stakeholders. However, it should be noted that the taxi and hire car industries have only operated in a ‘vehicle age limit’ environment and, therefore, have not experienced, or had exposure to, any alternative regime. Existing age limits also seem to align closely with current business practice to retire vehicles when their continued operation becomes financially unviable. Reducing the current age limits would result in limited road trauma benefits whilst resulting in a high cost to taxi and hire car operators through additional vehicle depreciation. Ultimately this cost would need to be passed onto consumers in order to not adversely impact operator business viability. Increasing age limits would result in positive economic benefits (assuming operators retain their vehicles to the maximum age limit), but would need to be considered carefully since it may increase road trauma.
SAFETY IMPLICATIONS OF TAXI AND HIRE CAR AGE LIMITS 81

Consideration is given to the relevance of minimum age limits for taxis. Minimum age limits seem largely unwarranted since operators need to operate vehicles for a minimum time period to achieve return on investment. The current maximum age limits dictate that vehicles are generally purchased between 12 and 18 months of age which is unlikely to change after removing minimum age limits.
7.3 VEHICLE SAFETY SPECIFICATION
Analysis in this study estimated significant road safety benefits could be obtained in a cost effective manner by setting standards for vehicle safety performance and specification for vehicles entering service as a taxi or hire car. To achieve these benefits it is recommended that:
The TSC considers mandating a five-star ANCAP rating for all vehicles being licensed as taxis or hire cars for the first time reflecting the established relationship between higher NCAP scores and reduced injury risk in a crash (Lie and Tingvall, 2002). It might be necessary to exempt WATs and stretched hire cars from this requirement as modifications may fundamentally alter safety performance. Further, there is possibly a limited range of vehicles that can reasonably be modified. Five-Star ANCAP ratings for vehicles on which WATs and modified hire cars are based should be encouraged.
The TSC monitors directly or through an external agency both the international research for evidence of the effectiveness of emerging vehicle crash avoidance technologies and establishes the availability of effective technologies in the Victorian vehicle fleet.
The TSC investigates a process for encouraging accelerated uptake of proven effective crash avoidance technologies in taxis and hire cars. This should include working with Government, rental car and other fleet owners whose vehicles are regularly purchased second hand for use as a taxi or hire car, to purchase vehicles fitted with proven effective crash avoidance technologies.
The TSC considers mandating proven effective vehicle crash avoidance technologies for fitment to taxis and hire cars. Technologies can be mandated when there is sufficiently high fitment rate in the fleet to ensure adequate supply of vehicles and after providing sufficient warning to taxi and hire car operators of the impending mandate.
7.4 DRIVER TRAINING AND MONITORING
Taxis were identified to have a very high crash risk relative to hire cars, even after accounting for vehicle kilometres travelled. Effectively addressing this problem offers the potential for the greatest crash savings (up to 50% of all crashes) with up to $15,000 per vehicle able to be spent whist still returning positive benefits to the community. Driving standards were also noted as the prime concern of taxi customers. To address this problem, the following recommendations are made:
Consideration is given to the introduction of a practical on-road test as part of the taxi driver accreditation scheme to assess driver skills for a level of hazard perception and risk assessment above that mandated for the regular driver licensing test. Research would need to be undertaken to establish the most appropriate content of the test based on in-depth analysis of taxi crash causation to establish the primary risk factors for taxi crashes.
82 MONASH UNIVERSITY ACCIDENT RESEARCH CENTRE

A trial of the use of vehicle telematics systems is undertaken in taxis with the cooperation of some larger metropolitan taxi fleet operators. The benefits of using telematics to improve driver safety as well as to lower vehicle operating should be investigated in the trial. The trial should also consider issues of how telematics should be ultimately implemented in the taxi fleet with respect to access, use and ownership of data from the system. The trial should be subject to rigorous independent scientific evaluation. Results of the trial should be reviewed with a view to establishing the benefits of mandating telematics for taxis in the longer term.
7.5 THE ROLE OF THE COMPLIANCE REGIME
Analysis identified that the TSC compliance regime undertaking both targeted and random inspections of taxi and hire car roadworthiness appears to identify defects that may impact on crash risk across the operating life of a taxi and hire car. It is recommended that:
A random and targeted vehicle inspection program should be maintained to ensure the continued detection and rectification of vehicle faults.
SAFETY IMPLICATIONS OF TAXI AND HIRE CAR AGE LIMITS 83

84 MONASH UNIVERSITY ACCIDENT RESEARCH CENTRE
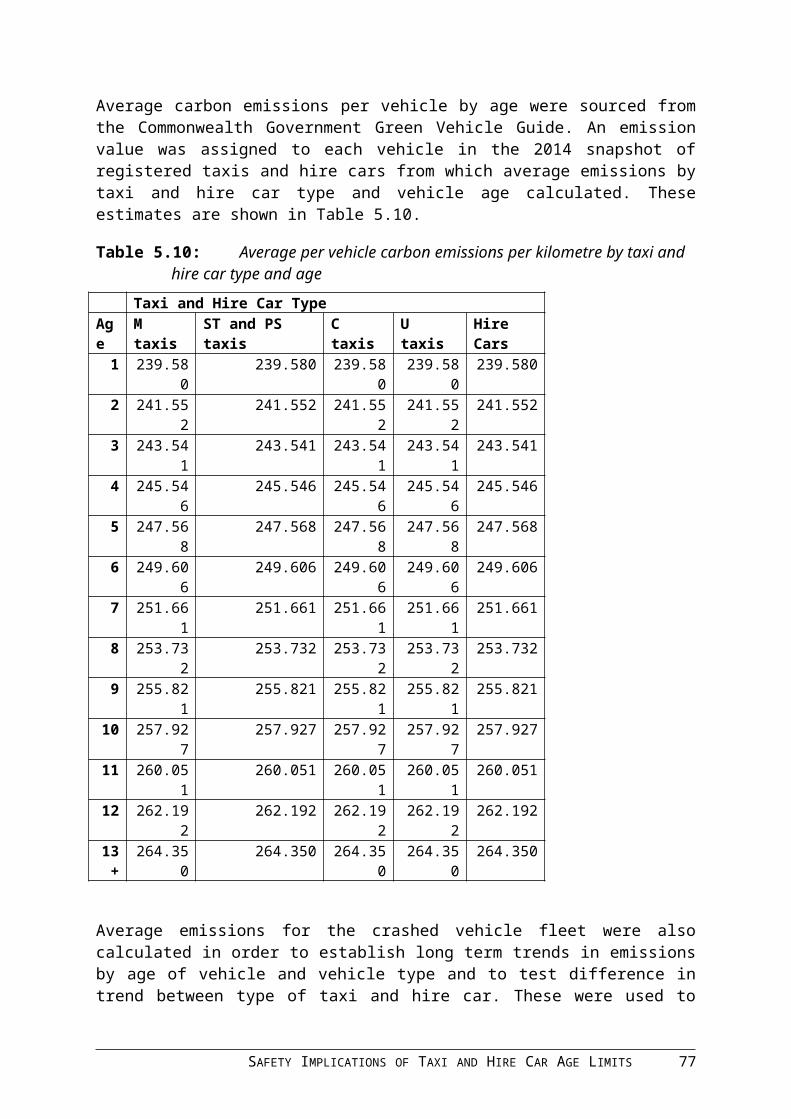
8 FURTHER RESEARCH AND EVALUATION
A number of areas for further research were identified in undertaking this project. They are:
Given the disparity in crash risk between taxis and hire cars is not attributable to vehicle safety standards, further research is recommended to quantify differences in factors between taxis and hire cars that might affect crash risk . This could include factors such as driver behaviour and experience, shift lengths and differences in the nature of work undertaken by taxis and hire cars.
Undertake an in depth study of taxi crashes to establish crash causation factors and in particular inadequacies in hazard perception and risk management by taxi drivers. Methods employed for the study could be post-crash in-depth investigation to establish crash causation as well as naturalistic methods of driver behaviour generally to quantify risk factors. This research could also develop key requirements for enhanced on-road licence testing of existing or prospective taxi drivers.
Undertake evaluation of the impact of any future changes to taxi age limits, vehicle safety requirements and driver focused countermeasures on road trauma outcomes in crashes involving taxis and hire cars. The research could, at a minimum continue to track taxi fleet safety performance and in particular the impact of closure of local vehicle manufacturing on the taxi and hire car fleet.
Undertake ongoing review of the international literature to identify proven effective new vehicle safety technologies that could be fitted to the taxi and hire car fleets. Research should also monitor the profile of Victorian fleet vehicles to identify the ownership pathway of vehicles prior to taxi ownership in order to identify the key touch points to improving the supply of safer vehicles that are likely to eventually become taxis.
SAFETY IMPLICATIONS OF TAXI AND HIRE CAR AGE LIMITS 85

86 MONASH UNIVERSITY ACCIDENT RESEARCH CENTRE

9 REFERENCES
Anderson, R., Hutchinson, T.P., Linke, B. & Ponte, G. (2011). Analysis of crash data to estimate the benefits of emerging vehicle technology, Centre for Automotive Safety Research, The University of Adelaide. Report No. CASR094.
BITRE (2010). Cost of road crashes in Australia 2006 Canberra, Bureau of Infrastructure Transport and Regional Economics.
Budd L, Newstead S, Scully J (2013) Modelling the Road Trauma Effects of Potential Vehicle Safety Improvements in the Western Australian Light Passenger Vehicle Fleet Curtin Monash Accident Research Centre, Project 09-009RSC.
Cameron, M. H., Newstead, S. V., Le, T. and Finch C. (1994) Relationship between vehicle crashworthiness and year of manufacture Melbourne, Australia, Royal Automobile Club of Victoria (RACV) Ltd.
Keall, M. D., Frith, W. J., and Patterson, T. L. (2001). A case control study of the effect of alcohol on the risk of driver fatal injury in New Zealand Proceedings, 2001 Road Safety Research, Policing and Education Conference, Melbourne, Victoria, Australia.
Keall, M. D. & Newstead, S.V (2010) The effect of market group mix on crash risk in the Australasian light vehicle fleet Monash University Accident Research Centre, Report No 295, 2010
Keall, M. D., Newstead, S. V. and Scully, J. E. (2006). Projecting effects of improvements in passive safety of the New Zealand light vehicle fleet to 2010. Melbourne, Australia, Monash University Accident Research Centre.
Kloeden CN, McLean AJ, Moore VM, Ponte G (1997) Travelling speed and the risk of crash involvement. Volumes 1 and 2 (CR172), Federal Office of Road Safety, Transport and Communications, Canberra.
Newstead, S., Delaney, A., Watson, L., & Cameron, M. (2004) A model for considering the 'Total Safety' of the light passenger vehicle fleet Melbourne, Australia: Report No 228 Monash University Accident Research Centre.
Newstead, S., & Scully, J. (2009). Estimation of the effect of improved average secondary safety of the passenger vehicle fleet on annual counts of serious injury for Australia and New Zealand: 1991-2006 Report No. 289 Monash University Accident Research Centre.
Newstead, S., Watson, L. & Cameron, M. (2013) Vehicle safety ratings estimated from police reported crash data: 2013 update. Australian and New Zealand crashes during 1987-2011 Report No. 318 Monash University Accident Research Centre, 2013
NTC(2010) Draft national in-vehicle telematics strategy Draft Report, National Transport Commission.
Scully, J.E. and Newstead. S.V. (2011) Follow-up Evaluation of Electronic Stability Control Effectiveness in Australasia Report No. 306 Monash University Accident Research Centre, 2011
SAFETY IMPLICATIONS OF TAXI AND HIRE CAR AGE LIMITS 87

Lie, A., & Tingvall, C. (2002). How Do Euro NCAP Results Correlate with Real-Life Injury Risks? A Paired Comparison Study of Car-to-Car Crashes. Traffic Injury Prevention, 3 288-293.
TSC (2012) Taxi Industry Inquiry: Consumers First – Service, Safety, Choice – Final Report Taxi Services Commission Victoria, September 2012.
van Schoor O, van Niekerk JL, Grobbelaar B (2001) Mechanical failures as a contributing cause to motor vehicle accidents — South Africa, Accident Analysis & Prevention 33:pp. 713-721.
88 MONASH UNIVERSITY ACCIDENT RESEARCH CENTRE

APPENDIX 1: LETTER OF INVITATION TO STAKEHOLDERS
SAFETY IMPLICATIONS OF TAXI AND HIRE CAR AGE LIMITS 89

90 MONASH UNIVERSITY ACCIDENT RESEARCH CENTRE
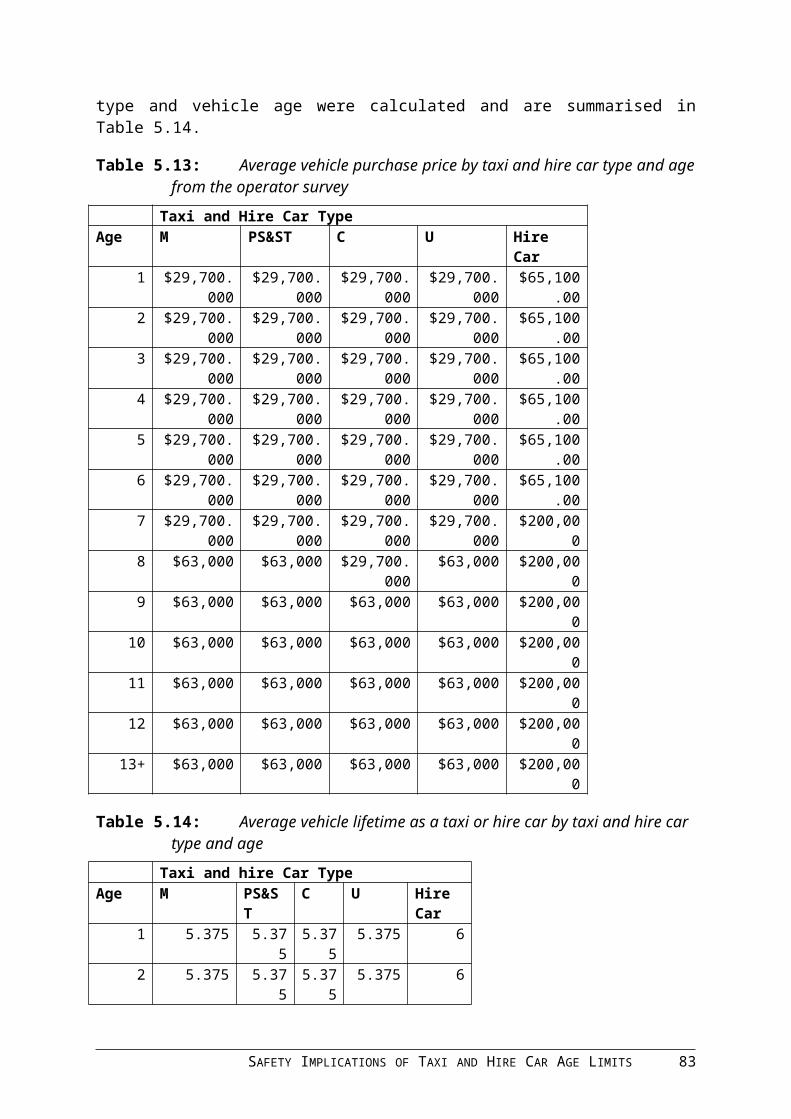
APPENDIX 2: TAXI AND HIRE CAR OPERATOR SURVEYS
(Double click to open)
SAFETY IMPLICATIONS OF TAXI AND HIRE CAR AGE LIMITS 91

APPENDIX 3: INTERSTATE TAXI REGULATOR SURVEY
1. Could you provide a copy of the taxi and hire car age limits that apply in your State/Territory please? (Victoria's age limits are attached below)
2. On what basis were the age limits that apply in your State/Territory set?
3. Was there any research conducted to support the setting of age limits applicable in your State/Territory and if so could you provide this please?
4. Do most operators operate their vehicles up to the maximum age limit or do they retire them from service before this time?
5. Do you believe the age limits in your State/Territory are appropriate to ensure the safety of vehicles (yes, too stringent, not stringent enough)?
6. Do you believe there are any links between the age of vehicles and safety?
7. Do you have periodic taxi and hire car roadworthiness checks, at what frequency and does this vary with vehicle age?
8. Do you have random roadworthiness inspections of taxis and hire cars. How many of these are conducted annually and what is the total number of taxis and hire cars registered in your State/Territory?
9. Do you think the periodic and random roadworthiness inspection regimes are effective in ensuring taxi and hire car safety?
10. In your opinion, are there different criteria on which to limit the type and age of vehicles that can be operated as taxis and hire cars to ensure their safety?
11. Are there any plans to review vehicle age limits in your State/Territory?
12. If your State/Territory was to review age limits, what changes would you consider, if any?
13. Would you have any other views/thoughts on vehicle age limits that may assist the research?
92 MONASH UNIVERSITY ACCIDENT RESEARCH CENTRE

APPENDIX 4: DETAILED ANALYSIS OF STAKEHOLDER SURVEY RESPONSES
It should be noted that in some of the tabulated data, responses sum to more than 100% because most survey questions were open-ended, allowing participants to provide multiple responses.
A4.1 JUSTIFICATION FOR THE CURRENT AGE LIMIT BASED RESTRICTIONS ON TAXIS AND HIRE CARS
This section provides details about respondents’ perceptions about the basis for entry and exit age limit restrictions, including whether they think the current criteria are appropriate and necessary for ensuring the safety of taxis and hire cars and their views on variable age limits for hire cars. Also included is a summary of criteria deemed by respondents to be more appropriate than age in limiting the operation of a vehicle as a taxi or hire car. Feedback given by respondents that was not captured in other sections of the surveys has also been summarised.
Respondents were asked to provide their opinion about what might be the basis for having entry and exit criteria for taxis and/or hire cars. Across the four participant groups, responses generally fell into five main themes, as shown in tables A4.1 and A4.2.
Table A4.1: Reasons perceived by respondents for taxi and hire car age limit restrictions
Taxi operators (n=10)
Hire car operators (n=6)
Taxi/hire car customers (n=51)
Stakeholders (n=9)
Safety 90% 88.2% 45%
Vehicle condition/maintenance
10% 50% 31.4% 27.3%
Comfort 50% 25.5%
Presentation/reputation 50% 13.7% 45.5%
Cost 33.3% 19.6% 9.1%
Policy 4%
SAFETY IMPLICATIONS OF TAXI AND HIRE CAR AGE LIMITS 93

Table A4.2: Reasons given by respondents who cited safety as the main basis for taxi and hire car age limit restrictions
Taxi operators Taxi/hire car customers
Stakeholders
Safety (n=9) (n=45) (n=5)
New and or better safety features
9% 22.2% 40%
Mechanical condition 2.2%
Crash history 20%
Public perception of fleet safety
20%
No explanation 91% 75.5% 20%
Total 100% 100% 100%
Across most groups, safety was generally perceived to be the main basis for taxi and hire car exit restrictions. The small proportion of respondents who cited safety as the key reason and provided an explanation for their response indicated that new vehicles are safer because vehicle technology has improved over time and key safety features proven to be effective in crash prevention and /or injury reduction such as air bags, automatic braking systems and electronic stability control are now manufactured as standard in most modern vehicles. Older vehicles will have fewer and less effective safety features than new vehicles and will provide less protection to vehicle occupants in the event of a crash. A small proportion of respondents pointed out that vehicle wear and tear is likely to increase with age and/or inadequate or infrequent servicing. Consequently, newer vehicles are generally in better mechanical condition and are therefore less likely to experience a technical failure that could contribute to a crash.
Fifty percent of hire car operators thought the age based criteria provided a proxy measure of the quality and condition of the vehicle, both of which could potentially influence vehicle safety. A third of hire car operators believed that cost was an important basis, allowing operators the opportunity to obtain a return on investment. Others who cited cost as a reason for the age criteria indicated that vehicle operational and maintenance costs would increase and potentially become too high as the vehicle approached retirement age. Those who cited presentation/reputation/comfort as a key reason thought that the industry would need to portray a positive image of the service being offered, particularly in the case of hire cars where a higher standard of service is generally expected.
A4.1.1 Perceptions about the appropriateness and necessity of age limit restrictions for taxis and hire cars
Respondents were asked whether they think age based criteria are a) appropriate and b) necessary for ensuring the safety of taxis/hire cars (See Table A4.3).
94 MONASH UNIVERSITY ACCIDENT RESEARCH CENTRE

Table A4.3: Percentage of respondents who thought age based criteria are appropriate and necessary for ensuring the safety of taxis and/or hire cars and who provided an explanation for their response
Taxi operators (n=21)
Hire car operators (n=6)
Taxi/hire car customers (n=52)
Stakeholders (n=11)
Appropriate 62% 17% 63.5% 82%
Explanation provided 38% 0% 75.8% 81%
Inappropriate 38% 83% 36.5% 18%
Explanation provided 50% 100% 94.7% 100%
Necessary 66% 34% 69.2% 100%
Explanation provided 26.6% 0% 72.2% 81%
Unnecessary 34% 66% 30.8% 0%
Explanation provided 42.9% 100% 75% 81%
With the exception of hire car operators, most respondents thought that the age limit restrictions were both appropriate and necessary for ensuring the safety of taxis and/or hire cars, with all groups being more likely to perceive the age limits as necessary than appropriate.
The key reason given by those who thought age based criteria are appropriate for ensuring the safety of taxis and/or hire cars was that more and better safety features are standard in new, compared to older vehicles, making the newer vehicles more crashworthy (33.3% of stakeholders; 48% of taxi/hire car customers). Age was also deemed to provide a reasonable proxy measure for safety because factors that are potentially more indicative of safety than age are harder to enforce, monitor or measure (28% customers; 33.3% stakeholders, 100% taxi operators). For example, about a third of respondents indicated that factors such as vehicle mileage and the standard and frequency of vehicle servicing and maintenance provide a better measure of vehicle safety than age. However, the age criteria were deemed to be more appropriate in situations where the standard and/or frequency of vehicle maintenance and servicing was low and/or could not be adequately monitored, particularly in cases where the stringency of vehicle inspections varies and is not subject to auditing. Age was also deemed to be easier to assess than mileage since it is not subject to falsification like an odometer reading and was generally thought to correlate well with vehicle mileage and wear and tear, particularly in busy metropolitan taxis operations.
Those who thought the age criteria were inappropriate indicated that factors other than age, including maintenance and servicing, (100% of taxi operators; 75% of hire car operators; 50% of stakeholders), and vehicle safety standards and features (75% of hire car operators) have a greater bearing on safety. Some of these respondents also thought that the lifetime of
SAFETY IMPLICATIONS OF TAXI AND HIRE CAR AGE LIMITS 95

vehicles currently coming into the market would extend beyond current exit age limits due to the higher safety standards and requirements of modern vehicles. Just under ten percent of hire car operators and stakeholders thought that the current exit age limits should be reduced to five years, particularly for imported vehicles. Three quarters of taxi and hire car customers cited factors other than age as being more appropriate or more effective measures of safety. Just over a third of these respondents indicated that the age criteria appeared to be designed for pragmatic rather than safety reasons, and or as a financial incentive for operators, citing the very broad categories into which vehicles are categorised, and the inconsistencies in exit age criteria between some categories of vehicle, particularly between those operating in country and metropolitan zones and between standard taxis and WATs.
The key reasons given by those who thought the age based criteria are necessary were similar to those who thought the criteria were appropriate for ensuring the safety of taxis/hire cars. However, about 25% of taxi operators and stakeholders and taxi/hire car customers also thought that the age based criteria were necessary for eliminating vehicles from the fleet that would otherwise continue to be driven beyond the point where they could be considered safe and/or presentable for customers. About a quarter of taxi and hire car customers also felt the age limits were necessary but not sufficient for safety, with regular maintenance; high safety ratings; a crash free history and objective road safety inspections also being important.
All taxi and hire car operators and 75% of taxi and hire car customers who thought the age criteria were not necessary indicated that factors other than age including vehicle maintenance and servicing have a greater bearing on safety. They indicated that an older vehicle that has been regularly serviced and maintained is much safer than a new vehicle that has been poorly serviced and maintained. Taxi and hire car customers also felt that vehicle safety ratings/standards (16.7%) and vehicle mileage (16.7%) were more important than age limits. Just over 28% of taxi operators indicated that the maximum entry age limit for taxi vehicles was unnecessary for safety purposes. Most argued that the focus should be on the total period of time the vehicle is operational as a taxi, in addition to vehicle condition and mileage. As long as the vehicle is decommissioned when it becomes too old and/or unsafe then operators should be free to decide the age at which the vehicle becomes operational as a taxi. This decision was deemed by most operators to be based on financial constraints including the balance between costs to purchase the vehicle and predicted returns on investment to its retirement age, taking into consideration maintenance and running costs. Although some operators felt that it would be more cost effective to purchase a vehicle at 1-2 years above the current maximum age limit they were generally also in favour of raising the exit age limits.
A4.1.2 Perceptions about variable age limits for hire cars
Respondents were asked whether they support age limits for hire cars being variable according to the type or value of the vehicle (Table A4.4).
96 MONASH UNIVERSITY ACCIDENT RESEARCH CENTRE

Table A4.4: Proportion of respondents who supported variable age limit restrictions for hire cars and provided an explanation for their response
Hire car operators (n=6)
Taxi/hire car customers (n=50)
Stakeholders (n=4)
Supported 33.3% 58% 25%
Explanation provided 50% 72.4% 100%
Not supported 66.7% 42% 75%
Explanation provided 100% 57.1% 100%
Only one third and one quarter of hire car operators and stakeholders respectively supported variable age limit restrictions for hire cars, compared to just under 60% of hire car customers. Those who did not support the variable limits cited safety as the main reason. Hire car operators and customers stated that unless there are inherent differences in the safety standards/ratings of the vehicles then exit limits should only vary according to differences in vehicle condition, including the standard and frequency of maintenance they have received. Hire car customers pointed out that expensive and/or more luxurious vehicles are not necessarily safer, and most stakeholders argued that vehicles would likely deteriorate at exactly the same rate regardless of their value or type. Several respondents believed that the variable age limit criteria have no bearing on safety. Some confusion was expressed as to why, for example, the exit age limit was 5 years for a hybrid vehicle but 6.5 years for the same make and model of vehicle running on petrol. Respondents also felt that the exit limit for a hybrid vehicle used as a taxi should not be greater than when used as a hire car, particularly when taxis typically travel further and endure more wear and tear.
Half of all hire car customers who supported variable age limit restrictions perceived some types of hire car to be safer by design and/or to include more and better safety features; 33.3% felt that some types of hire car are perceived to be in better condition and/or are more comfortable than others; and 16.7% felt that that some types of hire car do not accumulate as much mileage as others and therefore take longer to wear out. Fifteen percent of hire car customers and most stakeholders cited economic constraints as the key driving force behind variable age limits. They argued that it is more cost effective for an operator to keep some types of expensive and/or luxurious hire vehicles in service for longer in order to recoup the high purchasing costs. Some respondents thought that less restrictive age limits would allow operators to offer customers a greater degree of vehicle quality / trip price combinations.
A4.1.3 Perceptions about whether there are more appropriate criteria than age on which to limit the operation of a vehicle as a taxi or hire car
Respondents were asked to provide their opinions about whether there are more appropriate criteria than age on which to limit the operation of a vehicle as a taxi or hire car (Table A4.5).
SAFETY IMPLICATIONS OF TAXI AND HIRE CAR AGE LIMITS 97

Table A4.5: Proportion of respondents who thought there are more appropriate criteria than age on which to limit the operation of a vehicle as a taxi or hire car and who provided an explanation for their response
Taxi operators (n=21)
Hire car operators (n=6)
Taxi/hire car customers (n=50)
Stakeholders (n=11)
Yes 52.4% 66.7% 72.5% 27.3%
Explanation provided 82% 75% 97.3% 100%
No 47.6% 33.3% 27.5% 72.7%
Explanation provided 20% 25% 85.7% 100%
The majority of hire car operators and taxi/hire car customers thought there were more appropriate criteria than age on which to limit the operation of a vehicle as a taxi or hire car. Just under half of all taxi operators and three quarters of stakeholders thought that the current age based criteria were appropriate. Table A4.6 presents the criteria deemed by respondents as being more appropriate than age.
Table A4.6: Proportion of respondents who specified criteria other than age for ensuring the safety of taxis/hire cars
Taxi operators (n=9)
Hire car operators (3)
Taxi/hire car customers (n=35)
Stakeholders (n=3)
Mechanical condition 55.6% 75% 17.2% 33.3%
Safety rating/features 47.2% 66.7%
Quality and frequency of servicing and maintenance
22.2% 25% 58.3%
Mileage 22.2% 11.4% 33.3%
Comfort 14%
Crash history 11.4%
Presentation 3% 33.3%
Economics 5.7%
Overall, the factors deemed by the largest proportion of respondents to be more appropriate than age in limiting the operation of the vehicle as a taxi or hire car were the mechanical
98 MONASH UNIVERSITY ACCIDENT RESEARCH CENTRE

condition of the vehicle; vehicle safety ratings or features; and the quality and frequency of vehicle maintenance and servicing. A small proportion of stakeholders pointed out that since most mechanical defects are not implicated in serious crashes there is currently no basis for age criteria apart from the fact that newer vehicles are inherently safer. They felt that the criteria were largely in place to maintain a public perception that safety is being upheld and suggested that more frequent and targeted vehicle inspections that track operators with a history of key vehicle defects and/or poor driving records could potentially address safety more effectively. A small proportion of taxi/hire car customers felt that it would be more appropriate to determine the appropriate decommissioning point for vehicles based on a combination of their level of safety by contemporary standards and the condition they are in. Others suggested that a set of standards relating to minimum safety levels would be appropriate, perhaps based on NCAP or similar criteria. A phase-in timetable of desirable safety features or ratings could be set out for operators and incentives for their adoption put in place.
The key reasons cited by those who thought there were not more appropriate criteria were that age provides a reasonable proxy for safety because factors that are potentially more indicative of safety than age are harder to enforce, monitor or measure (66.7% of taxi customers; 100% of taxi operators); and other criteria in addition to age are also appropriate, particularly the crash history of the vehicle (33.3%). Whilst most stakeholders generally perceived age to be the best measure of vehicle safety, it was acknowledged that factors such as vehicle mileage and condition can impact on safety independently of age. For example, some respondents felt that safety and presentation were still being compromised under the current regime and provided examples of a number of metropolitan taxis that that had already worn out at 4-5 years, having acquired the same mileage as vehicles at retirement age.
Respondents were asked if they would like to provide any other feedback in relation to the safety of taxis and or hire cars. Of those who provided relevant comments, just over half felt that driver care and competency were more important than vehicle age in ensuring the safety of passengers and the general public. Some of these respondents were of the opinion that driver skill is related to the presentation and safety of the vehicle, with more competent drivers generally taking greater pride in, and care of, their vehicles. Some respondents also suggested that drivers should be banned from using mobile phones and navigational systems whilst driving. Others suggested that driver training requirements should be stricter to raise the current low level of driving skills and attention displayed by some drivers, as well as their route knowledge.
A4.2 IDENTIFICATION OF METHODS AND MOTIVATIONS FOR SELECTION AND PURCHASE OF THE CURRENT TAXI AND HIRE CAR FLEET
A4.2.1 Taxi operators
The number of taxi operators and the average number and types of licences owned/leased are shown in Table A4.7.
SAFETY IMPLICATIONS OF TAXI AND HIRE CAR AGE LIMITS 99

Table A4.7: Number of taxi operators and average number and type of licences owned/leased by operators
Taxi licence type Number of operators Number licences owned/leased
Average number licences owned/leased per operator
Metropolitan zone, conventional taxi
16 106 6.6
Urban zone, conventional taxi
3 11 3.7
Regional zone, conventional taxi
6 12 2
Country zone, conventional taxi
3 7 2.3
Metropolitan zone, Wheelchair Accessible Taxi (WAT)
5 10 2
Urban zone, Wheelchair Accessible Taxi (WAT)
1 20 20
Regional zone, Wheelchair Accessible Taxi (WAT)
5 9 1.8
The number and percentage of the most common make and model types across the taxi fleet are shown in Table A4.8.
100 MONASH UNIVERSITY ACCIDENT RESEARCH CENTRE

Table A4.8: Number and percentage of most common vehicle make and model types across the taxi fleet
Make Model Number of vehicles Percent of all vehicles
Ford Falcon 8 25.9%
Ford Falcon (wagon) 2 6.5%
Ford FG 2 6.5%
Ford G6E 1 3.2%
Ford Fairmont 1 3.2%
Toyota Camry Hybrid 4 12.9%
Toyota Camry 3 9.7%
Toyota Commuter 2 6.5%
Toyota Hiace 2 6.5%
Toyota Not specified 2 6.5%
Toyota Prius 1 3.2%
Holden Caprice 1 3.2%
Holden Commodore 1 3.2%
Holden Berlina 1 3.2%
31 100%
The most common vehicle type in the taxi fleet was the Ford Falcon, comprising about a quarter of all vehicles. The most common make of vehicle was the Ford and the Toyota, each comprising just under half of all vehicles within the fleet.
SAFETY IMPLICATIONS OF TAXI AND HIRE CAR AGE LIMITS 101

Methods and motivations for selection and purchase of taxi vehicles
Table A4.9 shows the percentage of vehicles purchased by taxi operators at various vehicle age groups.
Table A4.9: Percentage of vehicles purchased by taxi operators at various vehicle age groups
Vehicle age Percent of operators (n=28)
New 25%
Pre-owned, less than or equal to 6 months
3.6%
Pre-owned, 7-12 months
21.4%
Pre-owned 13-18 months
25%
Pre-owned 19-24 months
14.3%
Pre-owned, older than 24 months
10.7%
Total 100%
About three-quarters of operators purchased their vehicles between the ages of 0-18 months of age. Within this age range, most operators purchased their vehicle/s new or pre-owned at 13-18 months of age.
Table A4.10 shows the percentage of vehicle purchases made by taxi operators at various locations.
102 MONASH UNIVERSITY ACCIDENT RESEARCH CENTRE

Table A4.10: Percentage of vehicle purchases made by taxi operators at various locations
Vehicle age Percent of operators (n=29)
New car dealership 31%
Used car dealership 24.1%
Auction house 34.5%
New and used car dealership and auction house
6.9%
Wholesaler 3.4%
Total 100%
The largest proportion of respondents purchased their vehicles from an auction house, followed by a new car dealership and a used car dealership. The responses given by taxi industry stakeholders were generally consistent with these figures, with most stating that taxi operators generally purchase their vehicles from auction houses.
Taxi operators were asked to indicate the importance of each of a number of factors in their decision making when purchasing their vehicles.
Table A4.11 shows the proportion of taxi operators who rated the importance of various factors as low or high in vehicle purchasing decisions.
SAFETY IMPLICATIONS OF TAXI AND HIRE CAR AGE LIMITS 103

Table A4.11: Proportion of taxi operators who rated the importance of various factors as low or high in vehicle purchasing decisions
Vehicle purchasing in general Last vehicle purchase
Factors influencing purchasing decisions
Percent of operators who indicated factor is of low importance
Percent of operators who indicated factor is of high importance
Percent of operators who indicated factor is of low importance
Percent of operators who indicated factor is of high importance
Comfort, style, look, customer preference (n=27)
22.2% 77.8% 20.8% 79.2%
Country of manufacture (n=26)
46.2% 53.8% 43.5% 56.5%
Fuel economy (n=25) 12% 88% 13.6% 86.4%
Servicing and maintenance costs (n=25)
4% 96% 9.5% 90.5%
Frequency of maintenance/service (n=25)
20% 80% 22.7% 77.3%
Make/model (n=25) 12% 88% 18.2% 81.8%
Familiarity with vehicle (n=25)
4% 96% 100%
Performance (n=25) 36% 64% 36.4% 63.6%
Purchase price (n=25) 16% 84% 18.2% 81.8%
Reliability (n=24) 4.2% 95.8% 4.5% 95.5%
Safety performance/features (n=25)
16% 84% 18.2% 81.8%
Re-sale value (n=25) 80% 20% 77.3% 22.7%
Vehicle size and type (n=26)
3.8% 96.2% 8.7% 91.3%
Luggage capacity (n=25)
28% 72% 31.8% 68.2%
Warranty (n=25) 68% 32% 68.2% 31.8%
104 MONASH UNIVERSITY ACCIDENT RESEARCH CENTRE

Age of vehicle (n=25) 24% 76% 18.2% 81.8%
Hybrid power train or ability to convert to LPG (n=25)
28% 72% 27.3% 72.7%
Age limits that apply to use as a taxi (n=25)
28% 72% 27.3% 72.7%
Taxi operators were more likely to rate the following four factors as being high priorities in decision making when purchasing vehicles in general: vehicle size and type; familiarity with vehicle; servicing and maintenance costs; and reliability. The same four factors were also rated as the highest priorities in the last vehicle purchase, albeit in a slightly different order: familiarity with vehicle; reliability; vehicle size and type; and servicing and maintenance costs.
The taxi industry stakeholders were asked to indicate how important they thought each of the same factors were in taxi operators’ decision making when purchasing vehicles in general.
Table A4.12 shows the proportion of taxi industry stakeholders who rated the importance of various factors as low or high in taxi operators’ general vehicle purchasing decisions.
SAFETY IMPLICATIONS OF TAXI AND HIRE CAR AGE LIMITS 105

Table A4.12: Proportion of taxi industry stakeholders who rated the importance of various factors as low or high in taxi operators’ general vehicle purchasing decisions (n=6 respondents)
Factors influencing purchasing decisions
Percent of operators who indicated factor is of low importance
Percent of operators who indicated factor is of high importance
Comfort, style, look, customer preference
66.7% 33.3%
Country of manufacture
100%
Fuel economy 20% 80%
Servicing and maintenance costs
50% 50%
Frequency of maintenance/service
50% 50%
Make/model 80% 20%
Familiarity with vehicle
33.6% 66.7%
Performance 50% 50%
Purchase price 100%
Reliability 20% 80%
Safety performance/features
20% 80%
Re-sale value 83.3% 16.7%
Vehicle size and type 50% 50%
Luggage capacity 16.7% 83.3%
Warranty 80% 20%
Age of vehicle 40% 60%
Hybrid power train or ability to convert to LPG
100%
Age limits that apply to use as a taxi
100%
106 MONASH UNIVERSITY ACCIDENT RESEARCH CENTRE

Taxi industry stakeholders were more likely to perceive the following factors as being high priorities for taxi operators when purchasing vehicles: hybrid power train or ability to convert to LPG; age limits; purchase price; luggage capacity; safety/performance features; reliability, and fuel economy. This pattern of responses was different to that evident for taxi operators, with only vehicle reliability being rated as a high priority by a large proportion of both taxi operators and taxi stakeholders.
Re-sale value; vehicle warranty; and country of manufacture were rated by taxi operators as the top three lowest priorities in decision making when purchasing vehicles in general and for the last vehicle purchase. Taxi industry stakeholders were more likely to perceive the following factors as being low priorities for taxi operators in general: re-sale value; vehicle make and model and warranty; and customer style/look/preference. Both groups of respondents were in agreement that re-sale value and vehicle warranty were among the most likely factors to be rated as low priorities by taxi operators when purchasing vehicles.
Of the nine companies who operated a WAT, 55.5% stated that they chose their own vehicles when making the purchase, and 44.4% indicated they obtained guidance from a vehicle conversion/modification company. The estimates given by the vehicle conversion companies differed to these, with two thirds stating that operators generally choose the WATs according to the advice of a vehicle conversion/modification company.
According to WAT operators, the key criteria for selecting a WAT were: passenger comfort (44.4%); wheel chair carrying capacity (33.3%); safety (33.3%); convenience of access and loading and unloading including the condition of the hoist (44.4%); reliability including reputation of vehicle and supplier of modification (44.4%); age of vehicle (22.2%); vehicle operating costs (22.2%); and purchase price (11.1%).
According to the taxi industry stakeholders, the key criteria for selecting a WAT were wheelchair carrying capacity, including number of wheelchairs that can be accommodated and number of seating positions (75%); reliability, including reputation of the vehicle (40%); ease of use (20%); price (20%) and compliance with state design regulations (20%).
Table A4.13 shows the make and model of latest vehicle purchase by taxi operators.
SAFETY IMPLICATIONS OF TAXI AND HIRE CAR AGE LIMITS 107

Table A4.13: Make and model of latest vehicle purchase by taxi operators
Vehicle make Vehicle model Percent of operators (n=25)
Ford Falcon 28%
Toyota Camry hybrid 20%
Ford Falcon wagon 12%
Toyota Hiace 8%
Toyota Commuter SLWB 8%
Ford Fairmont 4%
Ford G6E 4%
Ford XT 4%
Holden Berlina 4%
Toyota Prius V 4%
Skoda Superb 4%
100%
The last vehicle purchased by just over 80% of taxi operators was a standard vehicle, followed by a WAT, and an ‘other’ (unspecified) vehicle. The Ford Falcon was the most common make and model purchased.
The most common method of financing vehicle purchases as reported by 26 taxi operators was to obtain finance through a loan from a financial institution (69.2%) and to make an
108 MONASH UNIVERSITY ACCIDENT RESEARCH CENTRE

outright purchase (30.8%). These methods were the same when purchasing a WAT. The estimates provided by the taxi industry stakeholders were consistent with those reported by the taxi operators. One of the taxi industry stakeholders noted that WATs are typically financed over a longer period than standard taxi vehicles.
The typical price range of an unmodified taxi vehicle as indicated by 24 taxi operators was $13,500 - $50,000, at an average price of $27,187. The typical price range of an unmodified taxi vehicle was estimated by the taxi industry stakeholders to be between $25,000 and $50,000, with an estimated average price of $35,625.
The typical price range of an unmodified WAT vehicle as indicated by nine operators was between $30,000 and $50,000 with an average price of $35,555. The estimates given by the taxi industry stakeholders were higher than these, with a range of $35,000 - $60,000, and an average price of $46,500. The typical price range of a WAT modification was between $15,000 and $40,000 with an average price of $28,000. The estimates given by the taxi industry stakeholders were lower than these, with a range of $15,000 - $60,000, and an average price of $21,750.
Three quarters of taxi operators set a limit on the purchase price of an unmodified taxi. For those who specified a limit, the average price was $25,588, ranging between $15, 0000 and $40,000. Although most taxi industry stakeholders indicated that there are limits on the purchase price of an unmodified taxi, the estimated average limit by the stakeholders at $40,000 was higher than that given by the taxi operators.
The main reason given by eighty percent of those who did not set a limit on the purchase price of an unmodified taxi was that there is limited price variability because the market dictates the cost of vehicles according to purpose of use. Other reasons cited as being more important than purchase price were safety (20%), comfort (20%), and fuel efficiency (20%). Some respondents were of the view that purchase price does not reflect the suitability of a vehicle for use as a taxi and that purchasing a vehicle based on price alone ‘is a recipe for disaster’.
Just over 44.4% of WAT operators said that they set a limit on the purchase price of a WAT, and this was generally consistent with the estimates given by the taxi industry stakeholders. For those operators who specified a limit, the average price was $46,666, ranging between $30,000 and $60,000. Some of the taxi industry stakeholders pointed out that WAT operators are less likely to set a limit on the purchase price of their vehicles because WATs are typically purchased new and the prices do not vary greatly across the market.
Almost 73% of taxi operators indicated that the minimum size of the unmodified taxi(s) in their fleets were large vehicles. Just under three and five percent of respondents respectively indicated that the minimum sizes were medium and small. The estimates given by the taxi industry stakeholders were different with a third each of respondents indicating that the minimum vehicle sizes were small, medium or large.
A4.2.2 Hire car operators
Table A4.14 presents the number of hire car operators and the average number and type of licences owned or leased by operators.
SAFETY IMPLICATIONS OF TAXI AND HIRE CAR AGE LIMITS 109

Table A4.14: Number of hire car operators and average number and type of licences owned or leased by operators
Hire car licence type Number operators Number licences owned/leased
Average number licences owned/leased per operator
Metropolitan hire car, regular vehicles
12 31 2.6
Country hire car, regular vehicles
4 5 1.3
Metropolitan hire car, modified vehicles (stretched limousine)
2 4 2
Table A4.15 presents the number and percentage of most common vehicle make and model types across the hire car fleet.
Table A4.15: Number and percentage of most common vehicle make and model types across the hire car fleet
Make Model Number of vehicles Percent of all vehicles
Holden Caprice 4 30.8%
Ford Fairlaine 3 23.1%
Ford LTD 2 15.4%
Ford G6E 1 7.7%
Chrysler 300 1 7.7%
Lexus 2010 1 7.7%
Mercedes ML 350 CDI 1 7.7%
13 100%
The most common vehicle type in the hire car fleet was the Holden Caprice, comprising almost 31% of all vehicles. The most common make of vehicle was the Ford (46.2%) followed by the Holden (30.8%).
Methods and motivations for selection and purchase of hire cars
Table A4.16 shows the percentage of vehicles purchased by hire car operators at different age groups.
110 MONASH UNIVERSITY ACCIDENT RESEARCH CENTRE

Table A4.16: Percentage of vehicles purchased by hire car operators at different age groups
Vehicle age Percent of operators (n=10)
New 40%
Pre-owned, less than or equal to 6 months
20%
Pre-owned, 7-12 months
20%
Pre-owned 13-18 months
10%
Pre-owned 19-24 months
0%
Pre-owned, older than 24 months
10%
Total 100%
Eighty percent of operators purchased their vehicles between the ages of 0-12 months of age. Within this age range, most operators purchased their vehicle/s new (40%) or pre-owned, less than or equal to 6 months (20%).
Table A4.17 shows the proportion of hire car purchases made at various locations.
Table A4.17: Hire car purchase locations
Vehicle age Percent of operators (n=13)
New car dealership 60%
Used car dealership 30%
Private sale 10%
Total 100%
The largest proportion of respondents purchased their vehicles from a new car dealership. Only ten percent of vehicles were purchased through private sales. The responses given by taxi/hire car industry stakeholders were different to these figures, with most stating that operators generally purchase their vehicles from auction houses.
SAFETY IMPLICATIONS OF TAXI AND HIRE CAR AGE LIMITS 111

Hire car operators were asked to indicate the importance of each of a number of factors in their decision making when purchasing their vehicles. Table A4.18 presents the proportion of hire operators who rated the importance of various factors as low or high in vehicle purchasing decisions.
Table A4.18: Proportion of hire operators who rated the importance of various factors as low or high in vehicle purchasing decisions (n=10 respondents)
112 MONASH UNIVERSITY ACCIDENT RESEARCH CENTRE

Vehicle purchasing in general Last vehicle purchase
Factors influencing purchasing decisions
Percent of operators who indicated factor is of low importance
Percent of operators who indicated factor is of high importance
Percent of operators who indicated factor is of low importance
Percent of operators who indicated factor is of high importance
Comfort, style, look, customer preference
100% 20% 80%
Country of manufacture
40% 60% 40% 60%
Fuel economy 100% 100%
Servicing and maintenance costs
10% 90% 10% 90%
Frequency of maintenance/service
10% 90% 20% 80%
Make/model 20% 80% 10% 90%
Familiarity with vehicle
20% 80% 30% 70%
Performance 10% 90% 30% 70%
Purchase price 100% 100%
Reliability 100% 100%
Safety performance/features
10% 90% 10% 90%
Re-sale value 90% 10% 100%
Vehicle size and type 100% 10% 90%
Luggage capacity 30% 70% 40% 60%
Warranty 50% 50% 55.6% 44.4%
Age of vehicle 20% 80% 30% 70%
Hybrid power train or ability to convert to LPG
50% 50% 40% 60%
Age limits that apply to use as a hire car
70% 30% 70% 30%
SAFETY IMPLICATIONS OF TAXI AND HIRE CAR AGE LIMITS 113

Overall, hire car operators rated the following four factors as being their highest priorities in decision making when purchasing vehicles in general: customer style/look/customer preference; fuel economy; purchase price; and reliability. With the exception of customer style/look/customer preference, the same factors were also rated as being the highest priorities in the last vehicle purchase. Re-sale value; vehicle warranty; and country of manufacture were rated as the top three lowest priorities in decision making when purchasing vehicles in general and for the last vehicle purchase.
Although industry stakeholders were asked to rate the importance of factors influencing the purchasing decisions for hire car operators, most of their current expertise/experience involved working within the taxi industry. Those who provided an opinion, however, perceived that the factors influencing purchasing choices would be similar across taxi and hire car operators (See Table 4.n, Section 4.n above). The main difference was that customer style/look was rated as a high priority in vehicle purchasing for hire car operators but as a low priority for taxi operators, a finding that was generally consistent with the ratings given by taxi and hire car operators.
Of the two companies who operated a modified hire car, one chose their own vehicle when making the purchase and the other was guided by a vehicle conversion/modification company. According to the vehicle conversion companies, about two thirds of operators generally choose modified hire cars according to the advice of a vehicle conversion/modification company. The key criteria for selecting a modified hire car were seating capacity and whether the vehicle could be converted to LPG.
Table A4.19 shows the make and model of the latest vehicle purchase by hire car operators.
114 MONASH UNIVERSITY ACCIDENT RESEARCH CENTRE

Table A4.19: Make and model of the latest vehicle purchase by hire car operators (n= 10 respondents)
Make Model Percent of all vehicles
Ford Fairlane 20%
Ford LTD 20%
Ford XR6 10%
Holden Caprice 10%
Chrysler 300 10%
Lexus 2010 10%
Mercedes ML 350 CDI 10%
Toyota Aurion 10%
100%
The last vehicle purchased by all hire car operators was a standard vehicle.
The most common methods of financing vehicle purchases for fleets as indicated by ten hire car operators were to obtain finance through a loan from a financial institution (70%); to make an outright purchase (20%); and to use a combination of both of these methods (10%). The estimates provided by the hire car industry stakeholders were generally consistent with those reported by hire car operators. One operator said that the method of financing the purchase of his modified hire car was different to that for a standard vehicle but did not specify how the finance was obtained.
The typical price range of a standard unmodified vehicle in the fleet as indicated by seven hire car operators was between $45,000 and $95,000, with an average purchase price of $57,857. The typical purchase price of a limousine as estimated by one modified hire car operator prior to modification was $40,000, and the cost of the modifications was $160,000.
Fifty-seven percent of hire car operators set a limit on the purchase price of a standard unmodified hire car in their fleet. The limit given by the one respondent who answered this question was $60,000. The reasons given by those who did not set a limit on the purchase price of an unmodified hire car were that factors other than price are more important, including the typical lifespan of the car, the cost of maintenance, servicing and repairs (and the trade-offs between both of these factors); safety; customer satisfaction; and meeting the Australian Standards requirements.
Just over 57% and 43% of hire car operators indicated that the minimum size of the unmodified hire cars in their fleet were large and luxury vehicles respectively.
SAFETY IMPLICATIONS OF TAXI AND HIRE CAR AGE LIMITS 115

A4.3 ANTICIPATION OF CHANGES IN PROFILE OF THE TAXI AND HIRE CAR FLEET WITH THE CLOSURE OF AUSTRALIAN VEHICLE MANUFACTURING
A4.3.1 Anticipated vehicle purchasing choices following closure of the Australian vehicle manufacturing industry
Respondents were asked to indicate whether closure of the Australian vehicle manufacturing would change the type of vehicles purchased by taxi and hire car operators. Table A4.20 shows the proportion of respondents who indicated that closure of the Australian vehicle manufacturing would change the type of vehicles purchased by vehicle operators.
Table A4.20: Proportion of respondents who indicated that closure of the Australian vehicle manufacturing would change the type of vehicles purchased by vehicle operators
Taxi operators (n=23) Hire car operators (n=6)
Stakeholders (n=4)
Percentage of respondents
65.2% 50% 50%
Most operators who indicated that their vehicle purchasing choices would change did not specify the types of vehicles they would purchase and why. Some operators indicated that they will likely purchase Toyota vehicles; whilst others indicated that diesel powered vehicles would be their primary choice. The taxi industry stakeholders were also of the opinion that Toyota Camrys would form the bulk of purchasing choices in future and that these vehicles would be imported once local manufacturing ceases.
Those who thought that closure of the Australian vehicle manufacturing industry would not change their purchasing choices indicated that the main vehicle in their fleet (Toyota van) is already imported or that they have a preference for vehicles manufactured overseas, particularly luxury vehicles used for hire car purposes. Stakeholders expressed similar opinions, pointing out that the Toyota Camry is already comprising the bulk of recent purchases by taxi operators and will continue to be the vehicle of choice in future.
Respondents were asked to indicate how they saw the taxi/hire car fleets in the longer term. About a quarter of taxi operators and most stakeholders predicted that the medium sized Toyota Camry Hybrid would be the predominant vehicle in future, and there was a general consensus that these vehicles are reliable, comfortable, economical, quality built and easily converted to LPG. About half of all taxi and hire car operators felt that there would be greater diversity in vehicle makes and models, with most vehicles being smaller, more fuel efficient and running on electric, or hybrid or diesel hybrid technology. However some felt that these vehicles would be less robust and more uncomfortable for passengers, and indicated that there still needs to be more affordable, luxurious models to choose from. Hire car operators, in particular, felt that they would be negatively impacted by the changes because smaller, lower standard, less prestigious vehicles would not adequately meet the higher needs and expectations of their customers. Similar views were expressed by the taxi industry stakeholders.
116 MONASH UNIVERSITY ACCIDENT RESEARCH CENTRE
Some of the vehicle modifiers were concerned that there would be an increase in the number of pre-modified vehicles being imported into Australia which would adversely affect employment within the local vehicle manufacturing industry.
A small proportion of taxi operators thought that purpose built taxis such as the London Cab would become more prominent if they were affordable and built by reputable manufacturers. Some operators were concerned that the changes would incur more costs to operators, including difficulties in obtaining parts and services for imported vehicles.
A4.3.1 Perceived advantages and disadvantages of purpose built taxis
Taxi operators and stakeholders were asked whether taxi operators would consider purchasing a purpose built taxi in future (such as the Nissan NV200 or the London Taxi Company TX4) (Table A4.21) and to indicate any advantages or disadvantages associated with this.
Table A4.21: Proportion of respondents who indicated that taxi operators would consider purchasing a purpose built taxi
Taxi operators (n=23) Stakeholders (n=5)
Percentage of respondents
40% 20%
Most operators and stakeholders indicated that they would not consider purchasing a purpose built taxi. Just under half of operators were concerned about the relatively high purchase price (estimated by some to be in the range of $52,000-$60,000) and the likelihood that only new vehicles would be available for purchase; a third cited high running costs including difficulty in obtaining reasonably priced parts and services; and about a quarter indicated that the vehicles are poorly suited for Australian driving conditions (for example driving on freeways, small size of vehicle), or had received negative customer feedback including the necessity for luggage to be stowed in the cabin. Similar disadvantages were expressed by the taxi stakeholders. Some stakeholders also indicated that purpose built taxis currently do not comply with Australian Design Rules and highlighted concerns that compliance plates are not legal. For example, the London cabs are not required to have Electronic Stability Control which is mandatory in Australia. However, if the vehicles were imported second hand then they would not need to meet Australian design requirements. Under this regime, stakeholders were concerned that taxi fleets would not be as safe as they could be if designed in Australia.
The main advantages highlighted by both taxi operators and stakeholders were that the vehicle is purpose built and has great design features including extra space for passengers, wheelchair accessibility on all vehicles, and a segregated cabin for the driver for improved security.
Just under two thirds of taxi operators and half of all stakeholders thought a purpose built taxi would be safer than a regular vehicle used as a taxi. The majority of operators who thought these vehicles would be safer indicated that they are specifically built for taxi purposes, providing additional security for the driver with the exclusively built cabin. Just under a third of respondents were of the view that vehicle safety should be able to be built in at the time of manufacture and to suit the extremely high mileage covered by metropolitan taxi
SAFETY IMPLICATIONS OF TAXI AND HIRE CAR AGE LIMITS 117

fleets. The reasons given by respondents who thought purpose built vehicles would be less safe included their higher centre of gravity, poorer handling and performance characteristics, and the possibility that vehicle maintenance would decrease due to a predicted lower return on investment. Some of the stakeholders also indicated that purpose built taxis are structurally less sound than regular taxis and that it would take years for purpose built vehicles to meet the equivalent safety standards of regular vehicles which have been continually improved through crash testing.
A4.4 IDENTIFICATION OF ECONOMIC AND UTILITY CONSTRAINTS ON VEHICLE PURCHASE, MAINTENANCE, REPAIR AND REPLACEMENT
A4.4.1 Annual vehicle mileage
The average annual mileage of a typical vehicle within the fleet as estimated by taxi/hire car operators and stakeholders is shown in Tables A4.22 and A4.23 respectively.
Table A4.22: Average annual mileage (kms) of a typical taxi
Taxi operator estimate (n=22) Stakeholder estimate (n=3)
Standard taxi 118,818 kms (30,000-200,000) 123,333 kms (100,000-140,000)
Taxi operator estimate (n=9) Stakeholder estimate (n=3)
WAT 64,333 kms (35,000- 130,000) 83,333 kms (50,000-100,000)
Table A4.23: Average annual mileage (kms) of a typical hire car
Hire car operator estimate (n=7)
Stakeholder estimate (n=3)
Standard hire car 75,714 kms (50,000-100,000) 123,333 kms (100,000-140,000)
Hire car operator estimate (n=1)
Stakeholder estimate (n=1)
Modified hire car 12,500 kms 30,000 kms
The vehicle operator estimates showed that standard taxis travelled about 40,000 kilometres per year more than standard hire cars, and about 50,000 kilometres more than WAT vehicles. The stakeholder estimates were higher than those reported by vehicle operators, although the difference in mileage between both types of taxis and hire cars was similar.
A4.4.2 Vehicle servicing and maintenance
The proportion of taxi operators who indicated that maintenance was carried out at regular servicing on various vehicle components is shown in table A4.24.
118 MONASH UNIVERSITY ACCIDENT RESEARCH CENTRE

Table A4.24: Proportion of taxi operators and stakeholders who indicated that maintenance was carried out at regular servicing on various vehicle components
Vehicle component Percent of taxi operators indicating vehicle component is checked at typical vehicle service (n=23)
Percent of stakeholders indicating vehicle component is checked at typical vehicle service (n=3)
Oil/filter change 100% 100%
Air filter 100% 100%
Fuel filter 78% 33.3%
Battery 95.7% 66.7%
Engine ignition system 73.9% 33.3%
Other engine systems 65.2% 66.7%
Transmission 91.3% 66.7%
Tyres 100% 100%
Brakes 100% 100%
Suspension 91.3% 33.3%
Lights 100% 100%
Electrical accessories 60.9% 66.7%
Seat belts 87% 66.7%
Interior trim 52.2% 33.3%
Bodywork 56.5% 33.3%
Hoist or other mechanism specific to wheel chair accessibility
100% 66.7%
The proportion of hire car operators and stakeholders who indicated that maintenance was carried out at regular servicing on various vehicle components is shown in table A4.25 below.
SAFETY IMPLICATIONS OF TAXI AND HIRE CAR AGE LIMITS 119

Table A4.25: Proportion of hire car operators and stakeholders who indicated that maintenance was carried out at regular servicing on various vehicle components
Vehicle component Percent of hire car operators indicating vehicle component is checked at typical vehicle service (n=7)
Percent of stakeholders indicating vehicle component is checked at typical vehicle service (n=3)
Oil/filter change 100% 100%
Air filter 100% 100%
Fuel filter 71.4% 33.3%
Battery 85.7% 66.7%
Engine ignition system 85.7% 33.3%
Other engine systems 85.7% 66.7%
Transmission 71.4% 66.7%
Tyres 85.7% 100%
Brakes 100% 100%
Suspension 75% 33.3%
Lights 100% 100%
Electrical accessories 75% 66.7%
Seat belts 85.7% 66.7%
Interior trim 57.1% 33.3%
Bodywork 57.1% 33.3%
The largest proportion of vehicle operators and stakeholders indicated that the oil/filter, air/filter, brakes, lights and tyres were frequently checked at regular servicing. Bodywork and interior trim were the least frequently checked items by both vehicle operators and stakeholders. All WAT operators reported that the hoist was checked at regular servicing.
The average servicing frequency of a typical taxi and hire car is shown in Tables A4.26 and A4.27 respectively.
120 MONASH UNIVERSITY ACCIDENT RESEARCH CENTRE

Table A4.26: Average servicing frequency of a typical taxi in the last year
Taxi operator estimate (n=23)
Stakeholder (n=3)
Standard taxi 11 (4-30) 5 (2-7)
WAT operator estimate (n=9)
Stakeholder (n=3)
WAT 9.3 (3-11) 5 (2-7)
Table A4.27: Average servicing frequency of a typical hire car in the last year
Hire car operator estimate (n=7)
Stakeholder (n=3)
Standard hire car 4.9 5 (2-7)
Modified hire car operator estimate (n=1)
Stakeholder (n=3)
Modified hire car 4.9 Not known
As reported by vehicle operators, the average annual servicing frequency for a typical vehicle in the taxi fleet was about twice that for a typical hire car, and slightly higher than that for a WAT. The stakeholder estimates were lower than those reported by the vehicle operators for all categories of vehicle.
The proportion of operators and stakeholders indicating that vehicles require more maintenance and servicing as they get older is shown in Table A4.28.
Table A4.28: Proportion of operators and stakeholders indicating that vehicles require more maintenance and servicing as they get older
Taxi operator (n=23)
Hire car operator (n=7)
Stakeholder (n=3)
Taxi 17.4% N/A 80%
Hire car N/A 28.6% 80%
The proportion of vehicle operators and stakeholders indicating that there is an age or mileage at which a typical vehicle in their fleet requires more maintenance or repairs outside of regular servicing is given in Table A4.29.
SAFETY IMPLICATIONS OF TAXI AND HIRE CAR AGE LIMITS 121

Table A4.29: Proportion of vehicle operators and stakeholders indicating that there is an age/mileage at which vehicles require more maintenance or repairs outside of regular servicing
Taxi operator (n=18)
Hire car operator (n=2)
Stakeholder (N=3)
Taxi 77.8% N/A 100%
Hire car N/A 100% 100%
WAT operator (n=9)
Hire car operator (n=2)
Stakeholder (N=3)
WAT 100% N/A 33.3%
Modified hire car N/A 100% 66.7%
The average vehicle age and mileage after which operators and stakeholders indicated that vehicles require more maintenance is given in Table A4.30.
122 MONASH UNIVERSITY ACCIDENT RESEARCH CENTRE

Table A4.30: Average vehicle age and mileage after which operators and stakeholders indicated that vehicles require more maintenance
Taxi operator estimate (n=13)
Hire car operator estimate (n=2)
Stakeholder estimate (n=3)
Standard taxi age (years)
4.6 (2-7) N/A 3.7 (2-5)
Standard taxi mileage (kms)
429,230(100,000-700,000)
N/A 358,333 (200,000-450,000)
Standard hire car age (years)
N/A 4.5 (1-8) 3.7 (2-5)
Standard hire car mileage (kms)
N/A 250,000(100,000-400,000)
358,333 (200,000-450,000)
Taxi operator estimate (n=7)
Hire car operator estimate (n=2)
Stakeholder estimate (n=3)
WAT (years) 5.1 (3-8) N/A 5 (2-8)
WAT mileage (kms)
481,428 (200,000-700,000)
N/A 358,333 (200,000-450,000)
Modified hire car age (years)
N/A 1 2.5 (2-3)
Modified hire car (mileage (kms)
N/A 100,000 360,000
The average mileage at which vehicles were deemed by operators to require more maintenance and servicing was about 180,000 kilometres higher for taxis than for hire cars, and about 52,000 kilometres higher for WATs than for standard taxis. The average age at which vehicles were deemed by operators to require more maintenance and servicing was similar for taxis and hire cars and slightly higher for WATs.
The frequency with which standard taxi and WAT operators indicated that various vehicle components required maintenance apart from regular servicing is shown in Tables A4.31 and A4.32 respectively.
SAFETY IMPLICATIONS OF TAXI AND HIRE CAR AGE LIMITS 123

Table A4.31: Proportion of taxi operators who rated the frequency of maintenance for taxi vehicle components outside of regular servicing (with options as not at all common, sometimes and regularly) (n=23 respondents)
Vehicle component Percent of respondents indicating vehicle component is not commonly checked/maintained outside of regular servicing
Percent of respondents indicating vehicle component is checked/maintained sometimes outside of regular servicing
Percent of respondents indicating vehicle component is checked/maintained regularly outside of regular servicing
Engine 43.5% 39.1% 17.4%
Transmission 30.4% 52.2% 17.4%
Tyres 0% 17.4% 82.6%
Brakes 4.3% 21.7% 73.9%
Suspension 26.1% 65.2% 8.7%
Battery 25% 65% 10%
Other electrical faults 52.2% 26.1% 21.7%
Hybrid battery or LPG system
25% 65% 10%
Seat belts 52.2% 26.1% 21.7%
Interior trim and accessories
34.8% 39.1% 26.1%
Bodywork 17.4% 65.2% 17.4%
Hoist or ramp or other mechanism specific to WAT
0% 50% 50%
Other
Overall, taxi operators indicated that most vehicle components were checked sometimes or not at all outside of regular servicing. Specifically, electrical faults, seat belts and engines were not commonly checked, whilst suspension, battery, LPG system, transmission, engine and interior trim were more likely to be checked sometimes. Tyres and brakes were more likely to be checked regularly.
Most WAT taxi operators thought that the frequency of maintenance required by WAT vehicles is similar to that for standard taxis, as shown in Table 4.n above. The ratings for the two respondents who thought it was different are shown in Table 4.n.
124 MONASH UNIVERSITY ACCIDENT RESEARCH CENTRE

Table A4.32: Proportion of WAT operators who rated the frequency of maintenance for various vehicle components outside of regular servicing (with options as not at all common, sometimes and regularly) (n=2 respondents).
Vehicle component % of respondents indicating vehicle component is not commonly checked outside of regular servicing
% of respondents indicating vehicle component is checked sometimes outside of regular servicing
% of respondents indicating vehicle component is checked regularly outside of regular servicing
Engine 0% 50% 50%
Transmission 50% 0% 50%
Tyres 0% 0% 100%
Brakes 0% 0% 100%
Suspension 50% 0% 50%
Battery 0% 50% 50%
Other electrical faults 50% 0% 50%
Hybrid battery or LPG system
0% 50% 50%
Seat belts 50% 0% 50%
Interior trim and accessories
0% 0% 100%
Bodywork 0% 50% 50%
Overall, WAT operators indicated that most vehicle components were checked sometimes or regularly outside of regular servicing. Specifically, tyres, brakes, interior trim and accessories were more likely to checked regularly, whilst engines, batteries, LPG systems, and bodywork were equally likely to be checked sometimes and regularly. Transmission, suspension, other electrical faults and seatbelts were equally likely to be checked regularly or not commonly.
The frequency with which taxi stakeholders indicated that various taxi/hire car and WAT vehicle components required maintenance apart from regular servicing is shown in Tables A4.33 and A4.34 respectively.
SAFETY IMPLICATIONS OF TAXI AND HIRE CAR AGE LIMITS 125

Table A4.33: Proportion of stakeholders who rated the frequency of maintenance for each standard taxi/hire car vehicle component outside of regular servicing (with options as not at all common, sometimes and regularly) (n=3 respondents)
Vehicle component % of respondents indicating vehicle component is not commonly checked outside of regular servicing
% of respondents indicating vehicle component is checked sometimes outside of regular servicing
% of respondents indicating vehicle component is checked regularly outside of regular servicing
Engine 33.3% 33.3% 33.3%
Transmission 0% 33.3% 66.7%
Tyres 0% 33.3% 66.7%
Brakes 0% 66.7% 33.3%
Suspension 0% 33.3% 66.7%
Battery 66.7% 33.3% 0%
Other electrical faults 33.3% 33.3% 33.3%
Hybrid battery or LPG system
33.3% 33.3% 33.3%
Seat belts 0% 66.7% 33.3%
Interior trim and accessories
0% 66.7% 33.3%
Bodywork 0% 33.3% 66.7%
Hoist or ramp or other mechanism specific to WAT
0% 0% 66.7%
Other
Overall, taxi stakeholders indicated that most taxi/hire vehicle components were checked sometimes or regularly outside of regular servicing. Specifically, transmission, tyres, suspension, and body work were more likely to checked regularly, whilst brakes, seat belts and interior trim and accessories were more likely to be checked sometimes. Most respondents indicated that the battery was not checked commonly.
126 MONASH UNIVERSITY ACCIDENT RESEARCH CENTRE

Table A4.34: WAT vehicle components checked outside of regular servicing (with options as not at all common, sometimes and regularly) (n=1 stakeholder)
Vehicle component Vehicle component is not commonly checked outside of regular servicing
Vehicle component is sometimes checked outside of regular servicing
Vehicle component is regularly checked outside of regular servicing
Engine Yes
Transmission Yes
Tyres Yes
Brakes Yes
Suspension Yes
Battery Yes
Other electrical faults Yes
Hybrid battery or LPG system
Yes
Seat belts Yes
Interior trim and accessories
Yes
Bodywork Yes
Overall, taxi stakeholders indicated that most WAT vehicle components were checked sometimes or regularly outside of regular servicing. Specifically, transmission, tyres, suspension, and body work were more likely to checked regularly, whilst brakes, seat belts and interior trim and accessories were more likely to be checked sometimes. Most respondents indicated that the battery was not checked commonly.
The proportion of hire car operators who rated the frequency with which various hire car and modified hire car components required maintenance or servicing apart from regular servicing is shown in Tables A4.35 and A4.36 respectively.
SAFETY IMPLICATIONS OF TAXI AND HIRE CAR AGE LIMITS 127

Table A4.35: Proportion of hire car operators who rated the frequency of maintenance for each hire car component outside of regular servicing (with options as not at all common, sometimes and regularly) (n=6 respondents).
Vehicle component % of respondents indicating vehicle component is not commonly checked outside of regular servicing
% of respondents indicating vehicle component is checked sometimes outside of regular servicing
% of respondents indicating vehicle component is checked regularly outside of regular servicing
Engine 83.3% 16.7%
Transmission 83.3% 16.7%
Tyres 66.6% 33.3%
Brakes 66.6% 33.3%
Suspension 66.6% 16.7% 16.7%
Battery 16.7% 66.6% 16.7%
Other electrical faults 16.7% 66.6% 16.7%
Hybrid battery or LPG system
75% 25%
Seat belts 83.3% 16.7%
Interior trim and accessories
83.3% 16.7% 0%
Bodywork 83.3% 16.7%
Other 50% 50%
Overall hire car operators indicated that all vehicle components were not commonly checked outside of regular servicing with the exception of tyres, batteries and electrical faults which were more likely to be sometimes checked.
The frequency with which modified hire car operators indicated that various components required maintenance apart from regular servicing is shown in Table A4.37.
128 MONASH UNIVERSITY ACCIDENT RESEARCH CENTRE

Table A4.36: Modified hire car components checked outside of regular servicing (with options as not at all common, sometimes and regularly) (n=1 modified hire car operator).
Vehicle component Vehicle component is not commonly checked outside of regular servicing
Vehicle component is checked sometimes outside of regular servicing
Vehicle component is checked regularly outside of regular servicing
Engine Yes
Transmission Yes
Tyres Yes
Brakes Yes
Suspension Yes
Battery Yes
Other electrical faults Yes
Hybrid battery or LPG system
Yes
Seat belts Yes
Interior trim and accessories
Yes
Bodywork Yes
Overall, the one modified hire car operator indicated that all vehicle components were not commonly checked outside of regular servicing with the exception of brakes and suspension which were more likely to be sometimes checked, and tyres which were more likely to be regularly checked.
The frequency with which taxi/hire car stakeholders indicated that various modified hire car components required maintenance apart from regular servicing is shown in Table A4.37.
SAFETY IMPLICATIONS OF TAXI AND HIRE CAR AGE LIMITS 129

Table A4.37: Modified hire car components checked outside of regular servicing (with options as not at all common, sometimes and regularly) (n=1 stakeholder).
Vehicle component Vehicle component is not commonly checked outside of regular servicing
Vehicle component is sometimes checked outside of regular servicing
Vehicle component is regularly checked outside of regular servicing
Engine Yes
Transmission Yes
Tyres Yes
Brakes Yes
Suspension Yes
Battery Yes
Other electrical faults Yes
Hybrid battery or LPG system
Yes
Seat belts Yes
Interior trim and accessories
Yes
Bodywork Yes
Overall, taxi/hire car stakeholders indicated that most modified hire car components were checked sometimes or regularly outside of regular servicing. Specifically, engine, transmission, tyres, seat belts, and interior trim and accessories were more likely to checked sometimes, whilst suspension, electrical faults and the LPG system were more likely to be checked frequently. Most respondents indicated that brakes and batteries were not checked commonly.
A4.4.3 Identification of economic and utility constraints on vehicle replacement
The average retirement age of taxi and hire vehicles as reported by operators and stakeholders is shown in Tables A4.38 and A4.39 respectively.
130 MONASH UNIVERSITY ACCIDENT RESEARCH CENTRE

Table A4.38: Average taxi vehicle retirement age (for categories of licence in which a retirement age was specified)
Taxi operators (n=21) Stakeholders (n=8)
Metropolitan Conventional (n=8)
6.1 years (6-7 years) 5.9 years (5.5-6.5 years)
Urban conventional (n=3)
6.8 years (5-8 years) Not known
Regional conventional (n=5)
6.5 years (5-7.5 years) Not known
Country Conventional (n=3)
7.2 years (7-7.5 years) Not known
Metropolitan WAT (n=2)
10 years 10.1 (10-10.5 years)
Table A4.39: Average hire car retirement age (for categories of licence in which a retirement age was specified)
Hire car operators (n=6) Stakeholders (n=8)
Metropolitan hire car regular
7.9 years (4-10) 5.9 years (5.5-6.5)
Hire car operators (n=1) Stakeholders (n=8)
Metropolitan hire car streched limousine
7 years Not known
The average retirement age for all categories vehicle except urban conventional taxis was lower than the maximum legal age limit. Of the four Interstate taxi stakeholders surveyed, NT and ACT indicated that most vehicles are retired at the maximum age limits due to the high cost of purchasing a replacement vehicle and replacing it. In NSW and Tasmania where it appears that more objective data were available/provided most vehicles are retired at least 12 months before, which is consistent with Victoria.
Respondents were asked to indicate the extent to which they agree/disagree with the statement ‘the more expensive a vehicle is to purchase the longer it should be kept working in the fleet’. The responses are shown in Figures A4.1-A4.4 for taxi operators, hire car operators, stakeholders and taxi/hire car customers, respectively.
SAFETY IMPLICATIONS OF TAXI AND HIRE CAR AGE LIMITS 131

Figure A4.1: Proportion of taxi operators who agreed/disagreed that the more expensive a vehicle is to purchase the longer it should be kept working in the fleet (n=22 respondents)
Figure A4.2: Proportion of hire car operators who agreed/disagreed that the more expensive a vehicle is to purchase the longer it should be kept working in the fleet (n=6 respondents)
132 MONASH UNIVERSITY ACCIDENT RESEARCH CENTRE

Figure A4.3: Proportion of taxi and hire car stakeholders who agreed/disagreed that the more expensive a vehicle is to purchase the longer it should be kept working in the fleet (n=9 respondents)
Figure A4.4: Proportion of taxi and hire car customers who agreed/disagreed that the more expensive a vehicle is to purchase the longer it should be kept working in the fleet (n=55 respondents)
With the exception of hire car operators, all respondents were more likely to disagree or strongly disagree that the more expensive a vehicle is to purchase the longer it should be kept working in the fleet. Hire car operators were more likely to agree or strongly agree with this statement.
Vehicle operators, stakeholders and taxi/hire car customers were asked to indicate how important they thought each of a number of reasons are in the decision to retire a taxi or hire car from the fleet (Tables A4.40-A4.43).
SAFETY IMPLICATIONS OF TAXI AND HIRE CAR AGE LIMITS 133

Table A4.40: Proportion of taxi operators who rated the importance (from high to low) of reasons to retire a taxi from the fleet (n=22 respondents)
Reasons to retire a vehicle
% of respondents who indicated reason is high importance
% of respondents who indicated reason is medium importance
% of respondents who indicated reason is low importance
No longer comfortable
45.5% 36.4% 18.2%
No longer economic to run
68.2% 27.3% 4.5%
Maintenance costs have become too high
77.3% 13.6% 9.1%
Vehicle is off road too often and/or too long
77.3% 18.2% 4.5%
Maximise re-sale value
0% 9.1% 90.9%
Vehicle perceived by customers as being too old
23.8% 42.9% 33.3%
Low likelihood of passing the annual road safety inspection
40.9% 40.9% 18.2%
Low likelihood of passing a random vehicle inspection
40.9% 36.4% 22.7%
No longer safe 90.9% 0% 9.1%
Customer feedback
38.1% 52.4% 9.5%
No longer meets TSC requirements
90.9% 4.5% 4.5%
The most important reasons to retire a vehicle as reported by taxi operators were that: it is no longer safe and no longer meets TSC requirements; maintenance costs have become too high and the vehicle is off-road too often and/or too long; and that it is no longer economic to run. Maximising vehicle re-sale value and concern over customers perceiving the vehicle as being too old were rated by most taxi operators as being the lowest priorities in retiring a vehicle.
134 MONASH UNIVERSITY ACCIDENT RESEARCH CENTRE

Table A4.41: Proportion of hire car operators who rated the importance (from high to low) of reasons to retire a hire car from the fleet (n=6 respondents)
Reasons to retire vehicles
% of respondents who indicated reason is high importance
% of respondents who indicated reason is medium importance
% of respondents who indicated reason is low importance
No longer comfortable
50% 50%
No longer economic to run
83.3% 16.7%
Maintenance costs have become too high
100%
Vehicle is off road too often and/or too long
100%
Maximise re-sale value
100%
Vehicle perceived by customers as being too old
66.6% 16.7% 16.7%
Low likelihood of passing the annual road safety inspection
33.3% 33.3% 33.3%
Low likelihood of passing a random vehicle inspection
33.3% 16.7% 50%
No longer safe 100%
Customer feedback
50% 50%
No longer meets TSC requirements
50% 50%
The most important reasons to retire a vehicle as reported by hire car operators were that: it is no longer safe; maintenance costs have become too high and the vehicle is off-road too often and/or too long; it is no longer economic to run; and that the vehicle is likely to be perceived by customers are being too old. Maximising vehicle re-sale value, low likelihood of passing a random vehicle inspection, and no longer meeting TSC requirements were rated by most hire car operators as being the lowest priorities in retiring a vehicle.
SAFETY IMPLICATIONS OF TAXI AND HIRE CAR AGE LIMITS 135

Table A4.42: Proportion of taxi and hire car stakeholders who rated the importance (from high to low) of reasons to retire a taxi/hire car from the fleet (n=7 respondents)
Reasons to retire vehicles
% of respondents who indicated reason is high importance
% of respondents who indicated reason is medium importance
% of respondents who indicated reason is low importance
No longer comfortable
57.1% 28.6% 14.3%
No longer economic to run
14.3% 42.9% 42.9%
Maintenance costs have become too high
14.3% 42.9% 42.9%
Vehicle is off road too often and/or too long
14.3% 14.3% 71.4%
Maximise re-sale value
71.4% 14.3% 14.3%
Vehicle perceived by customers as being too old
28.6% 71.4%
Low likelihood of passing the annual road safety inspection
57.1% 14.3% 28.6%
Low likelihood of passing a random vehicle inspection
42.9% 28.6% 28.6%
No longer safe 28.6% 57.1% 14.3%
Customer feedback 42.9% 42.9% 14.3%
No longer meets TSC requirements
28.6% 14.3% 57.1%
Vehicle not meeting clients’ higher expectations (hire cars only)
33.6% 66.7%
The most important reasons to retire a vehicle as reported by taxi and hire car stakeholders were that: the vehicle is off road too often and/or too long; the vehicle no longer meets
136 MONASH UNIVERSITY ACCIDENT RESEARCH CENTRE

clients’ higher expectations (hire cars only), and that the vehicle no longer meets TSC requirements. Maximising vehicle re-sale value, customer feedback, vehicle no longer comfortable, low likelihood of passing a random vehicle inspection and the annual road safety inspection were rated by most stakeholders as being the lowest priorities in retiring a vehicle.
SAFETY IMPLICATIONS OF TAXI AND HIRE CAR AGE LIMITS 137

Table A4.43: Proportion of taxi and hire car customers who rated the importance (from high to low) of reasons to retire a taxi from the fleet (n=52 respondents)
Reasons to retire vehicles (and number of respondents who provided a ranking)
% of respondents who indicated reason is high importance
% of respondents who indicated reason is medium importance
% of respondents who indicated reason is low importance
No longer comfortable (n=54)
38.9% 51.9% 9.3%
No longer economic to run (n=53)
54.7% 37.7% 7.5%
Maintenance costs have become too high(n=53)
60.4% 32.1% 7.5%
Vehicle is off road too often and/or too long (n=53)
37.7% 34% 28.3%
Maximise re-sale value (n=53)
3.8% 41.5% 54.7%
Vehicle perceived by customers as being too old (n=54)
31.5% 48.1% 20.4%
Low likelihood of passing the annual road safety inspection (n=54)
85.2% 9.3% 5.6%
Low likelihood of passing a random vehicle inspection (n=54)
77.8% 13% 9.3%
No longer safe (n=54)
98.1% 0% 1.9%
Customer feedback (n=52)
38.5% 50% 11.5%
No longer meets TSC requirements (n=54)
66.7% 24.1% 9.3%
Vehicle not meeting clients’
38.9% 48.1% 13%
138 MONASH UNIVERSITY ACCIDENT RESEARCH CENTRE

higher expectations (hire cars only) (n=54)
The most important reasons perceived by taxi/hire car customers to be important in retiring a vehicle were that: it is no longer safe; it has a low likelihood of passing the annual road safety inspection, and that it has a low likelihood of passing a random inspection. Maximising vehicle re-sale value, vehicle being off road for too often and/or too long, and the vehicle perceived by customers as being too old were rated by most taxi and hire car customers as being the lowest priorities in retiring a vehicle.
A4.5 SAFETY RELATED ISSUES IDENTIFIED BY ENFORCING AUTHORITIES INCLUDING COMMON TRENDS IN ROADWORTHINESS ISSUES RELATED TO OPERATION AND AGE BASED TRENDS
A4.5.1 Compliance at annual inspections
The proportion of taxi and hire vehicles found to be non-compliant at the last annual inspection are shown in Tables A4.44 and A4.45 respectively.
Table A4.44: Proportion of taxis found to be non-compliant at the last annual inspection as reported by vehicle operators and industry stakeholders
Taxi operators (n=16)
Stakeholders (n=3)
Taxis 21% (0-100%) 72% (60-85%)
Taxi operators (n=8)
Stakeholders (n=3)
WATs 17% (5%-100%) 46% (20%-85%)
Table A4.45: Proportion of hire cars found to be non-compliant at the last annual inspection as reported by vehicle operators and industry stakeholders
Hire car operators (n=6)
Stakeholders (n=3)
Hire cars 37% (0-100%) 72% (60-85%)
Hire car operators (n=1)
Stakeholders (n=2)
Modified hire cars 0% 20% (0-20%)
SAFETY IMPLICATIONS OF TAXI AND HIRE CAR AGE LIMITS 139

The proportion of hire vehicles found to be non-compliant at the last annual inspection was higher than that for taxi vehicles and WATs, and modified hire vehicles, in particular, had a higher pass rate than standard vehicles in the fleet. The estimates given by the taxi industry stakeholders were much higher than those given by the vehicle operators.
Issues identified following annual inspections
Taxi and hire car operators and stakeholders were asked to indicate the extent to which various vehicle components were identified in the last 12 months as requiring attention following annual inspections (Tables A4.46 – A4.53). The results are tabulated separately for operators of multiple and single vehicles.
140 MONASH UNIVERSITY ACCIDENT RESEARCH CENTRE

Table A4.46: Proportion of vehicle components reported by taxi operators as being identified in none, some and many standard taxi vehicles following annual inspections
Vehicle components identified in annual inspection and number of operators who answered question
Percent of respondents indicating component was not identified at all
Percent of respondents indicating component was identified in some vehicles
Percent of respondents indicating component was identified in many vehicles
Engine
(n=7)
100%
Transmission
(n=7)
100%
Tyres
(n=11)
63.6% 36.4%
Brakes
(n=10)
90% 10%
Suspension
(n=10)
60% 40%
Battery
(n=6)
100%
Lights/electrical
(n=10)
70% 20% 10%
Seat belts
(n=10)
30% 70%
Oil leaks
(n=4)
50% 50%
Trim
(n=10)
60% 40%
Body work
(n=10)
40% 60%
Taxi specific equipment (taxi meter, dispatchers, tariff lights, safety
80% 20%
SAFETY IMPLICATIONS OF TAXI AND HIRE CAR AGE LIMITS 141

cameras etc)
(n=5)
For WAT specific equipment (e.g., hoist or ramp)
(n=6)
16.7% 83.3%
142 MONASH UNIVERSITY ACCIDENT RESEARCH CENTRE

Table A4.47: Proportion of vehicle components reported by taxi operators as being identified or not in single vehicle taxi operations following annual inspections
Vehicle components identified in annual inspection and number of operators who answered question
Vehicle component not identified
Vehicle component identified
Engine (n=8) 87.5% 12.5%
Transmission (n=8) 87.5% 12.5%
Tyres
(n=9)
55.5% 44.4%
Brakes
(n=9)
55.6% 44.4%
Suspension
(n=9)
22.2% 77.8%
Battery
(n=8)
75% 25%
Lights/electrical
(n=8)
87.5% 12.5%
Seat belts
(n=8)
50% 50%
Oil leaks
Trim
(n=8)
62.5% 37.5%
Body work
(n=8)
87.5% 12.5%
Taxi specific equipment (taxi meter, dispatchers, tariff lights, safety cameras etc)
SAFETY IMPLICATIONS OF TAXI AND HIRE CAR AGE LIMITS 143

Overall, multi-taxi vehicle operators reported few issues identified in most of their vehicles following the last annual inspection. Issues with seat belts, body work and WAT specific equipment were more likely to be identified in some vehicles, and a small proportion of operators indicated that lights and other electrical equipment required servicing in many of their vehicles. In single vehicle taxi operations, most components were more likely not to require attention following the annual inspection. Only the suspension was more likely to require attention, and about half of all operators indicated that maintenance was required on the tyres and the battery.
144 MONASH UNIVERSITY ACCIDENT RESEARCH CENTRE

Table A4.48: Proportion of vehicle components reported by taxi operators as being identified in none, some and many WAT vehicles following annual inspections
Vehicle components identified in annual inspection and number of operators who answered question
Percent of respondents indicating component was not identified at all
Percent of respondents indicating component was identified in some vehicles
Percent of respondents indicating component was identified in many vehicles
Engine
Transmission
Tyres
(n=2)
100%
Brakes
(n=2)
100%
Suspension
(n=2)
100%
Battery
(n=6)
Lights/electrical
(n=2)
50% 50%
Seat belts
(n=2)
50% 50%
Oil leaks
(n=2)
100%
Trim
(n=2)
100%
Body work
(n=2)
50% 50%
Taxi specific equipment (taxi meter, dispatchers, tariff lights, safety
SAFETY IMPLICATIONS OF TAXI AND HIRE CAR AGE LIMITS 145

cameras etc)
For WAT specific equipment (e.g., hoist or ramp)
(n=6)
16.7% 83.3%
146 MONASH UNIVERSITY ACCIDENT RESEARCH CENTRE

Table A4.49: Proportion of vehicle components reported by taxi operators as being identified or not in single WAT vehicles taxi operations following annual inspections
Vehicle components identified in annual inspection and number of operators who answered question
Vehicle component not identified
Vehicle component identified
Engine (n=2) 100%
Transmission (n=2) 100%
Tyres
(n=4)
50% 50%
Brakes
(n=3)
66.7% 33.3%
Suspension
(n=4)
100%
Battery
(n=2)
100%
Lights/electrical
(n=4)
100%
Seat belts
(n=4)
100%
Oil leaks 100%
Trim
(n=4)
100%
Body work
(n=4)
100%
Taxi specific equipment (taxi meter, dispatchers, tariff lights, safety cameras etc)
SAFETY IMPLICATIONS OF TAXI AND HIRE CAR AGE LIMITS 147
For WAT specific equipment (e.g., hoist or ramp)
(n=4)
100%
Overall, most multi-taxi WAT operators reported few issues identified in most of their vehicles following the last annual inspection. Lights and other electrical equipment, and seat belts and body work were identified by half of all operators as requiring attention in some of their vehicles, and WAT specific equipment was identified by most operators as requiring attention in many of their vehicles. In single WAT operations, most components were more likely not to require attention following annual inspections. Half of all operators indicated that tyres required attention and a third indicated that brakes required attention.
Participants were asked whether they encountered any difficulties with rectifying these defects. There were no difficulties encountered by the 20 respondents who answered this question. However, one of the WAT operators said that he required specialist trades services and experienced some difficulty in obtaining these services.
148 MONASH UNIVERSITY ACCIDENT RESEARCH CENTRE

Table A4.50: Proportion of vehicle components reported by hire car operators as being identified in none, some and many standard hire car vehicles following annual inspections
Vehicle components identified in annual inspection
% of respondents indicating component was not identified at all
% of respondents indicating component was identified in some vehicles
% of respondents indicating component was identified in many vehicles
Engine (n=1) 100%
Transmission (n=1) 100%
Tyres (n=4) 50% 50%
Brakes (n=4) 75% 25%
Suspension (n=4) 75% 25%
Battery (n=1) 100%
Lights (n=4) 75% 25%
Hybrid battery or LPG system (n=1)
100%
Seat belts (n=4) 100%
Oil leaks (n=3) 66.7% 33.3%
Interior trim (n=1) 100%
Body work (n=4) 100%
Taxi specific equipment (taxi meter, dispatchers, tariff lights, safety cameras etc) (n=1)
100%
SAFETY IMPLICATIONS OF TAXI AND HIRE CAR AGE LIMITS 149

Table A4.51: Proportion of vehicle components reported by hire car operators as being identified or not in single hire car operations following annual inspections
Vehicle components identified in annual inspection
Vehicle component not identified
Vehicle component identified
Engine (n=1) 100%
Transmission (n=1) 100%
Tyres (n=1) 100%
Brakes (n=2) 100%
Suspension (n=2) 100%
Battery (n=1) 100%
Lights (n=2) 100%
Hybrid battery or LPG system (n=1)
100%
Seat belts (n=2) 100%
Oil leaks (n=1) 100%
Interior trim (n=1) 100%
Body work (n=2) 100%
Taxi specific equipment (taxi meter, dispatchers, tariff lights, safety cameras etc) (n=1)
100%
Overall, multi-hire car operators reported that there were few components identified as requiring attention in most of their vehicles following annual inspections. Half of all operators indicated that tyres required attention in some of their vehicles. The battery and hybrid battery required attention in some of the vehicles owned by one hire car operator. All single hire car operators reported that none of their vehicle components required attention following annual inspections in the last 12 months.
150 MONASH UNIVERSITY ACCIDENT RESEARCH CENTRE

Table A4.52: Proportion of vehicle components reported by hire car operators as being identified or not in single modified hire car operations following annual inspections
Vehicle components identified in annual inspection
Vehicle component not identified
Vehicle component identified
Engine (n=1) 100%
Transmission (n=1) 100%
Tyres (n=2) 100%
Brakes (n=2) 100%
Suspension (n=2) 100%
Battery (n=1) 100%
Lights (n=2) 100%
Hybrid battery or LPG system (n=1)
100%
Seat belts (n=2) 100%
Oil leaks (n=1) 100%
Interior trim (n=1) 100%
Body work (n=2) 100%
Taxi specific equipment (taxi meter, dispatchers, tariff lights, safety cameras etc) (n=1)
100%
Participants were asked whether they encountered any difficulties with rectifying these defects. There were no difficulties encountered by the six respondents who answered this question. There were no difficulties encountered by the one respondent with modified hire cars.
SAFETY IMPLICATIONS OF TAXI AND HIRE CAR AGE LIMITS 151

Table A4.53: Proportion of vehicle components reported by stakeholders (n=3) as being identified in none, some and many taxi and hire vehicles following annual inspections
Vehicle components identified in annual inspection
% of respondents indicating component was not identified at all
% of respondents indicating component was identified in some vehicles
% of respondents indicating component was identified in many vehicles
Tyres 0% 33.3% 66.7%
Brakes 0% 33.3% 66.7%
Suspension 0% 0% 100%
Lights 0% 66.7% 33.3%
Seat belts 0% 100% 0%
Oil leaks 33.3% 33.3% 33.3%
Body work 0% 33.3% 66.7%
Taxi specific equipment (taxi meter, dispatchers, tariff lights, safety cameras etc)
0% 66.7% 33.3%
For WAT specific equipment (e.g., hoist or ramp)
66.7% 33.3% 0%
Stakeholders reported that tyres, brakes, suspension and body work were more frequently identified in many vehicles whereas lights, seat belts and taxi specific equipment were more likely to be identified in only some vehicles. WAT specific equipment was more likely not to be identified at all. Oil leaks were equally likely to be identified in none, some and many vehicles. Issues were rarely identified in modified hire cars following annual inspections, although specific estimates were not provided.
Two thirds of stakeholders indicated that they had encountered difficulties with operators rectifying the identified defects. Some taxi operators disputed the defects, whilst others ‘shopped around’ for an inspector who would be less likely to fail the vehicle. These issues were deemed to be less common among hire car and modified hire car operators.
A4.5.2 Compliance at random inspections
The proportion of industry stakeholders and vehicle operators who indicated the likelihood (from very unlikely through very likely) that a taxi would be found compliant in a random inspection is shown in Tables A4.54 and A4.55 respectively.
152 MONASH UNIVERSITY ACCIDENT RESEARCH CENTRE

Table A4.54: Proportion of industry stakeholders and vehicle operators who indicated the likelihood (from very unlikely through very likely) that a taxi would be found compliant in a random inspection
Stakeholders (n=5) Taxi operators (n=20)
Taxis
Very unlikely 0% 0%
Unlikely 60% 25%
Neither likely nor unlikely
20% 10%
Likely 20% 65%
Very likely 0% 0%
Stakeholders (n=5) WAT operators (n=8)
WATs
Very unlikely 0% 0%
Unlikely 40% 12.5%
Neither likely nor unlikely
40% 25%
Likely 20% 65.2%
Very likely 0% 0%
SAFETY IMPLICATIONS OF TAXI AND HIRE CAR AGE LIMITS 153

Table A4.55: Proportion of industry stakeholders and vehicle operators who indicated the likelihood (from very unlikely through very likely) that a hire car would be found compliant in a random inspection
Stakeholders (n=5) Hire car operators (n= 6)
Hire cars
Very unlikely 0% 0%
Unlikely 60% 0%
Neither likely nor unlikely
20% 0%
Likely 20% 100%
Very likely 0%
Modified Hire cars Stakeholders (n=5) Modified hire car operators (n=1)
Very unlikely 0% 0%
Unlikely 40% 0%
Neither likely nor unlikely
40% 0%
Likely 20% 100%
Very likely 0% 0%
Taxi and hire car operators both perceived that their vehicles would be likely to be found compliant, with a much higher estimate given by hire car operators. Stakeholders were more likely to indicate that taxis and hire cars would be unlikely to be found compliant.
A4.5.3 Issues identified following random inspections
Vehicle operators and industry stakeholders and were asked to indicate (on a scale of 1-5, with 1 being not identified at all and 5 being very commonly identified) the frequency with which various vehicle components were identified as requiring attention following a random inspection within the past 12 months (Tables A4.56-A4.58).
154 MONASH UNIVERSITY ACCIDENT RESEARCH CENTRE

Table A4.56: Proportion of vehicle components reported by taxi operators as being identified (from 1 not identified at all to 5 commonly identified) following random inspections (n=20 respondents)
Vehicle components requiring attention following random inspection
% of respondents indicating component was not identified at all (rating 1-2)
% of respondents indicating component was sometimes identified (rating =3)
% of respondents indicating component was very commonly identified (rating = 4-5)
Tyres 80% 15% 5%
Brakes 100%
Suspension 100%
Lights 80% 10% 10%
Seat belts 85% 10% 5%
Oil leaks 90% 10%
Body work 80% 10% 10%
Taxi specific equipment (taxi meter, dispatchers, tariff lights, safety cameras etc.)
80% 5% 15%
For WAT specific equipment (e.g., hoist or ramp)
100%
Lights and bodywork were more likely to be very commonly identified as requiring attention, whereas suspension, brakes, suspension and WAT specific equipment were more likely to be rarely identified as requiring attention. Tyres, lights, seat belts, oil leaks and body work were more likely than other components to be sometimes identified. Respondents indicated that the frequency with which the various WAT vehicle components required attention was similar to that reported here for taxi vehicles. Taxi operators reported that they did not encounter any difficulties with rectifying these defects.
SAFETY IMPLICATIONS OF TAXI AND HIRE CAR AGE LIMITS 155

Table A4.57: Proportion of vehicle components reported by hire car operators as being identified (on a scale of 1-5, with 1 being not identified at all and 5 being very commonly identified) as requiring attention following random inspections (n=5 respondents)
Vehicle components identified in annual inspection
% of respondents indicating component was not identified at all (rating 1-2)
% of respondents indicating component was sometimes identified (rating =3)
% of respondents indicating component was very commonly identified (rating = 4-5)
Tyres 80% 20%
Brakes 100%
Suspension 100%
Lights 80% 20%
Seat belts 100%
Oil leaks 100%
Body work 100%
Taxi specific equipment (taxi meter, dispatchers, tariff lights, safety cameras etc.)
100%
All items excluding tyres and lights were not identified as requiring attention following random inspections. Tyres and lights were only sometimes identified as requiring attention. The one modified hire vehicle operator was unable to complete this section because none of his vehicles had been subject to a random inspection within the last 15 years. Hire car operators reported that they did not encounter any difficulties with rectifying these defects.
156 MONASH UNIVERSITY ACCIDENT RESEARCH CENTRE

Table A4.58: Proportion of vehicle components reported by stakeholders as being identified (from not identified at all to commonly identified) following random inspections (n=3 respondents)
Vehicle components identified in annual inspection
% of respondents indicating component was not identified at all (rating 1-2)
% of respondents indicating component was identified in some vehicles (rating =3)
% of respondents indicating component was very commonly identified (rating = 4-5)
Tyres 0% 33.3% 66.7%
Brakes 66.7% 33.3% 0%
Suspension 66.7% 0% 33.3%
Lights 0% 0% 100%
Seat belts 33.3% 33.3% 33.3%
Oil leaks 66.7% 33.3% 0%
Body work 0% 33.3% 66.7%
Taxi specific equipment (taxi meter, dispatchers, tariff lights, safety cameras etc.)
33.3% 33.3% 33.3%
For WAT specific equipment (e.g., hoist or ramp)
100% 0% 0%
Tyres, lights and bodywork were more likely to be very commonly identified as requiring attention, whereas suspension, oil leaks and taxi specific equipment were more likely to be rarely identified as requiring attention. Seat belts and taxi specific equipment were equally likely to be identified by respondents as rarely, sometimes and very commonly requiring attention. The ratings were similar for WAT vehicles. Stakeholders indicated that the frequency with which the various vehicle components required attention in modified hire cars was lower than that for taxis and WATs although none provided specific ratings. Stakeholders reported that they did not encounter any difficulties with rectifying the issues identified in random inspections.
A4.6 OPERATION, EFFICIENCY AND EFFECTIVENESS OF THE CURRENT INSPECTION REGIME
A4.6.1 Operation of the current inspection regime
This section provides details on the operation of the current inspection regime including whether and how vehicle operators prepare for annual inspections, and the frequency of
SAFETY IMPLICATIONS OF TAXI AND HIRE CAR AGE LIMITS 157

random inspections. The responses are from taxi and hire car operators and selected taxi/hire car industry stakeholders.
A4.6.2 Preparation for annual vehicle inspections
Table A4.59 presents the proportion of taxi and hire car operators who indicated that they prepare for annual vehicle inspections as well as the proportion of stakeholders indicating that vehicle operators prepare for annual inspections.
Table A4.59: Proportion of respondents indicating that taxi/hire car operators prepare for annual vehicle inspections
Taxi operators (n=21) Hire car operators (n=6)
Stakeholders (n=4)
% taxi operators who prepare
61.9% N/A 50%
% hire car operators who prepare
N/A 16.7% 50%
Taxi operators were much more likely to prepare for annual vehicle inspections than hire car operators. Just over half of all taxi operators provided details about how they prepare for annual vehicle inspections. The majority of preparations comprised a brief check of basic components such as brakes, tyres, and lights and rectifying any defects to a standard that was perceived by most operators to be compliant. A small proportion of taxi operators conducted more extensive testing. Overall, these responses were generally consistent with those reported by the taxi/hire car industry stakeholders based on their experiences with the fleet operators. Most hire car operators indicated that they rarely prepared for annual inspections; however no details of vehicle preparations were given by those indicating that they did prepare. A4.6.3 Frequency of random vehicle inspections
Table A4.60 presents the annual frequency of random vehicle inspections as reported by vehicle operators and stakeholders.
Table A4.60: Annual frequency of random vehicle inspections as reported by vehicle operators and stakeholders.
Taxi operators (n=21) Hire car operators (n=6)
Stakeholders (n=2)
Average annual frequency of random taxi inspections
2.6 (0-12) N/A 2 (1-3)
Average annual frequency of random hire car inspections
N/A 0 2
Taxis were subjected to random inspections more frequently than hire cars. None of the hire car operators, including those with modified vehicles, had experienced a random inspection in the last 12 months. The taxi industry stakeholders estimated the frequency of random
158 MONASH UNIVERSITY ACCIDENT RESEARCH CENTRE
inspections to be slightly lower than that reported by taxi operators and higher than that reported by hire car operators.
Only one of the four interstate taxi regulators who responded to the survey provided an estimate of the frequency of random vehicle inspections (estimated at 2.6 per year). The remaining respondents indicated that there were between 2-6 campaigns per year, however it was not possible to estimate a rate from these estimates because no data exposure data were provided.
Figures A4.5 - A4.8 presents the proportion of vehicle operators and stakeholders indicating the likelihood that a typical vehicle would be randomly inspected on-road in any one year.
Figure A4.5: Proportion of taxi operators indicating the likelihood that a typical taxi would be randomly inspected on-road in any one year (n=21 respondents)
Figure A4.6: Proportion of taxi operators indicating the likelihood that a typical WAT would be randomly inspected on-road in any one year (n=9 respondents)
SAFETY IMPLICATIONS OF TAXI AND HIRE CAR AGE LIMITS 159

Figure A4.7: Proportion of hire car operators indicating the likelihood that a typical hire car would be randomly inspected on-road in any one year (n=6 respondents)
Figure A4.8: Proportion of stakeholders indicating the likelihood that a typical taxi/hire car would be randomly inspected on-road in any one year (n=5)
Most taxi operators and stakeholders indicated that a typical vehicle would likely be randomly inspected on road in any one year. All hire car operators indicated that it would be unlikely that one of their vehicles would be randomly inspected on road in any one year. A4.6.4 Efficiency and effectiveness of the current inspection regime
This section summarises the perceptions of taxi and hire car operators and selected taxi/hire car industry stakeholders about the effectiveness and frequency of annual and random vehicle inspections. Respondents’ suggestions about how the current inspection regime could be improved to ensure the safety of taxis and hire cars are also summarised.
160 MONASH UNIVERSITY ACCIDENT RESEARCH CENTRE

Annual inspections
Taxi and hire car operators and selected industry stakeholders were asked to indicate their perceptions of the importance (Figures A4.9 – A4.11) and effectiveness (Figures A4.12 – A4.14) of the annual inspection process for ensuring the safety of vehicles.
Figure A4.9: Proportion of taxi operators who rated the importance of annual vehicle inspections for safety (n=21)
Figure A4.10: Proportion of hire car operators who rated the importance of annual vehicle inspections for safety (n=6 respondents)
SAFETY IMPLICATIONS OF TAXI AND HIRE CAR AGE LIMITS 161

Figure A4.11: Proportion of stakeholders who rated the importance of annual vehicle inspections for safety (n=6 respondents)
Figure A4.12: Proportion of taxi operators who rated the effectiveness of annual vehicle inspections for safety (n=21)
162 MONASH UNIVERSITY ACCIDENT RESEARCH CENTRE

Figure A4.13: Proportion of hire car operators who rated the effectiveness of annual vehicle inspections for safety (n=6 respondents)
Figure A4.14: Proportion of stakeholders who rated the effectiveness of annual vehicle inspections for safety (n=6 respondents)
The largest proportion of respondents from most groups perceived the annual inspection process to be both effective/very effective and important/very important in ensuring the safety of taxis and hire cars. Hire car operators were generally equally likely to perceive the annual inspection process to be important and unimportant, and taxi/hire car industry stakeholders were somewhat more divided in their perceptions of its effectiveness.
These responses were generally consistent with those reported by the interstate taxi regulators. However some felt that the number of compliance officers needed to be increased to enable more frequent inspections, and others thought that the inspection regime needed to be more stringent and consistent.
Taxi and hire car operators and selected industry stakeholders were asked to provide their opinion on the frequency with which vehicle inspections are currently conducted (Figures A4.15 – A4.17) and to indicate whether the frequency of annual inspections should change with the age of the vehicle (Figures 4.18 – 4.20).
SAFETY IMPLICATIONS OF TAXI AND HIRE CAR AGE LIMITS 163

Figure A4.15: Proportion of taxi operators indicating that annual vehicle inspections are too infrequent, about right or too frequent (n=21)
164 MONASH UNIVERSITY ACCIDENT RESEARCH CENTRE

Figure A4.16: Proportion of hire car operators indicating that annual vehicle inspections are too infrequent, about right or too frequent (n=6)
Figure A4.17: Proportion of stakeholders indicating that annual vehicle inspections are too infrequent, about right or too frequent (n=5)
SAFETY IMPLICATIONS OF TAXI AND HIRE CAR AGE LIMITS 165

Figure A4.18: Proportion of taxi operators indicating that annual vehicle inspections should stay the same, increase or decrease as vehicle age increases (n=21)
166 MONASH UNIVERSITY ACCIDENT RESEARCH CENTRE
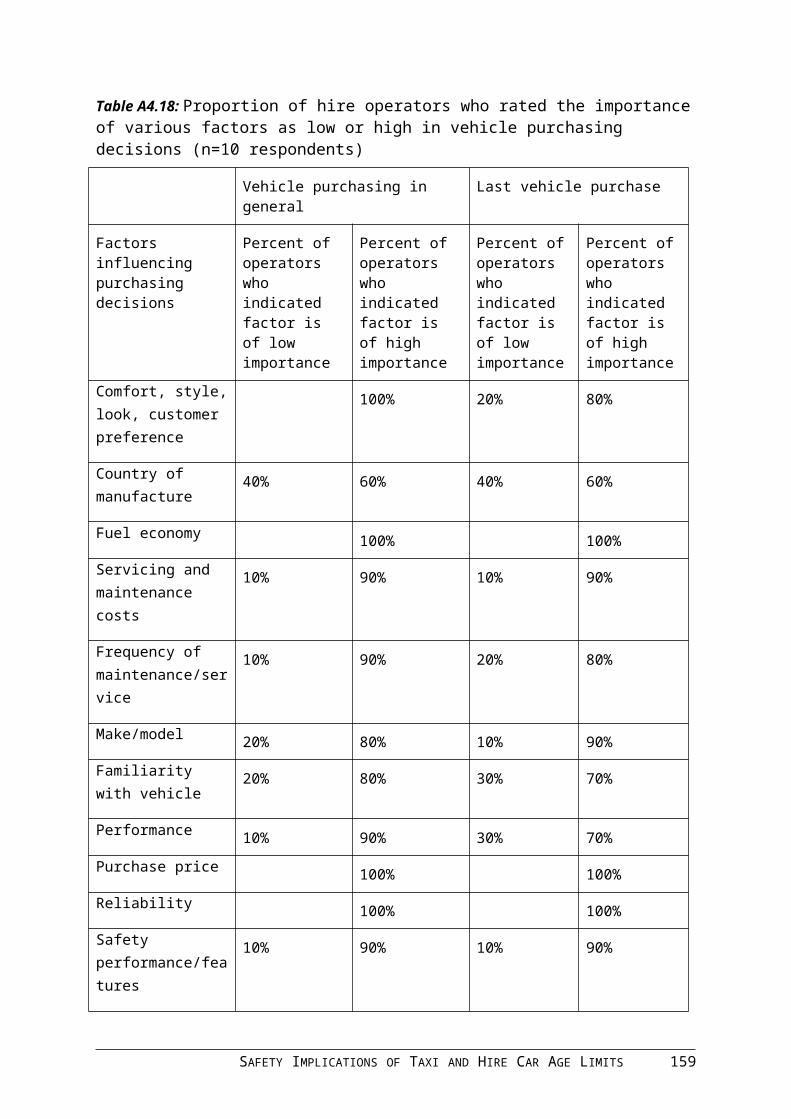
Figure A4.19: Proportion of hire car operators indicating that annual vehicle inspections should stay the same, increase or decrease as vehicle age increases (n=6)
Figure A4.20: Proportion of stakeholders indicating that annual vehicle inspections should stay the same, increase or decrease as vehicle age increases (n=5)
All four surveyed interstate taxi regulators reported that periodic taxi and hire car roadworthiness checks are conducted in their respective state/territory. In the Australian Capital Territory and the Northern Territory, periodic inspections are conducted annually. In New South Wales inspections are conducted every four months for metropolitan taxis and every six months for country taxis whereas hire vehicles are inspected annually and in Tasmania, taxis over 12 months of age have a roadworthiness inspection every 6 months and a full safety inspection every 6 months or 10,000 kms or whichever comes first. The frequency of vehicle inspections was not reported to increase with the age of the vehicle in any of the states surveyed.
Across all groups, respondents were more likely to believe that the frequency of ‘annual’ inspections is about right. A third of hire car operators and half as many taxi operators and
SAFETY IMPLICATIONS OF TAXI AND HIRE CAR AGE LIMITS 167

industry personnel thought that the frequency of these inspections should increase. Most taxi and hire car operators did not believe that the frequency of vehicle inspections should change with the age of the vehicle, whilst most taxi/hire car industry stakeholders believed that it should.
About half of all respondents provided explanations about their perceptions of the effectiveness of the current annual vehicle inspection regime along with suggestions about how it could be improved. Most respondents felt that the annual inspection process is important for ensuring a minimum standard of safety and maintenance by taxi/hire car operators. Some respondents felt that without the inspection process some operators would fail to adhere to minimum safety standards, contributing to a reduction in passenger safety and/or to a poor public perception of the industry’s commitment to customer safety and satisfaction.
A small proportion of stakeholders felt that annual inspections are more about providing a public perception that safety is being monitored because there is currently no evidence for their effectiveness in terms of maintaining and/or improving safety. A large proportion of respondents thought that the inspections only provide a ‘snapshot in time’ of the safety of a vehicle, potentially allowing operators to overlook problems that arise at other times. This view was more common among hire car operators and taxi/hire vehicle inspectors who were of the opinion that annual inspections are unnecessary for operators who service and maintain their vehicles on a regular basis. It was suggested that more frequent targeted inspections should replace annual inspections to allow continuous monitoring of vehicles, particularly those with previously identified safety issues. With respect to this issue, some operators felt that the inspection process needed to be more efficient as there was a tendency for some inspectors to focus on non-safety related issues (such as a missing sticker or moisture in the camera) and/or to find faults where they did not exist.
Some of the taxi industry stakeholders pointed out that the level of stringency and objectivity applied during inspections varies between licenced vehicle testers, with some testers failing to adequately inspect vehicles to the required standard. A large proportion of respondents suggested that a more standardised annual inspection process would help eliminate inconsistencies in vehicle testing procedures and do better to uphold TSC standards. One respondent felt that greater involvement by the TSC in the annual vehicle inspection process could assist with this, and suggested initiatives including sending copies of the inspection results to the TSC and greater enforcement and monitoring of the inspection process by the TSC. Some operators suggested that all annual inspections should be conducted by the TSC or VicRoads. It was felt that a more ‘standardised/centralised’ testing process would eliminate the potential for vehicle operators to ‘shop around’ for the most lenient inspectors, although it was acknowledged that supplementing annual inspections with more frequent random inspections would remove some of the problems associated with this practice.
A higher standard of training for those licenced to inspect vehicles was also deemed by some as a method to improve safety, with road safety inspectors perceived to be more qualified than general mechanics. Use of vehicle maintenance log books was also suggested as method to improve servicing and inspection procedures. Random inspections
Taxi and hire car operators and selected industry stakeholders were asked to provide their perceptions of the importance (Figures A4.21 – A4.23) and effectiveness (Figures A4.24 – A4.26) of the random inspection process for ensuring the safety of vehicles.
168 MONASH UNIVERSITY ACCIDENT RESEARCH CENTRE

Figure A4.21: Proportion of taxi operators who rated the importance of random vehicle inspections for safety (n=21)
Figure A4.22: Proportion of hire car operators who rated the importance of random vehicle inspections for safety (n=6 respondents)
SAFETY IMPLICATIONS OF TAXI AND HIRE CAR AGE LIMITS 169

Figure A4.23: Proportion of stakeholders who rated the importance of random vehicle inspections for safety (n=6 respondents)
Figure A4.24: Proportion of taxi operators who rated the effectiveness of random vehicle inspections for safety (n=20)
170 MONASH UNIVERSITY ACCIDENT RESEARCH CENTRE

Figure A4.25: Proportion of hire car operators who rated the effectiveness of random vehicle inspections for safety (n=6 respondents)
Figure A4.26: Proportion of stakeholders who rated the effectiveness of random vehicle inspections for safety (n=6 respondents)
The largest proportion of taxi operators and industry stakeholders perceived the random inspection regime to be important or very important in ensuring the safety of taxis and hire cars. Hire car operators were somewhat more divided on their perceptions of the process. Most taxi operators and stakeholders perceived the random inspection process to be effective or very effective in ensuring the safety of taxis and hire cars. In contrast, most hire car operators believed that the random inspection process was ineffective or very ineffective. Tables A4.27-A4.29 shows the proportion of taxi operators, hire car operators and stakeholders respectively who indicated that random vehicle inspections are too infrequent, about right or too infrequent.
SAFETY IMPLICATIONS OF TAXI AND HIRE CAR AGE LIMITS 171

Figure A4.27: Proportion of taxi operators indicating that random vehicle inspections are too infrequent, about right or too frequent (n=21)
Figure A4.28: Proportion of hire car operators indicating that random vehicle inspections are too infrequent, about right or too frequent (n=6)
172 MONASH UNIVERSITY ACCIDENT RESEARCH CENTRE

Figure A4.29: Proportion of stakeholders indicating that random vehicle inspections are too infrequent, about right or too frequent (n=5)
Tables A4.30-A4.32 shows the proportion of taxi operators, hire car operators and stakeholders respectively who indicated that random vehicle inspections should stay the same, increase or decrease with vehicle age.
Figure A4.30: Proportion of taxi operators indicating that random vehicle inspections should stay the same, increase or decrease as vehicle age increases (n=21)
SAFETY IMPLICATIONS OF TAXI AND HIRE CAR AGE LIMITS 173

Figure A4.31: Proportion of hire car operators indicating that random vehicle inspections should stay the same, increase or decrease as vehicle age increases (n=6)
Figure A4.32: Proportion of stakeholders indicating that random vehicle inspections should stay the same, increase or decrease as vehicle age increases (n=5)
Whilst most taxi operators believed that the frequency of random inspections was about right, half of the hire car operators and taxi industry stakeholders thought they should increase. Most taxi and hire car operators felt that the frequency of random vehicle inspections should not change with the age of the vehicle, whilst most taxi/hire car industry stakeholders believed that it should.
About half of all respondents provided explanations for their perceptions of the effectiveness of the current random vehicle inspection regime, along with suggestions about how it could be improved. Many of the themes were similar to those raised in relation to annual inspections.
Most respondents thought that random inspections are important for ensuring a minimum standard of safety and maintenance by vehicle operators at times outside of the annual inspection period. It was felt that the process would be more effective if licenced vehicle testing procedures were more rigorous and inspectors were more competent. It was suggested that vehicles should be pulled into a workshop or hoisted to allow more rigorous
174 MONASH UNIVERSITY ACCIDENT RESEARCH CENTRE

testing and assessment. A number of respondents had experienced difficulties with TSC inspectors, stating that they were inexperienced or unqualified to carry out the inspections safely and that there needed to be an improvement in the level of training and or attitudes of these personnel.
Some respondents, particularly hire car operators, suggested that the frequency of random inspections and the diversity of locations in which they are conducted could be increased. It was also suggested that random inspections could be implemented more consistently across the year, as they currently seem to be carried out in waves.
As noted previously, some respondents suggested that targeted inspections should replace random (and annual) inspections to allow continuous monitoring of vehicles with previously identified safety issues and/or vehicles that appear to be poorly maintained and/or reaching retirement age. Targeted inspections would likely represent an improvement over random inspections which were thought to be inefficient and disruptive to current operations, particularly when conducted at locations such as the airport.
A4.7 COMFORT AND PRESENTATION OF THE TAXI AND HIRE CAR FLEET RELATED TO VEHICLE AGE
Respondents were asked to indicate the extent to which they agree/disagree with the statements ‘the age of the vehicle is related to how comfortable it is’ (See Figures A4.33 – A4.36) and ‘the age of the vehicle is related to how well it presents to customers’ (See Figures A4.37- A4.38).
Figure A4.33: Percent of taxi operators who agreed/disagreed that the age of the vehicle is related to how comfortable it is
SAFETY IMPLICATIONS OF TAXI AND HIRE CAR AGE LIMITS 175

Figure A4.34: Percent of hire car operators who agreed/disagreed that the age of the vehicle is related to how comfortable it is
Figure A4.35: Percent of stakeholders who agreed/disagreed that the age of the vehicle is related to how comfortable it is
176 MONASH UNIVERSITY ACCIDENT RESEARCH CENTRE

Figure A4.36: Percent of taxi/hire car customers who agreed/disagreed that the age of the vehicle is related to how comfortable it is
Figure A4:37 Percent of taxi operators who agreed/disagreed that the age of the vehicle is related to how comfortable it is
SAFETY IMPLICATIONS OF TAXI AND HIRE CAR AGE LIMITS 177

Figure A4.38: Percent of hire car operators who agreed/disagreed that the age of the vehicle is related to how comfortable it is
Figure A4.39: Percent of stakeholders who agreed/disagreed that the age of the vehicle is related to how comfortable it is
178 MONASH UNIVERSITY ACCIDENT RESEARCH CENTRE

Figure A4.40: Percent of taxi/hire car customers who agreed/disagreed that the age of the vehicle is related to how comfortable it is
Overall, vehicle age was deemed by most groups to be related to vehicle presentation but not to vehicle comfort.
Taxi and hire car operators and industry stakeholders were in general agreement that vehicle age does not impact on the level of comfort of the vehicle. Hire car respondents were slightly less polarised than others in their views on vehicle age and comfort, and taxi and hire car customers were more likely to agree that vehicle age does have an impact on comfort.
Hire car operators, taxi and hire car customers, and industry stakeholder groups were much more likely to agree than disagree that the age of the vehicle is related to how well it presents to customers. Hire car respondents were slightly less polarised than others in their views on vehicle age and presentation.
SAFETY IMPLICATIONS OF TAXI AND HIRE CAR AGE LIMITS 179