Embed Size (px)
Citation preview
9TH. INTERNATIONAL SYMPOSIUM ON FLOW VISUALIZATION, 2000
Paper number 259 259-1
RESEARCH ON THE SELF-INDUCED SLOSHINGPHENOMENA IN A RECTANGULAR TANK
Tetsuo SAGA, Hui HU, Toshio KOBAYASHI
Shigeki SEGAWA and Nobuyuki TANIGUCHI
Keywords: self-induced sloshing, vortex shedding, resonated oscillation, PIV technique
ABSTRACTThe flow patterns in a rectangular tank and the evolution of the vortex structures in the
rectangular tank when the self-induced sloshing phenomena occurring had been investigatedexperimentally by using Particle Imaging Velocimetry (PIV) technique. It was found that threedifferent flow patterns could be found in the test tank for the same system parameter setting, whichare reverse vortex flow pattern, first sloshing mode flow pattern and second sloshing mode flowpattern. The evolution of the vortical and turbulent structures in the test tank was found to be quitedifferent from each other for the three flow patterns. Based on the PIV measurement results, theresonated oscillation was suggested to be the mechanism of the self-induced sloshing phenomena.The fluctuation of the inlet jet and the periodically shedding of the unsteady vortices from the inletjet were conjectured to be the excitation source of the self-induced sloshing.
1. INTRODUCTION
Self-induced sloshing is a natural oscillation phenomenon that had been paid great attention bymany researchers in the fields of civil engineering, petroleum industry and nuclear energyengineering. For example, in the Liquid Metal Fast Breeder Reactor (LMFBR), which is one of themajor energy plants in the near future, the self-induced sloshing of the sodium coolant may occurin reactor vessels. Such kind of self-induced sloshing will result in very high thermal stresses onthe vessel walls, which may do severe damage to the vessel structures (Okamoto et al. 1998[1]).The fluid dynamic mechanism of the self-induced sloshing phenomena should be understoodclearly in order to have an optimum safety design of these reactor vessels to prevent the occurringof the self-induced sloshing of the high temperature sodium coolant in the reactor vessels. Since the first systemical study on the self-induced sloshing in a rectangular tank reported byOkamoto et al. (1991)[2], several investigations on the self-induced sloshing in a rectangular tankwith circulating flow had been conducted experimentally and numerically in the past ten years.Okamoto et al. (1993) [3] reported that the self-induced sloshing was found to occur in a certainregion of the flow rate and water level in a rectangular tank, and the frequency of the free surfacesloshing equaled to the eigenvalue of the water in the test tank. Based on the superposition of thesteady circulating flow in the test tank being represented by an ideal flow with a vortex, Madarame
Author(s): Institute of Industrial Science, University of Tokyo, 7-22-1 Roppongi,Minato-ku, Tokyo 106-8558, Japan
Corresponding author: Tetsuo SAGA or Hui HUEmail: [email protected] or [email protected]
Tetsuo SAGA, Hui HU, Toshio KOBAYASHI, Shigeki SEGAWA and Nobuyuki TANIGUCHI
259-29th International Symposium on Flow Visualization, Heriot-Watt University, Edinburgh, 2000Editors G M Carlomagno and I Grant.
et al. (1992) [4] proposed that the oscillation energy of the sloshing be supplied by pressurefluctuations caused by the interaction between the circulating flow and the sloshing motion. Fukayaet al. (1996) [5] reported that two kinds of sloshing mode were observed under the certaingeometrical condition of a rectangular tank, and proposed that the self-induced sloshing be causedby the interaction of the plane jet flow with the free surface. Numerical simulation of the self-induced sloshing was firstly carried out by Takizawa et al.(1992) [6]. They solved two-dimensional Navier-Stokes equations with Physical ComponentBoundary Fitted Coordinate (PCBFC) [7]. Based on the analyzing of their numerical result, theysuggested that the oscillation energy of the self-induced sloshing be supplied by the surfacepotential, which was varied by the secondary flow due to the flow circulating. The recent work ofSaeki et al.(1997, 1998) [8][9]used a Boundary Fitted Coordinate (BFC) method with heightfunction to conduct two-dimensional numerical simulation. They reported that their numericalresult agreed with an experiment result very well and also suggested that the self-induced sloshingwas mainly dependent on the inlet jet fluctuation. Although many important results had been got through these previous investigations, much workstill needs to be done to understand the fluid dynamic mechanism of the self-induced sloshing moreclearly. In the present study, a high-resolution PIV system was used to study the flow pattern in thefluid tank and to reveal the evolution of the vortical and the turbulent structures in the flow fieldwhen the self-induced sloshing phenomena is occurring. By using the instantaneous PIV velocityvector fields, time-average values and the phase-average results of the PIV measurement, thecharacteristics of the vortical and the turbulent structures in the test tank were studied, and then themechanism of the self-induced sloshing was suggested based on the PIV measurement results.
2 EXPERIMENT SETUP
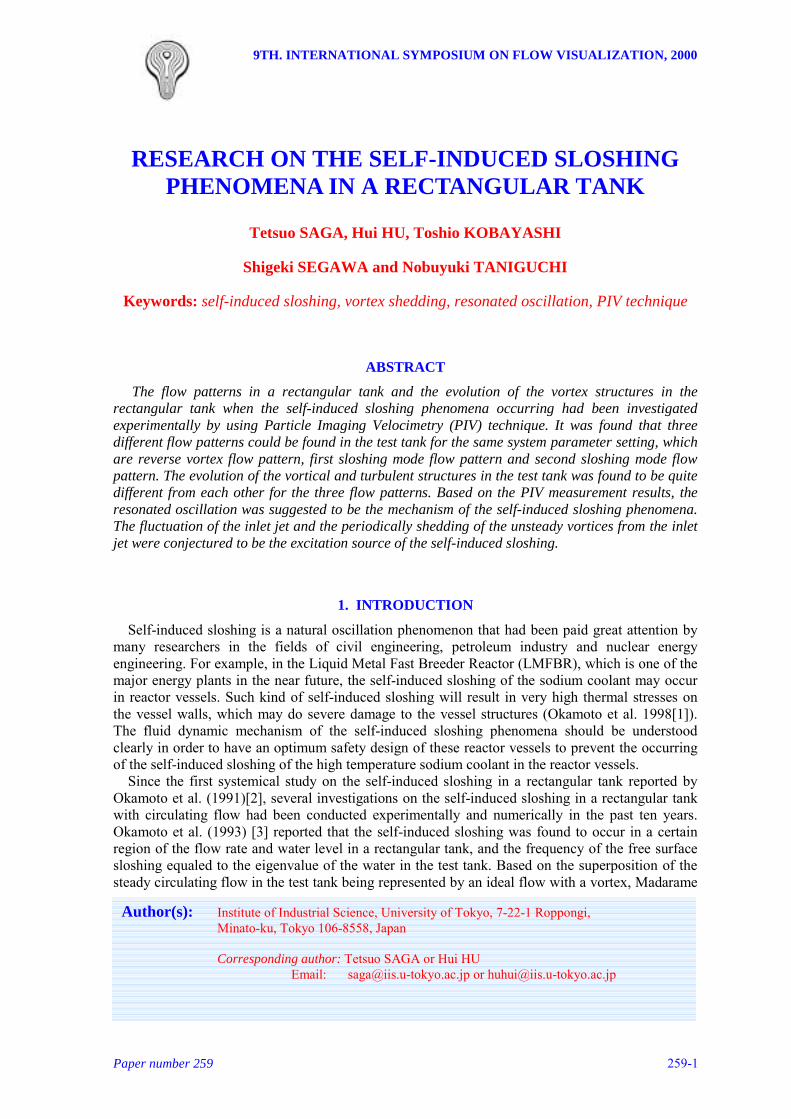
Figure 1 shows the experimental setup used in the present study. The flow in the test loop wassupplied from a head tank, which was continuously pump-filled from a lower tank. The water levelin the head tank was maintained in constant by an overflow system in order to eliminate the effectof the pump vibration on the inlet condition of the test tank. The flow rate of the loop, which wasused to calculate the representative velocity and Reynolds numbers, was measured by a flow meter.Honeycomb structures and a convergent section were installed in the upstream of the inlet of thetest tank to insure the uniform flow entrance. A valve was installed at the downstream of the testtank exit to adjust the water level of the free surface in the test tank.
PC computer
Synchronizer
cross-correlationCCD Camera
twin Nd:Yag lasers
laser sheet
overflow
pump
valve
flowmeter
honeycomb sturcture
test section
(RAM 1GB,HD 20GB)
(15Hz,20mJ/Pulse)
(1008 by 1018)
lower tank
head tank
Figure 1. The schematic of the experiment set-up
Research on the Self-induced Sloshing Phenomena in a Rectangular Tank
259-39th International Symposium on Flow Visualization, Heriot-Watt University, Edinburgh, 2000Editors G M Carlomagno and I Grant.
W=300mm
S=150mmE=60mm
T=50mm
H=160mm
free surface
L=110mm
Y
X
Z
inletb=20mm
outlet
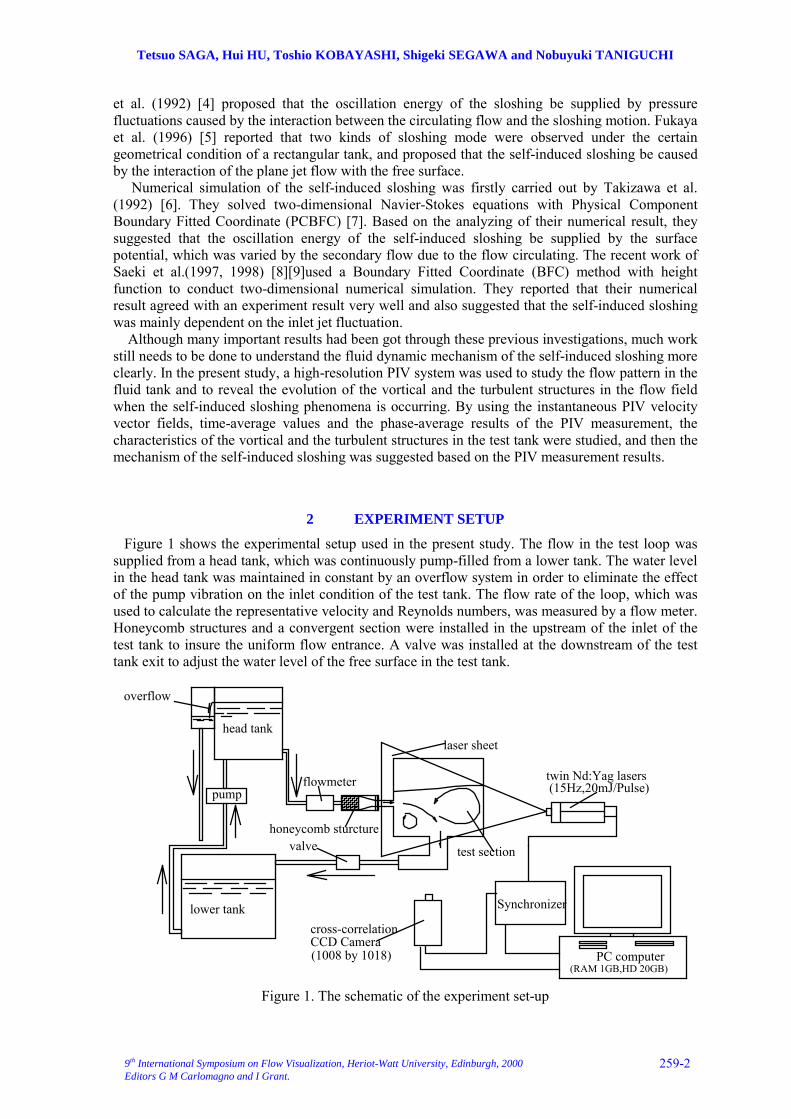
Figure 2. The schematic of the test tank
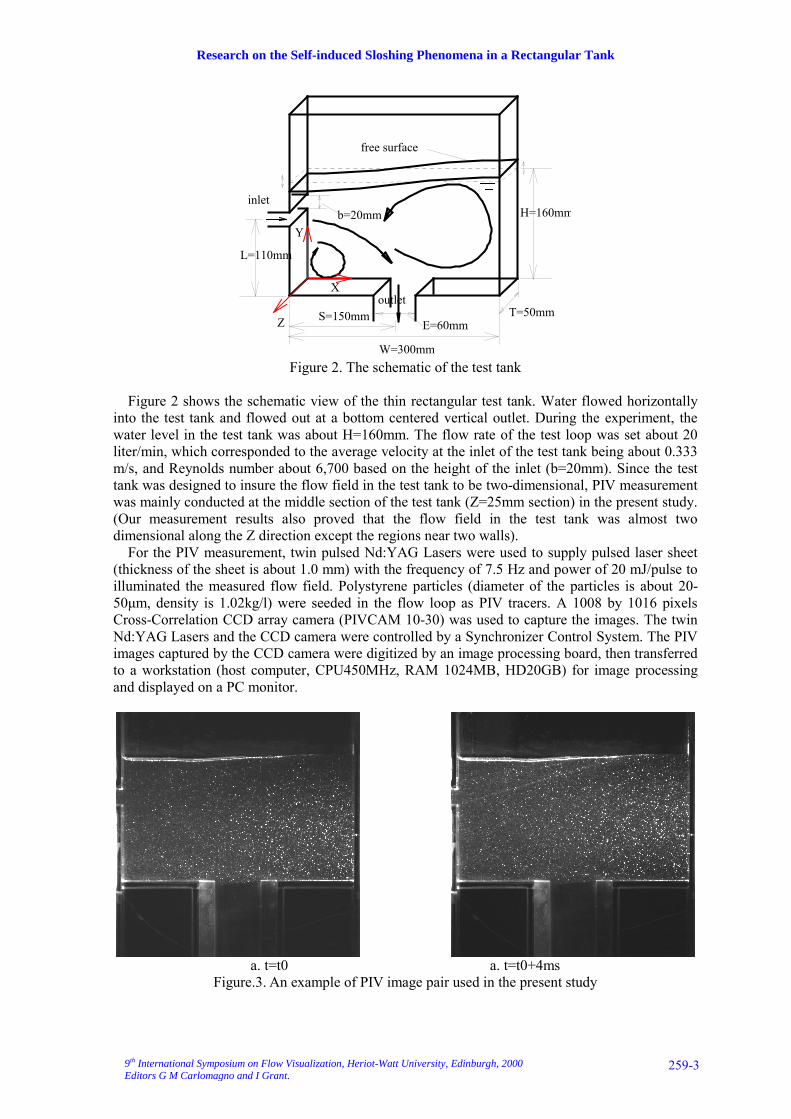
Figure 2 shows the schematic view of the thin rectangular test tank. Water flowed horizontallyinto the test tank and flowed out at a bottom centered vertical outlet. During the experiment, thewater level in the test tank was about H=160mm. The flow rate of the test loop was set about 20liter/min, which corresponded to the average velocity at the inlet of the test tank being about 0.333m/s, and Reynolds number about 6,700 based on the height of the inlet (b=20mm). Since the testtank was designed to insure the flow field in the test tank to be two-dimensional, PIV measurementwas mainly conducted at the middle section of the test tank (Z=25mm section) in the present study.(Our measurement results also proved that the flow field in the test tank was almost twodimensional along the Z direction except the regions near two walls). For the PIV measurement, twin pulsed Nd:YAG Lasers were used to supply pulsed laser sheet(thickness of the sheet is about 1.0 mm) with the frequency of 7.5 Hz and power of 20 mJ/pulse toilluminated the measured flow field. Polystyrene particles (diameter of the particles is about 20-50µm, density is 1.02kg/l) were seeded in the flow loop as PIV tracers. A 1008 by 1016 pixelsCross-Correlation CCD array camera (PIVCAM 10-30) was used to capture the images. The twinNd:YAG Lasers and the CCD camera were controlled by a Synchronizer Control System. The PIVimages captured by the CCD camera were digitized by an image processing board, then transferredto a workstation (host computer, CPU450MHz, RAM 1024MB, HD20GB) for image processingand displayed on a PC monitor.
a. t=t0 a. t=t0+4msFigure.3. An example of PIV image pair used in the present study
Tetsuo SAGA, Hui HU, Toshio KOBAYASHI, Shigeki SEGAWA and Nobuyuki TANIGUCHI
259-49th International Symposium on Flow Visualization, Heriot-Watt University, Edinburgh, 2000Editors G M Carlomagno and I Grant.
Rather than tracking individual particle, the cross correlation method [10] was used in the presentstudy to obtain the average displacement of the ensemble particles. The PIV images (Figure. 3)were divided into 32 by 32 pixel interrogation windows, and 50% overlap grids were employed forthe PIV image processing. The time interval between the two pulses was set at 4ms to have theaverage displacement of the tracer particles in the inlet jet is about 4 to 6 pixels. The post-processing procedures which including sub-pixel interpolation [11] and velocity outliner deletion[12] were used to improve the accuracy of the PIV result.
3. RESULTS AND DISCUSSIONS
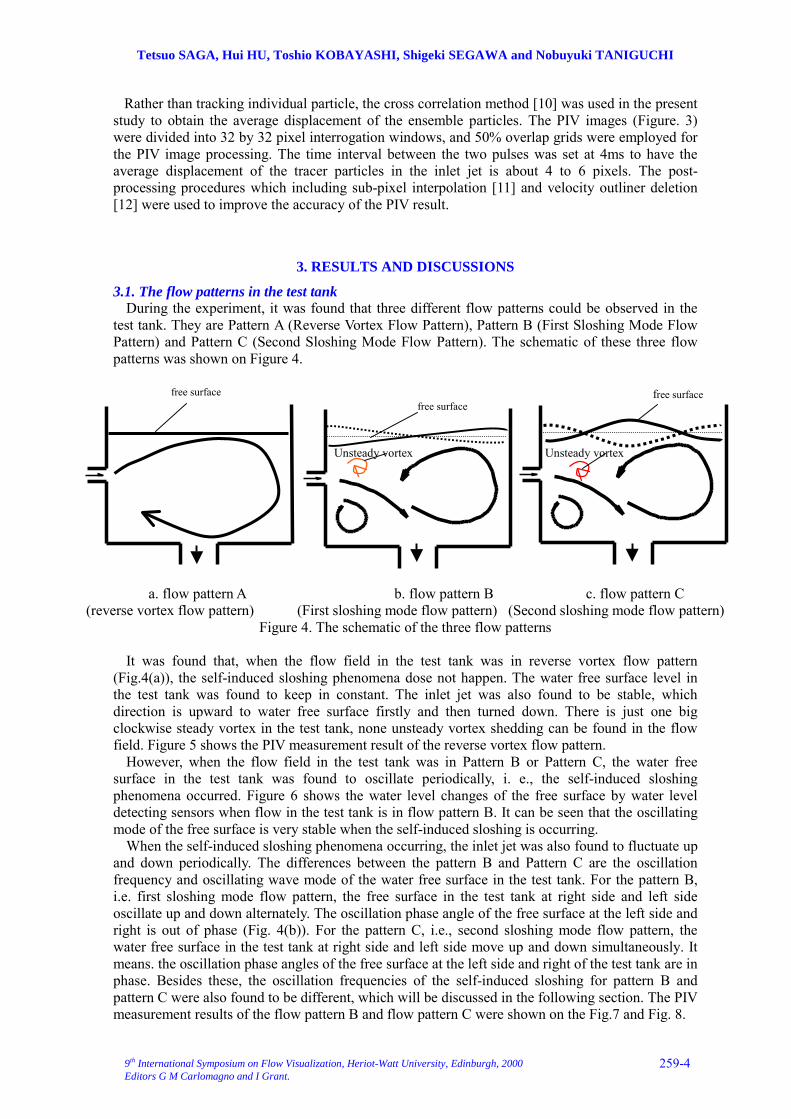
3.1. The flow patterns in the test tankDuring the experiment, it was found that three different flow patterns could be observed in the
test tank. They are Pattern A (Reverse Vortex Flow Pattern), Pattern B (First Sloshing Mode FlowPattern) and Pattern C (Second Sloshing Mode Flow Pattern). The schematic of these three flowpatterns was shown on Figure 4.
a. flow pattern A b. flow pattern B c. flow pattern C(reverse vortex flow pattern) (First sloshing mode flow pattern) (Second sloshing mode flow pattern)
Figure 4. The schematic of the three flow patterns
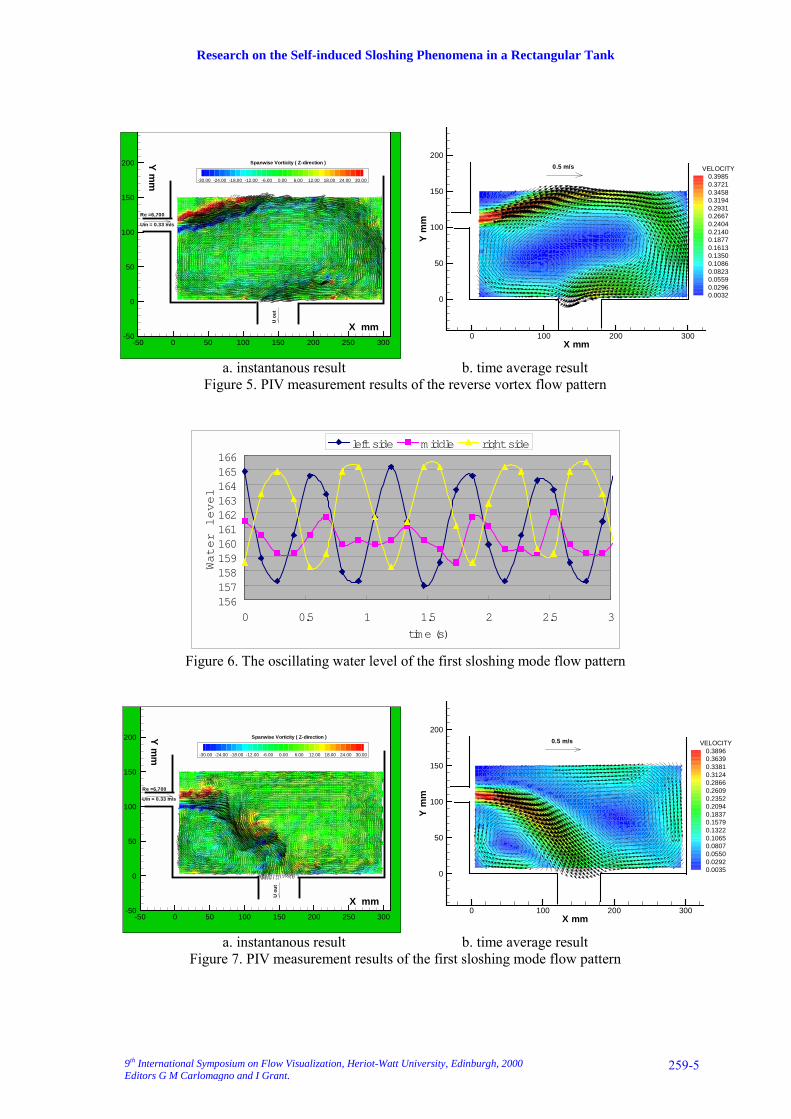
It was found that, when the flow field in the test tank was in reverse vortex flow pattern(Fig.4(a)), the self-induced sloshing phenomena dose not happen. The water free surface level inthe test tank was found to keep in constant. The inlet jet was also found to be stable, whichdirection is upward to water free surface firstly and then turned down. There is just one bigclockwise steady vortex in the test tank, none unsteady vortex shedding can be found in the flowfield. Figure 5 shows the PIV measurement result of the reverse vortex flow pattern.
However, when the flow field in the test tank was in Pattern B or Pattern C, the water freesurface in the test tank was found to oscillate periodically, i. e., the self-induced sloshingphenomena occurred. Figure 6 shows the water level changes of the free surface by water leveldetecting sensors when flow in the test tank is in flow pattern B. It can be seen that the oscillatingmode of the free surface is very stable when the self-induced sloshing is occurring.
When the self-induced sloshing phenomena occurring, the inlet jet was also found to fluctuate upand down periodically. The differences between the pattern B and Pattern C are the oscillationfrequency and oscillating wave mode of the water free surface in the test tank. For the pattern B,i.e. first sloshing mode flow pattern, the free surface in the test tank at right side and left sideoscillate up and down alternately. The oscillation phase angle of the free surface at the left side andright is out of phase (Fig. 4(b)). For the pattern C, i.e., second sloshing mode flow pattern, thewater free surface in the test tank at right side and left side move up and down simultaneously. Itmeans. the oscillation phase angles of the free surface at the left side and right of the test tank are inphase. Besides these, the oscillation frequencies of the self-induced sloshing for pattern B andpattern C were also found to be different, which will be discussed in the following section. The PIVmeasurement results of the flow pattern B and flow pattern C were shown on the Fig.7 and Fig. 8.
free surfacefree surface
free surface
Unsteady vortex Unsteady vortex
Research on the Self-induced Sloshing Phenomena in a Rectangular Tank
259-59th International Symposium on Flow Visualization, Heriot-Watt University, Edinburgh, 2000Editors G M Carlomagno and I Grant.
-50 0 50 100 150 200 250 300-50
0
50
100
150
200
-30.00 -24.00 -18.00 -12.00 -6.00 0.00 6.00 12.00 18.00 24.00 30.00
Spanwise Vorticity ( Z-direction )
Re =6,700
Uin = 0.33 m/s
X mm
Ym
m
Uou
t
0 100 200 300X mm
0
50
100
150
200
Ym
m
VELOCITY0.39850.37210.34580.31940.29310.26670.24040.21400.18770.16130.13500.10860.08230.05590.02960.0032
0.5 m/s
a. instantanous result b. time average resultFigure 5. PIV measurement results of the reverse vortex flow pattern
156157158159160161162163164165166
0 0.5 1 1.5 2 2.5 3time (s)
Water level
left side middle right side
Figure 6. The oscillating water level of the first sloshing mode flow pattern
-50 0 50 100 150 200 250 300-50
0
50
100
150
200
-30.00 -24.00 -18.00 -12.00 -6.00 0.00 6.00 12.00 18.00 24.00 30.00
Spanwise Vorticity ( Z-direction )
Re =6,700
Uin = 0.33 m/s
X mm
Ym
m
Uou
t
0 100 200 300X mm
0
50
100
150
200
Ym
m
VELOCITY0.38960.36390.33810.31240.28660.26090.23520.20940.18370.15790.13220.10650.08070.05500.02920.0035
0.5 m/s
a. instantanous result b. time average resultFigure 7. PIV measurement results of the first sloshing mode flow pattern
Tetsuo SAGA, Hui HU, Toshio KOBAYASHI, Shigeki SEGAWA and Nobuyuki TANIGUCHI
259-69th International Symposium on Flow Visualization, Heriot-Watt University, Edinburgh, 2000Editors G M Carlomagno and I Grant.
X (mm)
Y(m
m)
-50 0 50 100 150 200 250 300-50
0
50
100
150
200
250
-20.00 -15.00 -10.00 -5.00 0.00 5.00 10.00 15.00 20.00
Spanwise Vorticity (Z-direction)
Uin =0.333m/s
X mm
Ym
m
0 100 200 300
0
50
100
150
200
VELOCITY0.37990.35480.32970.30460.27950.25440.22930.20420.17910.15400.12890.10380.07870.05360.02850.0034
a. instantanous result b. time average result
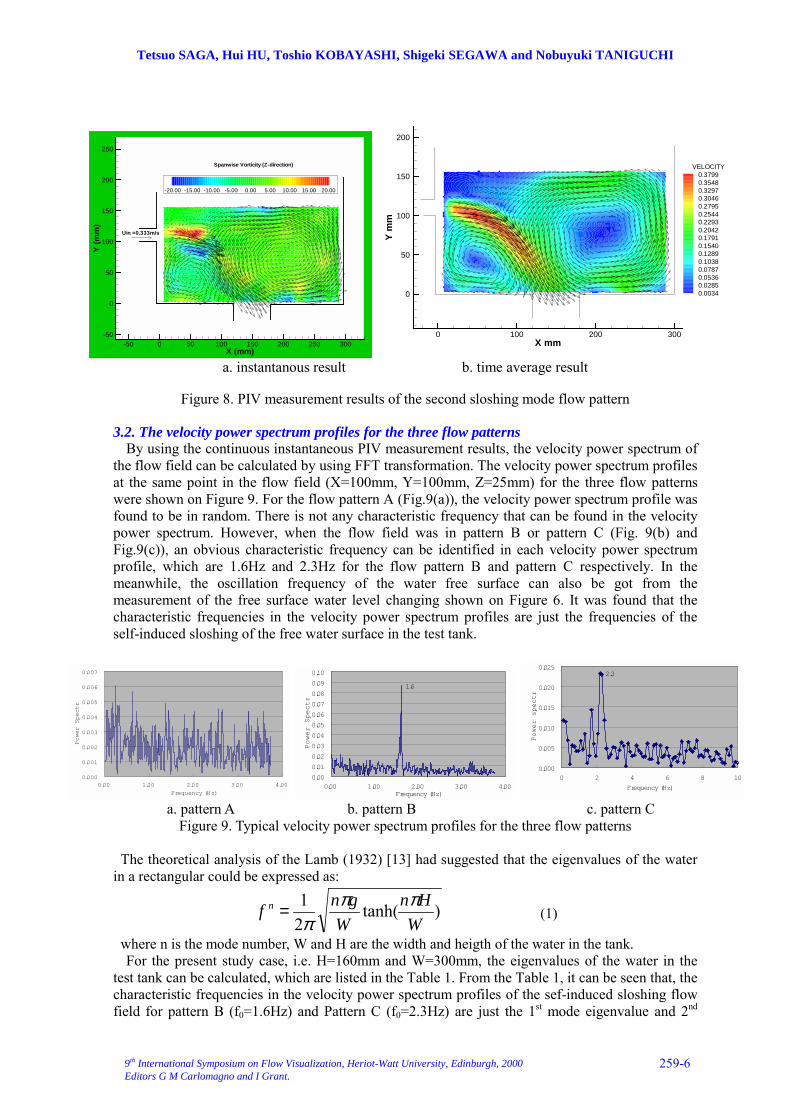
Figure 8. PIV measurement results of the second sloshing mode flow pattern
3.2. The velocity power spectrum profiles for the three flow patternsBy using the continuous instantaneous PIV measurement results, the velocity power spectrum of
the flow field can be calculated by using FFT transformation. The velocity power spectrum profilesat the same point in the flow field (X=100mm, Y=100mm, Z=25mm) for the three flow patternswere shown on Figure 9. For the flow pattern A (Fig.9(a)), the velocity power spectrum profile wasfound to be in random. There is not any characteristic frequency that can be found in the velocitypower spectrum. However, when the flow field was in pattern B or pattern C (Fig. 9(b) andFig.9(c)), an obvious characteristic frequency can be identified in each velocity power spectrumprofile, which are 1.6Hz and 2.3Hz for the flow pattern B and pattern C respectively. In themeanwhile, the oscillation frequency of the water free surface can also be got from themeasurement of the free surface water level changing shown on Figure 6. It was found that thecharacteristic frequencies in the velocity power spectrum profiles are just the frequencies of theself-induced sloshing of the free water surface in the test tank.
0.000
0.001
0.002
0.003
0.004
0.005
0.006
0.007
0.00 1.00 2.00 3.00 4.00Frequency (Hz)
Power Spectr
1.6
0.00
0.010.02
0.03
0.040.050.06
0.070.08
0.090.10
0.00 1.00 2.00 3.00 4.00Frequency (Hz)
Power Spectr
2.3
0.000
0.005
0.010
0.015
0.020
0.025
0 2 4 6 8 10Frequency (Hz)
Power spectr
a. pattern A b. pattern B c. pattern CFigure 9. Typical velocity power spectrum profiles for the three flow patterns
The theoretical analysis of the Lamb (1932) [13] had suggested that the eigenvalues of the waterin a rectangular could be expressed as:
)tanh(21
WHn
Wgnf n ππ
π= (1)
where n is the mode number, W and H are the width and heigth of the water in the tank.For the present study case, i.e. H=160mm and W=300mm, the eigenvalues of the water in the
test tank can be calculated, which are listed in the Table 1. From the Table 1, it can be seen that, thecharacteristic frequencies in the velocity power spectrum profiles of the sef-induced sloshing flowfield for pattern B (f0=1.6Hz) and Pattern C (f0=2.3Hz) are just the 1st mode eigenvalue and 2nd
Research on the Self-induced Sloshing Phenomena in a Rectangular Tank
259-79th International Symposium on Flow Visualization, Heriot-Watt University, Edinburgh, 2000Editors G M Carlomagno and I Grant.
mode eigenvalue of the water in the test tank. This is reason why the flow pattern B is called firstsloshing mode pattern and the pattern C is called second sloshing mode flow pattern in the presentpaper.
Table 1. the eigenvalues of the water in the test tankn-th mode Eigenvalues (Hz)
1 1.62 2.33 2.84 3.25 3.6
1. The evolution of the vortical structures in the test tank It can be found that the characteristics of the vortical and turbulent structures in the test tank arequite different from each other for the three flow patterns. For the flow reverse vortex flow patternA (Fig. 4(a)), just one big clockwise larger scale vortex can be found in the flow field as mentionedabove. However, when the flow was in pattern B or Pattern C, two counter rotating vortices can befound from the PIV time average results, which were at the right side and the left lower corner ofthe test tank. During the experiment, it was also found that when the flow was sloshing (pattern Bor pattern C), the inlet jet fluctuated up and down and some smalle scale unsteady vortices can alsobe found to shed from the inlet jet periodically.
-50 0 50 100 150 200 250 300-50
0
50
100
150
200-25.00 -20.00 -15.00 -10.00 -5.00 0.00 5.00 10.00 15.00 20.00 25.00
S panwis e Vorticity ( Z-direction )
Re =6,700
Uin = 0.33 m/s
X mmY
mm
Uou
t
water free surface
-50 0 50 100 150 200 250 300
-50
0
50
100
150
200-25.00 -20.00 -15.00 -10.00 -5.00 0.00 5.00 10.00 15.00 20.00 25.00
S panwis e Vorticity ( Z-direction )
Re =6,700
Uin = 0.33 m/s
X mm
Ym
m
Uou
t
water free surface
(a). situation 1 (θ=0) (b). situation 2 (θ=π/2)
-50 0 50 100 150 200 250 300-50
0
50
100
150
200-25.00 -20.00 -15.00 -10.00 -5.00 0.00 5.00 10.00 15.00 20.00 25.00
S panwis e Vorticity ( Z-direction )
Re =6,700
Uin = 0.33 m/s
X mm
Ym
m
Uou
t
water free surface
-50 0 50 100 150 200 250 300
-50
0
50
100
150
200-25.00 -20.00 -15.00 -10.00 -5.00 0.00 5.00 10.00 15.00 20.00 25.00
S panwis e Vorticity ( Z-direction )
Re =6,700
Uin = 0.33 m/s
X mm
Ym
m
Uou
t
water free surface
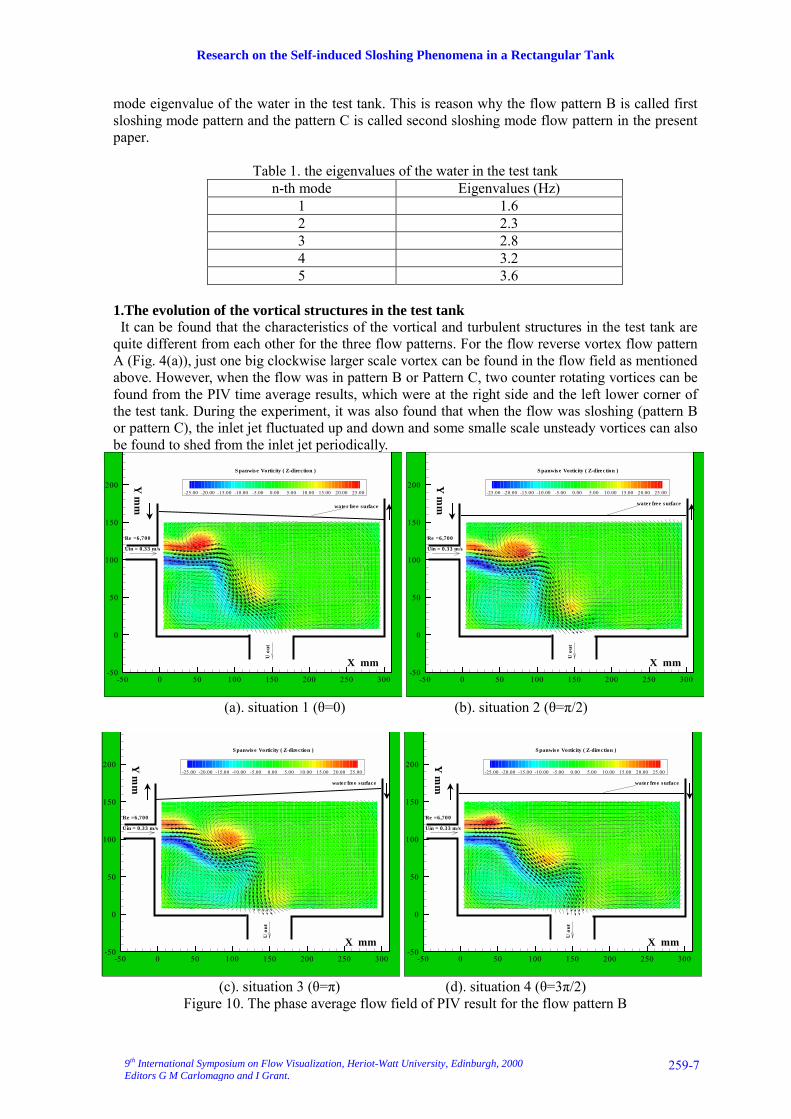
(c). situation 3 (θ=π) (d). situation 4 (θ=3π/2)Figure 10. The phase average flow field of PIV result for the flow pattern B
Tetsuo SAGA, Hui HU, Toshio KOBAYASHI, Shigeki SEGAWA and Nobuyuki TANIGUCHI
259-89th International Symposium on Flow Visualization, Heriot-Watt University, Edinburgh, 2000Editors G M Carlomagno and I Grant.
In order to investigate the relationship of the periodically shedding of the unsteady vortices andthe inlet jet fluctuation with the self-induced sloshing phenomena, the PIV phase averagemeasurement had also been conducted in the present study. During the PIV phase averagemeasurements, the water level of the free surface in the test tank was detected by a water levelsensor. The water level sensor can generate a signal to trig the synchronizer of the PIV systemwhen the free surface in the test tank arrive at the pre-set water level.
The phase average measurement results for the flow pattern B were shown on Figure 10. Thephase angles of these results are 0=θ , π/2,π and 3π/2. The water levels of the free surface at theleft side (inlet side) of the test tank were at its highest position, middle level (the free surface levelis decreasing), lowest position and middle level (the free surface level is increasing) correspondingto these four phase angles respectively.
Unlike the time average results, which can just reveal two steady vortices in the sloshing flowfield, the unsteady vortex can also be revealed clearly in the flow field from the phase averagemeasurement result. The unsteady vortex was found to change its position with the changing of thephase angle. When the phase angle increasing from 0 toπ, i.e., the free surface water level at the leftside of the test tank decreased from its highest position to its lowest position (from Fig.10(a),Fig.10(b) to Fig.10(c)); the unsteady vortex shed from the inlet jet and moved downstream. Whenthe phase angle increasing fromπto 2π, i.e, the free surface water level at the left side of the testtank began to increased from its lowerst position to its highest position (from Fig. 10(c), Fig. 10(d)to Fig. 10(a)), the unsteady vortex was engulfed by the large steady vortex at the right side of thetest tank, and another new vortex was found to roll up from the inlet of the test tank. Then, anothernew self-induced sloshing cycle began. As the phase angle changing, the inlet jet flow was alsofound to fluctuated up and down periodically.
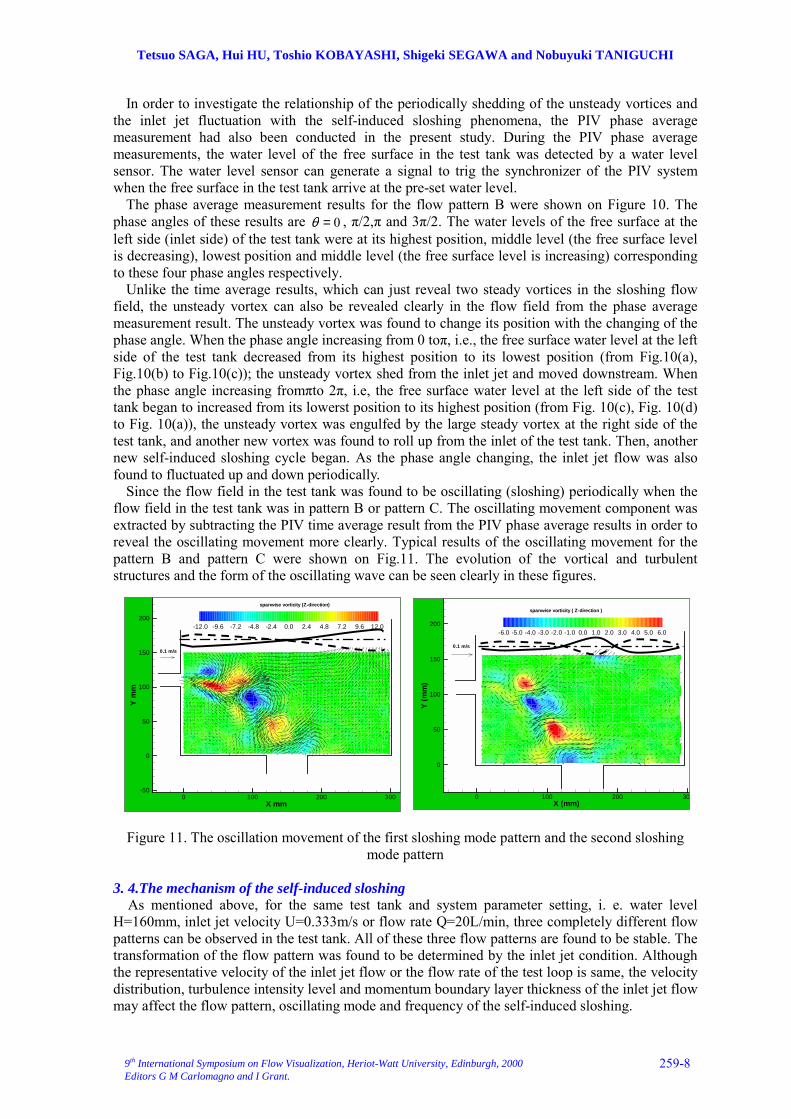
Since the flow field in the test tank was found to be oscillating (sloshing) periodically when theflow field in the test tank was in pattern B or pattern C. The oscillating movement component wasextracted by subtracting the PIV time average result from the PIV phase average results in order toreveal the oscillating movement more clearly. Typical results of the oscillating movement for thepattern B and pattern C were shown on Fig.11. The evolution of the vortical and turbulentstructures and the form of the oscillating wave can be seen clearly in these figures.
Figure 11. The oscillation movement of the first sloshing mode pattern and the second sloshingmode pattern
3. 4.The mechanism of the self-induced sloshing As mentioned above, for the same test tank and system parameter setting, i. e. water levelH=160mm, inlet jet velocity U=0.333m/s or flow rate Q=20L/min, three completely different flowpatterns can be observed in the test tank. All of these three flow patterns are found to be stable. Thetransformation of the flow pattern was found to be determined by the inlet jet condition. Althoughthe representative velocity of the inlet jet flow or the flow rate of the test loop is same, the velocitydistribution, turbulence intensity level and momentum boundary layer thickness of the inlet jet flowmay affect the flow pattern, oscillating mode and frequency of the self-induced sloshing.
X mm
Ym
m
0 100 200 300-50
0
50
100
150
200-12.0 -9.6 -7.2 -4.8 -2.4 0.0 2.4 4.8 7.2 9.6 12.0
0.1 m/s
spanwise vorticity (Z-direction)
X (mm)
Y(m
m)
0 100 200 30
0
50
100
150
200-6.0 -5.0 -4.0 -3.0 -2.0 -1.0 0.0 1.0 2.0 3.0 4.0 5.0 6.0
0.1 m/s
spanwise vorticity ( Z-direction )
Research on the Self-induced Sloshing Phenomena in a Rectangular Tank
259-99th International Symposium on Flow Visualization, Heriot-Watt University, Edinburgh, 2000Editors G M Carlomagno and I Grant.
From the above discussions, it can be seen that when the flow field in the test tank is sloshing,(pattern B and pattern C), the frequencies of the self-induced sloshing always equal to theeigenvalues of the water in the test tank. The same results were also found from the continousstudies of Okamaoto et al. [1-5][14]. These mean that the self-induced sloshing has a very closerelationship with the oscillation characteristics of the water in the test tank. So the resonatedoscillation may be suggested to be the mechanism for the self-induced sloshing. It was well known that there are two necessary factors for the resonated oscillation, which areexcitation source and frequency coupling of the excitation source with the eigenvalue of theoscillating body. From the above PIV measurement result, it can be seen that during the self-induced sloshing, the fluctuation of the inlet jet and the periodically shedding of the unsteadyvortex played a key role on the distribution of the vortical and turbulence structures in the test tank.The frequency of jet fluctuation and the perodically shedding of the unsteady vortex just equal tothe frequency of the self-induced sloshing (which means it can be coupled with the eigenvalue ofthe water in the test tank). So the inlet jet fluctuation and the periodical shedding of the unsteadyvortex may be suggested to be the excitation source of the resonated oscillation (self-inducedsloshing). In the meanwhile, it should be mentioned that the inlet jet fluctuation of the flow pattern B orPattern C has very similar characteristics to the well known phenomenon of �edged tone� [15].�Edged tone� phenomenon is also a self-sustained jet oscillation phenomenon and caused by theinteraction between the jet instability and the edge. So the relationship between the self-inducedsloshing and �edged tone� phenomenon will be studied in the future work.
4. CONCLUSIONThe self-induced sloshing in a rectangular tank was investigated experimentally by using PIV
technique. The instantaneous flow field, time averaged value and phase averaged result of the PIVmeasurement were used to investigate the evolution of vortical structures in the self-inducedsloshing flow field. Based on the experimental results, resonated oscillation was suggested to be themechanism of the self-induced sloshing. Periodic fluctuation of the inlet jet and the periodicallyshedding of the unsteady vortices from the inlet jet were conjectured to be the excitation source ofthe self-induced sloshing.
REFERENCE[1] Okamoto, K. and Madarame, H. "Fluid Dynamics of Free Surface in Liquid Metal Fast
Breeder Reactor", Progress in Nuclear Energy, Vol. 32, No.1/2, pp159-207, 1998[2] Okamoto, K., Madrarame, H. and Hagiwara, T. "Self-induced Oscillation of Free Surface in
a Tank with Circulating Flow ", C416/092, IMechE, p539-545, 1991[3] Okamoto, K., Fukaya, M. and Madarame, H., "Self-induced Sloshing Caused by Flow in a
Tank", PVP-Vol.258, Flow-Induced Vibration and Fluid-Structure Interaction,ASME,1993(a).
[4] Madarame, H., Okamoto, K. and Hagiwara, T. "Self-induced Sloshing in a Tank WithCirculating Flow", PVP-Vol.232, Fluid-Structure Vibrations and Sloshing, 1992.
[5] Fukaya, M. Madarame, H. and Okamoto, K., "Growth Mechanism of Self-Induced SloshingCaused by Jet in Rectangular Tank (2nd Report, Multimode Sloshing Caused by HorizontalRectangular Jet)" Trans. of JSME, (B), Vol.62, No.599. pp64-71, 1996.
[6] Takizawa, A and Kondo, S. "Mechanism and Condition of Flow Induced Sloshing of In-Vessel Circulated Free Surface flow " Proc. Int. Conf. On Nonlinear Mathematical Problemsin Industry, Iwaki, Japan. 1992a.
[7] Takizawa, A. Koshizuka, S and Kondo, S. "Generalization of Physical ComponentsBoundary Fitted Coordinate (PCBFC) Method for the Analysis of Free Surface Flow." Int. J.for Numerical Method in Fluids, Vol.15, pp1213-1237. 1992b
[8] Saeki, S., Madarame, H., Okamoto, K. and Tanaka, N., "Numerical Study on the self-induced Sloshing" FEDSM97-3401 ASME FED Summer Meeting, Vancouver, 1997
Tetsuo SAGA, Hui HU, Toshio KOBAYASHI, Shigeki SEGAWA and Nobuyuki TANIGUCHI
259-109th International Symposium on Flow Visualization, Heriot-Watt University, Edinburgh, 2000Editors G M Carlomagno and I Grant.
[9] Saeki, S., Madarame, H., Okamoto, K, and Tanaka, N., "Numerical Study on the GrowthMechanism of self-induced Sloshing Caused by Horizontal Plane Jet," FEDSM98-5208,ASME FED Summer Meeting, Washington DC, 1998
[10] Willert, C. E. and Gharib, M., "Digital Particle Image Velocimetry" Experiments in Fluids,Vol.l0, ppl8l-l99, 1991.
[11] Hu H., Saga, T., Kobayashi, T., Okamoto, K. and Taniguchi, N.," Evaluation of the CrossCorrelation Method by Using PIV Standard Images", Journal of Visualization, Vol.1, No.1,pp87-94, 1998.
[12] Westerweel, J. "Efficient Detection of Spurious Vectors in Particle Image VelocimetryData", Experiments In Fluids, Vol.16, pp236-247, 1994.
[13] Lamb H., �Hydrodynamics� Cambridge Univ. Press, pp363-366, 1932[14] Okamoto, K., Madrarame, H. and Fukaya, M. "Flow Pattern and Self-induced Oscillation in
a Thin Rectangular Tank with Free Surface", Journal of Faculty of Engineering, TheUniversity of Tokyo. Vol. XLII, No. 2, 1993(b).
[15] Rockwell and Naudascher, "Self-sustained Oscillation of Impinging Free Shear Layers",Ann. Rev. Fluid Mech. Vol.11, pp67-94, 1979.


![Light induced atomic desorption [LIAD ] and related phenomenacewqo08.phy.bg.ac.rs/UserFiles/File/prezentations/Moi.pdf · Light induced atomic desorption [LIAD ] and related phenomena](https://img.pdfslide.net/doc/110x75/5b7a05047f8b9a7f378ee486/light-induced-atomic-desorption-liad-and-related-light-induced-atomic-desorption.jpg)