Embed Size (px)
Citation preview
RESEARCH Open Access
A living cell quartz crystal microbalance biosensorfor continuous monitoring of cytotoxic responsesof macrophages to single-walled carbonnanotubesGang Wang1,2, Abiche H Dewilde1, Jianping Zhang1, Anoop Pal3, Malavika Vashist4, Dhimiter Bello3,Kenneth A Marx2†, Susan J Braunhut1*†, Joel M Therrien4†
Abstract
Background: Numerous engineered nanomaterials (ENMs) exist and new ENMs are being developed. A challengeto nanotoxicology and environmental health and safety is evaluating toxicity of ENMs before they become widelyutilized. Cellular assays remain the predominant test platform yet these methods are limited by using discrete timeendpoints and reliance on organic dyes, vulnerable to interference from ENMs. Label-free, continuous, rapidresponse systems with biologically meaningful endpoints are needed. We have developed a device to detect andmonitor in real time responses of living cells to ENMs. The device, a living cell quartz crystal microbalancebiosensor (QCMB), uses macrophages adherent to a quartz crystal. The communal response of macrophages totreatments is monitored continuously as changes in crystal oscillation frequency (Δf). We report the ability of thisQCMB to distinguish benign from toxic exposures and reveal unique kinetic information about cellular responses tovarying doses of single-walled carbon nanotubes (SWCNTs).
Results: We analyzed macrophage responses to additions of Zymosan A, polystyrene beads (PBs) (benignsubstances) or SWCNT (3-150 μg/ml) in the QCMB over 18 hrs. In parallel, toxicity was monitored over 24/48 hrsusing conventional viability assays and histological stains to detect apoptosis. In the QCMB, a stable unchangingoscillation frequency occurred when cells alone, Zymosan A alone, PBs alone or SWCNTs without cells at thehighest dose alone were used. With living cells in the QCMB, when Zymosan A, PBs or SWCNTs were added, asignificant decrease in frequency occurred from 1-6 hrs. For SWCNTs, this Δf was dose-dependent. From 6-18 hrs,benign substances or low dose SWCNT (3-30 μg/ml) treatments showed a reversal of the decrease of oscillationfrequency, returning to or exceeding pre-treatment levels. Cell recovery was confirmed in conventional assays. Thelag time to see the Δf reversal in QCMB plots was linearly SWCNT-dose dependent. Lastly, the frequency neverreversed at high dose SWCNT (100-150 μg/ml), and apoptosis/necrosis was documented in conventional 24 and 48hr-assays.
Conclusion: These data suggest that the new QCMB detects and provides unique information about peak, sub-lethal and toxic exposures of living cells to ENMs before they are detected using conventional cell assays.
* Correspondence: [email protected]† Contributed equally1Department of Biological Sciences, University of Massachusetts Lowell, OneUniversity Ave., Lowell, MA, 01854, USAFull list of author information is available at the end of the article
Wang et al. Particle and Fibre Toxicology 2011, 8:4http://www.particleandfibretoxicology.com/content/8/1/4
© 2011 Wang et al; licensee BioMed Central Ltd. This is an Open Access article distributed under the terms of the Creative CommonsAttribution License (http://creativecommons.org/licenses/by/2.0), which permits unrestricted use, distribution, and reproduction inany medium, provided the original work is properly cited.
BackgroundI. The challenge by nanotechnologies to nanotoxicologyis combinatorial in nature: the expansion and variety ofENMsCommercialization of ENMs is expanding quickly, withmore than 2400 different nanoproducts already in com-merce [1], outpacing our ability to conduct toxicologicalevaluations for human safety prior to large scale use ofENMs. Thus, there is a urgent need for the developmentof high-rate toxicity screening approaches [2,3]. At pre-sent, cellular assays remain the predominant toxicitytesting platform for ENMs [4]. Common to cellular testsystems is the use of various cell lines, single dosing at arange of concentrations and monitoring of a limited setof toxicological endpoints at discrete time intervals.Additionally, cellular testing relies heavily on organicdyes, labels and spectrophotometric techniques (ultra-violet or fluorescence measurements). Such protocolshave several technical drawbacks, including: i) interfer-ence of the label by ENMs via absorption of detectiondyes onto the large surface area of ENMs [5-8]; and ii)light scattering and/or quenching of fluorescence usedin detection in the assay by the ENMs. In addition thesetypes of protocols may be inadequate in detecting themechanism of ENM toxicity because: i) discrete moni-toring of toxic endpoints at particular time intervalsmay miss the recovery behavior of the community ofcells between those endpoints following initial perturba-tions; ii) these assays do not reveal kinetics of such per-turbations; iii) the monitored toxic endpoints may notinclude all mechanistic pathways leading to cellular toxi-city; and iv) repeated ENMs dosimetry on cells is rarelydone, missing a critical aspect of human exposure. Evi-dence is slowly accumulating that exposures to ENMsoccur during different stages of production, handling,processing, and use of nanoproducts. Development oftest systems capable of monitoring continuously and inreal time communal behavior of cells over hrs to daysusing biologically-relevant global, label-free endpointswould alleviate several limitations of current cellulartesting protocols.Measurement in real-time of multiple physicochemical
parameters implicated in ENMs toxicity is, at best, chal-lenging, and often impractical. At present, the linksbetween an ENM’s physicochemical parameters and itstoxicity are poorly understood and, therefore, it is notpossible yet to predict ENM toxicity from the aggregateof these data. For these reasons, characterization ofexposures to ENMs, especially as related to humanhealth and the environment, and interpretation of theirtoxicological relevance, remains a major challenge.Expert panels have called for innovative approaches andtechnologies to tackle this complex problem [9,10].
Alternatively, biologically-relevant metrics, responsive tomultiple key parameters involved in ENM toxicity, mayprovide an opportunity to screen for the inherent toxi-city potential of ENMs and be adopted as novel ENMspecific exposure metrics, providing a much needed linkbetween common toxicological test systems (cells, ani-mals) and human exposures. We believe that the livingcell-based quartz crystal microbalance biosensor(QCMB) described below possesses unique technologicalfeatures to fulfill the requirements described above andoffers a great potential to serve the needs posed bynanotechnologies- the need for high rate toxicity screen-ing and novel exposure dosimetry for human and envir-onmental health studies.
II. The Quartz Crystal Microbalance (QCM) as a live cellbiosensorFor decades, piezoelectric quartz systems have beenused in analytical chemistry because their oscillating fre-quency value, which can vary across the megahertz[(MHz), 106 cycles/sec] range, is sensitive and directlyproportional to the crystal mass. Adding mass to thecrystal lowers the oscillation frequency and decreasingmass raises it. This mass sensing ability has resulted inthe creation of a nanogram mass sensing device knownas the quartz crystal microbalance (QCM). Since theoscillating crystal detects any mass coupled to its sur-face, it has been widely used as a label-free signal trans-duction platform for a variety of chemical sensor andbiosensor designs [11,12]. A number of more recentreviews of this platform have appeared in the applica-tion areas of drug discovery [13], clinical diagnostics[14], biochemical and cellular processes [15] and chemi-cal biosensors [16-18]. More recently, cell based biosen-sors have been developed. In these devices, living cellsare attached to the gold surface of the quartz crystaland serve as the sensing element, where cellular massand viscoelastic properties affect the oscillation fre-quency of the crystal. Cells as the sensing element havethe advantage that they possess a wide range of intelli-gent system properties resulting from the interplay oftheir integral membrane receptor-cytoskeletal-nuclearmembrane systems to alter their mass distribution orviscoelastic properties due to external (i.e. cytokines,chemotactic agents, toxins, pathogens, chemical signals,pH or ionic alterations) or internal (i.e. DNA damage,mitochondria activity, cell polarity, new gene expres-sion) signals. Thus, cells can detect a wide variety ofchanges in their environment, from individual molecules(traditional ‘linear’ biosensors) to more complex altera-tions (smart biosensors). These intelligent propertiescan be exploited when cells are used as biosensor detec-tion elements.
Wang et al. Particle and Fibre Toxicology 2011, 8:4http://www.particleandfibretoxicology.com/content/8/1/4
Page 2 of 17
In a series of studies developing cell based biosensors,we have demonstrated that cell attachment to an oscil-lating crystal could be studied to detect novel cell-cellcooperativity during the earliest stages establishing thecell based biosensor through cell coupling to the crystalsurface [19-23]. Once formed, the cell based biosensorrepresented by a monolayer of cells attached to the crys-tal can detect cytokine initiated mitosis before any otherconventional method [19]. Small molecules that affectspecific aspects of the cells’ cytoskeleton can be ana-lyzed. Taxol and nocodazole, drugs that bind microtu-bules and hyperstabilize them vs. dissociate them,respectively, have opposite effects on the crystal oscilla-tion frequency when using a cell based sensor [21-23].We showed the nocodazole effect in the biosensorexhibited the log [effect] vs. dose response behavior of atypical drug with a midpoint of 0.9 μM. Thus, the bio-sensor was shown to be able to function as a drug dis-covery and characterization device. Advantages of livecell biosensors are that they can be used as continuousmonitoring devices and can detect cumulative effectsfrom low dose toxins. The other advantage of a biosen-sor technology in the evaluation of environmental expo-sures to ENMs is that it measures a direct effect of thenanomaterial on living cells and avoids the complica-tions that ENMs may interfere with assays by disruptingor binding to assay reagents, may prevent or compro-mise the readout, or contaminant the equipment usedfor assays [5]. The output is gathered continuously andis automated so brief transient exposures are detectedand the kinetics of cell stress and recovery can be mea-sured. In this report, we describe experiments thatdemonstrate the ability of live cell based biosensors todetect and provide unique temporal response data fol-lowing living cell exposures to single-walled carbonnanotubes (SWCNTs).
MethodsCell lines and culturing conditionsThe DH82 macrophage cell line was obtained fromAmerican Type Tissue Culture Collection (ATCC, Man-assas, VA) and stock cultures were established andgrown in media recommended by the manufacturers, at37°C in a humidity controlled incubator with 5% CO2,unless otherwise noted. The media used was Eagle’sMinimum Essential Medium (ATCC, Manassas, VA)supplemented with 15% heat-inactivated fetal bovineserum (FBS; Invitrogen, Carlsbad, CA), 200 mM L- Glu-tamine, 10 K IU Penicillin, 10 K mg/ml StreptomycinSulfate (GPS Sigma, Saint Louis MOMO), and Ampho-tericin B (FGZ; Lonza, Basel, Switzerland). The macro-phages were grown in 75 cm2 rectangular canted neckcell culture flasks with vented caps (Corning Life
Science, Lowell, MA), and re-fed every three days andpassaged at least once a week in stock cultures.
Phagocytic studiesPhagocytosis using living macrophages was analyzedusing 3 μm diameter Zymosan A (S. cerevisiae) BioParti-cles®, Alexa Fluor® 488 conjugate (Invitrogen, Carlsbad,CA) or 0.8 μm polystyrene beads (Sigma, Saint LouisMO) vs. SWCNTs. Polystyrene microparticles are nega-tively charged stabilized colloidal particles. Source andcharacterization of SWCNTs is described below.For phagocytic experiments, cells were trypsinized
from stock flasks with 0.05% trypsin with EDTA (Invi-trogen, Carlsbad, CA) and plated into either 8-well Lab-Tek™ II slide chambers (Nalge Nunc International,Rochester, NY), or into at least three QCM devices atequivalent cell densities (growth areas for Lab-Teks™was 0.7 cm2/Well vs. growth area for QCM which was0.4 cm2/Well. Cells were plated at 9.3 × 10⁴ cells/Lab-Tek chamber; and into each QCM as 5.0 × 10⁴ cells/QCM device. Cells were then allowed to attach for24 hours at 37°C in a humidity controlled incubatorwith 5% CO2.After the 24 hr attachment period, duplicate Lab-
Tek™ control wells or QCM wells were trypsinized todetermine attachment frequency. Cells were counted inthe overlaid media, a PBS wash and three consecutivetrypsin cell removal steps. The standard of practice isthat only when an 80% or greater attachment efficiencywas obtained were QCM devices or Labteks used forexperiments. The cell counts were also used to calculatea correct particle or bead concentration. For the Zymo-san A experiments, a 1:100 cell to particles concentra-tion was used. For example, approximately 7.44 × 10⁶
beads (1:100) were added to 74,400 cells based on an80% attachment efficiency from 9.3 × 10⁴ plated cells inLABTEK experiments. For polystyrene bead experi-ments, a 1:100 cell to polystyrene beads concentrationwas used. These ratios were per manufacturer’s recom-mendations and ideal for stimulating phagocytosis bymacrophages and for photomicroscopy following cellingestion. The remaining wells and QCM devices hadmedia changed and the devices were then moved toroom temperature and open ambient air to simulatemore natural environmental monitoring conditions suchas in a manufacturing or usage setting. For QCMexperiments, after the attachment period and cell count-ing of a QCM device, the remaining QCMs moved toroom temperature and open ambient air were connectedto the automated computer data collection and crystaloscillator. Base line QCM traces were established for thenext two hours and only if a stable frequency wasobserved, were QCM experiments continued. At least
Wang et al. Particle and Fibre Toxicology 2011, 8:4http://www.particleandfibretoxicology.com/content/8/1/4
Page 3 of 17
two QCM devices were run in parallel, a treatmentQCM and at least one cell-containing QCM as an envir-onmental baseline control response trace for the next18 hrs. In some cases, additional QCMs with mediawere prepared in parallel without cells and were treatedwith either the highest dose of SWCNT alone, or withZymosan A alone, or with polystyrene beads alone.These served as controls over the same time period asQCM cell experiments.Cells in Lab-Tek™s were examined using phase
microscopy and photographed at various times andfixed or stained as described below. At the end of allQCM experiments, cells numbers in the QCM weredetermined in the spent media, a PBS wash and in twoto three consecutive trypsin cell removals using non-SWCNT treated QCM devices. This could only be donewith non-SWCNT containing wells so as not to contam-inate cell-counting equipment and other lab devices.These cell numbers were compared to the time zero cellnumbers to detect loss of cells over the time course.This procedure and the gold QCM surface-cleaning pro-cedure with successive PBS, water, ethanol and otherwashes were used to remove all residual extracellularmatrix and cell debris, in order to regenerate the surfacefor the next experiment, and have been previouslydescribed by us [22,23].
Fixation and staining of cellsFor immunohistology, cells in Lab-Teks™ were firstfixed by adding an equal volume of 4% paraformalde-hyde (Electron Microscopy Sciences, Hatfield, PA) inPBS to the well containing media (in a 1:1 volumetricequivalent) for 10-15 min at room temperature. Thecells were then fixed using 4% paraformaldehyde again,and then rinsed with PBS. The cells were then dualstained with a cytoplasmic stain, Lava Cell (Activemotif,Carlsbad, CA) and a DNA stain, 4’,6-diamidino-2-phe-nylindole (DAPI). DAPI staining was performed byremoving the PBS and replacing it with a 0.2 μg/mlsolution of DAPI in methanol and incubating the cellsat RT for 30 min. The cells were then rinsed with PBS,and the 24 μM Lava Cell in PBS was applied for 30 minRT. The cells were then rinsed with PBS; air dried,mounted with ProLong® Gold (Invitrogen, Carlsbad,CA) and a cover slip applied. Images were obtainedusing fluorescence microscopy (Olympus, Center Valley,PA). Mitotic, apoptotic and interphase DNA morphol-ogy could be seen by DAPI as previously reported by us[24,25]. The DAPI images were taken using an excita-tion wavelength filter of 350 nm and the Lava Cellimages were taken using an excitation wavelength filterof 534 nm. For the Zymosan A treated cells, the Zymo-san A is viewed using an excitation wavelength filter of480 nm.
Photomicroscopy of SWCNTs inside live and fixed cellsFor the SWCNT treated cells, a bright field image wastaken. The image was then manipulated with AdobePhotoshop to render the SWCNT green. First the contrast& brightness was set for all images to 44, then imageswere inverted and the threshold adjusted to 128 to removethe artifact of cell membranes. Color was added by chan-ging the hue and saturation. In the colorize mode, the huewas adjusted to 137, saturation to 77 and light to -50. Tocreate a composite, the three images obtained (DAPI,Lava, SWCNT) were overlaid using DP manager ver-sion.3.1 software (Olympus, Center Valley, PA).
SWCNTsSWCNTs used in this study were purchased from CheapTubes Inc., (Brattleborough, VT, USA). These SWCNTswere synthesized via combustion chemical vapor deposi-tion technique (CCVD) and were reported to have >90%wt purity. The preparation was reported to have >5%wtof co-produced multi-walled CNTs and >3%wt of amor-phous carbon content as impurities.
Physicochemical characterization of SWCNTsThe physicochemical characterization of SWCNTs aresummarized in Table 1. The properties of the SWCNTsinclude: specific surface area by BET (Brunauer,Emmett, and Teller N2 adsorption method); total andwater soluble fractions of a panel of most importanttransition metals (i.e. Fe, Cr, Co, Ni, Mo, Mn,) deter-mined using microwave-assisted acid digestion and ICP-MS based on the EPA 3051A method; organic carboncontent was determined using a surrogate measure oforganic material and the OC/EC ratio based on a modi-fied NIOSH method 5040; surface charge in PBS saline;crystallinity by XRD, and morphology by TEM (Figure 1)described below. The polycyclic aromatic hydrocarbon(PAH) content of these SWCNTs was determined withthe EPA Method 3546 (microwave extraction) andmethod 8276 (GC-MS). Additionally, we measured thebiological oxidant damage potential and generation ofreactive oxygen species (ROS) using the Ferric ReducingAbility of Serum (FRAS) [26] and using the modifiedDCFH assay [27].The SWCNTs had high concentrations (μg/g) of Co
(1798), Mo (1672), Fe (741) and Cr (476), and smallamounts of Ni (67) and Mn [25]. The water solublefractions of these metals were negligible (Table 1). Thediffraction pattern (XRD) was consistent with its pri-mary particle size, chemical composition, and puritylevels from other analyses and Co was present in theXRD spectrum. The sample had 19.4 ppm (2.1%) oforganic carbon. In addition, the SWCNTs used werefound to have quantifiable levels of two PAHs (ppb):fluorene (95) and phenanthrene (189) with all other
Wang et al. Particle and Fibre Toxicology 2011, 8:4http://www.particleandfibretoxicology.com/content/8/1/4
Page 4 of 17
congeners being below the method limit of detection[28]. The SWCNTs were also found to have a significantoxidative damage potential in human blood serum-among the highest values tested in this assay for differ-ent classes of ENMs: 1,376 trolox equivalent units(TEUs, μmol L-1)/10 mg under the assay conditions,equivalent to 136.7 TEUs (μMol)/mg or 2.70 TEUs/m2.The SWCNTs were found to induce significant ROSgeneration in the DCFH assay as well, equal to 1812.8(μM H2O2 eq./m
2) at 0.3 mg/mL.
Dispersion of SWCNTsDispersion of SWCNT solution for cellular testingwas prepared in the actual culture medium to avoid
possible re-agglomeration when stock dispersions ofSWCNTs were spiked into the culture medium of adifferent composition. Dispersion of a stock solutionof 1 mg/mL SWCNTs was based on a modificationof published protocols (18-20), and involved using1% BSA/Eagle ’s minimum essential medium andprobe sonication for 10 min with 30 sec cycle at 30%amplitude (~200 W), while maintaining the scintilla-tion vial in ice at all times. Dispersion efficiency wasevaluated with Dynamic Light Scattering (DLS-Zeta-sizer, Malvern Instruments) and parameters of iso-lated SWCNTs were found to have a mean effectivehydrodynamic diameter in solution of 371.5 nm(Table 1).
Table 1 Physicochemical characterization of SWCNTs
SWCNT_L (Long Single-Wall CNTs)
Primary particle size Outer Diameter = 1-2 nm Length = 5-30 μm Organic Carbon (OC, μg g-1) 19.4
Specific Surface Area (m2g-1) 510.50 Elemental Carbon (EC, μg g-1) 921.7
XRD spectra Co [15-0806] present in the spectrum, consistent withthe material description.
Organic Carbon/Total Carbon 0.021
Dispersion efficiency in solution by DLS Transition metals (ug/g, ppm)
Total Water soluble
Zeta Potential(mV) -10.39 Cr 476 <0.1
Effective Particle Size (nm) 371.50 Co 1798 1.1
Mo 1672 31
Electrophoretic Mobility (μm/s)/(V/cm) -0.814 Mn 25.3 0.1
Zn 4.1 1.3
Polydispersity Index 0.47 Ni 67.3 <0.1
Fe 741 <0.6
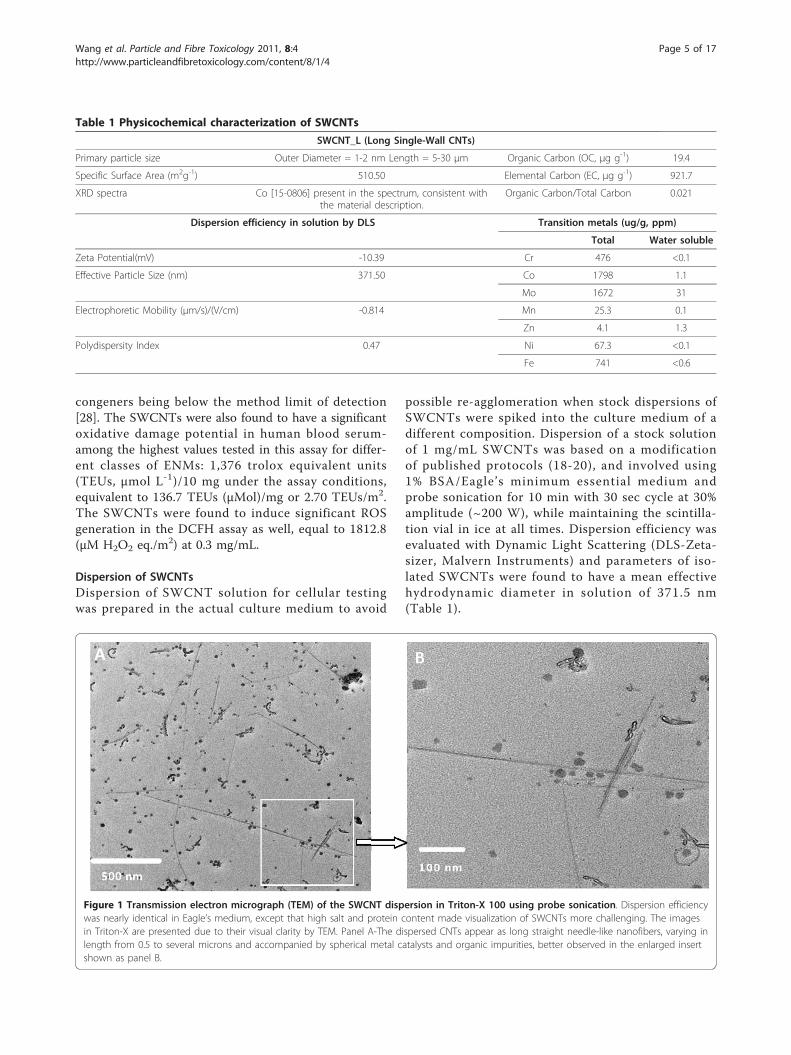
Figure 1 Transmission electron micrograph (TEM) of the SWCNT dispersion in Triton-X 100 using probe sonication. Dispersion efficiencywas nearly identical in Eagle’s medium, except that high salt and protein content made visualization of SWCNTs more challenging. The imagesin Triton-X are presented due to their visual clarity by TEM. Panel A-The dispersed CNTs appear as long straight needle-like nanofibers, varying inlength from 0.5 to several microns and accompanied by spherical metal catalysts and organic impurities, better observed in the enlarged insertshown as panel B.
Wang et al. Particle and Fibre Toxicology 2011, 8:4http://www.particleandfibretoxicology.com/content/8/1/4
Page 5 of 17
SWCNT Transmission Electron MicroscopicCharacterizationThe morphology of raw SWCNTs in the dispersions wasevaluated using transmission electron microscopy on aPhilips EM 400T for particle size and morphology [29].Representative images in Triton-X 100 dispersion med-ium are shown (Figure 1). Dispersion efficiency ofSWCNTs was nearly identical in both Triton-X andEagles’ media, a property confirmed with DLS measure-ments. However, the images of SWCNTs are muchclearer in Triton-X due to lack of salts and proteins.The dispersed CNTs appear as long straight needle-likenanofibers varying in length between 0.5 to severalmicrons (Figure 1). The insert image (Figure 1B) showsa magnified view of a single strand of SWCNT, sur-rounded by metal impurities. The length of CNTs isshorter than the vendor’s specifications (5-30 μm) andour own measurements suggest fracturing of longSWCNT fibers during probe sonication.
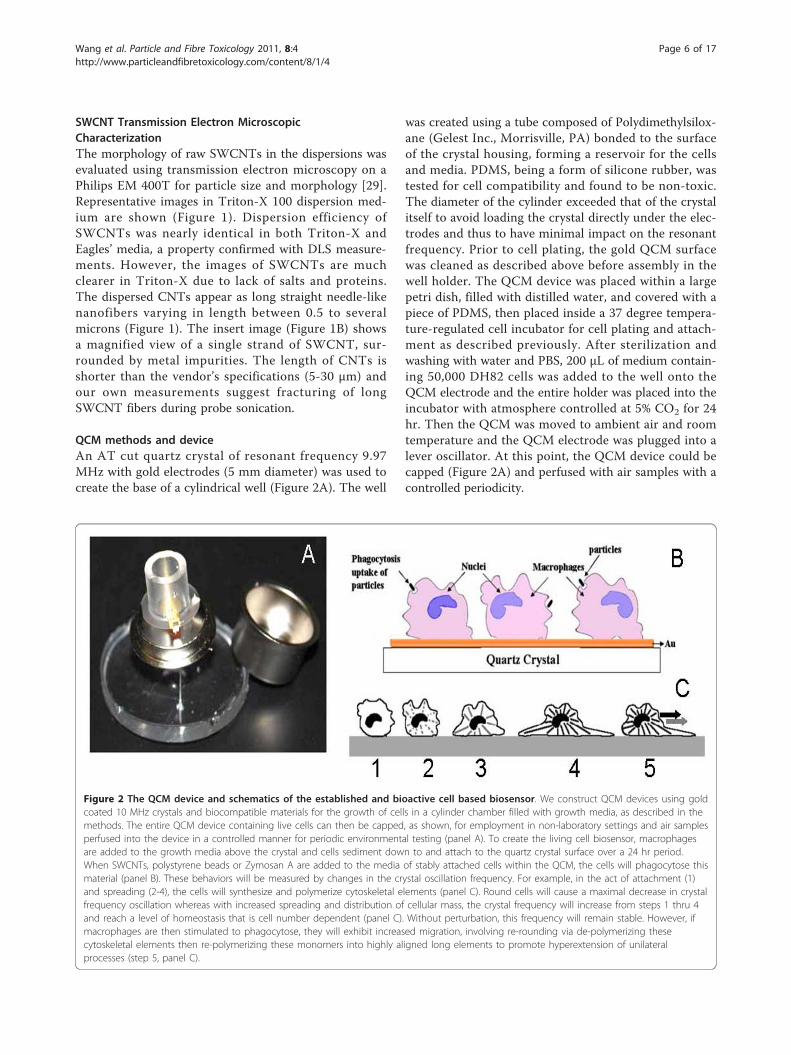
QCM methods and deviceAn AT cut quartz crystal of resonant frequency 9.97MHz with gold electrodes (5 mm diameter) was used tocreate the base of a cylindrical well (Figure 2A). The well
was created using a tube composed of Polydimethylsilox-ane (Gelest Inc., Morrisville, PA) bonded to the surfaceof the crystal housing, forming a reservoir for the cellsand media. PDMS, being a form of silicone rubber, wastested for cell compatibility and found to be non-toxic.The diameter of the cylinder exceeded that of the crystalitself to avoid loading the crystal directly under the elec-trodes and thus to have minimal impact on the resonantfrequency. Prior to cell plating, the gold QCM surfacewas cleaned as described above before assembly in thewell holder. The QCM device was placed within a largepetri dish, filled with distilled water, and covered with apiece of PDMS, then placed inside a 37 degree tempera-ture-regulated cell incubator for cell plating and attach-ment as described previously. After sterilization andwashing with water and PBS, 200 μL of medium contain-ing 50,000 DH82 cells was added to the well onto theQCM electrode and the entire holder was placed into theincubator with atmosphere controlled at 5% CO2 for 24hr. Then the QCM was moved to ambient air and roomtemperature and the QCM electrode was plugged into alever oscillator. At this point, the QCM device could becapped (Figure 2A) and perfused with air samples with acontrolled periodicity.
Figure 2 The QCM device and schematics of the established and bioactive cell based biosensor. We construct QCM devices using goldcoated 10 MHz crystals and biocompatible materials for the growth of cells in a cylinder chamber filled with growth media, as described in themethods. The entire QCM device containing live cells can then be capped, as shown, for employment in non-laboratory settings and air samplesperfused into the device in a controlled manner for periodic environmental testing (panel A). To create the living cell biosensor, macrophagesare added to the growth media above the crystal and cells sediment down to and attach to the quartz crystal surface over a 24 hr period.When SWCNTs, polystyrene beads or Zymosan A are added to the media of stably attached cells within the QCM, the cells will phagocytose thismaterial (panel B). These behaviors will be measured by changes in the crystal oscillation frequency. For example, in the act of attachment (1)and spreading (2-4), the cells will synthesize and polymerize cytoskeletal elements (panel C). Round cells will cause a maximal decrease in crystalfrequency oscillation whereas with increased spreading and distribution of cellular mass, the crystal frequency will increase from steps 1 thru 4and reach a level of homeostasis that is cell number dependent (panel C). Without perturbation, this frequency will remain stable. However, ifmacrophages are then stimulated to phagocytose, they will exhibit increased migration, involving re-rounding via de-polymerizing thesecytoskeletal elements then re-polymerizing these monomers into highly aligned long elements to promote hyperextension of unilateralprocesses (step 5, panel C).
Wang et al. Particle and Fibre Toxicology 2011, 8:4http://www.particleandfibretoxicology.com/content/8/1/4
Page 6 of 17
A Tektronix TDS 2012B two channel digital storageoscilloscope (Tektronix) and lever oscillator (ICM,35366-10), was used for the simultaneous computer-con-trolled measurement of the resonant frequency (f) as afunction of time. For experimental treatments, the stablevalues at 2-3 hr were taken as baseline values before theaddition of test materials. For direct additions of testsamples, 50 μl of media is removed from the top of theQCM device and replaced with 50 μl of pre-warmedmedium containing specific amounts of test materials orvehicle alone. Automatic monitoring of the f values at1-min intervals was carried out using a PC and Labviewsoftware and the f values were continually automaticallymonitored. Frequency shift, Δf, plots were generated bysubtracting measured f values from the baseline f beforeadditions. Crystal oscillation is generated by a lever oscil-lator circuit (International Crystal manufacturing Co.,Inc, Oklahoma City, OK) designed for driving a piezo-electric resonator under the heavily damped conditionsassociated with in-liquid operation. The frequency of theoscillation is measured via a fast Fourier transform andrecorded once a minute. With a multi-channel oscillo-scope, separate QCM’s were able to be run in parallelallowing for control samples to be run under the exactsame environmental conditions as treatment sample.The frequency of crystal oscillation after cell addition is
dependent on the macrophage attachment and degree ofspreading on the surface of the crystal (Figure 2B and 2C).When first attaching as a round cell (panel C, step 1), thefrequency will be maximally decreased. As cells spread, asis shown in steps 2-4, the cells using their cytoskeletal ele-ments, will distribute their mass over a larger area,increase their viscoelasticity and the end result will be anincrease in crystal oscillation to a homeostatic level relativeto the cell attachment state. If stably attached macro-phages are then stimulated to phagocytosis (panel B) theywill exhibit increased migratory, cytokinetic and chemoki-netic behavior as shown in step 5 (panel C). This canresult in cyclic increases and decreases in crystal oscilla-tion as cells alternatively round and hyperextend their cellbody during directional mobility.At the end of an experiment, the number of cells
adhering to the QCM surface was determined by multi-ple trypsinizations and electronic cell counting. Trypsintreatment will remove cells and cellular protein fromthe crystal surface and the crystal oscillation willincrease significant to pre-cell addition biosensor levels.
LDH assays and standard curves with or without inclusionof SWCNTsLactate dehydrogenase enzyme activity in cell superna-tants was measured with TOX-7 kit (Sigma Aldrich).Due to SWCNT binding to the enzyme [30,31], the cali-bration curve was performed with a pure LDH standard
(Sigma Co., St. Louis) and in parallel using lysed cellsolutions with different concentrations of SWCNT. Dif-ferent numbers of cells (monosuspension) were platedin duplicate into Labteks for 24 hr at 37°C and 5%CO2
as described above. After DH82 were seeded in 8-wellLabTeks for 24hrs, old media was replaced with freshmedia with or without SWCNTs at final concentrationsof 10, 30 or 100 μg/ml. Cells were then incubated at RTand ambient air for 24 hrs. The supernatants were col-lected into eppendorf tubes, and centrifuged at 250 g for5 min at RT. These supernatants were then transferredto new tubes and centrifuged at 27,500 g for 60 min at4°C to remove the SWCNTs. Supernatants were trans-ferred to microfuge tubes for LDH assay. Lactate dehy-drogenase assay mixture was freshly prepared for eachexperiment according to the manufacturers’ instructions.Briefly, equal amounts of Lactate Dehydrogenase AssaySubstrate, Assay Dye, and 1’x LDH Assay Cofactor wereadded together. 75 μl of the cell supernatant sample wasdiluted with 75 μl of PBS, so FBS became 7.5% in eachtube and was added to 300 μL of the substrate/dye/cofactor mixture solution, light protected and incubatedat room temperature for 30 minutes. 45 μl (1/10volume) of 1 M HCl was then added to each tube tostop the reaction. Blank controls were prepared using asimilar procedure as the above LDH assay except 1:1diluted media was used instead of DH82 supernatant.Spectrometric absorbance was measured using aLAMBDA 35 UV/Vis Spectrophotometer (PerkinElmer,Inc.). Absorbance at a wavelength of 490 nm was sub-tracted by the absorbance readings at a wavelength of690 nm. Each disposable cuvette was read in triplicate.The optical density values were then normalized to cellnumber using the calibration curves. Calibration curveswith and without SWCNT effects were plotted by totallysis LDH reading versus total cell numbers derivedfrom multiple trypsinizations and electronic cell count-ing in addition to the LDH pure standard curve.The use of cell-derived LDH representing known
numbers of macrophages allowed us to relate LDHunits detected in the pure LDH assay to the actual num-ber of lysed macrophages, as different cells types havedifferent internal pools of LDH available. We also usedthe pure LDH standard in developing a calibrationcurve in the presence and absence of SWCNTs. Bycomparing cell-derived LDH to pure LDH withSWCNTs in the assay, we controlled for possible cellprotein - SWCNT interactions that would alter the col-orimetric readout using this assay.
ResultsI. Non-toxic macrophage phagocytosis measured by QCMWe first examined normal phagocytosis using ZymosanA (Figure 3A) or polystyrene beads (Figure 3B), classic
Wang et al. Particle and Fibre Toxicology 2011, 8:4http://www.particleandfibretoxicology.com/content/8/1/4
Page 7 of 17
C
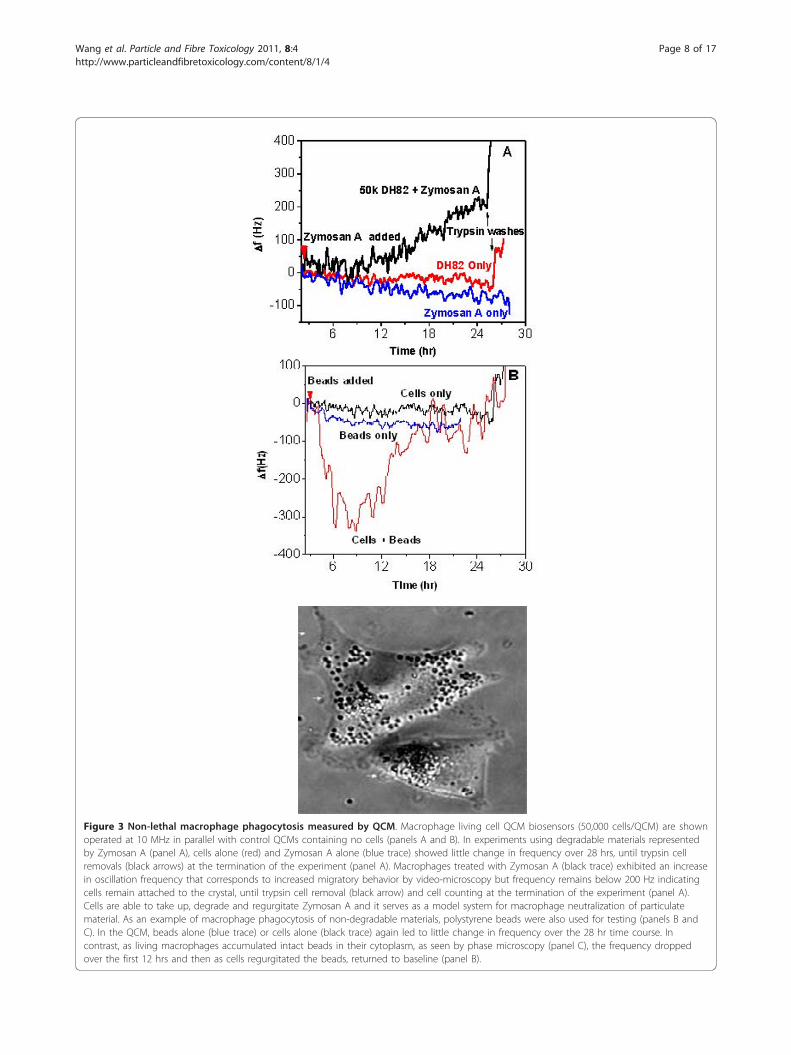
Figure 3 Non-lethal macrophage phagocytosis measured by QCM. Macrophage living cell QCM biosensors (50,000 cells/QCM) are shownoperated at 10 MHz in parallel with control QCMs containing no cells (panels A and B). In experiments using degradable materials representedby Zymosan A (panel A), cells alone (red) and Zymosan A alone (blue trace) showed little change in frequency over 28 hrs, until trypsin cellremovals (black arrows) at the termination of the experiment (panel A). Macrophages treated with Zymosan A (black trace) exhibited an increasein oscillation frequency that corresponds to increased migratory behavior by video-microscopy but frequency remains below 200 Hz indicatingcells remain attached to the crystal, until trypsin cell removal (black arrow) and cell counting at the termination of the experiment (panel A).Cells are able to take up, degrade and regurgitate Zymosan A and it serves as a model system for macrophage neutralization of particulatematerial. As an example of macrophage phagocytosis of non-degradable materials, polystyrene beads were also used for testing (panels B andC). In the QCM, beads alone (blue trace) or cells alone (black trace) again led to little change in frequency over the 28 hr time course. Incontrast, as living macrophages accumulated intact beads in their cytoplasm, as seen by phase microscopy (panel C), the frequency droppedover the first 12 hrs and then as cells regurgitated the beads, returned to baseline (panel B).
Wang et al. Particle and Fibre Toxicology 2011, 8:4http://www.particleandfibretoxicology.com/content/8/1/4
Page 8 of 17
methods for examining phagocytic processes, but neverbefore studied using QCM.For both types of experiments, the oscillation fre-
quency was observed first for two hours under roomtemperature and ambient air conditions to determine itsstability and was then normalized to a frequency shiftvalue Δf of zero. This stable frequency representsmacrophages that are attached but quiescent. At thispoint, one of the QCM devices was used for cell enu-meration by counting cells in the media and trypsinwashes of this QCM and viability determination wasperformed in the Cellometer (Nexcelom Bioscience,Lawrence, MA) using Trypan blue exclusion. At least an80% plating efficiency was required and the cells neededto be 90% viable before commencing with additions inthe QCM device. For studies with Zymosan A (Figure3A), in some QCM devices only fresh media was thenadded as shown (red trace) and the frequency remainedstable for the duration of the experiment, until trypsincell removal was performed (small black arrow). Inother QCM devices, not containing cells, Zymosan Awas added (blue trace) at the same dose and time asthat used for QCM devices containing cells (black traceat red arrowhead). Zymosan A alone (blue trace)showed a slight gradual decrease in frequency shift cor-responding to crystals that had no cell layer on the crys-tal surface and a small increase in mass deposited onthe surface of the crystal. However in contrast, QCMdevices containing cells and receiving the same amountof Zymosan A exhibited a slight decrease and then anincrease in frequency that never exceeded 200 Hz untiltrypsin cell removal (black trace, panel A black arrow).This change in frequency corresponds to the agitatedmigration of macrophages stimulated to collect and pha-gocytose Zymosan A, clearly contrasting with the fre-quency behavior of the unstimulated cells. Thisstimulated behavior requires the cells to spread, sendout processes and attach leading edges of the cell bodyin a forward position while at the same time detachingthe posterior side of the cell in order to exhibit direc-tional mobility (Figure 2C). The cells do not detach ordie in large numbers, as documented by the persistenceof a slowly rising 200 Hz oscillation frequency, final cellnumbers at the termination of the experiment, and theabrupt rise of the frequency exceeding 400 Hz whentrypsin is finally applied (arrows) as cells detach fromthe surface. This behavior was confirmed in videomicro-scopy experiments run in parallel.Macrophages gather and are able to degrade Zymosan
A (Figure 4A-D) as described below. In contrast, macro-phages can also be challenged to phagocytose non-degradable debris, simulated using polystyrene beads(Figure 3B). Again, after zeroing the baseline, cells alone(black trace) or beads alone (blue trace) over 18 hrs did
not alter the oscillation frequency. However, when poly-styrene beads were added to QCMs containing cells,these macrophages accumulated polystyrene beadswithin their cytoplasm (see Figure 3C) and could notdegrade them. The oscillation frequency dropped 300Hz by 12 hrs and then cells regurgitated the beads intothe medium and recovered with the frequency shiftreturning to and exceeding baseline. These patterns ofnormal macrophage phagocytosis using degradable andnon-degradable materials have been reported in the lit-erature but have not previously been studied usingQCM.
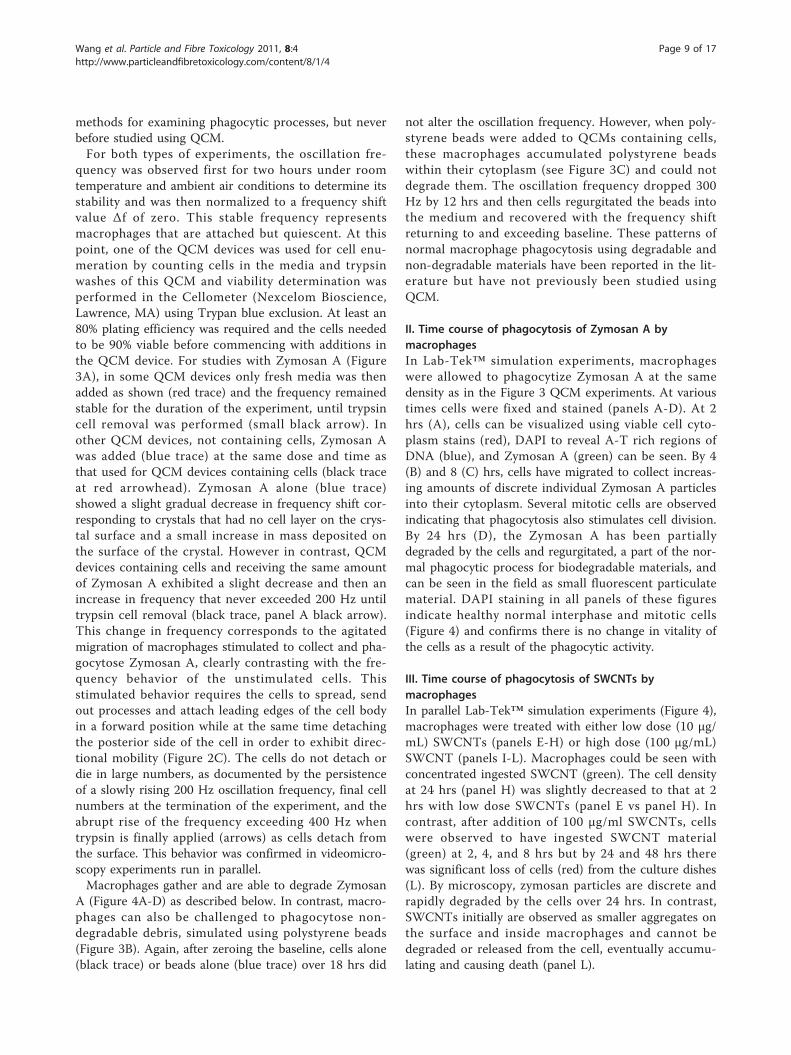
II. Time course of phagocytosis of Zymosan A bymacrophagesIn Lab-Tek™ simulation experiments, macrophageswere allowed to phagocytize Zymosan A at the samedensity as in the Figure 3 QCM experiments. At varioustimes cells were fixed and stained (panels A-D). At 2hrs (A), cells can be visualized using viable cell cyto-plasm stains (red), DAPI to reveal A-T rich regions ofDNA (blue), and Zymosan A (green) can be seen. By 4(B) and 8 (C) hrs, cells have migrated to collect increas-ing amounts of discrete individual Zymosan A particlesinto their cytoplasm. Several mitotic cells are observedindicating that phagocytosis also stimulates cell division.By 24 hrs (D), the Zymosan A has been partiallydegraded by the cells and regurgitated, a part of the nor-mal phagocytic process for biodegradable materials, andcan be seen in the field as small fluorescent particulatematerial. DAPI staining in all panels of these figuresindicate healthy normal interphase and mitotic cells(Figure 4) and confirms there is no change in vitality ofthe cells as a result of the phagocytic activity.
III. Time course of phagocytosis of SWCNTs bymacrophagesIn parallel Lab-Tek™ simulation experiments (Figure 4),macrophages were treated with either low dose (10 μg/mL) SWCNTs (panels E-H) or high dose (100 μg/mL)SWCNT (panels I-L). Macrophages could be seen withconcentrated ingested SWCNT (green). The cell densityat 24 hrs (panel H) was slightly decreased to that at 2hrs with low dose SWCNTs (panel E vs panel H). Incontrast, after addition of 100 μg/ml SWCNTs, cellswere observed to have ingested SWCNT material(green) at 2, 4, and 8 hrs but by 24 and 48 hrs therewas significant loss of cells (red) from the culture dishes(L). By microscopy, zymosan particles are discrete andrapidly degraded by the cells over 24 hrs. In contrast,SWCNTs initially are observed as smaller aggregates onthe surface and inside macrophages and cannot bedegraded or released from the cell, eventually accumu-lating and causing death (panel L).
Wang et al. Particle and Fibre Toxicology 2011, 8:4http://www.particleandfibretoxicology.com/content/8/1/4
Page 9 of 17
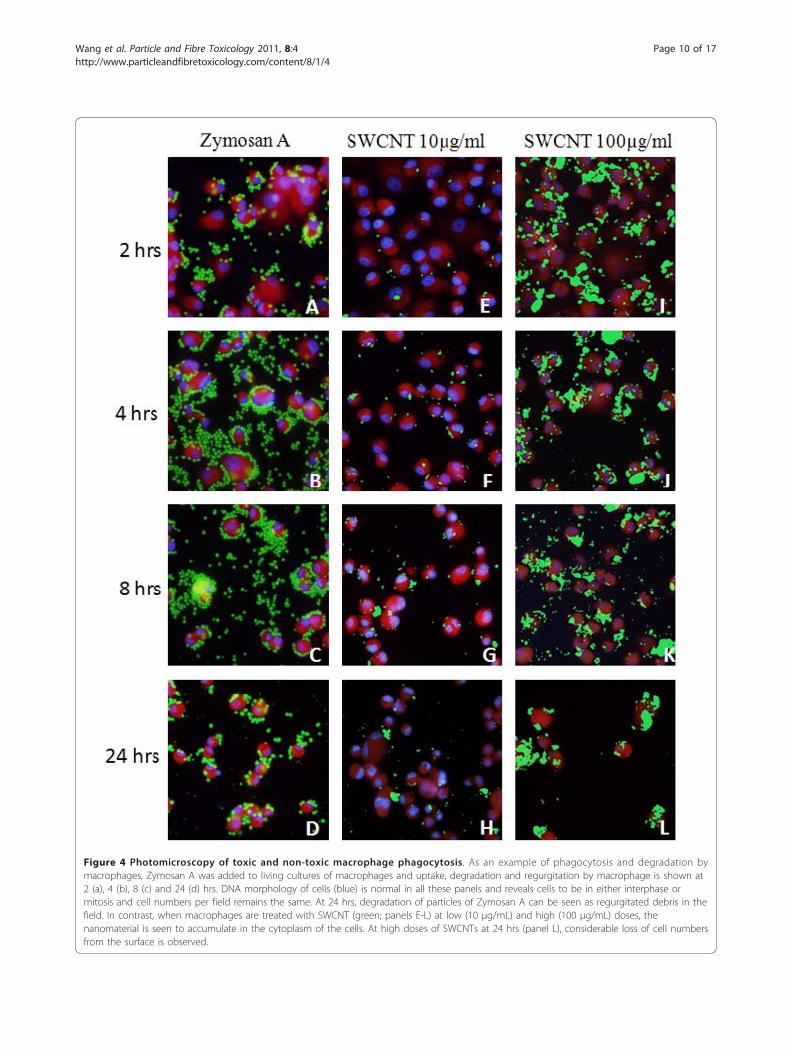
Figure 4
Figure 4 Figure 4 Photomicroscopy of toxic and non-toxic macrophage phagocytosis. As an example of phagocytosis and degradation bymacrophages, Zymosan A was added to living cultures of macrophages and uptake, degradation and regurgitation by macrophage is shown at2 (a), 4 (b), 8 (c) and 24 (d) hrs. DNA morphology of cells (blue) is normal in all these panels and reveals cells to be in either interphase ormitosis and cell numbers per field remains the same. At 24 hrs, degradation of particles of Zymosan A can be seen as regurgitated debris in thefield. In contrast, when macrophages are treated with SWCNT (green; panels E-L) at low (10 μg/mL) and high (100 μg/mL) doses, thenanomaterial is seen to accumulate in the cytoplasm of the cells. At high doses of SWCNTs at 24 hrs (panel L), considerable loss of cell numbersfrom the surface is observed.
Wang et al. Particle and Fibre Toxicology 2011, 8:4http://www.particleandfibretoxicology.com/content/8/1/4
Page 10 of 17
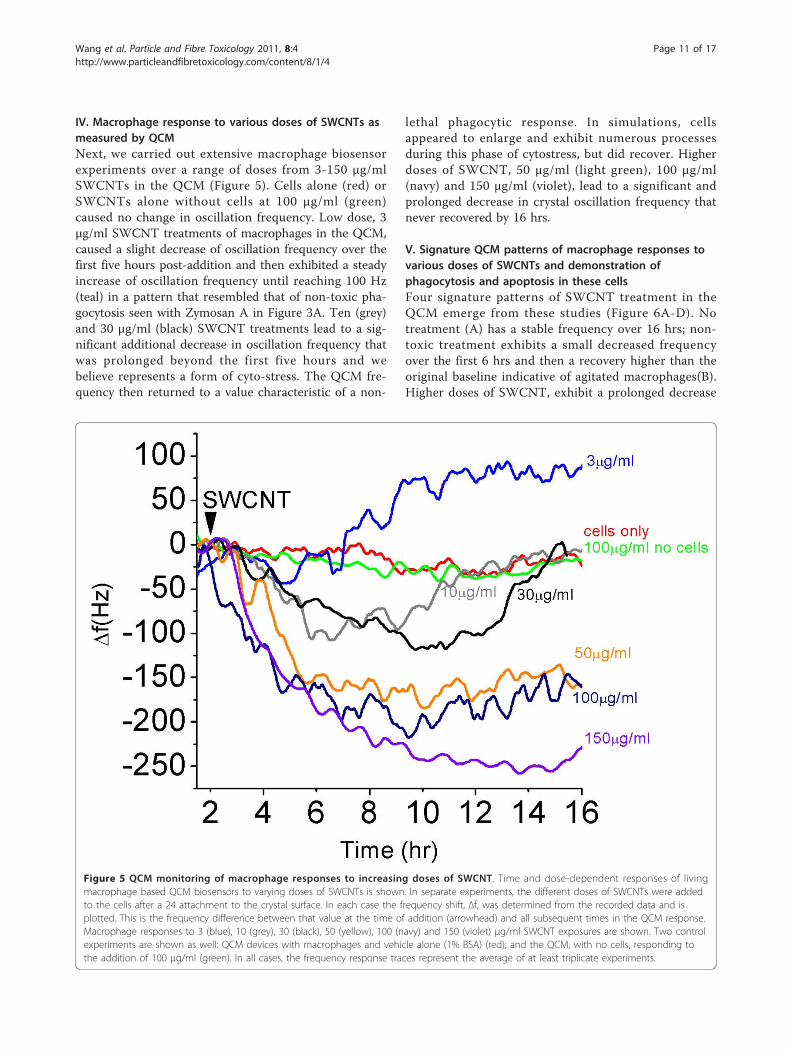
IV. Macrophage response to various doses of SWCNTs asmeasured by QCMNext, we carried out extensive macrophage biosensorexperiments over a range of doses from 3-150 μg/mlSWCNTs in the QCM (Figure 5). Cells alone (red) orSWCNTs alone without cells at 100 μg/ml (green)caused no change in oscillation frequency. Low dose, 3μg/ml SWCNT treatments of macrophages in the QCM,caused a slight decrease of oscillation frequency over thefirst five hours post-addition and then exhibited a steadyincrease of oscillation frequency until reaching 100 Hz(teal) in a pattern that resembled that of non-toxic pha-gocytosis seen with Zymosan A in Figure 3A. Ten (grey)and 30 μg/ml (black) SWCNT treatments lead to a sig-nificant additional decrease in oscillation frequency thatwas prolonged beyond the first five hours and webelieve represents a form of cyto-stress. The QCM fre-quency then returned to a value characteristic of a non-
lethal phagocytic response. In simulations, cellsappeared to enlarge and exhibit numerous processesduring this phase of cytostress, but did recover. Higherdoses of SWCNT, 50 μg/ml (light green), 100 μg/ml(navy) and 150 μg/ml (violet), lead to a significant andprolonged decrease in crystal oscillation frequency thatnever recovered by 16 hrs.
V. Signature QCM patterns of macrophage responses tovarious doses of SWCNTs and demonstration ofphagocytosis and apoptosis in these cellsFour signature patterns of SWCNT treatment in theQCM emerge from these studies (Figure 6A-D). Notreatment (A) has a stable frequency over 16 hrs; non-toxic treatment exhibits a small decreased frequencyover the first 6 hrs and then a recovery higher than theoriginal baseline indicative of agitated macrophages(B).Higher doses of SWCNT, exhibit a prolonged decrease
Figure 5 QCM monitoring of macrophage responses to increasing doses of SWCNT. Time and dose-dependent responses of livingmacrophage based QCM biosensors to varying doses of SWCNTs is shown. In separate experiments, the different doses of SWCNTs were addedto the cells after a 24 attachment to the crystal surface. In each case the frequency shift, Δf, was determined from the recorded data and isplotted. This is the frequency difference between that value at the time of addition (arrowhead) and all subsequent times in the QCM response.Macrophage responses to 3 (blue), 10 (grey), 30 (black), 50 (yellow), 100 (navy) and 150 (violet) μg/ml SWCNT exposures are shown. Two controlexperiments are shown as well: QCM devices with macrophages and vehicle alone (1% BSA) (red); and the QCM, with no cells, responding tothe addition of 100 μg/ml (green). In all cases, the frequency response traces represent the average of at least triplicate experiments.
Wang et al. Particle and Fibre Toxicology 2011, 8:4http://www.particleandfibretoxicology.com/content/8/1/4
Page 11 of 17
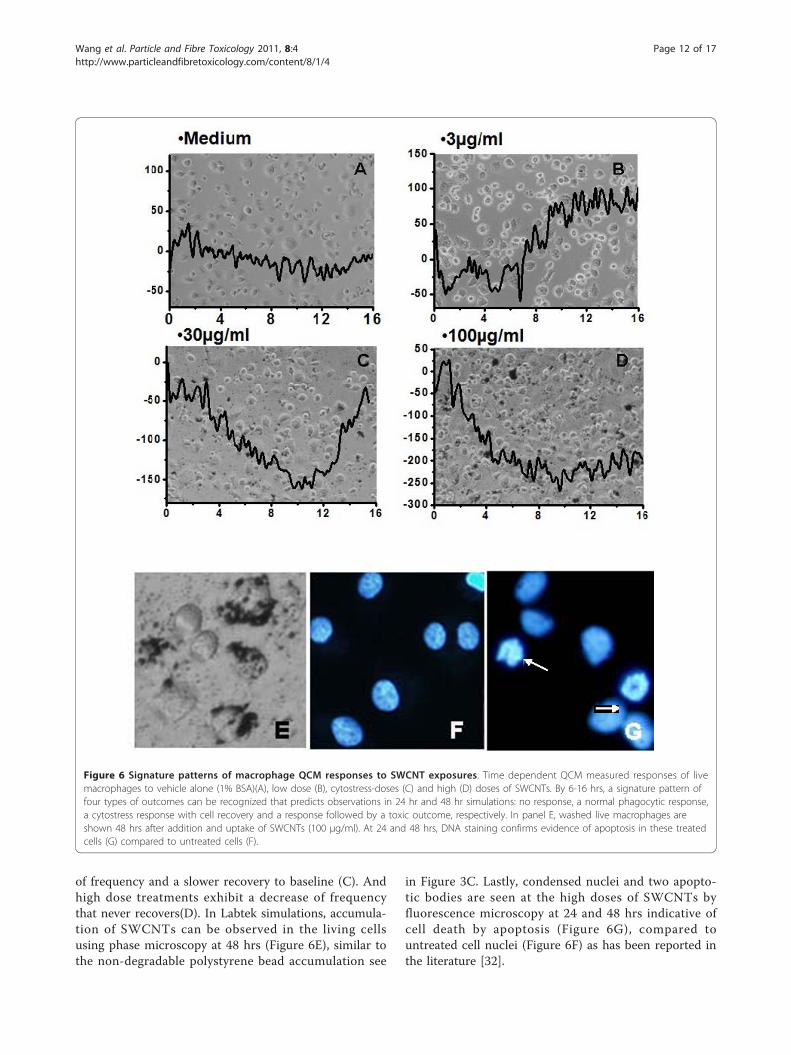
of frequency and a slower recovery to baseline (C). Andhigh dose treatments exhibit a decrease of frequencythat never recovers(D). In Labtek simulations, accumula-tion of SWCNTs can be observed in the living cellsusing phase microscopy at 48 hrs (Figure 6E), similar tothe non-degradable polystyrene bead accumulation see
in Figure 3C. Lastly, condensed nuclei and two apopto-tic bodies are seen at the high doses of SWCNTs byfluorescence microscopy at 24 and 48 hrs indicative ofcell death by apoptosis (Figure 6G), compared tountreated cell nuclei (Figure 6F) as has been reported inthe literature [32].
Figure 6 Signature patterns of macrophage QCM responses to SWCNT exposures. Time dependent QCM measured responses of livemacrophages to vehicle alone (1% BSA)(A), low dose (B), cytostress-doses (C) and high (D) doses of SWCNTs. By 6-16 hrs, a signature pattern offour types of outcomes can be recognized that predicts observations in 24 hr and 48 hr simulations: no response, a normal phagocytic response,a cytostress response with cell recovery and a response followed by a toxic outcome, respectively. In panel E, washed live macrophages areshown 48 hrs after addition and uptake of SWCNTs (100 μg/ml). At 24 and 48 hrs, DNA staining confirms evidence of apoptosis in these treatedcells (G) compared to untreated cells (F).
Wang et al. Particle and Fibre Toxicology 2011, 8:4http://www.particleandfibretoxicology.com/content/8/1/4
Page 12 of 17
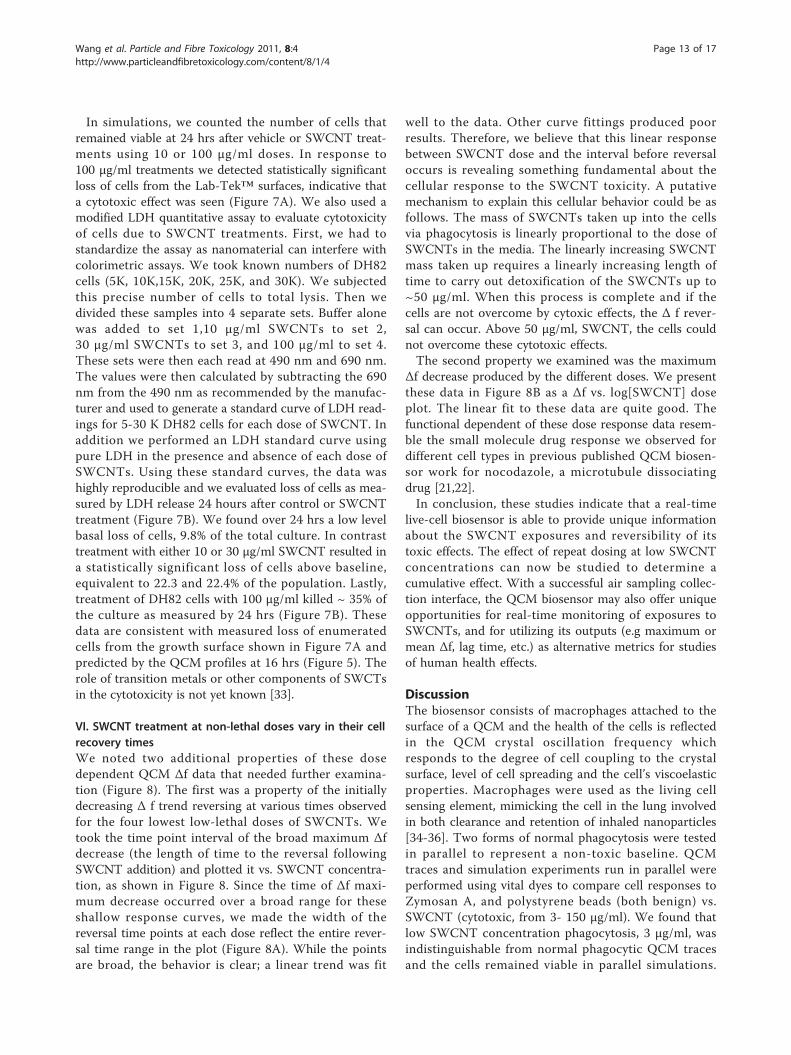
In simulations, we counted the number of cells thatremained viable at 24 hrs after vehicle or SWCNT treat-ments using 10 or 100 μg/ml doses. In response to100 μg/ml treatments we detected statistically significantloss of cells from the Lab-Tek™ surfaces, indicative thata cytotoxic effect was seen (Figure 7A). We also used amodified LDH quantitative assay to evaluate cytotoxicityof cells due to SWCNT treatments. First, we had tostandardize the assay as nanomaterial can interfere withcolorimetric assays. We took known numbers of DH82cells (5K, 10K,15K, 20K, 25K, and 30K). We subjectedthis precise number of cells to total lysis. Then wedivided these samples into 4 separate sets. Buffer alonewas added to set 1,10 μg/ml SWCNTs to set 2,30 μg/ml SWCNTs to set 3, and 100 μg/ml to set 4.These sets were then each read at 490 nm and 690 nm.The values were then calculated by subtracting the 690nm from the 490 nm as recommended by the manufac-turer and used to generate a standard curve of LDH read-ings for 5-30 K DH82 cells for each dose of SWCNT. Inaddition we performed an LDH standard curve usingpure LDH in the presence and absence of each dose ofSWCNTs. Using these standard curves, the data washighly reproducible and we evaluated loss of cells as mea-sured by LDH release 24 hours after control or SWCNTtreatment (Figure 7B). We found over 24 hrs a low levelbasal loss of cells, 9.8% of the total culture. In contrasttreatment with either 10 or 30 μg/ml SWCNT resulted ina statistically significant loss of cells above baseline,equivalent to 22.3 and 22.4% of the population. Lastly,treatment of DH82 cells with 100 μg/ml killed ~ 35% ofthe culture as measured by 24 hrs (Figure 7B). Thesedata are consistent with measured loss of enumeratedcells from the growth surface shown in Figure 7A andpredicted by the QCM profiles at 16 hrs (Figure 5). Therole of transition metals or other components of SWCTsin the cytotoxicity is not yet known [33].
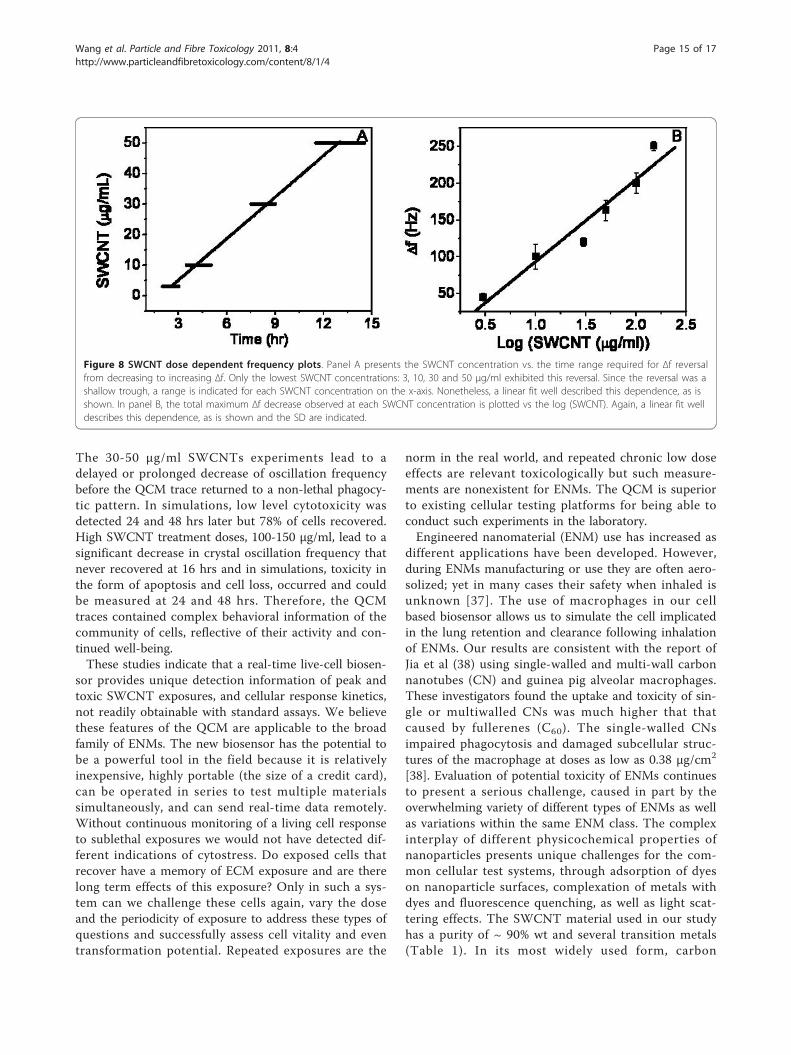
VI. SWCNT treatment at non-lethal doses vary in their cellrecovery timesWe noted two additional properties of these dosedependent QCM Δf data that needed further examina-tion (Figure 8). The first was a property of the initiallydecreasing Δ f trend reversing at various times observedfor the four lowest low-lethal doses of SWCNTs. Wetook the time point interval of the broad maximum Δfdecrease (the length of time to the reversal followingSWCNT addition) and plotted it vs. SWCNT concentra-tion, as shown in Figure 8. Since the time of Δf maxi-mum decrease occurred over a broad range for theseshallow response curves, we made the width of thereversal time points at each dose reflect the entire rever-sal time range in the plot (Figure 8A). While the pointsare broad, the behavior is clear; a linear trend was fit
well to the data. Other curve fittings produced poorresults. Therefore, we believe that this linear responsebetween SWCNT dose and the interval before reversaloccurs is revealing something fundamental about thecellular response to the SWCNT toxicity. A putativemechanism to explain this cellular behavior could be asfollows. The mass of SWCNTs taken up into the cellsvia phagocytosis is linearly proportional to the dose ofSWCNTs in the media. The linearly increasing SWCNTmass taken up requires a linearly increasing length oftime to carry out detoxification of the SWCNTs up to~50 μg/ml. When this process is complete and if thecells are not overcome by cytoxic effects, the Δ f rever-sal can occur. Above 50 μg/ml, SWCNT, the cells couldnot overcome these cytotoxic effects.The second property we examined was the maximum
Δf decrease produced by the different doses. We presentthese data in Figure 8B as a Δf vs. log[SWCNT] doseplot. The linear fit to these data are quite good. Thefunctional dependent of these dose response data resem-ble the small molecule drug response we observed fordifferent cell types in previous published QCM biosen-sor work for nocodazole, a microtubule dissociatingdrug [21,22].In conclusion, these studies indicate that a real-time
live-cell biosensor is able to provide unique informationabout the SWCNT exposures and reversibility of itstoxic effects. The effect of repeat dosing at low SWCNTconcentrations can now be studied to determine acumulative effect. With a successful air sampling collec-tion interface, the QCM biosensor may also offer uniqueopportunities for real-time monitoring of exposures toSWCNTs, and for utilizing its outputs (e.g maximum ormean Δf, lag time, etc.) as alternative metrics for studiesof human health effects.
DiscussionThe biosensor consists of macrophages attached to thesurface of a QCM and the health of the cells is reflectedin the QCM crystal oscillation frequency whichresponds to the degree of cell coupling to the crystalsurface, level of cell spreading and the cell’s viscoelasticproperties. Macrophages were used as the living cellsensing element, mimicking the cell in the lung involvedin both clearance and retention of inhaled nanoparticles[34-36]. Two forms of normal phagocytosis were testedin parallel to represent a non-toxic baseline. QCMtraces and simulation experiments run in parallel wereperformed using vital dyes to compare cell responses toZymosan A, and polystyrene beads (both benign) vs.SWCNT (cytotoxic, from 3- 150 μg/ml). We found thatlow SWCNT concentration phagocytosis, 3 μg/ml, wasindistinguishable from normal phagocytic QCM tracesand the cells remained viable in parallel simulations.
Wang et al. Particle and Fibre Toxicology 2011, 8:4http://www.particleandfibretoxicology.com/content/8/1/4
Page 13 of 17
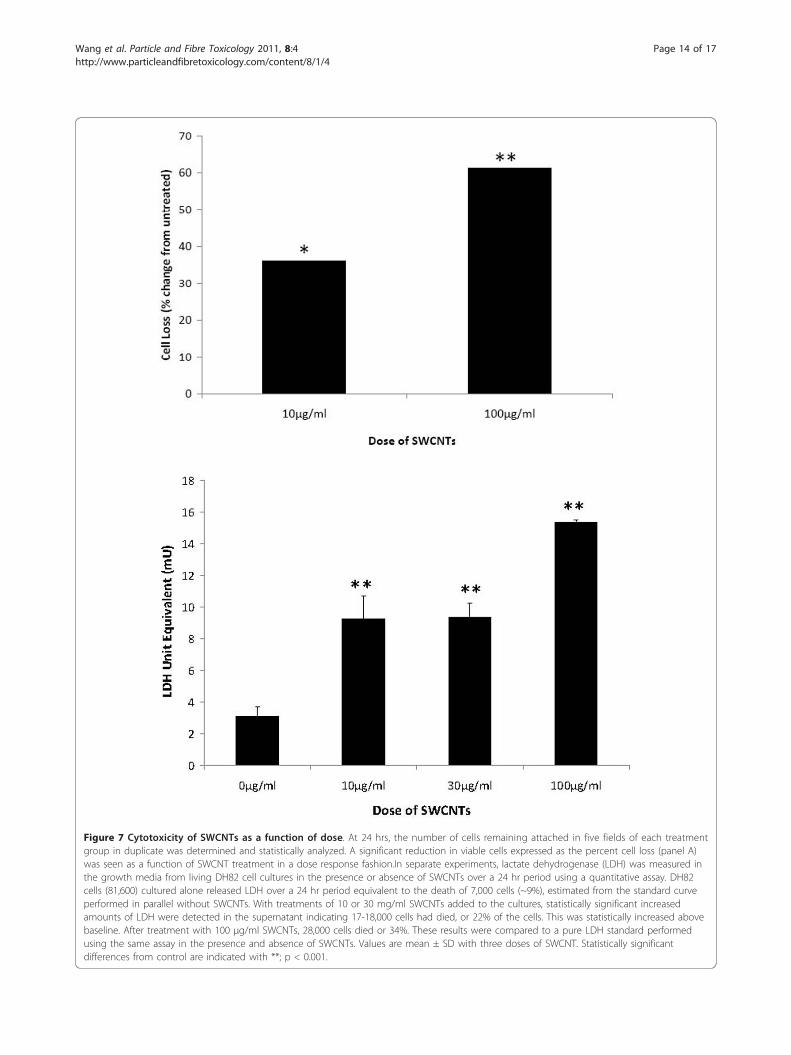
Figure 7 Cytotoxicity of SWCNTs as a function of dose. At 24 hrs, the number of cells remaining attached in five fields of each treatmentgroup in duplicate was determined and statistically analyzed. A significant reduction in viable cells expressed as the percent cell loss (panel A)was seen as a function of SWCNT treatment in a dose response fashion.In separate experiments, lactate dehydrogenase (LDH) was measured inthe growth media from living DH82 cell cultures in the presence or absence of SWCNTs over a 24 hr period using a quantitative assay. DH82cells (81,600) cultured alone released LDH over a 24 hr period equivalent to the death of 7,000 cells (~9%), estimated from the standard curveperformed in parallel without SWCNTs. With treatments of 10 or 30 mg/ml SWCNTs added to the cultures, statistically significant increasedamounts of LDH were detected in the supernatant indicating 17-18,000 cells had died, or 22% of the cells. This was statistically increased abovebaseline. After treatment with 100 μg/ml SWCNTs, 28,000 cells died or 34%. These results were compared to a pure LDH standard performedusing the same assay in the presence and absence of SWCNTs. Values are mean ± SD with three doses of SWCNT. Statistically significantdifferences from control are indicated with **; p < 0.001.
Wang et al. Particle and Fibre Toxicology 2011, 8:4http://www.particleandfibretoxicology.com/content/8/1/4
Page 14 of 17
The 30-50 μg/ml SWCNTs experiments lead to adelayed or prolonged decrease of oscillation frequencybefore the QCM trace returned to a non-lethal phagocy-tic pattern. In simulations, low level cytotoxicity wasdetected 24 and 48 hrs later but 78% of cells recovered.High SWCNT treatment doses, 100-150 μg/ml, lead to asignificant decrease in crystal oscillation frequency thatnever recovered at 16 hrs and in simulations, toxicity inthe form of apoptosis and cell loss, occurred and couldbe measured at 24 and 48 hrs. Therefore, the QCMtraces contained complex behavioral information of thecommunity of cells, reflective of their activity and con-tinued well-being.These studies indicate that a real-time live-cell biosen-
sor provides unique detection information of peak andtoxic SWCNT exposures, and cellular response kinetics,not readily obtainable with standard assays. We believethese features of the QCM are applicable to the broadfamily of ENMs. The new biosensor has the potential tobe a powerful tool in the field because it is relativelyinexpensive, highly portable (the size of a credit card),can be operated in series to test multiple materialssimultaneously, and can send real-time data remotely.Without continuous monitoring of a living cell responseto sublethal exposures we would not have detected dif-ferent indications of cytostress. Do exposed cells thatrecover have a memory of ECM exposure and are therelong term effects of this exposure? Only in such a sys-tem can we challenge these cells again, vary the doseand the periodicity of exposure to address these types ofquestions and successfully assess cell vitality and eventransformation potential. Repeated exposures are the
norm in the real world, and repeated chronic low doseeffects are relevant toxicologically but such measure-ments are nonexistent for ENMs. The QCM is superiorto existing cellular testing platforms for being able toconduct such experiments in the laboratory.Engineered nanomaterial (ENM) use has increased as
different applications have been developed. However,during ENMs manufacturing or use they are often aero-solized; yet in many cases their safety when inhaled isunknown [37]. The use of macrophages in our cellbased biosensor allows us to simulate the cell implicatedin the lung retention and clearance following inhalationof ENMs. Our results are consistent with the report ofJia et al (38) using single-walled and multi-wall carbonnanotubes (CN) and guinea pig alveolar macrophages.These investigators found the uptake and toxicity of sin-gle or multiwalled CNs was much higher that thatcaused by fullerenes (C60). The single-walled CNsimpaired phagocytosis and damaged subcellular struc-tures of the macrophage at doses as low as 0.38 μg/cm2
[38]. Evaluation of potential toxicity of ENMs continuesto present a serious challenge, caused in part by theoverwhelming variety of different types of ENMs as wellas variations within the same ENM class. The complexinterplay of different physicochemical properties ofnanoparticles presents unique challenges for the com-mon cellular test systems, through adsorption of dyeson nanoparticle surfaces, complexation of metals withdyes and fluorescence quenching, as well as light scat-tering effects. The SWCNT material used in our studyhas a purity of ~ 90% wt and several transition metals(Table 1). In its most widely used form, carbon
Figure 8 SWCNT dose dependent frequency plots. Panel A presents the SWCNT concentration vs. the time range required for Δf reversalfrom decreasing to increasing Δf. Only the lowest SWCNT concentrations: 3, 10, 30 and 50 μg/ml exhibited this reversal. Since the reversal was ashallow trough, a range is indicated for each SWCNT concentration on the x-axis. Nonetheless, a linear fit well described this dependence, as isshown. In panel B, the total maximum Δf decrease observed at each SWCNT concentration is plotted vs the log (SWCNT). Again, a linear fit welldescribes this dependence, as is shown and the SD are indicated.
Wang et al. Particle and Fibre Toxicology 2011, 8:4http://www.particleandfibretoxicology.com/content/8/1/4
Page 15 of 17
nanotubes produced as powders for electronics, compo-site materials and optics usually do contain transitionmetals that act as catalysts during synthesis. In our futurestudies we are comparing the response of macrophagesto carbon nanotubes with different geometrics and che-mistries. In the current work and that of other investiga-tors, the assessment of carbon nanotubes with transitionmetals is a realistic scenario for human exposures(37,38]. A label-free living cell quartz crystal microba-lance (QCM) biosensor offers unique opportunities toprovide continuous monitoring of cellular responseswithout these common drawbacks of cellular testing.Validation of the biosensor against animal inhalation
experiments is planned for the near future. The biosen-sor described has the potential to function as a personaldosimeter for human exposure assessment. The biosen-sor can provide an integrated biologically relevantresponse to the complex interplay of an ENMs exposureprofile, its intrinsic toxic potential, and the ENMs’ aero-sol reactivity at the point of generation. For example,loss of toxicity due to aging of reactive aerosols cannotbe captured in current post-sampling characterization.Additionally, the biosensor can respond to ENM mix-ture aerosols in the workplace and environment and can‘sense’ their potential interactive/synergistic effects, andintegrate these effects over broad particle size distribu-tions relevant to human inhalation exposures. Similar tothe use of biomarkers as surrogates for internal tissuedose in human epidemiological studies and toxicity eva-luations, the biosensor response can be seen as a surro-gate biomarker of ENM exposures. The reported studycan contribute to a broad-based, high rate toxicityscreening approach for ENMs; provide mechanisticinformation about ENM effects on living cells by provid-ing dynamic data on the health and behavioral status ofthe community of cells; and be a unique tool in explor-ing dosimetry issues in real-time.
AbbreviationsENM: Engineered nanomaterial; QCMB: quartz crystal microbalancebiosensor; SWCNTs: single-walled carbon nanotubes; QCM:quartz crystalmicrobalance; DAPI: 6-diamidino-2-phenylindole; CCVD: combustionchemical vapor deposition technique; PAH: polycyclic aromatic hydrocarbon;ROS: reactive oxygen species; FRAS: Ferric Reducing Ability of Serum; TEUs:trolox equivalent units
AcknowledgementsThe authors thank Ms.Patricia Arnold for her assistance with the manuscript.And we thank the U.S. ARMY RESEARCH OFFICE for funding this project(W911NF-07-2-0081).
Author details1Department of Biological Sciences, University of Massachusetts Lowell, OneUniversity Ave., Lowell, MA, 01854, USA. 2Department of Chemistry,University of Massachusetts Lowell, One University Ave., Lowell, MA, 01854,USA. 3Department of Work Environment, University of Massachusetts Lowell,One University Ave., Lowell, MA, 01854, USA. 4Department of Electrical and
Computer Engineering, University of Massachusetts Lowell, One UniversityAve., Lowell, MA, 01854, USA.
Authors’ contributionsGW built all the QCM devices used and carried out the QCM studies; ADcarried out the phagocytosis simulations using polystyrene beads andzymosan and performed immunocytochemical staining of cells usingfluorescent microscopy studies after SWCNT addition to macrophagecultures; JZ carried out the LDH and apoptosis assays and phase microscopystudies after SWCNT addition to macrophage cultures. AP and DB preparedall SWCNT samples, performed all characterization studies and TEM ofSWCNTs. MV designed and built the electronics for the QCM devices. SJBdrafted the manuscript, and participated in the conception and design of allthe studies and supervised all simulation experiments. KM helped to designthe QCM experiments, interpret the data and performed statistical analysison the data. JT supervised all the QCM experiments, designed the QCMdevice and the electronics associated with the QCM. All authors read andapproved the final manuscript.
Authors’ informationJT, KM and SJB are principal investigators of the work. JT is a electricalengineer with expertise in nanoscale sensors, nanoelectromechanicaldevices, chemical/biological sensors, optoelectronics, and standards ofpractice in nanomanufacturing. KM is a chemist with expertise in datamining of large biological, biomedical and molecular datasets and incharacterization of polymer based bio materials and drug effects usingbiosensors. SJB is a cell biologist with expertise in radiation biology,regenerative medicine, nanotherapeutics and biosensors. DB is a chemistwith expertise in nanomaterials, human health and safety, environmentalmonitoring and dosimetry.
Competing interestsThe authors declare that they have no competing interests.
Received: 17 August 2010 Accepted: 25 January 2011Published: 25 January 2011
References1. Maynard AD: Oversight of engineered nanomaterials in the workplace. J
Law Med Ethics 2009, 37:651-658.2. Ayres JG, Borm P, Cassee FR, Castranova V, Donaldson K, Ghio A, et al:
Evaluating the toxicity of airborne particulate matter and nanoparticlesby measuring oxidative stress potential–a workshop report andconsensus statement. Inhal Toxicol 2008, 20:75-99.
3. Kane AB, Hurt RH: Nanotoxicology: The asbestos analogy revisited. NatureNanotechnology 2008, 3:378-379.
4. Hansen SF, Larsen BH, Stig I, Olsen SI, Anders BA: Categorizationframework to aid hazard identification of nanomaterials. Nanotoxicology2007, 1:243-250.
5. Monteiro-Riviere NA, Inman AO, Zhang LW: Limitations and relative utilityof screening assays to assess engineered nanoparticle toxicity in ahuman cell line. Toxicol Appl Pharmacol 2009, 234:222-235.
6. Doak SH, Griffiths SM, Manshian B, Singh N, Williams PM, Brown AP,Jenkins GJ: Confounding experimental considerations innanogenotoxicology. Mutagenesis 2009, 24:285-293.
7. Casey A, Herzog E, Lyng FM, Byrne HJ, Chambers G, Davoren M: Singlewalled carbon nanotubes induce indirect cytotoxicity by mediumdepletion in A549 lung cells. Toxicol Lett 2008, 179:78-84.
8. Wörle-Knirsch JM, Pulskamp K, Krug HF: Oops they did it again! Carbonnanotubes hoax scientists in viability assays. Nano Lett 2006, 6:1261-1268.
9. Davoren M, Herzog E, Casey A, Cottineau B, Chambers G, Byrne HJ,Lyng FM: In vitro toxicity evaluation of single walled carbon nanotubeson human A549 lung cells. Toxicol in Vitro 2007, 21:438-448.
10. Oberdorster G, Maynard A, Donaldson K, Castranova V, Fitzpatrick J,Ausman K, et al: Principles for characterizing the potential human healtheffects from exposure to nanomaterials: elements of a screeningstrategy. Part Fibre Toxicol 2005, 2:8.
11. Casero E, Vázquez L, Parra-Alfambra AM, Lorenzo E: AFM, SECM and QCMas useful analytical tools in the characterization of enzyme-basedbioanalytical platforms. Analyst 2010, 135:1878-903.
Wang et al. Particle and Fibre Toxicology 2011, 8:4http://www.particleandfibretoxicology.com/content/8/1/4
Page 16 of 17
12. Hunter AC: Application of the quartz crystal microbalance tonanomedicine. J Biomed Nanotechnol 2009, 5:669-675.
13. Pavey KD: Quartz Crystal analytical sensors: the future of label-free, real-time diagnostics? Expert Rev. Mol. Diag 2002, 2:173-186.
14. Godber B, Thompsom KSJ, Rehak M, Uludag Y, Kelling S, Sleptsov A,Frogley M, Wiehler K, Whalen C, Cooper MA: Direct Quantification ofAnalyte Concentration by Resonant Acoustic Profiling. Clinical Chem2005, 51:1962-1972.
15. Heitmann V, Reiss B, Wegener J: The Quartz Crystal Microbalance in CellBiology: Basics and Applications. Chem Sensors Biosensors 2007, 5:303-338.
16. Marx KA: The quartz crystal microbalance and the electrochemical QCM:Applications to studies of thin polymer films, electron transfer systems,biological macromolecules, biosensors and cells. Chem Sensors Biosensors2007, 5:371-424.
17. Hook F, Kasemo B: The QCM-D technique for probing biomacromolecularrecognition reactions. Chem. Sensors Biosensors 2007, 5:425-447.
18. Wegener J, Janshoff A, Steinem C: The quartz crystal microbalance as anovel means to study cell-substrate interactions in situ. Cell BiochemBiophys 2001, 34:121-151.
19. Zhou T, Marx KA, Warren M, Schulze H, Braunhut SJ: The QCM as acontinuous monitoring tool for the study of EC attachment and growth.Biotech Progress 2000, 16:268-277.
20. Marx KA, Zhou T, Warren M, Braunhut SJ: QCM study of EC numberdependent differences in initial adhesion and steady state behavior.Biotech Progress 2003, 19:987-999.
21. Marx KA, Zhou T, Schulze H, Braunhut SJ: A QCM cell biosensor: detectionof microtubule alterations in living cells with nocodazole. Biosensors andBioelectronics 2001, 16:773-782.
22. Marx KA, Zhou T, Montrone A, McIntosh D, Braunhut SJ: A comparativestudy of cytoskeleton binding drugs nocodazole and taxol with amammalian cell QCM biosensor. Analytical Biochem 2007, 361:77-92.
23. Braunhut S, MacIntosh D, Vorotnikova E, Zhou T, Marx K: Detection ofapoptosis and drug resistance of human breast cancer cells to taxanetreatments using QCM. Assay and Drug Develop 2005, 3:77-88.
24. Vorotnikova E, Rosenthal R, Tries M, Doctrow S, Braunhut SJ: Novelsynthetic SOD catalyse mimetics can mitigate capillary endothelial cellapoptosis caused by ionizing radiation. Rad Res 2010, 173:748-759.
25. Vorotnikova E, Ivkov R, Foreman A, Tries M, Braunhut SJ: The magnitudeand time-dependence of the apoptotic response of normal andmalignant cells subjected to varying treatments of ionizing and thermalradiation. International J. Radiation Biology 2006, 82:549-559.
26. Rogers EJ, Hsieh SF, Organti N, Schmidt D, Bello D: A high throughput invitro analytical approach to screen for oxidative stress potential exertedby nanomaterials using a biologically relevant matrix: human bloodserum. Toxicol In Vitro 2008, 22:1639-1647.
27. Lu S, Duffin R, Poland C, Daly P, Murphy F, Drost E, et al: Efficacy of simpleshort-term in vitro assays for predicting the potential of metal oxidenanoparticles to cause pulmonary inflammation. Environ Health Perspect2009, 117:241-247.
28. Foucaud L, Wilson MR, Brown DM, Stone V: Measurement of reactivespecies production by nanoparticles prepared in biologically relevantmedia. Toxicol Lett 2007, 174:1-9.
29. Porter AE, Gass M, Muller K, Skepper JN, Midgley PA, Welland M: Directimaging of single-walled carbon nanotubes in cells. NatureNanotechnology 2007, 2:713-717.
30. Loboa AO, Corat MAF, Antunesa EF, Palma MBS, Pacheco-Soares C, Corat EJ:Cytotoxicity analysis of vertically aligned multi-walled carbon nanotubesby colorimetric assays. Synthetic Metals 2009, 159:2165-2166.
31. Wörle-Knirsch JM, Pulskamp K, Krug HF: Oops They Did It Again! CarbonNanotubes Hoax Scientists in Viability Assays. Nano Letters 2006,6:1261-1268.
32. Cveticanin J, Joksic G, Leskovac A, Petrovic S, Sobot A, Neskovic O: Usingcarbon nanotubes to induce micronuclei and double strand breaks ofthe DNA in human cells. Nanotechnology 2010, 21:1-7.
33. Bello D, Hart AJ, Ahn K, Hallock M, Yamamoto N, Garcia EJ, Ellenbecker MJ,Wardle BL: Particle exposure levels during CVD growth and subsequenthandling of vertically-aligned carbon nanotube films. Carbon 2008,46:974-977.
34. Geiser M, Kreyling W: Deposition and biokinetics of inhaled nanoparticles.Particle and Fibre Toxicology 2010, 7:2.
35. Cheng C, Müller KH, Koziol KKK, Skepper JN, Midgley PA, Welland ME,Porter AE: Toxicity and imaging of multi-walled carbon nanotubes inhuman macrophage cells. Biomaterials 2009, 30:4152-4160.
36. Shvedova A, Castranova V, Kisin E, Schwegler-Berry D, Murray A,Gandelsman V, Maynard A, Baron P: Exposure to carbon nanotubematerial: Assessment of nanotube cytotoxicity using human keratinocytecells. Journal of Toxicology and Environmental Health 2003, 66:1909.
37. Sargent LM, Reynolds SH, Castranova V: Potential pulmonary effects ofengineered carbon nanotubes: in vitro genotoxic effects. Nanotoxicology2010, 4:396-408.
38. Jia G, Wang H, Yan L, Wang X, Pei R, Yan T, Zhao Y, Guo X: Cytotoxicity ofcarbon nanomaterials: single-wall nanotube, multi-wall nanotube, andfullerene. Environ Sci Technol 2005, 39(5):1378-83.
doi:10.1186/1743-8977-8-4Cite this article as: Wang et al.: A living cell quartz crystal microbalancebiosensor for continuous monitoring of cytotoxic responses ofmacrophages to single-walled carbon nanotubes. Particle and FibreToxicology 2011 8:4.
Submit your next manuscript to BioMed Centraland take full advantage of:
• Convenient online submission
• Thorough peer review
• No space constraints or color figure charges
• Immediate publication on acceptance
• Inclusion in PubMed, CAS, Scopus and Google Scholar
• Research which is freely available for redistribution
Submit your manuscript at www.biomedcentral.com/submit
Wang et al. Particle and Fibre Toxicology 2011, 8:4http://www.particleandfibretoxicology.com/content/8/1/4
Page 17 of 17