Embed Size (px)
Citation preview

Bischof et al. Biotechnology for Biofuels 2013, 6:127http://www.biotechnologyforbiofuels.com/content/6/1/127
RESEARCH Open Access
Comparative analysis of the Trichoderma reeseitranscriptome during growth on the cellulaseinducing substrates wheat straw and lactoseRobert Bischof1, Lukas Fourtis2, Andreas Limbeck3, Christian Gamauf4, Bernhard Seiboth1,2
and Christian P Kubicek1,2*
Abstract
Background: Renewable lignocellulosic biomass is an advantageous resource for the production of secondgeneration biofuels and other biorefinery products. In Middle Europe, wheat straw is one of the most abundantlow-cost sources of lignocellulosic biomass. For its efficient use, an efficient mix of cellulases and hemicellulases isrequired. In this paper, we investigated how cellulase production by T. reesei on wheat straw compares to that onlactose, the only soluble and also cheap inducing carbon source for enzyme production.
Results: We have examined and compared the transcriptome of T. reesei growing on wheat straw and lactose ascarbon sources under otherwise similar conditions. Gene expression on wheat straw exceeded that on lactose, and1619 genes were found to be only induced on wheat straw but not on lactose. They comprised 30% of theCAZome, but were also enriched in genes associated with phospholipid metabolism, DNA synthesis and repair, ironhomeostatis and autophagy. Two thirds of the CAZome was expressed both on wheat straw as well as on lactose,but 60% of it at least >2-fold higher on the former. Major wheat straw specific genes comprised xylanases,chitinases and mannosidases. Interestingly, the latter two CAZyme families were significantly higher expressed in astrain in which xyr1 encoding the major regulator of cellulase and hemicellulase biosynthesis is non-functional.
Conclusions: Our data reveal several major differences in the transcriptome between wheat straw and lactosewhich may be related to the higher enzyme formation on the former and their further investigation could lead tothe development of methods for increasing enzyme production on lactose.
BackgroundThe utilization of cellulosic and hemicellulosic polymersin plant biomass for the production of bioethanol or plat-form chemicals is considered as a possible strategy to re-duce carbon dioxide emissions and bypass the currentdependence on fossil resources. Renewable lignocellulosicbiomass, besides being cheap and abundant, has also theadvantage that it does not compete with food production.Currently favored raw materials for this purpose include –among others – wood residues, “energy crops” such asswitch grass or Miscanthus, and agricultural byproducts
* Correspondence: [email protected] Centre of Industrial Biotechnology (ACIB) GmBH c/o Institute ofChemical Engineering, University of Technology of Vienna,Gumpendorferstraβe 1a, Vienna A-1060, Austria2Institute of Chemical Engineering, University of Technology of Vienna,Gumpendorferstraβe 1a, Vienna A-1060, AustriaFull list of author information is available at the end of the article
© 2013 Bischof et al.; licensee BioMed CentralCommons Attribution License (http://creativecreproduction in any medium, provided the or
such as wheat straw [1]. The latter is one of the mostabundant low-cost sources of lignocellulosic biomass inmiddle European countries with an annual production ofover 130 million tons [2].For the biotechnological use of these materials, they
first need to be pretreated and then hydrolyzed to theirmonomers. The fungus Trichoderma reesei is currentlythe major industrial producer of enzymes needed to de-grade the above polymers to soluble monosaccharide[1,3]. Most of these enzymes are not formed during cul-tivation on monosaccharides such as glucose; the fungusmust therefore be grown in the presence of an inducerwhich is mostly a cellulose and hemicellulose containingwaste material [4]. Optimally, this would be the samematerial for which the produced enzymes are aimed tobe applied, because this would ensure the induction ofthe whole spectrum of enzymes needed. However, this is
Ltd. This is an Open Access article distributed under the terms of the Creativeommons.org/licenses/by/2.0), which permits unrestricted use, distribution, andiginal work is properly cited.

Bischof et al. Biotechnology for Biofuels 2013, 6:127 Page 2 of 14http://www.biotechnologyforbiofuels.com/content/6/1/127
often not possible because commercial producers preferthe manufacture of an enzyme preparation for a broadrange of substrates.One of the carbon sources that is used for the produc-
tion of cellulases and hemicellulases by T. reesei is lactose,which is favoured when a soluble and cheap inducing car-bon source is preferred, e.g. to facilitate and reduce costsfor fermentation control and enzyme recovery [5]. How-ever, cellulase production on lactose occurs at a slowerrate and a lower final enzyme yield than on cellulosic ma-terials, and it has also been reported to lead to an enzymepreparation with lower specific activities [6]. Yet an indepth comparison of the enzymes produced on cellu-lose and lactose has to our knowledge not been publishedso far.Here we report a comparison of the transcriptome of
T. reesei growing on lactose and cellulose (wheat straw),which not only demonstrates the differences in the en-zymes produced but also in the molecular physiology ofgrowth on these two carbon sources.
ResultsComparison of the wheat straw and lactose-regulatedtranscriptome of T. reeseiAs a prerequisite for this study, we examined the growthof T. reesei QM 9414 on wheat straw, lactose and glu-cose. As shown in Figure 1, growth on glucose occurredat a faster rate than on the other two carbon sources.Growth on lactose and on wheat straw occurred atslower rates, that on wheat straw being lowest. In orderto compare the expression of genes that are induced in
0.00
1.00
2.00
3.00
4.00
5.00
6.00
0 10 20 30 40 50 60
Bio
mas
s dr
y w
eigh
t [g
/L]
Cultivation Time [hrs]
Figure 1 Growth profiles of T. reesei QM 9414 on differentsubstrates. The biomass dry weight per liter was directly measuredgravimetrically for glucose (squares) and lactose (diamonds) orcalculated from the intracellular protein content for wheat straw(triangles) on the basis of 0.35 g intracellular protein per g drybiomass. Error bars show the respective standard deviation of threebiological replicates.
T. reesei on lactose and on wheat straw to that on glu-cose, we therefore determined the transcriptional pro-files during the initial growth phase (i.e. when 25–30%of the carbon source have been consumed). We thensearched for those transcripts that were >2-fold lessabundant at a p <0.05 on glucose than either on lactoseand wheat straw. This retrieved a total of 3120 genes, ofwhich 2832 and 1501 were significantly upregulated onwheat straw and lactose, respectively. The significantlyhigher number on cellulose suggested to us that theslower growth and the complex nature of wheat strawmay cause a generally more enhanced transcriptional ac-tivity. In order to test this, we examined those 1100genes that were expressed on glucose, lactose and wheatstraw at a comparable level (± 1.4-fold; Additional file 1:Table S1): they were highly enriched in the KOG groupsJ (Translation, ribosomal structure and biogenesis; 12.3%of all genes of this category) and K (transcription; 10.3%)(KOG numbers taken from http://genome.jgi-psf.org/cgi-bin/kogBrowser?db=Trire2). The 1100 genes alsocontained several housekeeping genes such as tef1 en-coding elongation factor 1-α and act1, encoding actin[7]. Interestingly, sar1, encoding a small protein involvedin the secretory pathway, which was recommended asthe most reliable housekeeping gene [7] exhibited > 2-fold upregulation on wheat straw, probably because ofthe general upregulation of secretory genes under theseconditions.Within the 3120 genes, five patterns (further called
“transcript groups”) could be distinguished: 1213 geneswere significantly upregulated both on wheat straw andon lactose (Table 1); 1619 genes were upregulated onlyon wheat straw (transcript group A), in contrast to only288 genes that were upregulated on lactose (transcriptgroup B) only. Among the 1213 genes, 344 were signifi-cantly stronger upregulated on wheat straw (transcriptgroup C) and 65 on lactose (transcript group D; Table 1),whereas 804 were equally strong upregulated on wheatstraw and lactose (transcript group E). 1288 and 238of the 3120 genes encoded unknown or orphan proteins,respectively. For a complete list of these genes seeAdditional file 2: Table S2.When the percentage of individual gene groups (de-
fined as FunCat categories; [8]) in the total number ofgenes in the individual group was compared, transcriptgroup A displayed some unique features (Table 1): it wasstrongly enriched in Funcat categories for phospholipidmetabolism, iron homeostasis, secretion, protein kinases/phosphatases and DNA repair. The genes related to ironhomeostasis comprised four ferric reductases, three irontransporters, three siderophore transporters, and two en-zymes involved in the biosynthesis of siderophores, includ-ing one of the two siderophore synthases (Trire2:71005;[9]; Figure 2). Genes for gluconeogenesis were significantly

Table 1 Overview of the T. reesei transcriptome on wheat straw (W) and lactose (L)*
Wheat straw Lactose Wheat straw and lactose
W > L L >W W= L
Transcript category A B C D E
Gene category FunCat
All genes 1619 288 344 65 804
unknown genes 743 117 98 21 309
orphans 90 44 18 5 81
Metabolism 01
glycolysis 02.01 10 1 10
PPP 02.07 1 2 1
TCA cycle 02.10 4 2 5
pentose catabolism NN** 1 1 1 2
gluconeogenesis NN*** 1 5
amino acids 01.01 17 8 6 3 15
nucleotide 01.03 6 1 4
fatty acids 01.06.01 35 6 6 3 22
phospholipids 01.06.03 15 6
secondary metabolism 01.20 8 3
Transport
MFS 20.01.03 28 7 28 3 46
nitrogenous compounds 20.01.07, 20.01.09 4 5 2 3 8
ions 20.01.01 6 1 1 5
ABC transporters 20.03.25 4 2 1 4
mitochondrial transport 20.09.04 1 1
aquaporins 20.03.01 1 4
iron transport and reduction 20.01.01.01 6 6 1
Transcription
transcription factors 11.02.03.04 98 16 18 3 57
DNA 10.01 76 4 17
Cell cycle 10.03 13 2 2 1 9
Translation 12.04 7 1 1 1
Secretion 20.09.16 35 1 1 1
Signal transduction
G-protein signalling 30.01.05.05 6 1 4 3 9
protein kinases/phosphatases 30.01.05 27 1 1 3
Extracellular products
SSCPs NN**** 39 6 12 1 18
glycosyl transferases 14.07.02 5 1 2 1
Hydrolytic enzymes 01.25.01
CAZys 40 7 54 4 27
proteases 26 6 8 8
lipases 11 2 3 1 7
nucleases 9 2 1
amidases and nitrilases 8 2 2 4
Bischof et al. Biotechnology for Biofuels 2013, 6:127 Page 3 of 14http://www.biotechnologyforbiofuels.com/content/6/1/127
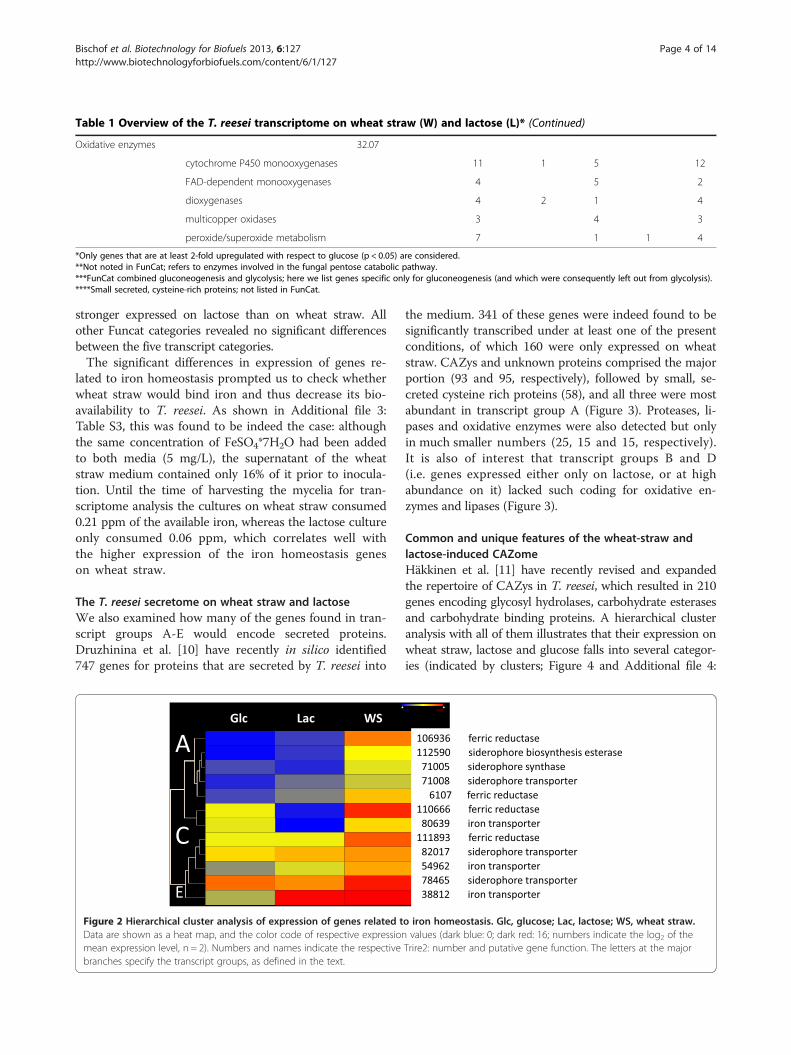
Table 1 Overview of the T. reesei transcriptome on wheat straw (W) and lactose (L)* (Continued)
Oxidative enzymes 32.07
cytochrome P450 monooxygenases 11 1 5 12
FAD-dependent monooxygenases 4 5 2
dioxygenases 4 2 1 4
multicopper oxidases 3 4 3
peroxide/superoxide metabolism 7 1 1 4
*Only genes that are at least 2-fold upregulated with respect to glucose (p < 0.05) are considered.**Not noted in FunCat; refers to enzymes involved in the fungal pentose catabolic pathway.***FunCat combined gluconeogenesis and glycolysis; here we list genes specific only for gluconeogenesis (and which were consequently left out from glycolysis).****Small secreted, cysteine-rich proteins; not listed in FunCat.
Bischof et al. Biotechnology for Biofuels 2013, 6:127 Page 4 of 14http://www.biotechnologyforbiofuels.com/content/6/1/127
stronger expressed on lactose than on wheat straw. Allother Funcat categories revealed no significant differencesbetween the five transcript categories.The significant differences in expression of genes re-
lated to iron homeostasis prompted us to check whetherwheat straw would bind iron and thus decrease its bio-availability to T. reesei. As shown in Additional file 3:Table S3, this was found to be indeed the case: althoughthe same concentration of FeSO4*7H2O had been addedto both media (5 mg/L), the supernatant of the wheatstraw medium contained only 16% of it prior to inocula-tion. Until the time of harvesting the mycelia for tran-scriptome analysis the cultures on wheat straw consumed0.21 ppm of the available iron, whereas the lactose cultureonly consumed 0.06 ppm, which correlates well withthe higher expression of the iron homeostasis geneson wheat straw.
The T. reesei secretome on wheat straw and lactoseWe also examined how many of the genes found in tran-script groups A-E would encode secreted proteins.Druzhinina et al. [10] have recently in silico identified747 genes for proteins that are secreted by T. reesei into
Figure 2 Hierarchical cluster analysis of expression of genes related tData are shown as a heat map, and the color code of respective expressionmean expression level, n = 2). Numbers and names indicate the respectivebranches specify the transcript groups, as defined in the text.
the medium. 341 of these genes were indeed found to besignificantly transcribed under at least one of the presentconditions, of which 160 were only expressed on wheatstraw. CAZys and unknown proteins comprised the majorportion (93 and 95, respectively), followed by small, se-creted cysteine rich proteins (58), and all three were mostabundant in transcript group A (Figure 3). Proteases, li-pases and oxidative enzymes were also detected but onlyin much smaller numbers (25, 15 and 15, respectively).It is also of interest that transcript groups B and D(i.e. genes expressed either only on lactose, or at highabundance on it) lacked such coding for oxidative en-zymes and lipases (Figure 3).
Common and unique features of the wheat-straw andlactose-induced CAZomeHäkkinen et al. [11] have recently revised and expandedthe repertoire of CAZys in T. reesei, which resulted in 210genes encoding glycosyl hydrolases, carbohydrate esterasesand carbohydrate binding proteins. A hierarchical clusteranalysis with all of them illustrates that their expression onwheat straw, lactose and glucose falls into several categor-ies (indicated by clusters; Figure 4 and Additional file 4:
o iron homeostasis. Glc, glucose; Lac, lactose; WS, wheat straw.values (dark blue: 0; dark red: 16; numbers indicate the log2 of the
Trire2: number and putative gene function. The letters at the major

60
50
40
30
20
10
0
NU
MB
ER
OF
GE
NE
S
GH
s
Pro
teas
es
SS
CP
s
Oxi
dativ
e E
nzym
es
Est
eras
es/L
ipas
es
Oth
er G
enes
Orp
hans
Unk
now
n ge
nes
Figure 3 At least >2-fold upregulated genes encoding putative secreted proteins during growth of T. reesei on wheat straw andlactose. Different transcript groups (for explanation see text) are: transcript group A, blue; transcript group B, red; transcript group C, green;transcript group D, yellow; and transcript group E, white. Esterases and lipases include both carbohydrate esterases as well as lipases.
Bischof et al. Biotechnology for Biofuels 2013, 6:127 Page 5 of 14http://www.biotechnologyforbiofuels.com/content/6/1/127
Table S4): they comprise genes not expressed at all or – ifso only weakly on wheat straw (I a), genes much strongerexpressed on wheat straw than on lactose (clusters II a andb), but also genes that are expressed on all carbon sources(cluster VI). As noted above, 132 of these genes fulfilledour criterion of at least 2-fold increased expression onwheat straw versus glucose and at least 2-fold on lactoseversus glucose, respectively. This number is higher thanthat of secreted CAZymes, which is due to the factthat several of the upregulated α- and β-glycosidaseslacked a signal peptide and apparently represent intracel-lular enzymes.A detailed analysis showed that the majority of genes
for cellulases, cellulose monooxygenases and cellulosebinding proteins were > 2-fold stronger expressed onwheat straw than on lactose (Table 2). This included al-most all of the cellulases with a CBM1 cellulose bindingdomain, and also the auxiliary proteins swollenin, CIP1and one GH61 polysaccharide monooxygenase. Only thecellobiohydrolase 1-encoding gene cel7a, as well as twoGH1 and one GH3 β-glucosidase genes (cel1a, cel1b andbgl3j) and two GH61 polysaccharide monooxygenaseswere equally expressed on wheat straw and lactose, andone other polysaccharide monooxygenase was onlyexpressed on wheat straw. A contrasting picture wasobtained for the GH10, GH11 and GH30 xylanases, halfof which were only expressed on wheat straw. In con-trast, most of the genes encoding enzymes that cleavehemicelluloses side chains (α-L-arabinosidases, α-(methyl)-D-glucuronidases, α-D-fucosidases and polysaccharidedeacetylases) were equally well expressed on lactoseand wheat straw (transcript group E). Finally, it was
noted that the presence of wheat straw (transcriptgroups A and C) also specifically induced an array ofGH18 chitinases –particularly such that also contain a cel-lulose binding domain (CHI18-14, CH18-16, and CHI18-17 [12]) GH2 and GH47 β-D-mannosidases and GH55endo-β-1,3-glucanases.
Chitinases, mannanases and galactosidases are negativelyregulated in a strain in which the cellulase regulator XYR1is nonfunctionalThe polysaccharides present in pretreated wheat straware mainly cellulose and (a small amount of) xylan [11].Yet the above data (Table 2) have shown that several genesnot associated with degradation of cellulose or xylan,such as chitinases, mannosidases or α-D-galactosidases,are specifically or higher induced by wheat straw. Sincethe genes encoding the cellulose and xylan depolymerisingenzymes are regulated by the Zn2Cys6 transcriptionfactor XYR1 [13], we also wanted to learn whether tran-scription of these other differentially expressed genes isalso controlled by XYR1. To this end, we examined theirexpression on wheat straw both in T. reesei strain QM9414 as well as in a Δxyr1 knock-out strain. The resultsare shown in Figure 5: while qPCR confirmed the inducedexpression of these genes in QM 9414, we found thatalmost all of them – with the only clear exception ofthe β-mannanase encoding gene man1 – were 2- to>100-fold overexpressed in the Δxyr1 mutant. Mostnotably this was true for all the tested chitinases, whilethere were one and two ambiguous cases for themannanases and galactosidases respectively. The signifi-cance of these results was also tested by an unequal

I a
I b
II aII b
III
IV
V
VI
Figure 4 Hierarchical cluster analysis of glycosyl hydrolase gene expression. Data are shown as a heat map, and the color code ofrespective expression values (dark blue: 0; dark red: 16; numbers indicate the log2 of the mean expression level, n = 2). Roman numbers and(in certain cases) lower case letters specify clades characterized by consistent expression patterns.
Bischof et al. Biotechnology for Biofuels 2013, 6:127 Page 6 of 14http://www.biotechnologyforbiofuels.com/content/6/1/127
variance t-test and the respective result are reported inAdditional file 5: Table S5.This finding prompted us to test whether the 5’-up-
stream nontranslated sequences of these chitinase,mannanase and galactosidase genes would bear consen-sus sites for binding of XYR1 (GGCW4). Furukawa et al.[14] assessed that the whole genome of T. reesei contains20692 XYR1 consensus binding sites, which – in view ofthe estimated 33 Mbp of the T. reesei genome [15] –
implies that on the average one binding site may occurabout every 1500 bp. When this value is compared tothe number of consensus sites in four major cellulasegenes cel7a, cel7b, cel6a and cel5a, they all contain >10consensus sites in the first 1500 5’ bp upstream of theATG [14]. A similar analysis for the 16 chitinase, α-galactosidase and α-mannanase/mannosidase genes thatwere analyzed by qPCR (Figure 5) revealed a broadrange of number of consensus sites within 1000 bp
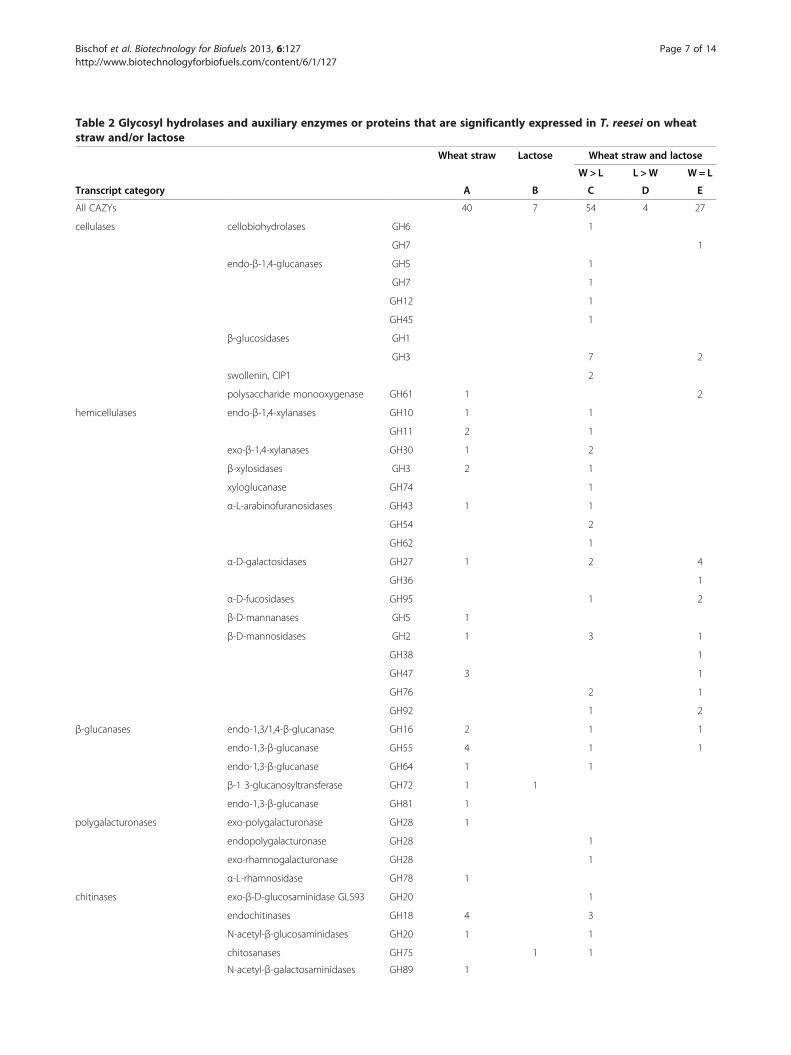
Table 2 Glycosyl hydrolases and auxiliary enzymes or proteins that are significantly expressed in T. reesei on wheatstraw and/or lactose
Wheat straw Lactose Wheat straw and lactose
W > L L >W W= L
Transcript category A B C D E
All CAZYs 40 7 54 4 27
cellulases cellobiohydrolases GH6 1
GH7 1
endo-β-1,4-glucanases GH5 1
GH7 1
GH12 1
GH45 1
β-glucosidases GH1
GH3 7 2
swollenin, CIP1 2
polysaccharide monooxygenase GH61 1 2
hemicellulases endo-β-1,4-xylanases GH10 1 1
GH11 2 1
exo-β-1,4-xylanases GH30 1 2
β-xylosidases GH3 2 1
xyloglucanase GH74 1
α-L-arabinofuranosidases GH43 1 1
GH54 2
GH62 1
α-D-galactosidases GH27 1 2 4
GH36 1
α-D-fucosidases GH95 1 2
β-D-mannanases GH5 1
β-D-mannosidases GH2 1 3 1
GH38 1
GH47 3 1
GH76 2 1
GH92 1 2
β-glucanases endo-1,3/1,4-β-glucanase GH16 2 1 1
endo-1,3-β-glucanase GH55 4 1 1
endo-1,3-β-glucanase GH64 1 1
β-1 3-glucanosyltransferase GH72 1 1
endo-1,3-β-glucanase GH81 1
polygalacturonases exo-polygalacturonase GH28 1
endopolygalacturonase GH28 1
exo-rhamnogalacturonase GH28 1
α-L-rhamnosidase GH78 1
chitinases exo-β-D-glucosaminidase GLS93 GH20 1
endochitinases GH18 4 3
N-acetyl-β-glucosaminidases GH20 1 1
chitosanases GH75 1 1
N-acetyl-β-galactosaminidases GH89 1
Bischof et al. Biotechnology for Biofuels 2013, 6:127 Page 7 of 14http://www.biotechnologyforbiofuels.com/content/6/1/127

Table 2 Glycosyl hydrolases and auxiliary enzymes or proteins that are significantly expressed in T. reesei on wheatstraw and/or lactose (Continued)
carbohydrate binding proteins CBM13 1
CBM18 1
α-glucan hydrolases α-D-1,4-glucosidases GH13 1 1
glucamylase GH15 1
α-D-1,4-glucosidases GH31 3
α,α'-trehalase GH37 1
α,α'-trehalase GH65 2
α-D-1,3-glucosidases GH71 2 1
carbohydrate esterases CE1 2
CE4 1 1
acetyl xylan esterase CE5 3
acetyl esterase CE16 1
chitin deacetylase 1
α-glucuronidases GH67 1
GH79 1
GH105 1 1
GH115 1 1
Bischof et al. Biotechnology for Biofuels 2013, 6:127 Page 8 of 14http://www.biotechnologyforbiofuels.com/content/6/1/127
upstream of their start codon, ranging from 6 (MAN1) to0 (for two chitinases and one mannosidase; Additional file6: Table S6). The significance of the number of consensussites versus the mean statistical occurrence (every 1500 bp)was rejected by the Anderson-Darling test [16].
Wheat straw induces the expression of genes involved inautophagyThe above described upregulation of chitinases could bea consequence of enhanced autophagy. This term speci-fies an intracellular degradation process functioning inthe delivery of cytoplasmic proteins and organelles tovacuoles for macromolecule turnover and recycling[17,18]. To investigate this possibility, we screened forthe potential of genes known to be involved in fungalautophagy in T. reesei growing on wheat straw and lac-tose. Indeed, as shown in Figure 6, we found 7 autoph-agy genes (atg1, atg5, atg7, atg9, atg15, atg18 and atg26)to be significantly upregulated on wheat straw, but noton glucose or lactose.
DiscussionWe have previously described that lactose can induce analmost complete cellulase and hemicellulase enzyme sys-tem in T. reesei, and reasoned that this could be due toa preference of the fungus to initiate feeding on lignocel-lulose by hydrolysing the β-galactoside side chains inthe xyloglucans, which are linked to cellulose in the pri-mary cell wall of dicotyledons [19]. In order to test howthis induction on lactose would compare to a complex
lignocellulosic material – wheat straw, which not onlycontains cellulose but also xylans but with very little ga-lactose side chains (< 0.1%; [11]) – we compared the tran-scriptome under both conditions. The results showed that85 of the 132 genes of the CAZome were expressed bothon lactose as well as on wheat straw. However, two thirdsof them were significantly stronger expressed on wheatstraw than on lactose. One of the major qualitative differ-ences between wheat straw and lactose was a strict de-pendence of 4 xylanases and 2 β-xylosidases on wheatstraw for expression, implying that xylanases are onlypoorly expressed on lactose. Only xyn2 and xyn3 were alsoexpressed on the latter. These findings suggest that thereis indeed no major difference between the induction ofcellulolytic enzymes by lactose and cellulose, but that theobserved differences are due to the content of xylan. Ex-pression of xyn2 has previously been demonstrated to betriggered by both sophorose (which is considered to be a“cellulose-specific” inducer) as well as xylobiose (consid-ered to be “xylan-specific”) and by lactose [20]. However,xyn1, xyn2, xyn4 and xyn5 have recently also been shownto be differentially induced by D-xylose and L-arabinose[21]. Similarly, Akel et al. [22] have shown that theα-L-arabinofuranosidase genes require the presence ofL-arabinose for full induction. We therefore interpret thesignificantly higher expression of most of the xylanasesand hemicelluloses side chain hydrolases to be due to thepresence of additional specific inducers for their genes.These results raise an interesting question: it has been
demonstrated that expression of the cellulase and

Figure 5 Results of qPCR analyses of those chitinases, galactanases and mannanases that were upregulated on either lactose, wheatstraw or both carbon sources. The expression of the lactose samples and wheat straw samples, taken at the indicated time points (see legend)is related to that of an 8 h sample from a QM 9414 glucose culture and normalized on tef1. Error bars show the standard deviation of twoindependent experiments.
Bischof et al. Biotechnology for Biofuels 2013, 6:127 Page 9 of 14http://www.biotechnologyforbiofuels.com/content/6/1/127
hemicellulase genes in T. reesei is completely dependenton the function of the Zn2Cys6-transcription factor XYR1[13,22], and xyr1 itself is induced both on lactose [19], andcellulose [23]. So how could a single transcription factorrespond to different inducers in quantitative differentways? The regulation of genes encoding xylanolytic en-zymes of the model organism Neurospora crassa has beensuggested to involve several regulatory groups: the xylanaseregulator XLR-1 (the N. crassa orthologue of XYR1) wassuggested to work alone or in combination with other
unknown regulators and an XLR-1 independent group ofgenes was also suggested to exist [24]. Häkkinen et al. [11]have also hypothesized that several regulatory mechanisms,depending on the inducers present, may act on theCAZyme gene promoters simultaneously, and in somecases also in an additive manner. An example of such anadditional regulator could be ACE2, which has been dem-onstrated to assist xylanase gene transcription by enhan-cing xyr1 transcription and by forming a putativeheterodimer with XYR1 [25], whereas it has only a small

Gen
e ex
pres
sion
rat
io[-
fold
]
8
6
4
2
0atg15 atg7 atg26 atg18 atg9 atg5 atg1
Figure 6 Changes in gene expression of autophagy relatedT. reesei genes on glucose, lactose and wheat straw: blue barsshow the expression of lactose (Lac) cultures relative toglucose (Glc) cultures, red bars show the expression of wheatstraw (Wheat) cultures relative to glucose (Glc) cultures, andgreen bars show the expression of wheat straw (Wheat)cultures relative to lactose (Lac) cultures. Values represent themean of three biological replicates, error bars show thestandard deviation.
Bischof et al. Biotechnology for Biofuels 2013, 6:127 Page 10 of 14http://www.biotechnologyforbiofuels.com/content/6/1/127
effect on induction of cellulase gene transcription by solkafloc cellulose, and none at all when sophorose is used as aninducer [26]. Another candidate could be the orthologue(Trire2: 26163) of the recently described N. crassa cellulaseregulator CLR-2 [27]. In this study, clr2 was found to beinduced during growth on lactose or wheat straw. A blastpsearch with the T. reesei CLR2 protein sequence againstthe NCBI database revealed that it is an orthologue of theA. nidulans mannanase regulator ManR, for which theDNA-binding motif has been determined as 5’-YAGAAT-3’ [28]. However, a search of the presence of this motif in1 kb upstream of several CAZome genes that were foundto be significantly regulated in this study revealed no con-sistent picture: 1–2 copies were present in some genes,but completely absent in the majority of them, includingthe major β-mannanase gene man5 (unpublished data).Whether or not CLR2 or another transcription factor co-operate with XYR1 in the expression of some CAZomegenes therefore remains to be determined. We should liketo stress that both xyr1 and clr2 belonged to transcriptgroup E, i.e. they were expressed to similar levels on lac-tose and wheat straw. The different level of expres-sion of various genes on wheat straw and lactose cantherefore not be simply the result of an enhanced ex-pression of xyr1.In this study, we also detected a significant upre-
gulation of genes encoding chitinases, α-galactosidasesand mannosidases. These genes were also recently ob-served to behave different from the major set of cellulaseand hemicellulase genes by being moderately or evenvery low expressed during growth on birch xylan, steamexploded and enzymatically treated bagasse already atthe early time points [11]. Interestingly, this upre-gulation was strongly enhanced in a strain in which thexyr1 gene had been deleted, indicating that XYR1 is a
repressor of these genes. While the XYR1 orthologuesfrom A. oryzae, N. crassa and Fusarium graminearumall function in the regulation of xylanase gene expres-sion, XYR1 regulates cellulase gene expression only inT. reesei and A. oryzae. In both N. crassa and A. oryzae –the two fungi in which the effect of xyr1 manipulation hasbeen studied on a genome-wide scale [24,29] - it has sofar been shown only to activate gene expression. However,the variation of occurrence (and in 3 cases even absence)of XYR1 binding sites in the promoters of these genesmakes an action of XYR1 as a repressor of these genes un-likely. We consider it rather possible that their strongupregulation in the Δ xyr1 mutant is due to its inability togrow on wheat straw and the reduced growth on lactose[30], i.e. autophagy. In fact, upregulation of some of theT. reesei chitinases by carbon starvation has been shown[12], but is so far not known for the α-mannanases/mannosidases or α-galactosidases. Since oligosaccharideswith these monosaccharide and linkage types are not partof the cell wall polymers of the fungus [31], their induc-tion under starvation requires further studies.A comparison of the wheat straw and lactose tran-
scriptome did not lead to the detection of major changesin metabolic pathways and the signaling to them withfour exceptions: one was a high number of genes associ-ated with phospholipid metabolism and protein secre-tion, with DNA replication and repair, and finally themassive upregulation of genes for iron homeostasis. Asfor the first, Schreiber et al. [32] showed that theaddition of the phospolipid precursor cholin increasedcellulase formation in T. reesei, and at the same timeled to an increase in the hyphal content of endoplasmicreticulum. Also, Glenn et al. [33] showed that thehypercellulolytic mutant T. reesei RUT C30 exhibits aproliferated amount of endoplasmic reticulum. It isthus possible that the increased expression of genesassociated with phospholipid synthesis is responsiblefor an enhanced synthesis of endomembrane compo-nents required for increased cellulase export from thehyphae.Another group of upregulated genes was those related
to autophagy. To date, more than 30 autophagy-related(ATG) genes have been identified for Saccharomycescerevisiae and other fungi [34,35]. BLASTP search of thepredicted T. reesei proteins (http://genome.jgi-psf.org/Trire2/Trire2.home.html) against the NCBI database (ata cutoff of E-value < −70 over at least 80% of the se-quence length) detected 22 orthologues of ATG genes(see Additional file 7: Table S7) of which 7 were foundto be strongly upregulated on wheat straw but not onlactose or glucose. Notably this group included the serine/threonine protein kinase Atg1 [17,18], which – togetherwith Atg17, Atg29, and Atg31 – forms a protein complexthat initiates the formation of autophagosomes [36,37].

Bischof et al. Biotechnology for Biofuels 2013, 6:127 Page 11 of 14http://www.biotechnologyforbiofuels.com/content/6/1/127
Nitsch et al. [38] have recently shown that autophagyplays important roles in physiological adaptation in sub-merged cultures under conditions of carbon depletion byorganelle turnover and protection against cell death. Ourdata suggest that the slow growth rate on wheat strawmay lead to a carbon uptake rate slow enough to alreadysignal starvation. However, autophagy has also beenshown to be necessary for fungal morphogenesis, particu-larly when attacking other organisms [39,40], and we cantherefore also not rule out that it is crucial for the growthof T. reesei on an insoluble substrate.The upregulation of genes associated with DNA syn-
thesis and repair appears to indicate the operation ofmechanisms leading to damage of DNA during growthon cellulose. While the occurrence of such mechanismshas not been reported so far, we detected a wheat-straw-specific 2.7-fold upregulation of the T. reesei orthologueof the NADPH oxidase NoxA (NOX1; Trire2:79498; seeAdditional file 2: Table S2). This enzyme generates react-ive oxygen species in a regulated manner and is involvedin several aspects of fungal biology, including develop-ment and plant pathogenesis [41]. We consider it pos-sible that the upregulation of enzymes for DNA repair isa response to the formation of reactive oxygen speciesby NOX1, although the reason for its upregulation is notclear. Brun et al. [42] reported that Podospora anserinahyphae form specialized structures for cellulose degradationand their formation is differentially regulated by NOX1 andNOX2. Interestingly, Montero-Barrientos et al. [43]reported that an overexpression of nox1 in T. harzianumleads to the increased formation of protease, cellulase, andchitinase activities during mycoparasitic interaction with afungal host. Nitsche at al. (2013) reported that in A. nigerautophagy influences the sensitivity towards oxidativestress. We consider it likely that the detected enhanced au-tophagic activity on wheat straw (vide supra) also causesthe increased expression of genes related to DNA damagerepair and oxidative stress.Finally, a very intriguing finding from this study was
the massive upregulation of genes involved in ironhomeostasis. This elevated expression of iron-uptakesystems on wheat straw can be explained by a lower bio-available concentration of iron during growth on wheatstraw (as shown in this study), which is probably due tothe ability of cellulose for sequestering Fe3+ [44]. In na-ture, this shortage can be reinforced by the formation ofFe3+-oxalate chelates with the oxalic acid secreted by ba-sidiomycetes [45]. It is also possible that this inductionof iron assimilating enzymes has the additional benefitof triggering the synthesis of the large number of flavincontaining oxidases and monooxygenases that are up-regulated during growth on wheat straw and result in anincreased demand for iron. As already hypothesized [19],this increased expression of oxidative enzymes could
indicate the operation of Fenton chemistry during cellu-lose degradation by T. reesei. The increased expressionof a glucose oxidase (Trire2:22915) and a gluconate kin-ase (Trire2:71072), as observed in this study, suggestspartial degradation of the glucose from cellulose, whichcould be involved in the provision of hydrogen peroxidefor this process.
ConclusionsOur study shows that growth on wheat straw leads in partto an enhanced expression of cellulase and hemicellulasegenes by T. reesei, but also to the selective induction of aset of enzymes, notable the majority of the xylanolyticenzymes. This implies that the expression of genes associ-ated with lignocelluloses degradation by T. reesei is subjectto as yet unknown regulator proteins which are sup-posed to cooperate with XYR1. A detailed analysis oftranscriptomic changes of genes involved in cellularmetabolism and its regulation further identified au-tophagy, phospholipid biosynthesis, iron homeostasisand DNA repair as processes related to degradationof wheat straw, whose roles warrant further investiga-tions. In addition, manipulation of these genes maybe a new tool for strain improvement in T. reesei.
Materials and methodsStrains and cultivationsT. reesei QM9414 (ATCC 26921), a moderately cellulaseproducing mutant, and a Δxyr1 mutant prepared from it[13] was used throughout this work and kept on potatodextrose agar (Sigma, St. Louis, MO).Cultures were grown in 250 ml of Mandels Andreotti
(MA) medium (per liter: 1.4 g (NH4)2SO4, 2.0 g KH2PO4,0.3 g MgSO4*7H2O, 0.3 g CaCl2*2H2O, 0.3 g urea, 1 gpeptone (casein), 5 mg FeSO4*7H2O, 1.6 mg MnSO4*H2O,1.4 mg ZnSO4*7H2O and 2 mg CoCl2*2H2O) with 10 g/lglucose monohydrate, lactose monohydrate or pre-treated wheat straw (dry basis) as the sole carbon sourceand inoculated with 106 ml-1 conidiospores. Pretreatedwheat straw was kindly provided by Clariant ProdukteDeutschland GmbH. In brief, the substrate was mechanic-ally ground, and subjected to slightly acidic, thermochem-ical pretreatment.Furthermore, 0.5 g l-1 of tween 80 were added in the
case of lactose cultures and the pH of wheat straw mediawas adjusted to 4.8 with 1 M KOH. All cultivations wereperformed in a rotary shaker at 28°C and 250 rpm. Bio-mass samples for total RNA extraction or measurementof biomass were withdrawn at appropriate time points.Cultures for the qPCR analyses were pregrown for 24 hin glycerol containing (10 g l-1) MA medium and equalportions of the harvested and washed mycelium wereaseptically replaced into MA medium, again containingeither 10 g l-1 glucose monohydrate, lactose monohydrate

Bischof et al. Biotechnology for Biofuels 2013, 6:127 Page 12 of 14http://www.biotechnologyforbiofuels.com/content/6/1/127
or pretreated wheat straw (dry basis) as the sole carbonsource, but this time devoid of urea and peptone.
Transcriptome analysisMycelia were harvested from cultures growing on wheatstraw, lactose, and glucose, for 50 (wheat straw) and 28 hrs(lactose and glucose), respectively. Total RNAs from glu-cose and lactose cultures were extracted using TRIzol® re-agent (Invitrogen Life Technologies, Carlsbad, CA, USA),according to the manufacturer's instructions, and thenpurified using the RNeasy MinElute Kit (Qiagen, Hilden,Germany). For isolation and purification of total RNA fromwheat straw cultures, the RNeasy Plant Mini Kit and theRNeasy MinElute Kit (both Qiagen, Hilden, Germany) re-spectively were used according to the manufacturer’s in-structions. cDNA synthesis, labelling and hybridization wasperformed by Roche NimbleGen (Roche-NimbleGen, Inc.,Madison, WI, USA) with a high density oligonucleotidemicroarray using 60-mer probes representing the 9.129genes of T. reesei. Microarray scanning, data acquisitionand identification of probe sets showing a significantdifference (p = 0.05) in expression level between the differ-ent conditions were performed essentially as describedpreviously [13,46]. Gene accession numbers were anno-tated according to version 2 of the T. reesei genome data-base (http://genome.jgi-psf.org/Trire2/Trire2.home.html),and ambiguous cases annotated manually. The Euclideandistance metric method, as implemented in DNASTARv5.1.2. build 3 (DNAstar Inc., Madison, WI), was used forHierarchical Clustering.Genes were then classified according to their major
annotation in the GO (Gene Ontology), KOG (EuKaryoticOrthologous Groups) classification available at the T. reeseigenome database v2.0 (http://genome.jgipsf.org/Trire2/Trire2.home.html), and the MIPS Functional Catalogue(http://mips.helmholtz-muenchen.de/proj/funcatDB; [8]). Todetermine whether there were differences in the functionalcategories in each cluster, the distribution within each clusterwas compared to the total distribution of all the annotatedgenes using independent chi-square tests.The microarray data and the related protocols are avail-
able at the GEO web site (www.ncbi.nlm.nih.gov/geo/)under accession number GSE46155.
Promoter sequence analysisAll analyses were performed with the RSAT softwaresuite [47]. Promoter sequences from −1000 to −1 wereobtained from the T. reesei genome database (http://gen-ome.jgi-psf.org/Trire2/Trire2.home.html). Motifs weresearched using the "DNA Pattern Matching" algorithm,with the "prevent overlapping matches" parameter checked.For a given set of genes (any cluster, or whole genome), thetotal number of motifs found was collected and an averagenumber of sites per gene was calculated.
qPCRDNase treated (DNase I, RNase free; Fermentas) totalRNA (5 μg) was reversely transcribed with the RevertAid™First Strand cDNA Kit (Fermentas) according to the man-ufacturer’s protocol with a combination (1:1) of the pro-vided oligo-dT and random hexamer primers. All assayswere carried out in 96-well plates which were coveredwith optical tape, as described [13,46]. Primers, amplifica-tion efficiency and R-square values are given in Additionalfile 8: Table S8. Determination of the PCR efficiency wasperformed using triplicate reactions from a dilutionseries of cDNA, and the amplification efficiency then cal-culated from the given slopes in the realplex v2.2 software.Expression ratios were calculated using REST© Software[48]. All samples were analyzed in two independentexperiments with three replicates in each run. Theunequal varaiance t-test was performed as previouslydescribed [49].
Measurement of biomass dry weightBiomass formation of lactose and glucose cultures wasdetermined gravimetrically, as previously reported [16].Biomass concentrations of wheat straw cultures were in-directly measured by the amount of intracellular proteinessentially as in [50]. In brief, a 1 ml sample of the cul-ture broth was withdrawn and the solids collected bycentrifugation. One mL 1 M NaOH was added and themixture was incubated for two hours and frequentlyvortexed. This suspension was then clarified by centrifu-gation and the protein concentration of the supernatantwas determined with the BioRad protein assay reagent(BioRad, Hercules, USA) against a BSA standard. Theprotein content was furthermore corrected by a set ofsubstrate controls where no inoculum was added to thewheat straw medium. The biomass dry weight was thencalculated assuming an average content of 0.35 g intra-cellular protein per g of dry cell mass. Three independ-ent cultivations were performed for each carbon sourceand the mean of the three experiments is reported.
Measurement of ironThe concentration of iron in the soluble supernatant ofthe cultures was measured by inductively coupledplasma mass spectrometry (ICP-MS). To overcome pos-sible matrix effects during sample introduction and ICP-MS analysis, the samples were diluted 1:100 with HNO3
(1% v/v) prior to measurement. Indium (1.0 μg L-1) wasbeen added as an internal standard to all samples. Themeasurements were performed using an iCAP Q ICP-MS System from Thermo Fisher Scientific (Bremen,Germany) equipped with a standard quartz tube torchand nickel sample and skimmer cones. For sample intro-duction a set consisting of a concentric nebulizer and aPeltier cooled cyclonic spray chamber has been used.
Bischof et al. Biotechnology for Biofuels 2013, 6:127 Page 13 of 14http://www.biotechnologyforbiofuels.com/content/6/1/127
Transportation of sample solutions was performed bythe peristaltic pump of the iCAP Q coupled to an ESISC2 DX auto sampler (ESI, USA). For separation ofspectral interferences caused from polyatomic ions pro-duced in the argon plasma by matrix constituents allICP-MS measurements were performed in the collisionmode using He with 7% H2 as collision gas at a flow rateof 5 mL min-1 and a KED value of 3 eV. Plasma powerwas maintained at 1550 W, cooling gas and auxiliary gasflow set at 14 L.min-1 and 0.8 L.min-1, respectively. Makeup gas flow, nebulizer flow rate and sample uptake ratewere adjusted at 0.7, 0.99 and 0.4 L.min-1, respectively.For analysis the elemental isotopes (m/z ratios) 56Fe,57Fe, 58Ni, 59Co and 58Ni and 115In (as internal standard)were monitored. Quantification of derived signals wasbased on an external calibration function determinedwith aqueous standard solutions using Indium as in-ternal standard. The ICP-MS operation and data acquisi-tion (by peak hopping) was accomplished by usingQtegra software, using a dwell time of 10 ms and 20sweeps per reading, and 4 replicates per sample.
Additional files
Additional file 1: Table S1. Genes constitutively expressed in T. reeseion glucose (Glc), lactose (Lac) and wheat straw (WS).
Additional file 2: Table S2. All genes that are at least 2-folddifferentially regulated on lactose or wheat straw vs glucose.
Additional file 3: Table S3. Concentration of iron in the culturesupernatant on lactose and wheat straw.
Additional file 4: Table S4. Genes present in the clusters shown inFigure 4.
Additional file 5: Table S5 Unequal variance t-test of qPCR resultsshown in Figure 5.
Additional file 6: Table S6. Presence of the XYR1 binding consensusmotif in the first 1000 bp upstream of the start codon in the genesupregulated in the Δxyr1 mutant strain.
Additional file 7: Table S7. Autophagy genes in T. reesei.
Additional file 8: Table S8. Nucleotide sequences and Reactionefficiencies of RT-qPCR oligos used in this study.
AbbreviationsCAZome: Carbohydrate active enzyme proteome; CAZys: Carbohydrateactive enzymes; ESI: Electron spray ionization; GEO: Gene expressionomnibus; GH: Glycosyl hydrolase; GO: Gene ontology; ICP-MS: Inductivelycoupled plasma mass spectrometry; KED: Kinetic energy discrimination;KOG: EuKaryotic Orthologous Groups; MIPS: MUNICH Information Center forProtein Sequences; qPCR: Quantitative polymerase chain reaction;REST: Relative expression software tool.
Competing interestsThe authors declare that they have no competing interests.
Authors’ contributionsBS and CPK initiated, designed and coordinated the study and reviewedthe manuscript. RB planned and carried out experiments and measurementsand interpreted experimental data. LF carried out experiments andmeasurements and analysed experimental data. AL performed the ironanalyses. CG analyzed and discussed data. CPK drafted the paper. All authorshave read and approved the final manuscript.
AcknowledgementsThis work has been supported by the Federal Ministry of Economy, Familyand Youth (BMWFJ), the Federal Ministry of Traffic, Innovation andTechnology (bmvit), the Styrian Business Promotion Agency SFG, theStandortagentur Tirol and ZIT - Technology Agency of the City of Viennathrough the COMET-Funding Program managed by the Austrian ResearchPromotion Agency FFG, and by the Austrian Science Foundation projectP 23202 to CPK and project P24219 to BS.
Author details1Austrian Centre of Industrial Biotechnology (ACIB) GmBH c/o Institute ofChemical Engineering, University of Technology of Vienna,Gumpendorferstraβe 1a, Vienna A-1060, Austria. 2Institute of ChemicalEngineering, University of Technology of Vienna, Gumpendorferstraβe 1a,Vienna A-1060, Austria. 3Institute of Chemical Technologies and Analytics,University of Technology of Vienna, Getreidemarkt 9, Vienna A-1060, Austria.4Biotech & Renewables Center, Clariant GmbH, München 81477, Germany.
Received: 31 May 2013 Accepted: 4 September 2013Published: 9 September 2013
References1. Kubicek CP: Fungi and lignocellulosic biomass. New York: Wiley; 2012.2. Talebnia F, Karakashev D, Angelidaki I: Production of bioethanol from
wheat straw: an overview on pretreatment, hydrolysis and fermentation.Bioresour Technol 2010, 101:4744–4753.
3. Schuster A, Schmoll M: Biology and biotechnology of Trichoderma.Appl Microbiol Biotechnol 2010, 87:787–799.
4. Aro N, Pakula T, Penttilä M: Transcriptional regulation of plant cell walldegradation by filamentous fungi. FEMS Microbiol Rev 2005, 29:719–739.
5. Persson I, Tjerneld F, Hahn-Hägerdal B: Fungal cellulolytic enzymeproduction: A review. Proc Biochem 1991, 26:65–74.
6. Ryu D, Andreotti R, Mandels M, Reese ET: Studies on QuantitativePhysiology of Trichoderma reesei with Two-Stage Continuous Culture forCellulase Production. Biotechnol Bioengin 1979, 21:1887–1903.
7. Steiger MG, Mach RL, Mach-Aigner AR: An accurate normalization strategyfor RT-qPCR in Hypocrea jecorina (Trichoderma reesei). J Biotechnol 2010,145:30–37.
8. Ruepp A, Zollner A, Maier D, Albermann K, Hani J, Mokrejs M, Tetko I,Güldener U, Mannhaupt G, Münsterkötter M, Mewes HW: The FunCat, afunctional annotation scheme for systematic classification of proteinsfrom whole genomes. Nucleic Acids Res 2004, 32:5539–5545.
9. Lehner SM, Atanasova L, Neumann NK, Krska R, Lemmens M, Druzhinina IS,Schuhmacher R: Isotope-assisted screening for iron-containingmetabolites reveals a high degree of diversity among known andunknown siderophores produced by Trichoderma spp. Appl EnvironMicrobiol 2013, 79:18–31.
10. Druzhinina IS, Shelest E, Kubicek CP: Novel traits of Trichoderma predictedthrough the analysis of its secretome. FEMS Microbiol Lett 2012, 337:1–9.
11. Häkkinen M, Arvas M, Oja M, Aro N, Penttilä M, Saloheimo M, Pakula TM:Re-annotation of the CAZy genes of Trichoderma reesei and transcriptionin the presence of lignocellulosic substrates. Microb Cell Fact. 2012,11:134.
12. Seidl V, Huemer B, Seiboth B, Kubicek CP: A complete survey ofTrichoderma chitinases reveals three distinct subgroups of family 18chitinases. FEBS J 2005, 272:5923–5939.
13. Stricker AR, Grosstessner-Hain K, Würleitner E, Mach RL: Xyr1 (xylanaseregulator 1) regulates both the hydrolytic enzyme system and D-xylosemetabolism in Hypocrea jecorina. Eukaryot Cell. 2006, 5:2128–2137.
14. Furukawa T, Shida Y, Kitagami N, Mori K, Kato M, Kobayashi T, Okada H,Ogasawara W, Morikawa Y: Identification of specific binding sites forXYR1, atranscriptional activator of cellulolytic and xylanolytic genes inTrichoderma reesei. Fungal Genet Biol 2009, 46:564–574.
15. Martinez D, Berka RM, Henrissat B, Saloheimo M, Arvas M, Baker SE,Chapman J, Chertkov O, Coutinho PM, Cullen D, Danchin EG, Grigoriev IV,Harris P, Jackson M, Kubicek CP, Han CS, Ho I, Larrondo LF, de Leon AL,Magnuson JK, Merino S, Misra M, Nelson B, Putnam N, Robbertse B, SalamovAA, Schmoll M, Terry A, Thayer N, Westerholm-Parvinen A, et al: GenomeSequence Analysis of the Cellulolytic Fungus Trichoderma reesei(syn. Hypocrea jecorina) Reveals a Surprisingly Limited Inventory ofCarbohydrate Active Enzymes. Nat Biotechnol 2008, 26:553–560.

Bischof et al. Biotechnology for Biofuels 2013, 6:127 Page 14 of 14http://www.biotechnologyforbiofuels.com/content/6/1/127
16. Corder GW, Foreman DI: Nonparametric Statistics for Non-Statisticians: AStep-by-Step Approach. NY: Wiley; 2009.
17. Bartoszewska M, Kiel JAKW: The role of macroautophagy in developmentof filamentous fungi. Antioxid Redox Signaling 2011, 14:2271–2287.
18. Inoue Y, Klionsky DJ: Regulation of macroautophagy in S. cerevisiae.Semin Cell Dev Biol 2010, 21:664–670.
19. Ivanova C, Baath J, Seiboth B, Kubicek CP: Systems analysis of lactosemetabolism in Trichoderma reesei identifies a lactose permease that isessential for cellulase induction. PLOS One. 2013, 8:e62631.
20. Zeilinger S, Mach RL, Schindler M, Herzog P, Kubicek CP: Differentialinduction of two xylanases in Trichoderma reesei. J Biol Chem 1996,271:25624–25629.
21. Herold S, Bischof R, Metz B, Seiboth B, Kubicek CP: Prepared for thepossible: xylanase gene transcription in Trichoderma reesei is triggeredby different inducers representing different hemicellulosic pentosepolymers. Eukaryot Cell 2013, 12:390–398.
22. Akel E, Metz B, Seiboth B, Kubicek CP: Molecular regulation of arabinanand L-arabinose metabolism in Hypocrea jecorina (Trichoderma reesei).Eukaryot Cell 2009, 8:1837–1844.
23. Tisch D, Kubicek CP, Schmoll M: The phosducin-like protein PhLP1impacts regulation of glycoside hydrolases and light response inTrichoderma reesei. BMC Genomics 2012, 12:613.
24. Sun J, Tian C, Diamond S, Glass NL: Deciphering transcriptional regulatorymechanisms associated with hemicellulose degradation in Neurosporacrassa. Eukaryot Cell. 2012, 11:482–493.
25. Stricker AR, Trefflinger P, Aro N, Penttilä M, Mach RL: Role of Ace2(Activator of Cellulases 2) within the xyn2 transcriptosome of Hypocreajecorina. Fungal Genet Biol 2008, 45:436–445.
26. Aro N, Saloheimo A, Ilmén M, Penttilä M: ACEII, a novel transcriptionalactivator involved in regulation of cellulase and xylanase genes ofTrichoderma reesei. J Biol Chem 2001, 276:24309–24314.
27. Coradetti ST, Craig JP, Xiong Y, Shock T, Tian C, Glass NL: Conserved andessential transcription factors for cellulase gene expression inascomycete fungi. Proc Natl Acad Sci U S A 2012, 109:7397–7402.
28. Ogawa M, Kobayashi T, Koyama Y: ManR, a novel Zn(II)(2)Cys(6)transcriptional activator, controls the β-mannan utilization system inAspergillus oryzae. Fungal Genet Biol 2012, 49:987–995.
29. Noguchi Y, Sano M, Kanamaru K, Ko T, Takeuchi M, Kato M, Kobayashi T:Genes regulated by AoXlnR, the xylanolytic and cellulolytictranscriptional regulator, in Aspergillus oryzae. Appl Microbiol Biotechnol2009, 85:141–154.
30. Stricker AR, Steiger MG, Mach RL: Xyr1 receives the lactose inductionsignal and regulates metabolism in Hypocrea jecorina. FEBS Lett 2007,581:3915–3920.
31. Latgé JP: The cell wall: a carbohydrate armour for the fungal cell.Mol Microbiol 2007, 66:279–290.
32. Schreiber G, Kolar H, Foisner R, Kubicek CP: Choline stimulates synthesis ofextracellular proteins in Trichoderma reesei. Arch Microbiol 1986, 144:41–47.
33. Glenn M, Ghosh A, Ghosh BK: Subcellular fractionation of ahypercellulolytic mutant, Trichoderma reesei Rut-C30: localization ofendoglucanase in microsomal fraction. Appl Environ Microbiol 1985,50:1137–1143.
34. Kanki T, Klionsky DJ, Okamoto K: Mitochondria autophagy in yeast.Antioxid Redox Signaling. 2011, 14:1989–2011.
35. Xie Z, Klionsky DJ: Autophagosome formation: core machinery andadaptions. Nat Cell Biol 2007, 9:1102–1109.
36. Cheong H, Nair U, Geng J, Klionsky DJ: The Atg1 kinase complex isinvolved in the regulation of protein recruitment to initiate sequesteringvesicle formation for nonspecific autophagy in Saccharomyces cerevisiae.Mol Biol Cell 2008, 19:668–681.
37. Kabeya Y, Kamada Y, Baba M, Takikawa H, Sasaki M, Ohsumi Y: Atg 17functions in cooperation with Atg1 and Atg13 in yeast autophagy.Mol Biol Cell 2005, 16:2544–2553.
38. Nitsche BM, Burggraaf-van Welzen AM, Lamers G, Meyer V, Ram AF:Autophagy promotes survival in aging submerged cultures of thefilamentous fungus Aspergillus niger. Appl Microbiol Biotechnol 2013.Epub ahead of print.
39. Chen YL, Gao Y, Zhang KQ, Zou CG: Autophagy is required for trapformation in the nematode trapping fungus Arthrobotrys oligospora.Environ Microbiol Rep 2013, 5:511–517.
40. Duan Z, Chen Y, Huang W, Shang Y, Chen P, Wang C: Linkage ofautophagy to fungal development, lipid storage and virulence inMetarhizium robertsii. Autophagy 2013, 9:538–549.
41. Heller J, Tudzynski P: Reactive oxygen species in phytopathogenic fungi:signaling, development, and disease. Annu Rev Phytopathol 2011, 49:369–90.
42. Brun S, Malagnac F, Bidard F, Lalucque H, Silar P: Functions and regulationof the Nox family in the filamentous fungus Podospora anserina: a newrole in cellulose degradation. Mol Microbiol 2009, 74:480–496.
43. Montero-Barrientos M, Hermosa R, Cardoza RE, Gutiérrez S, Monte E:Functional analysis of the Trichoderma harzianum nox1 gene, encodingan NADPH oxidase, relates production of reactive oxygen species tospecific biocontrol activity against Pythium ultimum. Appl EnvironMicrobiol 2011, 77:3009–3016.
44. Xu G, Goodell B: Mechanisms of wood degradation by brown-rot fungi:chelator-mediated cellulose degradation and binding of iron bycellulose. J Biotechnol 2001, 87:43–57.
45. Arantes V, Milagres AM, Filley TR, Goodell B: Lignocellulosicpolysaccharides and lignin degradation by wood decay fungi: therelevance of nonenzymatic Fenton-based reactions. J Ind MicrobiolBiotechnol 2011, 38:541–555.
46. Metz B, Seidl-Seiboth V, Haarmann T, Kopchinskiy A, Lorenz P, Seiboth B,Kubicek CP: Expression of Biomass-Degrading Enzymes Is a Major Eventduring Conidium Development in Trichoderma reesei. Eukaryot Cell 2011,10:1527–1735.
47. Thomas-Chollier M, Sand O, Turatsinze JV, Janky R, Defrance M, Vervisch E,Brohée S, van Helden J: RSAT regulatory sequence analysis tools.Nucleic Acids Res 2008, 1:119–127.
48. Pfaffl MW, Horgan GW, Dempfle L: Relative expression software tool(REST) for group-wise comparison and statistical analysis of relativeexpression results in real-time PCR. Nucleic Acids Res 2002, 30:e36.
49. Ruxton GD: The unequal variance t-test is an underused alternativeto Student’s t-test and the Mann–Whitney U test. Behav Ecol 2006,17:688–690.
50. Kubicek CP: Release of carboxymethyl-cellulase and β-glucosidase fromcell walls of Trichoderma reesei. Eur J Appl Microbiol Biotechnol 1981,13:226–231.
doi:10.1186/1754-6834-6-127Cite this article as: Bischof et al.: Comparative analysis of theTrichoderma reesei transcriptome during growth on the cellulaseinducing substrates wheat straw and lactose. Biotechnology for Biofuels2013 6:127.
Submit your next manuscript to BioMed Centraland take full advantage of:
• Convenient online submission
• Thorough peer review
• No space constraints or color figure charges
• Immediate publication on acceptance
• Inclusion in PubMed, CAS, Scopus and Google Scholar
• Research which is freely available for redistribution
Submit your manuscript at www.biomedcentral.com/submit