Embed Size (px)
Citation preview

RESEARCH Open Access
The polymyxin B-induced transcriptomicresponse of a clinical, multidrug-resistantKlebsiella pneumoniae involves multipleregulatory elements and intracellulartargetsPablo Ivan Pereira Ramos1,2, Márlon Grégori Flores Custódio1, Guadalupe del Rosario Quispe Saji1,Thiago Cardoso1, Gisele Lucchetti da Silva1, Graziela Braun3, Willames M. B. S. Martins3, Raquel Girardello3,Ana Tereza Ribeiro de Vasconcelos1, Elmer Fernández4, Ana Cristina Gales3* and Marisa Fabiana Nicolás1*
From 6th SolBio International Conference 2016 (SoIBio-IC&W-2016)Riviera Maya, Mexico. 22-26 April 2016
Abstract
Background: The emergence of multidrug-resistant Klebsiella pneumoniae is a major public health concern. Many K.pneumoniae infections can only be treated when resorting to last-line drugs such as polymyxin B (PB). However,resistance to this antibiotic is also observed, although insufficient information is described on its mode of action aswell as the mechanisms used by resistant bacteria to evade its effects. We aimed to study PB resistance and theinfluence of abiotic stresses in a clinical K. pneumoniae strain using whole transcriptome profiling.
Results: We sequenced 12 cDNA libraries of K. pneumoniae Kp13 bacteria, from two biological replicates of theoriginal strain Kp13 (Kp13) and five derivative strains: induced high-level PB resistance in acidic pH (Kp13pH),magnesium deprivation (Kp13Mg), high concentrations of calcium (Kp13Ca) and iron (Kp13Fe), and a controlcondition with PB (Kp13PolB). Our results show the involvement of multiple regulatory loci that differentially respondto each condition as well as a shared gene expression response elicited by PB treatment, and indicate theparticipation of two-regulatory components such as ArcA-ArcB, which could be involved in re-routing the K.pneumoniae metabolism following PB treatment. Modules of co-expressed genes could be determined, whichcorrelated to growth in acid stress and PB exposure. We hypothesize that polymyxin B induces metabolic shifts in K.pneumoniae that could relate to surviving against the action of this antibiotic.
Conclusions: We obtained whole transcriptome data for K. pneumoniae under different environmental conditionsand PB treatment. Our results supports the notion that the K. pneumoniae response to PB exposure goes beyonddamaged membrane reconstruction and involves recruitment of multiple gene modules and intracellular targets.
Keywords: Antibiotic resistance, Klebsiella pneumoniae, Pathogen, Polymyxin B, RNA-seq, Transcriptomics
* Correspondence: [email protected]; [email protected]ório Alerta. Division of Infectious Diseases, Department of InternalMedicine, Escola Paulista de Medicina/Universidade Federal de São Paulo,São Paulo, São Paulo, Brazil1Laboratório Nacional de Computação Científica, Petrópolis, Rio de Janeiro,BrazilFull list of author information is available at the end of the article
© 2016 The Author(s). Open Access This article is distributed under the terms of the Creative Commons Attribution 4.0International License (http://creativecommons.org/licenses/by/4.0/), which permits unrestricted use, distribution, andreproduction in any medium, provided you give appropriate credit to the original author(s) and the source, provide a link tothe Creative Commons license, and indicate if changes were made. The Creative Commons Public Domain Dedication waiver(http://creativecommons.org/publicdomain/zero/1.0/) applies to the data made available in this article, unless otherwise stated.
The Author(s) BMC Genomics 2016, 17(Suppl 8):737DOI 10.1186/s12864-016-3070-y
BackgroundAntibiotic discovery represented one of the most signifi-cant events in human health improvement. The antibiotic‘golden age’, when many classes were identified and com-mercialized, extended from 1950 to 1960 [1]. Parallel toantibiotic availability, there were ever increasing numbersof bacteria that could overcome treatment and displayed aresistant phenotype. Extreme cases involve bacteria thatdisplay resistance against all clinically available agents [2].Although the emergence of resistance pre-dates the anti-biotic era, widespread multi-drug resistance (MDR) isnow a major concern that limit therapeutic options in thetreatment of many bacterial infections.Polymyxins, including polymyxin B and colistin, are cat-
ionic antimicrobial lipopeptides (CAMPs) that have beenavailable for decades, but due to their nephrotoxicity andthe lack of pharmacodynamics and pharmacokinetics in-formation, have had its use greatly diminished [3, 4]. Themode of action of these drugs is also not completelyelucidated, but generally involves interaction with lipo-polysaccharides (LPS) located in the outer membrane ofGram-negative bacteria, competing with the calcium andmagnetic ions that stabilize LPS, allowing for drug uptaketo the cell interior [3]. It has been reported that PB activitymay involve inhibition of vital respiratory enzymes locatedin the inner membrane, such as NADH-quinone oxidore-ductase (NDH-2) [5], thereby hampering bacterialrespiration.Recently, polymyxins have re-emerged, now as ‘last
resort’ drugs, used in patients with difficult-to-treat infec-tions caused by MDR Gram-negative bacteria including K.pneumoniae, Pseudomonas aeruginosa and Acinetobacterbaumannii. Resistance to polymyxins, however, has alsobeen described in many settings [6, 7].In order to better understand the mechanisms employed
by MDR bacteria to evade the action of polymyxins, we ap-plied whole transcriptomic profiling of a clinical K. pneu-moniae strain with induced, high-level resistance topolymyxin B. We previously reported the complete genomeof this strain [8], and we identified that it has a truncatedmgrB gene, consistent with reports that mutations in thisgene represent one of the various mechanisms for acquiredcolistin resistance [9–11]. Despite Kp13 being already re-sistant to polymyxin B, we aimed to induce additionaladaptive responses by growth in high polymyxin B concen-trations while also probing in vitro the effects of diverse en-vironmental stimuli. Variations in abiotic stimuli governmany transcriptional regulatory responses, including intwo-component regulatory systems (TCRSs) that may playa role in drug resistance. For instance, varying concentra-tions of divalent cations (such as Mg2+ and Ca2+) alter theexpression of important global regulators such as thePhoP-PhoQ TCRS, which regulates over 40 genes and hasbeen implicated in colistin resistance [12]. On the other
hand, acid pH and iron supplementation were shown to in-duce colistin resistance in A. baumannii probably involvingalterations in regulatory circuits [13].While genome analyses provide a complete picture of
the genes present (and potentially expressed), onlythrough the use of high throughput expression profilingtechniques such as RNA sequencing (RNA-seq), as per-formed in this report, can we find consistent expressionpatterns that can aid in pinpointing the intracellular tar-gets and metabolic processes related to polymyxin Bmode of action and resistance.
MethodsBacterial strain, higher-level polymyxin B resistanceinduction and growth conditionsKlebsiella pneumoniae subsp. pneumoniae Kp13 (here-after referred as Kp13) was isolated in 2009 from a pa-tient during an event of nosocomial outbreak due toKPC-2-producing K. pneumoniae bacteria in an inten-sive care unit from the Hospital Universitário (UEL),South Brazil. The complete genome of this strain iscomprised by one chromosome and six plasmids andwas completely sequenced by our group in a previouswork [8]. Kp13 harbors multiple virulence and resistancedeterminants in its genome, and presents resistant tomany antibiotics [8, 14].Kp13 was originally resistant to polymyxin B (PB) [8] at
a minimum inhibitory concentration (MIC) of 32 μg mL−1
(EUCAST breakpoint [15]). We have induced an in-creased, high-level resistance to this antibiotic by growingthe bacteria in solid Luria-Bertani medium (LB, Oxoid,Basingstoke, England) in the presence of crescent poly-myxin B (Sigma-Aldrich, St. Louis, MO, USA) concentra-tions and passaging the bacteria in serial dilutions of PBbeginning with a concentration of 8 μg mL−1 up to64 μg mL−1. Before and after the induction of resistance,PB MICs were confirmed by CLSI broth microdilutions.Then, we selected from the original strain K. pneumo-
niae Kp13 five derivative strains subcultured in differentphysical conditions, as shown in Table 1. We note thatthe original and derivate strains represented a singleclone presenting high-level resistance to polymyxin Bwith MIC >32 μg mL−1 and MIC >64 μg mL−1, respect-ively (Table 1). Pulsed-field gel electrophoresis per-formed in these six strains (original and derivatives, datanot shown), resulted in similar genetic profiles suggest-ive that expression mechanisms may play an importantrole to their distinct resistance phenotypes.
Total RNA extraction and Illumina sequencingFor each condition, bacterial cultures were grown untilfinal-log phase and cells were all harvested at OD600 nm. Total RNA extraction was performed usingRNeasy Mini Kit (Qiagen) with DNAse treatment
The Author(s) BMC Genomics 2016, 17(Suppl 8):737 Page 448 of 462

(Qiagen). Enrichment for mRNA was performed using theMICROBExpress Bacterial mRNA Purification (Ambion),and rRNA were removed using Ribo-Zero kit (Epicentre).Sequencing of two biological replicates per condition wasperformed in an Illumina HiSeq 2500 (Fasteris, Geneva,Switzerland) using a paired-end strategy.
Expression validation by real time PCRTo validate the expression of selected genes, the transcrip-tional levels of TCRS components related with polymyxinB resistance were evaluated by quantitative real-time PCR(qRT-PCR). Total RNA was isolated from K. pneumoniaeKp13 and derivative strains subcultured in distinct condi-tions (Table 1) using the RNeasy Mini Kit (Qiagen, Hilden,Germany) with addition of RNase-free DNase (Qiagen,Hilden, Germany). Reverse transcription of the extractedRNA was performed using the High Capacity cDNA Re-verse Transcription Kit (Life Technologies, Carlsbad, CA,USA). The pairs of primers used for the amplification ofthe arcB, pmrB, phoP and 16S rDNA genes are shown inTable 2. Transcripts were quantified in triplicate usingSYBR® Green PCR Master Mix (Life Technologies,Carlsbad, CA, USA) in the 7500 Real Time system (LifeTechnologies, Carlsbad, CA, USA). The magnitude of ex-pression (ΔCT) of the studied gene was then obtained by
normalization against the housekeeping 16S gene. Theequation 2-ΔΔCT, where ΔΔCT =ΔCTtarget − ΔCTreference,was applied for relative quantification (RQ) of the differ-ences in gene expression levels between two conditions.To calculate the RQ of each studied gene the expressionat each probed condition (PB+high calcium; PB+high iron;PB+no magnesium; and PB+low pH, with the respectivestrains as in Table 1) was normalized against the PB con-dition (Table 1).
Growth curve and analysis of pH varianceStrains Kp13PolB and Kp13 (non-induced) were subculti-vated in the absence or presence of polymyxin B toevaluate differences in bacterial fitness. The growth ofbacterial strains was monitored until stationary phase ofgrowth was reached. The strains were cultured in theabsence or presence of polymyxin B sulfate 4 μg mL−1 inLB broth overnight. Three milliliters of each culturewere diluted in 447 mL of fresh LB broth in absence orpresence of polymyxin B, and incubated under constantshaking at 37 °C. Ten milliliters of each bacterial suspen-sion was removed every hour. One milliliter was trans-ferred to a cuvette for turbidity measure at 600 nmwavelength, while the remaining 9 mL were used toquantify the pH variation during the bacteria growth.
Table 1 Strains used in RNA sequencing experiments and respective growth conditions
Condition name Strain Conditionsa Concentration (mg L−1) pH MICb (μg mL−1) Reference
CaCl2 MgCl2 FeCl2
Non-induced Kp13 Original strain, no polymyxin B supplementation 25.0 12.5 0.0 7.0 32 [8]
PB Kp13PolB LB supplemented with 4 μg mL−1 of polymyxin B 25.0 12.5 0.0 7.0 64 This study
PB + high calcium Kp13Ca LB supplemented with 4 μg mL−1 of polymyxin Bplus high [Ca2+]
75.0 12.5 0.0 7.0 64 This study
PB + no magnesium Kp13Mg LB supplemented with 4 μg mL−1 of polymyxin Bwithout Mg2+
25.0 0.0 0.0 7.0 128 This study
PB + high iron Kp13Fe LB supplemented with 4 μg mL−1 of polymyxin Bplus high [Fe2+]
25.0 12.5 75.0 7.0 64 This study
PB + low pH Kp13pH LB supplemented with 4 μg mL−1 of polymyxin Bin acid pH
25.0 12.5 0.0 5.8 64 This study
aThe concentration of polymyxin corresponded to the concentration used during the extraction of RNA for RNAseq. All experiments were performed in duplicate.b,Minimum inhibitory concentration of polymyxin B in the respective strain
Table 2 Primers sequence used in qRT-PCR experiments
Primers Sequence Amplicon size Reference
arcB_RT-F 5′ GCTGAACGTCCAACTGAAAG 3′ 157 bp This study
arcB_RT-R 5′ GGAGGATTGCTGTTCGAGC 3′
phoP_RT-F 5′ TGCCGGATGAAGACGGACTA 3′ 226 bp This study
phoP_RT-R 5′ AGGGAGATCACCTGTGAGGC 3′
pmrB_RT-F 5′ GCTGATCCAGCGTCTCGATC 3′ 106 bp This study
pmrB_RT-R 5′ CAACAGCACCTGCTGGTAGC 3′
16S_RT-F 5′ CAGCTCGTGTCGTGAGATGT 3′ 150 bp [66]
16S_RT-R 5′ CGTAAGGGCCATGATGACTT 3′
The Author(s) BMC Genomics 2016, 17(Suppl 8):737 Page 449 of 462

Data analysisRaw read preprocessing and quality control (QC) wereperformed with FastQC [16], which allows assessment ofdiverse quality metrics of the sequencing data. Removalof adapters and low-quality reads were performed withSkewer [17]. We applied the normalization methodRemoval of Unwanted Variation (RUV) in order to prop-erly correct for batch effects in experimental data ob-tained through RNA sequencing [18]. For this approachwe used the MLST genes of Klebsiella, available at theInstitut Pasteur MLST database website [19], as controlgenes among the cDNA libraries data [20]. Reads pass-ing QC were aligned to the K. pneumoniae Kp13 refer-ence genome (NCBI BioProject accession PRJNA78291)using Top-Hat2 [21], and SAMtools [22] was used toparse alignments and QC of the mappings. Gene countswere obtained using HTSeq [23] and differential geneexpression was evaluated with edgeR [24], which modelsexpression data as negative binomial distributed. The PBcondition (Table 1) was the reference condition for com-parisons performed in the RNA-seq analyses unlessotherwise noted in the text.
Co-expression network constructionGene co-expression networks were created using weightedgene co-expression network analysis (WGCNA) packagein R [25]. Variance-stabilized count data were used as ameasure of gene expression. The biweight midcorrelationalgorithm implemented in the bicor function in WGCNAwas used to calculate expression correlation between eachpair of genes. This correlation measure is similar to Pear-son’s correlation with the advantage of being more robustto outliers [26]. The correlation matrix was transformedinto a weighted adjacency matrix representing connectionstrengths using a soft-thresholding approach by applying apower transformation with an appropriate β parameter,f(x) = xβ. β is chosen such that the resulting adjacencymatrix leads to a weighted co-expression network that dis-plays approximately scale-free topology. In this frame-work, a value of β = 14 was used in our analyses, whichresulted in a scale-free model fitting with R2 >0.80. Oncethe adjacency matrix was constructed, we derived from ita topological overlap matrix (TOM), which takes gene ex-pression connectivity into account. 1-TOM was used asdissimilarity measure for hierarchical clustering andmodule detection. Module assignment was determinedusing the dynamic tree cut algorithm within WGCNA[25]. Module eigengenes were tested for associationwith the different experimental conditions and thosedisplaying significant correlation, defined as Pearson's|r| ≥ 0.6; p-value <0.05, were more thoroughly studiedby means of Gene Ontology (GO) enrichmentanalysis.
GO enrichment analysisGenes belonging to each module of interest were sub-mitted to ClueGO v. 2.2.4 [27] for Cytoscape v.3.3.0[28], which performs Gene Ontology enrichment ana-lysis and cluster detection. Only biological process termswere considered, and GO terms were grouped if theirkappa score was ≥0.4. The statistical test chosen to iden-tify enriched biological process terms was the right-sidedhypergeometric test, considering as significant termswith adjusted p-value <0.05 and comprising at leastthree genes. The Benjamini-Hochberg procedure was ap-plied to control the false discovery rate. To study boththe more general biological processes associated to eachmodule as well as the more specific terms, the “GO treeinterval” parameter was set to either (min = 2, max = 5)or (min = 7, max = 15), respectively.
Results and discussionEvaluation of the global transcriptional response of K.pneumoniae to increased polymyxin B resistanceFirstly, we investigated the general transcriptional responseof K. pneumoniae Kp13 in view of increased resistance topolymyxin B (PB). Prior to high-level experimental induc-tion of resistance, Kp13 was already PB-resistant (MIC32 μg mL−1) and had a truncated mgrB gene due to trans-posase insertion, a mechanism already described in the lit-erature as providing PB resistance [9, 11]. We wereinterested in detecting additional mechanisms of resistanceto this antibiotic as well as understand the effect of PBtreatment combined with diverse abiotic stresses in the glo-bal gene expression response of K. pneumoniae.A total of 12 cDNA libraries were generated that in-
cluded the six experimental conditions (Table 1) eachwith two biological replicates. The total number of rawreads obtained was 73,438,485. The number of expressedgenes ranged from 5613 to 5662, fairly stable amongconditions. The presence of a large number of genes inthe K. pneumoniae transcriptome is not unsual, as previ-ous reports with multiple isolates found between 4744and 5378 genes expressed, which is also dependent onthe growth conditions [29]. The number of differentiallyexpressed (DE) genes (relative to condition PB in Table 1;FDR≤0.01) were 838; 691; 2022; 2162 and 3488 DE genesin Kp13 strain (original strain), Kp13Mg (PB+no magne-sium), Kp13Ca (PB+high calcium), Kp13Fe (PB+high iron)and Kp13pH (PB+low pH), respectively (Fig. 1a). We notethe difference between the original strain Kp13 and the in-duction of a higher level resistance against polymyxin B inthe other conditions (Table 1). The original strain as wellas the Kp13Mg strain were the least responsive, in terms ofDE genes, relative to the PB condition. We also deter-mined the genes with shared PB-dependent differentialexpression, which is composed of 41 up- and 28 down-regulated genes (Fig. 1b and c), by considering the gene
The Author(s) BMC Genomics 2016, 17(Suppl 8):737 Page 450 of 462

expression in the Kp13PolB strain relative to the strainsgrown in abiotic changes (Kp13 [to which no PB wasadded], Kp13Ca, Kp13Fe, Kp13Mg and Kp13pH [towhich PB was added]). These can be regarded as thecore, sustained activation/repression response to PBtreatment independent of abiotic stresses (Additional
file 1). On the other hand, the complete expressiontable of each gene relative to the PB condition isavailable as Additional file 2.Among the shared PB-dependent up-regulated genes
are various transcriptional factors (TFs). These TFs (andcorresponding locus) include the OmpR regulator
A
B C
Fig. 1 Transcriptomic response of Klebsiella pneumoniae Kp13 to different environmental stimuli. a The outer rings organized as pseudo-chromosomesharbor differentially expressed genes respective to the PB condition, except for the red ring representing the union of the conditions. Links from thetop 10 % DE (up- and down-regulated) genes to the union of conditions are depicted, and for each condition a heatmap of expression of each gene(in log2[fold-change] scale) is shown. Below the union of the conditions an histogram of the frequency of DE genes is shown (i.e. if a gene appears DEin all conditions a value of five is shown in the histogram). Selected gene labels are shown on the innermost ring, question marks denote hypotheticalgenes being found differentially expressed. b, c Venn diagram showing the differentially expressed up- (Panel b) and down-regulated (Panel c) genesin the different conditions relative to PB. Criteria for significance: FDR≤0.01. The image was prepared with Circos [67] and jvenn [68]
The Author(s) BMC Genomics 2016, 17(Suppl 8):737 Page 451 of 462

(KP13_00688) as well as the argR gene (KP13_31778)and genes encoding for a putative HTH-transcriptionalregulator (KP13_03008; KP13_00251). Also detected wasarcB (KP13_03225), part of the TCRS arcAB which has beenshown to be highly pleiotropic, and modulates the expres-sion of genes encoding for proteins with membrane modifi-cation functions as well as TCA cycle enzymes dependingon oxygen levels or redox state [30, 31]. Other TFs detectedincluded rpoH (KP13_08477), rpoN (KP13_03232). rpoH,encoding for the RNA polymerase σ32 factor is involved instress response, mobilizing genes that constitute the heat-shock stimulon, such as those encoding for chaperones andproteases [32], while rpoN codes the σ54 factor, involved inthe regulation of nitrogen utilization genes. Among the up-regulated genes we also highlight wzzE (KP13_13130) andthe ORF KP13_00225, encoding for a lipopolysaccharidebiosynthesis protein and a putative inner membrane protein,respectively. Overall, the combined evidence show that themain up-regulated functions in PB treatment are those re-lated to membrane functionality and maintenance. This is inline with the primary mode of action reported for this anti-biotic, which permeabilizes the Gram-negative bacterial OMvia direct interaction with the LPS [33].Examination of down-regulated genes revealed that both
the glycerol uptake (glpF and glpT) and metabolic pathwaysrelated to anaerobic catabolism of glycerol (dhaD, dhaK,dhaM, glpA, glpB, glpC, glpD, glpQ and plsY) are repressedby exposure to polymyxin B independently of environmentalstimuli. Interestingly, a secondary mode of action for PB hasbeen described and involves inhibitory activity againstNDH-2, a vital respiratory enzyme in the bacterial innermembrane [5]. This would lead to the activation of genes in-volved in the response to decreased oxidative power withinthe cell, including arcB, as we have observed. Besides repres-sing TCA genes it is also known that the ArcA-ArcB TCRSacts repressing genes encoding primary dehydrogenasessuch as glpD [31], which would explain our findings.
Respiratory/fermentative pathways and hydroxyl radicalscavenging form part of the response of K. pneumoniaeto polymyxin B and abiotic stimuliK. pneumoniae is a metabolically versatile bacteriumable to grow aerobically or anaerobically, and its genomecontains all the genes encoding for the complete set ofenzymes for obtaining energy from respiration orfermentation. How the bacteria adapt its metabolisminto any of these growth conditions depends on theavailability of oxygen (aerobic respiration) or alternativeelectron acceptors (e.g. nitrate, nitrite, fumarate duringanaerobic respiration), and on the fermentability of theavailable carbon sources. The control between these dif-ferent metabolic modes lies on the repression and dere-pression of the corresponding enzymes [34, 35]. Recentstudies report that polymyxin B inhibits the activity of
NDH-2 in the bacterial inner membrane of K. pneumoniae,E. coli and A. baumannii [5]. Besides the type II NDH-2that is encoded by the ndh gene, these bacteria produce an-other type of NADH-quinone oxidoreductase for the re-spiratory chain, namely the type I (NDH-1) encoded by 13tandemly arranged genes (nuoA-nuoN) [34]. In E. coli theNDH-2 is dominantly expressed under aerobic growth con-ditions, whereas the NDH-1 is induced under semiaerobicconditions [34]. So far, there are few reports on the effectsof disruption of NADH-quinone oxidoreductases activity,particularly for NDH-2 in Gram-negative bacilli [5]. Pre-sumably, in A. baumannii the mechanism of bacterial kill-ing by polymyxins, which is mediated by release ofhydroxyl radicals, might be due to disruption of a criticalrespiratory chain enzyme [36]. By our RNA-seq approach,ndh showed slightly decreased expression following anti-biotic treatment (0.5-log-fold decrease with FDR≤0.01) aswell as some genes encoding for NDH-1 (0.3-log-fold de-crease significant differentially expressed genes at a FDR of<0.05) (Table 3). The only primary dehydrogenases (DH)showing increased gene expression after treatment with PBwere formate hydrogenylases (fdhF, hycA-hycH), D-aminoacid DH (dad or dad2), glucose DH (gcD) and some sub-units of succinate DH (sdhCDAB) (Table 3). Regarding theexpression of genes involved in the biosynthesis of ubiquin-one (UQ) and naphthoquinone menaquinone (MK), our re-sults show that, as much as NDH-1 and NDH-2, mostwere repressed after treatment with PB (Table 3). This re-sult is in agreement with the knowledge that NADH dehy-drogenases type I and II transfer electrons to UQ as well asto the naphthoquinones [37].Thus, our results show that polymyxin B affects the ex-
pression of several genes encoding for respiratory chainenzymes, which may lead to a shift in alternative respira-tory and fermentation pathways for bacterial energymetabolism and to reoxidize the NADH produced by gly-colysis. Therefore, we investigated the response of genesencoding for enzymes in these alternative pathways, bothby the effect of PB with or without abiotic stimuli. In Add-itional file 3 we depict a model, according to the data ob-tained, of carbon flux in Kp13 under fermentativeconditions by stresses imposed by PB (Additional file 3, A)or PB plus abiotic stimuli (high calcium/iron, magnesiumdepletion or low pH) (Additional file 3, B). Consequentlyto stress imposed by PB without abiotic stimuli the ex-pression of genes encoding for the three enzymatic com-ponents of 2-oxoglutarate dehydrogenase complex wereslightly repressed (sucA: log2FC = −0.1 with FDR≤0.05,sucB: log2FC = −0.3 with FDR≤0.01 and lpdA: log2FC =−0.2 with FDR≤0.05). This repression was more pro-nounced with stress of PB in combination with abioticstimuli, in particular in PB+high Ca (sucA: log2FC = −1.4,sucB: log2FC = −0.8 and lpdA: log2FC = −1.6, all withFDR≤0.01) and PB+low pH (sucA: log2FC = −2.4, sucB:
The Author(s) BMC Genomics 2016, 17(Suppl 8):737 Page 452 of 462

Table 3 Relative expression of quinone biosynthesis and oxidoreductase genes belonging to the K. pneumoniae Kp13 respiratory chain
Enzyme name Gene name Locus ID log2FC
Primary dehydrogenases (DH):
Formate dehydrogenase-N subunit alpha (FDH-N subunit alpha) fdnG KP13_32232 0.1
Formate dehydrogenase-N subunit beta (FDH-N subunit beta) fdnH KP13_04527 −0.3
Formate dehydrogenase-N subunit (FDH-N subunit gamma) fdnI KP13_04529 0.1
Formate hydrogenlyase H fdhF KP13_05320 1.1
Formate hydrogenlyase regulatory protein hycA hycA KP13_02572 0.6
Formate hydrogenlyase subunit 2 to 7 hycB-G KP13_02573-8 0.9, 1.6, 0.9, 0.8, 0.9, 1.2
Formate hydrogenlyase maturation protein HycH hycH KP13_02579 1.3
NADH-quinone oxidoreductase (NDH-1) nuoA-nuoN KP13_00993-81 0.1, 0, 0.2, 0, 0, −0.2, 0, −0.3,−0.1, −0.2, −0.1, −0.1, −0.1
NADH-quinone oxidoreductase (NDH-2) ndh KP13_04904 −0.5
Glycerol-3-P DHO glpD KP13_00670 −1.5
Glycerol-3-P DH N (subunit A) glpA KP13_00962 −3.6
Glycerol-3-P DH N (subunit B) glpB KP13_00963 −2.1
Glycerol-3-P DH N (subunit C) glpC KP13_00964 −1.4
Pyruvate oxidase poxB KP13_04234 0.1
D -Lactate DH dld KP13_03193 −0.1
L -Lactate DH lctD or lldD KP13_00216 0.2
D -Amino acid DH dad (dad2) KP13_04669 0.9
Glucose dehydrogenase gcD KP13_32152 0.1b
Succinate DH sdhCDAB KP13_03281-77 0.3, 0.1, 0.1, 0, −0.1
Quinone biosynthesis:
Ubiquinone (UQ) ubiA-ubiH ubiX KP13_00377KP13_01733KP13_00376KP13_01739KP13_01731KP13_03318KP13_00956KP13_02174KP13_01019
−0.3−0.1−0.10.30.100.20.40
Naphthoquinone menaquinone (MK) menB-menF menH KP13_00975KP13_00974KP13_00977KP13_00973KP13_00978KP13_00976
−0.10.2−0.5−0.10.1−0.4
Terminal reductases:
Quinol oxidase bo 3 cyoABCE KP13_03683KP13_03684KP13_20485KP13_03687
0.1−0.1−0.2−0.1
Quinol oxidase bd cydAB KP13_03271-2 −0.3
Quinol oxidase III (Cyx) appBC KP13_04076-5 0.3
Nitrate reductase A narGHJI KP13_04712-09 0.2, 0.5, 0.6, 0.3
Nitrate reductase Z narZYWV KP13_04512-09 0.6, 0.3, 0.7, 0.5
Nitrate reductase, periplasmic nasAB KP13_04717-8 0.8, −1.1
DMSO reductase dmsBAD KP13_01159-61 0.8, 0.5, −0.2
The Author(s) BMC Genomics 2016, 17(Suppl 8):737 Page 453 of 462

log2FC = −1.6 and lpdA: log2FC = −1.6, all with FDR≤0.01)(Table 3). One explanation for this repression may relateto the observation that arcA-arcB showed high expressionlevel following the pressure of PB without abiotic stimuli,and this TCRS represses the expression of the genes in-volved in the TCA cycle, such as the sucABCD system[31]. Under low expression of the genes encoding for the2-oxoglutarate dehydrogenase complex the citric acidcycle may be interrupted, leading to a shift from aerobicpathways to the fermentation route [31]. Upon PB stress itseems that lactate and acetolactate can be produced ac-tively because ldhA and lvG showed increased expressionfollowing PB treatment, almost independently of abioticstimuli (Additional file 3, A; Table 3). Conversely, the in-fluence of abiotic changes together with PB induces up-regulation of genes involved in the production of ethanol,acetate and ATP, formate, butane 2,3-ediol and 1,3-propa-nediol (Additional file 3, B; Table 3). The synthesis of acidby-products would be observable as a lowering in the pHof the medium. To test this hypothesis, we performed anexperiment of K. pneumoniae Kp13 growth under poly-myxin B exposure (analogous to the PB condition inTable 1) and absence, concurrently measuring themedium pH at hourly intervals (see Additional file 4). Weobserved that, while there is a general trend of acidifica-tion of the culture pH, this lowering is more pronouncedin bacteria grown under PB stress (Additional file 4), sug-gesting that PB exposure induces metabolic shifts in K.pneumoniae that lead to synthesis of acidic by-products.The metabolism of glycerol by Kp13 under the pres-
sure of PB (Additional file 3, C) and PB plus abioticstimuli (Additional file 3, D) were also studied. Notably,it seems that all genes of this pathway showed decreasedexpression following PB treatment, whereas PB in com-bination with abiotic stimuli induces up-regulation of allgenes for production of 1,3-propanediol.In this sense, the shift in synthesis of metabolic by-
products might reflect a decrease in NADH oxidationvia the respiratory chain, which is compensated by theNADH consuming lactate or acetolactate (under PBstress), and ethanol or 1,3-propanediol (under PB+abi-otic stimuli stresses) production.On the other hand, disruption in the electron transport
chain induces the production of superoxide (HO2.-) that is
converted in hydrogen peroxide (H2O2), which in turn par-ticipate in the Fenton reaction and additionally inducesynthesis of hydroxyl radicals [38, 39]. Large concentrationsof superoxide and hydrogen peroxide trigger bacterial anti-oxidant defenses, but small amounts of hydroxyl radicals(OH−) do not elicit adequate defense mechanisms andcould quickly become fatal [38, 40]. In Gram-negative bac-teria, the intracellular superoxide dismutases Mn-SodA andFe-SodB, catalyze the dismutation of metabolic sources ofsuperoxide to hydrogen peroxide and oxygen [41]. Then, inthe presence of transition iron ions (Fe2+), the hydrogenperoxide can be converted to hydroxyl radicals via Fentonchemistry: Fe2+ + H2O2→ Fe3+ + OH. + OH−. In bacteria,the scavenging enzymes that can resolve the hydrogen per-oxide production are glutathione peroxidases and catalases[39, 40]. For that, glutathione peroxidases by oxidation ofglutathione (GSH): 2GSH+H2O2→GSSG+ 2H2O andcatalase via the reaction 2H2O2→O2 + 2H2O [42].In our RNA-seq analysis, we observed that sodA
(KP13_00587) was up-regulated in PB without the influ-ence of abiotic changes, whereas sodB (KP13_05143) ap-peared slightly overexpressed in high iron and magnesiumdeprivation conditions (Additional file 2). Genes encodingfor a glutathione peroxidase (KP13_31955) and CatalaseHPII (katE, KP13_05384) were overexpressed in poly-myxin B independently of abiotic changes. While katG(KP13_04579) encoding for a catalase-peroxidase bufunc-tional enzyme appeared overexpressed in high calcium/iron conditions (Additional file 2).One of the mechanisms used by bacteria to cope with
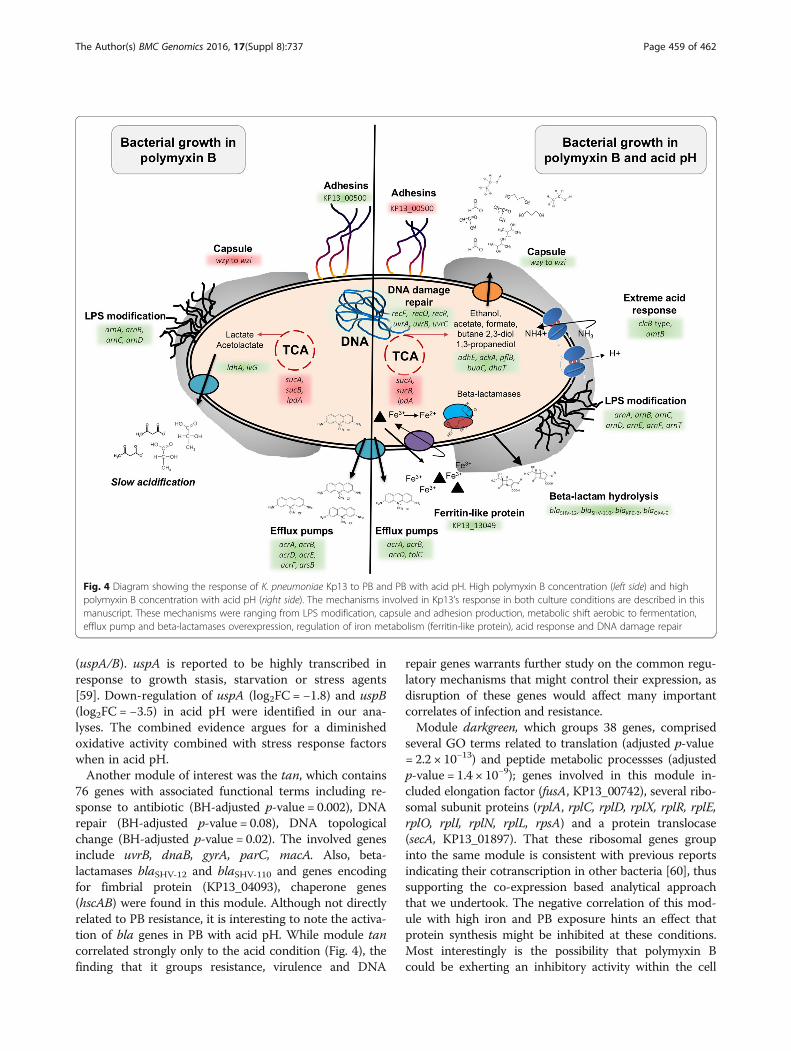
the oxidative stress induced by Fenton products involvethe intracellular regulation of iron metabolism mediatedby bacterioferritin (Bfr) or ferritin-like proteins. Theseproteins sequester intracellular Fe2+ ions and stores it inthe form of Fe3+, where one hydrogen peroxide oxidizestwo Fe2+ ions, thus preventing hydroxyl radical produc-tion by the Fenton reaction [43]. Here, we identified agene encoding for ferritin-like protein (KP13_13049)overexpressed in PB considering all abiotic changes, witha specially consistent up-regulation in PB with high ironcondition (log2FC = 1.6) (Additional file 2). It has beenreported that the production of hydroxyl radicals in-duced by polymyxin treatment is concurrent with rapidkilling of Gram-negative A. baumannii [36].
Table 3 Relative expression of quinone biosynthesis and oxidoreductase genes belonging to the K. pneumoniae Kp13 respiratory chain(Continued)
Fumarate reductase frdABCD KP13_31481KP13_00513KP13_00512KP13_00511
−0.2−0.10.5−0.3
Relative expression (log2(fold-change) [log2FC]) of genes encoding for quinone biosynthesis and oxido-reductases of the respiratory chains of Kp13 for bacterialgrowth in polymyxin (PB) versus control condition (non-induced). Criteria for significance: FDR≤0.01. log2FC values in bold, positive denotes up-regulation in PBand log2FC in bold, negative denotes down-regulation in polymyxin. log2FC in italic font are not significant based on FDR. bThese comparisons gave significant dif-ferentially expressed genes at a FDR of ≤0.05
The Author(s) BMC Genomics 2016, 17(Suppl 8):737 Page 454 of 462

Additionally, Fenton oxidants cause oxidation of DNAand free nucleotides, which can induce mismatched pairing,mutagenesis, and DNA breaks. We detected significantelevated relative expression of genes encoding for DNAdamage repair proteins in polymyxin B with acid pH(recF - KP13_00050 - log2FC = 2.8; recO - KP13_00815- log2FC = 0.7, recR - KP13_03619 - log2FC = 2.3; uvrA- KP13_00395 - log2FC = 2.3; uvrB - KP13_03032 -log2FC = 0.2; uvrC - KP13_01656 - log2FC = 1.2) andhigh iron condition (recN - KP13_02431 - log2FC = 0.2)(see Additional file 2). These observations were con-firmed by the detection of co-expressed gene modulesrelated to DNA damage repair processes, which arepresented in the last section of the results.Also, we identified that gene expression level of tisB
(KP13_31738, Additional file 2), which codes a proteinpart of the SOS-response regulon controlled by LexA,was increased during PB pressure with high calcium/ironcondition (log2FC>1.4) (Additional file 2). In E. coli, ithas been shown that this protein is toxic since its over-production cause slow or stop bacterial growth, probablyallowing DNA repair before cells continue to grow [44].With regard to the defense mechanisms against acidic
pH conditions, we identified a gene (KP13_00169) en-coding for a chloride channel/voltage gated protein up-regulated in PB with all abiotic changes (log2FC>1.4),but having considerable higher overexpression in acidpH condition (log2FC = 3.5) (Additional file 2). This pro-tein belongs to the chloride channel (TC 2.A.49) familyand probably acts as an electrical shunt for anoutwardly-directed proton pump that is linked to aminoacid decarboxylation, as part of the acid resistance re-sponse [45].On the other hand, we also identified PB-dependent over-
expression of a few genes encoding for proteins that are acti-vated in response to cold shock, such as deaD(KP13_01093, cold-shock DEAD box protein A with highestlog2FC>2.9 in PB with acid pH condition), cspA(KP13_00250, cold shock protein CspA with highestlog2FC>4.8 in PB with acid pH condition) (Additional file 2).We performed quantitative real-time PCR (qRT-PCR)
to independently validate the expression of some of thestudied genes (phoP, pmrB and arcB). These genes werechosen based on their involvement in the response to PBexposure, as discussed, for instance, with arcB. With fewexceptions, the three genes displayed similar expressiontrends in the various experimental conditions tested, thusvalidating the digital gene expression measurements pro-vided by the RNA-seq experiments (Additional file 5).
Environmental stimuli elicit differential responses in theexpression of regulatory systemsWe have also studied the expression of other identifiedTCRS. While magnesium deprivation generated low-
level repression on most of these regulatory circuits, inacid pH and high calcium/iron conditions, a similar pat-tern of activation/repression of regulatory genes was ob-served, leading to their clustering (Additional file 6). Forinstance, genes arcA, arcB, phoB, phoR, narL, citB, ompRand rcsB showed repression (log2FC < −1.0), consideringthe abiotic condition relative to PB condition (Fig. 2).The expression of arcB was validated by qRT-PCR, aspreviously observed. PhoBR has been primarily impli-cated in phosphate homeostasis, and its involvement instress responses such as acidic pH was previously re-ported [46]. That this system appears repressed whenconsidering only the influence of abiotic changes sug-gests the participation of other regulatory mechanismsor signals controlling its expression in K. pneumoniae.narL and citB are involved in anaerobic nitrate and cit-rate metabolism [47, 48], and were also found repressed,specially when the bacteria are grown in acidic medium,with log2FC of −1.3 (narL) and −1.92 (citB). The meta-bolic shift from aerobic to anaerobic in response to PB,through alternative pathways, was previously explored inthis report. ompR is part of a TCRS along with envZ thatresponds to external osmolarity, while rcsB is one of themediators of capsule synthesis [49].On the other hand, differential activation of several
regulators in specific abiotic stimuli were detected inour experiments, including the phoP-phoQ system whichwas found more activated in low pH and high calcium/iron conditions (Fig. 2; Additional file 5); zraR-zraS is azinc-responsive TCRS involved in tolerance to metalsand its differential activation occurred mostly in highcalcium and iron conditions. This system has beenregarded as important for pathogenic Salmonella duringinfection in pig [50]. basR (or pmrA) and basS (orpmrB), which have been implicated in PB resistance, ap-pear overexpressed in low pH and high iron conditions(Fig. 2), in line with previous observations [51]. In highiron condition, however, there were opposite responsescomparing the RNA-seq data with the qRT-PCR, wherein the latter pmrB appeared repressed. cpxA, part of theCpxA-CpxR TCRS, appeared slightly overexpressed inacid pH and high iron/calcium concentrations (Fig. 2).This system is involved in envelope stress response, ad-hesion, motility and pathogenesis, and modulates the ex-pression of a large number of genes [30]. Furthermore,cpxA-cpxR has also been implicated in oxidative stresstolerance in K. pneumoniae [52].We have also identified a strong (log2FC≥2) activation
in acid pH and high calcium/iron conditions of evgS,which form part of a TCRS along with evgA. EvgA-EvgSsystem has been reported as modulator of the expressionof several genes including multidrug-related, mostly inresponse to osmolarity changes in the medium. Thus,the finding that the sensor component evgS was more
The Author(s) BMC Genomics 2016, 17(Suppl 8):737 Page 455 of 462

activated in the low pH condition was not unexpected.The analysis of genes previously reported to be underregulation of this system in E. coli [53] allowed the identi-fication of orthologs in K. pneumoniae Kp13 that displaysimilar expression response in the low pH condition. Forinstance, we identified in Kp13 an ortholog of yfdX (55 %identity to the E. coli sequence, BLASTP; Kp13 locusKP13_31877), that is strongly activated in low pH condi-tion (log2FC = 2.0), in a similar fashion to the cognategene in E. coli [53]. These collateral results are of value tobetter explore the uncharacterized fraction of K. pneumo-niae genes and represent a complementary result attained
by this transcriptomic study in better delineating con-served regulatory responses in clinically importantbacteria.
Co-expression network analysis reveals functionalsignatures related to polymyxin B, iron limitation andacidic pHTo determine gene-expression signatures related to abi-otic stresses and PB treatment, we performed co-expression network analysis using the variance-stabilizedcount data as input. The premise of this analysis is thatco-expressed genes are biologically related, and thus can
Fig. 2 Expression of identified two-component systems in K. pneumoniae Kp13 with distinct environmental stimuli. Expression values are represented aslog2(fold-change) of the condition compared to the PB condition (log2(abiotic condition/PB condition). Thus, a positive log2FC value indicates higher expressionof the gene in face of abiotic stress to which it was subjected. For each system, the sensor protein is highlighted in bold, while the regulatory component isin normal formatting. The main functions and signals perceived by each system are shown according to literature mining
The Author(s) BMC Genomics 2016, 17(Suppl 8):737 Page 456 of 462

be grouped into clusters or modules. The modules weredifferentiated by assigning to each a color label, withgrey reserved for those that remained unassigned due tolow co-expression. A total of 24 modules were detectedusing this approach, with the smaller module comprising28 genes (module darkgrey) and the largest module hav-ing 988 genes (module turquoise) (Fig. 3a and b). Wecalculated module eigengene, which is the first principal
component of each module, summarizing the within-module expression pattern, and used it to assess whethermodules related to our RNA-seq experimental conditions.Some of the modules displayed significant correlation(marked in bold in Fig. 3c) and might shed further lighton the more fine-grained molecular aspects involved inthe bacterial response to the different stimuli in our exper-iments. For instance, module darkgrey had module
A C
B
D
Fig. 3 Determination of co-expressed gene modules related to PB and abiotic stresses. Modules were identified using hierarchical clusteringfollowed by dynamic tree cutting algorithm in WGCNA. Each co-expression module was assigned to a unique color (Panel a). The number ofgenes that grouped into each module ranged from 28 (module darkgrey) to 988 (module turquoise) (Panel b). Modules were related to our experimentalconditions, and we could detect modules significantly correlated to polymyxin B, low pH and high iron (marked in bold in Panel c). The membership ofeach gene to its module and its significance to the experimental condition is plotted for selected modules in Panel d. These genes can be regarded as keydrivers in these modules
The Author(s) BMC Genomics 2016, 17(Suppl 8):737 Page 457 of 462

eigengene positively correlated to the acid medium condi-tion (Pearson’s r = 0.88; p-value = 2 × 10⁻⁴) (Fig. 3c); thatis, genes in this module displayed expression patterns thatwere also associated to the low pH condition (Fig. 3d).The brown module was also positively associated to lowpH (Pearson’s r = 0.82; p-value = 1 × 10⁻³) (Fig. 3d), whilemodules cyan and royalblue could be related to high ironand PB exposure, respectively (Fig. 3c and d). Some mod-ules were also anti-correlated to the conditions, such asmodule yellow which was negatively correlated to acid pHcondition (Pearson’s r = 0.84; p-value = 7 × 10⁻⁴). In orderto understand their biological relevance, these significantmodules were studied in detail by means of GeneOntology enrichment analysis. Modules and associatedgenes and GO terms are available in Additional file 7.Module darkgrey comprised 28 genes with associated
GO terms related to glutamate biosynthetic process(Benjamini-Hochberg [BH] adjusted p-value = 0.1), ATPhydrolysis coupled proton transport (BH-adjusted p-value= 0.1) and protein metabolic processes such as proteincomplex disassembly (BH-adjusted p-value = 0.01). Thefinding that this module is strongly, positively correlatedto the low pH condition relates to described mechanismsof acid tolerance in bacteria. Although terms related toglutamate synthesis had low statistical significance, prob-ably due to the small module size, their identification con-firms literature evidence that glutamate is important forbacterial survival in low pH, as it can be decarboxylatedby specific enzymes which consume proton in the process[54]. Also, proton transport across the membrane bymeans of ATP synthase is an active strategy to maintainpH homeostasis on the cell interior, pumping excess H+
out of the cell. The gene encoding for subunit alpha ofATP synthase (atpA) was placed in this module, and itsexpression was slightly up-regulated in low pH whencompared to the control PB condition grown at pH 7.0(log2FC = 0.6). In fact, all subunits of ATP synthase aremore activated when in acid pH, indication of a consistentpattern and involvement of this enzyme in response toacid stress (Additional file 2), as has been reported forother bacteria [55]. The pink module, which also displayedpositive correlation to the acid pH condition (Fig. 3), in-cluded ATP synthase genes atpG, atpD and atpC, in-volved in ATP synthesis coupled proton transport (BH-adjusted p-value = 7.5 × 10⁻³). The log2FC of these genesrelative to the PB condition were of 2.00, 1.97 and 2.97, re-spectively. The presence of this biological process in mul-tiple modules related to low pH might punctuate a role inface of acid stress. Terms related to ribosome biogenesis(BH-adjusted p-value = 0.01) and RNA processing (BH-adjusted p-value = 0.01) were also enriched in this module,as well as branched-chain amino acid (BCAA) biosyn-thetic process (BH-adjusted p-value = 0.03), with genessuch as ilvC, leuB and leuC forming part of the module.
Routing of metabolism to produce BCAA is a mechanismemployed by bacteria to survive acid stress, as they can befurther decarboxylated by proton-consuming enzymes [56],which were previously identified in module darkgrey. Alsoin module pink were genes acrA and acrB coding for anacriflavine efflux pump. It is known that K. pneumoniaeuses the AcrAB-TolC efflux pump system to mediate resist-ance against fluoroquinolones and to resist CAMPs [57].Also, in our experiments, the genes acrA, acrB and tolCwere more expressed in PB with acid pH (Additional files 2and 5; also see scheme in Fig. 4).Module brown, also related to low pH, was enriched in
terms related to ion transmembrane transport (BH-ad-justed p-value = 0.2), which includes genes amtB (encod-ing for an ammonia channel) and the chloride channelKP13_00169 (previously discussed), mechanisms whichwould allow, respectively, for the entrance of NH3 (thatcan react with H+ yielding NH4
+ and increasing pH) andthe pumping out of H+ species [56]. Indeed, amtB expres-sion is higher when in low pH condition (log2FC = 1.1). Inthis module was also found arnB, arnC, arnD, arnE, arnFand arnT genes, encoding for proteins that participate inthe addition of 4-amino-4-deoxy-L-arabinose to lipid A,contributing to a more positive charge on LPS, which inturn decreases PB affinity to the membrane [58]. ArnA,encoded by gene arnA (found in the pink module), is alsoinvolved in this process, and was strongly up-regulated inacid pH (log2FC = 3.1; low pH vs. PB condition). The arngenes showed highest overexpression in PB with low pH.Genes related to stress and cold shock response (cspA,deaD), previously discussed, were found up-regulated inacid pH and also belong to this module.The yellow module, having 350 associated genes, pre-
sented negative correlation to the low pH condition(Pearson’s r = −0.84; p-value = 7 × 10⁻⁴). Overall, it ap-pears that this module comprises genes mostly relatedto respiration and oxidative cell processes. Functionalcategories identified in this module included aerobic res-piration (BH-adjusted p-value = 3.7 × 10⁻⁵; genes sdhA,sdhB, sdhC, sdhD encoding for succinate DH). Thesegenes were previously discussed in the context of PBpresence, appearing slightly activated in PB exposure.When considering acid stress, however, these genes werestrongly down-regulated, with log2FC values between−2.9 (sdhC) and −3.5 (shdA) (comparing low pH to PB).Generation of precursor metabolites and energy (BH-ad-justed p-value = 2.1 × 10⁻⁵) was also a significantlyenriched term, and genes encoding for ubiquinol oxidase(cyoAB), components of 2-oxoglutarate dehydrogenasecomplex (sucAB), succinyl-CoA ligase (sucC) could berelated to these metabolic processes. All of these geneswere found down-regulated when in acid pH. Alsopresent were small heat shock proteins coded in theibpA/ibpB genes as well as universal stress proteins A/B
The Author(s) BMC Genomics 2016, 17(Suppl 8):737 Page 458 of 462
(uspA/B). uspA is reported to be highly transcribed inresponse to growth stasis, starvation or stress agents[59]. Down-regulation of uspA (log2FC = −1.8) and uspB(log2FC = −3.5) in acid pH were identified in our ana-lyses. The combined evidence argues for a diminishedoxidative activity combined with stress response factorswhen in acid pH.Another module of interest was the tan, which contains
76 genes with associated functional terms including re-sponse to antibiotic (BH-adjusted p-value = 0.002), DNArepair (BH-adjusted p-value = 0.08), DNA topologicalchange (BH-adjusted p-value = 0.02). The involved genesinclude uvrB, dnaB, gyrA, parC, macA. Also, beta-lactamases blaSHV-12 and blaSHV-110 and genes encodingfor fimbrial protein (KP13_04093), chaperone genes(hscAB) were found in this module. Although not directlyrelated to PB resistance, it is interesting to note the activa-tion of bla genes in PB with acid pH. While module tancorrelated strongly only to the acid condition (Fig. 4), thefinding that it groups resistance, virulence and DNA
repair genes warrants further study on the common regu-latory mechanisms that might control their expression, asdisruption of these genes would affect many importantcorrelates of infection and resistance.Module darkgreen, which groups 38 genes, comprised
several GO terms related to translation (adjusted p-value= 2.2 × 10⁻¹³) and peptide metabolic processses (adjustedp-value = 1.4 × 10⁻⁹); genes involved in this module in-cluded elongation factor (fusA, KP13_00742), several ribo-somal subunit proteins (rplA, rplC, rplD, rplX, rplR, rplE,rplO, rplI, rplN, rplL, rpsA) and a protein translocase(secA, KP13_01897). That these ribosomal genes groupinto the same module is consistent with previous reportsindicating their cotranscription in other bacteria [60], thussupporting the co-expression based analytical approachthat we undertook. The negative correlation of this mod-ule with high iron and PB exposure hints an effect thatprotein synthesis might be inhibited at these conditions.Most interestingly is the possibility that polymyxin Bcould be exherting an inhibitory activity within the cell
Fig. 4 Diagram showing the response of K. pneumoniae Kp13 to PB and PB with acid pH. High polymyxin B concentration (left side) and highpolymyxin B concentration with acid pH (right side). The mechanisms involved in Kp13’s response in both culture conditions are described in thismanuscript. These mechanisms were ranging from LPS modification, capsule and adhesion production, metabolic shift aerobic to fermentation,efflux pump and beta-lactamases overexpression, regulation of iron metabolism (ferritin-like protein), acid response and DNA damage repair
The Author(s) BMC Genomics 2016, 17(Suppl 8):737 Page 459 of 462

interior and effectively blocking these cellular processes,an observation that is in line with literature evidence forother CAMPs [61, 62]. This is also in agreement with ourdata that PB not only disrupts membrane functions, butalso targets several central cellular processes such as car-bon metabolic pathways (previously discussed) and pro-vides further evidence to the idea that membranedisruption per se does not justify the killing of bacterialcells by these drugs, which probably involves additionalintracellular targets.It is worth noting that the genes coding for capsule bio-
synthesis (cpsKp13, which we previously studied in [14])did not cluster in any single module. This could be be-cause capsule production involves diverse biological pro-cesses, ranging from oligosaccharide chain biosynthesis,the polymerization of this chain and transport through theinner to the external membrane [63]. As such, each ofthese steps should be regulated independently, hinderingthe clustering of these genes based in co-expression pat-terns alone. However, there are several evidences that cap-sule overproduction is also correlated with resistance topolymyxins [64, 65]. This phenomenon was observed inour RNA-seq experiments, but was only consistent for al-most the whole cpsKp13 gene cluster in PB with low pHcondition (Additional file 2 and Fig. 4).The study of co-expressed modules and their association
to the different experimental conditions shed light on im-portant aspects underlying the K. pneumoniae response toPB and to abiotic stresses. Our results are consistent withthe proposition that multiple metabolic aspects are af-fected in the course of PB exposure, and bacteria display acoordinated response which involves shifts in oxidativemechanisms, respiratory control, amino acid usage andtransformation as well as regulatory components.
ConclusionsThe present report provides a comprehensive gene ex-pression dataset related to polymyxin B treatment underdiverse abiotic stresses using K. pneumoniae Kp13 asmodel. We emphasize the functional transcriptomic as-pects which are governed by PB treatment and the regu-latory responses that may relate to exposure andresistance to this antibiotic, pinpointing intracellular tar-gets that appear linked to the response elicited by PB ex-posure, such as the ArcA-ArcB system, previouslyunlinked to polymyxin response. Here, we highlight thatpolymyxin B exposure induced a metabolic shift into fer-mentative growth in Klebsiella pneumoniae Kp13.Since PB resistance is an increasing trend in MDR bac-
teria, the study of its emergence by combination of ex-pression profiling data from diverse bacteria, expandingon the present dataset, may aid on the search for com-mon traits of resistance mechanisms linked to PB. A bet-ter understanding of these mechanisms will support the
search of alternative or combination therapies to controlthese hard-to-treat infections.
Additional files
Additional file 1: Genes with a shared PB-dependent differential expressionpattern (core PB treatment independent of abiotic stresses). (DOC 101 kb)
Additional file 2: Differentially expressed genes in polymyxin incomparison with five environmental conditions. (XLS 1099 kb)
Additional file 3: Scheme of carbon flux in Klebsiella pneumoniae Kp13under different abiotic conditions and polymyxin B exposure. Description:A) Scheme of carbon flux in Klebsiella pneumoniae Kp13 underfermentative conditions induced by stresses imposed by PB; B) Schemeof carbon flux in Klebsiella pneumoniae Kp13 under fermentativeconditions induced by stresses imposed by PB plus abiotic stimuli (HighCa, High Fe, Mg deprivation or Low pH); C) The metabolism of glycerolby Klebsiella pneumoniae under the pressure of PB; D) The metabolism ofglycerol by Klebsiella pneumoniae under the pressure of PB plus abioticstimuli (High Ca, High Fe, Mg deprivation or Low pH). (PDF 145 kb)
Additional file 4: Klebsiella pneumoniae Kp13 growth under polymyxinB (PB) exposure vs. non-induced bacteria grown without PB. Description:Bacterial growth and medium pH were recorded at hourly intervals atseven timepoints. (PDF 46 kb)
Additional file 5: Validation of the expression of pmrB, arcA and phoBusing qRT-PCR. Description: The log2-transformed expression values ofeach gene, relative to the PB condition (strain Kp13PolB), is reported forboth the RNA-seq data and qRT-PCR measurements. (PDF 40 kb)
Additional file 6: Expression heatmap of regulatory systems.Description: Expression values are represented as log2(fold-change) ofthe condition compared to the PB condition (log2(abiotic condition/PBcondition). Thus, a positive log2FC value indicates higher expression ofthe gene in face of abiotic stress to which it was subjected. In this figure,all genes that we identified as a possible two-component regulatory system(by sequence similarity, conserved domains, genomic positional evidenceand co-occurrence) are depicted. Genes for which we failed to identify aknown homolog in the literature and databases are only cited by their locustag in Kp13 strain. (PDF 79 kb)
Additional file 7: Modules of co-expressed genes as revealed byweighted gene correlation network analysis. Description: Reported arethe modules (labeled by different colours) to which each gene belongs,as well as the associated Gene Ontology terms. (XLS 734 kb)
AcknowledgementsPIPR is a recipient of a PhD fellowship from CAPES. We thank Eliane C. Vesperoand Marsileni Pelisson for providing the Kp13 strain. We also thank Dr. GabrielaBindea for preparing custom GO mapping files for use in CloudGO.
DeclarationsAbout this supplementThis article has been published as part of BMC Genomics Volume 17Supplement 8: Selected articles from the Sixth International Conference ofthe Iberoamerican Society for Bioinformatics on Bioinformatics andComputational Biology for Innovative Genomics. The full contents of thesupplement are available online at https://bmcgenomics.biomedcentral.com/articles/supplements/volume-17-supplement-8.
FundingFundação de Amparo à Pesquisa do Estado do Rio de Janeiro (FAPERJ) andFundação de Amparo à Pesquisa do Estado de São Paulo (FAPESP) supported thiswork through grants awarded to MFN (process no. E-26/110.315/2014) and ACG(process no. 2010/12891-9), respectively. The publication charges for this articlewere funded by Coordenação de Aperfeiçoamento de Pessoal de Nível Superior(CAPES) (process no. 23038.010041/2013-13) through grant awarded to ATRV. Thefunders of the study had no role in the design, data analysis, interpretation orwriting of this report.
The Author(s) BMC Genomics 2016, 17(Suppl 8):737 Page 460 of 462

Availability of data and materialsExpression values (fold-changes relative to the PB condition) are available inAdditional file 2, and raw data is available from the corresponding authorsupon request.
Authors’ contributionsACG, MFN conceived and coordinated the project. EF, GLS, GRQS, MGFC,PIPR, TC performed data analysis and wrote bioinformatics scripts. GB, RG,WMBSM carried out experimental procedures. ACG supervised experimentalprocedures. ATRV supervised the sequencing experiments. MFN and PIPRdrafted the paper with input from the other authors. All authors read andapproved the final manuscript.
Competing interestsThe authors declare that they have no competing interests.
Consent for publicationNot applicable.
Ethics approval and consent to participateNot applicable.
Author details1Laboratório Nacional de Computação Científica, Petrópolis, Rio de Janeiro,Brazil. 2Centro de Pesquisas Gonçalo Moniz, FIOCRUZ, Salvador, Bahia, Brazil.3Laboratório Alerta. Division of Infectious Diseases, Department of InternalMedicine, Escola Paulista de Medicina/Universidade Federal de São Paulo,São Paulo, São Paulo, Brazil. 4Facultad de Ingeniería, Universidad Católica deCórdoba, CONICET, Córdoba, Argentina.
Published: 25 October 2016
References1. Brown ED, Wright GD. Antibacterial drug discovery in the resistance era.
Nature. 2016;529:336–43.2. Davies J, Davies D. Origins and evolution of antibiotic resistance. Microbiol
Mol Biol Rev. 2010;74:417–33.3. Zavascki AP, Goldani LZ, Li J, Nation RL. Polymyxin B for the treatment of
multidrug-resistant pathogens: a critical review. J Antimicrob Chemother.2007;60:1206–15.
4. Li J, Nation RL, Turnidge JD, Milne RW, Coulthard K, Rayner CR, Paterson DL.Colistin: the re-emerging antibiotic for multidrug-resistant Gram-negativebacterial infections. Lancet Infect Dis. 2006;6:589–601.
5. Deris ZZ, Akter J, Sivanesan S, Roberts KD, Thompson PE, Nation RL, Li J,Velkov T. A secondary mode of action of polymyxins against Gram-negativebacteria involves the inhibition of NADH-quinone oxidoreductase activity.The Journal of Antibiotics. 2014;67:147–51.
6. Lee J, Patel G, Huprikar S, Calfee DP, Jenkins SG. Decreased susceptibility topolymyxin B during treatment for carbapenem-resistant Klebsiellapneumoniae infection. J Clin Microbiol. 2009;47:1611–2.
7. Gales AC, Jones RN, Sader HS. Contemporary activity of colistin andpolymyxin B against a worldwide collection of Gram-negative pathogens:results from the SENTRY Antimicrobial Surveillance Program (2006–09). JAntimicrob Chemother. 2011;66:2070–4.
8. Ramos PIP, Picão RC, Almeida LGP, Lima NCB, Girardello R, Vivan ACP, XavierDE, Barcellos FG, Pelisson M, Vespero EC, Médigue C, Vasconcelos ATR, GalesAC, Nicolás MF. Comparative analysis of the complete genome of KPC-2-producing Klebsiella pneumoniae Kp13 reveals remarkable genomeplasticity and a wide repertoire of virulence and resistance mechanisms.BMC Genomics. 2014;15:54.
9. Poirel L, Jayol A, Bontron S, Villegas M-V, Ozdamar M, Turkoglu S, NordmannP. The mgrB gene as a key target for acquired resistance to colistin inKlebsiella pneumoniae. J Antimicrob Chemother. 2015;70:75–80.
10. Cannatelli A, Giani T, D’Andrea MM, Di Pilato V, Arena F, Conte V, TryfinopoulouK, Vatopoulos A, Rossolini GM. MgrB inactivation is a common mechanism ofcolistin resistance in KPC-producing Klebsiella pneumoniae of clinical origin.Antimicrob Agents Chemother. 2014;58:5696–703.
11. Yu Z, Qin W, Lin J, Fang S, Qiu J. Antibacterial mechanisms of polymyxinand bacterial resistance. Biomed Res Int. 2015;2015:1–11.
12. Jayol A, Nordmann P, Brink A, Poirel L. Heteroresistance to colistin inKlebsiella pneumoniae associated with alterations in the PhoPQ regulatorysystem. Antimicrob Agents Chemother. 2015;59:2780–4.
13. Adams MD, Nickel GC, Bajaksouzian S, Lavender H, Murthy AR, Jacobs MR,Bonomo RA. Resistance to colistin in Acinetobacter baumannii associatedwith mutations in the PmrAB two-component system. Antimicrob AgentsChemother. 2009;53:3628–34.
14. Ramos PIP, Picão RC, Vespero EC, Pelisson M, Zuleta LFG, Almeida LGP,Gerber AL, Vasconcelos ATR, Gales AC, Nicolás MF. Pyrosequencing-basedanalysis reveals a novel capsular gene cluster in a KPC-producing Klebsiellapneumoniae clinical isolate identified in Brazil. BMC Microbiol. 2012;12:173.
15. The European Committee on Antimicrobial Susceptibility Testing. Breakpointtables for interpretation of MICs and zone diameters. Version 3.0, January 2013
16. Andrews SC. FastQC: a quality control tool for high throughput sequencedata. 2010 [http://www.bioinformatics.babraham.ac.uk/projects/fastqc/].
17. Jiang H, Lei R, Ding S-W, Zhu S. Skewer: a fast and accurate adapter trimmerfor next-generation sequencing paired-end reads. BMC Bioinformatics. 2014;15:182.
18. Peixoto L, Risso D, Poplawski SG, Wimmer ME, Speed P, Wood MA, Abel T.How data analysis affects power reproducibility and biological insight ofRNA-seq studies in complex datasets. Nucleic Acids Res. 2015;43:1–11.
19. Institut Pasteur MLST database [http://bigsdb.web.pasteur.fr/klebsiella/klebsiella.html]
20. Risso D, Ngai J, Speed TP, Dudoit S. Normalization of RNA-seq data usingfactor analysis of control genes or samples. Nat Biotechnol. 2014;32:896–902.
21. Kim D, Pertea G, Trapnell C, Pimentel H, Kelley R, Salzberg SL. TopHat2:accurate alignment of transcriptomes in the presence of insertions,deletions and gene fusions. Genome Biol. 2013;14:R36.
22. Li H, Handsaker B, Wysoker A, Fennell T, Ruan J, Homer N, Marth G, AbecasisG, Durbin R. The Sequence Alignment/Map format and SAMtools.Bioinformatics. 2009;25:2078–9.
23. Anders S, Pyl PT, Huber W. HTSeq–a Python framework to work with high-throughput sequencing data. Bioinformatics. 2015;31:166–9.
24. Robinson MD, McCarthy DJ, Smyth GK. edgeR: a Bioconductor package fordifferential expression analysis of digital gene expression data.Bioinformatics (Oxford, England). 2010;26:139–40.
25. Langfelder P, Horvath S. WGCNA: an R package for weighted correlationnetwork analysis. BMC Bioinformatics. 2008;9:559.
26. Langfelder P, Horvath S. Fast R functions for robust correlations andhierarchical clustering. J Stat Softw. 2012;46
27. Bindea G, Mlecnik B, Hackl H, Charoentong P, Tosolini M, Kirilovsky A,Fridman W-H, Pages F, Trajanoski Z, Galon J. ClueGO: a Cytoscape plug-in todecipher functionally grouped gene ontology and pathway annotationnetworks. Bioinformatics. 2009;25:1091–3.
28. Shannon P, Markiel A, Ozier O, Baliga NS, Wang JT, Ramage D, Amin N,Schwikowski B, Ideker T. Cytoscape: a software environment for integratedmodels of biomolecular interaction networks. Genome Res. 2003;13:2498–504.
29. Bruchmann S, Muthukumarasamy U, Pohl S, Preusse M, Bielecka A, Nicolai T,Hamann I, Hillert R, Kola A, Gastmeier P, Eckweiler D, Häussler S. Deeptranscriptome profiling of clinical K lebsiella pneumoniae isolates revealsstrain and sequence type-specific adaptation. Environ Microbiol. 2015;17:4690–710.
30. Zhou L, Lei X-H, Bochner BR, Wanner BL. Phenotype microArray analysis ofEscherichia coli K-12 mutants with deletions of all two-component systems.J Bacteriol. 2003;185:4956–72.
31. Shimizu K. Metabolic regulation of a bacterial cell system with emphasis onEscherichia coli metabolism. ISRN Biochemistry. 2013;2013:1–47.
32. Ramirez-Santos J. Conserved regulatory elements of the promoter sequenceof the gene rpoH of enteric bacteria. Nucleic Acids Res. 2001;29:380–6.
33. Deris ZZ, Swarbrick JD, Roberts KD, Azad MAK, Akter J, Horne AS, Nation RL,Rogers KL, Thompson PE, Velkov T, Li J. Probing the penetration ofantimicrobial polymyxin lipopeptides into gram-negative bacteria.Bioconjug Chem. 2014;25:750–60.
34. Unden G, Bongaerts J. Alternative respiratory pathways of Escherichia coli:energetics and transcriptional regulation in response to electron acceptors.Biochim Biophys Acta. 1997;1320:217–34.
35. Spiro S, Guest JR. Adaptive responses to oxygen limitation in Escherichiacoli. Trends Biochem Sci. 1991;16:310–4.
36. Sampson TR, Liu X, Schroeder MR, Kraft CS, Burd EM, Weiss DS. Rapid killingof Acinetobacter baumannii by polymyxins is mediated by a hydroxylradical death pathway. Antimicrob Agents Chemother. 2012;56:5642–9.
The Author(s) BMC Genomics 2016, 17(Suppl 8):737 Page 461 of 462

37. Tran QH, Bongaerts J, Vlad D, Unden G. Requirement for the proton-pumpingNADH dehydrogenase I of Escherichia coli in respiration of NADH to fumarateand its bioenergetic implications. Eur J Biochem. 1997;244:155–60.
38. Belenky P, Ye JD, Porter CBM, Cohen NR, Lobritz MA, Ferrante T, Jain S, KorryBJ, Schwarz EG, Walker GC, Collins JJ. Bactericidal antibiotics induce toxicmetabolic perturbations that lead to cellular damage. Cell Rep. 2015;13:968–80.
39. Imlay JA, Chin SM, Linn S. Toxic DNA damage by hydrogen peroxidethrough the Fenton reaction in vivo and in vitro. Science (New York, NY).1988;240:640–2.
40. Vatansever F, de Melo WCMA, Avci P, Vecchio D, Sadasivam M, Gupta A,Chandran R, Karimi M, Parizotto NA, Yin R, Tegos GP, Hamblin MR.Antimicrobial strategies centered around reactive oxygen species –bactericidal antibiotics, photodynamic therapy, and beyond. FEMS MicrobiolRev. 2013;37:955–89.
41. Broxton CN, Culotta VC. SOD enzymes and microbial pathogens: survivingthe oxidative storm of infection. PLoS Pathog. 2016;12:e1005295.
42. Betteridge DJ. What is oxidative stress? Metab Clin Exp. 2000;49(2 Suppl 1):3–8.43. Nair S, Finkel SE. Dps protects cells against multiple stresses during
stationary phase. J Bacteriol. 2004;186:4192–8.44. Fozo EM, Kawano M, Fontaine F, Kaya Y, Mendieta KS, Jones KL, Ocampo A,
Rudd KE, Storz G. Repression of small toxic protein synthesis by the Sib andOhsC small RNAs. Mol Microbiol. 2008;70:1076–93.
45. Iyer R, Iverson TM, Accardi A, Miller C. A biological role for prokaryotic ClCchloride channels. Nature. 2002;419:715–8.
46. Lamarche MG, Wanner BL, Crépin S, Harel J. The phosphate regulon andbacterial virulence: a regulatory network connecting phosphatehomeostasis and pathogenesis. FEMS Microbiol Rev. 2008;32:461–73.
47. Goh E-B, Bledsoe PJ, Chen L-L, Gyaneshwar P, Stewart V, Igo MM. Hierarchicalcontrol of anaerobic gene expression in Escherichia coli K-12: the nitrate-responsive NarX-NarL regulatory system represses synthesis of the fumarate-responsive DcuS-DcuR regulatory system. J Bacteriol. 2005;187:4890–9.
48. Chen Y-T, Liao T-L, Wu K-M, Lauderdale T-L, Yan J-J, Huang I-W, Lu M-C, LaiY-C, Liu Y-M, Shu H-Y, Wang J-T, Su I-J, Tsai S-F. Genomic diversity of citratefermentation in Klebsiella pneumoniae. BMC Microbiol. 2009;9:168.
49. Albright LM, Huala E, Ausubel FM. Prokaryotic signal transduction mediatedby sensor and regulator protein pairs. Annu Rev Genet. 1989;23:311–36.
50. Huang Y, Leming CL, Suyemoto M, Altier C. Genome-wide screen ofsalmonella genes expressed during infection in pigs, using in vivoexpression technology. Appl Environ Microbiol. 2007;73:7522–30.
51. Falagas ME, Rafailidis PI, Matthaiou DK. Resistance to polymyxins: mechanisms,frequency and treatment options. Drug Resist Updat. 2010;13:132–8.
52. Srinivasan VB, Vaidyanathan V, Mondal A, Rajamohan G. Role of the Twocomponent signal transduction system CpxAR in conferring cefepime andchloramphenicol resistance in klebsiella pneumoniae NTUH-K2044. PLoSOne. 2012;7:e33777.
53. Nishino K, Inazumi Y, Yamaguchi A. Global analysis of genes regulated byEvgA of the two-component regulatory system in Escherichia coli. JBacteriol. 2003;185:2667–72.
54. Krulwich TA, Sachs G, Padan E. Molecular aspects of bacterial pH sensingand homeostasis. Nat Rev Microbiol. 2011;9:330–43.
55. Koponen J, Laakso K, Koskenniemi K, Kankainen M, Savijoki K, Nyman TA, deVos WM, Tynkkynen S, Kalkkinen N, Varmanen P. Effect of acid stress onprotein expression and phosphorylation in Lactobacillus rhamnosus GG. JProteome. 2012;75:1357–74.
56. Lund P, Tramonti A, De Biase D. Coping with low pH: molecular strategiesin neutralophilic bacteria. FEMS Microbiol Rev. 2014;38:1091–125.
57. Padilla E, Llobet E, Doménech-Sánchez A, Martínez-Martínez L, Bengoechea JA,Albertí S. Klebsiella pneumoniae AcrAB efflux pump contributes to antimicrobialresistance and virulence. Antimicrob Agents Chemother. 2010;54:177–83.
58. Gatzeva-Topalova PZ, May AP, Sousa MC. Structure and mechanism of ArnA:conformational change implies ordered dehydrogenase mechanism in keyenzyme for polymyxin resistance. Structure. 2005;13:929–42.
59. Sousa MC, McKay DB. Structure of the universal stress protein ofHaemophilus influenzae. Structure. 2001;9:1135–41.
60. Shaik YB, Grogan S, Davey M, Sebastian S, Goswami S, Szmigielski B, GencoCA. Expression of the iron-activated nspA and secY genes in Neisseriameningitidis group B by fur-dependent and -independent mechanisms. JBacteriol. 2007;189:663–9.
61. Spindler EC, Hale JDF, Giddings TH, Hancock REW, Gill RT. Deciphering themode of action of the synthetic antimicrobial peptide Bac8c. AntimicrobAgents Chemother. 2011;55:1706–16.
62. Podda E, Benincasa M, Pacor S, Micali F, Mattiuzzo M, Gennaro R, Scocchi M.Dual mode of action of Bac7, a proline-rich antibacterial peptide. BiochimBiophys Acta Gen Subj. 2006;1760:1732–40.
63. Whitfield C. Biosynthesis and assembly of capsular polysaccharides inEscherichia coli. Annu Rev Biochem. 2006;75:39–68.
64. Campos MA, Vargas MA, Regueiro V, Llompart CM, Albertí S, BengoecheaJA. Capsule polysaccharide mediates bacterial resistance to antimicrobialpeptides. Infect Immun. 2004;72:7107–14.
65. Llobet E, Tomás JM, Bengoechea JA. Capsule polysaccharide is a bacterialdecoy for antimicrobial peptides. Microbiology. 2008;154(Pt 12):3877–86.
66. Provasi Cardoso J, Cayô R, Girardello R, Gales AC. Diversity of mechanismsconferring resistance to β-lactams among OXA-23–producing Acinetobacterbaumannii clones. Diagn Microbiol Infect Dis. 2016;85:90–7.
67. Krzywinski M, Schein J, Birol I, Connors J, Gascoyne R, Horsman D, Jones SJ,Marra MA. Circos: an information aesthetic for comparative genomics.Genome Res. 2009;19:1639–45.
68. Bardou P, Mariette J, Escudié F, Djemiel C, Klopp C. jvenn: an interactiveVenn diagram viewer. BMC Bioinformatics. 2014;15:293.
• We accept pre-submission inquiries
• Our selector tool helps you to find the most relevant journal
• We provide round the clock customer support
• Convenient online submission
• Thorough peer review
• Inclusion in PubMed and all major indexing services
• Maximum visibility for your research
Submit your manuscript atwww.biomedcentral.com/submit
Submit your next manuscript to BioMed Central and we will help you at every step:
The Author(s) BMC Genomics 2016, 17(Suppl 8):737 Page 462 of 462

![Open Access Effectiveness of polymyxin B-immo bilized ... · with DHP-PMX as well as suppression of Staphylococcus aureus lipoteichoic acid-induced TNF-α production [7-24]. However,](https://img.pdfslide.net/doc/110x75/5f04f3247e708231d4108316/open-access-effectiveness-of-polymyxin-b-immo-bilized-with-dhp-pmx-as-well-as.jpg)