Embed Size (px)
Citation preview

Journal of Cancer 2015, Vol. 6
http://www.jcancer.org
394
JJoouurrnnaall ooff CCaanncceerr 2015; 6(4): 394-402. doi: 10.7150/jca.11212
Research Paper
Clinical Implication of Performance Status in Patients with Hepatocellular Carcinoma Complicating with Cirrhosis Hiroki Nishikawa1,, Ryuichi Kita1, Toru Kimura1, Yoshiaki Ohara1, Azusa Sakamoto1, Sumio Saito1, Norihiro Nishijima1, Akihiro Nasu1, Hideyuki Komekado1 and Yukio Osaki1 1Department of Gastroenterology and Hepatology, Osaka Red Cross Hospital, Osaka, Japan
Corresponding author: Hiroki Nishikawa, M.D. Department of Gastroenterology and Hepatology, Osaka Red Cross Hospital, 5-30 Fudegasaki-cho, Tennoji-ku, Osaka 543-0027, Japan. Tel: +81-6-6774-5111; Fax: +81-6-6774-5131; E-mail: [email protected]
© 2015 Ivyspring International Publisher. Reproduction is permitted for personal, noncommercial use, provided that the article is in whole, unmodified, and properly cited. See http://ivyspring.com/terms for terms and conditions.
Received: 2014.11.30; Accepted: 2015.01.18; Published: 2015.02.26
Abstract
Background and aims: The aims of our study were to elucidate the relationship between baseline characteristics of hepatocellular carcinoma (HCC) patients complicating with liver cir-rhosis (LC) and performance status (PS) and to investigate the impact of PS on survival in patients with HCC complicating with LC. Methods: In a total of 1003 patients diagnosed with HCC complicating with LC, we divided into two groups of PS >1 (n=251) and PS 0 (n=752) as evaluated by using the Eastern Cooperative Oncology Group criteria at the time of HCC diagnosis. Baseline characteristics between these two groups were compared. We also performed univariate and multivariate analyses of factors con-tributing to overall survival (OS). Results: The median follow-up period was 1.6 years in the PS >1 group and 3.1 years in the PS 0 group. The 1-, 3- and 5-year OS rates after each initial therapy for HCC were 90.3%, 67.4% and 49.8%, respectively, in the PS 0 group and 73.4%, 42.0% and 17.7%, respectively, in the PS >1 group (P<0.001). A worse PS was significantly associated with age, gender, Child-Pugh classification, HCC stage, Japan Integrated Staging score, initial treatment option for HCC, maximum tumor size, alanine aminotransferase value, hypoalbuminemia, hyperbilirubinemia, renal insufficiency, hypo-natremia, prothrombin time prolongation, platelet count and tumor marker level. In multivariate analyses, poorer PS was an independent predictor linked to OS with a hazard ratio of 1.773 (P<0.001). Conclusions: PS was closely associated with status of HCC patients with LC and could be an important predictor for these populations.
Key words: Hepatocellular carcinoma, Liver cirrhosis, Performance status, Prognostic factor, Pro-pensity score matching
Introduction Hepatocellular carcinoma (HCC) is the most
common carcinoma worldwide. [1, 2] Treatment op-tions for HCC vary depending on the liver function and HCC stage, and these include liver transplanta-tion, surgical resection (SR), percutaneous ablative
therapies (PATs), transcatheter arterial chemotherapy with or without embolization, systemic chemotherapy with molecular-targeted therapy (MTT) such as so-rafenib and radiation therapy (RT). [3-5] HCC also carries a high risk of recurrence even when curative
Ivyspring
International Publisher

Journal of Cancer 2015, Vol. 6
http://www.jcancer.org
395
therapy was achieved at the initial therapy, with any underlying liver disease and tumor characteristics important predictors affecting the risk of HCC recur-rence or survival. [1, 3, 4]
The performance status (PS) scale measures how the daily living ability is affected by the underlying disease. The PS scale recommended by the Eastern Cooperative Oncology Group (ECOG) is widely used by clinicians to assess the functional status in patients with various cancers. [6] It also serves as an indicator of cancer therapy and predictor of patient survival. The PS scale is a major survival determinant in pa-tients with HCC and is specifically included in the Barcelona Clinic Liver Cancer (BCLC) staging system as an essential parameter for treatment guidance for HCC. [7, 8]
The most commonly identified complications in patients with liver cirrhosis (LC) include ascites, he-patic encephalopathy, esophageal varices, kidney dysfunction, susceptibility for infections such as spontaneous bacterial peritonitis, and development of HCC. Furthermore, severe muscle wasting or sarco-penia is one of the most common and frequently hidden complications in patients with LC, which negatively effect on survival and quality of life. All of these complications may potentially lead to deterio-ration of PS. [9, 10]
However, to our knowledge, there are few stud-ies specifically evaluated the role of PS in patients with HCC complicating with LC. [11-14] These stud-ies have been reported from Asian country only. Clinical factors linked to PS in patients with HCC complicating with LC have not been fully determined and also the prognostic significance of the PS has not been systematically assessed in these populations. The objectives of the present study were thus to elu-cidate the relationship between characteristics of HCC patients complicating with LC and PS and to investi-gate the impact of PS on survival in patients with HCC complicating with LC.
Patients and methods Patients
A total of 1003 consecutive treatment-naïve pa-tients diagnosed with HCC complicating with LC were admitted to the Department of Gastroenterology and Hepatology, Osaka Red Cross Hospital, Japan, between April 2005 and June 2014. LC was deter-mined based on radiologic findings including typical computed tomography (CT) or ultrasound findings, laboratory parameters such as platelet count (less than 10 ×104/mm3) and/or histological findings obtained by surgical specimens or liver biopsy. We divided these patients into two groups of PS >1 (n=251) and
PS 0 (n=752). PS was evaluated by using the ECOG performance scale ranging from 0 (asymptomatic) to 4 (confined to bed). We compared the overall survival (OS) rate between the PS >1 group and the PS 0 group. Prior to therapy for HCC, written informed consent for HCC therapy was obtained from all subjects. The ethics committee of our department approved the protocol for this study. The present study comprised a retrospective analysis of patients’ medical records in our database and all treatments were performed in an open-label manner.
Diagnosis of HCC and HCC therapy HCC was diagnosed based on the results from
abdominal ultrasound and dynamic CT scan (hyper-attenuation during the arterial phase in the entire or part of the tumor, and hypoattenuation in the por-tal-venous phase) and/or magnetic resonance imag-ing mainly as recommended by the American Asso-ciation for the Study of Liver Diseases. [7] Arterial and portal phase dynamic CT images were obtained ap-proximately 30 seconds and 120 seconds after injec-tion of contrast material. In our hospital, abdominal angiography combined with CT (angio-CT) was rou-tinely performed before therapy for HCC after ob-taining informed consent from them for performing abdominal angiography. This was performed based on the fact that this technique was useful for detecting small satellite nodules as reported by Yamasaki et al. [15] Then, we confirmed HCC using CT during he-patic arteriography (CTHA) and CT during arteri-al-portography (CTAP). HCC stage was determined by TNM staging system by the Liver Cancer Study Group of Japan. [16] As for HCC therapy, the most appropriate treatment modality such as SR, PATs, transcatheter arterial therapy, MTT or RT for each patient was selected through discussion with sur-geons, hepatologists and radiologists considering tumor status and liver function. [17, 18] Best sup-portive care was provided when treatment efficacy was considered limited or patients refused therapy for HCC. In the present analysis, there was no patient treated with liver transplantation.
Follow-up after initial therapy for HCC Follow-up observation consisted of regularly
blood tests and monitoring of tumor markers, in-cluding alpha-fetoprotein (AFP) and des-γ-carboxy prothrombin (DCP), which was measured using a chemiluminescent enzyme immunoassay (Lumipulse PIVKAII Eisai, Eisai, Tokyo, Japan). Dynamic CT scan was performed every 3-4 months after initial therapy for HCC. When HCC recurrence or disease progres-sion was detected based on radiologic findings, most appropriate therapy was performed in each patient.

Journal of Cancer 2015, Vol. 6
http://www.jcancer.org
396
[18]
Statistical analysis The primary end point is OS. Continuous varia-
bles were compared by unpaired t test, and categori-cal variables were compared by Fisher's exact test. Data were analyzed using univariate and multivariate analyses. To analyze the significance of prognostic predictors, continuous variables were divided by the median values (or close to them) and treated as di-chotomous covariates. The cumulative OS rate was calculated by Kaplan-Meier method and tested by log-rank test. A Cox proportional hazard model was used for multivariate analyses of factors with P value <0.01 in univariate analyses. These statistical methods were used to estimate the interval from each date of diagnosis for HCC until the date of death or last fol-low up date. Data were analyzed using SPSS software (SPSS Inc., Chicago, IL, USA) for Microsoft Windows. Data are expressed as mean ± standard deviation. A P value less than 0.05 were considered to be statistically significant.
Stratification by Japan Integrated Staging score and propensity score analysis
To compare the OS between patients with PS >1 and patients with PS 0, in three subgroups stratified by Japan Integrated Staging (JIS) score (group of JIS score of 0 or 1, group of JIS score of 2 or 3, and group of JIS score of 4 or 5), a propensity score model was used with an attempt to reduce potential biases in survival analysis. [19, 20] JIS score was calculated by summation of TNM stage score (stage I=0, stage II=1, stage III=2 and stage IV=3) and Child-Pugh classifica-tion (A=0, B=1 and C=2) as reported by Kudo, et al. [21] Possible variables associated with long-term sur-vival of HCC patients, including age, sex, HCC stage, maximum tumor size, tumor number, cause of liver disease and Child-Pugh classification were included comprehensively for propensity score generation. With these selected variables, a logistic regression was applied to generate a continuous propensity score from 0 to 1. One-to-one matches between the PS >1 group and the PS 0 group patients were introduced into the subsequent analysis.
Results Patient demographic characteristics between patients with PS 0 and PS >1
Baseline demographic characteristics of patients in PS 0 (n=752) and PS >1 (n=251: n=125 in PS 1, n=87 in PS 2, n=26 in PS 3 and n=13 in PS 4) are shown in Table I. A worse PS was significantly associated with age (P<0.001), gender (P=0.001), Child-Pugh classifi-cation (P<0.001), HCC stage (P<0.001), JIS score
(P<0.001), initial treatment option for HCC (P<0.001), maximum tumor size (P<0.001), alanine aminotrans-ferase (ALT) value (P<0.001), hypoalbuminemia (P<0.001), hyperbilirubinemia (P=0.038), renal insuf-ficiency (P=0.005), hyponatremia (P<0.001), pro-thrombin time prolongation (P=0.029), platelet count (P=0.002), AFP value (P=0.016) and DCP value (P=0.012). In terms of proportion of patients with poor PS (PS >1), significant differences between HCC stage I (48/254, 18.9%) and IV (53/109, 48.6%) (P<0.001), II (86/399, 21.6%) and IV (P<0.001) and III (64/241, 26.6%) and IV (P<0.001) were found. (Fig. 1) Similarly, there were significant differences between Child-Pugh A (140/687, 20.4%) and B (74/257, 28.8%) (P=0.007), B and C (37/59, 62.7%) (P<0.001) and A and C (P<0.001) and between JIS score of 0 or 1 (105/546, 19.2%) and JIS score of 2 or 3 (94/364, 25.8%) (P=0.022), JIS score of 2 or 3 and JIS score of 4 or 5 (52/93, 55.9%) (P<0.001) and JIS score of 0 or 1 and JIS score of 4 or 5 (P<0.001). (Fig. 2 and 3)
Fig. 1. The proportion of patients with poor performance status (PS) of >1 according to HCC stage (I [n=254], II [n=399], III [n=241] and IV [n=109]). Significant differences between HCC stage I and IV (P<0.001), II and IV (P<0.001) and III and IV (P<0.001) were observed.
Fig. 2. The proportion of patients with poor performance status (PS) of >1 according to Child-Pugh classification (A [n=687], B [n=257] and C [n=59]). There were significant differences between Child-Pugh A and B (P=0.007), B and C (P<0.001) and A and C (P<0.001).

Journal of Cancer 2015, Vol. 6
http://www.jcancer.org
397
Fig. 3. The proportion of patients with poor performance status (PS) of >1 according to Japan Integrated Staging (JIS) score (0 or 1 [n=546], 2 or 3 [n=364] and 4 or 5 [n=93]). There were significant differences between JIS score of 0 or 1 and JIS score of 2 or 3 (P=0.022), JIS score of 2 or 3 and JIS score of 4 or 5 (P<0.001) and JIS score of 0 or 1 and JIS score of 4 or 5 (P<0.001).
As an initial therapy for HCC, in the PS >1
group, SR was performed in 32 patients, PATs in 111, trancatheter arterial chemotherapy with or without embolization in 82, MTT in 2 and no specific therapy in 24, whereas in the PS 0 group, SR was performed in 145 patients, PATs in 422, trancatheter arterial chem-otherapy with or without embolization in 163, MTT in two, RT in one and no specific therapy in 19 (P<0.001).
The median follow-up period was 1.6 years (range, 0.1-8.4 years) in the PS >1 group and 3.1 years (range, 0.1-9.6 years) in the PS 0 group. One hundred
and fifty-three patients (61.0%) in the PS >1 group died during the follow-up period. The causes of death were HCC progression (80 patients), liver failure (46 patients) and miscellaneous (27 patients). Three hun-dred and fifty-seven patients (47.5%) in the control group died during the follow-up period. The causes of death were HCC progression (190 patients), liver failure (136 patients) and miscellaneous (31 patients). The 1-, 3- and 5-year OS rates after each initial therapy for HCC were 90.3%, 67.4% and 49.8%, respectively, in the PS 0 group and 73.4%, 42.0% and 17.7%, re-spectively, in the PS >1 group (P<0.001). (Fig. 4)
Fig. 4. Cumulative overall survival (OS) rates in patients with PS >1 (n=251) and PS 0 (n=752). The 1-, 3- and 5-year OS rates after each initial therapy for HCC were 90.3%, 67.4% and 49.8%, respectively, in the PS 0 group and 73.4%, 42.0% and 17.7%, respectively, in the PS >1 group (P<0.001).
Table I. Baseline characteristics between the performance status (PS) >1 group (n=251) and the PS 0 group (n=752).
Variables PS >1 (n=251) PS 0 (n=752) P value Age (years) 73.4 ± 8.1 68.1 ± 8.8 <0.001a Gender, male / female 132 / 119 483 / 269 0.001b Causes of liver disease B / C / non B and non C /B and C 19 / 177 / 51 / 4 77 / 524 / 141 / 10 0.624b Child-Pugh, A / B / C 140 / 74 / 37 547 / 183 / 22 <0.001b HCC stage, I /II / III / IV 48 / 86 / 64 / 53 206 / 313 / 177 / 56 <0.001b JIS score, 0 / 1 / 2 / 3 / 4 / 5 32 / 73 / 58 / 36 / 36 / 16 162 / 279 / 192 / 78 / 40 / 1 <0.001b Initial therapy for HCC SR / PAT / TAT / MTT / RT / none 32 / 111 / 82 / 2 / 0 / 24 145 / 422 / 163 / 2 / 1 / 19 <0.001b Maximum tumor size (cm) 3.9 ± 3.0 3.0 ± 2.2 <0.001a Tumor number (single/multiple) 123 / 128 422/ 330 0.057b AST (IU/L) 67.8 ± 51.3 69.8 ± 54.5 0.593a ALT (IU/L) 45.8 ± 33.8 57.8 ± 47.3 <0.001a Total bilirubin (mg/dL) 1.31 ± 1.33 1.11 ± 0.83 0.038a Serum albumin (g/dL) 3.44 ± 0.60 3.69 ± 0.50 <0.001a ALP (IU/L) 426.7 ± 252.7 397.6 ± 221.7 0.105a GGT (IU/L) 113.5 ± 141.8 109.5 ± 139.6 0.695a Serum creatinine (mg/dL) 1.10 ± 1.23 0.87 ± 0.52 0.005a
Serum sodium (mmol/L) 139.2 ± 4.0 140.2 ± 2.5 <0.001a Diabetes mellitus, yes/no 74 / 177 177 / 578 0.052b Prothrombin time (%) 77.4 ± 17.1 80.1 ± 14.2 0.029a Platelets (×104/mm3) 11.0 ± 5.6 9.8 ± 4.5 0.002a AFP (ng/mL)† 15240 ± 84452 2147 ± 15350 0.016a DCP (mAU/mL)‡ 6882 ± 26369 2403 ± 14784 0.012a Data are expressed as number or mean ± standard deviation. HCC; hepatocellular carcinoma, JIS score; Japan integrated staging score, SR; surgical resection, PAT; percu-taneous ablative therapies, TAT; transcatheter arterial therapies, MTT; molecular targeting therapy, RT; radiation therapy, AST; aspartate aminotransferase, ALT; alanine aminotransferase, ALP; alkaline phosphatase, GGT; gamma glutamyl transpeptidase, AFP; alpha-fetoprotein, DCP; des-γ-carboxy prothrombin, a; unpaired t test, b; Fisher’s exact test. †; missing data, n=2, ‡; missing data, n=15

Journal of Cancer 2015, Vol. 6
http://www.jcancer.org
398
Univariate and multivariate analysis of factors contributing to OS
Using univariate analyses of factors contributing to OS, HCC stage (P<0.001), tumor number (P<0.001), maximum tumor size >2.5 cm (P<0.001), Child-Pugh classification (P<0.001), PS (P<0.001), AST >57 IU/L (P<0.001), alkaline phosphatase (ALP) >346 IU/L (P<0.001), gamma glutamyl transpeptidase (GGT) >64 IU/L (P<0.001), serum sodium >140 mmol/L (P<0.001), serum creatinine >0.8 mg/dL (P=0.036), AFP >30 ng/mL (P<0.001) and DCP >54 mAU/mL (P<0.001) were found to be significant factors (Table II). The multivariate analyses involving eleven factors with P<0.01 in the univariate analysis showed that tumor number (P=0.020), Child-Pugh classification (P<0.001), HCC stage (P<0.001), PS (P<0.001), AST >57 IU/L (P<0.001), ALP >346 IU/L (P<0.001), and DCP >54 mAU/mL (P<0.001) were significant inde-pendent predictors linked to OS. The hazard ratios (HRs), 95% confidence interval and P value for these factors are detailed in Table II.
Propensity score matching analyses in three subgroups stratified by JIS score
Baseline demographic characteristics of patients after propensity score matching in each subgroup (groups of JIS 0 or 1 [74 pairs], JIS 2 or 3 [41 pairs] and JIS 4 or 5 [29 pairs]) are shown in Table III. In terms of
baseline characteristics, no significant difference was observed between patients with PS >1 and PS 0 in each subgroup.
In patients with JIS 0 or 1, in terms of OS, the difference reached significance before (P<0.001) and after (P<0.001) propensity score matching. (Fig. 5A and 6A) In patients with JIS 2 or 3, in terms of OS, significant difference was found in terms of OS before propensity score matching (P=0.008), whereas after propensity score matching, such significance was di-minished (P=0.254). (Fig. 5B and 6B) On the other hand, in patients with JIS 4 or 5, in terms of OS, the difference did not reach significance before (P=0.175) and after (P=0.165) propensity score matching. (Fig. 5C and 6C)
Comparison of OS in the two groups according to treatment modality
We also performed subgroup analyses according to treatment modality. In patients treated with SR (n=145 in PS 0 and n=32 in PS >1), the difference in the two groups did not reach significance (P=0.334) (Fig. 7A), whereas in patients treated with PATs (n=422 in PS 0 and n=111 in PS >1) and those treated with trancatheter arterial therapies (n=163 in PS 0 and n=82 in PS >1), there were significant differences in the two groups (P<0.001 for both). (Fig. 7B and 7C)
Table II. Univariate and multivariate analyses of factors contributing to overall survival.
Variables n Univariate Analysis
Multivariate Analysis Hazard Ratio (95% CI) P valuea
Gender, male vs. female 615 / 388 0.371 Age (years), >70 vs. <70 538 / 465 0.402 Tumor number, single vs. multiple 545 / 458 <0.001 1.458 (1.063-2.000) 0.020 Maximum tumor size (cm), >2.5 vs. <2.5 502 / 501 <0.001 1.057 (0.792-1.412) 0.706 Child-Pugh, A / B / C 687 / 257 / 59 <0.001 Child-Pugh A Reference Child-Pugh B 2.049 (1.441-2.915) <0.001 Child-Pugh C 3.597 (2.381-5.435) <0.001 HCC stage, I / II / III / IV 254 / 399 / 241 / 109 <0.001 HCC stage I Reference HCC stage II 3.817 (2.857-5.102) <0.001 HCC stage III 4.525 (3.096-6.623) <0.001 HCC stage IV 5.025 (2.857-8.850) <0.001 Performance status, 0 vs. >1 752 / 251 <0.001 1.773 (1.429-2.198) <0.001 Cause of liver disease, B / C / B and C / NBNC 96 / 701 / 14 / 192 0.218 AST (IU/l), >57 vs. <57 500 / 503 <0.001 1.479 (1.214-1.802) <0.001 ALT (IU/l), >44 vs. <44 493 / 510 0.101 ALP (IU/l), >346 vs. <346 501 / 502 <0.001 1.406 (1.161-1.704) <0.001 GGT (IU/l), >64 vs. <64 503 / 500 <0.001 0.904 (0.744-1.097) 0.306 Serum sodium (mmol/l), >140 vs. <140 458 / 545 <0.001 0.947 (0.787-1.140) 0.564 Platelet count (×104 / mm3), >9.2 vs. <9.2 507 / 496 0.399 Diabetes mellitus, yes vs. no 248 / 755 0.193 Serum creatinine (mg/dl), >0.8 vs. <0.8 539 / 464 0.036 AFP (ng/ml), >30 vs. <30† 498 / 503 <0.001 1.029 (0.849-1.246) 0.772 DCP (mAU/ml), >54 vs. <54‡ 493 / 495 <0.001 2.114 (1.724-2.591) <0.001 CI; confidence interval, HCC; hepatocellular carcinoma, NBNC; non B and non C, AST; aspartate aminotransferase, ALT; alanine aminotransferase, ALP; alkaline phospha-tase, GGT; gamma glutamyl transpeptidase, AFP, alpha-fetoprotein; DCP, des-γ-carboxy prothrombin, a; Cox proportional hazard model, †; missing data, n=2, ‡; missing data, n=15

Journal of Cancer 2015, Vol. 6
http://www.jcancer.org
399
Comparison of OS in patients with PS 0, PS 1 and PS >2
In patients with PS >1 (n=251), we divided them into two groups of patients with PS 1 (n=125) and those with PS >2 (n=126). In the two groups, a worse
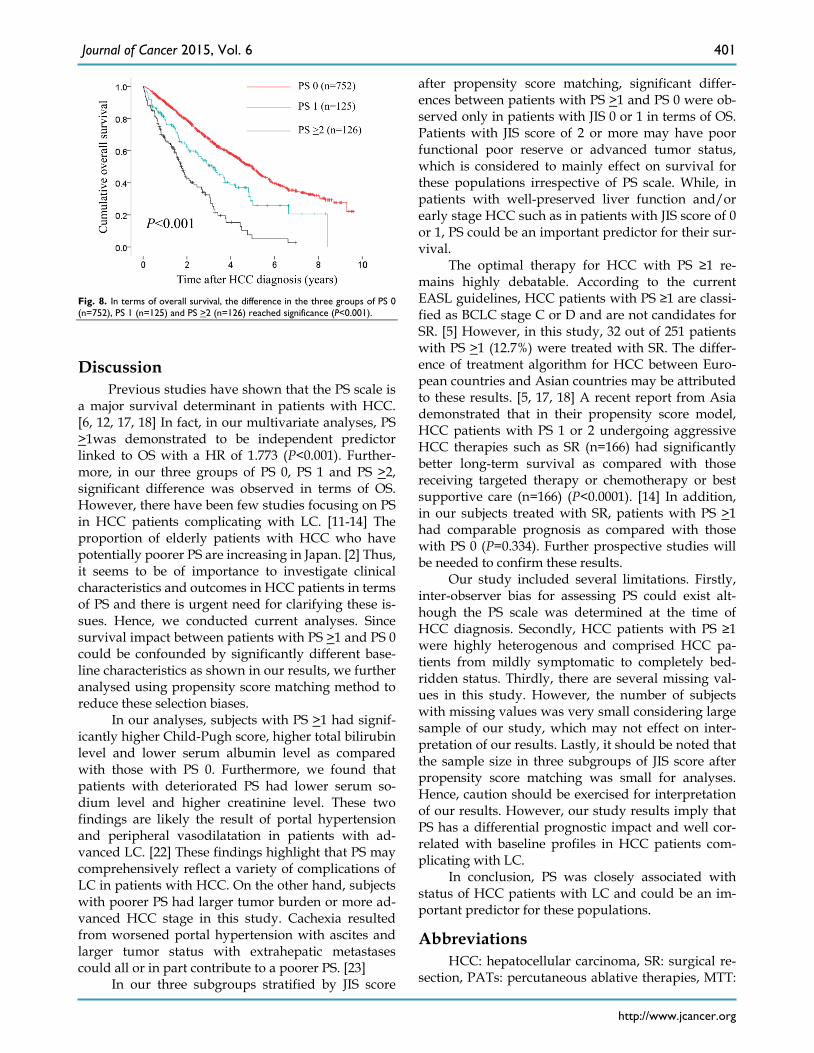
PS was significantly associated with Child-Pugh clas-sification (P=0.015), hypoalbuminemia (P=0.001), hyponatremia (P=0.022) (data not shown). In terms of OS, the difference in the three groups of PS 0, PS 1 and PS >2 reached significance (P<0.001). (Fig. 8)
Table III. Baseline characteristics between the performance status (PS) >1 group and the PS 0 group in each subgroup stratified by Japan Integrated Staging (JIS) scoring system after propensity score matching.
Variables JIS 0 or 1 (n=148, 74 pairs) JIS 2 or 3 (n=82, 41 pairs) JIS 4 or 5 (n=58, 29 pairs) PS >1 PS 0 P value PS >1 PS 0 P value PS >1 PS 0 P value
Age (years) 73.8 ± 6.5 74.0 ± 6.2 0.867a 71.6 ± 7.0 70.7 ± 7.9 0.615a 69.4 ± 9.9 65.7 ± 7.8 0.118a Gender, male / female 55 / 19 52 / 22 0.714b 20 / 21 19 / 22 >0.999b 23 / 6 21 / 8 0.760b Causes of liver disease B / C / non B and non C / B and C 2 / 59 / 12 / 1 3 / 58 / 12 / 1 >0.999b 4 / 32 / 5 / 0 3 / 32 / 4 / 2 0.671b 3 / 17 / 7 / 2 4 / 21 / 4 / 0 0.366b Child-Pugh, A / B / C 65 / 9 / 0 66 / 8 / 0 >0.999b 17 / 22 / 2 18 / 21 / 2 >0.999b 0 / 21 / 8 0 / 21 / 8 >0.999b HCC stage, I / II / III / IV 32 / 42 / 0 / 0 32 / 42 / 0 / 0 >0.999b 1 / 12 / 25 / 3 1 / 11 / 25 / 4 >0.999b 0 / 0 / 7 / 22 0 / 0 / 7 / 22 >0.999b Maximum tumor size (cm) 2.2 ± 0.9 2.3 ± 1.0 0.630a 3.6 ± 2.2 3.8 ± 2.3 0.614a 6.2 ± 3.5 6.9 ± 3.2 0.409b Tumor number, single / multiple 65 / 9 70 / 4 0.245b 12 / 29 8 / 33 0.441b 4 / 25 3 / 26 >0.999b AST (IU/L) 51.9 ± 28.7 57.3 ± 33.7 0.294a 62.4 ± 28.6 70.3 ± 49.7 0.380a 110.7 ± 91.9 141.0 ± 137.6 0.330a ALT (IU/L) 40.1 ± 24.7 48.7 ± 37.0 0.102a 47.8 ± 29.8 57.4 ± 59.9 0.362a 57.3 ± 41.3 82.2 ± 89.9 0.183a ALP (IU/L) 325.6 ± 131.9 336.4 ± 122.7 0.607a 421.5 ± 259.9 394.6 ± 175.5 0.584a 577.9 ± 321.5 524.5 ± 283.2 0.505a GGT (IU/L) 68.4 ± 67.7 66.1 ± 88.4 0.862a 97.3 ± 110.6 88.0 ± 95.9 0.688a 203.2 ± 164.5 157.2 ± 152.5 0.275a Platelets (×104/mm3) 10.2 ± 4.5 9.9 ± 4.1 0.644a 10.5 ± 4.6 10.3 ± 6.7 0.892a 14.0 ± 9.4 10.0 ± 4.6 0.090a AFP (ng/mL) 171.3 ± 424.5 508.8 ± 1581.3 0.080a 2203.9 ± 9771.3 1920.7 ± 5473.1 0.872a 47179 ± 164649 4366.8 ± 8142.3 0.173a DCP (mAU/mL) 490.7 ± 2214.4 411.3 ± 1710.5 0.808a 2453.3 ± 7323.3 4190.6 ± 9477.2 0.356a 21669 ± 40251 13832 ± 27880 0.399a HCC; hepatocellular carcinoma, AST; aspartate aminotransferase, ALT; alanine aminotransferase, ALP; alkaline phosphatase, GGT; gamma glutamyl transpeptidase, AFP; alpha-fetoprotein, DCP; des-γ-carboxy prothrombin, a; unpaired t test, b; Fisher’s exact test.
Fig. 5. Subgroups analyses in terms of overall survival stratified by JIS score ([A]: 0 or 1 [n=441 in the PS 0 group and n=105 in the PS >1 group, P<0.001], [B]: 2 or 3 [n=270 in the PS 0 group and n=94 in the PS >1 group, P=0.008] and [C]: 4 or 5 [n=41 in the PS 0 group and n=52 in the PS >1 group, P=0.175]).

Journal of Cancer 2015, Vol. 6
http://www.jcancer.org
400
Fig. 6. Subgroups analyses in terms of overall survival stratified by JIS score after propensity score matching ([A]: 0 or 1 [n=74 in the PS 0 group and n=74 in the PS >1 group, P<0.001], [B]: 2 or 3 [n=41 in the PS 0 group and n=41 in the PS >1 group, P=0.254] and [C]: 4 or 5 [n=29 in the PS 0 group and n=29 in the PS >1 group, P=0.165]).
Fig. 7. Comparison of overall survival in the two groups according to treatment modality. In patients treated with SR (n=145 in PS 0 and n=32 in PS >1), the difference in the two groups did not reach significance (P=0.334). (A) While in patients treated with percutaneous ablative therapies (n=422 in PS 0 and n=111 in PS >1) and those treated with trancatheter arterial therapies (n=163 in PS 0 and n=82 in PS >1), there were significant differences in the two groups (P<0.001 for both). (B and C)
Journal of Cancer 2015, Vol. 6
http://www.jcancer.org
401
Fig. 8. In terms of overall survival, the difference in the three groups of PS 0 (n=752), PS 1 (n=125) and PS >2 (n=126) reached significance (P<0.001).
Discussion Previous studies have shown that the PS scale is
a major survival determinant in patients with HCC. [6, 12, 17, 18] In fact, in our multivariate analyses, PS >1was demonstrated to be independent predictor linked to OS with a HR of 1.773 (P<0.001). Further-more, in our three groups of PS 0, PS 1 and PS >2, significant difference was observed in terms of OS. However, there have been few studies focusing on PS in HCC patients complicating with LC. [11-14] The proportion of elderly patients with HCC who have potentially poorer PS are increasing in Japan. [2] Thus, it seems to be of importance to investigate clinical characteristics and outcomes in HCC patients in terms of PS and there is urgent need for clarifying these is-sues. Hence, we conducted current analyses. Since survival impact between patients with PS >1 and PS 0 could be confounded by significantly different base-line characteristics as shown in our results, we further analysed using propensity score matching method to reduce these selection biases.
In our analyses, subjects with PS >1 had signif-icantly higher Child-Pugh score, higher total bilirubin level and lower serum albumin level as compared with those with PS 0. Furthermore, we found that patients with deteriorated PS had lower serum so-dium level and higher creatinine level. These two findings are likely the result of portal hypertension and peripheral vasodilatation in patients with ad-vanced LC. [22] These findings highlight that PS may comprehensively reflect a variety of complications of LC in patients with HCC. On the other hand, subjects with poorer PS had larger tumor burden or more ad-vanced HCC stage in this study. Cachexia resulted from worsened portal hypertension with ascites and larger tumor status with extrahepatic metastases could all or in part contribute to a poorer PS. [23]
In our three subgroups stratified by JIS score
after propensity score matching, significant differ-ences between patients with PS >1 and PS 0 were ob-served only in patients with JIS 0 or 1 in terms of OS. Patients with JIS score of 2 or more may have poor functional poor reserve or advanced tumor status, which is considered to mainly effect on survival for these populations irrespective of PS scale. While, in patients with well-preserved liver function and/or early stage HCC such as in patients with JIS score of 0 or 1, PS could be an important predictor for their sur-vival.
The optimal therapy for HCC with PS ≥1 re-mains highly debatable. According to the current EASL guidelines, HCC patients with PS ≥1 are classi-fied as BCLC stage C or D and are not candidates for SR. [5] However, in this study, 32 out of 251 patients with PS >1 (12.7%) were treated with SR. The differ-ence of treatment algorithm for HCC between Euro-pean countries and Asian countries may be attributed to these results. [5, 17, 18] A recent report from Asia demonstrated that in their propensity score model, HCC patients with PS 1 or 2 undergoing aggressive HCC therapies such as SR (n=166) had significantly better long-term survival as compared with those receiving targeted therapy or chemotherapy or best supportive care (n=166) (P<0.0001). [14] In addition, in our subjects treated with SR, patients with PS >1 had comparable prognosis as compared with those with PS 0 (P=0.334). Further prospective studies will be needed to confirm these results.
Our study included several limitations. Firstly, inter-observer bias for assessing PS could exist alt-hough the PS scale was determined at the time of HCC diagnosis. Secondly, HCC patients with PS ≥1 were highly heterogenous and comprised HCC pa-tients from mildly symptomatic to completely bed-ridden status. Thirdly, there are several missing val-ues in this study. However, the number of subjects with missing values was very small considering large sample of our study, which may not effect on inter-pretation of our results. Lastly, it should be noted that the sample size in three subgroups of JIS score after propensity score matching was small for analyses. Hence, caution should be exercised for interpretation of our results. However, our study results imply that PS has a differential prognostic impact and well cor-related with baseline profiles in HCC patients com-plicating with LC.
In conclusion, PS was closely associated with status of HCC patients with LC and could be an im-portant predictor for these populations.
Abbreviations HCC: hepatocellular carcinoma, SR: surgical re-
section, PATs: percutaneous ablative therapies, MTT:

Journal of Cancer 2015, Vol. 6
http://www.jcancer.org
402
molecular targeted therapy, RT: radiation therapy, PS: performance status, ECOG: the Eastern Cooperative Oncology Group, BCLC: Barcelona Clinic Liver Can-cer, LC: liver cirrhosis, CT: computed tomography, OS: overall survival, AFP: aplpha-fetoprotein, DCP: des-γ-carboxy prothrombin, JIS: Japan Integrated Staging, AST: aspartate aminotransferase, ALT: ala-nine aminotransferase, ALP: alkaline phosphatase, GGT: gamma glutamyl transpeptidase, 95% CI:95% confidence interval, HR: hazard ratio.
Acknowledgements We would like to thank Haruko Takada for the
data collection.
Competing interests The authors declare that they have no conflicts of
interest. In addition, none of the authors had any fi-nancial relationship (within the past 12 months) with biotechnology manufacturers, pharmaceutical com-panies, or other commercial entities that have any interest in the subject matter, materials, or processes discussed in the manuscript.
References 1. El-Serag HB. Epidemiology of viral hepatitis and hepatocellular carcinoma.
Gastroenterology 2012, 142: 1264-1273. 2. Nishikawa H, Osaki Y. Non-B, non-C hepatocellular carcinoma (Review). Int J
Oncol. 2013, 43: 1333-1342. 3. Bruix J, Gores GJ, Mazzaferro V. Hepatocellular carcinoma: clinical frontiers
and perspectives. Gut. 2014; 63(5): 844-855. 4. El-Serag HB. Hepatocellular carcinoma. N Engl J Med. 2011, 365: 1118-1127. 5. de Lope CR, Tremosini S, Forner A, Reig M, Bruix J. Management of HCC. J
Hepatol. 2012; 56 Suppl 1: S75-87. 6. Oken MM, Creech RH, Tormey DC, Horton J, Davis TE, McFadden ET, et al.
Toxicity and response criteria of the Eastern Cooperative Oncology Group. Am J Clin Oncol 1982; 5: 649-655.
7. Bruix J and Sherman M; Practice Guidelines Committee, American Association for the Study of Liver Diseases. Management of hepatocellular carcinoma. Hepatology. 2005, 42: 1208-1236.
8. Bruix J, Sherman M; American Association for the Study of Liver Diseases. Management of hepatocellular carcinoma: an update. Hepatology. 2011; 53(3): 1020-1022.
9. Montano-Loza AJ. Clinical relevance of sarcopenia in patients with cirrhosis. World J Gastroenterol. 2014; 20(25): 8061-8071.
10. Iwasa M, Hara N, Terasaka E, Hattori A, Ishidome M, Mifuji-Moroka R, et al. Evaluation and prognosis of sarcopenia using impedance analysis in patients with liver cirrhosis. Hepatol Res. 2014; 44(10): E316-E317.
11. Hsu CY, Lee YH, Hsia CY, Huang YH, Su CW, Lin HC, et al. Performance status in patients with hepatocellular carcinoma: determinants, prognostic impact, and ability to improve the Barcelona Clinic Liver Cancer system. Hepatology. 2013; 57(1): 112-119.
12. Liu PH, Lee YH, Hsia CY, Hsu CY, Huang YH, Chiou YY, et al. Surgical resection versus transarterial chemoembolization for hepatocellular carcinoma with portal vein tumor thrombosis: a propensity score analysis. Ann Surg Oncol. 2014; 21(6): 1825-1833.
13. Liu PH, Lee YH, Hsu CY, Huang YH, Chiou YY, Lin HC, et al. Survival ad-vantage of radiofrequency ablation over transarterial chemoembolization for patients with hepatocellular carcinoma and good performance status within the milan criteria. Ann Surg Oncol. 2014; 21(12): 3835-3843.
14. Hsu CY, Liu PH, Lee YH, Hsia CY, Huang YH, Chiou YY, et al. Aggressive Therapeutic Strategies Improve the Survival of Hepatocellular Carcinoma Pa-tients with Performance Status 1 or 2: A Propensity Score Analysis. Ann Surg Oncol. 2014 [Epub ahead of print]
15. Yamasaki T, Kurokawa F, Shirahashi H, Kusano N, Hironaka K, Okita K. Percutaneous radiofrequency ablation therapy with combined angiography and computed tomography assistance for patients with hepatocellular carci-noma. Cancer. 2001, 91: 1342-1348.
16. [No authors listed] The general rules for the clinical and pathological study of primary liver cancer. Liver Cancer Study Group of Japan. Jpn J Surg. 1989; 19(1): 98-129.
17. Park JW, Amarapurkar D, Chao Y, Chen PJ, Geschwind JF, Goh KL, et al. Consensus recommendations and review by an International Expert Panel on Interventions in Hepatocellular Carcinoma (EPOIHCC). Liver Int. 2013, 33: 327-337
18. Kudo M, Izumi N, Kokudo N, Matsui O, Sakamoto M, Nakashima O, et al; HCC Expert Panel of Japan Society of Hepatology. Management of hepato-cellular carcinoma in Japan: Consensus-Based Clinical Practice Guidelines proposed by the Japan Society of Hepatology (JSH) 2010 updated version. Dig Dis. 2011, 29: 339-364.
19. Austin PC. A comparison of 12 algorithms for matching on the propensity score. Stat Med. 2014, 33: 1057-1069.
20. D’Agostino RB Jr. Propensity score methods for bias reduction in the com-parison of a treatment to a non-randomized control group. Stat Med 1998, 17: 2265-2281.
21. Kudo M, Chung H, Osaki Y. Prognostic staging system for hepatocellular carcinoma (CLIP score): its value and limitations, and a proposal for a new staging system, the Japan Integrated Staging Score (JIS score). J Gastroenterol. 2003; 38(3): 207-215.
22. Biggins SW, Kim WR, Terrault NA, Saab S, Balan V, Schiano T, et al. Evi-dence-based incorporation of serum sodium concentration into MELD. Gas-troenterology 2006; 130: 1652-1660.
23. Huo TI, Hsu CY, Huang YH, Su CW, Lin HC, Lee RC, et al. Prognostic pre-diction across a gradient of total tumor volume in patients with hepatocellular carcinoma undergoing locoregional therapy. BMC Gastroenterol 2010; 10: 146.