Embed Size (px)
Citation preview

Acta Cryst. (1999). D55, 1703±1717 Dauter � Data-collection strategies 1703
research papers
Acta Crystallographica Section D
BiologicalCrystallography
ISSN 0907-4449
Data-collection strategies
Zbigniew Dauter
National Cancer Institute, Frederick and Brook-
haven National Laboratory, Building 725A-X9,
Upton, NY 11973, USA
Correspondence e-mail: [email protected]
# 1999 International Union of Crystallography
Printed in Denmark ± all rights reserved
The optimal strategy for collecting X-ray diffraction data from
macromolecular crystals is discussed. Two kinds of factors
in¯uencing the completeness of data are considered. The ®rst
are geometric, arising from the symmetry of the reciprocal
lattice and from the experimental setup; they affect quantita-
tively the completeness of the measured set of re¯ections. The
second concern the quality, or information content, of the
recorded intensities of these measured re¯ections.
Received 28 January 1999
Accepted 22 June 1999
1. Introduction
Owing to technological advances in both hardware and soft-
ware in recent years, collection of diffraction data from
macromolecular crystals becomes ever easier and faster.
Parallel advances have occurred in the subsequent steps of the
analysis, such as phasing, re®nement and model building,
where more powerful programs accelerate the process and
make dif®cult cases more tractable. In the light of such general
progress, the importance of the quality of the intensities
should be emphasized. As all subsequent, mainly computa-
tional, steps of structure analysis become faster and easier, the
primary data quality plays a more important role, since data
collection is the last experimental stage and is often dif®cult to
repeat. High data quality makes all subsequent steps easier
and leads to more precise atomic models.
X-ray data collection is the last experimental step of the
analysis, but it is not a mere technicality and should be treated
as an important scienti®c process. The factors involved are
complex. Some can be treated in an automatic manner by the
controlling software. Others require decisions to be made by
the experimenter. The present detector-controlling and data-
processing programs often allow the use of some built-in
default parameters. Most of them can be recommended;
however, some parameters involved in the setting up of the
data collection should be considered for each individual
application. Crystals of macromolecules differ widely in their
characteristics, as do the various detectors. Appropriate values
of the parameters involved in setting up the experiment
should be selected to ensure the best possible data quality. The
choice of strategy for collecting data using the rotation
method has been discussed previously (Arndt, 1968; Klinger &
Kretsinger, 1989; Arndt & Wonacott, 1977; Vickovic et al.,
1994; Leslie, 1996; Ravelli et al., 1997; Dauter, 1997 and
numerous data-collection workshops). The presentation of the
basic concepts relevant for this subject can be found in several
compendia and textbooks (e.g. Giacovazzo, 1992; Helliwell,
1992; International Tables for X-ray Crystallography, 1992).
The most important factor in assessing the X-ray data is the
completeness. X-ray data consist of a set of indices and their

research papers
1704 Dauter � Data-collection strategies Acta Cryst. (1999). D55, 1703±1717
associated intensities, with their standard uncertainties. Both
should be complete; indices in terms of numbers and inten-
sities in terms of the information content. The quantitative
completeness of indices is mainly dependent on factors
governed by the geometry of the crystal lattice and of the
detector setup.
The qualitative completeness of the measured intensities
depends in a somewhat more complicated way on other
factors, such as exposure time, crystal diffracting power and
characteristics of the detector and X-ray source. The inten-
sities should be complete, but obviously not all of them are
strong. However, the weak intensities also contain informa-
tion. Some direct-methods applications make use of the fact
that certain re¯ections have very weak intensities. Neglecting
the weak re¯ections in re®nement introduces bias and
removes part of the information. It is not good practice to
reject all re¯ections weaker than, for example, 1� at the data-
processing stage, particularly if the estimation of errors may
also be dubious. The uncertainties (�s) of the measured
intensities have often been treated lightly in macromolecular
crystallography. In part, this re¯ects dif®culties involved in
their proper estimation. However, contemporary detectors
and processing programs allow the user to obtain proper
statistically estimated uncertainties of all measured intensities.
Many sophisticated algorithms, notably phasing and re®ne-
ment programs based on the maximum-likelihood principle,
depend on properly estimated standard deviations of the
structure amplitudes.
Factors in¯uencing diffraction data collected using two-
dimensional detectors will be discussed, ®rstly in the quanti-
tative or geometrical context and secondly in the qualitative
context.
2. Quantitative completeness of indices
2.1. The rotation method
All geometrical considerations of diffraction can be ratio-
nalized using the concept of the Ewald sphere, which illus-
trates Bragg's law of diffraction in three dimensions. For
geometric considerations, the diffraction from a crystal can be
treated as a re¯ection of X-rays from planes in the crystal. In
reality, this process is based on the interference of X-rays
scattered from atoms (or rather their electrons) positioned in
the crystal in an ordered fashion.
The Ewald construction is shown in Fig. 1. The radiation of
wavelength � is represented by a sphere of radius 1/� centered
on the X-ray beam. The crystal is represented by the reci-
procal lattice, with its origin at the point on the Ewald sphere
where the direct beam leaves it. Each reciprocal-lattice point
lies at the end of a vector perpendicular to the corresponding
family of crystal planes and with a length inversely propor-
tional to the interplanar spacing d. If the reciprocal-lattice
point lies on the surface of the Ewald sphere, the following
trigonometric condition is ful®lled: 1/2d = (1/�)sin�. After a
simple rearrangement, it takes the form of Bragg's law:
� = 2dsin�. Therefore, when a reciprocal-lattice point with
indices (hkl) lies at the surface of the Ewald sphere, the
interference condition for that particular re¯ection is ful®lled
and it gives rise to a diffracted beam directed along the line
joining the sphere centre with the reciprocal-lattice point at
the surface.
For any particular crystal orientation, only a few re¯ections
can be in the diffracting position, but most of them will not lie
on the surface of the Ewald sphere. The number depends on
the density of the reciprocal lattice and hence on the unit-cell
dimensions. A small-molecule crystal with short unit-cell
dimensions and a sparsely populated reciprocal lattice may
not give rise to any diffraction in some orientations. Crystals of
macromolecules have unit-cell dimensions much larger than
the wavelength of the radiation used, and several reciprocal-
lattice points (re¯ections) will lie on the surface of the Ewald
sphere in any crystal orientation.
In general, to observe the diffraction from a number of
re¯ections, the reciprocal-lattice points have to be moved to
the surface of the Ewald sphere or the sphere radius has to be
changed so that different re¯ections will lie on its surface. The
®rst approach, using a constant Ewald sphere and therefore a
selected wavelength (monochromatic radiation), requires that
the crystal be rotated to bring successive re¯ections into
diffraction (Fig. 2). If the crystal is only rotated about a single
axis, this is called the rotation method; this is the most
common procedure used for recording diffraction data in
macromolecular crystallography and is discussed below. The
other approach, with a stationary crystal and radiation of
continuous-wavelength spectrum (white radiation), is called
the Laue method. It is only used in special applications when
diffraction data have to be collected rapidly. This technique
will not be discussed here; its requirements are quite different
from those of the commonly used rotation method.
The reciprocal lattice consists of points arranged in planes.
Owing to the large unit-cell dimensions of macromolecular
crystals compared with the X-ray wavelengths, these planes
Figure 1The Ewald construction. When the reciprocal-lattice point crosses thesurface of the sphere, the trigonometric condition 1/d = (2/�) sin� isful®lled. This is the three-dimensional illustration of Bragg's law� = 2d sin�.

are densely populated in relation to the size of the Ewald
sphere. If the plane of re¯ections in the reciprocal lattice is
perpendicular to one of the real-space crystal axes, all re¯ec-
tions have one common index. It is instructive to inspect how
the arrangement of re¯ections into reciprocal-lattice planes
de®nes the diffraction pattern on a two-dimensional detector.
The plane intersects with the sphere, giving a small circle
which projects onto the detector as an ellipse, since all rays
diffracted by re¯ections from the same plane form a cone.
When the crystal is not rotated during the X-ray exposure or
rotates only very little, as in so called `still' or `pseudo-still'
photographs (Fig. 3), the diffraction pattern will consist of
spots arranged in a set of concentric ellipses originating from
one family of parallel planes in the reciprocal lattice. However,
if the crystal is rotated, the start and end orientations of the
plane form two intersecting ellipses with all re¯ections
recorded between them in the form of a lune, as in Fig. 4. All
re¯ections within the same lune originate from the same
reciprocal-lattice layer and represent direct lattice planes
parallel to one common axis. Because re¯ections are arranged
in families of parallel planes, there will be a family of
concentric lunes on the detector. The lunes will be more
pronounced if the reciprocal-lattice planes are oriented nearly
perpendicular to the X-ray beam or parallel to the detector
plane. Crystals with large unit-cell dimensions will produce
more pronounced lunes, while in the diffraction patterns of
small structures the lunes are not distinguishable.
The width of each lune varies around its circumference.
They are widest in the direction perpendicular to the rotation
axis, when the width is proportional to the rotation range per
exposure. In the direction along the rotation axis, the width is
very small, since the intersection of the plane with the Ewald
sphere does not vary signi®cantly. This is illustrated in Fig. 4.
Within each lune, diffraction spots are arranged along lines,
re¯ecting the regularity of the reciprocal lattice. Their pattern
Acta Cryst. (1999). D55, 1703±1717 Dauter � Data-collection strategies 1705
research papers
Figure 3A still exposure with a stationary crystal contains only a small number ofre¯ections arranged in a set of narrow ellipses.
Figure 4When the crystal is rotated, re¯ections from the same plane in thereciprocal lattice form a lune, limited by two ellipses corresponding to thestart and end positions.
Figure 2To bring more re¯ection into diffraction, the crystal represented by thereciprocal lattice has to rotate.

research papers
1706 Dauter � Data-collection strategies Acta Cryst. (1999). D55, 1703±1717
is distorted to a different extent as a consequence of the
mapping of the curved Ewald sphere on the ¯at (or sometimes
cylindrical) detector surface. The straight lines of re¯ections
become hyperbolas. The degree of distortion depends on the
diffraction angle, i.e. resolution. At low angles, the surface of
the Ewald sphere can be approximated by a plane, and at low
resolution the lunes look like precession photographs and are
easy to interpret and index even by eye.
2.2. Crystal mosaicity and beam divergence
The Ewald construction represents the radiation as a sphere
of radius 1/� attached rigidly to the beam, and the crystal in a
particular orientation as a reciprocal lattice consisting of
mathematical dimensionless points. In practice, the incident
radiation is not directed precisely along one line and all parts
of the crystal are not in the same unique orientation. The
X-ray beam can be focused and collimated to be parallel
within a small angle, about 0.2 or 0.4� on a rotating-anode
source with or without mirror optics, respectively, and to
somewhat smaller values on synchrotron beamlines, where the
horizontal and vertical beam divergence may differ. Crystals
are composed of small mosaic blocks slightly misoriented with
respect to one another, which adds some divergence to the
total rocking curve, that is to the amount of rotation during
which an individual re¯ection diffracts. This is schematically
illustrated in Fig. 5. In addition, the X-radiation is mono-
chromated to a de®ned narrow wavelength window and has a
bandpass ��/� of the order 0.0002±0.001 at synchrotron
beamlines; this is considerably wider on laboratory sources.
The Ewald sphere has two limiting orientations which results
in a de®ned active width, and reciprocal-lattice points can be
represented by disks extended angularly; mosaicity does not
extend them radially since the diffraction angle � remains
constant (Fig. 6). The wavelength bandpass effectively
broadens the Ewald sphere. These effects cause the diffraction
by a particular re¯ection to be spread over a range of crystal
rotation and therefore a period of time.
2.3. Partially and fully recorded re¯ections
The ®nite value of the rocking curve (the total effect of
beam divergence and crystal mosaicity) has consequences for
the diffraction pattern. In the rotation method, images are
exposed in a continuous series of narrow crystal rotations and
each re¯ection diffracts during a de®ned interval of crystal
rotation. Some re¯ections come into the diffracting position
during one exposure and ®nish during the next. Consequently,
part of their intensity will be recorded on one image and
another part on the next. If the rotation range per image is
small compared with the rocking curve, individual re¯ections
can be spread over several images. Such re¯ections are termed
partially as opposed to fully recorded, the latter having all
their intensity present on a single image. Inspection of Fig. 7,
which schematically represents a lune on two consecutive
images, illustrates how partials are present at the edges of
every lune. The lower edge of each lune contains the
remaining intensity of those partials which started diffracting
on the previous image, and the upper edge contains those
partials which will have the rest of their intensity on the next
exposure. Thus, comparison of two successive exposures shows
that some spots are common to both images. Fig. 8 illustrates
the effect of mosaicity on the diffraction pattern. If the
mosaicity increases, the lunes become wider because there are
more partial re¯ections. When the mosaicity reaches the value
of the rotation range, there are no fully recorded re¯ections at
all.
It is easy to judge by visual inspection if the mosaicity is low
or high. If it is low, all lunes have sharply de®ned edges. If it is
high, the intensities of re¯ections fade out gradually and there
are no clearly visible borders. A key characteristic of high
mosaicity is that all lunes are wide in the region along the
rotation axis. On still exposures, the width of the rings is
proportional to the crystal mosaicity.
The effect of mosaicity should not be confused with the
effect of crystal splitting. This effect, sometimes incorrectly
termed `twinning', produces diffraction patterns with over-
Figure 5Schematic illustration of how beam divergence and crystal mosaicitycombine to give the total rocking curve of the diffracted rays.
Figure 6Representation of beam divergence and crystal mosaicity in reciprocalspace, which cause the diffraction by a particular re¯ection to take placein a ®nite time and therefore during a de®ned crystal rotation.

lapped multiple lattices. Depending on the degree of splitting,
separate regular lattices can be identi®ed or re¯ection pro®les
are elongated or smeared out. The effect on the diffraction
image differs depending on the crystal orientation. In the
simplest case, the crystal consists of two parts slightly rotated
with respect to one another around a particular axis. When
such a rotation axis lies along the X-ray beam, the re¯ection
pro®les will be elongated or doubled in the plane of the
detector, and when it lies parallel to the detector plane, the
lunes will be broadened. The latter effect is similar to that of
high mosaicity, but the re¯ection pro®les will not be signi®-
cantly affected. It is therefore good practice to judge the
crystal quality from inspection of two initial test exposures
separated by 90o rotation.
2.4. Wide and ®ne slicing
In the context of the angular width of an individual re¯ec-
tion, two approaches within the rotation method can be
considered. So-called `wide slicing' is based on collecting
images wider than the rocking curve, usually of the order of
0.5� or more. The images contain mainly fully recorded
re¯ections, with some partials. In the `®ne-slicing' method,
images are much narrower than the re¯ection width, 0.1� or
less, so that each re¯ection is spread over several images. The
two methods require a different approach to the integration of
intensities. In the wide-slicing method, each re¯ection has a
two-dimensional pro®le. In the ®ne-slicing approach, three-
dimensional pro®les can be constructed, with the ' axis of
rotation as a third dimension.
The disadvantage of wide slicing
relates to the fact that the rotation range
is greater than the rocking curve. As a
consequence, each re¯ection pro®le is
overlapped on the background which
accumulates during the whole image
exposure, even when re¯ections do not
diffract. In this context, there is no
advantage in cutting the rotation range
further than the crystal rocking width.
However, ®ner slicing allows the
construction of the three-dimensional
pro®les, which may provide more accu-
rate intensity integration.
The main factor for or against wide or
®ne slicing is the read-out time of the
detector. If this is negligible in compar-
ison with the exposure time (as for
ionization chambers or some CCDs),
then ®ne slicing can be recommended. If
the detector dead-time is relatively large
(as for imaging plates), wide slicing is
usually the method of choice.
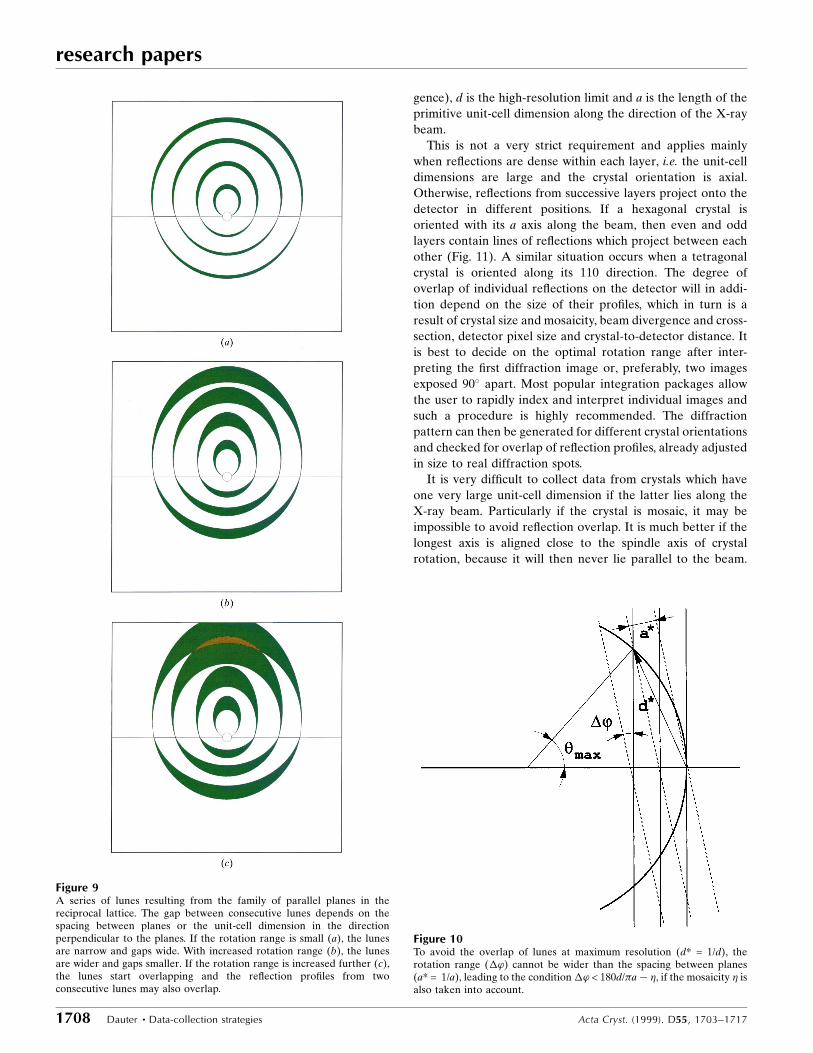
2.5. Rotation range
In the ®ne-slicing approach, there are
no practical limitations resulting from
the geometry of the rotation method. For
wide slicing, a few factors must be taken
into account for selection of the rotation
range per single exposure. In principle, it
should be small enough to avoid overlap
of neighbouring lunes, Figs. 9(a)±9(c). A
simple formula can be derived (Fig. 10)
and used to estimate the maximum
permitted rotation range:
�' � 180d=�aÿ �;
where the factor 180/� converts radians
to degrees, � is the angular width of the
re¯ection (mosaicity and beam diver-
Acta Cryst. (1999). D55, 1703±1717 Dauter � Data-collection strategies 1707
research papers
Figure 8The difference between analogous lunes for low (left) and high mosaicity (right). With increasedmosaicity the width of the lune widens, most characteristically along the rotation axis.
Figure 7Schematic representation of a lune on two consecutive exposures. The ®rst image, on the left,contains the remaining intensity of partially recorded re¯ections from the previous image (yellow),fully recorded re¯ections (green) and a fraction of the intensity of re¯ections which still diffract atthe end of exposure (brown). On the next exposure, on the right, the remaining intensity of thelatter re¯ections is present (brown) as well as further fully and partially recorded re¯ections.
research papers
1708 Dauter � Data-collection strategies Acta Cryst. (1999). D55, 1703±1717
gence), d is the high-resolution limit and a is the length of the
primitive unit-cell dimension along the direction of the X-ray
beam.
This is not a very strict requirement and applies mainly
when re¯ections are dense within each layer, i.e. the unit-cell
dimensions are large and the crystal orientation is axial.
Otherwise, re¯ections from successive layers project onto the
detector in different positions. If a hexagonal crystal is
oriented with its a axis along the beam, then even and odd
layers contain lines of re¯ections which project between each
other (Fig. 11). A similar situation occurs when a tetragonal
crystal is oriented along its 110 direction. The degree of
overlap of individual re¯ections on the detector will in addi-
tion depend on the size of their pro®les, which in turn is a
result of crystal size and mosaicity, beam divergence and cross-
section, detector pixel size and crystal-to-detector distance. It
is best to decide on the optimal rotation range after inter-
preting the ®rst diffraction image or, preferably, two images
exposed 90� apart. Most popular integration packages allow
the user to rapidly index and interpret individual images and
such a procedure is highly recommended. The diffraction
pattern can then be generated for different crystal orientations
and checked for overlap of re¯ection pro®les, already adjusted
in size to real diffraction spots.
It is very dif®cult to collect data from crystals which have
one very large unit-cell dimension if the latter lies along the
X-ray beam. Particularly if the crystal is mosaic, it may be
impossible to avoid re¯ection overlap. It is much better if the
longest axis is aligned close to the spindle axis of crystal
rotation, because it will then never lie parallel to the beam.
Figure 9A series of lunes resulting from the family of parallel planes in thereciprocal lattice. The gap between consecutive lunes depends on thespacing between planes or the unit-cell dimension in the directionperpendicular to the planes. If the rotation range is small (a), the lunesare narrow and gaps wide. With increased rotation range (b), the lunesare wider and gaps smaller. If the rotation range is increased further (c),the lunes start overlapping and the re¯ection pro®les from twoconsecutive lunes may also overlap.
Figure 10To avoid the overlap of lunes at maximum resolution (d* = 1/d), therotation range (�') cannot be wider than the spacing between planes(a* = 1/a), leading to the condition �' < 180d/�aÿ �, if the mosaicity � isalso taken into account.

Unfortunately, plate-like crystals often have the very long cell
edge perpendicular to the ¯at face. It is dif®cult to mount such
crystals across the spindle axis. A goniostat with � geometry
may be used to reorient the crystal or the mounting loop can
be bent (Fig. 12) to accommodate a ¯at crystal in a skewed
orientation.
2.6. Crystal-to-detector distance
The longer the crystal-to-detector distance, the better the
signal-to-noise ratio in the recorded diffraction pattern, since
the background area increases with the square of the distance,
whereas re¯ection pro®les increase less. The distance should
therefore be adjusted to match the maximum resolution of the
diffraction. It is advisable to inspect two images 90� apart, as
some crystals display anisotropy and diffract further in one
direction than another. A key and dif®cult decision is to judge
how far meaningful intensities extend, and initial images
should be carefully inspected visually with maximum display
contrast. It is advisable to apply some safety margin, i.e. set the
distance a little closer than results from such an inspection.
In some cases, additional factors must be taken into
account. If one unit-cell dimension is so large that setting the
detector distance to maximum diffraction resolution would
lead to signi®cant overlap of re¯ection pro®les, it is better to
sacri®ce the resolution for full completeness of the data and
set the distance so that re¯ection pro®les separate. If the
detector setup permits, it can be shifted from the central
position using either the 2� arm or a simple vertical displa-
cement. With such an offset, higher diffraction angles and
higher resolution data can be collected. However, a larger
total rotation may be necessary to achieve complete data. This
only applies when the re¯ection overlap is a consequence of
the long axis being oriented in the plane of the detector. If it is
caused by the overlap of lunes (discussed in the previous
section), increase of the distance and detector offset will not
help.
2.7. Wavelength
The wavelength of X-radiation produced by a rotating-
anode source is ®xed at the value characteristic for the anode
metal, usually copper with � = 1.542 AÊ . In contrast, the user of
a synchrotron beamline often has the freedom of choosing the
radiation wavelength.
If data are collected with the aim of recording the anom-
alous diffraction signal, the wavelength must be appropriately
optimized. The requirements of multiwavelength anomalous
dispersion experiments are particularly strict and are
discussed in a separate article. For single-wavelength anom-
alous dispersion data, it is usually suf®cient to adjust the
wavelength to be a little shorter than the absorption edge of
the anomalous scatterer present in the crystal. If possible, it is
also instructive to record a ¯uorescence spectrum from the
crystal or at least from a standard sample containing the
desired element or its salt. In the latter case, some safety
margin should be adopted, setting the wavelength about
0.001±0.002 AÊ shorter (or the energy 10±20 eV higher) than
the observed edge of the standard, allowing for the possible
chemical shift of the signal.
For native data collection at a synchrotron, any value of the
wavelength can be used, ensuring the high intensity of the
beam, which may vary depending on the characteristics of the
source and beamline optics. At most synchrotrons, wave-
lengths below 1 AÊ are used, as this minimizes the absorption
of radiation by the crystal and its mother liquor and the air
scatter. The prolonged lifetime of crystals owing to avoidance
of secondary damage is not a signi®cant factor today since
cryogenically frozen samples are generally used. Short wave-
length is advantageous for collecting very high resolution data,
since it decreases the maximum recordable 2� angle and
minimizes the blind region (see below). The advantage of
longer wavelength is the stronger interaction with crystals,
leading to enhanced intensity of diffracted rays.
2.8. Blind region
In the rotation method, the crystal is rotated around a single
axis. Using the reciprocal-space construction, the X-radiation
Acta Cryst. (1999). D55, 1703±1717 Dauter � Data-collection strategies 1709
research papers
Figure 11When the cell is centered or if the cell angles differ from 90�, there¯ections from neighbouring lunes will not overlap, as in the case of ahexagonal crystal exposed along its a axis.
Figure 12It is advantageous to orient the longest crystal unit-cell dimension alongthe spindle axis. If the crystal is a thin plate, a bent loop can be used toachieve this.

research papers
1710 Dauter � Data-collection strategies Acta Cryst. (1999). D55, 1703±1717
is represented by the Ewald sphere and the crystal by the
lattice of points rotating around an axis tangential to the
sphere. Re¯ections diffract when the corresponding lattice
points cross the surface of the sphere. For analysis of the
mutual relationship between the radiation and the crystal,
disregarding detector and radiation source position, it is
convenient to treat the crystal as stationary and the radiation
sphere as rotating, which is easier to visualize graphically.
Fig. 13 shows that not all the re¯ections can diffract, since
some reciprocal-lattice points lying close to the rotation axis
will never cross the Ewald sphere, even after 360� rotation.
This part of the reciprocal lattice, on both sides of the spindle
axis, is called the `blind region' or `cusp'. Following the
curvature of the sphere, the width of the blind region varies: at
low resolution it is narrow and it broadens at high resolution.
Its width depends only on the relationship between the reso-
lution and the wavelength or, in other words, on the value of
the diffraction angle �. The fraction of the reciprocal space
within the blind region, equivalent to the fraction of unre-
cordable re¯ections at a particular angle B� is
B� � 1ÿ cos �:
The total fraction of re¯ections lost in the blind region up to a
certain limit of the � angle, Btot, is
Btot � 1ÿ 3�4� ÿ sin 4��=�32 sin3 ��:A graph showing the proportion of data contained in the blind
region Btot as a function of resolution for selected wavelengths
is shown in Fig. 14. At a particular resolution, the blind region
is narrower if the wavelength is short, since the surface of the
Ewald sphere is ¯atter (Fig. 15). As mentioned previously, this
is an advantage of using short-wavelength radiation.
When the crystal has symmetry axes, it is possible to record
re¯ections which are symmetry-equivalent to those in the
blind region if the unique axis itself does not lie in it. Skewing
the symmetry axis by at least �max from the spindle direction
ensures that there will be no loss of completeness owing to the
blind region (Fig. 16). Monoclinic crystals should be skewed
away from the ac plane as well as from the b axis.
If the crystal is triclinic, there is no way to avoid loss of
completeness arising from the blind region in a single rotation
pass. To collect missing re¯ections, the crystal has to be re-
oriented by at least 2�max from the previous spindle-axis
direction, e.g. using �-goniostat arcs. The second pass of data
collection should cover the missing 2�max width of reciprocal
space.
In summary, the detrimental effect of the blind region on
the completeness of data is signi®cant only if the crystal is
aligned along the unique symmetry axis or if it is in space
group P1. At low resolution it can be neglected altogether!
2.9. Total rotation range
Selection of the total rotation range appropriate for the
crystal symmetry is the most important factor in¯uencing the
completeness of data. In principle, collecting 180 or even 360�
(with anomalous signal in low symmetry) of data will always
ensure maximum completeness. As discussed below, it would
also result in multiple measurements of equivalent intensities,
leading to more accurate data. However, the available beam
time can often be limited, especially at synchrotron sites, and
minimization of the time of the experiment is a factor to be
taken into account in the normal practice of data collection.
The analysis of the crystal symmetry in relation to the
geometry of the rotation method allows one to specify
conditions leading to the minimal complete data set when all
unique re¯ections are measured at least once. Such consid-
Figure 13A full 360� rotation of a crystal is here represented as the equivalentrotation of the Ewald sphere with the crystal stationary. Re¯ections in theblind region, close to the rotation axis, will never cross the surface of thesphere. The blind region is narrow at low resolution and wide at highresolution. Its half-width equals the diffraction angle � at a givenresolution.
Figure 14A graph showing the total fraction of re¯ections located in the blindregion for different wavelengths: 1.54 AÊ (green), 1 AÊ (blue) and 0.71 AÊ
(red). Only at very high resolution is there the possibility of a signi®cantloss of completeness because of the blind region.

erations can be expected to be less important at third-
generation synchrotron sources. On the other hand, some
crystals, even if frozen, may not survive the exceedingly
intense radiation from third- or fourth-generation synchrotron
sources and in this case it would be bene®cial to reach high
completeness as soon as possible, following the optimal
strategy.
The data are complete if the Ewald sphere has been crossed
by all re¯ections (or their symmetry mates) in the asymmetric
part of the reciprocal lattice, which always has the shape of a
wedge with the apex at the origin and is limited by the
maximum-resolution sphere. Its shape and volume is char-
acteristic for the particular Laue symmetry group. Restricting
the analysis to macromolecular crystals with the centre of
symmetry excluded, it is suf®cient to consider the point-group
symmetry (i.e. crystal class). The presence of screw axes is
irrelevant for these considerations; for example, P41212, P4322
and P4212 belonging to point group 422 have identical
asymmetric units in reciprocal space. In some point groups, the
asymmetric unit can be speci®ed in more than one way; for
example, in triclinic symmetry any hemisphere constitutes an
asymmetric unit.
When a crystal is rotated by 180�, both sides of the Ewald
sphere cover 180� of reciprocal space. Fig. 17 illustrates the
case when a monoclinic crystal is rotated around the unique
axis b. This also applies to a triclinic crystal rotated around any
arbitrary axis. After 180� rotation, the lower side of the Ewald
sphere covers the region marked in green and the upper side
covers the region marked in brown. Re¯ections in the dark-
brown region will be measured twice, but the centrosymme-
trically related blue region will not be covered at all. When
anomalous differences are not required, it is suf®cient to
collect 180� of data to achieve full completeness (except for
the blind region present in such an orientation). When both
Friedel mates must be collected, a wider rotation range of
180� + 2�max is necessary. If the crystal symmetry is monoclinic,
each Bijvoet mate is then measured twice owing to the
symmetric relation of the volumes above and below the plane
of the graph. If there is no anomalous signal, each unique
re¯ection is measured four times.
The situation after 135� of rotation is shown in Fig. 18.
There is only a small region with re¯ections measured twice,
but there are some re¯ections not covered at all. Character-
istically, the high-resolution data are completed ®rst and the
missing region at lowest resolution is only ®lled when the
rotation approaches 180�. This should be taken into account in
calculations of predicted completeness using integration
software. Such programs usually give the overall value, but
Acta Cryst. (1999). D55, 1703±1717 Dauter � Data-collection strategies 1711
research papers
Figure 15The blind region is narrower with short-wavelength radiation (green)than long-wavelength radiation (brown), since the corresponding Ewaldsphere is ¯atter.
Figure 16To avoid loss of completeness arising from the blind region, it is suf®cientto skew the crystal from the axial orientation by �max, the diffraction angleat highest resolution.
Figure 17The diffraction sphere (dashed line) corresponding to the highestresolution limit of diffraction and the Ewald sphere at the start andend of a 180� rotation. The lower side of the Ewald sphere covers one partof the reciprocal space (green) and the upper side another part (brown).They overlap over the 2�max range (dark brown). If a monoclinic crystal isrotated around its twofold axis, 180� is suf®cient to achieve fullcompleteness, even if individual Bijvoet mates have to be recordedseparately for anomalous data. If the crystal is triclinic, 180� is suf®cientfor the native data, owing to the centrosymmetric relation between thenon-covered region (blue) and the covered part (dark brown). However,for anomalous triclinic data 180� + 2�max have to be covered.

research papers
1712 Dauter � Data-collection strategies Acta Cryst. (1999). D55, 1703±1717
data 95% complete in total may lack 20% of the re¯ections in
low-resolution shells. This effect results from the curvature of
the Ewald sphere and is more pronounced at very high reso-
lution. If one collects atomic resolution data in several passes
with different exposures and resolution limits, it is not
necessary to cover all the theoretically required rotation range
in the highest resolution pass, but the lowest resolution pass
must be complete.
In general, a given fraction of the rotation range yields a
larger fraction of data. For example, after 90� rotation when
180� is required, as shown in Fig. 19, the completeness may
reach about 65%. However, it is possible to obtain higher
completeness without increasing the total rotation range
covered by splitting the whole range into smaller parts. 45� of
data collected twice but separated by a 45� gap, as shown in
Fig. 20, will give much higher completeness than a single 90�
pass, again as a result of the curvature of the sphere.
When an orthorhombic crystal is rotated around any of its
twofold axes, the required rotation range is 90�, as illu-
strated in Fig. 21. In fact, this also applies if the crystal is
rotated around any vector lying in one of the axial planes,
since the asymmetric unit corresponds to 90� of data
between one of the axes and a plane perpendicular to it. It
is advantageous to have the crystal oriented around e.g. the
110 vector, since in the exactly axial orientation there will be
some re¯ections lost in the blind region. However, the 90�
must be between the axis and the plane of symmetry. If the
rotation range starts in the diagonal orientation, as in Fig. 22,
the same 45� of data will be collected twice, giving a �65%
complete set, similar to Fig. 19. When the orthorhombic crystal
is oriented around an arbitrary axis not in the symmetry plane,
more than 90� of rotation is required. In such cases, it is
advisable to estimate the necessary rotation range and start
using the strategy programs available within some data-
processing packages.
In general, the required rotation range depends on the
crystal orientation. For example, in 622 symmetry the asym-
metric unit is a wedge, 30� wide but spanning the space
between the sixfold axis along c and the ab plane. Therefore, if
rotated around the c axis, the 622 crystal requires only 30� of
data, but if rotated around a vector in the ab plane 90� are
necessary.
In the above, it is assumed that the detector position is
symmetrical with respect to the X-ray beam. If it is offset by a
2� angle, then only one side of the Ewald sphere is relevant
and the required rotation ranges will be different, e.g. an
orthorhombic crystal will require 90� + 2�max for complete-
ness. It is then better to rely on software predictions of
required rotation.
Table 1 lists the required rotation range for crystals of
different classes in various typical orientations. A central
position of the detector is assumed. For cubic crystals, it is
dif®cult to give reliable estimations, since they vary dramati-
cally with the crystal orientation.
Figure 18After 135� of rotation when 180� is required, the high-resolution shellmay be ®lled, but the low-resolution region will not be complete.
Figure 19The fractional completeness is higher than the fraction of the requiredrotation range; 90� rotation out of 180� gives about 65% of unique data.
Figure 20If 90� is split into two 45� ranges separated by 45� gaps, the totalcompleteness is considerably higher than for one continuous range.

Taking into account the importance of selecting the optimal
rotation range, it should again be stressed that it is highly
advantageous to interpret the ®rst trial images from a newly
mounted crystal, establish its orientation and symmetry and
then decide where to start and how wide a rotation to cover.
Tools available within most popular integration packages
allow the quick and reliable making of such estimates.
2.10. Equivalent indexing
In certain point groups, re¯ections can be indexed in
multiple ways, all permitted but not equivalent, so that
intensities of re¯ections indexed according to different
schemes do not agree. This is possible in point groups which
have symmetry lower than the symmetry of their Bravais
lattice. In other words, the symmetry of re¯ection positions is
higher than the symmetry of the distribution of their inten-
sities which de®nes the true symmetry of the crystal. Groups
with polar axes, such as 3, 4 or 6, can be indexed with the c axis
up or down the same direction. The directionality of polar axes
is not de®ned by the lattice if its two other dimensions are
equivalent. In monoclinic symmetry, the twofold axis is polar,
but its direction is speci®ed by the non-equivalence of the two
remaining axes perpendicular to it. Fig. 23 illustrates the case
of crystal class 4 with the two possible indexing schemes.
Re¯ections de®ned by the same indices in both schemes have
different intensities.
Another example of the multiple-indexing choice is in cubic
symmetry 23 with twofold axes placed along the lattice four-
folds. Rotation by 90� leads to alternative, although perfectly
permitted, indexing of re¯ections.
Alternative, non-equivalent indexing schemes are not
important if all data are collected from one crystal. However,
when they are merged from several crystals or intensities are
compared between native and derivative data it has to be
taken into account. It does not matter how re¯ections are
indexed during intensity integration, since all possibilities will
perfectly match the crystal lattice, but for scaling and merging
of intensities all re¯ections must be indexed in the same way.
To re-index all re¯ections to the alternative scheme, it is
necessary to apply the symmetry operation which is included
in the (higher) symmetry of the lattice but does not occur in
the (lower) crystal point-group symmetry. For example,
re¯ections in symmetry 3 can be indexed in four non-
equivalent ways, since there are four ways of locating a
threefold axis in the hexagonal lattice of 622 rotational
symmetry. The operations required for re-indexing are either
sixfold rotation or one of the alternative twofold rotations
which are not present in the point group 3. Instead of sixfold
rotation, twofold rotation around the c axis can be applied,
since it is included in 6 and absent in 3. Table 2 lists point
groups with alternative indexing possibilities, with the
symmetry operations required for re-indexing.
Acta Cryst. (1999). D55, 1703±1717 Dauter � Data-collection strategies 1713
research papers
Table 1Rotation range (�) required to collect a complete data set in differentcrystal classes.
The direction of the spindle axis is given in parentheses; ac means any vector inthe ac plane.
Point group Native data Anomalous data
1 180 (any) 180 + 2�max (any)2 180 (b); 90 (ac) 180 (b); 180 + 2�max (ac)222 90 (ab or ac or bc) 90 (ab or ac or bc)4 90 (c or ab) 90 (c); 90 + �max (ab)422 45 (c); 90 (ab) 45 (c); 90 (ab)3 60 (c); 90 (ab) 60 + 2�max (c); 90 + �max (ab)32 30 (c); 90 (ab) 30 + �max (c); 90 (ab)6 60 (c); 90 (ab) 60 (c); 90 + �max (ab)622 30 (c); 90 (ab) 30 (c); 90 (ab)23 �60 �70432 �35 �45
Figure 21An orthorhombic crystal requires 90� rotation between two axialorientations.
Figure 22If an orthorhombic crystal is exposed starting at diagonal orientation, 90�
is equivalent to collecting twice the same 45� and is not suf®cient forcomplete data.

research papers
1714 Dauter � Data-collection strategies Acta Cryst. (1999). D55, 1703±1717
When collecting multiple data sets from the same crystal, as
in two-exposure passes or in a MAD experiment, it is advi-
sable to adopt a common orientation matrix from the ®rst
indexing to all data. If other parameters differ, they can be
modi®ed and different rotation starting positions can be easily
related. Independent autoindexing for each data pass may
lead to confusion resulting from non-equivalence of indexing
schemes.
2.11. Interpretation of the example images
The series of images presented in Figs. 24(a)±24(f) were
recorded from a crystal of lysozyme, space group P43212, unit-
cell dimensions a = b = 78.6, c = 37.2 AÊ , crystal-to-detector
distance 243 mm, wavelength 0.92 AÊ , resolution 2.7 AÊ , oscil-
lation range 1.5� and crystal mosaicity �0.5�. These images
illustrate some of the points discussed above. Each lune in
Figs. 24(a)±24(d) consists of re¯ections arranged as squares
re¯ecting the tetragonal symmetry with a = b. The crystal was
rotated around the axis diagonal between a and b, which is
evident from the way the squares of re¯ections are arranged.
The gaps between lunes are large, a consequence of the
relatively short third unit-cell dimension c, which is oriented
along the beam perpendicular to the detector plane. This axis
was almost perfectly perpendicular to the detector at the point
between the images in Figs. 24(a) and 24(b), and the corre-
sponding zero-layer almost vanishes behind the shadow of the
beam-stop. In such an orientation, the {hk0} plane in the
reciprocal lattice is tangential to the Ewald sphere at the
origin. The images 90� away (Figs. 24e and 24f) look quite
different. There are more lunes with smaller gaps between
them, but they are less densely populated by re¯ections,
consistent with the orientation of the reciprocal lattice. Now
the lunes are parallel to the hhl family of planes normal to the
110 vector. These planes have ®ner spacing, but the distances
between re¯ections within each plane are longer. The average
density of spots is constant over the whole reciprocal lattice
and therefore the number of re¯ections present in each image
is approximately equal and does not depend on the crystal
orientation. The hhl lunes even partially overlap at higher
resolution close to the detector edge but, owing to the diag-
onal orientation, re¯ections on each successive lune ®t
between those on the previous one.
Closer inspection of the re¯ections within the zero-layer
hk0, in particular the `pseudo-precession' patterns in the
images in Figs. 24(c) and 24(d), proves that only every second
re¯ection is observed along the lines of spots passing through
the origin containing re¯ections h00 or 0k0. This re¯ects the
presence of the 21 screw axes within space group P43212. The
presence of the 43 screw axis can be con®rmed on the images
exposed after 90� rotation (Figs. 24e and 24f), when the c axis
lies vertically in the plane of the detector and the 00l re¯ec-
tions can be seen. Another con®rmation of the crystal Laue
symmetry group being P4/mmm and not P4/m is the presence
of diagonal (in this case vertical) mirror correspondence of
re¯ection intensities on the left and right halves of the lunes. It
must be stressed that the positions of the re¯ections de®ne
only the Bravais lattice and it is the symmetry of the intensity
pattern which re¯ects the point-group symmetry and the
arrangement of molecules (or, more correctly, structural
motifs) in the crystal.
Table 2Space groups with alternative non-equivalent indexing schemes.
Symmetry operations required for re-indexing are given as relations of indicesand in the matrix form. In brackets are the chiral pairs of space groupsindistinguishable by diffraction. These space groups may also display the effectof merohedral twinning, with the twinning symmetry operators the same asthose required for re-indexing.
Space group Re-indexing transformation
P4, (P41, P43), P42, I4, I41 hkl!khl 010/100/001P3, (P31, P32) hkl!hkl 100/010/001
or hkl!khl 010/100/001or hkl!khl 010/100/001
R3 hkl!khl 010/100/001P321, (P3121, P3221) hkl!hkl 100/010/001P312, (P3112, P3212) hkl!hkl 100/010/001P6, (P61, P65), (P62, P64), P63 hkl!khl 010/100/001P23, P213, (I23, I213), F23 hkl!khl 010/100/001
Figure 23Two ways of indexing the tetragonal lattice in point group 4, with thefourfold axis directed `up' or `down'. These two ways are not equivalent,since re¯ections with the same indices will have different intensities. Inthis case the symmetry of re¯ection positions (lattice) is higher than thesymmetry of their intensities.

A detailed comparison shows that some re¯ections at the
edges of every lune are present in pairs of images. The crystal
mosaicity was about 0.5�, which is one-third of the rotation
range. Therefore, about one-sixth of the re¯ections from each
lune is expected to show up on both images. The substantial
mosaicity of the crystal can be judged from the fact that the
lune edges are not clearly de®ned, but the intensities gradually
fade out. However, it is not necessary to compare two images
to realise how the crystal was rotated. It is clear where the
lunes are narrow (along the spindle axis, close to the blind
region) and where they are wide (direction of rotation,
perpendicular to the spindle axis).
3. Qualitative factors
3.1. Re¯ection pro®les
The ®rst and easiest to inspect visually are the re¯ection
pro®les, which can be checked on the initially exposed images.
They should be regular with a single peak. Their shape should
re¯ect the size and shape of the crystal: if the crystal is needle-
like, re¯ection pro®les will be elongated; otherwise, elongation
of spot pro®les, especially in the direction perpendicular to the
detector radius, is a bad sign. When the pro®les are irregular, it
is vital to expose the crystal in another orientation and
compare the pro®les, since crystal splitting may not be equally
obvious in all orientations. After indexing the diffraction
pattern, the integration pro®les should be matched with the
size and shape of diffraction spots. The spots should not
extend into the area de®ned as background. Selection of too
small integration pro®les will lead to incorrect integration of
intensities; when pro®les are too large, the estimation of
standard uncertainties will be biased.
3.2. Exposure time
Exposure time is the factor which most strongly in¯uences
the re¯ection intensities. In principle, the higher the inten-
sities, the higher the signal-to noise-ratio and therefore the
higher the data quality. This is a simple consequence of
counting statistics. Doubling the intensity enhances the signal-
to-noise ratio by 21=2. In practice, other factors also play an
important role.
There are always limitations on the available beam time. In
the time available for the experiment, all images necessary to
achieve complete data have to be recorded, even at the cost of
underexposing them. It is better to have maximally complete
data of somewhat lower intensity than only a part of theore-
tically superior data. This consideration has often been of
special importance at synchrotron stations, but may diminish
with third-generation sources and fast detectors such as CCDs
or pixel devices.
3.3. Overloads
The dynamic range of the detector is another factor to be
taken into account. Each detector has a certain count level
which saturates its pixels, resulting mainly from the limitations
of its electronics. Pixels which accumulate more counts are
overloaded and cannot be used for accurate evaluation of
re¯ection intensity. There is a method of approximate
evaluation of intensities affected by overloaded pixels which
have a `top-hat' pro®le and are only overloaded at the central
pixels. This is based on the overlap of a standard re¯ection
pro®le on the pixels in the shoulder of such a spot, but gives a
less reliable measurement. For some applications, especially
those based on the Patterson function (like molecular repla-
cement) or direct methods, it may be preferable to accept such
estimations, since complete absence of the strongest re¯ec-
tions will seriously bias the results, but for the ®nal re®nement
of the model they should perhaps be excluded.
The contrast between the intensities of the strongest and
weakest re¯ections is very large. It is therefore inevitable that
if the exposure is adjusted to adequately measure the weak
high-resolution re¯ections, some of the strongest ones will be
overloaded. They should be measured in a separate rotation
pass, with shorter exposures adjusted to adequately cover the
strong re¯ections below the overload limit. In some cases, the
required speed of spindle-motor rotation may be exceedingly
fast and beyond its limit of reliability. Instead of increasing the
rotation speed, it is then better to attenuate the beam inten-
sity, e.g. using aluminium foil(s) of appropriate thickness. The
second pass does not need to extend to the same resolution
limit: it is suf®cient to cover the region containing overloads,
and the distance can be increased as well as the rotation range
per image. The difference in effective exposure should not
exceed 10±20 for successful scaling of all data.
3.4. R factor, I/r and estimated uncertainties
The data quality is usually judged by the global Rmerge
factor, based on intensities or rather F2. This gives the average
ratio of the spread of intensities of the multiply measured
symmetry-equivalent re¯ections to the estimated value of the
re¯ection intensity
Rmerge �Phkl
Pi
jIhkl;i ÿ hIhklij=Phkl
hIhkli:
This global value is not a proper statistical quanti®er and is
calculated in different ways in different programs. The value of
Rmerge is highly in¯uenced by data multiplicity. As a conse-
quence, it is always higher for data in high-symmetry space
groups than those in low symmetry. Higher multiplicity always
leads to improved data quality, although it increases the Rmerge
factor.
Merging of equivalent intensities provides an opportunity
to identify and reject outliers, i.e. intensities wrongly measured
and not agreeing with their equivalents. A small number of
outliers may result from erroneous classi®cation of partially
and fully recorded re¯ections, particularly those lying close to
the blind region, from individual CCD detector pixels affected
by `zingers', i.e. sparks from trace radioactivity of the taper
glass, from shadowed or inactive regions of the detector
window etc. However, the number of outliers rejected from the
merging process should be small, at most 1%. It is possible to
`improve' the Rmerge by rejecting a large number of measure-
ments until the multiplicity is low. This is an extremely bad
Acta Cryst. (1999). D55, 1703±1717 Dauter � Data-collection strategies 1715
research papers

research papers
1716 Dauter � Data-collection strategies Acta Cryst. (1999). D55, 1703±1717
practice which adversely
in¯uences the overall quality
of data. There should always
be a physical reason for
rejecting outliers, other than
just bad agreement with
symmetry-equivalent inten-
sities.
Similarly, it is not advisable
to reject re¯ections weaker
than a certain limit, say 1�, at
the stage of data merging. As
pointed out before, weak
intensities also carry infor-
mation and their neglect
introduces bias into intensity
distribution affecting, for
example, the re®ned overall
temperature factor.
Complementary informa-
tion about the data quality to
Rmerge is given by the ratio of
intensities to their uncertain-
ties,P
Ihkl=P��Ihkl�,
provided that �s are esti-
mated properly. This is not
trivial, since most detectors
(such as imaging plates or
CCDs) do not count indivi-
dual X-ray quanta directly
and counting statistics may
be biased. The detector-gain
factor specifying the detector
response to a single quantum
of radiation should be taken
into account in the evaluation
of intensity uncertainties
during integration. Usually,
data-processing packages
provide means for checking
and correcting the level of
intensity uncertainties based
on the �2 test or on the t plot,
which requires that the ratio
of the spread of estimated
intensities to the associated
uncertainties:
t = (hIi ÿ Ii)/�(I) should have
a normal distribution with an
average of 0.0 and standard
deviation of 1.0. Correct
estimation of intensity stan-
dard uncertainties is impor-
tant in all successive
applications based on statis-
tical or probabilistic treat-
ments, such as maximum-
Figure 24A series of images from a crystal of lysozyme with unit-cell parameters a = 78.6, c = 37.2 AÊ in space group P43212at 2.7 AÊ resolution with 1.5� rotation per exposure. (a)±(d) Four consecutive images exposed with the crystaloriented along its fourfold axis. Large gaps between lunes result from a short c axis. (e, f ) Two images exposed90� away, along the 110 direction. The lunes are much wider, overlapping at high resolution. A close inspectionof the zero-layers reveals the presence of systematic absences resulting from the 21 axes (c and d) and the 43 axis(e and f ).

likelihood phasing, re®nement and direct methods of solving
heavy- or anomalous-atom positions.
In principle, data contain some information if I/� is higher
than 1.0. However, there will be few meaningful intensities
among a majority of unreliable estimations if the ratio is close
to 1.0. For certain applications, it may be advisable to accept
weak data. For example, direct methods use only the subset of
most meaningful re¯ections but extending to as high a reso-
lution as possible. In the standard applications, the accepted
resolution limit is where the I/� falls below about 2.0. Rmerge
may then reach 20±40%, depending on the symmetry and
redundancy.
4. Final remarks
Optimal strategies for data collection are in¯uenced by several
factors. Some are general and others depend on the char-
acteristics of a particular crystal or detector. The selection of
data-acquisition parameters is not trivial and is often the result
of a compromise between several requirements. It is dif®cult
to obtain very high multiplicity of measurements in a time-
limited experiment. It is essential to know the relative
importance of particular parameters in the whole process and
make appropriate decisions. As synchrotron beamlines
become brighter, detectors become faster and data-processing
software becomes more sophisticated, the whole process of
data collection becomes easier from the technical point of
view, yet the crucial scienti®c decisions still have to be made by
the experimenter. It must be stressed that it is always bene-
®cial to sacri®ce some time and interpret the initial diffraction
images thoroughly in order to avoid mistakes which may have
an adverse effect on data quality and the whole of the
subsequent structural analysis.
References
Arndt, U. W. (1968). Acta Cryst. B24, 1355±1357.Arndt, U. W. & Wonacott, A. J. (1977). Editors. The Rotation Method
in Crystallography. Amsterdam: North Holland.Dauter, Z. (1997). Methods Enzymol. 276, 326±344.Giacovazzo, C. (1992). Editor. Fundamentals of Crystallography.
IUCr/Oxford Science Publications.Helliwell, J. R. (1992). Macromolecular Crystallography with
Synchrotron Radiation. Cambridge University Press.International Tables for X-ray Crystallography (1992). Vol. C, edited
by A. J. C. Wilson. Dordrecht: Kluwer Academic Publishers.Klinger, A. L. & Kretsinger, R. H. (1989). J. Appl. Cryst. 22, 287±293.Leslie, A. G. W. (1996). CCP4 Newslett. Protein Crystallogr. 32, 7±8.Ravelli, R. B. G., Sweet, R. M., Skinner, J. M., Duisenberg, A. J. M. &
Kroon, J. (1997). J. Appl. Cryst. 30, 551±554.Vickovic, I., Kalk, K. H., Drenth, J. & Dijkstra, B. W. (1994). J. Appl.
Cryst. 27, 791±793.
Acta Cryst. (1999). D55, 1703±1717 Dauter � Data-collection strategies 1717
research papers