Embed Size (px)
Citation preview
research papers
122 https://doi.org/10.1107/S2052520616019028 Acta Cryst. (2017). B73, 122–133
Received 29 April 2016
Accepted 28 November 2016
Edited by P. Bordet, Institut Neel, France
Keywords: polytypism; polymorphism; phase
transitions; lithium ammonium sulfate.
CCDC references: 1519626; 1530426
Supporting information: this article has
supporting information at journals.iucr.org/b
Structures and thermal stability of the a-LiNH4SO4
polytypes doped with Er3+ and Yb3+
N. P. Sabalisck,a* C. Guzman-Afonso,a C. Gonzalez-Silgo,a M. E. Torres,a J.
Pasan,a,b J. del-Castillo,a D. Ramos-Hernandez,a A. Hernandez-Suareza and L.
Mestresc
aDepartamento de Fısica, Facultad de Ciencias, Seccion Fısica, Universidad de La Laguna, 38206 La Laguna, Tenerife,
Spain, bInstitut de Ciencia Molecular (ICMol), C/ Catedratico Jose Beltran 2, 46980 Paterna, Valencia, Spain, and cGrup
de Quımica de l’Estat Solid, Departament de Quımica Inorganica, Universitat de Barcelona, 08028 Barcelona, Spain.
*Correspondence e-mail: [email protected]
In order to clarify the polymorphism in the lithium sulfate family,
LiREx(NH4)1 � xSO4 (0.5 � x � 4.0 mol%, nominal value; RE = Er3+, Yb3+
and Dy3+) crystals were grown from aqueous solution by slow evaporation
between 298 and 313 K. The doping of the samples allowed us to obtain two
polymorphic forms, � and �, of LiNH4SO4 (LAS). By means of X-ray diffraction
(XRD) in single crystals, we determined the crystal structures of two new �-
polytypes, which we have named �1- and �2-LAS. They present the same space
group P21/c and the following relation among their lattice parameters: a2 = �c1,
b2 = �b1, c2 = �2a1 � c1. In order to evaluate the stability of the new �-
polytypes, we performed thermal analysis, X-ray diffraction and dielectric
spectroscopy on single crystals and polycrystalline samples over the cyclic
temperature range: 190 ! 575 ! 190 K. The results obtained by all the
techniques used in this study demonstrate that �-polytypes are stable across a
wide range of temperatures and they show an irreversible phase transition to the
paraelectric �-phase above 500 K. In addition, a comparative study of �- and �-
polytypes shows that both polymorphic structures have a common axis, with a
possible intergrowth that facilitates their coexistence and promotes the
reconstructive � ! � transition. This intergrowth was related to small
anomalies detected between 240 and 260 K, in crystals with an �-habit.
1. Introduction
In the last few years, considerable attention has been devoted
to the lithium sulfate family with the chemical formula
ALiSO4 (A = Li, Na, K, Rb, Cs, NH4 or Tl) and related
compounds. These materials present open lattices, which
provide them with a great flexibility that makes possible
thermal rearrangements of their LiO4 and SO4 tetrahedra,
involving phase transitions (Tomaszewski, 1992b; Połomska,
2001; Mata-Ramırez, 2002; Lim et al., 2013, and references
cited therein). This ability to generate polymorphism allows a
large number of different crystal structures to be obtained,
which display interesting nonlinear physical properties of
current interest such as ferroelectricity (Połomska et al., 2005;
Shamshin, 2010), ferroelasticity (Czaja, 2013; Lim & Kim,
2012) and second harmonic generation (Palmero et al., 2008;
Closser et al., 2013); as well as fast-ion conduction at higher
temperatures (Lv et al., 2015; Xiao et al., 2015). In the case of
the lithium ammonium sulfate (LAS), its varied poly-
morphism and its phase transition sequence (which depend on
the synthesis conditions, i.e. thermal treatment, doping of the
ammonium ion etc.), have been the subject of more than 200
articles in the last 50 years, which were not exempt from
ISSN 2052-5206
# 2017 International Union of Crystallography
controversy (for instance, see Solans et al., 1999; Tomaszewski,
2000). Still nowadays some phases are being revised and
referenced (Komornicka et al., 2014; Rudysh et al., 2015; Lim,
2016). Moreover, a variety of phases in this family is largely
influenced by the chemical pressure, which can be changed by
the replacement of cations and anions (Połomska, 2001; Lim et
al., 2013; Czaja, 2013; Rousse & Tarascon, 2014).
The three polymorphic phases and thermal stability of �-
LiNH4SO4 (�-LAS) have been described as: ferroelectric �-
LAS, from 285 to 460 K (P21cn space group; Połomska, 2001).
Above 460 K the corresponding ferroelectric–paraelectric
transition to a crystal structure with the space group Pmcn
takes place (Itoh et al., 1981). Below 285 K, it undergoes a
ferroelectric–ferroelastic phase transition with a final mono-
clinic phase (P21=c; Mashiyama & Kasano, 1993). Very
recently, this non-polar and ferroelastic phase has been iden-
tified as a ferroaxial crystal structure (Hlinka et al., 2016).
There is also the so-called �-LiNH4SO4 (�-LAS) or �-modi-
fication. It has been described as an orthorhombic structure
with the space group Pbc21 and the following lattice para-
meters: a = 4.991, b = 10.196 and c = 17.010 A (Z = 8;
Pietraszko & Lukaszewicz, 1992; Tomaszewski, 1992a). The �-
modification presents a complex correlated structural disorder
that can be represented by, at least, three different polytypes
and whose lattice parameters c follow the conditions: c1 ¼ c,
c2 ¼ 2c and c3 ¼ 3c (Tomaszewski, 1992a). Recently, Komor-
nicka et al. (2014) have studied the polytypism in �-LAS. They
have simulated the X-ray diffuse scattering by the Monte
Carlo technique, using a two-spin like Ising model of disorder.
This model incorporates correlations into the �-polytypism,
described as a ‘domainized’ sequence of layers.
Several authors have studied the growth conditions, thermal
stability and phase transitions of both modifications: �- and �-
LAS. The crystallization above and at room temperature
favors the ferroelectric �-phase, whereas the �-polytype is
obtained below room temperature (Solans et al., 1999;
Połomska, 2001; Mel’nikova et al., 2003). According to the
literature, the �-LAS modification has an unstable structure
and undergoes a reversible phase transition to �-LAS at 250 K
and a non-reversible phase transition to the ferroelectric
phase of �-LAS, at � 350 K (Połomska, 2001). Another study
of crystal growth conditions of �- and �-LAS performed by
Mel’nikova et al. (2003) showed that there are two tempera-
ture intervals where the crystal may experience a recon-
structive �! � phase transition. In the first temperature
interval (340–350 K) a reconstructive phase transition causes
the fast destruction of the sample. In the second temperature
interval (440–450 K) the crystal structure undergoes a slow
transformation (recrystallization) without significant distor-
tions. Using XRD, Komornicka et al. (2014) confirmed the
reconstructive and irreversible � ! � phase transition
between 431 and 457 K.
In this work we present two new crystal structures of Yb3+-
doped LiNH4SO4, obtained from XRD of single crystals,
which are new polytypes of the �-LAS modification. In
addition, from DSC and dielectric spectroscopy of single
crystals and XRD of polycrystalline samples, we study the
thermal stability, the reconstructive � ! � phase transition
and the possible coexistence of both � and � polymorphs for
different Yb3+ and Er3+ doped samples with �modification. In
this study we try to clarify most of the controversy given in the
literature and to contribute to future research which correlate
physical properties with new structural distortions.
2. Experimental
2.1. Sample preparation and selection of crystals
Pure and doped LiNH4SO4 (LAS) crystals, with different
concentrations of Er3+, Yb3+ and Dy3+, were grown at 298, 308
and 313 K from aqueous solutions by slow evaporation (see
Table 1). Pure LAS was obtained at equimolar quantities of
Li2SO4 and (NH4)2SO4; whereas for the doped compounds,
the molar ratio was 1:1:x, where x is the concentration of the
corresponding rare earth sulfate [RE2(SO4)3]. All reagents
had a purity grade of 99.99%. At least four syntheses were
performed for each temperature and concentration, for all
compounds studied.
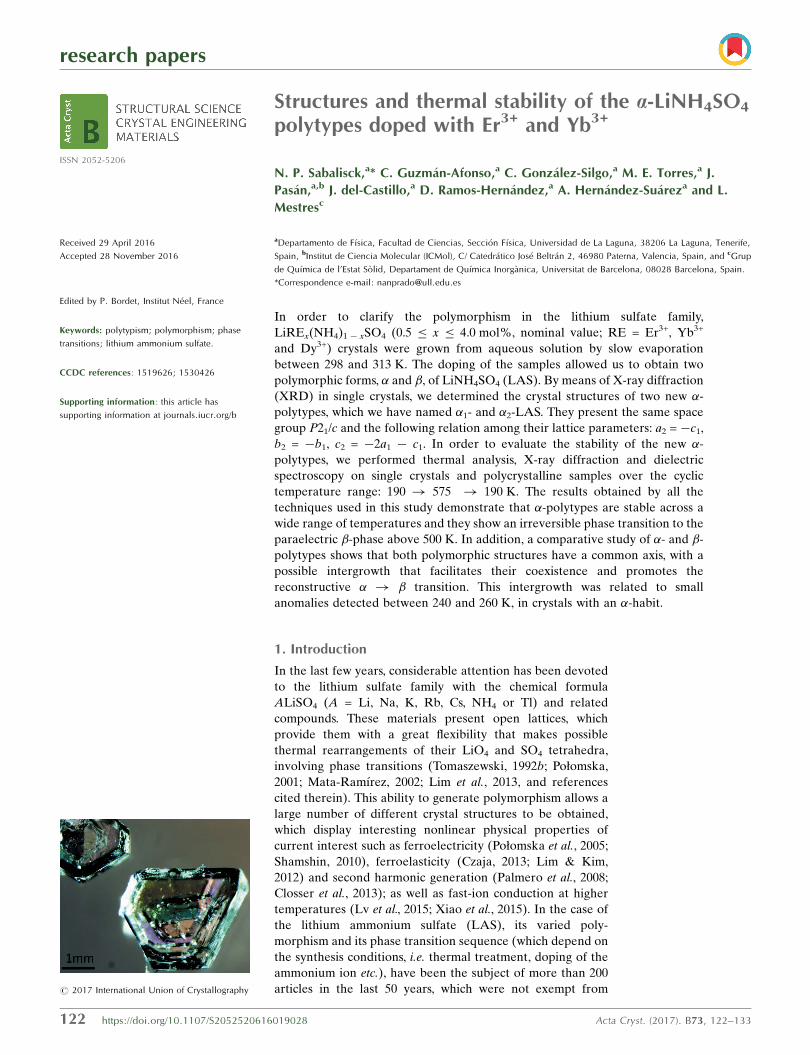
Although �-LAS usually crystallizes below 293 K and �-
LAS grows above this temperature (Mel’nikova et al., 2003),
by visual and microscopic analysis, a marked difference was
observed in the crystalline habits of obtained single crystals
under our conditions. According to Mel’nikova et al. (2003)
and Mata-Ramırez (2002), the samples with polyhedral and
cylindrical shapes were classified as �-habit (see Figs. 1a and
b). While the very thin (millimetric thickness), flat and
transparent layers, with rectangular or square shapes, of the
samples were classified as �-habit (Fig. 1c). After the classi-
fication of the crystals obtained from experiments, they were
counted and divided into two parts: one for the analysis of
single crystals and the other one to grind for the analysis of
polycrystalline samples.
research papers
Acta Cryst. (2017). B73, 122–133 N. P. Sabalisck et al. � Structure and thermal stability of polytypes 123
Table 1Concentrations of Er3+, Yb3+ and Dy3+ used to obtain doped LiNH4SO4
crystals.
Rare earth Nominal concentration (mol%)
Er3+ – 0.6 – 0.8 – 1.0 1.2 1.4 2.0 –Yb3+ 0.5 0.6 0.7 0.8 0.9 1.0 1.2 1.4 2.0 4.0Dy3+ – 0.6 – 0.8 – 1.0 1.2 – – –
Figure 1Samples of LiNH4SO4 with different crystalline habits: (a), (b) �-habit,and (c) �-habit for doped with Yb3+ crystal.
2.2. Thermal analysis
Differential scanning calorimeter (DSC) analysis was
performed in order to study the stability of all selected, doped
and pure, single crystals with different habits. DSC measure-
ments were carried out on a Perkin–Elmer differential scan-
ning calorimeter Pyris I-DSC, under nitrogen gas in a
sequential cycle: 298! 190! 575 !190 K, using a heating
and cooling rate of 10 K min�1.
2.3. X-ray diffraction
XRD data were obtained by using three different experi-
mental protocols. Two of them related to single crystals and
the third one for powder samples.
(i) Two single crystals of Yb-doped LAS with 2 and 4 mol%
(nominal concentrations), and �-habit were selected.
Diffraction data at 293 K were collected on a MARS345
automated diffractometer, with an image-plate detector and
using monochromatic Mo K� radiation by reflection from a
graphite crystal. The structures were solved by Patterson’s
method, using SHELXS (Sheldrick, 2015), and refined by full-
matrix least-squares using SHELXL (Sheldrick, 2015). For
details of the data collection and the
structure determination see Table 2
and the CIF files in the supporting
information.
(ii) On the other hand, single crys-
tals with an �-habit were measured
with the Agilent SuperNova diffract-
ometer, in order to study the thermal
dependence of their reciprocal space
images and lattice parameters at low
temperatures (from 200 to 295 K).
The CrysAlisPro computer software
(Agilent, 2014) was used during the
data analysis and also for diffract-
ometer control and data collection.
(iii) Powder diffraction measure-
ments were performed for all doped
and pure LAS samples, using a
PANalytical X’Pert Pro diffract-
ometer (Bragg–Brentano mode)
equipped with an X’Celerator
detector using Cu K�1 radiation. The
angular range 5 > 2� > 100� was
scanned at a step size of 0.02� and
200 s step time. Divergence and anti-
scatter slits were set at 1 and 0.5�,
respectively, and the detector was
used in a scanning mode with an
active length of 2.14�. A 0.02 rad
Soller slit was used in the diffraction
beam. Measurements at different
temperatures were carried out during
a cyclic process of heating and
cooling: 298! 548! 298 K using an
Anton Paar HTK–2000 chamber and under air atmosphere.
The heating and cooling rate was 10 K min�1 and the sample
kept at the selected temperature for 5 min to stabilize before
the scan. Whole pattern fits were performed using the FullProf
computer program (Rodrıguez-Carvajal, 1993). In addition, to
compare the obtained crystal structures, we performed a
symmetry-mode analysis of the more distorted structure with
respect to the more symmetric one, by using the AMPLI-
MODES program (Orobengoa et al., 2009), available on the
Bilbao Crystallographic Server (Aroyo et al., 2011).
2.4. Dielectric spectroscopy
Dielectric measurements (real "0r and imaginary "00r parts of
complex permittivity) were performed on single crystals, using
an HP 4192A impedance analyzer in the frequency range from
0.1 kHz to 1 MHz with an AC signal amplitude of 1 V. Three
single crystals were selected: one �-LAS with cylindrical shape
(height 2.0 mm and diameter 3.0 mm) was cut with the c-axis
(pseudo-hexagonal axis) parallel to the axis of the cylinder,
and two single crystals with thin plate shapes: one pure �-LAS
(obtained at room temperature), and one doped �-LAS Yb
1.4 mol%. After, the plane parallel faces for all crystal samples
research papers
124 N. P. Sabalisck et al. � Structure and thermal stability of polytypes Acta Cryst. (2017). B73, 122–133
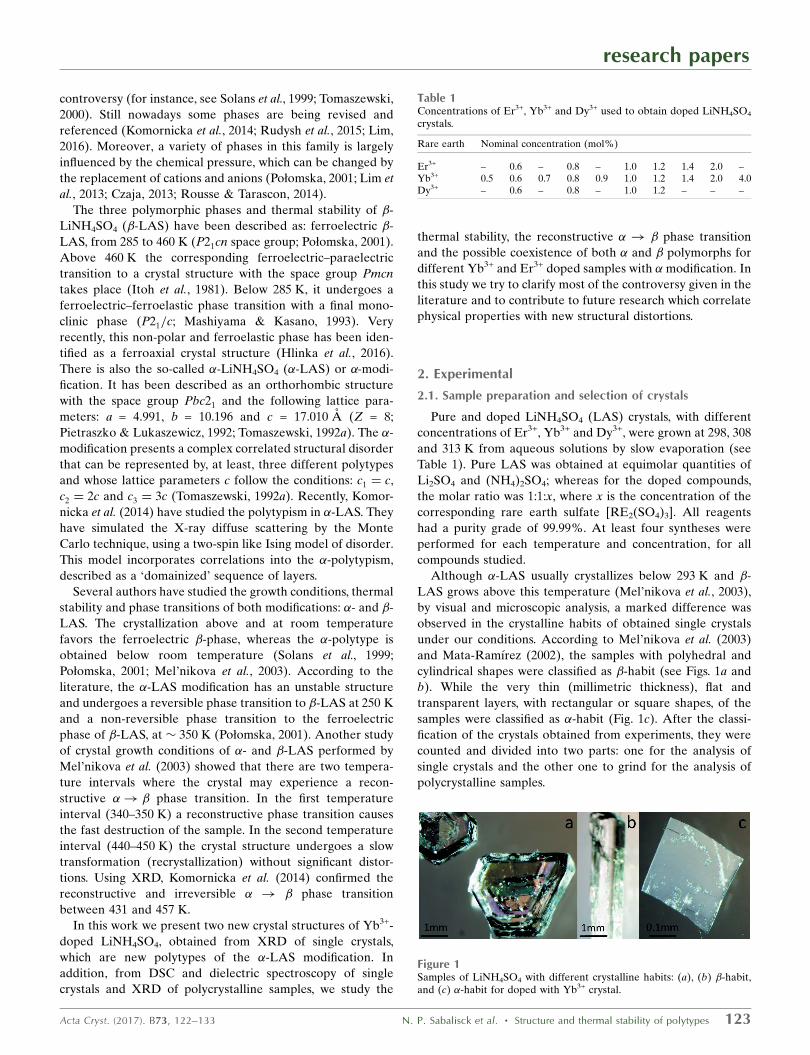
Table 2Single crystal and refinement data for the �1-LAS and �2-LAS polytypes.
Identification code �1-LAS Yb 2 mol% �2-LAS Yb 4 mol%
Crystal dataEmpirical formula H3.940LiN0.984O4SYb0.005 H3.843LiN0.961O4SYb0.013
Mr 121.54 122.51Crystal system, space group Monoclinic, P21=c Monoclinic, P21=cTemperature (K) 293 293Wavelength (A) 0.71073 0.71073a, b, c (A) 17.856 (8), 5.008 (3), 10.264 (13) 10.177 (15), 5.106 (4), 34.234 (16)� (�) 106.46 (5) 90.20 (10)V (A3) 880.2 (13) 1779 (3)Z 8 16F(000) 497 1000.0Dx (Mg m�3) 1.836 1.831Radiation type Mo K� Mo K�� (mm�1) 0.73 0.89Crystal size (mm3) 0.18 � 0.14 � 0.09 0.17 � 0.11 � 0.09
Data collectionDiffractometer Enraf–Nonius CAD4 Enraf–Nonius CAD4Absorption correction – –No. of measured, independent and
observed [I > 2�(I)] reflections4811, 2549, 2020 9573, 5071, 3231
Rint 0.0905 0.068(sin �/�)max (A�1) 0.705 0.704Range of h, k, l h = �25! 0, k = �7! 7, l = �13
! 14h =�14! 14, k =�7! 7, l =�48! 0
Completeness to � (%) 99.90 (� = 25.242�) 100 (� = 25.242�)
RefinementRefinement method Full-matrix least-squares on F2 Full-matrix least-squares on F2
Final R indices [I > 2�(I)] R1 = 0.0535, wR2 = 0.1354 R1 = 0.0603, wR2 = 0.1333R indices (all data) R1 = 0.0671, wR2 = 0.1434 R1 = 0.1029, wR2 = 0.1632Goodness-of-fit on F2 1.173 1.197No. of reflections, restraints,
parameters2549, 74, 153 5071, 0, 256
��max, ��min (e A�3) 1.05, �0.68 1.89, �1.04
were coated with silver paste and then placed into the cell
(parallel plate capacitor). The measurements were recorded in
two different runs: (1) heating from 190 until 290 K, using a
homemade cryostat, and (2) above room temperature,
following the cycle: 298 ! 520 ! 298 K using a resistance
furnace, with a warming and cooling rate of 0.8 K min�1. In
both experiments, the temperature was monitored using a
thermocouple within an accuracy of approximately 0.1 K. In
order to gain a deeper knowledge of the dielectric behavior,
we performed a conductivity spectra analysis. It is based on
the Universal Dielectric Response (UDR; Jonscher (1977;
Ngai et al., 1979; Dissado & Hill, 1979). According to this
model, the real part of the conductivity spectra �0 tends
towards the DC conductivity (�dc) as the frequency ()
decreases and shows a dispersive regime where the conduc-
tivity strongly increases with the frequency. A slightly
different version of the more typical Jonscher equation is
given by Leon et al. (1997)
�0ðÞ ¼ �dc 1þ coss
2
� �
p
!s" #; ð1Þ
where s is a fractional exponent with values between 0 and 1,
depending on the many-body interactions among charge
carriers, and p is crossover frequency.
3. Results and discussion
3.1. Effect of the doping in the LAS single crystals
Taking into account the crystals identified as �- and �-
habits, obtained from each experiment, we found for pure
compounds at 298, 308 and 313 K only 5% of an �-habit.
However, by doping the compounds with rare earth ions (Er3+
and Yb3+), at the same evaporation temperatures, it was
possible to obtain a bigger proportion of crystals with the �-
habit; reaching a percentage of 15%. The crystals with better
quality were obtained for concentrations of Er3+ ions between
0.6 and 1.2 mol% and for concentrations of Yb3+ ions from
0.7 mol% thereafter. In the cases where we used Dy3+ as a
dopant, with the concentrations given in Table 1, we did not
obtain the �-habit. Therefore, as a first result, when we doped
the samples with the Er3+ and Yb3+ ions above and at room
temperature the �-habit is favored.
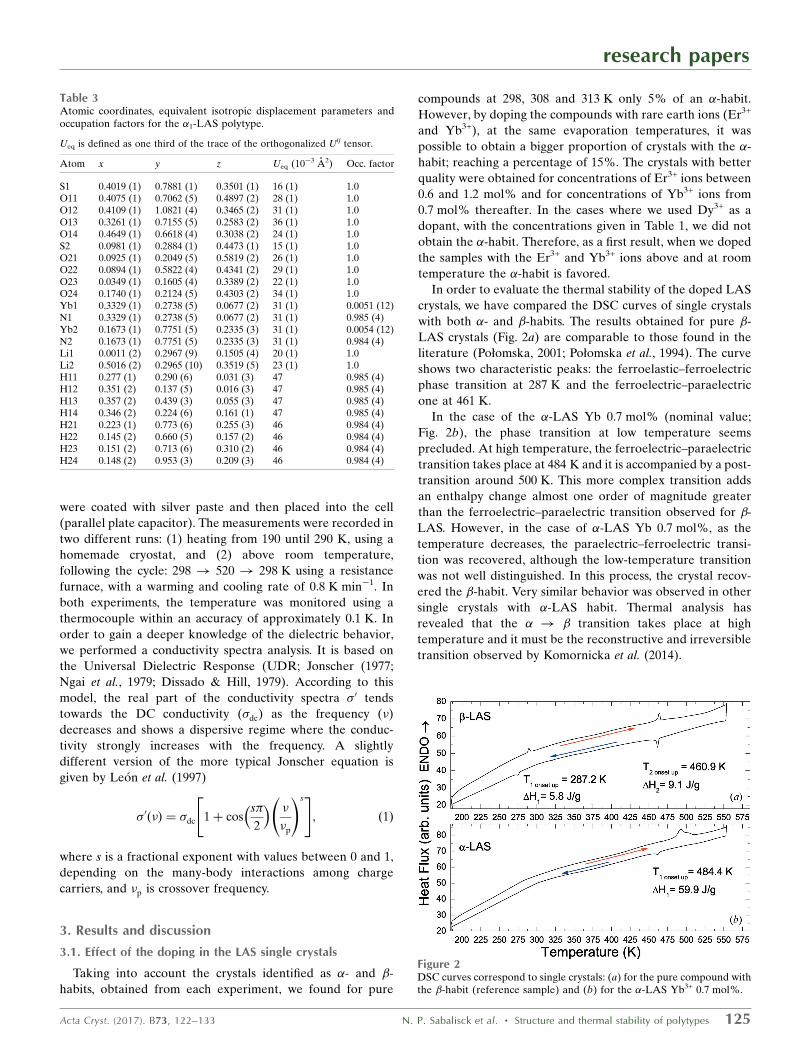
In order to evaluate the thermal stability of the doped LAS
crystals, we have compared the DSC curves of single crystals
with both �- and �-habits. The results obtained for pure �-
LAS crystals (Fig. 2a) are comparable to those found in the
literature (Połomska, 2001; Połomska et al., 1994). The curve
shows two characteristic peaks: the ferroelastic–ferroelectric
phase transition at 287 K and the ferroelectric–paraelectric
one at 461 K.
In the case of the �-LAS Yb 0.7 mol% (nominal value;
Fig. 2b), the phase transition at low temperature seems
precluded. At high temperature, the ferroelectric–paraelectric
transition takes place at 484 K and it is accompanied by a post-
transition around 500 K. This more complex transition adds
an enthalpy change almost one order of magnitude greater
than the ferroelectric–paraelectric transition observed for �-
LAS. However, in the case of �-LAS Yb 0.7 mol%, as the
temperature decreases, the paraelectric–ferroelectric transi-
tion was recovered, although the low-temperature transition
was not well distinguished. In this process, the crystal recov-
ered the �-habit. Very similar behavior was observed in other
single crystals with �-LAS habit. Thermal analysis has
revealed that the � ! � transition takes place at high
temperature and it must be the reconstructive and irreversible
transition observed by Komornicka et al. (2014).
research papers
Acta Cryst. (2017). B73, 122–133 N. P. Sabalisck et al. � Structure and thermal stability of polytypes 125
Figure 2DSC curves correspond to single crystals: (a) for the pure compound withthe �-habit (reference sample) and (b) for the �-LAS Yb3+ 0.7 mol%.
Table 3Atomic coordinates, equivalent isotropic displacement parameters andoccupation factors for the �1-LAS polytype.
Ueq is defined as one third of the trace of the orthogonalized Uij tensor.
Atom x y z Ueq (10�3 A2) Occ. factor
S1 0.4019 (1) 0.7881 (1) 0.3501 (1) 16 (1) 1.0O11 0.4075 (1) 0.7062 (5) 0.4897 (2) 28 (1) 1.0O12 0.4109 (1) 1.0821 (4) 0.3465 (2) 31 (1) 1.0O13 0.3261 (1) 0.7155 (5) 0.2583 (2) 36 (1) 1.0O14 0.4649 (1) 0.6618 (4) 0.3038 (2) 24 (1) 1.0S2 0.0981 (1) 0.2884 (1) 0.4473 (1) 15 (1) 1.0O21 0.0925 (1) 0.2049 (5) 0.5819 (2) 26 (1) 1.0O22 0.0894 (1) 0.5822 (4) 0.4341 (2) 29 (1) 1.0O23 0.0349 (1) 0.1605 (4) 0.3389 (2) 22 (1) 1.0O24 0.1740 (1) 0.2124 (5) 0.4303 (2) 34 (1) 1.0Yb1 0.3329 (1) 0.2738 (5) 0.0677 (2) 31 (1) 0.0051 (12)N1 0.3329 (1) 0.2738 (5) 0.0677 (2) 31 (1) 0.985 (4)Yb2 0.1673 (1) 0.7751 (5) 0.2335 (3) 31 (1) 0.0054 (12)N2 0.1673 (1) 0.7751 (5) 0.2335 (3) 31 (1) 0.984 (4)Li1 0.0011 (2) 0.2967 (9) 0.1505 (4) 20 (1) 1.0Li2 0.5016 (2) 0.2965 (10) 0.3519 (5) 23 (1) 1.0H11 0.277 (1) 0.290 (6) 0.031 (3) 47 0.985 (4)H12 0.351 (2) 0.137 (5) 0.016 (3) 47 0.985 (4)H13 0.357 (2) 0.439 (3) 0.055 (3) 47 0.985 (4)H14 0.346 (2) 0.224 (6) 0.161 (1) 47 0.985 (4)H21 0.223 (1) 0.773 (6) 0.255 (3) 46 0.984 (4)H22 0.145 (2) 0.660 (5) 0.157 (2) 46 0.984 (4)H23 0.151 (2) 0.713 (6) 0.310 (2) 46 0.984 (4)H24 0.148 (2) 0.953 (3) 0.209 (3) 46 0.984 (4)
3.2. Structural characterization of two new polytypes
Two different polytypes, with an �-habit, were solved in the
same space group P21=c for ytterbium-doped LAS crystals
with 2 and 4 mol% (nominal concentrations) and these phases
were named �1- and �2-LAS, respectively (see Table 2). The
atomic coordinates, equivalent thermal displacement and
occupation factor are shown in Tables 3 and 4; including the
atomic coordinates of the H atoms, which were calculated only
for �1-LAS. The bond lengths as well as the angles are given as
CIF files attached as supporting information. The refinement
of the ammonium sites indicates that NHþ4 and Yb3+ are
located at the same position, in agreement with the electron
density residuals found in the difference Fourier maps (see
Table 2). Note that the substitution of ammonium by ytter-
bium is not homogeneous and the experimental concentra-
tions, calculated from the occupation factors, are 0.5 and
1.3 mol% for the �1-LAS, and the �2-LAS, respectively. These
values are less than the nominal concentrations: 2 and
4 mol%.
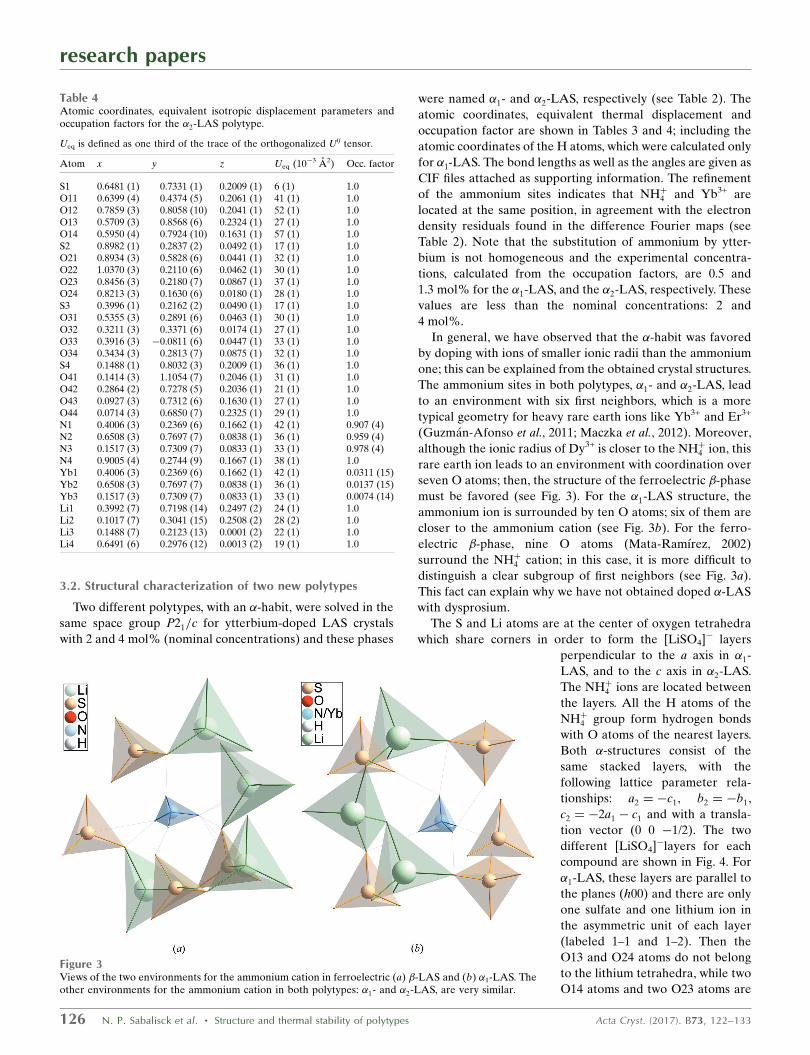
In general, we have observed that the �-habit was favored
by doping with ions of smaller ionic radii than the ammonium
one; this can be explained from the obtained crystal structures.
The ammonium sites in both polytypes, �1- and �2-LAS, lead
to an environment with six first neighbors, which is a more
typical geometry for heavy rare earth ions like Yb3+ and Er3+
(Guzman-Afonso et al., 2011; Maczka et al., 2012). Moreover,
although the ionic radius of Dy3+ is closer to the NHþ4 ion, this
rare earth ion leads to an environment with coordination over
seven O atoms; then, the structure of the ferroelectric �-phase
must be favored (see Fig. 3). For the �1-LAS structure, the
ammonium ion is surrounded by ten O atoms; six of them are
closer to the ammonium cation (see Fig. 3b). For the ferro-
electric �-phase, nine O atoms (Mata-Ramırez, 2002)
surround the NHþ4 cation; in this case, it is more difficult to
distinguish a clear subgroup of first neighbors (see Fig. 3a).
This fact can explain why we have not obtained doped �-LAS
with dysprosium.
The S and Li atoms are at the center of oxygen tetrahedra
which share corners in order to form the [LiSO4]� layers
perpendicular to the a axis in �1-
LAS, and to the c axis in �2-LAS.
The NHþ4 ions are located between
the layers. All the H atoms of the
NHþ4 group form hydrogen bonds
with O atoms of the nearest layers.
Both �-structures consist of the
same stacked layers, with the
following lattice parameter rela-
tionships: a2 ¼ �c1, b2 ¼ �b1,
c2 ¼ �2a1 � c1 and with a transla-
tion vector (0 0 �1/2). The two
different [LiSO4]�layers for each
compound are shown in Fig. 4. For
�1-LAS, these layers are parallel to
the planes (h00) and there are only
one sulfate and one lithium ion in
the asymmetric unit of each layer
(labeled 1–1 and 1–2). Then the
O13 and O24 atoms do not belong
to the lithium tetrahedra, while two
O14 atoms and two O23 atoms are
research papers
126 N. P. Sabalisck et al. � Structure and thermal stability of polytypes Acta Cryst. (2017). B73, 122–133
Table 4Atomic coordinates, equivalent isotropic displacement parameters andoccupation factors for the �2-LAS polytype.
Ueq is defined as one third of the trace of the orthogonalized Uij tensor.
Atom x y z Ueq (10�3 A2) Occ. factor
S1 0.6481 (1) 0.7331 (1) 0.2009 (1) 6 (1) 1.0O11 0.6399 (4) 0.4374 (5) 0.2061 (1) 41 (1) 1.0O12 0.7859 (3) 0.8058 (10) 0.2041 (1) 52 (1) 1.0O13 0.5709 (3) 0.8568 (6) 0.2324 (1) 27 (1) 1.0O14 0.5950 (4) 0.7924 (10) 0.1631 (1) 57 (1) 1.0S2 0.8982 (1) 0.2837 (2) 0.0492 (1) 17 (1) 1.0O21 0.8934 (3) 0.5828 (6) 0.0441 (1) 32 (1) 1.0O22 1.0370 (3) 0.2110 (6) 0.0462 (1) 30 (1) 1.0O23 0.8456 (3) 0.2180 (7) 0.0867 (1) 37 (1) 1.0O24 0.8213 (3) 0.1630 (6) 0.0180 (1) 28 (1) 1.0S3 0.3996 (1) 0.2162 (2) 0.0490 (1) 17 (1) 1.0O31 0.5355 (3) 0.2891 (6) 0.0463 (1) 30 (1) 1.0O32 0.3211 (3) 0.3371 (6) 0.0174 (1) 27 (1) 1.0O33 0.3916 (3) �0.0811 (6) 0.0447 (1) 33 (1) 1.0O34 0.3434 (3) 0.2813 (7) 0.0875 (1) 32 (1) 1.0S4 0.1488 (1) 0.8032 (3) 0.2009 (1) 36 (1) 1.0O41 0.1414 (3) 1.1054 (7) 0.2046 (1) 31 (1) 1.0O42 0.2864 (2) 0.7278 (5) 0.2036 (1) 21 (1) 1.0O43 0.0927 (3) 0.7312 (6) 0.1630 (1) 27 (1) 1.0O44 0.0714 (3) 0.6850 (7) 0.2325 (1) 29 (1) 1.0N1 0.4006 (3) 0.2369 (6) 0.1662 (1) 42 (1) 0.907 (4)N2 0.6508 (3) 0.7697 (7) 0.0838 (1) 36 (1) 0.959 (4)N3 0.1517 (3) 0.7309 (7) 0.0833 (1) 33 (1) 0.978 (4)N4 0.9005 (4) 0.2744 (9) 0.1667 (1) 38 (1) 1.0Yb1 0.4006 (3) 0.2369 (6) 0.1662 (1) 42 (1) 0.0311 (15)Yb2 0.6508 (3) 0.7697 (7) 0.0838 (1) 36 (1) 0.0137 (15)Yb3 0.1517 (3) 0.7309 (7) 0.0833 (1) 33 (1) 0.0074 (14)Li1 0.3992 (7) 0.7198 (14) 0.2497 (2) 24 (1) 1.0Li2 0.1017 (7) 0.3041 (15) 0.2508 (2) 28 (2) 1.0Li3 0.1488 (7) 0.2123 (13) 0.0001 (2) 22 (1) 1.0Li4 0.6491 (6) 0.2976 (12) 0.0013 (2) 19 (1) 1.0
Figure 3Views of the two environments for the ammonium cation in ferroelectric (a) �-LAS and (b) �1-LAS. Theother environments for the ammonium cation in both polytypes: �1- and �2-LAS, are very similar.
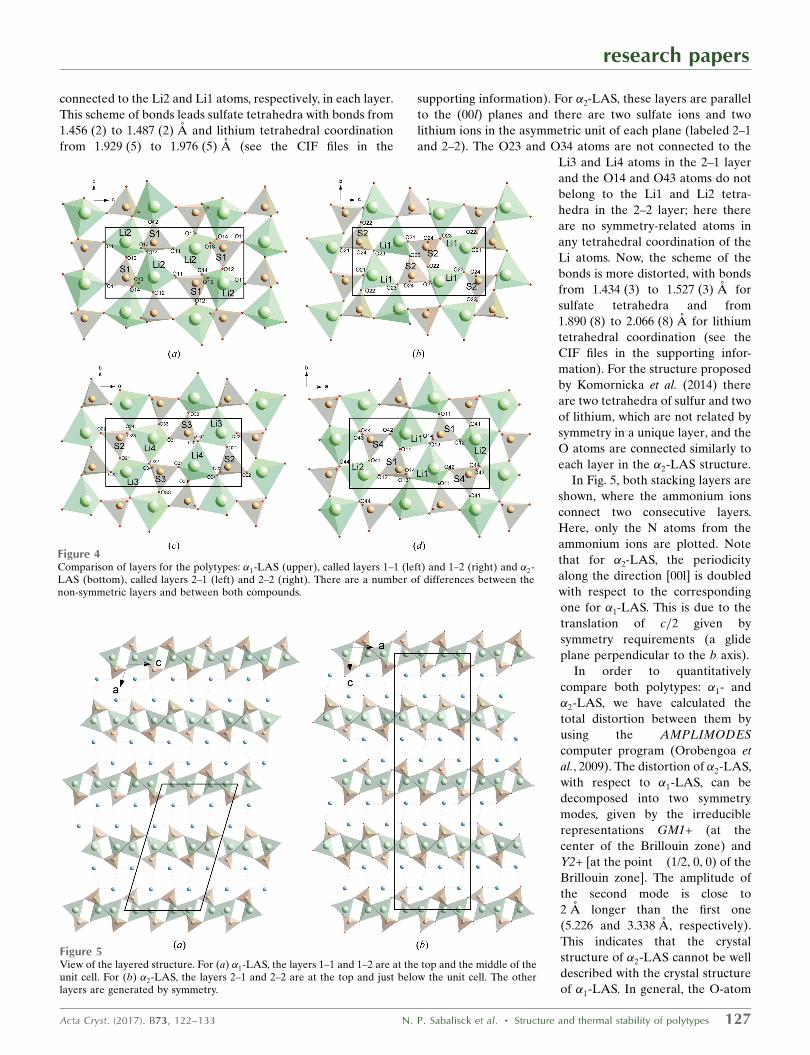
connected to the Li2 and Li1 atoms, respectively, in each layer.
This scheme of bonds leads sulfate tetrahedra with bonds from
1.456 (2) to 1.487 (2) A and lithium tetrahedral coordination
from 1.929 (5) to 1.976 (5) A (see the CIF files in the
supporting information). For �2-LAS, these layers are parallel
to the (00l) planes and there are two sulfate ions and two
lithium ions in the asymmetric unit of each plane (labeled 2–1
and 2–2). The O23 and O34 atoms are not connected to the
Li3 and Li4 atoms in the 2–1 layer
and the O14 and O43 atoms do not
belong to the Li1 and Li2 tetra-
hedra in the 2–2 layer; here there
are no symmetry-related atoms in
any tetrahedral coordination of the
Li atoms. Now, the scheme of the
bonds is more distorted, with bonds
from 1.434 (3) to 1.527 (3) A for
sulfate tetrahedra and from
1.890 (8) to 2.066 (8) A for lithium
tetrahedral coordination (see the
CIF files in the supporting infor-
mation). For the structure proposed
by Komornicka et al. (2014) there
are two tetrahedra of sulfur and two
of lithium, which are not related by
symmetry in a unique layer, and the
O atoms are connected similarly to
each layer in the �2-LAS structure.
In Fig. 5, both stacking layers are
shown, where the ammonium ions
connect two consecutive layers.
Here, only the N atoms from the
ammonium ions are plotted. Note
that for �2-LAS, the periodicity
along the direction [00l] is doubled
with respect to the corresponding
one for �1-LAS. This is due to the
translation of c=2 given by
symmetry requirements (a glide
plane perpendicular to the b axis).
In order to quantitatively
compare both polytypes: �1- and
�2-LAS, we have calculated the
total distortion between them by
using the AMPLIMODES
computer program (Orobengoa et
al., 2009). The distortion of �2-LAS,
with respect to �1-LAS, can be
decomposed into two symmetry
modes, given by the irreducible
representations GM1+ (at the
center of the Brillouin zone) and
Y2+ [at the point �(1/2, 0, 0) of the
Brillouin zone]. The amplitude of
the second mode is close to
2 A longer than the first one
(5.226 and 3.338 A, respectively).
This indicates that the crystal
structure of �2-LAS cannot be well
described with the crystal structure
of �1-LAS. In general, the O-atom
research papers
Acta Cryst. (2017). B73, 122–133 N. P. Sabalisck et al. � Structure and thermal stability of polytypes 127
Figure 4Comparison of layers for the polytypes: �1-LAS (upper), called layers 1–1 (left) and 1–2 (right) and �2-LAS (bottom), called layers 2–1 (left) and 2–2 (right). There are a number of differences between thenon-symmetric layers and between both compounds.
Figure 5View of the layered structure. For (a) �1-LAS, the layers 1–1 and 1–2 are at the top and the middle of theunit cell. For (b) �2-LAS, the layers 2–1 and 2–2 are at the top and just below the unit cell. The otherlayers are generated by symmetry.
displacements are larger than those of the S, Li and N atoms
and their contributions to the distortion are more important.
The obtained layered structures are consistent with other �-
LAS polytypes and LiNH4SeO4 (LASe) found in the litera-
ture (Pietraszko & Lukaszewicz, 1992; Waskowska &
Allmann, 1982; Tomaszewski, 1992a) which were described in
the orthorhombic space group Pbn21. Very recently, Komor-
nicka et al. (2014) modeled possible structures for LiNH4SO4
leading the formation of different polytypes. They combine a
different sequence of layers of A and B types, where each
layer is composed of stripes (S+/S-) oriented in ferroelectric or
antiferroelectric (AF) order. In particular, they determined a
crystal structure in the space group Pca21 with a = 10.195 (2),
b = 4.9967 (10) and c = 17.127 (3) A, with layers containing AF
domains. The A and B stacked layers are symmetrically
related. None of our two structures are completely described
with the proposed model, as we can see in Figs. 4 and 5. The
�1-LAS polytype has two different layers in the unit cell
(layers 1–1 and 1–2) that are not related by symmetry.
However, the domains of AF type, in each layer, are related by
symmetry. The unit cell for the �2-LAS polytype is formed by
four layers related by symmetry in pairs (from the layers 2–1
and 2–2), but the domains of each layer are AF type and are
not related by symmetry.
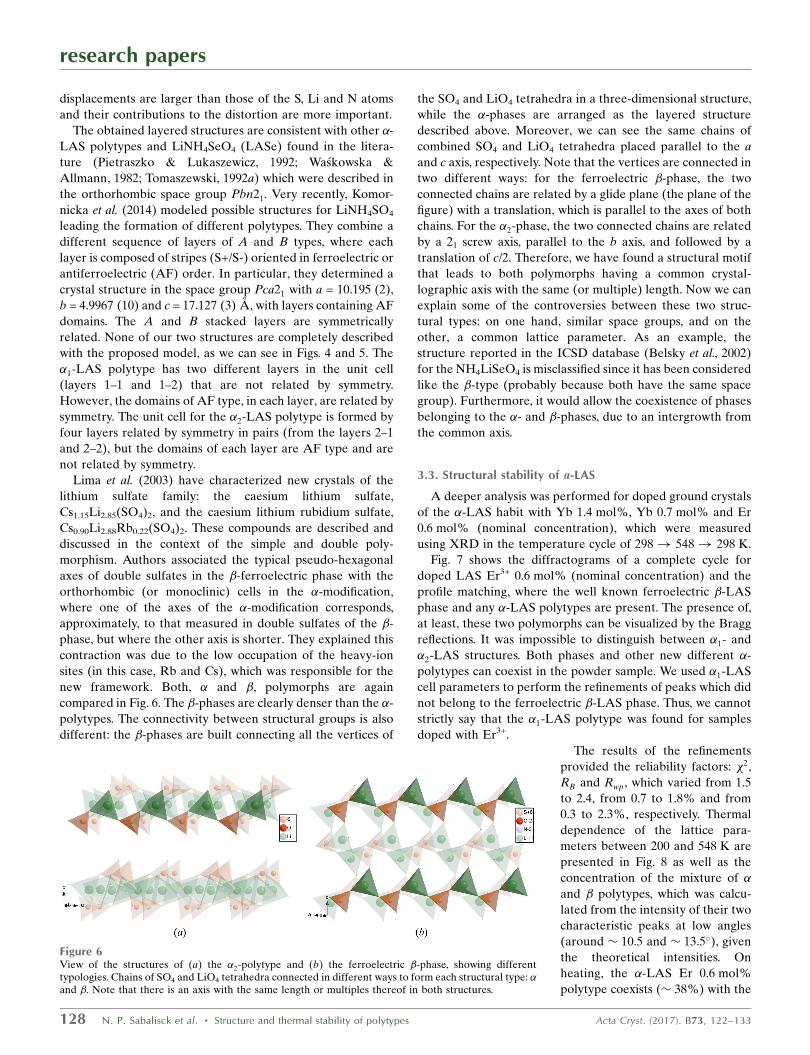
Lima et al. (2003) have characterized new crystals of the
lithium sulfate family: the caesium lithium sulfate,
Cs1.15Li2.85(SO4)2, and the caesium lithium rubidium sulfate,
Cs0.90Li2.88Rb0.22(SO4)2. These compounds are described and
discussed in the context of the simple and double poly-
morphism. Authors associated the typical pseudo-hexagonal
axes of double sulfates in the �-ferroelectric phase with the
orthorhombic (or monoclinic) cells in the �-modification,
where one of the axes of the �-modification corresponds,
approximately, to that measured in double sulfates of the �-
phase, but where the other axis is shorter. They explained this
contraction was due to the low occupation of the heavy-ion
sites (in this case, Rb and Cs), which was responsible for the
new framework. Both, � and �, polymorphs are again
compared in Fig. 6. The �-phases are clearly denser than the �-
polytypes. The connectivity between structural groups is also
different: the �-phases are built connecting all the vertices of
the SO4 and LiO4 tetrahedra in a three-dimensional structure,
while the �-phases are arranged as the layered structure
described above. Moreover, we can see the same chains of
combined SO4 and LiO4 tetrahedra placed parallel to the a
and c axis, respectively. Note that the vertices are connected in
two different ways: for the ferroelectric �-phase, the two
connected chains are related by a glide plane (the plane of the
figure) with a translation, which is parallel to the axes of both
chains. For the �2-phase, the two connected chains are related
by a 21 screw axis, parallel to the b axis, and followed by a
translation of c/2. Therefore, we have found a structural motif
that leads to both polymorphs having a common crystal-
lographic axis with the same (or multiple) length. Now we can
explain some of the controversies between these two struc-
tural types: on one hand, similar space groups, and on the
other, a common lattice parameter. As an example, the
structure reported in the ICSD database (Belsky et al., 2002)
for the NH4LiSeO4 is misclassified since it has been considered
like the �-type (probably because both have the same space
group). Furthermore, it would allow the coexistence of phases
belonging to the �- and �-phases, due to an intergrowth from
the common axis.
3.3. Structural stability of a-LAS
A deeper analysis was performed for doped ground crystals
of the �-LAS habit with Yb 1.4 mol%, Yb 0.7 mol% and Er
0.6 mol% (nominal concentration), which were measured
using XRD in the temperature cycle of 298! 548! 298 K.
Fig. 7 shows the diffractograms of a complete cycle for
doped LAS Er3+ 0.6 mol% (nominal concentration) and the
profile matching, where the well known ferroelectric �-LAS
phase and any �-LAS polytypes are present. The presence of,
at least, these two polymorphs can be visualized by the Bragg
reflections. It was impossible to distinguish between �1- and
�2-LAS structures. Both phases and other new different �-
polytypes can coexist in the powder sample. We used �1-LAS
cell parameters to perform the refinements of peaks which did
not belong to the ferroelectric �-LAS phase. Thus, we cannot
strictly say that the �1-LAS polytype was found for samples
doped with Er3+.
The results of the refinements
provided the reliability factors: �2,
RB and Rwp, which varied from 1.5
to 2.4, from 0.7 to 1.8% and from
0.3 to 2.3%, respectively. Thermal
dependence of the lattice para-
meters between 200 and 548 K are
presented in Fig. 8 as well as the
concentration of the mixture of �and � polytypes, which was calcu-
lated from the intensity of their two
characteristic peaks at low angles
(around � 10.5 and � 13.5�), given
the theoretical intensities. On
heating, the �-LAS Er 0.6 mol%
polytype coexists (� 38%) with the
research papers
128 N. P. Sabalisck et al. � Structure and thermal stability of polytypes Acta Cryst. (2017). B73, 122–133
Figure 6View of the structures of (a) the �2-polytype and (b) the ferroelectric �-phase, showing differenttypologies. Chains of SO4 and LiO4 tetrahedra connected in different ways to form each structural type: �and �. Note that there is an axis with the same length or multiples thereof in both structures.
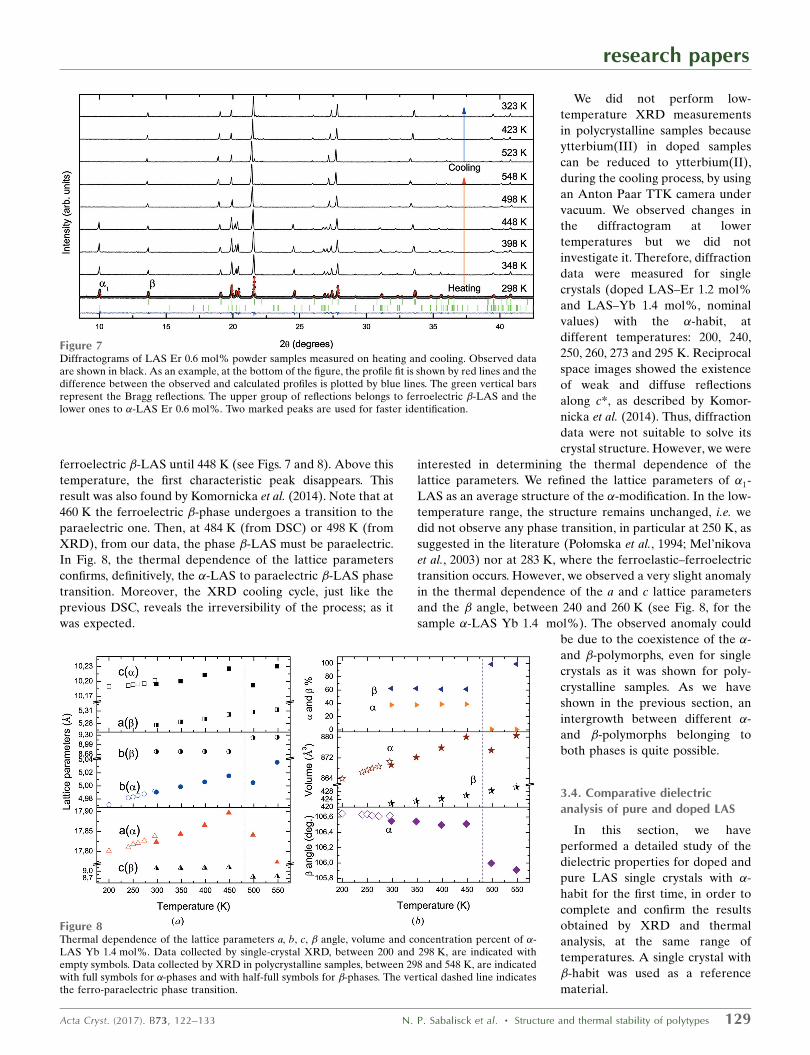
ferroelectric �-LAS until 448 K (see Figs. 7 and 8). Above this
temperature, the first characteristic peak disappears. This
result was also found by Komornicka et al. (2014). Note that at
460 K the ferroelectric �-phase undergoes a transition to the
paraelectric one. Then, at 484 K (from DSC) or 498 K (from
XRD), from our data, the phase �-LAS must be paraelectric.
In Fig. 8, the thermal dependence of the lattice parameters
confirms, definitively, the �-LAS to paraelectric �-LAS phase
transition. Moreover, the XRD cooling cycle, just like the
previous DSC, reveals the irreversibility of the process; as it
was expected.
We did not perform low-
temperature XRD measurements
in polycrystalline samples because
ytterbium(III) in doped samples
can be reduced to ytterbium(II),
during the cooling process, by using
an Anton Paar TTK camera under
vacuum. We observed changes in
the diffractogram at lower
temperatures but we did not
investigate it. Therefore, diffraction
data were measured for single
crystals (doped LAS–Er 1.2 mol%
and LAS–Yb 1.4 mol%, nominal
values) with the �-habit, at
different temperatures: 200, 240,
250, 260, 273 and 295 K. Reciprocal
space images showed the existence
of weak and diffuse reflections
along c*, as described by Komor-
nicka et al. (2014). Thus, diffraction
data were not suitable to solve its
crystal structure. However, we were
interested in determining the thermal dependence of the
lattice parameters. We refined the lattice parameters of �1-
LAS as an average structure of the �-modification. In the low-
temperature range, the structure remains unchanged, i.e. we
did not observe any phase transition, in particular at 250 K, as
suggested in the literature (Połomska et al., 1994; Mel’nikova
et al., 2003) nor at 283 K, where the ferroelastic–ferroelectric
transition occurs. However, we observed a very slight anomaly
in the thermal dependence of the a and c lattice parameters
and the � angle, between 240 and 260 K (see Fig. 8, for the
sample �-LAS Yb 1.4 mol%). The observed anomaly could
be due to the coexistence of the �-
and �-polymorphs, even for single
crystals as it was shown for poly-
crystalline samples. As we have
shown in the previous section, an
intergrowth between different �-
and �-polymorphs belonging to
both phases is quite possible.
3.4. Comparative dielectricanalysis of pure and doped LAS
In this section, we have
performed a detailed study of the
dielectric properties for doped and
pure LAS single crystals with �-
habit for the first time, in order to
complete and confirm the results
obtained by XRD and thermal
analysis, at the same range of
temperatures. A single crystal with
�-habit was used as a reference
material.
research papers
Acta Cryst. (2017). B73, 122–133 N. P. Sabalisck et al. � Structure and thermal stability of polytypes 129
Figure 8Thermal dependence of the lattice parameters a, b, c, � angle, volume and concentration percent of �-LAS Yb 1.4 mol%. Data collected by single-crystal XRD, between 200 and 298 K, are indicated withempty symbols. Data collected by XRD in polycrystalline samples, between 298 and 548 K, are indicatedwith full symbols for �-phases and with half-full symbols for �-phases. The vertical dashed line indicatesthe ferro-paraelectric phase transition.
Figure 7Diffractograms of LAS Er 0.6 mol% powder samples measured on heating and cooling. Observed dataare shown in black. As an example, at the bottom of the figure, the profile fit is shown by red lines and thedifference between the observed and calculated profiles is plotted by blue lines. The green vertical barsrepresent the Bragg reflections. The upper group of reflections belongs to ferroelectric �-LAS and thelower ones to �-LAS Er 0.6 mol%. Two marked peaks are used for faster identification.
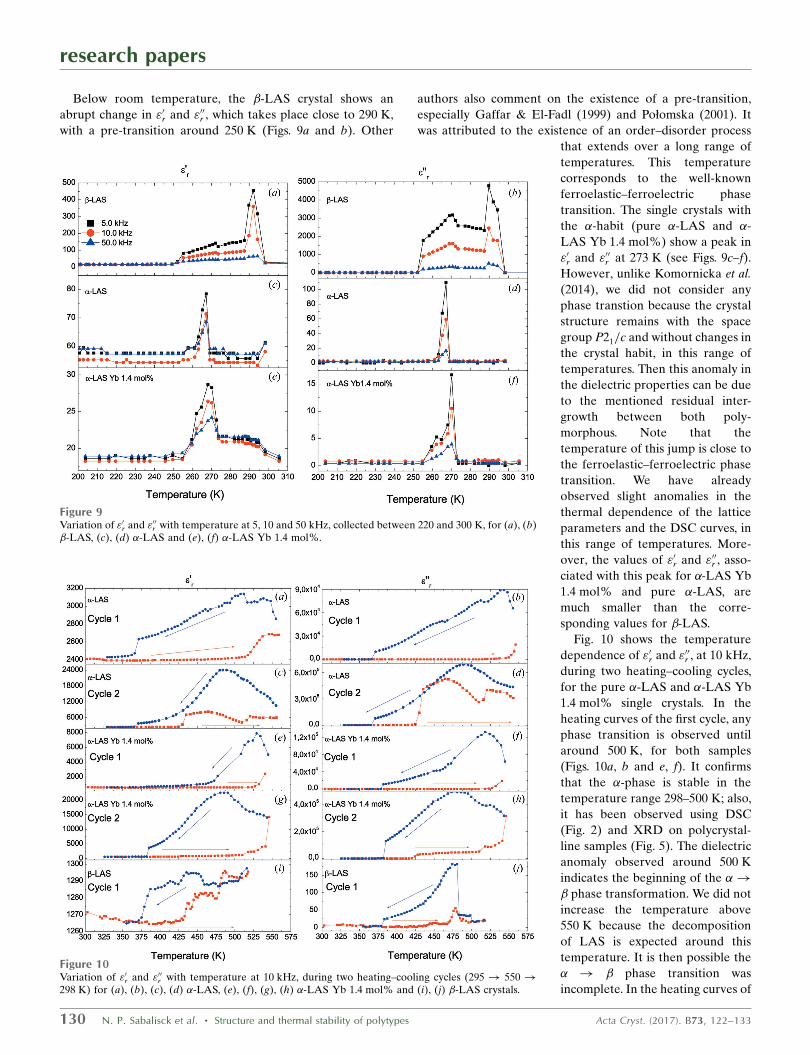
Below room temperature, the �-LAS crystal shows an
abrupt change in "0r and "00r , which takes place close to 290 K,
with a pre-transition around 250 K (Figs. 9a and b). Other
authors also comment on the existence of a pre-transition,
especially Gaffar & El-Fadl (1999) and Połomska (2001). It
was attributed to the existence of an order–disorder process
that extends over a long range of
temperatures. This temperature
corresponds to the well-known
ferroelastic–ferroelectric phase
transition. The single crystals with
the �-habit (pure �-LAS and �-
LAS Yb 1.4 mol%) show a peak in
"0r and "00r at 273 K (see Figs. 9c–f).
However, unlike Komornicka et al.
(2014), we did not consider any
phase transtion because the crystal
structure remains with the space
group P21=c and without changes in
the crystal habit, in this range of
temperatures. Then this anomaly in
the dielectric properties can be due
to the mentioned residual inter-
growth between both poly-
morphous. Note that the
temperature of this jump is close to
the ferroelastic–ferroelectric phase
transition. We have already
observed slight anomalies in the
thermal dependence of the lattice
parameters and the DSC curves, in
this range of temperatures. More-
over, the values of "0r and "00r , asso-
ciated with this peak for �-LAS Yb
1.4 mol% and pure �-LAS, are
much smaller than the corre-
sponding values for �-LAS.
Fig. 10 shows the temperature
dependence of "0r and "00r , at 10 kHz,
during two heating–cooling cycles,
for the pure �-LAS and �-LAS Yb
1.4 mol% single crystals. In the
heating curves of the first cycle, any
phase transition is observed until
around 500 K, for both samples
(Figs. 10a, b and e, f). It confirms
that the �-phase is stable in the
temperature range 298–500 K; also,
it has been observed using DSC
(Fig. 2) and XRD on polycrystal-
line samples (Fig. 5). The dielectric
anomaly observed around 500 K
indicates the beginning of the �!� phase transformation. We did not
increase the temperature above
550 K because the decomposition
of LAS is expected around this
temperature. It is then possible the
� ! � phase transition was
incomplete. In the heating curves of
research papers
130 N. P. Sabalisck et al. � Structure and thermal stability of polytypes Acta Cryst. (2017). B73, 122–133
Figure 10Variation of "0r and "00r with temperature at 10 kHz, during two heating–cooling cycles (295 ! 550 !298 K) for (a), (b), (c), (d) �-LAS, (e), (f), (g), (h) �-LAS Yb 1.4 mol% and (i), (j) �-LAS crystals.
Figure 9Variation of "0r and "00r with temperature at 5, 10 and 50 kHz, collected between 220 and 300 K, for (a), (b)�-LAS, (c), (d) �-LAS and (e), (f) �-LAS Yb 1.4 mol%.
the second cycle (Figs. 10c, d and g, h), a similar behavior to
that performed by the �-LAS crystal (reference sample, in
Figs. 10i, j) can be seen, although it is much smoother. This
dielectric behavior corresponds to the new �-phases trans-
formed from pure �-LAS and �-LAS Yb 1.4 mol% ones,
respectively. It is important to note that the reorder process
occurs, in the first cooling (cycle 1), until 382 K, where a
possible new phase transition is observed. Solans et al. (1999)
found for the �-LAS a transformation, from the crystal
structure at 318 K to the structure at 383 K, which consists of a
rotation by 41� of the sulfate ions around an S—O bond. This
may be the reason for the decrease of almost two orders of
magnitude in the electrical conductivity between both
temperatures. Thus, this result cannot be explained by a
mixture of different components (�- and �-phases) as
Tomaszewski (2000) suggests; at this stage, �-LAS polymorphs
are precluded. At the end of the thermal experiment, all the
samples: pure �-LAS and doped �-LAS with Er 0.6 mol%, Yb
0.7 mol% and Yb 1.4 mol% showed similar behavior and they
were twinned crystals with the �-habit.
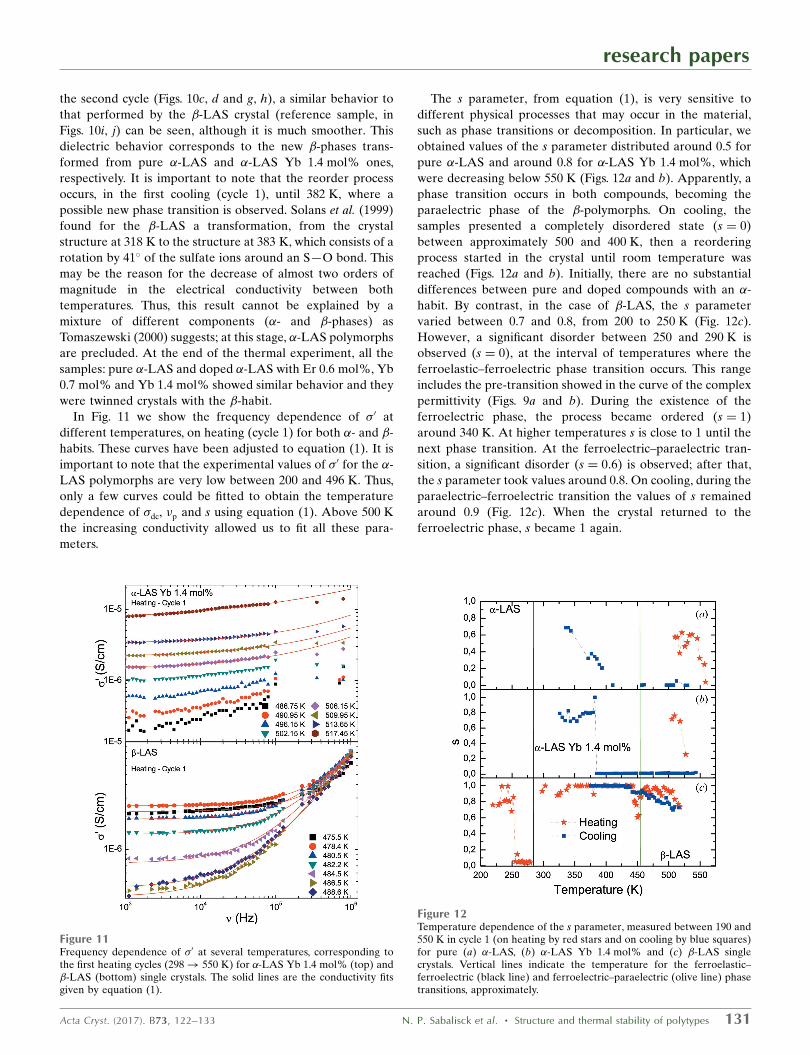
In Fig. 11 we show the frequency dependence of �0 at
different temperatures, on heating (cycle 1) for both �- and �-
habits. These curves have been adjusted to equation (1). It is
important to note that the experimental values of �0 for the �-
LAS polymorphs are very low between 200 and 496 K. Thus,
only a few curves could be fitted to obtain the temperature
dependence of �dc, p and s using equation (1). Above 500 K
the increasing conductivity allowed us to fit all these para-
meters.
The s parameter, from equation (1), is very sensitive to
different physical processes that may occur in the material,
such as phase transitions or decomposition. In particular, we
obtained values of the s parameter distributed around 0.5 for
pure �-LAS and around 0.8 for �-LAS Yb 1.4 mol%, which
were decreasing below 550 K (Figs. 12a and b). Apparently, a
phase transition occurs in both compounds, becoming the
paraelectric phase of the �-polymorphs. On cooling, the
samples presented a completely disordered state (s ¼ 0)
between approximately 500 and 400 K, then a reordering
process started in the crystal until room temperature was
reached (Figs. 12a and b). Initially, there are no substantial
differences between pure and doped compounds with an �-
habit. By contrast, in the case of �-LAS, the s parameter
varied between 0.7 and 0.8, from 200 to 250 K (Fig. 12c).
However, a significant disorder between 250 and 290 K is
observed (s ¼ 0), at the interval of temperatures where the
ferroelastic–ferroelectric phase transition occurs. This range
includes the pre-transition showed in the curve of the complex
permittivity (Figs. 9a and b). During the existence of the
ferroelectric phase, the process became ordered (s ¼ 1)
around 340 K. At higher temperatures s is close to 1 until the
next phase transition. At the ferroelectric–paraelectric tran-
sition, a significant disorder (s ¼ 0:6) is observed; after that,
the s parameter took values around 0.8. On cooling, during the
paraelectric–ferroelectric transition the values of s remained
around 0.9 (Fig. 12c). When the crystal returned to the
ferroelectric phase, s became 1 again.
research papers
Acta Cryst. (2017). B73, 122–133 N. P. Sabalisck et al. � Structure and thermal stability of polytypes 131
Figure 11Frequency dependence of �0 at several temperatures, corresponding tothe first heating cycles (298! 550 K) for �-LAS Yb 1.4 mol% (top) and�-LAS (bottom) single crystals. The solid lines are the conductivity fitsgiven by equation (1).
Figure 12Temperature dependence of the s parameter, measured between 190 and550 K in cycle 1 (on heating by red stars and on cooling by blue squares)for pure (a) �-LAS, (b) �-LAS Yb 1.4 mol% and (c) �-LAS singlecrystals. Vertical lines indicate the temperature for the ferroelastic–ferroelectric (black line) and ferroelectric–paraelectric (olive line) phasetransitions, approximately.
4. Conclusions
The synthesis of LAS doped with Er3+ and Yb3+ had led us to
obtain single crystals of the �-modification at temperatures
between 298 and 313 K, instead of the more favorable and
denser ferroelectric �-phase. When the ionic radius of the rare
earth decreases, the substitution of the ammonium ion favors
the more open layered structure. In particular, when Yb3+ is
partially substituted, two new crystal structures: �1- and �2-
LAS, have been determined by X-ray diffraction of single
crystals. Both structures belong to the space group P21=c and a
displacive distortion has been calculated between them. Our
two new structures show there are symmetry relations among
layers and domains belonging to each layer, which are not
completely described in the model proposed by Komornicka
et al. (2014).
Moreover, we perform a comparative study between the �1,
�2 polytypes of the �-type and the paraelectric and ferro-
electric phases of the �-type. Although there are no symmetry
operations relating them, we found a common structural motif
that results in one of the lattice parameters having the same
magnitude or a multiple thereof in both phases. The slight
anomaly in the thermal dependence of the lattice parameters
and the dielectric permittivity between 220 and 260 K in single
crystals can be related with an intergrowth from the common
axis between both phases.
The thermal dependence of diffractograms for polycrystal-
line samples and dielectric permittivity for single crystals,
including an analysis of the order–disorder parameter s,
reveals that the �-polytypes undergo an irreversible and
reconstructive phase transition around 500 K to the para-
electric �-phase. Doped samples of �-polytypes remain stable
between 200 and about 500 K.
Therefore, in this work, we have succeeded in clarifying
most of the controversy on the stability of the �-polytypes. We
have given information that helps explain the nature of the �-
polytypes (with two new structures) and the key for explaining
the reconstructive � ! � phase transition (through the
common structural motif between both structural modifica-
tions). The enriched diversity of LiO4 and SO4 tetrahedra-
based phases, built by chains, layers or three-dimensional
connections, can serve for studies of the macroscopic
symmetry lowering or/and changes in the [LiSO4]� framework
dimensionality and their current applications, for instance,
ferroic phases, nonlinear and transport properties (Hlinka et
al., 2016; Mishra et al., 2013).
Acknowledgements
With this work we want to pay tribute to our teacher,
colleague and friend Xavier Solans, who died in the course of
this research. We acknowledge the financial support of
Ministerio de Economıa y Competitividad (MAT2013-43319-
P) from Spain and Servicios Generales de Apoyo a la Inves-
tigacion (SEGAI) from Universidad de La Laguna (Spain).
The authors are very grateful to Dr Emilio Matesanz from
CAI Difraccion de Rayos X de la Universidad Complutense
de Madrid (Spain) and Dr Tomasz Breczewski from Depar-
tamento de Fısica Aplicada II de la Universidad del Paıs
Vasco (Spain) and Dr Juan Rodrıguez-Carvajal from Institut
Laue–Langevin (Grenoble, France) for their invaluable help.
References
Agilent (2014). CrysAlisPro. Agilent Technologies Ltd, Yarnton,Oxfordshire, England.
Aroyo, M. I., Perez-Mato, J. M., Orobengoa, D., Tasci, E., de la Flor,G. & Kirov, A. (2011). Chem. Commun. 43, 183–197.
Belsky, A., Hellenbrandt, M., Karen, V. L. & Luksch, P. (2002). ActaCryst. B58, 364–369.
Closser, R. G., Gualtieri, E. J., Newman, J. A. & Simpson, G. J. (2013).Mater. Sci. Eng. 46, 1903–1906.
Czaja, P. (2013). J. Therm. Anal. Calorim. 113, 91–95.Dissado, L. A. & Hill, R. M. (1979). Nature, 279, 685–689.Gaffar, M. A. & Abu El-Fadl, A. (1999). Physica B, 262, 159–169.Guzman-Afonso, C., Gonzalez-Silgo, C., Gonzalez-Platas, J., Torres,
M. E., Lozano-Gorrın, A. D., Sabalisck, N., Sanchez-Fajardo, V.,Campo, J. & Rodrıguez-Carvajal, J. (2011). J. Phys. Condens.Matter, 23, 325402.
Hlinka, J., Privratska, J., Ondrejkovic, P. & Janovec, V. (2016). Phys.Rev. Lett. 116, 177602.
Itoh, K., Ishikura, H. & Nakamura, E. (1981). Acta Cryst. B37, 664–666.
Jonscher, A. K. (1977). Nature, 267, 673–679.Komornicka, D., Wołcyrz, M. & Pietraszko, A. (2014). Cryst. Growth
Des. 14, 5784–5793.Leon, C., Lucıa, M. L. & Santamarıa, J. (1997). Phys. Rev. B, 55, 882–
887.Lim, A. R. (2016). Solid State Commun. 247, 23–26.Lima, R. J. C., Sasaki, J. M., Ayala, A. P., Freire, P. T. C., Mendes-
Filho, J., Melo, F. E. A., Ellena, J. & Santos Jr, S. (2003). Acta Cryst.C59, i67–i70.
Lim, A. R. & Kim, S. H. (2012). Solid State Ionics, 214, 19–24.Lv, W., Tong, Z., Yin, Y. M., Yin, J. & Ma, Z. (2015). Nano-Micro Lett.
7, 268–275.Maczka, M., Souza Filho, A. G., Paraguassu, W., Freire, P. T. C.,
Mendes Filho, J. & Hanuza, J. (2012). Prog. Mater. Sci. 57, 1335–1381.
Mashiyama, H. & Kasano, H. (1993). J. Phys. Soc. Jpn, 62, 155–162.Mata-Ramırez, J. O. (2002). PhD thesis. University of Barcelona,
Spain.Mel’nikova, S. V., Kartashev, A. V., Grankina, V. A. & Flerov, I. N.
(2003). Phys. Solid State, 45, 1572–1578.Mishra, A. K., Murli, C., Verma, A. K., Song, Y., Kumar, M. R. S. &
Sharma, S. M. (2013). J. Phys. Chem. A, 117, 5734–5741.Ngai, K. L., Jonscher, A. K. & White, C. T. (1979). Nature, 277, 185–
189.Orobengoa, D., Capillas, C., Aroyo, M. I. & Perez-Mato, J. M. (2009).
J. Appl. Cryst. 42, 820–833.Palmero, I. C., Gonzalez-Silgo, C., Torres, M. E., Marrero-Lopez, D.,
Rivera-Lopez, F., Haro-Gonzalez, P. & Solans, X. (2008). J. Lumin.128, 1025–1028.
Pietraszko, A. & Lukaszewicz, K. (1992). Pol. J. Chem. 66, 2057–2061.Połomska, M. (2001). Phase Transitions, 74, 409–468.Połomska, M., Hilczer, B. & Baran, J. (1994). J. Mol. Struct. 325, 105–
110.Połomska, M., Wolak, J. & Kirpichnikova, L. (2005). Mater. Sci. Eng.
B, 120, 76–83.Ran Lim, A., Hyoun Kim, H. & Lee, M. (2013). J. Solid State Chem.
199, 96–101.Rodrıguez-Carvajal, J. (1993). Physica B, 192, 55–69.Rousse, P. & Tarascon, J. M. (2014). Chem. Mater. 26, 394–406.Rudysh, M., Stadnyk, V., Brezvin, R. & Shchepanskii, P. (2015). Phys.
Solid State, 57, 53–58.Shamshin, A. P. (2010). Ferroelectrics, 397, 9–15.
research papers
132 N. P. Sabalisck et al. � Structure and thermal stability of polytypes Acta Cryst. (2017). B73, 122–133
Sheldrick, G. M. (2015). Acta Cryst. C71, 3–8.Solans, X., Mata, J., Calvet, M. T. & Font-Bardia, M. (1999). J. Phys.
Condens. Matter, 11, 8995–9007.Tomaszewski, P. E. (1992a). Solid State Commun. 81, 333–335.Tomaszewski, P. E. (1992b). Phase Transitions, 38, 127–220.
Tomaszewski, P. E. (2000). J. Phys. Condens. Matter, 12, 8933–8936.
Waskowska, A. & Allmann, R. (1982). Cryst. Struct. Commun. 11,2029–2034.
Xiao, R., Li, H. & Chen, L. (2015). J. Materiomics, 1, 325–332.
research papers
Acta Cryst. (2017). B73, 122–133 N. P. Sabalisck et al. � Structure and thermal stability of polytypes 133