Embed Size (px)
Citation preview

R E S E A R C H P R O G R A M S
MONTANA HIGHWAY RECONFIGURATION STUDY
Final Reportprepared forTHE STATE OF MONTANADEPARTMENT OF TRANSPORTATION
in cooperation withTHE U.S. DEPARTMENT OF TRANSPORTATIONFEDERAL HIGHWAY ADMINISTRATION
May 2005prepared byChristopher WornumDaniel HodgeCambridge Systematics, Inc.
FHWA/MT-05-003/8164

You are free to copy, distribute, display, and perform the work; make derivative works; make commercial use of the work under the condition that you give the original author and sponsor credit. For any reuse or distribution, you must make clear to others the license terms of this work. Any of these conditions can be waived if you get permission from the sponsor. Your fair use and other rights are in no way affected by the above.

final report
Montana Highway Reconfiguration Study
prepared for
Montana Department of Transportation
prepared by
Cambridge Systematics, Inc. 555 12th Street, Suite 1600 Oakland, California 94607
with
Economic Development Research Group ICF Consulting Short Elliott Hendrickson, Inc.
February 2005

ii
TECHNICAL REPORT DOCUMENTATION PAGE 1. Report No. FHWA/MT-05-003/8164
2. Government Accession No.
3. Recipient's Catalog No.
5. Report Date February, 2005
4. Title and Subtitle Montana Highway Reconfiguration Study
6. Performing Organization Code Cambridge Systematics, Inc.*
7. Author(s) Christopher Wornum, Daniel Hodge, Glen Weisbrod, Julie Colby, Teresa Lynch, Rod Payne, Mark Benson, Jeff Ang-Olson
8. Performing Organization Report No.
10. Work Unit No.
9. Performing Organization Name and Address Cambridge Systematics, Inc.* 555 12th Street, Suite 1600 Oakland, CA 94607
11. Contract or Grant No. 8164
13. Type of Report and Period Covered Final Report April 2002 to February 2005
12. Sponsoring Agency Name and Address Research Programs Montana Department of Transportation 2701 Prospect Avenue PO Box 201001 Helena MT 59620-1001
14. Sponsoring Agency Code 5401
15. Supplementary Notes Research performed in cooperation with the Montana Department of Transportation and the US Department of Transportation, Federal Highway Administration. This report can be found at http://www.mdt.mt.gov/research/reconfigstdy. 16. Abstract The 2001 Montana State legislature and Governor’s Office directed the Department (MDT) to conduct a study examining the economic impact of reconfiguring the State’s major two-lane highways. To achieve this overall goal, the Governor created the Reconfiguration Study Steering Committee (RSSC) to guide the Highway Reconfiguration Study. The RSSC developed a scope of work for a consultant team that called for the development of an analytical tool box that would give MDT the ability to evaluate the economic benefits and costs of highway investments anywhere in the State that could be expected to generate significant economic benefits for the State as a whole. The consultant team, led by Cambridge Systematics, Inc., evaluated all of the available tools used for state-of the-practice benefit/cost analysis of highway investments. Their findings led to their development of the Highway Economic Analysis Tool (HEAT). HEAT combines seven automated and linked modules into a software package that MDT will operate in-house. Once fully tested, HEAT will become a fourth performance measure for MDT’s Performance Programming Process (P3), which at present includes bridge preservation, pavement preservation, and congestion relief. *with Economic Development Research Group; ICF Consulting; and Short Eliot Hendrickson, Inc. 17. Key Words Economic Development, Commodity Flows, Travel Modeling, Benefit-Cost Analysis
18. Distribution Statement Unrestricted. This document is available through the National Technical Information Service, Springfield, VA 21161.
19. Security Classif. (of this report) Unclassified
20. Security Classif. (of this page) Unclassified
21. No. of Pages 326
22. Price

Montana Highway Reconfiguration Study Final Report
Cambridge Systematics, Inc. iii
Disclaimer Statement This document is disseminated under the sponsorship of the Montana Department of Transportation and the United States Department of Transportation in the interest of informa-tion exchange. The State of Montana and the United States Government assume no liability of its contents or use thereof.
The contents of this report reflect the views of the authors, who are responsible for the facts and accuracy of the data presented herein. The contents do not necessarily reflect the official poli-cies of the Montana Department of Transportation or the United States Department of Transportation.
The State of Montana and the United States Government do not endorse products of manufac-turers. Trademarks or manufacturers’ names appear herein only because they are considered essential to the object of this document.
This report does not constitute a standard, specification, or regulation.
Alternative Format Statement The Montana Department of Transportation (MDT) attempts to provide reasonable accommodations for any known disability that may interfere with a person participating in any service, program, or activity of the Department. Alternative accessible formats of this document will be provided upon request. For further information, call (406)444-7693 or TTY (406)444-7696.
Acknowledgements The consultant team wishes to acknowledge the hard work and dedication of many individuals and their organizations for their contribution to the Highway Reconfiguration Study.
The Study was directed by the Reconfiguration Study Steering Committee (RSSC), which was composed of 15 members from private business, local elected office, economic development agencies, and senior MDT officials.
1. Dan Rice, Transportation Commissioner, and Chairman of the RSSC;
2. Kent Coe, Vice President, Billings Chamber of Commerce;
3. Mark Cole, Dick Irvin, Inc.;
4. Robert Giordano, Missoula Institute for Sustainable Transportation;
5. Randall Gray, Mayor, City of Great Falls;
6. Duane Kurokawa, President, Great Northern Development Corporation;
7. Charity Watt Levis, Assistant Manager, Public Relations, AAA Mountain West;
8. Janice Brown, Division Administrator, Federal Highway Administration;
Montana Highway Reconfiguration Study Final Report
Cambridge Systematics, Inc. iv
9. Vern Petersen, Commissioner, Fergus County;
10. Michael Sanderson, Vice President, Engineering Inc.;
11. Keith Tokerud, Chairman of the Board, Great Falls Chamber of Commerce;
12. Joe Unterreiner, President, Kalispell Area Chamber of Commerce;
13. Dave Galt, Director, Montana Department of Transportation;
14. Mark Simonich, Director, Montana Department of Commerce; and
15. Dave Gibson, Chief Business Officer, Governor’s Office of Economic Opportunity.
The study was managed by Susan Sillick, Research Programs Manager, and Dick Turner, Multimodal Planning Bureau Chief. Other MDT staff with significant involvement includes Sandra Straehl, Administrator of the Rail, Transit, and Planning Division.
The consultant team conducted dozens of interviews with economic development officials, business owners, local and state elected officials, and other stakeholders. Due to informal nature of some of these communications (e.g., telephone conversations, e-mail exchanges, chance encounters at presentations, etc.), it is not possible to acknowledge all those who gave their insights and offered assistance over the course of the past two years. Nevertheless, the consultant team wishes to acknowledge the following people who took time to meet with them face-to-face:
1. Liz Harris, Flathead Economic Development Authority;
2. Joe Unterreiner, Kalispell Area Chamber of Commerce;
3. Carol Edgar, Flathead Visitors and Convention Bureau;
4. Dick King, Missoula Economic Development Corporation;
5. Alicia Bradshaw, Executive Director, Gallatin Development Corporation;
6. Desiree Salter, Administrative Assistant, Gallatin Development Corporation;
7. Linda Bech, Director of Business Outreach and Recruitment, Big Sky Economic Development Authority;
8. James (Jim) K. Klessens, RC&D Coordinator, Beartooth Resource Conservation & Development Area, Inc., Economic Development District;
9. Bernice Hash, Director of Business Development, Billings Area Chamber of Commerce;
10. Al Jones, Department of Commerce;
11. Bruce Wittenberg, President Sutton’s Sportswear;
12. Linda Twitchell, Great Northern Development Corporation, Wolf Point;
13. Paul Tuss, Executive Director, Bear Paw Development Corporation of Northern Montana;
14. Craig Erickson, Planner, Bear Paw Development Corporation of Northern Montana;
15. Tim Leeds, Havre Daily News;
16. John Kramer, President Great Falls Development Authority; and
17. Evan Barrett, Executive Director, Butte Local Development Corporation.
Montana Highway Reconfiguration Study Final Report
Cambridge Systematics, Inc. v 7170.003
Table of Contents
1.0 Introduction and Background..................................................................................... 1-1 1.1 Goals and Study Objectives .................................................................................. 1-1 1.2 Overview of Approach and Study Objectives ................................................... 1-3 1.3 Structure of This Report ........................................................................................ 1-11
2.0 Theory and Methodology ............................................................................................ 2-1 2.1 Overview of Theory Linking Highway Investments to Economic
Development........................................................................................................... 2-1 2.2 Alternative Methods .............................................................................................. 2-8 2.3 Preferred Method ................................................................................................... 2-10 2.4 Analytical Steps in HEAT ..................................................................................... 2-12 2.5 References................................................................................................................ 2-21
3.0 Data Sources and Software.......................................................................................... 3-1 3.1 Overview of Data Sources..................................................................................... 3-1 3.2 GIS Data Repository, Network Development, and GIS Tool
Development........................................................................................................... 3-1 3.3 Commodity Flow Data .......................................................................................... 3-17 3.4 Commodity Flow Forecast.................................................................................... 3-19 3.5 Industrial Profiles................................................................................................... 3-21 3.6 Reference ................................................................................................................. 3-36
4.0 Results ............................................................................................................................. 4-1 4.1 Overall Findings..................................................................................................... 4-1 4.2 Results from Scenario Testing .............................................................................. 4-3 4.3 Findings for Specific Roadway Improvements.................................................. 4-5
5.0 Implementation ............................................................................................................. 5-1 5.1 P3 and HEAT Integration ...................................................................................... 5-1 5.2 HEAT Software Installation and Training.......................................................... 5-7 5.3 HEAT Maintenance................................................................................................ 5-8 5.4 HEAT Upgrades ..................................................................................................... 5-10

Montana Highway Reconfiguration Study Final Report
Cambridge Systematics, Inc. vi 7170.003
Table of Contents (continued)
Appendix A1 Methods of Highway Project Impact Evaluation Literature Review...................... A1-1
Appendix A2 A Comparison of Commodity Flow Forecasting Techniques in Montana ............ A2-1
Appendix A3 Industrial Profiles ........................................................................................................... A3-1
Appendix A4 Business Attraction Model ............................................................................................ A4-1
Appendix A5 Cost Estimation Methodology ...................................................................................... A5-1
Appendix A6 Value of Time .................................................................................................................. A6-1
Appendix A7 Bibliography.................................................................................................................... A7-1

Montana Highway Reconfiguration Study Final Report
Cambridge Systematics, Inc. vii
List of Figures
1.1 Integrating Economic Policy to Transportation ....................................................... 1-4
1.2 Screening for Industries that Will Benefit from Improved Ground Transportation............................................................................................................... 1-6
1.3 Transportation and Other Conditions for Stimulation of Economic Growth...... 1-7
1.4 Basic Methodology for Estimating Economic Benefits of Transportation Investments.................................................................................................................... 1-8
1.5 Benefit/Cost Analysis of Highway Investments ..................................................... 1-10
2.1 HEAT Analytical Modules .......................................................................................... 2-12
2.2 Economic Impact Analysis System Elements ........................................................... 2-17
2.3 Business Attraction Methodology.............................................................................. 2-19
4.1 Existing and Improved Scenario for Highway U.S. 93............................................ 4-5
4.2 U.S. 93 Scenario – Improved Conditions (Benefits in Millions of Dollars by 2025).................................................................... 4-8
4.3 U.S. 2 Existing Conditions and Improvement Scenarios ........................................ 4-10
4.4 User Benefits for U.S. 2 Super 2 and Four-Lane Scenarios (Millions of 2000 Dollars)............................................................................................. 4-12
4.5 U.S. 2 Scenario – Improved Conditions (Benefits in Millions of Dollars by 2025).................................................................... 4-13
4.6 Existing and Improved Scenario for Highway MT 3............................................... 4-15
4.7 User Benefits for MT 3 Two and Four-Lane Scenarios (Millions of 2000 Dollars)............................................................................................. 4-17
4.8 MT 3 Scenarios – Improved Conditions (GRP Impacts in Millions of Dollars by 2025)........................................................... 4-18
4.9 Existing and Improved Scenario for S-323................................................................ 4-19

Montana Highway Reconfiguration Study Final Report
Cambridge Systematics, Inc. viii
List of Tables
2.1 Value of Time Delay in HEAT (2002 Dollars Per Hour) ......................................... 2-16
3.1 Speed Lookup Table (Miles Per Hour) ...................................................................... 3-7
3.2 Capacity (Vehicles Per Lane Per Hour) Lookup Table............................................ 3-7
3.3 Tons Per Truck by Commodity and Distance Range .............................................. 3-10
3.4 Speed Boundaries by Roadway Functional Class.................................................... 3-12
3.5 Speed Boundaries by Functional Class and Area Type .......................................... 3-13
3.6 Speed Boundaries by Functional Class and Terrain ................................................ 3-13
3.7 Speed Boundaries by Functional Class and Roadway Surface .............................. 3-14
3.8 Speed Boundaries by Functional Class and Number of Lanes .............................. 3-14
3.9 Speed Boundaries by Functional Class and Access Type (Divided vs. Undivided).............................................................................................. 3-15
3.10 Speed Boundaries by Functional Class and Two-Lane Configuration ................. 3-15
3.11 Calculation of Future Outbound Flows with Enhanced Forecast – Conceptual Example .................................................................................................... 3-20
3.12 Major Industry Groups in Montana........................................................................... 3-23

Montana Highway Reconfiguration Study Final Report
Cambridge Systematics, Inc. 1-1
1.0 Introduction and Background
1.1 Goals and Study Objectives
Montana’s residents, employers and a host of public and private-sector stakeholders regard transportation in general, and highways in particular, as a critical factor for the state’s current and future economic vitality. The Montana Department of the Transportation (MDT) initiated the Reconfiguration Study in response to this widespread interest in the economic benefits of improving Montana's highways and to comply with a resolution of the 2001 Montana Legislature that directed MDT to incorporate economic factors into its planning processes. The focus of highway improvement was placed on adding capacity to Montana’s two-lane state highways. In order to assure that the study addressed a wide diversity of interests beyond those most directly involved in maintaining and improving the state’s highways, MDT convened a steering committee that drew heavily from economic development agencies, chambers of commerce, local elected officials, and private businesses as well as state and federal agencies charged with the stewardship of the state’s highway infrastructure. The Reconfiguration Study Steering Committee (RSSC) was composed of the following 15 members:
1. Dan Rice, Transportation Commissioner, and Chairman of the RSSC;
2. Kent Coe, Vice President, Billings Chamber of Commerce;
3. Mark Cole, Dick Irvin, Inc.;
4. Robert Giordano, Missoula Institute for Sustainable Transportation;
5. Randall Gray, Mayor, City of Great Falls;
6. Duane Kurokawa, President, Great Northern Development Corporation;
7. Charity Watt Levis, Assistant Manager, Public Relations, AAA Mountain West;
8. Janice Brown, Division Administrator, Federal Highway Administration (FHWA);
9. Vern Petersen, Commissioner, Fergus County;
10. Michael Sanderson, Vice President, Engineering Inc.;
11. Keith Tokerud, Chairman of the Board, Great Falls Chamber of Commerce;
12. Joe Unterreiner, President, Kalispell Area Chamber of Commerce;
13. Dave Galt, Director, Montana Department of Transportation;
14. Mark Simonich, Director, Montana Department of Commerce; and
15. Dave Gibson, Chief Business Officer, Governor’s Office of Economic Opportunity.

Montana Highway Reconfiguration Study Final Report
Cambridge Systematics, Inc. 1-2
The RSSC was given ultimate responsibility for the direction of the Study and the results it would produce. Nevertheless, they also acted as spokespeople and conduits to a much larger group of stakeholders. Their geographical and professional diversity ensured that businesses, local officials, citizens and advocacy groups throughout the state would have opportunities to learn about the Study’s progress, interim findings, pose questions, and give feedback throughout the Study’s almost three-year duration.
The RSSC prepared a request for proposals (RFP) in 2001 and selected Cambridge Systematics, Inc. as its consultant in March of 2002. The RFP asked consultants to develop a software tool that would evaluate the economic benefits and costs of proposed highway projects and develop and analyze several scenarios for highway reconfiguration. The eco-nomic analysis tool would become part of MDT’s annual Performance Programming Process (P3) analysis of prospective projects for Transportation Commission consideration and inclusion in the Statewide Transportation Improvement Program (STIP). The inte-gration of the economic analysis tool into P3 would also comply with the direction of the House Joint Resolution 30 of the 2001 Legislature, which required MDT to consider eco-nomic criteria in its programming process. The STIP provides a detailed list of specific construction projects by phase to be undertaken in the next three years. Once fully tested, MDT will apply and refine policies to incorporate economic development criteria into the planning, funding apportionment, and project selection processes on an ongoing basis. The initial policies are described in Section 5.1.
The original goal of this study was to evaluate the impact of reconfiguring Montana’s two-lane highway network to a four-lane network on Montana’s economy. The RSSC devel-oped the following three objectives to achieve this goal:
1. Identify which transportation investments will benefit specific Montana industries;
2. Provide MDT with an analytical toolbox to evaluate economic development impacts of transportation improvements; and
3. Apply the analytical toolbox to quantify the economic impacts of transportation improvement scenarios as part of MDT’s planning process.
The toolbox developed to accomplish these objectives became known as the Highway Economic Analysis Tool (HEAT). HEAT also provides a much more detailed under-standing of the relationship between specific changes in highway capacity and economic development, provides data and models to quantify that relationship, and estimates the likely economic impacts of a range of highway improvements within both a constrained and unconstrained fiscal environment.
Finally, HEAT has more sophisticated methodology than used in existing benefit/cost tools. The existing software tools do not often quantify the effects of roadway improve-ments on business attraction. These benefits are often significant relative to the direct benefits to highway users in rural areas, where low existing and future traffic volumes produce modest aggregate benefits. HEAT includes a business attraction module and adds these benefits as inputs into the benefit-cost calculation (see Section 2.4, page 2-19).

Montana Highway Reconfiguration Study Final Report
Cambridge Systematics, Inc. 1-3
Ultimately, HEAT will provide MDT with an objective, efficient, and accurate way to quantify the potential economic benefits of roadway improvements.
1.2 Overview of Approach and Study Objectives
The specific result that the RSSC and MDT require of the new software is a consistent and rigorous comparison of a proposed transportation improvement to its estimated costs. In addition, the RSSC, MDT, and public and private stakeholders intend this project to address a variety of different goals and agendas. Throughout the study, MDT staff and consultants have conducted detailed discussions with advocates of specific roadway pro-jects, stakeholders from communities and industries across the State, and economic devel-opment officials from Montana’s diverse regions. Their expectations regarding the potential role highways can play in attracting new business and jobs vary widely. The overarching goal of the study was to ensure the results would be credible and useful to this diverse audience. Furthermore, MDT staff and consultants recognized the need to provide transparent analysis that would allow a stakeholder to follow the steps used to quantify the new jobs, higher incomes, and/or increased business output that a proposed transportation improvement may generate.
A significant concern that emerged during the study and the development of HEAT involved the economic benefits of preserving the existing roadway network. More spe-cifically, MDT would like to measure the tradeoff between investing in additional capacity and maintaining alternative levels of existing roadway conditions. Measuring this trade-off, however, requires a different type of economic analysis methodology than that needed to measure the tradeoff between alternative roadway capacity improvements. Thus, the application of HEAT will not address MDT’s allocation of limited funds between new capacity and preservation of the existing roadway network. Nevertheless, qualitative comparisons will provide some insights and analytical methods are available, should MDT want quantitative measurements at some later date.1
Fostering economic development with targeted transportation investments is not as sim-ple as some might believe. As the maturity of Montana’s transportation system grows, there are fewer opportunities to unleash significant economic development by widening roadways, expanding airports, or building new transit corridors. Furthermore, transpor-tation projects in and of themselves are almost never the sole impetus for economic devel-opment. Industrial location experts almost always cite quantity and quality of the labor force, quality of life, proximity to markets, and access to raw materials as the most critical determinants of a region’s attractiveness. These complicating factors, fewer opportunities, and the critical bundling of non-transportation improvements, create a complex process 1 The Highway Economic Recovery System (HERS) is widely regarded as the most capable tool
available for this purpose. HERS is maintained and continually updated by the Federal Highway Administration (FHWA).

Montana Highway Reconfiguration Study Final Report
Cambridge Systematics, Inc. 1-4
for transportation planners trying to respond to project stakeholders and advocates who may see transportation funding as one of the few remaining resources to further economic development.
Given this complexity, the Reconfiguration Study applied a comprehensive framework that was used to develop HEAT and ensuring that it can provide a comprehensive assessment of the role of transportation in economic development. This framework (pic-tured in Figure 1.1) recommends transportation policy-makers and planners think first about the structure of the economy for their region, then how their economy uses logistics to function. These logistics patterns exploit the transportation infrastructure, which results in the traffic flows observed on Montana’s highways. All four levels of this proc-ess are influenced by the transportation policies and the organization of the regulators, transportation planners, shippers/receivers/carriers, and business owners. The opportu-nities to use transportations polices in each level to improve economic growth is described below.
Figure 1.1 Integrating Economic Policy to Transportation
2040
Economic Structure Type of Industries, Number of Households
Industry Logistics PatternsSupply Chains, Distribution Networks
Traffic FlowsTrucks, Planes, Rail Cars
Org
aniz
atio
n an
d Pu
blic
Pol
icy
Ow
ners
hip,
Reg
ulat
ion,
Pri
cing2020
Present
Transportation InfrastructureHighways, Rail Lines, Ports, Access Roads
Source: Cambridge Systematics, Inc.
• Economic Structure – It is important to understand the key trade relationships between the region and its trading partners. This requires quantifying the roles of each major industry and assessing the local, national, and international economic fac-tors that will drive each industry’s demand for goods movement. In one of the first steps taken in this study, the consultant team worked with individual businesses, uni-versity faculty and researchers, regional economic development authorities, the Department of Commerce, and the Governor’s Office of Economic Opportunity to

Montana Highway Reconfiguration Study Final Report
Cambridge Systematics, Inc. 1-5
profile each major industry in Montana, including measurement of their performance compared to their regional, national, and global competition. These industry profiles provide trend analysis that helps to demonstrate how effective transportation invest-ments may be, given the overall health of each industry being targeted.
• Industry Logistics Patterns –Given the State’s economic structure and industry mix described above, HEAT applies goods movement data and forecasts of future goods movement to the transportation system. Specifically, HEAT assigns the movement of goods to the supply chains and distribution patterns for the key industries. These goods movement patterns assume some degree of consistency in the locations of dis-tribution centers, order rates and time sensitivity, transport/inventory cost tradeoffs, and key technology trends. Major changes in current logistical patterns would require revisions in the goods movement data and forecasts.
• Transportation Infrastructure – Montana’s current transportation infrastructure sup-ports the current logistics patterns of its industries. Some characteristics of these logistics patterns, however, are not affected by the quality or quantity of the transportation infrastructure. These include long distances to customers or suppliers (regardless of road width), empty back-hauls for a majority of trucking, lack of choice for Class 1 railroads, interstate regulations limiting truck sizes and weights, and other non-infrastructure constraints.2 When these characteristics constrain an industry’s competitiveness, improving the State’s goods movement infrastructure will not pro-vide significant benefits to a target industry. HEAT is sensitive to these constraints and will not produce economic benefits if the State’s transportation infrastructure is not a binding constraint.
• Traffic Flows – Finally, HEAT applies the observed and forecast commodity flows, traffic volumes, trip origins and destinations, congestion, accidents, etc. These flows may be obtained from HEAT; and their volumes, composition, and locations may be understood in a more informed and comprehensive context, given the three previous steps. This context provides stakeholders with a more comprehensive understanding for how traffic problems or roadway conditions may or may not affect economic development.
The vertical bar that straddles all four layers in Figure 1.1 represents MDT’s opportunity to solve problems that show up in each of these layers. The approach used in this study, therefore, began with a task to understand how much each industry (both those currently located in Montana and those targeted by economic development officials) depends on ground transportation. Of those industries that have such a dependence, the next task identified which ones need help and which of those would likely benefit from the pro-posed transportation investment. In addition, the industry profiles identify what other economic development efforts (i.e., collateral activities) must be included to assure that 2 The proposed widening of the Panama Canal, for example, could cause a significant shift from
grain moving west to Seattle to the Mississippi and Gulf ports, regardless of improvements to roadway, river, or rail access to Seattle.

Montana Highway Reconfiguration Study Final Report
Cambridge Systematics, Inc. 1-6
the proposed transportation investment achieves its intended benefit. This approach gives MDT a more selective role in an industry-based program, but avoids using trans-portation investment to solve non-transportation problems (Figure 1.2). This study gener-ated profiles of 13 key industries in Montana, which are included for reference within HEAT.
Figure 1.2 Screening for Industries that Will Benefit from Improved Ground Transportation
All Major & Emerging Montana Industries
Collateral Activities
Paired With Target
Industries
Targeted Transportation Investments
Loan Guarantees Job Training
Public Relations
Schools
Industrial RecruitmentHousing
Public Amenities
Research Funding
Air Service
Successful Industries With No Need of New Transportation
Industries Which Will Not
Benefit fromTransportation
Target Industries Paired With Transportation
Investments
Source: Cambridge Systematics, Inc.
This industry-based perspective bores into the mantra: build it and they will come. The approach used in this study first determines: who they are. It then evaluates the perform-ance of each industry likely to benefit from the investments, filtering out those that have little or no dependence on highway access to suppliers and customers or that are in steep decline for reasons beyond any need for improved transportation. The target industries that remain are goods movement-intensive industries that may perform better if they have better access to their customers and suppliers. Improved access consists of improvements to travel time; travel time reliability; likelihood of accidents; and operating costs related to roadway conditions (grade, pavement condition). A critical constraint to improving access for industries in Montana is their distance to markets (i.e., suppliers and custom-ers). Many of Montana business interviewed in this study acknowledged that even dramatic improvements to roadways would have very modest benefits, because they would still be faced with long distances, no matter how good the roads. The degree that transportation improvement will help, however, also depends on other economic condi-

Montana Highway Reconfiguration Study Final Report
Cambridge Systematics, Inc. 1-7
tions. Figure 1.3 presents the modest and highly interdependent role transportation plays in stimulating the growth of goods movement-intensive industries.
Figure 1.3 Transportation and Other Conditions for Stimulation of Economic Growth
Goods MovementDependent Industries
Goods MovementIntensive Industries
Supporting Industries
Economic Development
Programs• Business Attraction• Private Investment
• Job Training
OtherInfrastructure
• Water and Sewer• Education
• Power
Housing and Quality of Life
• Affordability• Crime
• Public Amenities
TransportationInfrastructure
• Transit• Freight
• Highways
Tax and Regulatory Environment
Labor Force• Wage Rates• Skill Level
•Activism
Suppliers
Collateral A
ctivities
CollateralActivities
Customers
Accessto:
Source: Cambridge Systematics, Inc.
Access to:
Accessto:
The left-hand diagram in Figure 1.3 is intended to portray the importance of the relation-ship between goods movement-intensive industries and their suppliers, customers, and supporting industries. This relationship dictates that industries select locations that opti-mize their access. As described above, Montana’s goods movement-intensive industries are often faced with long distances to customers, but regard their current location as opti-mal, given their location confers more important advantages and transportation is only one of many critical elements to their success. Thus, a comprehensive economic develop-ment strategy must include other elements:
• Labor force characteristics, such as the quantity and quality of available labor, wage rates, the mix of skilled labor, and the level of labor organization and activism.
• Economic development programs from state and regional economic development organizations (EDOs) or chambers of commerce include business attraction efforts, such as industrial and labor force recruitment (including recruitment of suppliers and supporting industries that would improve access and, thus, reduce shipping costs and improve reliability); job training programs, access to capital; and business develop-ment centers (assistance with marketing, business plans, etc.).

Montana Highway Reconfiguration Study Final Report
Cambridge Systematics, Inc. 1-8
• Quality of life and cost of living, including schools, housing, and recreation.
• Other infrastructure improvements, including water, sewer, telecommunications (band width), and power;
• Tax and regulatory environment, including the ease of building permits and the level of community involvement.
Composing an appropriate and realistic package of collateral activities to support eco-nomic development, however, goes beyond the knowledge and resources of MDT. All of the state agencies involved in economic development must work in concert with the local economic development authorities to identify the specific collateral activities needed to achieve economic progress.
HEAT is designed to estimate the full economic benefits of industries that will improve their performance because of a particular highway improvement project (Figure 1.4 shows the three basic components.).
Figure 1.4 Basic Methodology for Estimating Economic Benefits of Transportation Investments
Commodity Flows• Weight• Truck Trips• Origins-
Destinations• Type of Goods• Value of Goods
Industry Analysis• Employment• Growth trends• Transportation
Intensity• Other Collateral
Needs
Economic Benefit• Jobs• Income• Gross Regional
Product• Multiplier Effects
Project A
Project B
Project C
Project Z
Source: Cambridge Systematics, Inc.
More specifically, when a highway improvement is proposed, the economic evaluation tool must first identify which industries will be impacted, and the flows of freight and passenger traffic. This involves the following sequence of three analytical steps (within the Commodity Flow analysis):
1. Locate the improvement on an electronic network map of Montana roadways stored on a geographical information system (GIS). We have created an extensive GIS data-base and linked it to the Montana highway network and the relevant regions throughout North America.
2. Identify what commodities are being shipped and the passenger trips on the roadway proposed for improvement, and forecast the growth of these traffic flows. HEAT uses

Montana Highway Reconfiguration Study Final Report
Cambridge Systematics, Inc. 1-9
detailed county-level commodity flow data for Montana, and we developed com-modity flow forecasts within the tool.
3. Locate the origins and destinations of these freight and passenger trips and identify the industries that are involved in shipping and receiving.
The second component (Industry Analysis) takes a closer look at these industries: This second component involves the following three steps:
4. Identify 13 industry sectors in Montana that export their products and rely on surface transportation for significant amounts of their inputs and/or outputs. We have com-pleted focused profiles of each industry that summarizes their performance and dependence of various modes of freight transportation.
5. Identify new industry sectors and new businesses that are not present in Montana, but could be recruited if the conditions became attractive. We have relied on the knowledge of Montana’s economic development officials to inform a business attrac-tion model. This model is nested within the tool to quantify the potential for business expansion and attraction due to highway improvements, and also is capable of esti-mating the economic impacts from tourism (e.g., additional visitor days related to a highway improvement, creating additional spending in the economy).
6. Estimate each industry’s direct benefits, including travel time reductions, operating cost reductions, and safety benefits from the proposed transportation improvement (Step 3), based on its industry profile (Step 4) and the change in its shipping and receiving operations (Step 2).
The third component (Transportation Economic Benefit) involves estimating the job crea-tion, growth in personal income, and changes in regional output generated from com-pleting the project. This analysis component involves the following four steps:
7. Determine the health of the industry (Step 4) and its needs for other economic devel-opment assistance (i.e., collateral support). This assessment will determine if the businesses being helped are in industries that are declining or expanding. Thus, MDT has an indication of how effective the transportation investment may be, given the broader business climate.
8. Input each industry’s direct benefits (Step 6) plus the additional business location estimated with the business attraction model (Step 5) into a multi-regional REMI model. REMI is an economic model that will determine how direct improvements to travel efficiency and business/visitor attraction will ripple through the regional econ-omy to create jobs, increase personal income, and expand the region’s gross product. This result will provide MDT with an estimate of the full economic benefits associated with a highway improvement.
9. Estimate the capital, maintenance, and operating costs of each proposed project using a cost model, based on unit costs taken from similar projects recently completed in Montana.

Montana Highway Reconfiguration Study Final Report
Cambridge Systematics, Inc. 1-10
10. Compare discounted benefits with discounted costs, based on the construction sched-ule and 20 to 30 years of each project’s operation.
In summary, this approach provides a reasonably comprehensive methodology for evalu-ating highway improvements with a consistent set of assumptions. These steps have been bundled into HEAT, which allows MDT to conduct benefit/cost analysis on a routine basis. HEAT also provides analysts and stakeholders access to the underlying data and assumptions, which should help to explain the outcome and provide useful information independent of the economic findings (e.g., commodity flow data, including forecasts, traffic volumes, employment, output, income, etc.). Figure 1.5 presents these basic steps.
Figure 1.5 Benefit/Cost Analysis of Highway Investments
Direct BenefitsSpeedSpeedDistanceDistanceAccidentsAccidentsOperating CostsOperating CostsMaintenance CostsMaintenance Costs
TourismVisitor DaysVisitor DaysPassPass--by Spendingby Spending
Business Attraction
Access to:Access to:CustomersCustomersSuppliersSuppliersEmployeesEmployeesTransTrans--shipment shipment nodesnodes
Economic BenefitsGross State Product (GSP)Gross State Product (GSP)Real Personal IncomeReal Personal IncomeEmploymentEmployment
Project CostsConstructionConstructionOperating & MaintenanceOperating & Maintenance
Benefit/Cost RatioDiscounted GSPDiscounted GSPDiscounted CostsDiscounted Costs
Net Present Value (NPV)Net Present Value (NPV)
Source: Cambridge Systematics, Inc.
The economic benefit/cost analysis within HEAT is intended to perform a first approxi-mation to determine the relative size of likely economic benefits and costs, which helps to determine the economic feasibility of a project. While, the analysis techniques used above embody the state-of-the-practice, they do not quantify all of the benefits and costs associ-ated with highway investments. These omissions are explicitly accounted for in the envi-ronmental review required for a project’s ultimate advancement to funding and construction. Such omissions include the impacts a highway improvement may have on environmental, cultural, and historic resources, traffic noise, quality of life, and other qualitative impacts. While these impacts cannot be reliably quantified, they may consti-
Montana Highway Reconfiguration Study Final Report
Cambridge Systematics, Inc. 1-11
tute significant issues that should be included in a project evaluation. The lack of their inclusion in HEAT is in no way an indication of their lack of importance.
Also deliberately left out of HEAT are the economic benefits of a project’s construction activity. These benefits last only as long as the construction phase, and then disappear entirely. While such employment is real and significant, it is not a durable benefit and usually does not create benefits in excess of those generated if the public funds were spent for some other purpose or left in the pocket of tax payers (i.e., the opportunity cost or next best investment alternative). This is why these economic benefits should not be included in transportation benefit/cost analyses.
Appendix A1 provides a literature review of the well-researched and accurate analyses of roadway investments intended to advance a region’s economic development. The scope and scale of these case studies range from construction of bypasses around small cities to the 13-state Appalachian region, which received over $1.4 billion in Federally-funded roadway construction.
These case studies provide some useful background to the possible effects of roadway improvements on Montana’s economic development, but they cannot be applied without significant qualifications. Nevertheless, they describe the major types of economic impacts that can be expected due to transportation investments, and provide examples showing other states’ experiences with using transportation as part of an economic devel-opment strategy, as well as their approaches for assessing economic benefits. Underlining the importance of transportation to economic development efforts, the literature review also summarizes the importance of highways and transportation infrastructure as a con-sideration in the site selection process.
1.3 Structure of This Report
The remainder of this report is composed of eight sections, including a final section of five appendices. The first seven sections, which form the body of the report, provide summa-ries of the work accomplished. More detailed descriptions are provided in the five techni-cal appendices. This report, however, is not a user manual for the HEAT software. A separate user manual and help function within HEAT will be available for HEAT users. Nevertheless, significant portions of this report provide a technical reference for HEAT users or for others seeking information that would shed light on outcomes from HEAT analyses.
The following brief descriptions summarize the content of the remaining seven sections of this report:
Section 2.0 – Theory and Methodology – This section presents three topics that form an intellectual foundation for the mathematical operations performed in HEAT. Subsection 2.1 summarizes the economic theory underlying the role of highway infra-structure in economic development. Subsection 2.2 presents the possible methods that

Montana Highway Reconfiguration Study Final Report
Cambridge Systematics, Inc. 1-12
could be used to calculate economic benefits. Subsection 2.3 presents the preferred method chosen for HEAT.
Section 3.0 – Data Sources and Software – Subsection 3.1 provides an overview of the data sources used in HEAT. Subsection 3.2 describes the GIS data, including the devel-opment of the roadway network and the GIS tool development. Subsection 3.3 describes the commodity flow data and Subsection 3.4 gives a brief overview of the commodity flow forecast. Appendix A2 contains a detailed write-up of the forecasting methodology which has been published by the Transportation Research Board (TRB). Subsection 3.5 gives an overview of the industrial profiles, which are provided in full in Appendix A3.
Section 4.0 – Results – The first of three subsections summarizes the general conditions under which HEAT would be more likely to provide a useful analysis. These general cri-teria may be helpful to project stakeholders who are uncertain if their project has signifi-cant potential for fostering economic development. This section goes on to summarize the results from the application of HEAT to specific roadway improvements. The purpose of this was two-fold. First, it was intended as a direct test of HEAT. As described in Subsection 4.2, the scenario testing helped the consultant team and MDT determine the accuracy of the analytical process, the degree of automation and need for manual or exogenous analysis and data manipulation. In Subsection 4.3, results from four scenario tests using HEAT are presented. These four are:
1. U.S. Highway 93 from Missoula to Polson;
2. U.S. Highway 2 from the North Dakota Stateline to the Idaho Stateline;
3. MT 3 from Great Falls to Billings; and
4. Secondary 323 (S-323) from South of Ekalaka to Alzada.
MDT selected these four improvement scenarios in part because they varied in length, cost, location, and amount of traffic affected.
Section 5.0 – Implementation – This section presents the following four general topics that MDT will most likely contend with as HEAT is implemented: 1) integration of HEAT with MDT existing performance-based programming process (P3), 2) software installation and training, 3) maintenance, and 4) software upgrades and enhancements.
This final report includes six appendices. These consist of the following:
• Appendix A1 – A literature review which was completed as specified in Task 2 of the consultant team scope of work.
• Appendix A2 – A TRB paper submitted on August 1, 2003, entitled A Comparison of Commodity Flow Forecasting Techniques in Montana, by Janine M. Waliszewski, Dike N. Ahanotu, and Michael J. Fischer, who were all members of the consultant team. The paper describes for two methods of developing commodity flow forecasts at a sub-state level of geography. The majority of the analysis in this paper is taken

Montana Highway Reconfiguration Study Final Report
Cambridge Systematics, Inc. 1-13
from the commodity flow freight forecast created for the Montana Department of Transportation Highway Reconfiguration Study.
• Appendix A3 – Thirteen industrial profiles for each of the major industrial clusters that have some degree of significant dependence on transportation in general and goods movement in particular.
• Appendix A4 – A more detailed description of the business attraction model in HEAT than is provided in the summary of this methodology in Subsection 2.4 (Analytical Steps in HEAT). The material in the appendix lays out the methodology used to determine how enhancing strategic connections between specific locations can attract outside business activity and investment into the affected area.
• Appendix A5 – An overview of the methodology used to build the cost estimation module in HEAT and a user manual.
• Appendix A6 – An overview of the research and methodology used to estimate values of time by commodity type, trip length, time-of-day, and congested vs. free-flow conditions.
• Appendix A7 – An extensive bibliography for this report.

Montana Highway Reconfiguration Study Final Report
Cambridge Systematics, Inc. 2-1
2.0 Theory and Methodology
This section presents three topics that form an intellectual foundation for the mathemati-cal operations performed in the Highway Economic Analysis Tool (HEAT). The first topic, presented in Section 2.1, summarizes the economic theory underlying the role of highway infrastructure in economic development. Section 2.2 presents the possible meth-ods that could be used to calculate economic benefits. Section 2.3 presents the preferred method chosen for HEAT. Section 3.0 follow with an overview of the data sources neces-sary and the software required to run HEAT.
2.1 Overview of Theory Linking Highway Investments to Economic Development
There is fairly widespread acceptance of the major roles that transportation infrastructure in general and roadway investment in particular play in all levels of economic activity. At the national level, a well-maintained interstate highway system replaced the railroads as the backbone of interstate commerce. Local transportation projects also can affect the eco-nomic fortunes of regions and states by expanding customer or supplier markets; increasing labor markets; reducing business operating costs through lower direct expenses or increased economies of business operation; and increasing the volume, visibility, and access of pass by traffic. These impacts contribute to overall economic productivity and also local competitiveness.
The following list of five economic linkages provides a brief overview of some of the basic ways that transportation investments affect the economic development of a state, region, or city.1
• Industry competitiveness – Transportation efficiency improvements provide major benefits for industries through reduced production and distribution costs. More spe-cifically, properly-designed transportation investments increase access to varied and specialized labor pools, improve connections to inventory and raw materials, and expand customer bases. Impacts at an industry level are often concentrated in par-ticular locations. Though they extend to the state and national level, these impacts are a key example of how transportation investments impact a local economy. Growth of a particular industry in a given area can yield extensive spill-over effects as the
1 The literature review in Appendix A1 contains an extensive annotation of the theory and findings
linking highway investment to national and regional economic development.

Montana Highway Reconfiguration Study Final Report
Cambridge Systematics, Inc. 2-2
additional business and personal income generated create opportunities for other businesses.
• Household welfare – Individuals and families benefit from a strong transport network through increased access to new or better jobs, goods, and services. Well-maintained roads also reduce personal vehicle repair costs; efficient public transport networks reduce costs associated with driving and automobile ownership.
• Travel – Both business and leisure travelers depend on transportation infrastructure for access to activities and destinations, such as conferences, trade shows, national parks, beach resorts, and everyday business meetings and social events. Localized travel impacts can occur if a particular area develops a major tourist or business attraction. Business conference facilities, for example, can create the need for hotels, restaurants, and other related facilities that can provide a base of economic growth for an area. These facilities, however, may not be feasible in areas that do not already attract business travelers.
• Reduced costs – Traffic accidents average $580 per capita in lost productivity, prop-erty damage, and medical expenses each year. Similarly, congestion-related time delays and fuel consumption cost $78 billion for major U.S. urban areas in 1999 (1). Investments that improve safety and increase capacity mitigate accident losses and benefit businesses and households alike. These costs may not directly impact eco-nomic development in a particular area, but they decrease overall efficiency.
• Direct employment – Transportation investments provide employment in several ways. First, construction spending provides employment in construction and support industries, as well as increasing consumer spending due to increased earnings. Second, nearly 11 million people are employed in for-hire transportation and transportation-related industries in the United States. This includes some 236,000 people in the railroad industry; 147,000 school bus drivers; close to 1.9 million people in motor freight; and nearly 1.3 million people in air transportation (2).
For the purpose of economic development of disadvantaged areas, some of these linkages are more important than others. This study ties directly into the first factor, boosting industry competitiveness. The timing and duration of benefits generated from each of these connections will be different. The impacts of construction are short-lived and cannot be considered equivalent to the subsequent impacts from industrial activity. If a trans-portation facility is built, but underused, the increased benefit from industry and tourist growth may lag the completion of the project for many years or never generate significant benefits. The timeframe, therefore, becomes a critical element of evaluating potential benefits.
Monetary benefits to households also are important, but tend to occur when industrial growth increases the incomes of residents in an affected area through direct employment opportunities and the secondary and tertiary spending generated from business activity. Nevertheless, benefits to residents of an economically depressed area may lag significantly behind the transportation investments, and may provide more benefits to new residents rather than existing ones. Stimulating business activity that can hire local residents may require job training; public subsidies (e.g., welfare-to-work); and other non-transportation
Montana Highway Reconfiguration Study Final Report
Cambridge Systematics, Inc. 2-3
interventions to ensure some of the original benefit from these investments flow to the target population.
The five economic linkages describe the direct connections between transportation investments and economic development. Given Montana’s relatively small population and uncongested roadways, the most relevant of the direct connections listed above are reduced transportation costs, better service, or both, of freight movement. All Montana firms engaged in the manufacture and distribution of goods benefit from a reduction of their per-mile cost of goods movement and reduced travel times, because their factories or distribution centers can serve existing clients more efficiently, and serve a wider market area, with potential gains from scale efficiencies. It also means a factory can draw sup-plies from a wider area with potential gains in terms of the cost and/or quality of parts and materials coming to the factory.
In addition to the lower costs to shipping-intensive industries, decreases in transit time and/or improvements in reliability will allow firms to manage their inventories and sup-ply chains more efficiently. Improved travel time reliability, for example, reduces the amount of inventory a firm holds to buffer its production activity against late deliveries of supplies. Higher speeds for trucks and/or shorter travel time benefit factories or distri-bution centers, especially when a firm can gain improved access to an air freight terminal or a second railroad, thus, forcing the railroads to compete on price and service for the firm’s business.
These adjustments to improved roadway access to customers, suppliers, and trans-shipment points are not nearly as well understood or quantified as the responses to lower transportation costs. In fact, very recent economic theory has posited that the cost of transportation has been decreasing for most industries (measured as a share of their value-added costs) (3). The argument most relevant to the theory underlining the analyti-cal methods used in HEAT is that transportation costs do not need to be accounted for in determining the location of future cities in the U.S. Thus, much of a firm’s response to transportation improvements may be reorganization of its logistics. It will move goods longer distances, using fewer warehouses, and carrying less inventory for a given level of production. It may actually buy less trucking and other transportation or use more trans-portation, because improved logistics allow it to reorganize its production to improve productivity (rather than just lowering costs). These changes may lead to product or ser-vice improvements and give the firm a larger market share. These medium-term (one to five years) or long-term (three or more years) adjustments that may emerge from trans-portation improvements are treated differently in the analysis. Although the state-of-the-practice has not fully accounted for these benefits, the following classification scheme for benefits and other effects helps to understand the potential for a full accounting (4).
Montana Highway Reconfiguration Study Final Report
Cambridge Systematics, Inc. 2-4
• First-order benefits – Immediate cost reductions to carriers and shippers, including gains to shippers from reduced transit times2 and increased reliability.
• Second-order benefits – Reorganization-effect gains from improvements in logistics3. Quantity of firms’ outputs changes; quality of output does not change.
• Third-order benefits – Gains from additional reorganization effects such as improved products, new products, or some other change.
• Other effects: Effects that are not considered as benefits according to the strict rules of benefit/cost analysis, but may still be of considerable interest to policy-makers. These could include, among other things, increases in regional employment or increases in rate of growth of regional income.
When all these effects are taken into account, some roadway improvements that benefit freight flows may propagate benefits through all the economic sectors that produce or distribute goods. While economic theory and logistics practices suggests that these bene-fits may create productivity improvements beyond the direct cost savings, the compre-hensive impacts of freight improvements are not yet understood, let alone incorporated into benefit/cost analysis methodology.
Therefore, most academic research and project specific studies on transportation and eco-nomic development have been focused on the direct benefits of travel time savings from highway investments. Much of the initial impetus was the desire to measure the eco-nomic benefits of building the interstate highway system. The research typically has been divided into two methods: macroeconomic and microeconomic.
The alternative methodologies and approaches for conducting benefit/cost analysis of highway investments may be grouped into three categories: macroeconomic, microeco-nomic, and overall benefit/cost analyses. The estimation of parameters is a critical com-ponent of all three. Researchers and practitioners have employed all of these methodologies to assess the productivity impacts of transportation investments. A brief review of their theoretical underpinnings includes some of their applications, strengths, and weaknesses.
2 Carrier effects include reduced vehicle operating times and reduced costs through optimal
routing and fleet configuration. Transit times may affect shipper in-transit costs such as for spoilage, and scheduling costs such as for intermodal transfer delays and port clearance. These effects are non-linear and may vary by commodity and mode of transport.
3 Improvements include rationalized inventory, stock location, network, and service levels for shippers.

Montana Highway Reconfiguration Study Final Report
Cambridge Systematics, Inc. 2-5
Macroeconomic Analysis
Macroeconomic analysis attempts to measure the national-level productivity enhancing benefits of transportation infrastructure using complex statistical modeling (Aschauer [5], Munnell [6], and Nadiri [7]). Macroeconomic models sometimes group all modes of transportation infrastructure into a single measure of public capital, including roads, rail, air, water, sewer, seaports, etc. While macroeconomic models have been used at the state level (see Maryland example in Appendix A1 – Literature Review), it is not a common approach for projecting the benefits of new highway investments at the sub-national level.
Nevertheless, macroeconomic models are frequently cited by transportation economists as the theoretical foundation for understanding the evolving role of roadway investments in economic growth. The most recent and often cited empirical research is that being done by Professor Ishaq Nadiri at New York University. Professor Nadiri has been involved with a number of investigations into the links between transportation and U.S. economic growth. His most often cited study demonstrates a statistically valid relationship between highway capital and industry productivity growth, which connects to overall growth in national productivity (7).
The study examines the contributions of total highway capital and non-local highway capital to the output growth and productivity of 35 industry sectors that comprise the U.S. economy, providing empirical evidence of the positive benefits of public highway capital on private sector costs of production. For example, the study found relatively large cost reductions (associated with an increase in highway capital) in such industries as food and kindred products, trade, construction, and transportation and warehousing. In addition to a “productivity effect,” the study also found an “output effect” resulting from the cost reductions. The cost reductions permit products to be sold at lower prices which, in turn, can be expected to lead to output growth. The cost saving productivity gains from high-way capital investments appear to “finance” a substantial portion of the higher total pro-duction costs associated with the output expansion effect.
In a comprehensive review of the published literature, Bilkis Khanam examines the impact of public capital stock of various types on the output and productivity of different economic sectors. He concludes that the evidence from these studies shows a positive relationship between public highway capital and private sector output and productivity; and the estimated size and significance of this relationship is very diverse and depends to a large extent on the approach followed. The results, expressed as output elasticities, range from 0.04 to 0.56; in some models, the estimates are statistically insignificant (from zero) or negative and compares results (output elasticities) obtained using Cobb-Douglas and Translog models (8).
Macroeconomic analysis uses econometric models with large historical and cross-sectional databases to measure the correlation between transportation investment (typically meas-ured as new highway capacity denominated in construction dollars) and gross domestic product (GDP). Academic studies by and for the FHWA, Office of Policy Development have documented the effects of public highway capital on logistics system and commer-cial sector economic performance.

Montana Highway Reconfiguration Study Final Report
Cambridge Systematics, Inc. 2-6
In addition to Nadiri’s 1996 study described above, examples include the following:
• Bell (1997) reviews macroeconomic analyses of the linkages between transportation investments and economic performance (9).
• Xin (1996) uses an input/output model to study regional economic benefits of trans-portation system projects (10).
• Duffy-Deno models the relationship between capital stock of public infrastructure and per capita income as an economic development indicator (11).
• Khanam examined empirical work on the relationship between highway capital stock and the output and productivity of goods-producing industries in a comprehensive review (8).
• Keeler (1988) uses a translog cost function econometric model for an analysis of the benefits of Federal-aid highway infrastructure investments in the United States on the costs and productivity of firms in the highway freight transport industry. The average sum of marginal benefits across all industries is about 0.294. This means that a $1.00 increase in net capital stock generates approximately $0.3 of cost saving producer benefits per year.4 These benefits continue over the design life of the road improve-ment (12).
Macroeconomic methods are applied primarily at the national-level and most researchers and practitioners do not regard their application at a state or regional level as reliable or practical. Nevertheless, these methods provide an essential foundation for the method-ologies that focus on more local impacts, and they provide a quantitative range for impacts that can help bracket the expected outcomes for regional and local roadway investments.
A final note on the economic theory underlying the linkages between transportation and economic growth sheds light on the effects of more than 50 years of interstate investments. Nadiri’s research and the more recent work of Glaeser and Kohlhase show a significant decline in the role of highway investment in the nation’s output. Over the 20th century, the costs of moving goods have declined by over 90 percent in real terms, and there is lit-tle reason to doubt that this decline will continue. The average cost of moving a ton a mile in 1890 was 18.5 cents (in 2001 dollars). Today, this cost is 2.3 cents. At their height, the transportation industries represented nine percent of GDP. Today, if we exclude air travel, they represent two percent of the national product. Two factors have acted to decrease the importance of transportation costs for goods. First, the technologies designed for moving goods have improved. Second, the value of goods lies increasingly in quality,
4 Mohring (13) and Forkenbrock (14) argue that productivity enhancements are not an additional
benefit to that already captured by the benefit-cost analysis framework, but that they are another useful measure of impact of highway investment.

Montana Highway Reconfiguration Study Final Report
Cambridge Systematics, Inc. 2-7
rather than quantity; so that we are shipping far fewer tons of goods relative to GDP than we have in the past (3).
Microeconomic Analysis
The second method of economic analysis focuses on the regional competitiveness and productivity benefits of improving the highway system as demonstrated through tradi-tional user benefit measures and microeconomic indicators, often combining state or regional transportation models with regional economic impact models. This method includes benefit/cost analysis (used in HEAT) and is considered by most practitioners as cost-effective and sensitive to the economic geography of the region most affected by the highway investment being studied.
Microeconomic Theory as Applied to Transportation
Microeconomic analysis examines how individual firms respond to changes in their transportation choices and costs. Their responses range from short-term adjustments in output, changes in the various inputs used (factors of production), and logistics. These responses were summarized in the section of theory above. This methodology also examines the longer-term adjustments in their logistical arrangements in response to lower costs of freight movement (13).5 Typically, such adjustments would involve fewer warehouses and more miles of truck movement as shippers take advantage of lower freight costs to consolidate storage facilities and reduce inventory costs. These effects are the principal source of benefits not captured in the conventional approach to benefit/cost analysis. One example of this method demonstrates that the magnitude of indirect bene-fits can be in the order of 12 percent of direct benefits (11).
Microeconomic methods can offer robust measurements of direct, indirect, and full social cost accounting estimates of benefits. Their use in understanding the comprehensive benefits of transportation investments has helped researchers develop more robust models for regional and local analysis. Nevertheless, the methodology does not include costs of construction or maintenance and usually does not discount the cost and benefit streams to a net present value. This disadvantage would frustrate most state and regional transpor-tation agencies that need a single metric that may be used across investment alternatives that vary in scale, mode, and timeframe.
Benefit/Cost Analysis Applied to Transportation
This section provides a brief overview of the research and recent findings in the use of benefit/cost analysis to evaluate and understand the economic impacts of transportation investments. The mechanics of benefit/cost analysis will be described in Section 2.2 – Alternative Methods. Montana may expect two types of benefits from corridor highway 5 The study was the first formal analysis of what has been termed reorganization benefits.

Montana Highway Reconfiguration Study Final Report
Cambridge Systematics, Inc. 2-8
investments: reductions in transportation costs and increases in economic activity (14). Simple tabulation of road user benefits is seldom the basis for decisions of whether or not to invest public funds to upgrade highways, especially in rural corridors or states like Montana with little or no congestion. Other indicators to consider include pavement con-dition and safety. In addition, the State’s policy-makers are often petitioned to invest in wider, better highways because proponents believe these investments will lead to eco-nomic development, a.k.a. “build it and they will come.” This expectation discounts the notion that a corridor’s current volume of travel or its existing industrial base portends what the future would hold if a wider, faster, safer roadway where built in its place.
Thus, the task of estimating the future benefits should take into account whether the investments will lead to business attraction, expansion, and retention benefits for the locally-affected area (with a transfer of future economic activity from other regions). In economic theory, this type of benefits has been called positive network externalities, where the change in location decision is only made because the firm is actually better off and more productive in this new location. While it is often regarded by theorists, practi-tioners, and policy analysts as speculative, the phenomenon has been measured for other types of infrastructure, such as telecommunications.6 Recent research has attempted to reduce the speculative nature of business attraction analysis for new highways (15). These examples lend support for government investment to correct for an undersupply of high-way infrastructure, but only where there may be positive network externalities (16).
2.2 Alternative Methods
Immediately after the Reconfiguration Study Steering Committee (RSSC) selected the con-sultant team, the scope of work for the Highway Reconfiguration Study evolved. Instead of a general analysis of the economic benefits of widening two-lane highways throughout Montana, the RSSC and MDT asked for a leave-behind, analytic tool that MDT would use on an ongoing basis to evaluate specific highway investments. The consultant team pro-posed a suite of analytic tools that could be integrated into a single software platform. This approach reduced the choices of alternative methods that could be used for each module of the software, since the functionality of each module was dictated by the inputs from the previous. Furthermore, the RSSC and MDT impressed upon the consultants that the methodology must withstand persistent challenges from project stakeholders. The consultant team included experts in the state-of-the-practice and recent experience in evaluating alternative methods.
In particular, the consultant team considered the guidance from the NCHRP 2-19(2) Final Report, Guidance on Using Existing Economic Analysis Tools for Evaluating Transportation 6 Capello and Rietveld found that logistics-oriented telecommunications systems are characterized
by positive externalities in the adoption process and, given the high-fixed costs of acquisition, government regulation may ensure the economically optimal critical mass of users.
Montana Highway Reconfiguration Study Final Report
Cambridge Systematics, Inc. 2-9
Investments (17). This report grouped all of the relevant analytic tools into four categories designed to address specific questions, or provide specific information to decision-makers:
• User impact tools – These models make assessments of direct user benefits gained from transportation projects of all modes. These benefits may include, for example, the monetary cost of travel, travel time, safety, comfort and reliability, and ease of access. Most user impact models tend to also be benefit/cost models, and some are used as inputs to regional economic models, such as REMI. They are sketch-planning tools and include MicroBENCOST, StratBENCOST, STEAM, HDM 4, NET_BC, and HERS.
• Regional economic impact tools – These models address the direct and indirect/induced economic impacts of a transportation investment for both users and non-users of the improvement. For businesses, for example, there can be direct economic effi-ciency benefits in terms of product costs, quality, or availability – often stemming from possible changes in access to labor markets, ease of obtaining production inputs, or changes in the cost of bringing a good to market. Indirect and induced economic impacts within a region can include business growth, shifts in population and busi-ness location patterns, land use/land value patterns, and even government costs and revenues. Specific impacts that can be evaluated include employment, personal income (wages), property value, business sales volume, value-added, and business profit (18). They may be divided into input-output models (IMPLAN, RIMS II, and PC-I/O) and dynamic equilibrium models (REMI and Global Insight, formally DRI).
• Fiscal impact tools – These models address specific issues relating to estimated public revenues and expenditures generated over the life of a project. They may include con-struction and maintenance spending impacts of these specific projects, the cost of capital, etc. Many of these fiscal models are not necessarily transportation-project-specific, which tends to limit their use by transportation professionals. The RSSC and MDT did not specify this type of analysis as part of its scope of work. Nevertheless, proponents of transportation spending often cite the large share of Montana’s state-wide employment that may be linked to its roadway construction and maintenance. FDISCALS is the leading and most available example.
• Mixed and other societal impact tools – This category highlights models that address various other types of impacts, such as air quality or social issues, and models that address more than one of the above categories, or mixed models. MCIBAS, by the Indiana DOT, integrates travel demand, benefit/cost, and general equilibrium tools to analyze economic impacts in Indiana highway corridors.
Montana Highway Reconfiguration Study Final Report
Cambridge Systematics, Inc. 2-10
2.3 Preferred Method
The distinguishing feature of the preferred method is that it recognizes the viewpoint of industry and economic development. Specifically, the tool:
• Represents a consistent, analytically rigorous approach to assess benefits of improving, expanding, or building new highways within the State’s highway net-work; and
• Helps maximize the effectiveness of Montana’s highway investments in assisting eco-nomic development for both urban and rural areas.
HEAT is designed to integrate a number of transportation and economic modeling tools described above. To achieve this integration, all of the models must be capable of distin-guishing impacts of highway system reconfiguration alternatives, including two- to four-lane widening, expansion of shoulders, limited access schemes, “Super 2” configurations for two-lane expressways, various schemes for mixed two/four-lane roads (with passing sections where applicable), etc. Nevertheless, because of the limitations on many of the necessary data and analytical models, this sensitivity cannot go below the county level. Fortunately, for a large dispersed state with many counties, this level of detail is sufficient to capture highway trips and traffic volumes that will impact economic development with statewide significance.
HEAT has been designed to build upon findings from the theory and methodology pre-sented in Sections 1.0, 2.1, and 2.2 and the literature review in Appendix A1. In this regard, HEAT integrates state-of-the-practice methods for newly-emerging perspectives for evaluating benefits of highway investments. It is centered on three key themes that are becoming central to the economic analysis of transportation in general, and are especially critical in its application to Montana.
• Recognizing the value of freight delivery time – There is a need to recognize the real value of freight movement, as well as passenger vehicle movement. A recent spurt of research has been focusing on freight-related planning and investment decision-making. An important element of that research is a finding that the real value of travel time savings for a full truck can be much more than that of an empty truck – where the value of time reflects vehicle operating and driver time. The emerging literature is showing that many manufacturing processes also depend on freight scheduling, reli-ability, and logistics handling, which increase the value of highway improvements that reduce travel time and/or increase travel time reliability. By recognizing these freight cost factors, the economic evaluation system can better represent factors affecting business market access, operating cost, and related competitiveness factors. In addition, the value of time for freight movements can vary by commodity, depending on the value of goods being shipped, and this variance in value of time cor-responds to the detailed commodity flow data used in this project.
Montana Highway Reconfiguration Study Final Report
Cambridge Systematics, Inc. 2-11
• Equal treatment for rural highway investment – There is a need to assess both urban and rural highway investments in a consistent way. Recent research has shown that accessibility is a key motivation factor for highway improvements that underlies both urban and rural highway needs. Research on urban areas is showing that, while a failure to adequately invest in highways can lead to road congestion, the ultimate result is a reduction in accessibility to/from some locations. Research on rural areas is also showing that a failure to adequately invest in highways can increase relative lev-els of isolation and effectively limit accessibility to markets. Thus, by keying on rela-tive changes in accessibility, it is possible to assess the impact of both urban and rural areas within the same framework.
• Focus on behavioral factors – There is a need to calculate highway investment bene-fits in a way that recognizes the types of business activity linkages that they support. The traditional engineering analysis of highway needs has focused on investment to maintain system flow or throughput, in terms of speed and safety. But the literature on economic impacts is demonstrating that people and businesses rely on highways not for the sake of travel alone, but rather as a means to access jobs, materials and other activities. At the same time, a line of economic analysis has focused on the rela-tionship between highway investment spending or capital stock and subsequent eco-nomic growth. The literature on business location and economic growth is demonstrating that business activity comes not as a result of highway spending (“build it and they will come”), but rather as a result of increasing market access and the productivity of locations. These findings underscore the importance of assessing highway system improvements in terms of how they affect the economic attractive-ness and competitiveness of locations by changing accessibility.
The focus on these three themes give HEAT its capability to translate improvements in travel time (i.e., the traditional engineering metrics) into factors that directly affect the creation of jobs and income for Montana residents. This approach can be understandable to both planners and the broader public, because it is behavioral – recognizing that the benefit of highway investments depends on where the highways are going and the extent to which they actually improve access linking people and businesses. It addresses the concern that the present use of a roadway (i.e., the current amount and mix of traffic) should not be the sole driver of what benefits may accrue if the roadway is improved.
This approach follows the new economic geography concept in economic development – in which competitive advantage arises and clusters of related businesses develop, because of economies of scale that come from access to broader input markets (labor and natural resources); output markets (delivery and customer access); and intermediate access points (airports, national trucking routes, intermodal, and rail facilities).
Finally, it should be stressed that HEAT’s design focuses on identifying how and when highways can affect the retention, growth, and attraction of the economic base for Montana, and, hence, the generation of income benefits for Montana residents. Economic base refers to firms that tend to export their goods or services outside the State. This means that mere shifts in the distribution of consumer retail and services businesses within Montana are not (by themselves) considered to be a net economic gain or loss.

Montana Highway Reconfiguration Study Final Report
Cambridge Systematics, Inc. 2-12
2.4 Analytical Steps in HEAT
HEAT software is composed of six linked modules that are illustrated in Figure 2.1. While these modules execute specific analytical and database management functions, the fol-lowing descriptions of six analytical steps provides a more focused and easier explanation of the underlying methodology used in HEAT.
Figure 2.1 HEAT Analytical Modules
Geographical Information System (GIS)Geographical Information System (GIS)
Roadway Network Modeling
Roadway Network Modeling
Travel Performance
Impacts
Travel Performance
ImpactsCommodity
FlowsCommodity
Flows
Project A
Project B
Project C
Project Z
Cost EstimationCost EstimationTransportation
Economic Benefit
Transportation Economic
BenefitIndustryAnalysisIndustryAnalysis
Source: Cambridge Systematics, Inc.
Benefit-Cost Analysis
Benefit-Cost Analysis
Step 1. Define GIS-Based Transportation and Economic Network
Transportation network – The first step is to define the highway network, including travel times, travel distances, accident rates, origin-destination patterns, reliability/delay, volumes of cars and trucks (i.e., a trip table) between zones within Montana (most likely counties) and to/from other areas of the U.S. and abroad. The truck flows should reflect volumes of freight, broken down by major industry or commodity.
Economic network – This task should be developed as part of the statewide highway network modeling effort, building upon the GIS system to represent the spatial relation-ship and pattern of car and truck flows among the zones. The GIS system should also include measures of each zone’s (county’s) population, employment (by major industry

Montana Highway Reconfiguration Study Final Report
Cambridge Systematics, Inc. 2-13
group), and inflow/outflow of freight (consistent with our available county-level IMPLAN economic models). In addition, the system should plot the location (within Montana and immediately adjacent areas) of commercial airports, major air freight facili-ties, intermodal (container) rail facilities, bulk rail loading facilities, river port facilities, major national highway routes, and commercial border facilities.
Step 2. Calculate Transportation and Market Access Changes for Alternative Scenarios
Alternative scenarios – The second step is to use the GIS-based network model from Step 1 to calculate changes in travel times, travel distances, accidents, reliability/delay, and volumes of cars and trucks between zones. The scenarios include: 1) the current highway network, 2) future conditions under a baseline assumption, and 3) one or more illustrative alternatives that further improves the statewide highway network. One of the most important steps is defining and coding the highway network improvement to be analyzed (e.g., changing highway segments from two lanes to four lanes). Often times, this is referred to as the “build” scenario and a detailed understanding of the differences between the baseline future highway conditions (i.e., no build) and the alternative sce-nario is essential for a sound assessment of impacts.
User benefit and reliability factors – As part of the statewide highway network analysis, the impacts of alternative scenarios on travel times and distances will be directly trans-lated into user benefits that include vehicle operating costs, driver/passenger value of time, and cargo value of time. The value of changes in business-related travel time for people are viewed as a change in business operating costs, while the value of personal travel time is viewed as not affecting the flow of dollars in the economy. In addition, the value of freight time reflects the time value of cargo delivery as a business user cost.
HEAT also includes a reliability factor that relates travel time reliability to the ratio of vol-ume to capacity along the route being improved. Thus, if a roadway has volume to capacity ratios approaching one, this functionality allows HEAT to quantify benefits associated with reducing non-recurrent delay. HEAT assigns the value of travel time savings associated with reducing non-recurrent delays compared to recurrent delay. The consultant team investigated a second type of reliability factor that could explicitly iden-tify parts of the network where there are periodic or sporadic slowdowns, because of traf-fic congestion, rail crossing delays, traffic lights or other intersection delays, high accident rates, or slow vehicle without passing issues. After significant empirical research on the frequency and severity of these slowdowns, results indicated these were not significant and would not contribute sufficient sensitivity to benefit calculations to warrant the effort and additional complexity to be added to HEAT.7
7 This functionality could be added at some future time. For each project being evaluated, a
reliability penalty factor could be assigned to the calculation of estimated travel time along those
(Footnote continued on next page...)

Montana Highway Reconfiguration Study Final Report
Cambridge Systematics, Inc. 2-14
Access – Once the travel performance factors have been developed, the GIS analysis sys-tem is applied to estimate each zone’s effective change in access to markets and interme-diate transportation facilities, including the following:
• Change in the amount of population or workforce within a 60-minute access time;
• Change in the amount of business activity (measured by employment) within the nearest major markets/cities; and
• Changes in travel time to the nearest commercial air, rail, highway, and border facilities.
Step 3. Calculate Impacts on Market Access and Operating Cost by Industry
Business sensitivity to highway changes – The third step is to assess the extent to which various industries in Montana are sensitive to (and hence depend on) various types of market access levels and costs as factors in their economic viability and competitiveness. HEAT relies on an industry screening model that adapts and builds upon the Hwy-OPPS model that was originally developed for the Appalachian Regional Commission as a tool to identify business opportunities created by highway system improvements. For this application, HEAT split that model into two elements.
The first element of the industry screening model is industry factors – reflecting how vari-ous industries differ in their relative reliance on various factors – skilled labor, truck deliveries, rail deliveries, air deliveries, pass-by traffic, or customer visitation. It makes use of the following sources:
1. Input-output tables which show how much each industry relies on labor and obtains goods and services from other industries;
2. Transportation Satellite Accounts (TSAs) developed by the U.S. Department of Commerce and Bureau of Transportation Statistics as an appendage to input-output tables, showing how much each industry ships by truck (for hire and in-house ser-vices), rail, air, and water transportation; and
3. Logistics/scheduling tables developed by Economic Development Research Group to reflect the extent to which each industry depends on time-sensitive deliveries.
This factor model makes it possible to identify how highway reconfiguration scenarios may improve access for some industries to key input factors, thus, increasing their pro-ductivity and growth potential.
routes where there should be some indicator of the type, frequency, and typical extent of delay based on the locations of delay points along the highway network (in the GIS system).
Montana Highway Reconfiguration Study Final Report
Cambridge Systematics, Inc. 2-15
The second element of the industry screening model is industry trend profiles – reflecting how patterns and trends of business activity differ among industries and locations in Montana. This analysis uses the GIS system and separate industry profile analyses (see Appendix A3) to identify where various industries are locating in Montana and to show how those industries are performing at various locations in Montana (relative to statewide, western, and/or U.S. trends). The purpose of this industry trend analysis is to recognize that there are fundamental reasons why some existing industries are located where they are, which cannot be changed by highways alone. This includes factors such as proximity to certain water, mineral or agricultural resources; cheap hydropower; universities; inter-national borders; Indian reservations; or national parks. The location and trend analysis allows us to identify industries that prefer or stay away from Montana locations for these other reasons, so that the market access opportunities identified from the preceding analy-sis will only be applied for locations where the specific industries appear to be viable.
Impacts of access changes on specific industries and locations – HEAT applies the industry screening model (which reflects sensitivity to access changes by industry) to the results of Step 2 (estimates of access changes by location and scenario). The result is a series of measures of how each alternative scenario affects the operating cost and size of the accessible market for different industries at different locations within Montana. This can also be viewed as measures of how each roadway improvement scenario will affect the travel time and cost of different commodity flows within Montana. HEAT incorpo-rates two different elements of analysis: 1) user benefits and 2) business attraction. This latter element is described in Step 4 (below).
The user benefits are generated by saving travel time (i.e., vehicle hours of delay or VHD), reducing operating costs, and avoiding accidents for shippers, receivers, carriers, com-muters, tourists, and households. Furthermore, this analysis differentiates the user bene-fits according to the type of commodity being shipped according to its value of time and by the purpose of the trip (i.e., on-the-clock, home-based work (commute) or other (e.g., pleasure, shopping, school, etc.). Finally, HEAT distinguishes between the value of time when delay is caused by normal road conditions or congestion (i.e., recurrent VHD) and unexpected delay caused by accidents (i.e., non-recurrent VHD). Table 2.1 presents the current values used in HEAT to differentiate between VHD by commodity type or trip purpose and recurrent versus non-recurrent delay.
HEAT also recognizes impacts on travel time or cost that applies to the personal travel of individuals. These personal user benefits are valued based on the estimates shown in, as shown in the last line in Table 2.1. HEAT tracks these impacts separately, because per-sonal travel benefits affect the economy differently. Personal savings in transportation costs (due to travel time savings, operating costs, and accidents) effectively increase the disposable income of individuals, which is in itself a direct benefit and also leads to increased sales for local consumer goods and services. HEAT accounts for personal sav-ings in travel time (due to faster effective speeds or shorter distances) as a true societal benefit that increases the quality of life of individuals and the value of locations, but does not immediately create any additional money in people’s pockets that affects the flow of dollars in the economy.

Montana Highway Reconfiguration Study Final Report
Cambridge Systematics, Inc. 2-16
Table 2.1 Value of Time Delay in HEAT (2002 Dollars Per Hour)
Dollars Per Vehicle Hour of Delay Commodity Type or Trip Purpose Recurrent Non-Recurrent
Non-durables manufacturing goods $53 $0
Durables manufacturing goods $66 $159
Agriculture $41 $198
Mining & wood resources $39 $123
Misc. transport services $42 $117
Drayage & warehousing $40 $126
Non-freight (service delivery) $38 $120
Auto – work $13 $76
Auto – non-work $6 $26
Source: Highway Economic Requirements System (HERS) by Cambridge Systematics, Inc.; Montana ES-202 wage statistics; and industry cost economic analysis model by Economic Development Research Group, Inc. (incorporating a Meta study of time benefits associ-ated with logistics and just-in-time processing).
Step 4. Calculate Relative Profitability and Productivity of Locations
The fourth step is to calculate the extent to which highway system improvements can affect both a) the profitability and income-generation of existing business activity retained at various locations, as well as b) the potential attractiveness of expanded or new business at various locations in Montana. Figure 2.2 shows these two independent analytical steps require inputs from the highway network assignment routine in HEAT, and are then translated through a bridge routine into the REMI economic model.

Montana Highway Reconfiguration Study Final Report
Cambridge Systematics, Inc. 2-17
Figure 2.2 Economic Impact Analysis System Elements
Existing Business Savings
Existing Business Savings
New Business Attraction
New Business Attraction
REMI BridgeREMI Bridge
Economic Model
Economic Model
Highway Network
Highway Network
Geographic Info SystemGeographic Info System
Source: Economic Development Research Group, Inc.
Business Productivity
HEAT applies the results of Step 3 to develop three measures:
1. The dollar value of the savings in production costs for each existing industry at various locations in Montana. This represents the potential cost savings benefits for existing businesses in Montana. The expense savings for households are also calculated in a similar manner.
2. The relative cost competitiveness for each existing major industry in various locations in Montana. This is measured as the ratio of business operating cost in Montana relative to the national average – measured with and without highway improvements under alternative scenarios.
3. The change in potential business markets for each existing major industry in various loca-tions in Montana – measured as the additional sales revenue potentially achievable if businesses were able to compete and grow in proportion to the expansion in size of their markets for customers and supplier access.
The preceding measures of business impact are calculated on the basis of a GIS system for various industries in each zone (i.e., county) within Montana. HEAT, however, distin-guishes between a) impacts that merely shift activity within Montana from b) impacts that also attract new investment and income to Montana. Both can have some value for public policy, though the former is a matter of intrastate equity, while the latter is a matter of statewide efficiency. Any package of highway improvements will affect some locations within Montana more than others. Nevertheless, even if there are shifts of future eco-nomic expansion between areas of the state, this disproportionate expansion is not a zero-sum game as long as there is a net business profitability or productivity improvement for the State.
To forecast long-term economic impacts, the analysis framework in HEAT applies an eco-nomic forecasting model that assesses how changes in regional and statewide industry
Montana Highway Reconfiguration Study Final Report
Cambridge Systematics, Inc. 2-18
cost and competitiveness will affect future economic growth (through business expansion or attraction). The REMI economic model for Montana is designed specifically for this purpose. It compares how different regions of Montana compare to the rest of the U.S. in terms of cost competitiveness, and it forecasts how each industry will grow over the next 35 years within regions of Montana, as well as outside of Montana. The zonal structure of the REMI model has been set to the five MDT districts, so it will generate sufficient detail of shifts and growth among regions, but still provide robust results when it compares costs, performance, and opportunities among the five regions of Montana, and compared to elsewhere in the U.S.
Business Attraction
The Business Attraction Module in HEAT focuses on how enhancing strategic connections between specific locations can attract outside business activity and investment into the affected area. This impact is dependent on the location of highway investments, the link-ages such investments create, and the effect of such investments on the market reach of businesses located in affected areas. These estimates of direct impacts on business attrac-tion are analyzed independently, and then input to the economic simulation model in order to calculate the total (direct, indirect, and induced) impacts on the economy analysis.
The business attraction module embedded in HEAT is designed to consider how highway investments will influence business location decisions, given that a variety of other (non-highway) factors also affects business location decisions. The analysis utilizes a combina-tion of inputs, including data on highway and non-highway business location attraction factors and trends in the local and national economies (see Step 3). The information is then used as a basis for calculating potential highway impacts on business attraction. HEAT includes the automated business attraction analysis tool to conduct these calcula-tions. That tool formalizes a series of calculations, each consistent with accepted economic development analysis practices. Figure 2.3 shows the sequence of steps the business attraction analysis uses to generate benefits.

Montana Highway Reconfiguration Study Final Report
Cambridge Systematics, Inc. 2-19
Figure 2.3 Business Attraction Methodology
Travel Performance Analysis
(GIS-Based Network Assignment)
Travel Performance Analysis
(GIS-Based Network Assignment)
Step 2
Economic Performance Screener
Step 2
Economic Performance Screener
Step 1
Market Access Rating
Step Step 11
Market Access RatingMarket Access Rating
Step 3
Direct Growth Opportunity
Step 3
Direct Growth Opportunity
Step 4
Cluster andAgglomeration
Opportunity
Step 4
Cluster andAgglomeration
Opportunity
Attraction Competitiveness
Attraction Competitiveness
Source: Economic Development Research Group, Inc.
The estimates of potential business attraction are based on the following calculations:
1. The existence of a potential for business attraction to the affected areas is determined by identifying industries that are under-represented in the affected areas, yet well-represented in comparison areas, (i.e., the states surrounding Montana). Industries that are under-performing in the affected area, but performing well elsewhere, may also represent potential categories for business attraction. This calculation process assumes that there is no additional business attraction potential for a particular industry if that particular type of business is already highly represented in the affected area and growing at typical rates for that industry.
2. The module assesses the magnitude of the business attraction potential for the affected area – for each industry – through a process of adding or subtracting “weights” associ-ated with the affected area’s relative advantages or disadvantages. These are defined on the basis of: 1) costs and availability of labor; 2) materials, utilities, tax, and trans-portation costs; and 3) the sensitivity of each industry to 1) and 2).
3. Given a potential for business attraction to the study area, the business attraction impact from the highway project is estimated for each industry in the affected area on the basis of: 1) the highway project’s impact on access to labor, customer, and/or just-in-time delivery markets; 2) the highway project’s impact on access to intermodal

Montana Highway Reconfiguration Study Final Report
Cambridge Systematics, Inc. 2-20
connections; and 3) the sensitivity of each industry to market size and transportation availability.
4. The industry trend analysis results are then compared to the direct growth opportu-nity (Step 3) to determine the direct business attraction impact by industry, by county measured in new jobs. The comparison uses the lower value of the two estimates so that the highway project impact can never be larger than the industry analysis results (to assure reasonably sized impacts).
The analysis framework prepares inputs for the REMI model through a process that esti-mates new jobs by industry by county, aggregating to the regional level (for business attraction), and reductions in production costs by industry based on business travel user benefits (existing business savings).
Step 5. Run Regional Model and Develop Estimates of Benefit and Compare to Costs
The final step in estimating benefits is to run the REMI model and make use of its results, together with other direct impact calculations. In addition to more straight-forward input-output calculations performed for the business attraction inputs, REMI also converts business travel user benefits (reduction in costs) to industry competitiveness and eco-nomic growth terms so that the results are based on tangible economic development fac-tors. The REMI model forecasts how alternative scenarios will affect levels of jobs, personal income, and business output by industry and by region within Montana, on a year by year basis to 2035. This has two primary uses:
1. Economic development analysis – The economic model results demonstrate how alternative highway reconfiguration scenarios will affect economic growth among various regions of Montana, and for the State as a whole. The value of these changes can be compared to a base case scenario for any specific future year(s) between the completion of construction and the year 2035.
2. Benefit/cost analysis – The stream of additional income and business output from eco-nomic growth (measured by gross state product – GSP) that results from highway improvements can be summed and summarized in terms of a discounted net present value of economic growth benefit for Montana. That can be interpreted as the benefit for the economy. To that, HEAT adds the dollar valuation of personal auto user bene-fits (largely travel time savings), which do not directly affect the economy, but are not considered in the economic model. The sum of the two can be considered a measure of societal benefit (though a full measure of societal benefit may also adjust for any additional environmental impacts).
These benefits for the economy and society can also be compared to direct measures of the user benefits – based on the Step 1 measures of changes in vehicle miles of travel (VMT) and vehicle hours of travel (VHT), with adjustments for cost and delay factors as identified in Step 2.

Montana Highway Reconfiguration Study Final Report
Cambridge Systematics, Inc. 2-21
Step 6. Estimate Costs and Compare to Economic Benefits
HEAT includes a cost estimation model designed to assist planning staff in comparing approximate probable costs to construct various project alternatives. While allowing the flexibility to change roadway widths and typical section thicknesses, the spreadsheet model performs quantity calculations and incorporates them into MDT’s standard cost estimation spreadsheet format utilizing the most common standard bid item numbers. In the future, unit bid prices may be modified to match more current versions of MDT’s average price items catalog or district-specific bid tabulations. A separate maintenance and operating cost worksheet is also included which performs a cost analysis over a 30-year default time period, based on inputs for construction dates and unit operation and maintenance costs.
The cost model requires the user to specify the start and end dates of construction and to allocate costs over this time period. HEAT then applies a discount rate to discount the stream of construction expenditures into a present value. This figure may then be com-pared to a present value of future benefits calculated in Step 5 (above) to generate a bene-fit/cost ratio and net present value (NPV). A detailed description of the methodology, data, parameters, and other technical specifications of this cost model are documented in Appendix A5.
2.5 References
1. Shrank, D., and T. Lomax, “The 2001 Urban Mobility Report,” Texas Transportation Institute (College Station, Texas) (2001).
2. U.S. Department of Labor, Bureau of Labor Statistics, Current Employment Statistics, Average Annual Averages for 2000, http://www.bls.gov/sahome.html.
3. Glaeser, E. L., and J. E. Kohlhase, “Cities, Regions, and the Decline of Transport Costs,” Harvard Institute of Economic Research, Discussion Paper Number 2014, (July 2003).
4. FHWA, Office of Freight Management and Operations, “Freight Benefit/Cost Study, Compilation of the Literature,” (Final Report), Prepared by the AECOM Team (ICF Consulting, HLB Decision Economics, Louis Berger Group) (February 9, 2001).
5. Aschauer, D.A., "Is Public Expenditure Productive?" Journal of Monetary Economics (1989).
6. Munnell, A. H., "Why Has Productivity Growth Declined? Productivity and Public Investment," New England Economic Review, (1990).

Montana Highway Reconfiguration Study Final Report
Cambridge Systematics, Inc. 2-22
7. Nadiri, I., and T. P. Mamuneas, “Contributions of Highway Capital to Industry and National Productivity Growth,” FHWA, Office of Policy Development, Washington, D.C. (September 1996).
8. Khanam, B., “Macroeconomic Performance and Public Highway Infrastructure,” Transport Canada – Economic Analysis (June 1996).
9. Bell, M., and T. McGuire, “Macroeconomic Analysis of the Linkages Between Transportation Investments and Economic Performance,” NCHRP Report 389, Transportation Research Board, National Research Council, (1997).
10. Xin, Y., “Study of Regional Economic Benefit Model of Transportation System Projects,” International Journal of Transport Economics (1996), pp. 89-105.
11. Duffy-Deno, K., and R. W. Eberts, “Public Infrastructure and Regional Economic Development: A Simultaneous Equations Approach,” Journal of Urban Economics (1991), Vol. 30, pp. 329-343.
12. Keeler, T., and J. Ying, “Measuring the Benefit of a Large Public investment – The Case of the U.S. Federal-Aid Highway System,” Journal of Public Economics, Volume 36, (1988), pp. 69-85.
13. Mohring, H., and H. Williamson, Jr., “Scale Economies of Transport Improvements”, Journal of Transport Economics and Policy (September 1969), Vol. 3, No 3.
14. Forkenbrock, D. J., and N. S. J. Foster, “Economic Benefits of a Corridor Highway Investment,” Transpn. Res.-A (1990), Vol. 24A, No. 4, pp. 303-312.
15. Hodge, D. J., G. Weisbrod, and A. Hart, “Do New Highways Attract Businesses?” Case Study for North Country, New York, Transportation Research Record No. 1839 (2003), pp. 150-158.
16. HLB Inc., “Social Cost Pricing and the External Benefits of Trucking,” American Trucking Association Foundation (December 1997).
17. Weisbrod, G., “Guidance on Using Existing Economic Analysis Tools for Evaluating Transportation Investments (Final Report),” NCHRP Report 2-19(2), Transportation Research Board, National Research Council, Hagler Bailly Services, Inc. (October 1999).
18. Weisbrod, G., “Assessing the Economic Impact of Transportation Projects: How to Match the Appropriate Technique to Your Project,” Transportation Research Circular No. 477, Transportation Research Board, National Research Council, Washington D.C. (1997).

Montana Highway Reconfiguration Study Final Report
Cambridge Systematics, Inc. 3-1
3.0 Data Sources and Software
This section describes the data and the commercial software programs imbedded in HEAT. Subsection 3.1 provides an overview of the data sources used in HEAT. Subsection 3.2 describes the GIS Data, including the development of the roadway network and the GIS tool development. Subsection 3.3 describes the commodity flow data and Subsection 3.4 gives a brief overview of the commodity flow forecast methodology. Appendix A2 contains a detailed write-up of the forecasting methodology which has been published by the Transportation Research Board (TRB). Subsection 3.5 gives an overview of the industrial profiles, which are provided in full in Appendix A3.
3.1 Overview of Data Sources
HEAT includes four major types of data and two commercially sold software programs. The data sources are divided into four categories:
1. Geographical Information System (GIS) data repository, network development, and GIS tool development;
2. Commodity flows and commodity forecasts;
3. Industrial profiles; and
4. Economic data (described in Section 2.3).
The two software programs are the ArcGIS platform for network assignment and data manipulation and display, and the REMI dynamic economic impact and forecasting model.
3.2 GIS Data Repository, Network Development, and GIS Tool Development
The consultant team developed a GIS database and a set of GIS-based analytical tools to store and analyze the project’s various sets of data. A GIS environment lends itself to normalizing data from disparate sources by creating a structure from which to store, view, and analyze many kinds of data under one platform. HEAT utilizes spatial data, such as transportation networks, transportation facilities or infrastructure, locations of economic concentrations or points of employment and socioeconomic data related to spatial boundaries, such as census tracts and counties. HEAT also analyzes spatial events or patterns that describe the movement of people and goods across transportation facilities.
Montana Highway Reconfiguration Study Final Report
Cambridge Systematics, Inc. 3-2
The data comes from many sources, both public and private, such as the U.S. Census, the State of Montana, Bureau of Transportation Statistics (BTS), private data collection com-panies such as Reebie, Woods & Poole, and Info USA. Together, these data describe how changes to the physical transportation networks, and the resulting changes to the demand for transportation services affect the economic environment of the State.
HEAT includes a number of tools either in the GIS environment or invoked from the GIS environment that visually orient a user for mapping data and reporting results in a more user-friendly format. These tools add to the understanding of the relationships between transportation supply and economic development by modeling the flows of goods over time and the effects they have on economic activity.
Data Acquisition and Compilation
The first step in HEAT’s modeling process is collecting the proper data and organizing it into useful formats and accessible database compartments. These data consist of:
• Road network data,
• Rail network data,
• Other transportation GIS layers,
• Employment data, and
• Socioeconomic data.
Road Network Data
There are several sources of road network data available in HEAT. MDT has provided a GIS road base map that it maintains and continually updates. This base map has a linear referencing system that can be used on which to map Highway Performance Monitoring System (HPMS) data. Other data sets, such as accident databases and trip count data-bases, have also been mapped to the GIS base map via the linear referencing system. The base map itself does not have attributes describing the level of service or other typical transportation planning information (e.g., number of lanes or capacity). Nevertheless, the HPMS data set does have that type of information and it can be joined to the GIS road base map.
The MDT road base map is probably the most positional-accurate road base map data source publicly available. It is updated via Global Positioning System (GPS) data collec-tion. It is not, however, a data set that can be used for a travel demand model network because its topology is not directly appropriate for model networks. Traditional model networks require what is called link node topology, which requires that the endpoint of a link overlap or be the same point as the nearest endpoint of the next or adjacent link. Model networks do not require exact positional accuracy – or accuracy relative to the actual ground measurements; however, they do require relative accuracy, or accuracy of links with respect to other links in the network. Thus, the MDT GIS base map is actually

Montana Highway Reconfiguration Study Final Report
Cambridge Systematics, Inc. 3-3
more accurate and precise than most modeling networks with respect to ground position. Its link endpoints, however, do not always end up in the right position with respect to other link positions, in effect causing disconnects in the network. These disconnects can only be seen when the base map is zoomed into a very localized area like to the scale of an intersection. In order to be used as a traditional model network, the base map had to be altered, cleaned, and connected.
Another source of road network data is the National Highway Planning Network (NHPN). This is a less detailed road network that was designed for planning and mod-eling purposes. It also has a linear referencing system and is populated with HPMS data. It also has attributes describing physical roadway features, such as number of lanes and capacity. It can be used directly in a transportation model.
HEAT has utilized both sources of road network data. Some analyses require the more detailed MDT base map and some require a fully connected modeling network. The fol-lowing data fields are required for a modeling network:
• Number of lanes,
• Capacity,
• Speed,
• Travel time,
• Distance, and
• Functional classification.
More information about the methodology that was used to develop the road network is in Subsection 2.3.
Rail Network Data
A rail network was assembled from publicly available national sources such as the BTS. HEAT uses the network primarily to provide context to maps and analyses. Freight flows along the rail network are not modeled.
Other Transportation GIS Layers
There are many other GIS layers that are collected, compiled, and integrated into the database for HEAT. HEAT uses these layers primarily for illustrative purposes; to pro-vide context and detail to maps and analyses. The data are all obtained from Federal sources such as BTS, and free, published data from private companies like Greyhound and Amtrak. The GIS database has spatial data on the following types of trip producing nodes:
• Airports, including freight and passenger terminals and facilities;
• Truck terminals;
Montana Highway Reconfiguration Study Final Report
Cambridge Systematics, Inc. 3-4
• Rail freight terminals, including bulk freight and intermodal facilities;
• Major grain elevators (110 shuttle car facilities) and rail connections;
• Border crossing locations; and
• Surface passenger terminals, including intercity bus stops, passenger rail bus stops, and any multimodal passenger terminals that may exist.
Attributes to describe economic activity and capacity at these nodes are also stored in the GIS.
Socioeconomic Data
Census data at the block scale has been collected and stored as attributes in Census block boundaries in the GIS. Census block polygons nest in block group boundaries, tracts, and counties; and these boundaries with more aggregate data will also be stored and utilized in the GIS. HEAT incorporates 2000 Census data describing population, households, and travel patterns (to the extent that it has been released). The data are used in the accessibil-ity analyses. The data is free.
Employment Data
HEAT stores two types of employment data in the GIS database. Establishment-level employment data is stored in a point layer. HEAT includes Info USA addresses for all places of manufacturing, mining, and agriculture employment that employ more than 10 people. These addresses are mapped and stored in the GIS database. Employment data at the Census tract and county level is also stored in the GIS database for accessibility analyses. The cost to obtain the year 2002 Montana Info USA database for this project was approximately $450, which should be similar to the costs to update the data.
HEAT uses employment data in its industrial profiles and some analytical tools to illus-trate the industries that are affected by specific roadway projects and to calculate changes in accessibility that may occur due to roadway projects. In addition, county-level industry employment data from IMPLAN is used as part of the business attraction module to esti-mate industry competitiveness factors.
Data Integration
Once the data was obtained, each layer had to be normalized to the other layers. A pro-jection was chosen for the GIS database and each layer made consistent with this map projection. Metadata will be compiled into a metadata catalog for the project, so that field definitions and source information are readily available. New fields that are created in the analysis process will also be documented in the metadata.

Montana Highway Reconfiguration Study Final Report
Cambridge Systematics, Inc. 3-5
Methodology for Assigning Transportation Flows to Network Links
HEAT describes, quantifies, and models the flows of transportation in the State in order to analyze the effects that transportation projects and improvements have on economic activity. This is done by developing origin-destination trip tables and assigning them to a statewide network. HEAT segments trip tables by two modes – passenger autos and trucks – and then the truck trip tables are further segmented by commodity or industry. Segmentation of the trip table allows us to quantify the number of vehicles on links in the network by type and cargo.
Network Development
The roadway data described above was used to build a network for trip assignment pur-poses. The network was checked and enhanced to ensure that it has the following:
• Full connectivity of links and nodes,
• Centroid connectors, and
• Fields required in the modeling process as listed in the Road Network Data section.
Passenger Trip Table Development
Statewide passenger trip tables do not exist in Montana, nor does the scope of the study include development of a full-fledged passenger model. But in order to estimate passen-ger traffic, a trip table must be estimated and assigned to the network. One way of doing this and the methodology used in this project is to perform an Origin-Destination Matrix Estimation (ODME). ODME is a procedure that estimates a background daily auto trip table. ODME iteratively creates a realistic trip table from a seed probability matrix, based on alternating an equilibrium assignment of the seed matrix and matching estimated vol-umes to observed traffic counts. This section outlines the steps involved in performing the ODME procedure.
5. Create a network, zone system, and centroid connectors:
a. The network is derived from the NHPN and contains functionally-classed roads that are collectors and higher.
b. The zone system is made up of county boundaries in the State (and subcounty regions as required), as well as external stations as needed.
c. The centroids are the geographic center of each county and the external stations.
d. There are one to four centroid connectors per zone to allow for adequate connec-tion to the network. The connections are made to nodes on the lesser classes of the functional class system.

Montana Highway Reconfiguration Study Final Report
Cambridge Systematics, Inc. 3-6
6. Obtain the data necessary for inputs to the ODME procedure:
a. The traffic counts are the average annual daily traffic (AADT) in the HPMS linear referencing database. The counts can be joined in an automatic way to the net-work using the HPMS linear referencing system (LRS). The counts should be dis-tributed evenly throughout the network, and there should be counts at links crossing zone boundaries. The counts may have to be smoothed for consistency as ODME works best with consistent counts. Smoothing the traffic counts ensures that trips are balanced, such that the volume of traffic that enters a highway seg-ment is approximately equal to the volume of traffic leaving that same highway segment – in transportation modeling terms, it is referred to as the “law of the con-servation of cars.”
b. Counts should also be estimated for centroid connectors. This is done so the ODME procedure can allocate trips from the centroids as required, thus, achieving an even assignment. Counts can be estimated for centroid connectors by doing an informal gravity evaluation in TransCAD and assignment of the resulting origin-destination matrix. In order to do this, approximate productions and attractions for three purposes – home-based-work (HBW), home-based-other (HBO), and non-home-based (NHB) – must be calculated based on national rates. The assignment resulting from the gravity evaluation compares total assigned volumes to total counts for all links with HPMS counts. Friction factors in the gravity evaluation can be adjusted, as needed, to match total assigned volumes to total counts. Then the assigned volumes on the centroid connectors are taken and used as counts in the ODME process. Running the gravity evaluation and subsequent assignment is additionally beneficial, because it reveals any network connectivity problems.
c. Estimating trip productions and attractions requires the following traffic analysis zones (TAZ) level data: population, autos, and employment broken down into retail employment and non-retail employment categories.
7. Prepare the network and calculate necessary link attributes:
a. Rid the network of stub links and disconnects.
b. Obtain or calculate the following link attributes:
1) Length – Taken from NHPN database;
2) Functional class – taken from NHPN or HPMS databases;
3) Area type – can be derived from population density of Census block group that link is in;
4) Number of lanes – Use NHPN or HPMS databases;
5) Facility type (one- or two-way) – Taken from NHPN or HPMS databases;

Montana Highway Reconfiguration Study Final Report
Cambridge Systematics, Inc. 3-7
6) Speed – Derived from Speed lookup table (Table 3.1), representing an “average” speed to generate trip tables and not as fully specified as the speed values discussed below and used in the assignment procedure;
7) Capacity – Derived from Capacity lookup table (Table 3.2); and
8) Free flow link time – Calculated from length and speed.
Table 3.1 Speed Lookup Table (Miles Per Hour)
Functional Class*
Area Type 1 2 3 4 5 6 8
1 – CBD** 50 40 40 30 25 25 41
2 – Fringe 50 45 45 35 30 25 41
3 – Urban 55 45 45 35 30 25 31
4 – Suburban 55 50 50 45 40 25 36
5 – Rural 70 60 60 60 60 35 50
Source: Cambridge Systematics, Inc. * Functional classes are 1 = interstate, 2 = expressway, 3 = principal arterial, 4 = minor arterial, 5 =
major collector, 6 = ramps, and 8 = centroid connectors. **CBD is short for central business district.
Table 3.2 Capacity (Vehicles Per Lane Per Hour) Lookup Table
Functional Class* Area Type 1 2 3 4 5 6 8
1 – CBD 1,700 1,280 750 460 400 1,100 9,000
2 – Fringe 2,000 1,280 935 500 500 1,100 9,000
3 – Urban 2,000 1,160 875 615 550 1,100 9,000
4 – Suburban 2,000 1,280 875 750 600 1,100 9,000
5 – Rural 2,000 1,350 955 940 880 1,110 9,000
Source: Cambridge Systematics, Inc. * Hourly capacity = Lane capacity x number of lanes, where functional class 1 = interstate, 2 =
expressway, 3 = principal arterial, 4 = minor arterial, 5 = major collector, 6 = ramps, and 8 = cen-troid connectors.

Montana Highway Reconfiguration Study Final Report
Cambridge Systematics, Inc. 3-8
8. Create the seed matrix input for ODME. A travel time matrix (zone-to-zone skim of free-flow time) is used as the seed input matrix for the ODME procedure. The travel time matrix is the inverse of the relative probabilities of travel to and from zones. It gives the most weight to the zones’ pairs farthest away. This is important, since the resulting trip table from ODME essentially stores the relative probability of a trip between two zones. Using the travel time matrix as a seed matrix makes long-distance trips more probable than short-distance trips and offsets ODME’s propensity to give more weight to the shortest trips. The National Personal Travel Survey (NPTS) may also be consulted to get average trip lengths for long trips between the TAZs – and the seed matrix could be adjusted accordingly. Intrazonals in the seed matrix should be set quite high as the TAZs are large county-sized zones.
9. Run the ODME. The ODME is run with the user equilibrium method constrained by capacity and free flow time. The field storing the counts must be specified.
10. Evaluate the results of the ODME. The results of the ODME procedure are evaluated by assigning the resulting trip table to the network and comparing the assigned vol-umes to the counts on links with HPMS counts. The comparison can be broken down by functional class, area type, and screenline. ODME results should be evaluated so that the network can be improved as necessary, ODME is then rerun, and the results evaluated again. The process is iterative and results in assigned volumes being within 10 percent of actual counts.
Truck Trip Table Development
Freight trip tables were developed from origin-destination (OD) data and a GIS version of the Vehicle Inventory and Usage Survey (VIUS) tool by mode and commodity group.1 The VIUS factors convert annual tonnage into annual trucks. This database provides detailed information on the physical and operational characteristics of the U.S. truck population, based on a mail survey of approximately 154,000 private and commercial truck companies. Individual state and national estimates for physical characteristics include model year, body type, empty weight, truck type, axle arrangement, length, and engine size. Operational characteristics include major use, products carried, annual and lifetime miles, area of operation, miles per gallon, operator classification, and hazardous materials transported.
This database is the only source of comprehensive truck data classified by their physical and operational characteristics that also provides microdata records. A microdata record contains complete information of each sampled record, as well as expansion factors to allow statistically valid information about an entire population to be developed. The microdata records are modified to avoid disclosure of a sampled vehicle or operating company. The survey has been conducted at approximately five-year intervals beginning in 1963. Prior to 1997, the survey included only commercial truck information and was
1 Conducted by the U.S. Bureau of the Census every five years.

Montana Highway Reconfiguration Study Final Report
Cambridge Systematics, Inc. 3-9
known as the Truck Inventory and Usage Survey (TIUS). The survey now includes pri-vate trucks and trucks transporting passengers. For HEAT, only the VIUS records for Montana were used in calculating payload factors.
The VIUS microdata includes the gross vehicle weight rating (GVWR); the empty weight of the vehicle; the average loaded weight of the vehicle; expansion factors based on the miles traveled; the percentage of the miles that the vehicle’s trip falls in one of five differ-ent distance-classes; the percentage of the miles the vehicle is empty; and, when full, the percentage of the miles that the vehicle is used to carry 31 distinct product classes.
There were two classes of vehicles established based on GVWR: 1) medium-heavy duty trucks (GVWR of 14,001 to 33,000 pounds) and 2) heavy-heavy duty trucks (GVWR of 33,001 pounds and more). For medium-heavy duty trucks, average payloads were calcu-lated by two distance-classes established in VIUS: 1) local (less than 50-mile trips) and 2) other trips (over 50-mile trips). For heavy-heavy duty trucks, average payloads were calculated by three VIUS distance-classes: 1) local (less than 50-mile trips); 2) medium (50- to 500-mile trips); and 3) long (over 500-mile trips). The payloads are calculated by distance-class, because the average payloads and truck size varied by distance-class. Shorter-distance trips tend to be dominated by single unit trucks, which carry smaller average payloads. Longer-distance trips are dominated by combination tractor-trailer trucks, which carry larger average payloads.
The product classes used by the VIUS and the two-digit STCC commodity classes estab-lished for TRANSEARCH are similar. The VIUS survey records the percentage of the mileage that a truck is carrying certain products, equipment, materials, etc. “No Load” is treated by VIUS as a separate product category. VIUS also includes buses and service trucks in the survey. Thus, certain VIUS product categories have no correspondence to the STCC commodity classes. A correspondence between the VIUS product classes and the STCC 2-digit commodities was developed. Passenger and service truck product classes (e.g., Craftsmen’s Tools or Household Possessions) not included in the commodity data were excluded.
The weighted annual mileage for each VIUS product carried by distance-class and gross vehicle weight rating was calculated for each record in the Montana VIUS database. That mileage was multiplied by the average payload for that record to obtain the weighted, annual ton-miles by gross vehicle weight rating, product class, and by distance-class for each record. The weighted, annual ton-miles, and the weighted annual miles were summed over all records. The average payload for each commodity by distance-class and weight rating is average annual ton-miles divided by average annual miles.
Calculating payloads by two-digit STCC commodity class is the first step in developing factors to convert tonnage to trucks. This payload does not include the percentage of mileage that a truck travels empty. This percentage of empty mileages by two-digit STCC commodity can also be calculated from the VIUS “No Load” product class. The factor used to covert from annual tonnage to annual trucks accounts for the average payload, including percentage of empty trucks, in each STCC commodity class (values by STCC two-digit and distance-class are given in Table 3.3 below).

Montana Highway Reconfiguration Study Final Report
Cambridge Systematics, Inc. 3-10
Table 3.3 Tons Per Truck by Commodity and Distance Range*
Gross Vehicle Weight Rating (in Pounds) Less than
14,000 14,001-33,000
14,001-33,000 Over 33,000 Over 33,000
Over 33,000
Distance Class STCC Commodity Class
All Distances <50 miles >50 miles <50 miles 50-500 miles >50 Miles
1 Agriculture 1.14 4.16 4.78 15.83 13.92 17.73 8 Forest Products 1.65 1.67 2.75 13.77 16.92 5.64 9 Fish 0.46 3.90 2.56 5.43 13.38 15.95 10 Metallic Ores 0.75 2.81 4.28 18.75 22.22 22.54 11 Coal 0.75 2.81 4.28 18.75 22.22 22.54 13 Crude Petroleum 0.20 3.50 3.13 14.83 17.48 17.32 14 Nonmetallic
Minerals 0.75 2.81 4.28 18.75 22.22 22.54
19 Ordnance 1.52 5.94 5.42 9.43 6.38 17.90 20 Food 0.46 3.90 2.56 5.43 13.38 15.95 21 Tobacco 1.52 4.49 4.91 15.51 14.25 17.49 22 Textiles 0.64 3.82 3.45 12.18 13.03 15.86 23 Apparel 0.64 3.82 3.45 12.18 13.03 15.86 24 Lumber 2.30 2.48 3.40 10.38 13.52 19.87 25 Furniture 0.22 2.03 3.45 12.18 13.03 10.07 26 Paper 0.85 5.20 3.36 12.18 13.03 12.56 27 Printed Goods 0.85 5.20 3.36 12.18 13.03 12.56 28 Chemicals 0.85 3.73 3.45 14.73 10.98 21.07 29 Petroleum 0.20 3.50 3.13 14.83 17.48 17.32 30 Rubber/Plastics 0.43 3.31 5.03 12.47 12.95 17.58 31 Leather 0.64 3.31 5.03 12.47 14.25 17.58 32 Clay, Concrete,
Glass 1.88 2.69 5.11 11.20 16.63 19.70
33 Metal 1.25 3.24 3.60 12.47 14.25 22.64 34 Metal Products 1.25 1.10 5.03 12.47 15.92 18.44 35 Machinery 2.04 3.84 5.77 14.84 16.61 15.94 36 Electrical
Equipment 2.04 3.84 5.77 14.84 16.61 15.94
37 Transportation Equipment
1.25 1.35 5.03 11.18 11.50 13.82
38 Instruments 0.98 4.51 5.03 13.10 15.73 16.23 39 Misc. Mfg
Products 0.75 5.87 4.89 12.70 8.05 17.89
46 Misc. Mixed Shipments
1.52 5.94 5.42 9.43 6.38 17.90
Sources: Vehicle Inventory and Usage Survey (VIUS) (1) and Cambridge Systematics, Inc. * Includes empty miles.
After the conversion of annual tons to annual trucks, the resulting annual truck trip table is converted into a daily truck trip table. The Highway Capacity Manual (2) suggests that

Montana Highway Reconfiguration Study Final Report
Cambridge Systematics, Inc. 3-11
an average truck working week consists of five weekdays at full capacity and two weekend days at 44 percent of capacity. This equates to 306 truck working days per year. In addition, there are six Federal holidays that should be excluded from working day calculations. The annual truck trips are divided by 300 average weighted truck working days to calculate daily truck trips (recognizing that although trucks do move 365 days a year on the highway, an average number of working days is approximately 300).
Assignment Procedure Methodology
A GIS-based assignment procedure assigns the trip tables to the network. The link-based assignment results are stored as attributes on links. The assignment procedure is an all-or-nothing procedure, but is sensitive to congested travel times stored as a function of volume-to-capacity ratios on links.
The assignment procedure works directly from the GIS, which makes it user-friendly, and is used to test highway projects. When HEAT tests the benefits of potential roadway improvement projects, the user codes the project(s) into the network and the trip tables are reassigned. Results of each scenario assignment are compared to the base case (i.e., no-project) assignment done on the network, which represents present day existing highway conditions with forecasted traffic volumes. Benefits of these test scenarios are determined, based on travel time, travel distance, and accessibility improvements. HEAT analyzes and maps the scenarios’ effects on the Montana economy.
It should be noted, that absent congestion, the only types of improvements that will pro-vide savings in VMT and vehicle hours traveled (VHT) are enhancements to design speed, new roads (which have shorter distance between significant origins and destinations), and enhancements that promote the functional classification of the roadway. For this reason, estimating an accurate change in average speed between an existing roadway and the improved version is critical to the amount of direct benefit generated by proposed high-way improvements. This estimation procedure is described in the next section.
Speed Estimation Methodology
HEAT includes a speed module that was developed under the guidelines of the 2000 Highway Capacity Manual (HCM 2000). The speeds resulting from the speed model are free-flow speeds that are not constrained by congestion. They are used as inputs to the HEAT’s assignment module. Subsequent modules calculate benefits based on congested speed. The speed model does not reflect actual or observed speed. Nevertheless, the speeds are meant to be accurate with respect to each other and have proper relative impact on the system based on functional class with adjustments determined by seven other variables.

Montana Highway Reconfiguration Study Final Report
Cambridge Systematics, Inc. 3-12
The speed module in HEAT determines the average speed on each roadway segment using the seven following variables:
1. Functional class;
2. Area type (rural vs. urban);
3. Terrain (level, rolling, mountainous);
4. Pavement (paved vs. unpaved);
5. Lanes;
6. Access type (divided vs. undivided); and
7. Two-lane type (pre-World War II, Normal, Improved, Super 2).
Functional class plays the largest role in the speed module. Each functional class has an upper bound below which the speed is constrained. Depending on the values of the seven other variables, the speed is then adjusted down or up by functional class-specific mar-ginal values (estimated from HCM 2000). The resulting speed is compared to a functional class-specific lower bound. If the resulting speed is less than the lower speed, it is replaced by the lower bound speed.
Tables 3.4 to 3.10 present the parameters (i.e., values) used for each of the seven variables in the speed module. Table 3.4 shows the upper and lower speed bounds for each functional class.
Table 3.4 Speed Boundaries by Roadway Functional Class
Functional Class High
Speed Low
Speed 1. Rural Interstate 75 45
2. Rural Principal Arterial 65 35
6. Rural Minor Arterial 55 30
7. Rural Major Collector 50 30
11. Urban Interstate 68 40
12. Urban Freeway/Expressway 55 30
14. Urban Principal Arterial 40 25
16. Urban Minor Arterial 40 25
Source: Highway Capacity Manual (HCM 2000), FHWA, 2000.
The parameters for the specific area type adjustments by functional class are shown in Table 3.5.

Montana Highway Reconfiguration Study Final Report
Cambridge Systematics, Inc. 3-13
Table 3.5 Speed Boundaries by Functional Class and Area Type
Functional Class Rural Urban 1. Rural Interstate 0 -2.5
2. Rural Principal Arterial 0 -5
6. Rural Minor Arterial 0 -5
7. Rural Major Collector 0 -5
11. Urban Interstate 0 0
12. Urban Freeway/Expressway 0 0
14. Urban Principal Arterial 0 0
16. Urban Minor Arterial 0 0
Source: Highway Capacity Manual (HCM 2000), FHWA, 2000.
The adjustments for the three types of terrain (i.e., level, rolling, and mountainous) by functional class are shown in Table 3.6.
Table 3.6 Speed Boundaries by Functional Class and Terrain
Functional Class Level Rolling Mountainous 1. Rural Interstate 0 -1.5 -4.5
2. Rural Principal Arterial 0 -2.4 -3.2
6. Rural Minor Arterial 0 -2.4 -3.2
7. Rural Major Collector 0 -2.4 -3.2
11. Urban Interstate 0 -1.5 -4.5
12. Urban Freeway/Expressway 0 -2.4 -3.2
14. Urban Principal Arterial 0 -2.4 -3.2
16. Urban Minor Arterial 0 -2.4 -3.2
Source: Highway Capacity Manual, FHWA, 2000.
The adjustments for the two types of roadway surface (i.e., paved and unpaved) by func-tional class are shown in Table 3.7.

Montana Highway Reconfiguration Study Final Report
Cambridge Systematics, Inc. 3-14
Table 3.7 Speed Boundaries by Functional Class and Roadway Surface
Functional Class Paved Unpaved 1. Rural Interstate 0 -15
2. Rural Principal Arterial 0 -15
6. Rural Minor Arterial 0 -5
7. Rural Major Collector 0 -5
11. Urban Interstate 0 -15
12. Urban Freeway/Expressway 0 -15
14. Urban Principal Arterial 0 -5
16. Urban Minor Arterial 0 -5
Source: Highway Capacity Manual (HCM 2000), FHWA, 2000.
The adjustments for the number of lanes (i.e., two-, four, and six-lane) by functional class are shown in Table 3.8.
Table 3.8 Speed Boundaries by Functional Class and Number of Lanes
Functional Class 2-Lanes 4-Lanes 6-Lanes 8-Lanes 1. Rural Interstate -3 0 0 0
2. Rural Principal Arterial -3 0 0 0
6. Rural Minor Arterial -3 0 0 0
7. Rural Major Collector -3 0 0 0
11. Urban Interstate -2.7 0 0 0
12. Urban Freeway/Expressway -2.7 0 0 0
14. Urban Principal Arterial -2.7 0 0 0
16. Urban Minor Arterial -2.7 0 0 0
Source: Highway Capacity Manual, FHWA, 2000.
The adjustments for the two access types (i.e., divided and undivided) by functional class are shown in Table 3.9.
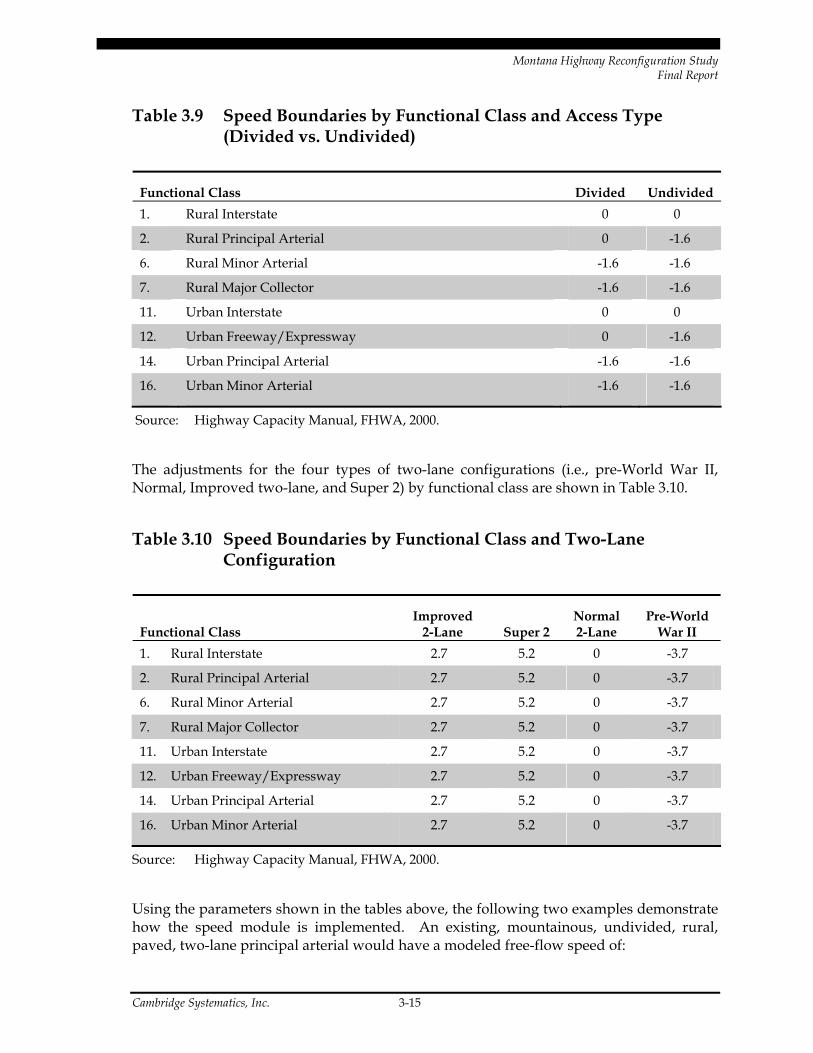
Montana Highway Reconfiguration Study Final Report
Cambridge Systematics, Inc. 3-15
Table 3.9 Speed Boundaries by Functional Class and Access Type (Divided vs. Undivided)
Functional Class Divided Undivided 1. Rural Interstate 0 0
2. Rural Principal Arterial 0 -1.6
6. Rural Minor Arterial -1.6 -1.6
7. Rural Major Collector -1.6 -1.6
11. Urban Interstate 0 0
12. Urban Freeway/Expressway 0 -1.6
14. Urban Principal Arterial -1.6 -1.6
16. Urban Minor Arterial -1.6 -1.6
Source: Highway Capacity Manual, FHWA, 2000.
The adjustments for the four types of two-lane configurations (i.e., pre-World War II, Normal, Improved two-lane, and Super 2) by functional class are shown in Table 3.10.
Table 3.10 Speed Boundaries by Functional Class and Two-Lane Configuration
Functional Class Improved
2-Lane Super 2 Normal 2-Lane
Pre-World War II
1. Rural Interstate 2.7 5.2 0 -3.7
2. Rural Principal Arterial 2.7 5.2 0 -3.7
6. Rural Minor Arterial 2.7 5.2 0 -3.7
7. Rural Major Collector 2.7 5.2 0 -3.7
11. Urban Interstate 2.7 5.2 0 -3.7
12. Urban Freeway/Expressway 2.7 5.2 0 -3.7
14. Urban Principal Arterial 2.7 5.2 0 -3.7
16. Urban Minor Arterial 2.7 5.2 0 -3.7
Source: Highway Capacity Manual, FHWA, 2000.
Using the parameters shown in the tables above, the following two examples demonstrate how the speed module is implemented. An existing, mountainous, undivided, rural, paved, two-lane principal arterial would have a modeled free-flow speed of:

Montana Highway Reconfiguration Study Final Report
Cambridge Systematics, Inc. 3-16
65 miles per hour (mph) for a rural principal arterial (high boundary) + 0 mph adjustment for rural - 3.2 mph adjustment for mountainous - 0 mph adjustment for paved - 3 mph adjustment for 2-lanes - 1.6 mph adjustment for undivided - 0 mph adjustment for not being a Super 2 - 0 mph adjustment for not being an Improved 2 = 57.2 mph.
If it were upgraded to a mountainous, divided, rural, paved, Super 2 lane, principal arte-rial it would have a modeled free-flow speed of:
65 miles per hour (mph) for a rural principal arterial (high boundary) + 0 mph adjustment for rural - 3.2 mph adjustment for mountainous - 0 mph adjustment for paved - 3 mph adjustment for 2-lanes - 0 mph adjustment for divided + 5.2 mph adjustment for being a Super 2 = 64.0 mph.
The current roadway network database accessed by the speed module does not contain the year of construction for each segment or what design standards were adhered to in its construction. Thus, the module does not have, at present, any means of distinguishing between speeds on unimproved two-lane roads that were constructed prior to World War II (WWII) (before modern design standards were applied) and after. While it does allow a user to manually override the speed parameters, such adjustments to selected segments within a larger network may create distortions that could generate spurious results. Possible refinements could include lowering the speed for all unimproved two-lane roads statewide, based on the approximate mix of unimproved two-lane roads con-structed after WWII. A more accurate but time consuming solution would assign a new variable to each existing unimproved two-lane road segment, indicating if is built according to pre-WWII design standards and add it to the speed model as a constraint.
Post-Processing Tools
HEAT has the capability to add other GIS-based analytical tools or give access to interme-diate data and analysis that the model produces, but does not display in its current ver-sion. This additional capability may be added as users and stakeholders gain more knowledge of HEAT’s basic functionality. Examples of additional functionality include addressing the following types of questions:
• What are the population characteristics that are affected by the potential roadway project?
• What are the origins and destinations of the vehicles affected by the projects?

Montana Highway Reconfiguration Study Final Report
Cambridge Systematics, Inc. 3-17
• To what extent does the project benefit the affected population(s) or industries and how are the benefits measured?
• To what extent does the project attract new industries, and how are these benefits measured?
• Which commodities are affected by the project and what are their value and volume?
3.3 Commodity Flow Data
Brief Description of Overall Approach
Commodity flow data has been purchased from Reebie Associates as the starting point in the development of the commodity flow database. The consultant team has supple-mented and verified Reebie data using several additional data sources, including data on non-manufactured goods transported by trucks available from state regulatory and monitoring agencies. For agricultural goods, county-level crop and livestock production were developed from data available through the U.S. Department of Agriculture National Agricultural Statistical Service. Additional data sources, such as the Commodity Flow Survey (CFS) and IMPLAN data have been used to verify commodity flow data on manu-factured goods. The 1997 Economic Census Data on Wholesale Trade were used to disag-gregate the secondary flows (flows from distribution centers and warehouses) into specific commodities in the commodity flow database.
Forecasts of the commodity flow database were created using a combination of Woods & Poole industry growth projections at the county level, and statewide commodity forecasts from FHWA’s Freight Analysis Framework (FAF). The consultant team used the FAF data to estimate the percentage growth for each commodity and allocated the growth to the county-level based on the Woods & Poole employment projections to determine flows in future years.
List and Descriptions of Data Elements
The consultant team purchased calendar year 2001 TRANSEARCH data from Reebie Associates for use in HEAT. The study area is the State of Montana and the database has county-to-county commodity flows with two-digit Standard Transportation Commodity Classification (STCC) detail for the truck mode. For each county in Montana, the database contains records for truck flows moving into, out of, or through the county. Origins and destinations outside of Montana are assigned to five external regions to enable routing onto major highways and interstates, which helps in capturing the impact of through-trips on Montana’s roadways. Regions external to Montana are divided into five geographies based on the five main interstates into and out of the State. Non-interstate highway trips

Montana Highway Reconfiguration Study Final Report
Cambridge Systematics, Inc. 3-18
with external origins and/or destinations are allocated to external regions based on the nearest grouping listed below. Currently, the geographies are divided into:
1. Western Canada – Everything west of Manitoba Province. This represents truck traf-fic on I-15 north of Montana and includes non-interstate highway trips on parallel roadways.
2. Northwest U.S. – Northern Idaho, Washington, Oregon. This represents truck traffic on I-90 west of Montana and includes non-interstate highway trips on parallel roadways.
3. Western U.S. – Southern Idaho, California, Nevada, Utah, Arizona. This represents truck traffic on I-15 south of Montana and includes non-interstate highway trips on parallel roadways.
4. North Central U.S. – North Dakota, Minnesota, Eastern Canada. This represents truck traffic on I-94 east of Montana and includes non-interstate highway trips on parallel roadways.
5. Rest of U.S. – All other states in the contiguous U.S. not mentioned in four other regions. This represents truck traffic on I-90 south of Montana and includes non-interstate highway trips on parallel roadways.
The final commodity flow database includes goods transported by truck and specified for three submodes: private trucks, less-than-truckload trucks, and truckload trucks. Data are reported in tonnage based on the STCC code system at the two-digit level. Truck data also include information on secondary flows, the truck portion of intermodal flows, and the truck portion of barge-truck flows. Data are stored in Microsoft Access format. These data can be updated on an annual basis. Based on the robustness of the model and the estimated accuracy of the commodity flow data, however, a more efficient update cycle is likely to be closer to five years. Select data with high variability, such as air cargo, may need to be updated annually (see Section 6.3, HEAT Maintenance). The forecast data are also available on an annual basis. These data should also be updated on a cycle closer to five years.
Comparison with Alternate Methodologies
The other major source of commodity flow data is the CFS produced by the BTS. This survey, however, is problematic for use in Montana for many reasons. First, data are available only for the entire State rather than on a county basis. Also, the commodity definition is limited for certain modes due to a lack of statistical significance based on the survey sample size. Additionally, identifying a process for updating a commodity flow database derived from CFS data is not possible, because the survey is undergoing major changes in the 2002 version, including a reduction in the amount of surveys taken and possibly a supply chain based survey process.
Montana Highway Reconfiguration Study Final Report
Cambridge Systematics, Inc. 3-19
3.4 Commodity Flow Forecast
Overview of Methodology
HEAT calculates the benefits and costs of highway investments once the roadway improvement has been completed and businesses, shippers, receivers, carriers, residents, and other economic players have had sufficient time to adapt to the improved roadway. This adjustment process requires modeling the impacts in the future. HEAT is currently set to project impacts out to year 2025. In order to make these projections, the current commodity flows described in Section 3.3 must be forecast out to year 2025.
The consultant team used an enhanced forecasting technique that takes into account the relative growth rates of different industries at the county level, as compared to simply applying state-level commodity forecasts to all county-level flows. The state-to-state commodity flow forecasts make use of the recent FHWA Freight Analysis Framework (FAF). The FAF growth rates can effectively be applied to county-to-county base year commodity flow data to make it possible to develop commodity flow trip tables for sketch-planning freight forecasting models like HEAT. Furthermore, the approach used in the HEAT commodity flow forecast enhance this methodology with employment fore-cast information at the county level and the embedded input-output tables. This improved the forecasting capabilities in HEAT significantly to capture variations in county-level commodity growth rates.2
Internal and Outbound Truck Trips
The enhanced forecasting methodology uses county-level economic and demographic data to geographically allocate future year tonnages estimated from the FAF data to each of the counties. Forecasted growth in tons statewide is estimated for each commodity using the percentage growth in the FAF data. The forecasted growth in tons is used as control totals for the geographic allocation procedure. For the Montana freight forecast, the estimated state-level growth was allocated to counties using county-level employment and population data.
Employment data was obtained from Woods & Poole and are summarized for each county in Montana by 13 industry categories from 1970 to 2025. For each county in the
2 The forecast of passenger/auto trips onto the network applied the FHWA Freight Analysis
Framework (FAF) forecasts for autos and non-freight trucks. The growth in these forecasts was constant for all non-freight (autos and trucks) for all of Montana, approximately 1.8 percent per year. Although it is recognized that regions within Montana – and thus non-freight traffic – are growing at different rates, this uniform growth assumption provides a baseline projection, which could be altered for sensitivity testing. Furthermore, the impact of this assumption is small, given the absence of significant intercity non-freight traffic congestion over the next 10 to 20 years.

Montana Highway Reconfiguration Study Final Report
Cambridge Systematics, Inc. 3-20
State, the change in employment for each industry over the study period was calculated. There are far fewer industry categories in the Woods & Poole employment data relative to the two-digit STCC codes in the commodity flow tables. Therefore, a conversion table was created to match each of the commodities in the truck trip table to one of the 13 industry categories in the employment data. The conversion table was created based on the pri-mary commodities produced by each of the industries. Applying this conversion table to the existing employment data resulted in a distribution of employment for each commod-ity across each county.
The distribution of employment for each commodity across each county is then used to distribute the forecasted tons of each commodity to each county. A conceptual example of this process is shown in Table 3.11. The 300 tons of growth in outbound production of STCC A are distributed to each county, based on the distribution of employment in STCC A. The process is performed separately for outbound and internal trips.
Table 3.11 Calculation of Future Outbound Flows with Enhanced Forecast – Conceptual Example
County
Change from 2001 to 2025
Employment for STCC A
STCC A Employment Distribution
Allocation of Statewide FAF
Growth for STCC A1
Base Year (2001) Tons for STCC
A
Future Year (2025)
Forecast for STCC A
1 40 20% 60 200 260
2 100 50% 150 600 750
3 60 30% 90 50 140
4 0 0% 0 150 150
Totals 200 100% 300 1,000 1,300
Source: Cambridge Systematics, Inc. 1 Use 300 tons of total statewide growth for allocation, equal to the calculated conceptual statewide
FAF total.
It should be noted that the mechanics of this forecast process occasionally produce nega-tive forecast tons for cases when the growth in a commodity is negative. In this case, a correction was applied to set the lowest negative forecast to zero, and proportionally adjust all of the positive flows for that commodity (for either internal or outbound trips). This eliminated any negative commodity flow forecasts, and ensured that the growth in tonnage was consistent with the control totals in the statewide FAF data.

Montana Highway Reconfiguration Study Final Report
Cambridge Systematics, Inc. 3-21
Inbound Truck Trips
For commodity trips coming into Montana, a modified methodology was applied to take into account the fact that the inbound goods are consumed in the State rather than pro-duced in the State. A particular commodity is often consumed by multiple industries and sometimes by individual consumers. As noted above, for internal and outbound flows, each commodity was matched to a single producing industry. For inbound flows, for each commodity, the distribution of this commodity to its consuming industries (and personal consumption) must be created. Therefore, the first step in the forecast process for inbound flows is to determine what share of an inbound commodity is consumed by each of the consuming industries and by personal consumption. These consumption shares can be calculated using IMPLAN economic input-output (I/O) data.
In Montana, a one-digit industry I/O table was used to develop the distribution for each commodity. For each commodity, there is a matching consuming industry and consump-tion percentage. For example, if 20 percent of all STCC 1 inbound flows are consumed by the Agriculture Industry, then this percentage will be used to convert the total inbound commodity flows.
After allocating each commodity to consuming industries, the distribution of each inbound commodity to each county was calculated based on county-level employment data similar to the internal and outbound procedure described in the previous section. The commodities assigned to personal consumption were allocated to counties based on the relative growth in population from each county based on Woods & Poole population forecasts. The Woods & Poole population data came in the same format as the employ-ment data, for consecutive years between 1970 and 2025, where 2001 and 2025 data were used to determine growth rates.
Appendix A2 contains a detailed description of this methodology, including a comparison between the enhanced method used here and a simplified methodology more commonly used.
3.5 Industrial Profiles
As part of the Highway Reconfiguration Study, the consultant team prepared industrial profiles which incorporated standard data analysis and industry surveying. The indus-trial profiles report three types of background information: 1) industry trends, 2) non-transportation local advantages and disadvantages, and 3) transportation access or mobility issues. The preparation followed a three-step procedure:
1. The consultants selected major industries present in Montana that could be expected to benefit in some way from improved transportation based on the two-digit Standard Industrial Classification (SIC) codes and minimum thresholds on size (measured in output and employment). The industrial profiles focused on industries that are part of

Montana Highway Reconfiguration Study Final Report
Cambridge Systematics, Inc. 3-22
Montana’s economic base (i.e., those that tend to export goods and/or services outside the State). This selection process netted industries accounting for 16 percent of Montana’s employment and output.
2. The consultant team performed extensive research on each industry’s competitive position in the global, national, multi-state regional, and state level; and included these findings in each industry profile.
3. Consultant team members were assigned individual industry groups and economic development regions throughout the State and conducted face-to-face and telephone interviews with business leaders, lead agency personnel, and other economic stake-holders to synthesize the strengths, weaknesses, opportunities and threats to each industry, considering both transportation and non-transportation factors.
The resulting industrial profiles were used to provide guidance regarding the business attraction model and its parameters, and are also available to users of HEAT through the user interface for industry trend context while performing an economic impact evaluation of a highway improvement.
Industry Identification
The consultant team used in-state employment and number of firms according to the two-digit SIC to determine which Montana industries should be profiled. The consultant team sought the review and advice of the RSSC, MDT, and the economic development agencies throughout the State of Montana. On the final selection, the consensus was to limit the list to the industries listed in Table 3.12. This ranking scheme identified 13 preliminary major industry groups, and was subsequently supplemented by a profile of the military industry in Montana.
Some additional industries were dropped, such as printing and publishing (which does include some large companies in Montana), because their sales were limited to major urban areas and not dependent on out-of-state roadway transportation. The list of poten-tial, smaller industries included the following with the approximate number of establish-ments in parenthesizes:
• Chemicals (42),
• Rubber/plastics (30),
• Printing/publishing (253),
• Paper products (5),
• Leather products (17), and
• Apparel/textiles (53).

Montana Highway Reconfiguration Study Final Report
Cambridge Systematics, Inc. 3-23
Table 3.12 Major Industry Groups in Montana
Industry Groups Output in Millions Employment
Number of Firms
Mining (coal, metal, and non-metal) $800 3,700 56
Oil (petroleum products and extraction) $191 1,561 78-84
Food processing $818 2,654 162
Industrial machinery $368 2,018 46
Lumber/wood products (include forestry) $1,417 8,991 ~154
Fabricated metal products $92 1,023 130
High-tech products (electrical/electronic equip. and instruments)
$9 863 ~96
Furniture manufacturing $69 815 84
Primary metals products $263 1,107 26
Farming (livestock and grain); $2,365 32,112 n/a
Stone, glass & clay products $218 1,306 90
Transportation equipment $110 581 33
Tourism $1,767 57,741 n/a
Source: IMPLAN 1998 and 2000 (3), except tourism, which is from ICF Consulting.
Industry Trends and Competitive Analysis
Before conducting its fieldwork, the consultant team researched each industry group based on available economic analysis literature and databases. The result was a set of lay-ered trend analyses which helped interview teams understand the context of each busi-ness interviewed. The three-layered trends analysis consisted of:
1. National and global trends – Recent historical data (at least five years, but longer if necessary) on geographical concentration of production/activity, including historical or current shifts, reasons for this concentration with other not easily quantifiable industry trends highlighted (i.e., competition, trading patterns, location of significant suppliers and markets (customers)).
2. State/regional trends – These include size of industry (i.e., employment, output, and share of national/global market), recent performance, etc. and location of primary suppliers and markets. It also includes employment by sub-industry if appropriate, average wages, location quotients, and regional concentrations.
Montana Highway Reconfiguration Study Final Report
Cambridge Systematics, Inc. 3-24
3. Montana firms – This analysis determined what percentage specific firms’ account for the total industry in Montana and identified which firms are more successful relative to the global, national, and state/regional trends.
Using a combination of interviews, literature, and statistics, the consultant team profiled the local (non-transportation) advantages and disadvantages for each industry group. These determinations addressed why the industry located in Montana and the benefits of their location. This effort also identified other types of economic development invest-ments, initiatives, and programs that are needed to improve the industry in the State (i.e., collateral activities). This information was usually verified with economic development authorities.
Finally (and most important), the consultant team evaluated each industry’s transporta-tion access/mobility issues. This analysis included:
• What are the primary modes used by the industry to transport goods (inbound and outbound shipments)? Are the industry’s transportation costs higher than the U.S. average?
• Assessments of the transportation access issues/problems facing the industry, including multimodal and intermodal, and border crossing issues.
• Determining what transportation improvements would benefit the industry. While the focus of the Reconfiguration Study is on highways, it was deemed useful and important to identify other transportation infrastructure that would be most critical to an industry or would be needed in addition to highway improvements in order to realize the benefits assumed with the highway investments (e.g., airports, rail, inter-modal, cross-boarder or regulatory changes, etc.).
• Describing the business owner’s expectations and the consultant’s conclusions regarding the degree to which improved highway(s) would improve the competitive-ness of the industry and potentially lead to business relocations.
Data Gathering
The profiles in general, and the structured interviews in particular, helped identify local and regional concerns and expectations related to highway improvement and its impact on business expansion, attraction, and development. General topics covered in the interviews include:
• Access to customers, suppliers, and workers;
• Business impacts of proposed or potential highway improvements;
• Factors influencing business location decisions;
• Strengths and weaknesses of the highway corridor as a place to do business;

Montana Highway Reconfiguration Study Final Report
Cambridge Systematics, Inc. 3-25
• Major trends in the regional economy;
• Factors contributing to or impeding business growth;
• Related economic development programs (collateral activities);
• Characteristics of the regional tourism market and its reliance on the highway corridor for tourist trips; and
• Marketing and outreach efforts.
Prior to the actual interviews, the consultant team members prepared an interview guide that emphasizes topics, such as industry mix, transportation investment programs, collat-eral economic development activities, socioeconomic trends, etc. This guide (which varied depending on the audience) was then used to document each industry’s current condi-tion, outlook, and dependence on transportation. HEAT contains a profile for each of these industries.
The first interviews were with local economic development and tourism experts. These economic development officials provided an important perspective concerning:
• The region’s degree of success in retaining, expanding, and attracting business;
• Factors enhancing or constraining economic development success, especially how non-transportation activities could be coupled to – or used in lieu of – transportation investments to facilitate economic growth;
• The relative importance of transportation infrastructure/access for Montana firms; and
• The sources of any business attraction (i.e., whether gains in the study region are offset by losses in other regions), and industries that regions of Montana are targeting for growth opportunities.
The industrial profiles document the critical points from the interviews of economic development officials, and were then used to set up personal or telephone interviews with business representatives. Business owners are in the best position to determine the rela-tive role of transportation and other factors in affecting their business expansion, contrac-tion, or location decisions. Interviews with business owners provided information on the role of transportation, among other factors, regarding:
• Business ratings of the regional factors constraining or enhancing their continuation and expansion opportunities;
• The extent of reliance on roadways and other transportation services for labor access, supplier access, or customer deliveries;
• Transportation needs or deficiencies (if any) in Montana that constrain economic opportunities; and

Montana Highway Reconfiguration Study Final Report
Cambridge Systematics, Inc. 3-26
• The non-transportation constraints that would need to be resolved to allow transporta-tion investments to provide the maximum benefit.
Summary of Findings
On the whole, business leaders were less likely to claim that new transportation invest-ments were critical to their growth when they face larger impediments. They may acknowledge that the likely success of transportation investments to spur development will also depend on enabling collateral activities, such as private investment and business attraction. Many industries felt that highways are generally strong and sufficient for their needs, but limitations tend to be based on: 1) distance to markets; 2) labor force quality and quantity; and 3) other non-highway factors such as global market competition, scale economies, lack of rail competition, etc. Nevertheless, there are some instances of high-way deficiencies that could improve economic opportunities.
The complete industry profiles are contained in Appendix A3. The following summaries provide a brief synopsis of the potential transportation constraints to each industry group. The context for these findings is provided in the full profile for each industry.
Mining (Coal, Metal, and Non-Metal)
Interviews with mining firms suggest that transportation is generally not an impediment to industry growth in the State. The future prospects of the mining industry are largely determined by world mineral prices and the development of new resources. Mining industry sub-sectors, however, vary considerably in their use of transportation services. Most important coal mines have direct access to rail transportation and ship all mined coal by rail, although a few smaller mines use trucks to move coal to rail terminals. According to the 1997 Commodity Flow Survey, 99 percent of coal shipments originating in the State move by rail. Interviews with coal mining industry executives suggest that the cost and reliability of rail transportation is an important transportation issue for the industry (4). Some in the industry believe that the lack of competition causes high prices for rail services.
Precious metals firms often ship product by expedited delivery service (such as FedEx). Input supplies are frequently brought in by truck. Some Montana firms believe that they pay higher freight rates than their out-of-state competitors, and this price differential is due in part to the fact that they are more distant from their suppliers. Industry executives also note that their freight rates often include a transportation fuel surcharge, assessing them an additional fee for the cost of fuel in Montana and the low density of freight traffic in the area. Montana metals mining firms suggest that the inability of workers to get to work sites during bad weather can have significant effects on the cost of doing business.

Montana Highway Reconfiguration Study Final Report
Cambridge Systematics, Inc. 3-27
Oil (Petroleum Products and Extraction)
Interviews suggest that most Montana firms regard the transportation system as currently serving their needs well. All output of the industry is moved by pipeline, and transporta-tion is not viewed as a major impediment to the ability of the industry to grow. The most important factor affecting industry prospects is the price of oil and gas in world markets. Potential for industry growth in the near term appears robust as uncertainty in the Middle East and OPEC supply curtailment has increased world prices.
Highway transportation is most important to the industry for the movement of small quantities of input supplies, such as pipes or drilling equipment. It also affects the costs of deploying teams into the field. A significant amount of this travel occurs on private prop-erty or on local roads in remote areas.
Food Processing
Interviews with Montana firms suggest that freight costs in the State often hinder access to markets and supplies. Several firms report that transportation costs account for as much as 25 percent of total production costs. This compares to the national industry average of only 2.6 percent, as reported in the Transportation Satellite Accounts. Montana firms also report paying more than out-of-state competitors for transportation.
All firms interviewed noted that improvements to the transportation infrastructure, espe-cially roadways, would support business expansion. Lower freight rates would improve market and supplier access as well as enhance competitiveness. One firm noted that it would like to expand its markets in the eastern U.S., but that the lack of freight carriers going east resulted in prohibitively high freight rates. If freight rates were lowered, it would pursue expansion plans in this region.
Montana food manufacturers feel that there is potential for development of backward and forward linked industries. One firm noted that improvements in regional access would not only support development of related industries, but would also support general growth of industries in the region, which could lead to lower transportation costs as more companies could share the cost of freight.
Industrial Machinery
Nationally, transportation costs in the industrial machinery sector are not significant, averaging just 2.0 percent of all production costs, which ranks it 41st of the 58 manufacturing and mining sectors for which data are collected.3 Two factors, though, appear to make transportation costs more important for Montana’s firms. First, the importance of export sales, both to the state and national industries, might be a particular disadvantage for firms in Montana, where transport costs associated with exporting are
3 Based on data from the U.S. Transportation Satellite Accounts.

Montana Highway Reconfiguration Study Final Report
Cambridge Systematics, Inc. 3-28
particularly high because of costs incurred in getting products to port. The high volume of sales to European Union countries underscores the distance and logistics issues facing Montana’s firms, but also suggests that they have been able to address some of these successfully.
Second, the decline in demand from traditional local customers (e.g., mining firms) forces Montana’s firms to transport products long distances even when they are destined for the domestic market. Thus, it appears that relative to other industrial machinery manufactur-ers, Montana’s firms face a more dispersed and geographically remote customer base, a factor that increases the importance of transportation costs. The largest transportation challenges facing these firms appear to be tied to fixed costs in the form of issues such as intermodal changes, securing return freight on out-going products, arranging over-sized loads, and finding trucking services. Thus, while industry informants tend to think that highway infrastructure is good, many report problems in accessing highway services.
Lumber/Wood Products (Including Forestry)
Industry informants in this sector report that supplies for companies (primarily logs) arrive almost exclusively by truck. One company does report using rail as a back-up transportation mode, but estimates that only 10 percent of logs come by rail. The heavy reliance on trucks is due to the location of forests and logging activity, which tend to be away from rail sources. The cost of transporting supplies was not apparent to the inter-viewees, because such costs are included in the log costs quoted by suppliers. For out-going products, both truck and rail are used. These range from a truck to rail split of 65 versus 35 percent to 20 versus 80 percent. In the latter case, however, the firm is located near two rail stations, so its reliance on rail might not be typical of firms in Montana.
The cyclical nature of the business causes other problems with transportation: in the spring and summer, when industry activity is at its highest, it is difficult to obtain rail cars, especially the types needed to move lumber products, and local “jobbers” who move product in and out can be hard to find. The latter problem is especially acute for product going to customers in remote areas; in these cases, it is difficult for truckers to secure return freight, thus making them reluctant to accept out-going jobs. Because of these problems, firms can experience delays of one to three weeks in securing the necessary transportation services, thus making it difficult to get on-time deliveries.
Highways are of critical importance to the wood products industry, especially for in-coming supplies of logs. Because of the nature of wood supplies, which are fixed by the location of loggable forests, new supply channels are difficult to develop; and the logistics associated with obtaining and transporting logs make trucks the most cost-effective means of transport. Even firms with ready access to rail and high dependence on rail for ship-ping finished products use highways almost exclusively for bringing in supplies. Given the nature of the industry, this is unlikely to ever change.

Montana Highway Reconfiguration Study Final Report
Cambridge Systematics, Inc. 3-29
Fabricated Metal Products
Transportation plays a significant role in determining the competitiveness and market area of the fabricated metals manufacturing industry. All of the firms interviewed cite transportation as a significant factor in competition. Montana firms report that transportation-related costs and lack of proximity to their customers sometimes prevent them from winning work. Nonetheless, most of the major Montana firms have a signifi-cant portion of out-of-state business.
Most Montana firms in this industry believe they are generally well served by the road-way infrastructure available to them. A number of interviewees suggested that widening major highways would lower their transportation costs. Transportation costs (and freight shipping rates) are perceived to be higher in the State due to the low density of freight traffic and problems associated with moving oversized loads. Still, firms interviewed expect to grow significantly in the near future, consistent with the increases in employ-ment over the last decade.
High-Tech Products (Electrical/Electronic Equipment and Instruments)
Computer and electronics firms report having few local suppliers, largely because of the specialized nature of the inputs they use. Supplies are often brought in by parcel. High-tech firms report that on a piece basis, 80 to100 percent of supplies are delivered by parcel service. Informants report that distance from suppliers does not cause problems with speed or timeliness of deliveries – “overnight is overnight wherever you’re located” – and one informant noted that because of short lead times in his sector, his firm would rely on overnight deliveries wherever the company is situated. Another firm, however, did note that although on a piece basis his firm receives 80 to 90 percent of supplies by parcel, on a weight basis, freight makes up a greater portion because it is used for heavy items like steel, motors, and heavy plastics (1). 4
The reliance on parcel services in Montana makes it difficult for informants at high-tech firms to estimate whether and how highway improvements would affect transportation costs. They recognize that the economic geography of Montana likely results in higher parcel rates than in high-tech areas like Chicago, California, Seattle, or Massachusetts: as one informant noted, “FedEx and UPS drivers pick up as much freight in 10 minutes in Seattle as they do in an hour in Montana.” Informants also note, however, that while highway improvements might have a direct effect on the rates charged by smaller, local couriers, it is not clear whether or how they would affect the rates charged by the major couriers (e.g., UPS, FedEx) on which they rely.
4 Dependence on parcel service appears to be a common phenomenon in this and related sectors in
Montana: in 1997 (the most recent year for which data are available), 81 percent of shipments by Montana’s precision instrument firms were shipped by parcel, compared to just 48 percent nationally.

Montana Highway Reconfiguration Study Final Report
Cambridge Systematics, Inc. 3-30
One informant emphasized that the importance of highways for his firm lies in their role in transporting workers, not goods. This company, a contract manufacturer in electronics, has tried to stay competitive by focusing on customer service. As such, if workers have difficulty getting to the plant, it can undermine the high levels of service the firm needs to provide. Many of the roads on which the workers travel are unpaved arterial roads maintained by the county, so inclement weather can have a large effect on employee turn-out. Compounding this issue is the role of wages in the company’s competitive strategy: although the company benefits from low wage rates in the area, many of its production workers (who start at minimum wage) often cannot afford reliable transportation.
Montana’s agglomeration of hi-tech industries is small, and with the exception of Semitool, is composed of small and scattered businesses. The infrastructure of parcel delivery services, such as UPS and FedEx, in part mitigates Montana’s competitive disadvantage of long distances. It appears, therefore, that roadway infrastructure in Montana will be a critical factor in the State’s success or failure to build high-tech indus-tries from its current base.
Furniture Manufacturing
Our interviews establish that supplies for the furniture industry, which include wood products, hardware, and various materials (e.g., vinyl) for companies (primarily logs) arrive by truck. Some of these goods are carried on suppliers’ trucks; some by LTL (less-than-truckload) carriers; some by parcel service (e.g., UPS, FedEx); and other by local contract carriers. The heavy reliance on trucks is due to the nature of the supplies – some, like wood products, are large and bulky; others, like some hardware, is small enough to ship by parcel – and cost considerations. Companies report only minor problems with transportation of in-coming goods.
For outgoing products, primarily truck, but also air was reported as being used. The absence of rail transport can be explained by a range of factors – in one case, an informant at a producer of specialty medical tables reported that rail was the preferred transport mode, especially for exports. His company had access to rail in the past, but the station was closed. Without direct access to rail or water, the company has to go through an extra step rather than ship directly overseas by loading containers onto rail, a process that raises transportation costs on exports to two to three times what their competitors in California pay. In other cases, informants report that cost and speed advantages – especially with large, bulky items common in the furniture sector – make truck the preferred method. One firm sends about 25 percent of its products by air. In this case, air is used to send lar-ger products (small products are sent by FedEx ground), which costs “about $500 a pop,” but ensures that goods get to their destination intact.
Some firms reported outsourcing trucking functions to a variety of carriers. Other firms, though, keep trucking functions in-house. One of these firms is a specialty producer of cabinet products for large, often public installations, such as stadiums, schools, and court houses. Most of their work is outside Montana, concentrated in urban areas in Colorado. This informant cited a number of reasons for keeping trucking in-house. First, as a small firm ($5 million to $6 million in annual sales), the company is not so large that a small per-
Montana Highway Reconfiguration Study Final Report
Cambridge Systematics, Inc. 3-31
centage savings on transportation would generate significant cost savings. According to this informant, “saving two percent on millions [in transport costs]” results in large sav-ings, but for this firm, transport costs are not a “big deal.” Second, keeping trucking in-house improves reliability and service: if a project required it, the firm could be unloading a truck in Denver tomorrow morning. Third, outsourcing would mean greater reliance on LTL carriers and as noted above, concerns were voiced about the service and quality pro-vided by these carriers.
In general, informants did not attribute high transportation costs to highway conditions or availability. Rather, all attributed high transportation costs to the long distances that sup-plies and final goods have to travel. In one case, in fact, an informant suggested that improvements in highway infrastructure had hurt his firm’s business by making large retailers, like Costco, accessible to greater portions of the Montana population, which has decimated the small retail stores his company has historically served. One informant at a firm with a national customer base said that his firm is in the process of setting up mini-warehouses across the U.S. in order to reduce transportation costs. Such warehouses, he suggested, will allow his firm to re-distribute products from central warehouses, thus, alleviating the need to ship every order from Montana, which will bring down delivery costs. One informant did suggest that access to rails would improve his company’s posi-tion, especially in export markets, by allowing the firm to load containers in Montana and shipping these to port by rail.
Taken together, state, national, and international trends paint a picture of an industry increasingly threatened at the low-end by rising imports, advances in ready-to-assemble furniture, and the reconfiguring of the retail sector towards large chains that sell these types of products. These trends suggest that production-related costs, especially labor and transportation costs, which are nationwide are high relative to other manufacturing sectors, will become increasingly important vectors of competition. While firms in Montana report that their geographic position (rather than quality or availability of high-ways) creates high transportation costs, geographic isolation has also slowed the influx of the large retailers that challenge small, local producers. Together, these factors suggest that improvement in highway infrastructure could have two distinct effects: while it would improve the competitive position of high-end firms that export, it might also fur-ther undermine small, low-end producers that currently serve local, usually rural, markets.
Primary Metals Products
Interviews with Montana firms suggest that transportation infrastructure is not a major impediment to growth in the primary metals manufacturing industry. Industry execu-tives feel that the firms generally have adequate access to highway transportation and are satisfied with the quality of their trucking service. For the major smelters, growth in the industry is constrained primarily by two non-transportation factors One is the expansion of capacity in world production (mostly in China), which puts downward pressure on the price of aluminum. The second factor is upward pressure on production costs because of electricity prices.

Montana Highway Reconfiguration Study Final Report
Cambridge Systematics, Inc. 3-32
Some Montana firms in the primary metals manufacturing industry have noted that they pay more for transportation services than out-of-state competitors. For instance, Columbia Falls Aluminum notes that a competitor in the Ohio River Basin pays $4.50 per ton to move a product from Point Comfort Texas to the Ohio River Basin by barge. Moving the same product by rail to Montana costs $70 per ton. Indeed, the quality and price of rail service was sited as a major concern by some shippers. Without significant competition, BNSF has implemented a variety of user charges and raised rates. Columbia Falls Aluminum Company feels that some new rail charges are unjustified and may con-test them.
Art casting firms typically receive and ship all products by truck. These included inbound supplies such as metals, foam packing, and molding materials, and outbound finished statues shipped to galleries around the world. These firms often ship by parcel delivery such as UPS. One firm noted that UPS allows them to ship or receive products anywhere within two days, which is adequate for their needs. Although none of their shipments have ever been late, they maintain buffers of critical supplies as an insurance policy.
Interviews with these smaller firms suggest that they are pleased with their transportation service, and do not see transportation infrastructure as an impediment to growth. The biggest limitation on growth in the art casting business is the overall health of the econ-omy, which determines the demand for art.
Farming (Livestock and Grain)
Some Montana agriculture firms (though not all) believe their transportation costs to be higher than out-of-state competitors and prohibit accesses to markets. A grower of spe-cialized high-value crops reports the following freight rates as prohibiting competitive access to out-of-state markets:
• Less than 200 miles, freight rate is 10 percent of total purchase price;
• Over 200 miles, freight rate is 12 percent of total purchase price; and
• Over 400 miles, freight rate is 15 percent of total purchase price.
This firm also notes the expense of receiving supplies into Montana because of the lack of direct routes. Often, supplies that arrive from Canada and California are delayed at a cross-docking station in Billings.
Livestock producers report that freight costs are comparable with out-of-state competitors. But one firm has noted that it is cheaper to ship to ranches in Kansas (approximately $2.20 per loaded mile) than to ranches in Montana ($2.50 per loaded mile). These costs may deprive the State of value-adding processing facilities. Another livestock producer typi-cally ships to North Dakota for processing because comparable facilities in Montana are lacking. Still another Montana firm reports benefiting from subsidized transportation rates, which result in relatively lower freight rates compared to its out-of-state competitors.

Montana Highway Reconfiguration Study Final Report
Cambridge Systematics, Inc. 3-33
Interviews with Montana firms suggest that the State’s two-lane highways can increase delivery time, driver hours, and thus total transportation costs for some agricultural shipments. Some firms believe that limited north-south road access presents challenges for accessing markets within Montana (for example between Bozeman and Kalispell) as well as out-of-state markets in Idaho.
Some Montana firms believe that transportation improvements would support business expansion. One firm reports that the cost of freight is preventing the firm from expanding into potentially lucrative Western U.S. markets where demand already exists for its prod-ucts. Factoring in freight costs as high as 17 percent of total purchase price, the firm can-not compete with Washington and Oregon companies that pay 15 percent of total purchase price for freight. Given most products are perishable, rail is not an option for this Montana firm. As such, the firm may have to redirect its expansion strategy, focusing more on a localized Montana market.
At least one Montana firm believes that the distances in accessing Montana markets, com-bined with current limited transportation infrastructure, helps to protect Montana-based firms from out-of-state competitors. Nevertheless, the same firm also commented that improved transportation infrastructure would improve hauling products between farms and processing plants and lower transportation costs.
A livestock producer reports that freight costs are not an impediment to business expan-sion or prohibitive to current operations. This firm is currently paying approximately five percent of its gross sales value of animals towards transportation costs. The firm cites limitations to growth as being tied more to land price and land availability than transpor-tation issues.
Stone, Glass and Clay Products
Transportation costs can be traced, in part, to the industry’s heavy consumption of coal, which is shipped by rail. One informant estimated that half of the total cost of coal (about $11 per ton) is attributable to the cost of transporting coal. Most of these costs can be attributed to high rail rates on the portion of Montana’s rail system run by national rail companies which, in this case, charge 60 percent more than regional rail service for an equivalent distance. This informant noted that for coal shipments, truck is becoming almost as competitive as rail: if his firm could guarantee a backload on coal shipments, it would cost about $13 per ton to ship coal by truck.5 It is hard to find backhaul loads from the coal strips, though, and with no back haul, trucking costs for coal are likely $17 to $18 per ton. Other informants note that the use of multiple rail systems adds costs, as the firm must pay each time product is shifted from one system to another (e.g., from Burlington National to Montana Rail Link). One informant suggested that Canadian competitors
5 Normally a “backload” is the load transported by a trucking company that fills a truck returning
from a delivery destination.

Montana Highway Reconfiguration Study Final Report
Cambridge Systematics, Inc. 3-34
might be at an advantage because of better and more competitive rail and that his firm is exploring bringing coal in from Canada for this reason.
With the exception of coal, however, most of the major supplies in the SCG industry are brought in by truck. This accords with the transportation patterns of firms nationally, which use trucks to meet 92 percent of transportation needs6. For some firms, production is co-located with mining activities, which can greatly reduce transportation costs of these products. However, one informant noted that his plant was intentionally established in the “middle of nowhere,” in an unpopulated area two miles from the plant’s quarry. After the firm built a road from the plant to the quarry, however, other development came and traffic between the two spots has slowed considerably. There is now consideration of setting up a rotary on the road, a project the firm supports – although rotaries tend to slow down traffic, they also keep traffic moving, which is more important.
Out-going product is shipped by both rail and truck. One firm, whose customers are located almost exclusively in Montana, reports that all product (ready-mix cement and asphalt) is shipped by truck and that the firm handles most of the trucking internally. Other producers of Portland cement, which sell to ready-mix operations and have cus-tomer bases that expand beyond state borders, report using a 50:50 mix of rail and truck and note that when trucks are used, customers often provide the trucks and pick up prod-uct at the plant. One informant noted that the choice between rail and truck is based on price and that rail can be cheaper, especially for longer distances. An informant at a min-eral producer supported this claim, noting that unlike trucks, rail costs are not mileage based, which makes rail more competitive when distances are greater than 500 or 600 miles.
Informants were more critical of rail service than highway conditions, citing a number of specific problems: low levels of competition in rail; high prices charged by national rail-ways; cost of intra-shipment goods transfer between railway carriers (e.g., MRL and BN). Informants generally emphasized the importance of transportation costs as a competitive factor in this industry. In one case, the informant noted that transportation costs were especially important because his competitors generally operate more efficient, higher-volume plants, which puts his firm at a cost disadvantage.
Cement and concrete, which dominate Montana’s SCG sector, are good examples of local-serving industries: the nature of the product, which is very high weight and low value added, means that local demand is most easily met by local suppliers. This appears also to be the case in Montana’s industry, which is almost wholly dependent on sales within the State. Given the proximity of Canadian markets and competitors, however, transpor-tation costs within Montana could affect import and export patterns of cement and con-crete, and some informants believe that Canadian competitors benefit from more competitive rail service, a factor that could be offset by lower highway or rail transport costs. One factor that affects the costs of using highways is difficulty in securing return freight for trucks, an issue that also affects other sectors in Montana. The largest impact of 6 U.S. Transportation Satellite Accounts.

Montana Highway Reconfiguration Study Final Report
Cambridge Systematics, Inc. 3-35
highway construction on the SCG sector, though, might be direct: highway and other infrastructure spending is an important source of demand for local firms.
Transportation Equipment
Key destinations for Montana products include ports of Houston and Tacoma; car dealers located between Illinois and the West Coast; and large core markets, such as Denver, Oklahoma City, St. Louis, Minneapolis-St. Paul, Chicago, and Salt Lake City. Supplies flowing to Montana companies include steel, new, and used axles, aluminum sheeting, wheels, suspensions, and tanker valves. Locations of suppliers are concentrated in the Southeast and industrial Midwest, but supplies are also brought in from sites across the U.S., and rest of the world.
Core suppliers for the industry and much of the customer base are located east of the Mississippi River. In addition, reaching international customers requires access to ship-ping ports. Montana-based companies pay more than out-of-state competitors that are located in the industrial Midwest and Mid-Atlantic states, or closer to ports, or where there is more competition among freight companies. A significant segment of this indus-try, however, includes providing service to customers. In this respect, Montana provides a locational advantage for servicing western customers (identified as an under-served market). Montana-based companies are also located within a concentration of mining and agriculture industries, which benefits heavy trailer manufacturers.
Tourism
Most nonresident visitors use road travel to access destinations within Montana. Approximately one-fifth of nonresident visitors to Montana fly on some portion of their trip, with 43 percent renting a car in Montana and 12 percent renting a car in Utah or Wyoming. Amtrak provides rail transit service across the State, running the Empire Builder train daily from Chicago to Seattle along the Hi-line parallel to U.S. Highway 2. Amtrak ridership declined substantially between 1998 and 2001, with boarding and dis-embarkments falling by almost 15 percent. Nonetheless, some communities along the Hi-Line are developing local tourism strategies based on Amtrak service.
In the Yellowstone National Park region, firms have noted that the narrowness and poor conditions of some two-lane highways can create problems for tourists trying to access destinations. In the Custer region, tourism businesses have noted the poor (gravel) state of highways and the lack of north-south connectivity. Some in the industry feel that paving specific roads in that region would have a major economic impact by improving accessibility to the region’s destinations, as well as promoting growth in other industries. In the Missoula region, industry contacts have suggested that the road infrastructure is not an impediment to tourism growth, although north-south connectivity is felt to be inadequate. All Montana’s tourism regions recognize air travel as an important mode for visitors. Finally, the lack of air traffic in the Missoula region has been cited as an impedi-ment to tourism growth there.
Montana Highway Reconfiguration Study Final Report
Cambridge Systematics, Inc. 3-36
Military Activity
Transportation impediments reported by the military in Montana include:
• Low overpasses on secondary roads, which at times impede hauling heavy equipment.
• Congestion caused by farm implements on roadways. The farming vehicles are diffi-cult to pass with semi-tractor trailers.
• The winter roadway conditions of Highway 2 cause safety concerns.
• Gravel roads in central Montana are a safety concern when transporting heavy equipment.
• U.S. routes (not Interstates) and state highways are important arteries for the National Guard, but can be dangerous when using large vehicles. These roadways include Routes 93, 200, 87, and 2.
National defense policies and geography appear more important than roadways in Montana in terms of influencing location decisions of the United States military in the State. However, it is clear that civilian roadways play a critical role in allowing the Air Force and Montana Air and Army National Guards to efficiently accomplish their mis-sions. In this respect, transportation costs were never mentioned as an important issue, but safety and congestion were reported to be significant issues.
3.6 Reference
1. “1997 Vehicle Inventory and Use Survey (VIUS): Montana,” Bureau of the Census.
2. Federal Highway Administration, “Highway Capacity Manual 2000 (HCM 2000),” (2000).
3. Minnesota IMPLAN Group, Inc., (MIG), http://www.IMPLAN.com (1998, 2000).
4. “1997 Commodity Flow Survey: Montana,” Department of Transportation (Bureau of Transportation Statistics) and Department of Census (December 1999).

Montana Highway Reconfiguration Study Final Report
Cambridge Systematics, Inc. 4-1
4.0 Results
The first of three subsections summarizes the general conditions under which HEAT would be more likely to provide a useful analysis. These general criteria may be helpful to project stakeholders who are uncertain if their project has significant potential for fos-tering economic development. This section goes on to summarize the results from the application of HEAT to specific roadway improvements. The purpose of this was two-fold: First, it was intended as a direct test of HEAT. As described in Subsection 4.2, the scenario testing helped the consultant team and MDT determine the accuracy of the ana-lytical process, the degree of automation and need for manual or exogenous analysis and data manipulation. Second, the economic impact analysis provides guidance to MDT and other stakeholders regarding the long-term economic benefits of a few proposed highway improvement scenarios. In Subsection 4.3, results from four scenario tests using HEAT are presented. These four are:
1. U.S. Highway 93 from Missoula to Polson;
2. U.S. Highway 2 from the North Dakota Stateline to the Idaho Stateline;
3. MT 3 from Great Falls to Billings; and
4. Secondary 323 (S-323) from South of Ekalaka to Alzada.
The RSSC selected these four improvement scenarios in part because they varied in length, cost, location, and amount of traffic affected.
4.1 Overall Findings
Montana’s transportation network provides a critical foundation to the State’s economy. The strategic decisions made by the State concerning transportation priorities and invest-ments will have a bearing on the State’s future prosperity. Businesses rely on the speed and reliability of the transportation system to ensure that supply streams are uninter-rupted and finished products are delivered to customers in a timely fashion. Transporta-tion provides access to scenery and sites that attract visitors from around the world. As part of their travel experience, tourists expect safe and well-marked routes that allow them to reach their destinations without spending inordinate amounts of time. Strategic investments in Montana’s highway network represent a key tool in the State’s efforts to better meet economic development goals.
Although the economic importance of the transportation system and transportation investments may seem inherently obvious, the quantification of these effects is complex.
Montana Highway Reconfiguration Study Final Report
Cambridge Systematics, Inc. 4-2
Until now, obtaining objective and quantitative findings has required stand-alone or one-off analyses that most agencies can only justify for large and politically controversial pro-jects. HEAT offers MDT access to sophisticated and quantitative analysis tools to estimate the potential economic benefits of transportation improvements without contending with all the delay, cost, and complexity of such stand-alone analysis.
While the most reliable findings of this study will be the results from iterative applications of HEAT to real proposals for transportation investment, this section of the report pro-vides some general findings that may help MDT staff, the Transportation Commission, and stakeholders in MDT’s investment decisions understand the general conditions under which roadway investments may generate significant economic benefits. While this list could include dozens of conditions, the following list summarizes the primary conditions where highway investments are likely to generate measurable economic growth:
1. High volumes of travel – Multi-lane highways and existing two-lane highways where current or projected traffic volumes are sufficient to require additional lanes and a sig-nificant percentage of the traffic is composed of on-the-clock travel, especially trucks carrying high-value commodities.
2. Opportunity for diversion – Roadway improvements that provide a faster or more reliable route between two or more large nodes of economic activity, thus, diverting from a slower route, can provide travelers with significant time savings or make the time of their trip more predictable.
3. Connecting centers of trade – Roadway improvements that provide a faster or more reliable service between trade centers (defined as having large population, employ-ment, industry diversity, property valuation, retail and service activity, and wholesale trade).
4. Access to labor – Roadway improvements that provide employers access to more potential employees enables firms to recruit from a larger and more diverse pool of labor. This condition is most often found in highly congested urban areas or suburban areas where the high cost of housing has forced many workers to live some distance from major employment clusters.
5. Access to manufacturing centers – Roadway improvements that provide a faster or more reliable route between manufacturing centers where companies need access to raw materials or sub-assembles and must ship their output to customers.
6. Access of agricultural centers to markets – Improving the speed and/or reliability of highway segments that connect areas of agricultural production (especially high value crops) with customers and more competitive transshipment points (rail heads of com-peting railroads, barge loading facilities, air freight terminals for high value and per-ishable crops).
7. Access between raw materials and value-added manufacturing – Roadway improve-ments that provide a faster or more reliable route between mines, forests or pulp mills, saw mills, or other facilities that produce semi-processed raw material and manufac-
Montana Highway Reconfiguration Study Final Report
Cambridge Systematics, Inc. 4-3
turing centers that utilize these inputs for fished goods such as food processing, fur-niture making, and machine fabrication.
8. Access to tourist activity – Highway segments that improve service between major airports or population centers and recreation and tourism centers that include outlets for tourist spending such as restaurants, lodging, campgrounds, seasonal dwellings, marina berths and harbors, ski resorts, fishing, etc.
This list is by no means complete and it provides only the general conditions where high-way improvements are likely to foster economic development. Furthermore, the potential economic benefits derived from improving transportation are likely to be limited without other non-transportation interventions, as transportation is often considered to be a tool to enhance and promote economic development.
4.2 Results from Scenario Testing
As a necessary step in testing the HEAT software, the Reconfiguration Study Steering Committee requested that the consultants perform a number of economic benefit/cost evaluations of actual proposals for roadway improvements. The HEAT methodology includes a number of linked analysis modules focused on capturing the full range of eco-nomic benefits stemming from highway improvements. There are seven primary analysis modules within HEAT:
1. Travel network model – Highway improvements are coded into the travel network model to assess the driving conditions for autos and trucks (further separated into non-freight trucks and commodity-based trucks), generating indicators such as traffic volume and speeds.
2. User benefits – Based on the results of the travel network model, user benefits (travel time savings, operating costs, and safety) are estimated in monetary terms due to highway improvements (compared to the No-Build scenario).
3. Value of time – The value of time is varied depending on the type of highway trip and the commodity being shipped. The value of time for auto trips is assumed to be $13.25 per hour based on recent data from the Texas Transportation Institute. Values of time for truck trips vary by commodity from $38 to $66 per hour for higher value goods.
4. Business attraction – Upgraded highway facilities have the potential to lead to busi-ness attraction, especially to the extent that faster travel times increase market accessibility.
5. Tourism – Improved highways also can generate additional visitation, either through increased pass-by traffic (diversion of trips to an improved road), or by making key destinations more accessible.

Montana Highway Reconfiguration Study Final Report
Cambridge Systematics, Inc. 4-4
6. Economic impacts – User benefits, business attraction, and tourism are all considered to be direct economic effects, which can be input into an economic simulation model to estimate the full economic impacts of a highway improvement on the Montana economy.1
7. Cost estimation – Based on factors such as roadway miles and upgrade specifications, a cost module developed for HEAT from MDT’s bid prices estimates both initial capi-tal costs and ongoing maintenance and lifecycle costs.
8. Benefit/cost analysis – To ensure that economic benefits from highway improvements are placed in the proper context, a benefit/cost analysis is conducted. Benefits include gross state product (GSP) gains for Montana businesses (from the economic impact analysis), as well as personal auto user benefits for Montana citizens (not included in the economic impact analysis).
The results of the scenario testing and those from the eventual application of HEAT to real projects are based on the premise of ceteris paribus, where the HEAT analysis measures the economic effects of improving conditions on a single corridor, while holding conditions throughout the larger transportation system constant. Thus, the results reflect an improb-able situation where only a single corridor – or just a section of a corridor – is being improved, while all the other highway in the State are assumed to remain as they are. This type of analysis isolates the effects of each improvement being studied. In reality, MDT is undertaking numerous improvement projects across the State simultaneously, and these may bolster or diminish the benefits from the improvement being evaluated. In practical terms, this means that the results from HEAT are most useful as a means of com-paring one improvement to another (i.e., measurements of relative benefits) and less reli-able as predictions of the future. The only way to be sure the HEAT results reflect reality would be go back in time and re-run history with a different improvement scenario and compare the results.
MDT selected four such improvement scenarios which varied in length, cost, location, and amount of traffic affected. These four are:
1. U.S. Highway 93 from Missoula to Polson;
2. U.S. Highway 2 from the North Dakota Stateline to the Idaho Stateline;
3. MT 3 from Great Falls to Billings; and
4. Secondary 323 (S-323) from South of Ekalaka to Alzada.
The results of four possible roadway improvement projects are summarized below.
1 HEAT uses a five-region economic impact simulation model leased from Regional Economic
Models, Inc. (REMI).

Montana Highway Reconfiguration Study Final Report
Cambridge Systematics, Inc. 4-5
4.3 Findings for Specific Roadway Improvements
U.S. Highway 93 from Missoula to Polson
HEAT analyzed the economic benefits and costs of MDT’s proposed highway investment scenario for approximately 59 miles of U.S. 93 from Missoula to Polson, including some sections of the existing traveled way that are not in MDT’s future construction program. This summary also includes a brief overview of the key modeling assumptions. (Figure 4.1).
Figure 4.1 Existing and Improved Scenario for Highway U.S. 93
22
Evaro
Ravalli
St. Ignatious
Ronan
Pablo
Polson
Missoula
Arlee
14 miles
9 miles
8 miles
4 miles
11.2 miles1
4 miles
4.5 miles
MT 35
MT 200
I-90
2 miles
4 Lane Divided
4 Lane Undivided
2 Lane Undivided1
2 Lane Improved
Super 2
Evaro
Arlee
Ravalli
St. Ignatious
Ronan
Pablo
Polson
14 miles
11 miles
8 miles
4 miles
11.2 miles
4 miles
4.5 miles
Missoula
MT 35
MT 200
I-90
Existing Conditions Improved Conditions
1 This 11.2-mile section between St. Ignatius and Ronan is being assessed through a supplemental environ-
mental impact statement (SEIS). Although the SEIS is not complete, the improvements proposed in the pre-ferred alternative would include passing lanes and other amenities that would enhance the roadway’s performance compared to the improvement scenario shown here, thus generating additional benefits.
Source: Cambridge Systematics, Inc.
This test involved calculating the economic impact and benefit/cost analysis for one improvement scenario compared to the base case conditions under a no-project scenario. Whenever conducting an impact analysis, it is important to have a clear definition of the No-Build highway scenario. In this case, it is simply an extension of existing highway infrastructure conditions into the future (i.e., same number of lanes and width of shoul-ders). The highway travel network projects future travel for the year 2025, based on

Montana Highway Reconfiguration Study Final Report
Cambridge Systematics, Inc. 4-6
existing conditions; and determines the travel speed, cost, and safety characteristics of U.S. 93 and all other Montana highways.
No-Build Base Case
The No-Build base case constitutes the existing conditions of U.S. 93 from Missoula to Polson. MDT’s proposed improvements begin in Evaro (about 14 miles north of Missoula) and continue to Polson on what is primarily a two-lane roadway. This segment is approximately 48 miles, and has been designated for improvement detailed in a memo-randum of agreement (MOA) between the MDT, the Salish and Kootenai Tribes, and the FHWA. In this no-build base case, these existing highway conditions are assumed to remain the same for future travel for the year 2025.
Improved Scenario
The main characteristics of the U.S. 93 improvement scenario are captured in the Safety and Operations Report of the MOA, and for analysis within HEAT were grouped into three categories:
1. Just over 29 miles of improved two-lane highway. An improved two-lane highway is defined by expanding the width of roadway from 30 to 40 feet, essentially creating significantly wider shoulders. The improved two-lane configuration is assumed to allow for slightly higher travel speeds than the existing two-lane given the wider roadway surface. This level of improvement may understate the speed and safety benefits if the preferred alternative in the supplemental environmental impact statement (SEIS) is implemented. This alternative includes passing lanes and other amenities that would enhance performance compared to the improvements assumed here.
2. About 7.5 miles of Super 2 roadway that includes two types of improvements to increase safety and travel speed. Wider roadway surface (30 to 40 feet) and frequent northbound and southbound passing lanes.
3. Roughly 11 miles of four-lane divided highway to assist in freeing highway capacity in the most heavily traveled sections of U.S. 93, in particular the segment from Ronan to Polson.
Summary of Results
The U.S. 93 highway improvement scenario produces a benefit/cost ratio of 1.2 and a net present value (NPV) of $14.2 million. The primary reasons why this improvement sce-nario produces positive net benefits is the relatively high volume of truck and auto traffic affected (producing significant user benefits) and the relatively modest costs associated with a combination of improvements on this 48-mile highway segment. This highway investment is expected to produce 120 additional jobs, $9 million additional gross state product (GSP), and $6 million in personal income in the year 2025.

Montana Highway Reconfiguration Study Final Report
Cambridge Systematics, Inc. 4-7
Key Modeling Assumptions for the U.S. 93 Alternative Analysis
Origin-destination patterns – The analysis was careful to assess the origin-destination (O-D) patterns of trips on U.S. 93 to allocate user benefits to Montana and non-Montana regions. It is estimated that about 81 percent of truck and auto trip benefits remain within Montana, with the remainder representing pass-through traffic, such as long-haul truck trips.
Tourism impacts – Given the lack of readily available data and uncertain causal linkages between the U.S. 93 improvements and increased tourism for the State of Montana, this analysis did not incorporate potential tourism impacts. In this sense, the analysis is con-servative – if given more time to analyze the improvements and interview local tourism experts, it is likely that these improvements would stimulate additional visitation to Montana (especially to Flathead County).
Discount rate and period of analysis – Consistent with MDT guidance, HEAT used a four percent discount rate. The time period for the benefit/cost analysis is 30 years from com-pletion of the initial construction, and includes one significant overlay in addition to nor-mal operating and maintenance costs.
Ceteris Paribus – This analysis measures the economic effects of improving conditions on the U.S. 93 corridor, while holding conditions throughout the larger transportation system constant. In reality, MDT will undertake numerous improvement projects across the State, and these may bolster or diminish the benefits from the improvements along U.S. 93.
Economic Impacts and Benefit/Cost Analysis
User benefits – For the forecast year of 2025, there are an estimated $4.3 million of user benefits for truck trips and $2.8 million for auto trips. About 16 percent of auto trip bene-fits are assumed to accrue to business travelers (i.e., on-the-clock). Though there are more individual auto trips on U.S. 93, the higher values of time result in larger truck benefits.
Business attraction – Despite helping connect two of Montana’s largest, growing cities (Missoula and Kalispell), the accessibility analysis for the U.S. 93 improvements are fairly modest and only expected to be experienced by a few western counties. This results in a modest estimate of business attraction of roughly 20 direct jobs in the Kalispell and Missoula areas.
Economic impacts – For this improvement scenario, in the forecast year of 2025, there will be an estimated 120 additional jobs in Montana due to roadway improvements, along with approximately $9 million additional GSP and $6 million in real personal income. These results are from the REMI economic impact model, with user benefits and business attraction as the inputs (user benefits are input as business cost savings and contribute most of the total economic effect in this scenario). See Figure 4.2 for the economic impacts by MDT district.

Montana Highway Reconfiguration Study Final Report
Cambridge Systematics, Inc. 4-8
Costs – Costs for the 48 miles of improved roadway are estimated to be $125 million and require roughly three years to construct (from 2004 through 2006, opening in 2007). In present value terms, this cost is approximately $115 million in 2004 dollars. In addition, maintenance and operations are expected to cost almost $16 million in present value terms (discounted over the 25 years following construction), including the cost of a thin overlay about 13 years after the improved highway opens (year 2018). About 88 percent of this cost is for the initial construction. The construction estimates are based on the most recent bonded projects, and the operations and maintenance costs are driven by the most recent bid prices for highway maintenance available, with validation from MDT’s existing pro-ject cost information. Full details of the unit costs and other assumptions are embedded in the HEAT cost module. Documentation for this module is in Appendix A5.
Benefit/cost analysis – The estimated benefit/cost ratio for the improved scenario is 1.2. The NPV is $14 million. This ratio does not include benefits from tourism, which were omitted until reliable data could be obtained. Such benefits, assuming the cost estimates remain the same, would push the benefit/cost ratio higher. Nevertheless, these findings show a benefit/cost ratio in excess of 1.0 and, thus, are indicative of a project that will return higher benefits to the State as a whole than it will cost to construct and maintain.
Figure 4.2 U.S. 93 Scenario – Improved Conditions (Benefits in Millions of Dollars by 2025)
Missoula
Butte-Silver Bow
BozemanBillings
Helena
Great Falls
HavreKalispellDistrict 1
JobsJobs 9999GRPGRP $7.6$7.6
District 3JobsJobs 88GRPGRP $0.5$0.5
District 4JobsJobs 11GRPGRP $0.0$0.0
District 2JobsJobs 99GRPGRP $0.5$0.5
District 5JobsJobs 44GRPGRP $0.3$0.3
Source: Cambridge Systematics, Inc.
This evaluation did not include comprehensive sensitivity testing. Sensitivity analysis could test the outcomes of using different discount rates, phasing of construction, and tourism impacts.

Montana Highway Reconfiguration Study Final Report
Cambridge Systematics, Inc. 4-9
U.S. Highway 2 Widening
HEAT was used to conduct an economic impact analysis of highway investment scenarios for the full length of U.S. 2 in Montana. This test involved calculating the economic impacts and benefit/cost analysis for two improvement scenarios compared to the base case conditions under a no project scenario.
• No-project base case – For these scenarios, the No-Build base case constitutes an extension of existing highway infrastructure conditions into the future for the entire border-to-border highway segment of U.S. 2. This segment is 666 miles from North Dakota to Idaho, with approximately 613 miles currently two lanes, 13 miles of three-lane roadway, and 40 miles of highway segments with four lanes. The highway travel network projects future travel for the year 2025, based on existing conditions; and determines the travel speed, cost, and safety characteristics of U.S. 2 and all other Montana highways. According to the travel model, the average impedance speed for the No-Build along the entire U.S. 2 highway segment is 56.4 miles per hour.
• The Super 2 scenario has wider surface widths (from 30 feet of roadway width to 40 feet), and passing lanes approximately every five miles to allow for a smooth flow of traffic on a generally uncongested highway. There are currently 613 miles of two-lane roadway, and 154 of those miles are already 40 feet wide, so the additional road-way for upgrade to Super 2 classification is 459 miles, though some additional passing lanes would also be needed for the existing 40-foot wide sections. This would result in an estimated 61.2 miles per hour average travel impedance speed.
• The four-lane scenario creates four lanes of roadway for the entire stretch of U.S. 2 in Montana. The modeled scenario is for an undivided highway (which reduces costs), and includes 613 miles of roadway upgraded from two to four lanes, and 13 miles of roadway upgraded from three to four lanes. As mentioned above, there are already approximately 40 miles of four-lane highway along U.S. 2 in Montana. The average estimated impedance speed for this scenario is 61.7 miles per hour.
Figure 4.3 presents the base case (no-project conditions in the year 2025) and the two improvement scenarios.
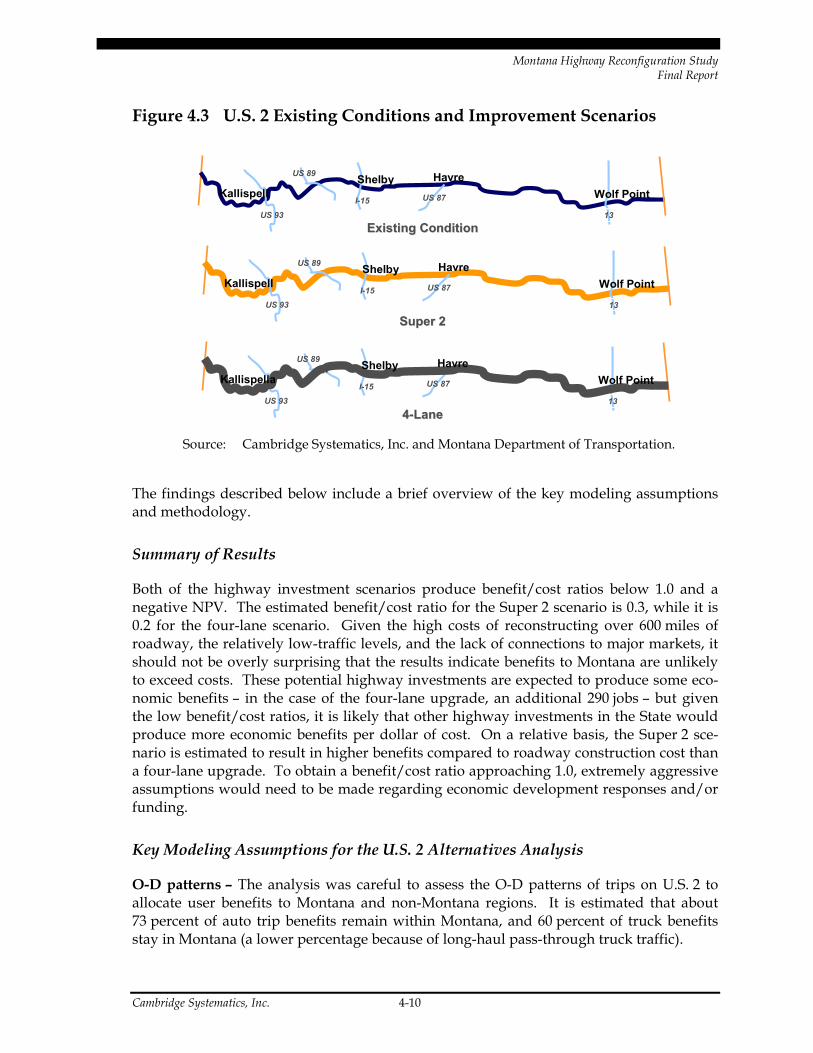
Montana Highway Reconfiguration Study Final Report
Cambridge Systematics, Inc. 4-10
Figure 4.3 U.S. 2 Existing Conditions and Improvement Scenarios
13I-15 US 87
US 89
US 93Existing ConditionExisting Condition
13I-15 US 87
US 89
US 93
Super 2Super 2
13I-15 US 87
US 89
US 93
44--LaneLane
Wolf PointHavreShelby
Kallispell
Wolf PointHavreShelby
Kallispell
Wolf PointHavreShelby
Kallispella
Source: Cambridge Systematics, Inc. and Montana Department of Transportation.
The findings described below include a brief overview of the key modeling assumptions and methodology.
Summary of Results
Both of the highway investment scenarios produce benefit/cost ratios below 1.0 and a negative NPV. The estimated benefit/cost ratio for the Super 2 scenario is 0.3, while it is 0.2 for the four-lane scenario. Given the high costs of reconstructing over 600 miles of roadway, the relatively low-traffic levels, and the lack of connections to major markets, it should not be overly surprising that the results indicate benefits to Montana are unlikely to exceed costs. These potential highway investments are expected to produce some eco-nomic benefits – in the case of the four-lane upgrade, an additional 290 jobs – but given the low benefit/cost ratios, it is likely that other highway investments in the State would produce more economic benefits per dollar of cost. On a relative basis, the Super 2 sce-nario is estimated to result in higher benefits compared to roadway construction cost than a four-lane upgrade. To obtain a benefit/cost ratio approaching 1.0, extremely aggressive assumptions would need to be made regarding economic development responses and/or funding.
Key Modeling Assumptions for the U.S. 2 Alternatives Analysis
O-D patterns – The analysis was careful to assess the O-D patterns of trips on U.S. 2 to allocate user benefits to Montana and non-Montana regions. It is estimated that about 73 percent of auto trip benefits remain within Montana, and 60 percent of truck benefits stay in Montana (a lower percentage because of long-haul pass-through truck traffic).

Montana Highway Reconfiguration Study Final Report
Cambridge Systematics, Inc. 4-11
Tourism impacts – The tourism analysis module relies on estimates of new visitors to Montana counties to calculate the spending effect on the State. For this analysis, CS assumed that a new four-lane highway would create approximately five percent diversion of trips from the Trans-Canada Highway to Montana. A Super 2 highway could also cre-ate tourism effects, but at a slightly lower rate (determined by the difference in travel speeds).
Business attraction from a four-lane highway – In addition to the pure market accessibil-ity effect provided by shorter travel times, an upgrade to a four-lane highway (for a region that currently lacks a four-lane) is expected to generate extra potential for business attrac-tion. This is due to the increased visibility for the State and to truckers, and the prefer-ences of site selectors to choose four-lane highway areas to locate new businesses. Consequently, the market accessibility effects were factored up appropriately based on HEAT’s industrial profiles and previous interviews with economic development experts.
Discount rate and period of analysis – Consistent with MDT guidance and the recent economic analysis for a 45-mile stretch of roadway on U.S. 2 as part of an EIS, HEAT used a four percent discount rate. The time period for the benefit/cost analysis is 30 years from completion of the initial construction, and includes one significant overlay in addition to normal operating and maintenance costs.
Ceteris Paribus – This analysis measures the economic effects of improving conditions on the U.S. 2 corridor, while holding conditions throughout the larger transportation system constant. In reality, MDT will undertake numerous improvement projects across the State, and these may bolster or diminish the benefits from the improvements along U.S. 2.
Economic Impacts and Benefit/Cost Analysis
User benefits – For the forecast year of 2025, there are an estimated $4.1 million of user benefits for truck trips for a Super 2 scenario, and $6.6 million for the four-lane scenario. In terms of auto benefits, CS estimated $2.2 million for auto trips for the Super 2 scenario, and $3.6 million for the four-lane scenario. About 16 percent of auto trip benefits are assumed to accrue to business travelers (i.e., on-the-clock). Though there are more indi-vidual auto trips on U.S. 2, the relatively longer distance of truck trips, along with higher values of time, result in larger truck benefits. The difference between the Super 2 and Four-Lane scenarios is primarily due to a fairly small difference in estimated travel speeds and traffic diversion (Figure 4.4).

Montana Highway Reconfiguration Study Final Report
Cambridge Systematics, Inc. 4-12
Figure 4.4 User Benefits for U.S. 2 Super 2 and Four-Lane Scenarios (Millions of 2000 Dollars)
Millions of Dollars
$6.3
$10.2
$4.1
$6.6
$2.2
$3.6
$0
$2
$4
$6
$8
$10
$12
Super 2 Four Lane
Truck
Auto
Source: Cambridge Systematics, Inc.
Business attraction – Due to three factors, the business attraction potential of U.S. 2 sce-narios appears to be relatively modest, although further refinements to the business attraction module may produce somewhat larger business attraction benefits. First, the improvement in travel speeds is fairly modest, compared to the No-Build, given the lack of congestion. Second, there are few large markets that are directly connected along the U.S. 2 highway segment (Kalispell is one exception). Third, and because of the first two effects, market accessibility gains are relatively small for each scenario (typically zero to three percent), and that is the primary driver of business attraction potential. Corre-spondingly, the Super 2 scenario is expected to attract a net of 30 direct jobs to Montana, and the four-lane scenario is projected to lead to an additional net of 85 direct jobs to Montana. Both of these estimates are likely to be increased once final revisions are made to the business attraction module.
Tourism – Diversion of auto trips from the Trans-Canada Highway to Montana is esti-mated to result in $4.9 million additional visitor spending in Montana for the four-lane scenario, and just over $3.0 million for the Super 2 scenario on an annual basis.
Economic impacts – For the Super 2 scenario, in the forecast year of 2025, there will be an estimated 140 additional jobs in Montana due to roadway improvements, along with approximately $10 million additional GSP and $6 million in real personal income. It is
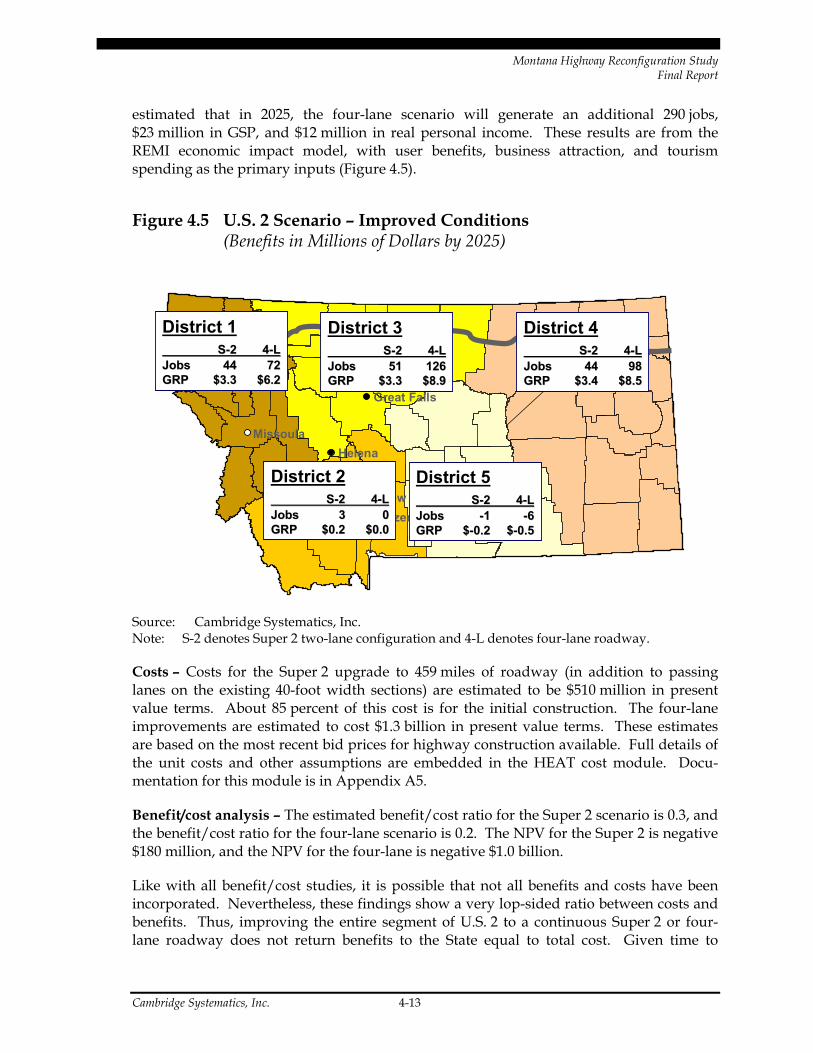
Montana Highway Reconfiguration Study Final Report
Cambridge Systematics, Inc. 4-13
estimated that in 2025, the four-lane scenario will generate an additional 290 jobs, $23 million in GSP, and $12 million in real personal income. These results are from the REMI economic impact model, with user benefits, business attraction, and tourism spending as the primary inputs (Figure 4.5).
Figure 4.5 U.S. 2 Scenario – Improved Conditions (Benefits in Millions of Dollars by 2025)
Missoula
Butte-Silver BowBozeman
Billings
Helena
Great Falls
HavreKalispellDistrict 1
SS--22 44--LLJobsJobs 4444 7272GRPGRP $3.3$3.3 $6.2$6.2
District 3SS--22 44--LL
JobsJobs 5151 126126GRPGRP $3.3$3.3 $8.9$8.9
District 4SS--22 44--LL
JobsJobs 4444 9898GRPGRP $3.4$3.4 $8.5$8.5
District 5SS--22 44--LL
JobsJobs --11 --66GRPGRP $$--0.20.2 $$--0.50.5
District 2SS--22 44--LL
JobsJobs 33 00GRPGRP $0.2$0.2 $0.0$0.0
Source: Cambridge Systematics, Inc. Note: S-2 denotes Super 2 two-lane configuration and 4-L denotes four-lane roadway.
Costs – Costs for the Super 2 upgrade to 459 miles of roadway (in addition to passing lanes on the existing 40-foot width sections) are estimated to be $510 million in present value terms. About 85 percent of this cost is for the initial construction. The four-lane improvements are estimated to cost $1.3 billion in present value terms. These estimates are based on the most recent bid prices for highway construction available. Full details of the unit costs and other assumptions are embedded in the HEAT cost module. Docu-mentation for this module is in Appendix A5.
Benefit/cost analysis – The estimated benefit/cost ratio for the Super 2 scenario is 0.3, and the benefit/cost ratio for the four-lane scenario is 0.2. The NPV for the Super 2 is negative $180 million, and the NPV for the four-lane is negative $1.0 billion.
Like with all benefit/cost studies, it is possible that not all benefits and costs have been incorporated. Nevertheless, these findings show a very lop-sided ratio between costs and benefits. Thus, improving the entire segment of U.S. 2 to a continuous Super 2 or four-lane roadway does not return benefits to the State equal to total cost. Given time to
Montana Highway Reconfiguration Study Final Report
Cambridge Systematics, Inc. 4-14
conduct comprehensive sensitivity testing, HEAT could test the outcomes of using differ-ent discount rates and phasing of construction. The low benefit/cost ratios obtained in this analysis, however, indicate that only very aggressive assumptions – to the point of being unreasonable – would produce benefit/cost ratios approaching 1.0. For example, the type of assumptions needed to reach a 1.0 benefit/cost analysis for the Super 2 sce-nario would include all the following:
1. Five times more traffic growth on U.S. 2 than what is projected;
2. An increase from five to 12 percent diversion of tourist traffic from Canada to Montana; and
3. Four times more projected business attraction than what is estimated by HEAT in the base case scenario.
The following assumptions would need to be made to achieve a benefit/cost ratio of 1.0 for the four-lane scenario:
1. Six to seven times more traffic growth on U.S. 2 than currently projected;
2. An increase from five to 15 percent diversion of tourist traffic from Canada to Montana; and
3. Five times more projected business attraction than what is estimated by HEAT.
MT 3 Billings to Great Falls
HEAT analyzed the economic benefits and costs of proposed highway investment sce-narios for 218 miles of MT 3 from Billings to Great Falls. This test involved calculating the economic impact and benefit/cost analysis for two improvement scenarios compared to the base case conditions in the year 2025 under a no-project scenario. The No-Build high-way scenario represents the existing highway infrastructure conditions with demographic and traffic conditions projected to the year 2025. The highway travel network in HEAT projects future travel conditions for the year 2025 and determines the travel speed, cost, and safety characteristics of MT 3 and all other Montana highways (Figure 4.6):
• The No-Build base case – This constitutes the existing conditions of MT 3 from Billings to Great Falls which is primarily a two-lane roadway. This segment is approximately 218 miles, and would remain so for the next 20 years under current MDT programming and long-range planning. In this No-Build base case, these existing highway conditions are assumed to remain the same for future travel for the year 2025.

Montana Highway Reconfiguration Study Final Report
Cambridge Systematics, Inc. 4-15
Figure 4.6 Existing and Improved Scenario for Highway MT 3
4 Lane Undivided
No Build
Scenario 4-A
2 Lane Undivided2 Lane Improved
Scenario 4-B
Scenario 2-A
Scenario 2-B
Broadview
LavinaHarlo
wton
Stanford
Billings
Great Falls
6 Lane Undivided
2 32Miles 14 44.5 67.5 58 1
Billings Bypass Great Falls Bypass
6
Source: Cambridge Systematics, Inc.
• The Two-Lane Improvement scenarios – The main characteristics of the two two-lane MT 3 improvement scenarios for analysis within HEAT are:
− 2-A Maintain currently planned two-lane configuration for MT 3, but add bypasses around Billings and Great Falls; and
− 2-B Same as above, but just add a Billings bypass.
• The Four-Lane Improvement scenarios – The main characteristics of the two four-lane MT 3 improvement scenarios for analysis within HEAT are:
− 4-A Increase from two- to four-lane undivided highway from Billings to Great Falls at RP 6.242 on N-53 to RP 86.911 on N-60; and
− 4-B Increase from two- to four-lane undivided highway from Billings to Great Falls (same as above), but also include bypasses around Billings and Great Falls consistent with Great Falls Feasibility Study. 2
The HEAT analysis of Scenarios 2-A and 4-B produced net present value (NPV) of $110 million and $73 million. The estimated benefit/cost ratio is 1.4 for the two-lane
2 (http://www.hkminc.com/gfsa/gfsa.htm).
Montana Highway Reconfiguration Study Final Report
Cambridge Systematics, Inc. 4-16
scenario 2-A, while it is 1.1 for the four-lane scenario 4-B. Since the results for the other two scenarios are fairly similar, the remainder of this section presents results from Scenarios 2-A and 4-B.
Key Modeling Assumptions for the MT 3 Alternatives Analysis
O-D patterns – The analysis was careful to assess the O-D patterns of trips on MT 3 to allocate user benefits to Montana and non-Montana regions. It is estimated that about 95 percent of auto trip benefits remain within Montana, and 70 percent of truck benefits stay in Montana (a lower percent representing long-haul pass-through truck traffic).
Tourism impacts – The tourism analysis module relies on estimates of new visitors to Montana counties to estimate the spending effect on the State. For this analysis, CS assumed that the two-lane improvement scenarios would create approximately 165,000 additional visitor days in Yellowstone County, and 68,500 visitor days in Cascade County. A four-lane highway is assumed to create a 55 percent larger increase in tourism effects due to the larger improvement in travel times and safety (consistent with a roughly five percent increase in visitation to each county).
Discount rate and period of analysis – Consistent with MDT guidance and the recent eco-nomic analysis for an EIS of a 45-mile stretch of roadway on U.S. 2 as part of an EIS, HEAT used a four percent discount rate. The time period for the benefit/cost analysis is 30 years from completion of the initial construction, and includes one significant overlay in addi-tion to normal operating and maintenance costs.
Ceteris Paribus – This analysis measures the economic effects of improving conditions on the MT 3 corridor, while holding conditions throughout the larger transportation system constant. In reality, MDT will undertake numerous improvement projects across the State, and these may bolster or diminish the benefits from the improvements along MT 3.
Economic Impacts and Benefit/Cost Analysis
User benefits – For the forecast year of 2025, there are an estimated $4.9 million of user benefits per year for truck trips for Scenario 4-B (four-lane scenario), and $2.6 million for Scenario 2-A (two-lane scenario). In terms of auto benefits, HEAT estimated $3.2 million in annual benefits for Scenario 4-B and $1.7 million for Scenario 2-A. 16.4 percent of auto trip benefits are assumed to accrue to business travelers (i.e., on-the-clock). Though there are more individual auto trips on MT 3, the relatively longer distance of truck trips, along with higher values of time result in larger truck benefits. The difference between the two-lane and four-lane scenarios is primarily due to the difference in estimated travel speeds (Figure 4.7).
Business attraction – Three factors contribute to the business attraction potential of MT 3 scenarios. First, the improvement in travel speeds is fairly robust, compared to the No-Build. Second, there are two major markets that are directly connected along the MT 3 highway segment. Third, and because of the first two effects, market accessibility gains are relatively strong, especially for counties between Great Falls and Billings; and

Montana Highway Reconfiguration Study Final Report
Cambridge Systematics, Inc. 4-17
accessibility is the primary driver of business attraction potential. Correspondingly, the two-lane improved scenarios are expected to attract a net of 280 direct jobs to Montana, and the four-lane scenarios are projected to lead to an additional net of 360 direct jobs to Montana.
Figure 4.7 User Benefits for MT 3 Two and Four-Lane Scenarios (Millions of 2000 Dollars)
Senario 2-ATwo Lane with Bypass
Senario 4-BFour Lane with Bypass
$4.3
$2.6
$1.7
$8.1
$4.9
$3.2
$0
$4
$8
$6
$2
$10Millions of Dollars
Truck
Auto
Source: Cambridge Systematics, Inc.
Tourism – An increase of 235,000 visitor days for the two-lane scenario is estimated to result in $8.8 million additional visitor spending in Montana, and $13.8 million for the four-lane scenario based on an additional 365,000 visitors on an annual basis.
Economic impacts – For the two-lane scenario, in the forecast year of 2025, there will be an estimated 530 additional jobs in Montana due to roadway improvements, along with approximately $34 million additional GSP, and $18 million in real personal income. It is estimated that in 2025, the four-lane scenario will generate an additional 730 jobs, $49 million in GSP, and $27 million in real personal income. These results are from the REMI economic impact model, with user benefits, business attraction, and tourism spending as the inputs (Figure 4.8).

Montana Highway Reconfiguration Study Final Report
Cambridge Systematics, Inc. 4-18
Costs – Costs for the two-lane upgrade to 40-foot width sections are estimated to be $302 million in present value terms, including initial capital costs and ongoing mainte-nance costs. The four-lane improvements are estimated to cost $519 million in present value terms. These estimates are based on the most recent bid prices for highway con-struction available as documented in Appendix A5, and include the costs of new by-passes.
Figure 4.8 MT 3 Scenarios – Improved Conditions (GRP Impacts in Millions of Dollars by 2025)
Missoula
Butte-Silver BowBozeman
Billings
Helena
Great Falls
HavreKalispellDistrict 1
44--LL 22--LLJobsJobs --7070 --5555GRPGRP --$4$4 --$3$3
District 344--LL 22--LL
JobsJobs 4242 44GRPGRP $4$4 $1$1
District 444--LL 22--LL
JobsJobs --22 --66GRPGRP $0$0 $0$0
District 544--LL 22--LL
JobsJobs 790790 615615GRPGRP $51$51 $38$38
District 244--LL 22--LL
JobsJobs --3131 --2424GRPGRP --$2$2 --$2$2
Source: Cambridge Systematics, Inc. Note: 4L denotes four-lane configuration with by-passes for Billings and Great Falls, and 2L denotes two-lane roadway with the same by-passes for Billings and Great Falls.
Benefit/cost analysis – The estimated benefit/cost ratio for the two-lane scenario is 1.36, and the benefit/cost ratio for the four-lane is 1.14. The NPV for the two-lane scenario is $110 million, and the NPV for the four-lane scenario is $73 million. According to this analysis, therefore, benefits are expected to exceed estimated costs for each improvement type, with a slightly larger benefit to cost ratio and NPV for the improved two-lane scenario.
Secondary 323 (S-323)
HEAT analyzed the economic benefits and costs of MDT’s proposed paving of about 48 miles of the existing two-lane gravel section of S-323 from South of Ekalaka at RP 24.826 to Alzada at RP 71.739 (Figure 4.9):
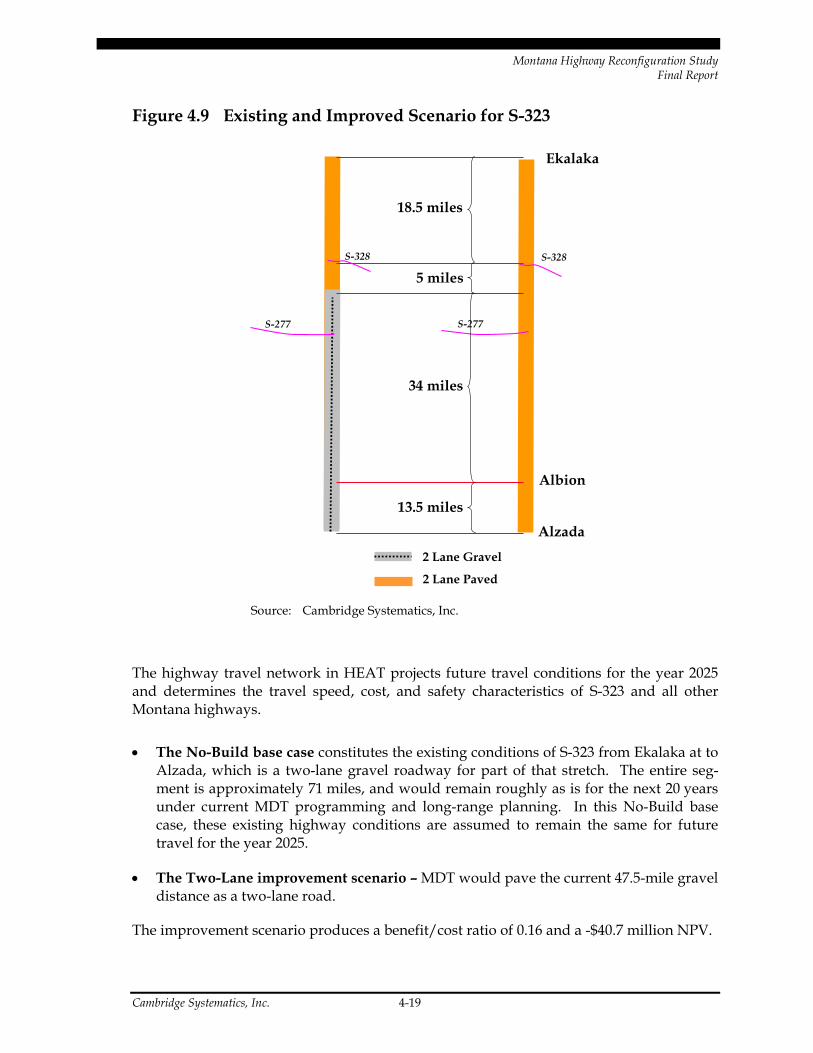
Montana Highway Reconfiguration Study Final Report
Cambridge Systematics, Inc. 4-19
Figure 4.9 Existing and Improved Scenario for S-323
2 Lane Gravel
2 Lane Paved
13.5 miles
S-277
Alzada
S-277
Ekalaka
S-328
5 miles
18.5 miles
S-328
Albion
34 miles
Source: Cambridge Systematics, Inc.
The highway travel network in HEAT projects future travel conditions for the year 2025 and determines the travel speed, cost, and safety characteristics of S-323 and all other Montana highways.
• The No-Build base case constitutes the existing conditions of S-323 from Ekalaka at to Alzada, which is a two-lane gravel roadway for part of that stretch. The entire seg-ment is approximately 71 miles, and would remain roughly as is for the next 20 years under current MDT programming and long-range planning. In this No-Build base case, these existing highway conditions are assumed to remain the same for future travel for the year 2025.
• The Two-Lane improvement scenario – MDT would pave the current 47.5-mile gravel distance as a two-lane road.
The improvement scenario produces a benefit/cost ratio of 0.16 and a -$40.7 million NPV.

Montana Highway Reconfiguration Study Final Report
Cambridge Systematics, Inc. 4-20
Key Modeling Assumptions for the S-323 Alternatives Analysis
O-D patterns – The analysis was careful to assess the O-D patterns of trips on S-323 to allocate user benefits to Montana and non-Montana regions. It is estimated that about 40 percent of auto trip benefits remain within Montana, and 81 percent of truck benefits stay in Montana. According to the select link analysis for S-323, the majority of auto trips using that stretch of roadway either begin or end outside the State.
Tourism impacts – Due to the improved roadway with paved conditions, it is assumed that the Custer Country tourism region will experience an increase in visitation of 2.5 percent, representing 167,000 new visitors.
Discount rate and period of analysis – Consistent with MDT guidance and the recent eco-nomic analysis for an environmental impact statement (EIS) of a 45-mile stretch of road-way on U.S. 2 as part of an EIS, HEAT used a four-percent discount rate. The time period for the benefit/cost analysis is 30 years from completion of the initial construction, and includes one significant overlay in addition to normal operating and maintenance costs.
Ceteris Paribus – This analysis measures the economic effects of improving conditions on the S-323 corridor, while holding conditions throughout the larger transportation system constant. In reality, MDT will undertake numerous improvement projects across the State, and these may bolster or diminish the benefits from the improvements along S-323.
Economic Impacts and Benefit/Cost Analysis
User benefits – For the forecast year of 2025, there is an estimated $118,000 of user bene-fits for truck trips for the paved two-lane improvement scenario. In terms of auto benefits, HEAT estimated $225,000 for auto trips, where 16.4 percent of auto trip benefits are assumed to accrue to business travelers (i.e., on-the-clock). The significantly larger auto volumes on S-323 lead to higher user benefits, despite higher values of time for truck trips. The difference between the gravel base case and paved scenario is primarily estimated based on a significant increase in travel speed.
Business attraction – Based on relatively small market accessibility gains (i.e., not much of a gain in accessibility to major markets, intermodal terminals, etc.), the estimated business attraction results are not significant.
Tourism – Due to an assumed increase in visitation of 167,000 visitors, the tourism mod-ule estimates an additional $6.3 million in visitor spending for Montana.
Economic impacts – For the paved two-lane improvement scenario, in the forecast year of 2025, there will be an estimated seven additional jobs in Montana due to roadway improvements, along with approximately $1.0 million additional GSP, and $0.6 million in real personal income. These results are from the REMI economic impact model, with user benefits, business attraction, and tourism spending as the inputs. These impacts are actu-ally sufficiently small so as to worry about the stability of the results.

Montana Highway Reconfiguration Study Final Report
Cambridge Systematics, Inc. 4-21
Costs – Costs for the two-lane upgrade with 48 miles of paved roadway on the existing 28-foot width sections are estimated to be $48.5 million in present value terms. These esti-mates are based on the most recent bid prices for highway construction available. Full details of the unit costs and other assumptions are embedded in the HEAT cost module. Documentation for this module is in Appendix A5.
Benefit/cost analysis – The estimated benefit/cost ratio for the paved scenario is 0.16 and a NPV of -$40.7 million. As with all benefit/cost studies, it is possible that not all benefits and costs have been incorporated. Nevertheless, these findings indicate costs that likely exceed benefits. Given time to conduct comprehensive sensitivity testing, HEAT could test the outcomes of using different assumptions of future traffic growth. For this scenario in particular, assumptions of the effect that paving a roadway might have on future traffic volumes are key to this analysis as the current level of activity is so small. More aggres-sive assumptions regarding future traffic volumes would produce more robust user bene-fit and economic impact results.
Reconfigure All of Montana Two-Lane Highways (Two-to-Four Scenario)
Section 1.1 of this report describes how the focus of the Reconfiguration Study changed as the project evolved. As originally stated by Governor Martz, the intent of the study was to assess the economic benefits of reconfiguring all of Montana’s two-lane highways as four-lane facilities (i.e., two-to-four scenario) in response to widespread interest in the economic benefits of four-lane highways. Although the RSSC and MDT have directed and sup-ported the change in scope, the original scope of work called for an analysis and estimate of benefits of such a scenario. The RSSC and MDT have dropped this scenario from the scope of work based on lessons learned through the scenario testing described above. These lessons include the following:
• Expanding all of Montana’s major two-lane highways to four lanes would be so cost-prohibitive as to be impractical. Developing an accurate cost estimate would be a sig-nificant undertaking and require MDT to devote significant staff time and divert a large share of the consulting budget for the Reconfiguration Study from other tasks.
• MDT would incur the high cost during the early, construction phase of the two-to-four scenario, while the benefits would accrue incrementally after construction is com-pleted and increase slowly over the next 20 to 30 years. Both costs and benefits must be collapsed using a net present value calculation. As a result, near-term costs have significantly more weight than long-term benefits. In order to outweigh large upfront costs, the structure of benefits must have large amounts initially that growth rapidly.
• Subsection 4.1 describes the general conditions under which roadway investments may generate significant economic benefits. These include roadway projects that have high volumes of travel, divert travel to a shorter route, connect centers activity of trade, access more labor, improve access to manufacturing and agricultural centers, improve access between raw materials and value-added manufacturing, and/or increase tourist. While some of the expanded four-lane roads may have such
Montana Highway Reconfiguration Study Final Report
Cambridge Systematics, Inc. 4-22
characteristics, a great many more will not. Without selecting a subset of projects that would generate significant benefits, the aggregate benefit-cost ratio of the all inclusive scenario will be weighed down by the unproductive projects.
• Absent a four-step statewide travel demand model, HEAT employs a network assign-ment module that approximates how travel will react to a proposed improvement. This simple assignment routine is not sophisticated and would underestimate the full range of travel behavior changes that may result when so many roadways are recon-figuration. HEAT would not take such synergies into account to the degree that they exist.
As a practical matter, MDT may eventually accomplish the intended purpose of the two-to-four scenario as it analyzes four-lane expansion projects on a case-by-case basis over time.
Montana Highway Reconfiguration Study Final Report
Cambridge Systematics, Inc. 5-1
5.0 Implementation
This section presents the following four general topics that MDT will most likely contend with as HEAT is implemented:
• P3 and HEAT Integration,
• HEAT Software Installation and Training,
• HEAT Maintenance, and
• HEAT Upgrades.
These are not presented in any deliberate order.
5.1 P3 and HEAT Integration
MDT has developed the Performance Programming Process or P3 as an optimal funding allocation and investment plan based on strategic highway system performance goals, and the continual measurement of progress toward these goals. The current process involves the following steps:
1. Definition of performance targets consistent with the goals established in the state-wide transportation policy plan (TranPlan 21 [1]). Current performance targets include the number of structurally deficient and functionally obsolete bridges, the average pavement ride quality, the percent of system miles with poor pavement condition, and the degree of future congestion (as measured by level of service).
2. Investment analysis to examine performance tradeoffs associated with different allo-cations of resources across different investment categories and portions of the high-way network. The categories currently used for this analysis are pavement reconstruction, pavement rehabilitation, pavement resurfacing, and bridge replace-ment/rehabilitation. The pavement reconstruction category includes work both to replace pavement that has deteriorated beyond the point where resurfacing or reha-bilitation is a cost-effective option, as well as work to address capacity problems. P3 does not currently include safety work, work on the Urban and Secondary Highway Systems, or work covered in the CMAQ and Enhancement funding programs. The result of the investment analysis is a funding plan that recommends the distribution of resources for year 6 of the capital program across districts, subnetworks, and the dif-ferent categories of work listed above. The funding plan does not list individual pro-jects; rather it displays the percentages of the available resources to be allocated to

Montana Highway Reconfiguration Study Final Report
Cambridge Systematics, Inc. 5-2
each district, for each work category, and on each portion of the network. This funding plan is presented to the commission along with its associated predicted per-formance impacts.
3. The Commission allocates funding to the districts program areas based on the rec-ommended funding plan and associated investment versus performance analysis.
4. Districts nominate projects. Guidance to the districts is provided to ensure that each district’s set of nominated projects does not exceed their allocation of budget, and is consistent with the mix of work in the approved funding plan. In addition, districts are provided with information from pavement, bridge, and congestion management systems so that they have access to the same base of information that was used for the investment analysis. The P3 process does not require that the specific project locations selected by management system simulations (as part of the investment analysis) be selected by the districts. The premise is that, if the districts select projects with the same distribution across highway networks (interstate, NHS, other); and work types (bridge, pavement reconstruction, pavement rehabilitation, pavement resurfacing), that the network-level performance results that were predicted in the investment analysis will be approximately achieved, even if the specific project locations are dif-ferent. Further, MDT’s pavement project selection procedures require that nominated pavement projects are similar to those that the pavement management system has rec-ommended. This provides a second level of consistency between the investment analysis and the project nomination process.
5. Five Year Cost-Constrained Transportation Construction Program Development. Project nominations are reviewed and staff compiles the TCP and Red Book for com-mission approval.
6. Project implementation and monitoring. Programmed projects proceed through the project development process, and system performance results are monitored.
Integration of Economic Development Criteria into P3
HJR 30-2001 required that economic development criteria be included in MDT’s funding apportionment process, and that the TranPlan 21 update include consideration of eco-nomic development issues. The TranPlan 21 update completed in 2002 included a com-mitment to incorporate tools from the Reconfiguration Study into MDT’s processes. Now that HEAT has become another evaluation tool for MDT, policies are needed to incorpo-rate economic development criteria into the planning, funding apportionment, and project selection processes on an ongoing basis. As a starting point, MDT has adopted the fol-lowing guiding principles to develop options for the HEAT/P3 integration strategy:
• Make use of HEAT to better understand opportunities for using transportation invest-ment as a method to enhance economic development in the State;

Montana Highway Reconfiguration Study Final Report
Cambridge Systematics, Inc. 5-3
• Make use of HEAT in the long-range planning process to identify corridors where additional investments are warranted based on a comparison of their full benefits (including economic development benefits) to their costs;
• Ensure that HEAT is not misused to promote transportation projects, which may pro-duce some economic benefits without understanding these benefits in relation to the project costs;
• Ensure that economic development benefits are considered in the context of other transportation benefits (e.g., safety, preservation, and system connectivity), rather than in isolation;
• Make sure that the investment analysis process provides a clear understanding of the implications of increased investment in capacity projects on the ability to address the State’s pavement and bridge performance goals; and
• Continue to view economic development benefits as one of several factors to be con-sidered in the process of selecting major capacity projects, and make use of a bene-fit/cost analysis framework to establish priorities among capacity projects.
New Process Incorporating HEAT
The recommended new process would use HEAT within the following steps of the P3
process:
• Long-Range Policy Plan Updates. Use HEAT to do a series of corridor-level analyses, which indicate which corridors are worthy of investment from an economic develop-ment perspective, and which investments have benefits greater than their costs. This process has already been initiated with the U.S. 2 and U.S. 93 analyses as part of the Reconfiguration Study, and will also include MT 3 and Secondary 323 evaluations.
• Investment Analysis. Use HEAT initially to estimate the economic benefits of the rec-ommended investment strategy and subsequently to evaluate packages of reconstruc-tion work that add capacity to the highway system (see Use of HEAT for Investment Analysis below).
• District Nomination Process: Use HEAT to screen and rank projects that are sug-gested for the purpose of economic development.
• Five-Year TCP Development: Use HEAT to examine the set of capacity projects not currently funded (based on screening guidelines for HEAT use), and help prioritize which projects should be advanced in the program. Once the entire program is set, use HEAT to evaluate and then communicate the likely statewide economic benefits to be gained from the program.

Montana Highway Reconfiguration Study Final Report
Cambridge Systematics, Inc. 5-4
• Project Implementation: Use HEAT as the standard tool for economic impact assess-ment for EIS evaluations.
Each of these steps is discussed in more detail below.
Long-Range Policy Plan Updates
Prior to the detailed P3 investment analysis and project programming process, highway corridor projects were often informally proposed by stakeholders throughout the state. Sometimes, these highway improvement projects were suggested based on speculations regarding potential economic development benefits. For example, proponents of four-laning U.S. 2 throughout Montana or improving the corridor between Great Falls and Billings (MT 3) point to the expectation of economic benefits as justification for highway improvements. HEAT provides an objective, quantitative assessment of the actual eco-nomic benefits that can be expected from a highway corridor improvement, and place these benefits in relation to project cost.
Though the Reconfiguration Study will address a few of the major corridor projects thus far suggested by the RSSC and other stakeholders, it’s likely that other corridor projects will continue to be proposed to MDT over time. HEAT will be run on these scenarios to provide a screening of the highway improvement scenario (if any) that might be cost effective given expected economic benefits. This will give MDT better direction regarding additional detailed analyses needed to move a project forward, or provide analytical sup-port to explain why an improvement project may not be justified.
Use of HEAT for Investment Analysis
There are two ways in which HEAT can be applied in the Investment Analysis step of the P3 process: 1) reporting the economic benefits of a recommended investment strategy, and 2) analyzing the economic benefits of different investment scenarios and using this infor-mation to help select among alternative investment scenarios. Because HEAT is a new tool for MDT, the initial application of HEAT for investment analysis (in the year 2004) will be limited to the first of these (reporting). Use of HEAT for scenario testing can be phased in the following year.
• Benefit Reporting. Use HEAT to generate information about the economic impacts of a package of capacity improvements identified based on congestion performance and other criteria. Note that while HEAT can only produce results given the identification of specific project locations, the investment analysis phase of P3 is concerned only with the aggregate benefits associated with a particular investment level and distribution of work. Therefore, the package of capacity projects included in the investment analysis may suggest specific project locations for the district nomination process, but is not intended to dictate or constrain these choices in any way, and HEAT results will be presented for the aggregate package of capacity improvements within the investment analysis. The six steps are:

Montana Highway Reconfiguration Study Final Report
Cambridge Systematics, Inc. 5-5
1. Run congestion management system to identify locations where congestion per-formance goals may not be met, and apply screening criteria for low-volume roads and amber routes (no change).
2. Identify other capacity projects to meet additional performance goals (new).
3. Integrate these capacity projects into the pavement management system so that the pavement simulation considers them (no change).
4. Run pavement scenarios to develop a work distribution that meets pavement con-dition objectives (no change).
5. Run HEAT with the capacity projects and generate aggregate estimates of eco-nomic benefits (new).
6. Report aggregate economic benefit measures for the package of capacity projects along with description of other measures (new).
This is a logical starting point for MDT. It is straightforward to implement, involves the least amount of change to the current process, and can be done this year.
• Scenario Analysis. After the initial year of using HEAT as a benefit reporting tool, the use of HEAT can be expanded to analyze and compare the economic benefits associ-ated with different work mix scenarios. The results of this analysis can be used to adjust the share of reconstruction work in the recommended funding plan as appro-priate. The eight steps are:
1. Define two different packages of capacity projects. Package 1 includes those iden-tified through congestion screening and Package 2 includes these plus an addi-tional set of projects that have been identified through the long-range planning process to address economic development objectives. Only projects with benefits greater than their costs would be included.
2. Run HEAT for the two packages of capacity projects to produce estimates of eco-nomic benefits for the two packages (new).
3. Integrate the Package 1 (congestion) projects into the pavement management sys-tem (no change).
4. Run pavement scenarios to develop work distribution targets that meet pavement condition objectives and prepare performance results (no change).
5. Make a final statewide pavement management run with increased reconstruction budgets (and proportionally reduced rehab/resurfacing budgets). The increase in the reconstruction budget would be the difference in cost between capacity project packages 1 and 2. Prepare a report that contrasts pavement condition performance measures for this run versus the base run with only Package 1 (new).
6. Prepare a summary graphic that contrasts the increase in economic benefit (from Package 1 to Package 2) with the decrease in pavement condition (new).
7. Adjust the share of reconstruction upward for combinations of districts and sys-tems where a compelling case can be made based on the tradeoff analysis results (new).
Montana Highway Reconfiguration Study Final Report
Cambridge Systematics, Inc. 5-6
8. The list of specific projects that were included in the two packages could be pub-lished as part of the documentation of the analysis so that the Commission and districts could understand the underlying assumptions. Districts would not be obligated to select the same projects. Nevertheless, in the project nomination proc-ess, they could be asked to suggest projects with the same level of benefit (new).
This type of analysis can provide an understanding of tradeoffs between spending more on capacity projects (to address economic development objectives) and less on preserva-tion projects (which would affect the ability to achieve pavement condition targets.) The specific method for developing scenarios may need to be adjusted based on how many capacity projects are identified with benefits greater than costs, and the extent to which reasonable economic development project candidates can be identified that are in loca-tions that don’t coincide with those identified by the congestion management analysis.
District Nomination Process
HEAT will be used to assess the economic benefits of projects nominated by the districts for state funding. HEAT would analyze those projects that increase highway capacity and influence county-to-county trips. CS has begun a memo that details the project character-istics that suggest the use of HEAT, to give MDT direction regarding the conditions to apply HEAT. This analytical step will have at least two benefits for MDT. First, when districts nominate a capacity-enhancing project based on potential economic development benefits, HEAT would assess actual benefits based on analytical analysis, rather than anecdotal speculation. Second, as MDT approves nominated projects and allocates funding to districts, HEAT can provide another check on the likely magnitude of benefits and costs of individual capacity-enhancing projects.
Five-Year Transportation Construction Program (TCP) Development
There are two aspects of developing the five-year (cost-constrained) TCP where HEAT could be useful to MDT. First, there is currently a backlog of capacity projects within the TCP that are not funded. HEAT could be applied to these projects to help prioritize which projects should be advanced in the program to receive funding. This prioritization could be based on a ranking of benefit/cost ratios or net present value (NPV). To ensure that HEAT is applied appropriately, without excessive time and effort from MDT staff, screening guidelines (under development by CS) will be used to determine the best use of HEAT.
Second, once the five-year TCP projects have been determined, HEAT could be run on the entire program of capacity projects (throughout the state), to estimate the full-value of economic benefits. This analysis would be performed to educate MDT and other stake-holders (e.g., the legislature) regarding the statewide economic development and produc-tivity benefits of the five-year TCP. This type of information has been effective in other states in debates regarding overall transportation funding, and could help MDT commu-nicate the quantitative benefits of the proposed highway investments.

Montana Highway Reconfiguration Study Final Report
Cambridge Systematics, Inc. 5-7
Project Implementation
As highway capacity projects near implementation and the choice of specific alternatives, it is often necessary to conduct an environmental impact statement (EIS). Though an EIS does not necessarily require economic impact or benefit/cost analysis, that type of assessment is frequently being applied across the country to determine the preferred alternative. For example, HEAT could be applied to examine alternatives such as an improved two-lane road, a Super 2 configuration, a four-lane scenario, or a combination of configurations, similar to recent analyses for U.S. 2. HEAT, and its individual analysis modules, could become the standard tool for all Montana EIS economic impact evalua-tions. HEAT’s modular structure should allow it to be applied for any project in the state, even if more detailed highway network engineering analysis is conducted to determine direct travel performance impacts (i.e., travel time, cost, safety). This would ensure con-sistent results for EIS analyses throughout the state, and by different consultants.
5.2 HEAT Software Installation and Training
CS intends to devote sufficient time to install and train MDT staff in HEAT’s operation. The exact level of effort for training is not known at this time, although MDT has identi-fied staff as candidates for training. In addition, MDT is considering a consultant pro-posal to train staff from other state agencies, such as the Governor’s Office of Economic Development and the Department of Commerce.
Training will not require expertise in ArcGIS software, REMI, or other software platforms embedded in HEAT. Nevertheless, familiarity with these packages will be of significant help in troubleshooting technical difficulties. A background in economics, especially regional economic analysis, and commodity flow and goods movement analysis will be of considerable help in interpreting the results, although these expertises are not necessary for HEAT to be operated and to obtain correct results.
Training is expected to be conducted over a matter of days with the likelihood that CS consultants will conduct training on multiple visits to Helena and make themselves avail-able for technical support immediately following the on-site training sessions. On-site training will be conducted on MDT computers which have ArcGIS installed.
Neither MDT nor CS has made formal provision for ongoing technical support. As must be expected with any software package and especially new software, both MDT and CS expect such support will be needed; however, the level of the support is unknown. A separate contract and workscope should be negotiated.

Montana Highway Reconfiguration Study Final Report
Cambridge Systematics, Inc. 5-8
5.3 HEAT Maintenance
HEAT uses five data sources and commercial analysis tools that must be periodically updated. In order to keep HEAT up to date, MDT will need to consider purchasing these data and software in the following list:
1. Reebie commodity flow data;
2. REMI economic impact and forecasting tool;
3. Woods & Poole county-level economic forecasts;
4. MISER international trade data; and
5. IMPLAN input/output and economic data.
Each data item and its relevance are briefly described, along with pricing options. It is expected that the first four data items would only need to be updated once every five years or so, while the IMPLAN economic data might be worth updating once every one to three years. There are other elements that may need updating, but these are likely to involve MDT staff and/or possible consultant support, rather than commercial data/model purchases. The transportation network and the industrial profiles are two examples.
Reebie Associates TRANSEARCH Commodity Data
Reebie is essentially the only provider of commodity flow data at a detailed county-by-county level. The commodity flow data allowed us to model the origins and destinations of goods movements within the State, to the State, from the State, and through the State. We have imbed an internal forecasting routine in the tool that will use the other data sources described below (REMI, Woods & Poole, and IMPLAN) to provide 10-, 20-, or 25-year commodity flow forecasts. Purchasing such forecasts in the future could cost upwards of $30,000 to $40,000; and it is unlikely that their accuracy would be much better than what we’ve done on our own. Still, the current year Reebie TRANSEARCH data is still needed to base these forecasts on.
Costs: 2001 data for truck movements only was $24,500. Since the project is focused on highway improvements, it was determined that a purchase of truck-only data would be sufficient for HEAT. Purchasing the data for all modes increases to $35,000. The cost for future updates of Reebie base year commodity data would likely be in this range.
REMI Model
The REMI model is used in HEAT for both generating economic forecasts for regions of the State, and determining the full economic impacts (employment, income, etc.) of high-way investments. The model is fairly expensive, especially if purchased down to the

Montana Highway Reconfiguration Study Final Report
Cambridge Systematics, Inc. 5-9
county level, which is one reason why HEAT uses a five region model (rather than one that would have 56 regions for each county in Montana) based on the five MDT districts.
Costs: The cost for the 14 industry sector, five region REMI model one year lease was $13,650, plus additional costs for consultant use. This lease runs through the summer of 2004. MDT is currently considering options to purchase the model for continuous use.
Woods & Poole Economic Forecasts
After inquiries with the Department of Commerce and at the University of Montana (Paul Polzin and Larry Swanson), there does not exist a state-sanctioned official long-term eco-nomic forecast for Montana. If a county-level forecast becomes available and has political significance (and low cost), HEAT can use this source. In the meantime, however, HEAT is using Woods & Poole (W&P). W&P is a commonly used, but relatively inexpensive source of economic forecast data. The benefit to this project of W&P data is that it pro-vides detail down to the county level. Since HEAT needs to forecast variables (employ-ment, population, commodity flows, etc.) at the county level, and the five-sector REMI model used in HEAT only offers forecasts at the five-region level, HEAT requires a sup-plemental county-level economic forecast. W&P provides 25-year forecasts of population, income, retail sales, and one-digit SIC code employment data. The costs of W&P for the State of Montana (and all its counties) data is $400 at present.
MISER International Trade Data
HEAT supplements Reebie’s international commodity trade data with international trade data from the Massachusetts Institute for Social and Economic Research (MISER). These data are a frequently used source of international trade data and provide detail down to all ports of entry and exit in Montana. The cost of the MISER international trade data is roughly $600 at present.
IMPLAN Economic Data
IMPLAN provides employment, exports, and output data at the county level (in addition to their input-output model) for detailed industries. It is a key source of data for the industrial profiles, the GIS mapping system, and the business attraction industry trend analysis component of the economic impact module. HEAT currently uses 2000 industry employment data purchased specifically for this project. Purchasing annual updates will increase the accuracy of the model, but depending on MDT budget constraints, less fre-quent updates would also be reasonable. The cost of annual updates to IMPLAN data for all counties in Montana is approximately $1,000.
Montana Highway Reconfiguration Study Final Report
Cambridge Systematics, Inc. 5-10
5.4 HEAT Upgrades
To make the use of HEAT as easy and transparent as possible, with user-friendly inter-faces and data access, CS anticipates that upgrades to HEAT may be desirable. In addi-tion, further research and model development will likely continue to improve and refine the model’s responses and the accuracy of results. Consequently, the following data and program upgrades illustrate a number of potential HEAT enhancements for MDT consideration.
• GIS assignment routine. The ArcGIS database and programming code developed for Montana’s version of HEAT are highly specific to the State. CS developed this module in the absence of a statewide travel demand model or any significant regional travel demand model. This assignment routine works well in a state, such as Montana, where the vast majority of roadways are through rural areas and there is little or no foreseeable congestion. Nevertheless, the underlying base map and much of the linked data on roadway conditions were imported from the NHPN database and ini-tial testing has already turned up some inconsistencies. MDT has been developing its own GIS for its roadway system, but had not completed this effort in time for its use in HEAT. When this database becomes available, MDT may elect to upgrade the current GIS data. The key challenge will be to format the Montana-specific data so that it can be used for travel network models (link node topology).
• Commodity flows database. CS has corrected many errors and omissions in the cur-rent commodity flow database used in HEAT. Nevertheless, errors remain, and improvements and updates are provided from the original Reebie data on a regular basis. Given the relatively slow pace of economic change in the State and its major trading partners, the next upgrade may not be necessary for five years following the 2003 original database’s creation. Nevertheless, CS has embarked on a separate national effort to develop Freight Tools. This web-based service will provide sub-scribers with access to commodity flow data for regions the user may specify. Access to such highly specific, customized commodity flow data would provide HEAT with a convenient source of the latest commodity flow data. CS intends to adapt future ver-sions of Freight Tools as accessible upgrades for HEAT.
• Commodity flows forecast. MDT’s current version of HEAT includes a 25-year fore-cast of the commodity flows prepared specifically for this project. The forecast used sophisticated methods and represents the state-of-the-practice for regional commodity forecasts. Nevertheless, improvements to this forecast are possible and updates are likely and eventually necessary. Although the same five-year shelf life suggested above for the commodity flow database applies to the forecast, CS is planning to pro-vide customizable commodity flow forecasts as part of Freight Tools’ subscription ser-vices. Access to Freight Tools, therefore, may provide MDT with a convenient mechanism to update and upgrade the original commodity flow forecast. Given Freight Tools is not available at this time, the version of HEAT delivered to MDT is not designed to download a commodity flow database or forecast from Freight Tools.

Montana Highway Reconfiguration Study Final Report
Cambridge Systematics, Inc. 5-11
Upgrades to MDT’s version of HEAT may be made when Freight Tools has been completed.
• Industry profiles. The 14 industry profiles were developed from extensive interviews conducted during the spring and summer of 2002 and from economic data available at that time from IMPLAN, Bureau of Labor Statistics, Census, etc. Given a relatively stable state economy, most profiled industries are not likely to undergo significant change and require updates or upgrades for another five years. Nevertheless, the Governor’s Office of Economic Development and the Department of Commerce have completed an industry cluster study and are embarking on a number of initiatives intended to improve the competitiveness of existing Montana industries and recruit new ones. The regional economic development agencies are also very active and have frequent contact with the businesses in their areas. As these efforts advance, the industries profiles may become outdated or incomplete. Therefore, all of this knowl-edge, which is being collected by agencies other than MDT, can and should be used to improve, expand, and update the industry profiles in HEAT. MDT will look to these agencies to help transfer their knowledge and may elect to move responsibility for industry profile updates to another state agency.
At the present time, the industry profiles are intended as a background source of information for a HEAT user or an audience of HEAT output to better understand the results HEAT has generated. The software does not directly access information from the industry profiles in order to calculate quantitative results. This separation may change in future versions of HEAT, where the software could employ statistics, parameters, data, or other information in the industry profiles.
• Direct benefits module. HEAT has benefited from a recent and significant improve-ment in the parameters used to calculate direct user benefits. Central to converting travel time savings into a change in business user costs is the value of time. Tradition-ally, this variable has been limited to two or three estimates based on the trip purpose: on-the-clock travel; home-based work (i.e., commute); and other. No distinction was made for the type of commodity being moved (e.g., sand and gravel versus fresh fish or microchips). Furthermore, few modeling packages differentiated between the value of time when travel time was due to normal congestion or road conditions (i.e., recur-rent delay) and unexpected longer travel time caused by accidents (i.e., non-recurrent delay). These distinctions have very significant effects on the value of time per hour of delay. The parameters in HEAT represent the current state-of-the-practice by differ-entiating between recurrent and non-recurrent delay, seven types of commodities, and three trip purposes.
Nevertheless, research is progressing that will further refine these estimates and fur-ther differentiate between commodity type; trip length; truck type; industry of origin or destination; type of carrier (e.g., in-house shipper, common carrier, LTL, etc.); and other important characteristics of a commodity move. As this research produces sta-ble and vetted results, HEAT can and should be updated.

Montana Highway Reconfiguration Study Final Report
Cambridge Systematics, Inc. 5-12
• Tourism module. The calculation of tourism benefits in HEAT from roadway improvements is very dependent on exogenous estimates and analysis of tourist behavior under the different roadway improvement alternatives. This dependence is unlikely to change in the near term. Nevertheless, the State continues to collect empirical data on tourism from visitor surveys, special studies, focus groups, and other sources. This effort is led by the Institute for Tourism and Recreation Research at the University of Montana. This information could and should be used to update the industry profile of tourism, so a HEAT user could obtain more reliable estimates of direct visitor benefits to input into HEAT. Furthermore, direct tourism benefits are input into HEAT at present based on best judgments and local knowledge. A poten-tial enhancement would automatically estimate alternative levels of visitor response to a roadway improvement to see how much additional visitation is needed to drive up the aggregate benefits of a proposed roadway improvement to generate a positive benefit/cost ratio. To estimate a likely and reliable visitor response from a roadway improvement, HEAT would require a separate, stand-alone module. If such a tool became available, HEAT could be upgraded to interface with the tools output.
• Business attraction module. The conceptual and arithmetic content of the business attraction module in HEAT was developed by the Economic Development Research Group, Inc. (EDR Group) with quality assurance and guidance from CS. This module was coded into the HEAT software by CS. Both efforts represent a significant advancement in the state-of-the-practice for economic impact analysis. Upgrades and updates to this module are likely, and EDR Group and CS will make every effort to offer these to MDT as they become stable. The most immediate upgrade likely may involve making the results of the business attraction module accessible in a geographi-cal format independently of the final results of a HEAT run. This functionality was not suggested or requested under the Reconfiguration Study. Nevertheless, stake-holders for many of the proposed highway improvements that have or will be ana-lyzed by HEAT have argued that the roadway improvement will attract new business (i.e., “build it and they will come”). The business attraction module addresses this assertion analytically and, thus, may be called upon to fully divulge its results. Such transparency may help stakeholders and MDT understand the final outcomes.
• REMI module and user interface. The REMI model is widely regarded as the state-of-the-practice tool for analyzing the full economic impacts of monetized direct user benefits. The REMI model incorporated in HEAT is based on data with a “last year of history” of 2000, and MDT is currently assessing options to continue the use of REMI for the next few years. At this time, CS does not anticipate any need to improve the interface between REMI and other modules in HEAT. Further upgrades to HEAT, however, may include enhancing access to some of the module’s internal data in REMI (i.e., industry statistics, regional forecasts and socioeconomic data, etc.). Such access is already possible to someone familiar with REMI.
• Output and user interface. The effort to create the first version of HEAT was directed at providing robust, reliable, and useful functionality to the user. CS did not divert its resources to create an extremely user-friendly interface or devote time to aesthetic or compelling graphical presentation of results. HEAT output, however, has been for-
Montana Highway Reconfiguration Study Final Report
Cambridge Systematics, Inc. 5-13
matted for easy import into Excel or other spreadsheet and database software, so a user is able to graph and manipulate results as they see fit. User input screens have been designed with a non-expert user in mind and are intended to be mastered with minimum training. Nevertheless, CS expects that subsequent upgrades to HEAT will devote more resources to the user interface and the graphical sophistication of the outputs. This effort recognizes that the results of HEAT will often be presented to policy and stakeholder audience who are not willing to interpret technical and cum-bersome presentations.
5.5 References
1. Tran Plan 21 2002 Update, Montana Department of Transportation in conjunction with Dye Management Group, Inc. (http://www.mdt.state.mt.us/tranplan21/).
Montana Highway Reconfiguration Study Final Report
Cambridge Systematics, Inc. A1-1
Appendix A1. Methods of Highway Project Impact Evaluation Literature Review
1.0 Introduction
Montana’s transportation network provides a critical foundation to the State’s economy. The strategic decisions made by the State concerning transportation priorities and invest-ments will have a bearing on the State’s future prosperity. Businesses rely on the speed and reliability of the transportation system to ensure that supply streams are uninter-rupted and finished products are delivered to customers in a timely fashion. Transporta-tion provides access to scenery and sites that attract visitors from around the world. As part of their travel experience, tourists expect safe and well-marked routes that allow them to reach their destinations without spending inordinate amounts of time. Strategic investments in Montana’s highway network represent a key tool in the State’s efforts to better meet economic development goals.
Although the economic importance of the transportation system and transportation investments may seem inherently obvious, the quantification of these effects is complex. As Montana considers the economic impacts of expanding the State’s roadways, this lit-erature review offers an overview of the methodologies used to assess, quantitatively and qualitatively, the potential economic benefits of transportation improvements. The types of economic impacts that can be expected due to transportation investments are discussed, and examples are provided showing other states’ experiences with using transportation as part of an economic development strategy as well as their approaches for assessing eco-nomic benefits. Underlining the importance of transportation to economic development efforts, literature also is reviewed that summarizes the importance of highways and trans-portation infrastructure as a consideration in the site selection process.
2.0 Relationship Between Transportation and Economic Development
There is fairly widespread acceptance of the notion that transportation infrastructure plays a major role in the economy. At the national level, a well-maintained transportation infrastructure system clearly is a fundamental part of a functioning economy. Local transportation projects also can affect the economic fortunes of regions and states by expanding customer or supplier markets; expanding labor markets; reducing business
Montana Highway Reconfiguration Study Final Report
Cambridge Systematics, Inc. A1-2
operating costs through lower direct expenses or increased economies of business operation; and increasing the volume, visibility, and access of pass by traffic. These impacts contribute to overall economic productivity and also local competitiveness.
This section provides a brief overview of some of the basic ways that transportation investments affect the economic development of a state, region, or city.
• Industry Competitiveness – Transportation efficiency improvements provide major benefits for industries through reduced production and distribution costs. More spe-cifically, properly-designed transportation investments increase access to varied and specialized labor pools, improve connections to inventory and raw materials, and expand customer bases. Impacts at an industry level are often concentrated in par-ticular locations. Though they extend to the state and national level, these impacts are a key example of how transportation investments impact a local economy. Growth of a particular industry in a given area can yield extensive spill-over effects as the addi-tional business and personal income generated create opportunities for other businesses.
• Household Welfare – Individuals and families benefit from a strong transport net-work through increased access to new or better jobs, goods, and services. Well-maintained roads also reduce personal vehicle repair costs; efficient public transport networks reduce costs associated with driving and automobile ownership.
• Travel – Both business and leisure travelers depend on transportation infrastructure for access to activities and destinations, such as conferences, trade shows, national parks, beach resorts, and everyday business meetings and social events. Localized travel impacts can occur if a particular area develops a major tourist or business attraction. Business conference facilities, for example, can create the need for hotels, restaurants, and other related facilities that can provide a base of economic growth for an area. These facilities, however, may not be feasible in areas that do not already attract business travelers.
• Reduced Costs – Traffic accidents average $580 per capita in lost productivity, prop-erty damage, and medical expenses each year. Similarly, congestion-related time delays and fuel consumption cost $78 billion for major U.S. urban areas in 1999 (1). Investments that improve safety and increase capacity mitigate accident losses and benefit businesses and households alike. These costs may not directly impact eco-nomic development in a particular area, but they decrease overall efficiency.
• Direct Employment – Transportation investments provide employment in several ways. First, construction spending provides employment in construction and support industries, as well as increasing consumer spending due to increased earnings. Sec-ond, nearly 11 million people are employed in for-hire transportation and transportation-related industries in the United States This includes some 236,000 peo-ple in the railroad industry; 147,000 school bus drivers; close to 1.9 million people in motor freight; and nearly 1.3 million people in air transportation (2).
This list provides a basic overview of the direct connections between transportation investments and economic development. For the purpose of economic development of

Montana Highway Reconfiguration Study Final Report
Cambridge Systematics, Inc. A1-3
disadvantaged areas, some items clearly are more important than others. This study ties directly into the first factor, boosting industry competitiveness. The goal of programming statewide funds to improve economic development should lead to a solid foundation for private industry to develop or re-emerge, so that the area can sustain long-term growth.
The timing and duration of benefits generated from each of these connections will be dif-ferent. The impacts of construction are short-lived and cannot be considered equivalent to the subsequent impacts from industrial activity. If a transportation facility is built but underused, the increased benefit from industry and tourist growth may lag the comple-tion of the project for many years or never generate significant benefits. The timeframe, therefore, becomes a critical element of evaluating potential benefits.
Monetary benefits to households also are important, but tend to occur when industrial growth increases the incomes of residents in an affected area through direct employment opportunities and the secondary and tertiary spending generated from business activity. Nevertheless, benefits to residents of an economically depressed area may lag significantly behind the transportation investments, are not necessarily as large, and may not flow to existing residents at all. This latter outcome, simulating business activity that can hire local residents, may require job training, initiate subsidies (e.g., welfare-to-work), and other non-transportation interventions to ensure some of the original benefit from these investments flow to the target population.
3.0 Economic Impacts of Highway Investments
Most transportation/economic research and studies, both academic and project-specific, have been focused on highway investments. Much of the initial impetus was the desire to measure the economic benefits of building the interstate highway system. The research typically has been divided into two methods. The first method attempts to measure the national-level productivity enhancing benefits of transportation infrastructure using com-plex statistical modeling (3). This method sometimes groups all modes of transportation infrastructure into a single measure of public capital, including roads, rail, air, water, sewer, seaports, etc. The second method focuses on the regional competitiveness and productivity benefits of improving the highway system as demonstrated through tradi-tional user benefit measures and regional economic development indicators, often com-bining state or regional transportation models with economic impact models. While the first approach has been attempted at the state level (see Maryland example provided below), it is not a common approach for projecting the benefits of new highway invest-ments at the subnational level.
Contributions of Highway Capital to Industry and National Productivity Growth
Frequently cited by transportation practitioners, Ishaq Nadiri (3) has been involved with a number of investigations into the links between transportation and U.S. economic growth. The publication summarized here demonstrates a statistically valid relationship between
Montana Highway Reconfiguration Study Final Report
Cambridge Systematics, Inc. A1-4
highway capital and industry productivity growth, which connects to overall growth in national productivity. The study examines the contributions of total highway capital and non-local highway capital to the output growth and productivity of 35 industry sectors that comprise the U.S. economy, providing empirical evidence of the positive benefits of public highway capital on private sector costs of production. For example, the study found relatively large cost reductions (associated with an increase in highway capital) in such industries as food and kindred products, trade, construction, and transportation and warehousing. In addition to a “productivity effect,” the study also found an “output effect” resulting from the cost reductions. The cost reductions permit products to be sold at lower prices which, in turn, can be expected to lead to output growth. The cost saving productivity gains from highway capital investments appear to “finance” a substantial portion of the higher total production costs associated with the output expansion effect.
Transportation: An Investment in Florida’s Future
A 1996 study by the Florida Transportation Commission and Floridians for Better Transportation examined the importance of transportation to the Florida economy (4). The report found that for every additional dollar invested in public capital, Florida’s gross state product (GSP) grew by $0.35, for a 35 percent return on investment. This analysis included all modes of transportation (plus non-transportation public capital) and was per-formed using a production function, multiple regression methodology by the Center for Urban Transportation Research (CUTR). In addition, CUTR focused an analysis on high-way performance, using the Highway Economic Requirements System (HERS) model.1 This analysis found that investments to maintain current levels of highway conditions (i.e., level of service) result in $2.86 in direct user benefits for every dollar invested. In addition, the HERS model can help determine the appropriate share of capacity and non-capacity (preservation) spending needed to maintain various Present Serviceability Ratings (PSR).
The Economic Impact of Maryland Highway Investment
This report focuses on the economic impacts of highway spending in Maryland from 1982 to 1996, showing: 1) the output and employment (direct and indirect) supported by the highway system via its demand for labor, goods, and services; and 2) the long-run pro-ductivity effect resulting from an expanded and improved highway system (5). The report seeks to answer three questions: 1) Why should the State invest in its highway system?; 2) What short-term economic benefits flow from these investments?; and 3) How does highway investment affect the economy in the long run?
The direct and indirect effects of highway investments (i.e., the economic activity associated with highway spending through its purchases of labor, goods, and services) in the State are shown in terms of jobs, output, and tax revenue. An input-output model of the regional economy is used to trace each dollar spent on highways from the State Highway
1 HERS was developed by Cambridge Systematics for the FHWA.

Montana Highway Reconfiguration Study Final Report
Cambridge Systematics, Inc. A1-5
Administration’s (SHA) immediate vendors and employees to spending by their workers and suppliers.
Beyond the direct and indirect effects associated with highway spending, the report also measures the long-run productivity impacts of the State’s highway investments. This includes the effects of transportation spending on the private costs of production, factor productivity, and its overall contribution to state economic growth. The study analyzes highways’ productive contribution by examining how costs in each of nine major indus-tries change over time. Econometric techniques make it possible to separate the effects of wage increases or changing prices of capital goods from the influence of other factors. Among such additional factors, highway investment offers substantial savings. The pub-lic’s annual rate of return on its highway investment is the sum of such industry savings per dollar of spending. The study found that highway investments were responsible for almost 10 percent of Maryland’s productivity growth between 1982 and 1996.
Macroeconomic Analysis of the Linkages Between Transportation Investments and Economic Performance
This report includes a thorough literature review and draws general conclusions about the importance of transportation investments for economic performance (6). The report explores ways in which infrastructure expands output and increases productivity, specifically examining the “direct” and “attraction” effects that infrastructure has on economic growth. Direct effects emphasize how infrastructure influences productivity while the attraction effects of infrastructure stress how additional inputs (e.g., labor and capital) entering a region stimulate its economy. The review concludes that infrastructure investments have a modest positive effect on the nation’s private economic activity, acknowledging that roads, airports, water, and other core infrastructure services are important ingredients in a modern, productive economy.
NCHRP Synthesis 290, Current Practices for Assessing Economic Development Impacts from Transportation Investments
The economic impact of transportation projects has become a relatively well researched topic by transportation practitioners, consultants, and academics. NCHRP Synthesis 290, as its name implies, provides an overview and assessment of the current practices employed in tying transportation investments to economic development impacts (7). A main feature of the study are the results of a survey which reviews the experiences of 52 transportation planning departments in applying economic impact analyses to trans-portation projects. As such, the report reviews the techniques used and the context in which other transportation agencies have evaluated the economic development impacts of transportation projects. The study defines several concepts that regularly are used by practitioners, including a differentiation between “economic development impacts” (development of an area’s economy) and “economic analysis” (any discrete elements of benefit or cost to a society, such as impacts on the environment, quality of life, and trans-portation system users). These factors of economic analysis can be applied to determine economic development impacts. Common variables that are applied in the measurement

Montana Highway Reconfiguration Study Final Report
Cambridge Systematics, Inc. A1-6
of economic development impacts, such as regional output, gross regional product (GRP)/value added, wages, employment, productivity, capital investment, property value appreciation, and tax revenue/public expenditures also are defined and put into a context demonstrating how they result from a transportation project/program. As with the eco-nomic development concepts, a wide range of analytical methods and tools were employed by transportation agencies to quantify economic development impacts. These tools included dynamic simulation models of specific project or program scenarios, input-output models to assess impacts of specific project scenarios, and hybrid modeling systems (e.g., combining a traffic model with an economic model, and combining a land-use model with an economic model).
Guidance on Using Existing Economic Analysis Tools for Evaluating Transportation Investments
This report presents the results of a study on the use of economic analysis tools in trans-portation, including their usefulness, reliability, and data requirements for specific types of transportation projects (8). The objective of the study was to develop a practical guide to commonly used economic analysis techniques and tools that address typical transporta-tion decision-making problems. The research draws on practitioner interviews and case studies, in conjunction with available literature, to illustrate how tools can be used by practitioners to evaluate specific transportation projects. The report provides explanations from case studies drawing the links between corridor improvements and economic bene-fits, including improved access, improved perceptions of region, reduced travel times, cost reductions, increased local sales at roadside businesses due to increased traffic volume, and additional visitors to an area due to improved access. These benefits then are tied to changes in employment, population, wages, and value added. The report provides thor-ough profiles of the tools that frequently are used to analyze user benefits (e.g., HERS) and economic impacts (e.g., REMI-Regional Economic Models, Inc.). Practitioners will find this study to be a useful “survey” guide to the approaches that are used for evaluating transportation projects. The report is made more accessible by several detailed descrip-tions of how these approaches and tools have been used in “real world” applications.
Freight Benefit/Cost Study: Compilation of the Literature
The goal of this study was to assist the Federal Highway Administration (FHWA) with taking a fuller account of the economic importance of freight in transportation planning (9). In order to achieve this, the study focuses on a review of the approaches that have been used to quantify and qualify the benefits and costs of investing in improvements in intermodal links between the highway system and railroads, ports, and airports, as well as in highway corridors where significant volumes of freight move. After a review of the approaches that have been used to measure the freight benefits of transportation, the study, in its next phase, will devise a new benefit/cost model for treating the benefits of freight-transportation improvements.
The study cites several reasons for including the movement of freight as a key economic consideration in transportation planning, and highlights how transportation

Montana Highway Reconfiguration Study Final Report
Cambridge Systematics, Inc. A1-7
improvements affect freight and logistics. Lower costs and improved service in freight movement has a positive effect on firms engaged in the manufacture and distribution of goods. Reducing per-mile cost of goods carriage means that any factory or distribution point can serve a wider market area, with potential gains from scale efficiencies. It also means a factory can draw supplies from a wider area with potential gains in terms of the cost and/or quality of materials being used as inputs. Beyond lower costs to shippers, reductions in transit time and improved schedule reliability also will have significant impacts. These improvements allow firms to manage their inventories and supply chains more efficiently. Increased reliability reduces the need for higher inventory levels to pro-tect against delivery failure. Lower transit times reduce costs by allowing drivers’ time (and associated costs) to be used more efficiently. Improvements in highway and inter-modal freight carriage are one of the ways that governments can make a valuable contri-bution to the efficiency of a regional economy.
Using Empirical Information to Measure the Economic Impact of Highway Investments
Improvements along existing highway corridors and new roadways designed to lower travel times and improve connectivity are raising considerable interest as a means for achieving economic development objectives. This study, through interviews and a litera-ture review, documents the approaches used to determine the economic benefits associ-ated with highway projects (10). By identifying and recording these benefits, quantitative methods for estimating the economic impacts of transportation projects can be refined and improved. Highway projects are not homogenous, and this study demonstrates that eco-nomic benefits vary on a project-by-project basis. The study also reviews the practices (e.g., simulation models, qualitative assessments) and variables (e.g., population, income) that are used to determine the economic benefits of transportation projects, showing the advantages/disadvantages of the approaches and evaluating the reliability, accuracy, and timeliness of the data sources used to measure the benefits. The interviews showed that state departments of transportation (DOT) have a strong interest in using economic impacts as part of the highway planning process. Job creation and the stimulation of new investment were revealed as key interests for the DOTs in their efforts to more closely tie projects to economic development.
4.0 Evaluation of Economic Impact Analysis Tools and Methods
4.1 Economics-Related Impacts
Economic development can be a complex, ambiguous concept often with varied meanings for different people. For this reason, the definition of economic development impacts is not always clear or consistent between academics, practitioners, and the general public. But the consensus seems to suggest that economic development impacts relate specifically to the development of a region’s economy and thus the flow of money (and/or jobs).

Montana Highway Reconfiguration Study Final Report
Cambridge Systematics, Inc. A1-8
Weisbrod (11) provided the following working definitions for key terms used in economic analysis and explained how economic development impacts relate to these:
• Transportation system user impacts are impacts on the value of travel time, expense, and safety for travelers.
• Economic development impacts are impacts on the level of economic activity in a given area. In the context of transportation project evaluation, economic development impacts most frequently are measured in terms of changes in business output (sales), income generated (wages), and associated employment (jobs) in a given area.
• Environmental and other external impacts include impacts on air pollution, noise, visual blight, and other quality of life factors. These are often considered to be intangible or non-monetary impacts, although they can be valued in monetary terms.
• Social (or societal) impacts encompass all types of benefits and costs that have a value to society and include transportation system user impacts, economic development impacts and environmental and other external impacts.
In the transportation field, benefit/cost analysis is better known as transportation system efficiency (or user benefit) analysis, which measures the monetary value of travel time, safety, and travel costs savings of users, and compares it the with monetary costs used by the project or program. Sometimes benefit/cost analysis is broadened to include the value of other benefits to society beyond those accruing to users, such as environmental and quality-of-life factors (e.g., air quality, water quality, noise, and visual blight). Benefit/cost analysis can also include economic development impacts insofar as they are not cov-ered by the user and environmental benefits. Impacts that do not directly change the flow of money (such as time savings for personal travel) are usually not covered in economic development impact studies, although values can be placed upon these in benefit/cost studies.
4.2 Economic Development Impacts Measured
Most states that consider the economic development impacts associated with transporta-tion improvements have focused on highway investments (12). The most popular meas-ures of economic development impacts are employment, personal income, and tourism, although property values, business attraction, and business output (sales)2 also are used:
2 Two related indicators are:
1. Gross regional product – The value of goods and services produced in the region that is not purchased for further processing or resale within that region. Value added is calculated as output minus the cost of purchasing intermediate products.
2. Business productivity – A ratio of output to the cost of some input (whether labor or capital). This ratio measures the efficiency of production.

Montana Highway Reconfiguration Study Final Report
Cambridge Systematics, Inc. A1-9
• Employment – the number of jobs associated with the investment;
• Personal income – wages are the financial rewards paid to workers for the use of their services, and are usually the primary component of personal income impacts;
• Tourism – change in tourism visitor-days or visitor spending;
• Effects on property values – an increase in property values reflects a growth in demand for land and buildings as a result of business investment and growth in population, personal income, and business activity;
• Business attraction or location – total investment or new employment in an area. When an area becomes more desirable for business activity, it often results in increases in investment and economic activity associated with the relocation of outside busi-nesses to the area and expansion of existing businesses; and
• Business output – the value of all business sales of goods and services that take place in an area.
The criteria for deciding which impacts to measure typically include:
• Information/data available;
• Staff resources available;
• Analysis tools available;
• Usefulness for public information; and
• Usefulness for decision-making (11).
4.3 Tools and Methods – Brief Descriptions of Economic Impact Analysis Tools
Among state DOT’s in the U.S., there is no standard approach to estimate the economic development impacts associated with transportation projects, either in terms of the method applied or the interpretation of the results. Also, states generally have not been considering the economic development impacts associated with entire programs. One example of a state that did consider program-level economic development impacts is Maryland, who employed consultants to examine the impacts of the entire highway pro-gram over a historical period. More detail about this study is provided earlier in this document.
The various approaches used by state DOT’s to account for economic development impacts are highlighted below. States examine the economic development impacts of transportation for a variety of reasons.

Montana Highway Reconfiguration Study Final Report
Cambridge Systematics, Inc. A1-10
Multi-Attribute Scoring/Ranking/Prioritizing System
Economic development criteria are identified and account for a certain percentage of the maximum score of a project. An expert panel usually assigns the points to the various projects as opposed to conducting a quantitative modeling exercise. Iowa, Ohio, and Kansas follow this approach for their local economic development enhancement pro-grams. This type of approach also is used to help define key corridors. The Minnesota Interregional Corridor Study and Wisconsin Translinks 21/Corridors 2020 Highway Plan are good examples of this approach. The focus is on using existing data regarding eco-nomic and traffic conditions, combined with local knowledge and trends, to define key access/connectivity facilities linking to economic markets.
Surveys and Interviews
In this approach, the economic impacts of proposed projects are assessed through expert interviews, business surveys, the collection of vehicle origin-destination (O-D) data, and corridor inventory methods. In Indiana, for example, quantitative modeling of the eco-nomic development impacts of highway corridors is complemented by interviews with professionals and stakeholders. This is an approach that can be used in any analysis. Often times, local surveys and interviews complement and provide context to more quan-titative analyses (Indiana, North Country). But with any analysis technique or task, it usually is helpful to talk with local groups about the expected economic impacts. The main concern for the analyst is determining when local individuals/organizations may bias their response.
Comparable Case Studies
Case studies are used to identify the localized impacts of proposed projects by evaluating the experiences of other communities or regions that had completed similar transportation projects. Comparable case studies particularly are useful when presenting information to the public, because they often are easier to understand than detailed economic analyses. Wisconsin uses various methods to evaluate transportation projects and measure eco-nomic development impacts, including case studies to determine the specific impacts of bypass projects. It typically is useful to consider how similar transportation investment projects influenced economic development in other places, and this approach is most commonly used for local economic development and corridor identification efforts. Care must be taken to assess not only similarities, but also to understand the differences.
Checklist/Screening Tool
Some states have formal project priority formulas or ranking systems which include either quantitative or qualitative factors related to economic development. Typically, economic development considerations are one of multiple factors that enter into the project selection process, and are given a weight relative to other factors, such as safety, time savings, etc. The economic development impact or benefit often is rated based on a series of questions or concepts. For example, in Kansas, economic development is a key consideration of its “System Enhancement Program,” a program designed to fund state highway projects that

Montana Highway Reconfiguration Study Final Report
Cambridge Systematics, Inc. A1-11
improve safety, relieve congestion, improve access, or enhance economic development (13). Some of the information applicants are asked to provide include:
• A description of economic trends in the impact area (most recent five year trends showing change in jobs, jobs resulting from local firm expansions, jobs resulting from new companies or new locations, and the types of industries that created these jobs);
• A subjective assessment of how the requested highway project will strengthen the local economy; an explanation of additional infrastructure requirements that may be associated with the project and how they may be funded;
• A description of local economic development activities related to the requested high-way project;
• A listing of anticipated economic impacts resulting from the project; and
• A description of how existing businesses in the impact area would be affected by the project.
The valuation of each of these measures is determined by local experts, familiar with the project and the local area. Applications for the System Enhancement Program are reviewed by a state-selected panel of economic development experts. Another example of the checklist/screening tool approach is used in Ohio.
Market Studies
These studies assess the current level of business activity in a given area to provide a basis for forecasting changes under different future scenarios. Market data and forecasting models are used to predict how proposed projects would change the size of the market and or the cost of doing business in a specific area, impacting the area’s relative competi-tiveness and future economic growth. A Maryland study to assess the strategic invest-ment requirements associated with emerging markets and technologies for the logistics and distribution industry is a type of market study (7).
Regional Economic Simulation Models
User benefit models are the traditional method of assessing the economic impacts of transportation investments. However, they do not estimate impacts in terms of standard macroeconomic variables, such as employment, income, and GSP. Economic impact tools, often linked with user benefit models, estimate impacts on these and other economic vari-ables. The key is that economic impact tools require precise calculations of the “direct” impacts of transportation investments, such as how travel time savings reduces the cost of doing business. Dynamic (REMI) and static (IMPLAN and RIMS II) economic simulation

Montana Highway Reconfiguration Study Final Report
Cambridge Systematics, Inc. A1-12
models are described below. Other state and regional economic forecasting models do exist, but they are typically not designed for policy analysis.3
REMI. The Regional Economic Models, Inc. (REMI) model provides a representation of regional economies and predicts demand and supply changes occurring as the result of a policy change. The REMI model can be configured with any county or group of counties, including entire states. The forecasts and simulation of policy change impacts are based on a series of linked socioeconomic policy variables representing industry output, demand for goods and services, labor supply, wages and prices, and industry market shares. For example, the REMI model is capable of capturing detailed macroeconomic information on 53 industry sectors, 25 types of consumption demand, 94 occupations, and 202 age/sex cohorts, along with impacts to personal income and GSP. The links between these many input and output variables are based on observed interindustry relationships (input-output) and behavioral equations from economic theory.
Regional economic simulation models are used to forecast how future economic growth would change in a given region if various policies or projects were to be implemented. Input variables to the model are chosen to represent the direct impacts of an anticipated change in the economy, such as an expansion to highway, rail, or airport service. The REMI model then estimates the indirect and induced impacts throughout all sectors of the regional economy based on these direct impacts. For example, the model would capture key interrelationships within the economy such as the increase in competitiveness and production (sales) due to reduced transportation costs in the economy.
IMPLAN and RIMS II. Input-output (I-O) models capture the interindustry linkages of a regional economy and estimate economic multipliers. The most commonly used I-O models are IMPLAN and RIMS II.4 The IMPLAN model is privately produced by the Minnesota IMPLAN Group, Inc. and can be applied to any county or group of counties in the country.5 The RIMS II model is produced by the U.S. Bureau of Economic Analysis with geographic specificity down to the county level.6 Both models are reasonably priced ($200 to $600) and fairly easy to use. The RIMS II model simply produces multipliers by industry, while IMPLAN allows a bit more flexibility and direct calculation of total employment, output, and income impacts.
Standard economic multipliers produced by I-O models estimate two kinds of secondary impacts from direct changes to an economy: 1) indirect; and 2) induced. Direct changes to an economy usually are represented by employment, sales, or purchases (spending) due to a firm attraction or expansion, or a change in tourism. Indirect impacts result from the 3 Examples of regional and state economic forecasting models include Global Insight
(www.globalinsight.com) and the University of Montana’s short-term forecasting model developed by the Bureau of Economic and Business Research.
4The REMI model is sometimes termed a dynamic I-O model, but has enough functionality to not be considered a straight I-O model. It is discussed in the previous section. Further information about this model can be obtained through their web site (www.REMI.com).
5 Further information about the IMPLAN model can be obtained through their web site (www.implan.com) or at (651) 439-4421.
6 RIMS II information can be obtained at (www.bea.doc.gov/bea/regional/rims/) or (202) 606-5343.

Montana Highway Reconfiguration Study Final Report
Cambridge Systematics, Inc. A1-13
intermediate purchases necessary to operate a business. To the extent that local firms buy from local suppliers, then the indirect impact will be larger. Induced effects stem from the re-spending of wages in the local area earned by workers affected at the direct and indi-rect activity. In other words, if a new firm is attracted to the local area, the employees of that firm will spend some proportion of their earnings at local shops, restaurants, etc.
Regional economic simulation models in practice:
Project-level – North Country, NY. The North Country Transportation Study assessed transportation strategies that would improve economic conditions in the region between Watertown and Plattsburgh, New York. The North Country is one of the slowest-growing areas of the Northeast, and has struggled for many years with limited highway, air, and rail access to key consumer and tourist markets. Key issues that were examined in the study include the impact of limited highway access on freight and distribution industries; the potential to attract additional tourists to regional casinos, other attractions, and the Adirondack Mountains by improving highway or air service; and the potential to increase international trade through improvements to bridge crossings between New York and Ontario. There was an extensive economic development analysis for the project, including an assessment of the impact on the economy if no additional transportation investments are made as well as the relative benefits of alternative transportation strategies (14). The analysis used a REMI econometric model in conjunction with a series of spreadsheet tools to explicitly estimate the potential economic growth in the region related to transportation investments in terms of jobs, income, and population.
Findings: Traditional analysis of user benefits determined that four-lane highway con-struction projects were not cost effective (i.e., costs exceed benefits) due to relatively low traffic and congestion levels. However, an analysis of business attraction potential to the region suggests that increased accessibility to major markets (e.g., Syracuse, Albany) could increase economic activity in the study area enough to justify highway expansion. Full economic impact analysis of the preferred route estimated roughly 3,800 new jobs. Though the North Country is a fairly rural and isolated region, distance-wise, it’s not that far from major markets. In contrast, Montana is relatively far from major markets, but does provide important trade corridors with Canada and the rest of the northwestern U.S.
Program-level – Florida DOT Macroeconomic Analysis. This study for the Florida DOT is an analysis of the macroeconomic effects of program-level transportation investments at both the state and district level (15). The study includes a review of state and national efforts to estimate the economic impacts of transportation improvements; a thorough data collection process; the design of an analysis framework; and the development of a macroeconomic model to examine highway, rail, air, and water transportation linkages to Florida’s economy. Ultimately, the macroeconomic model will be applied at the state and district level and be available for future analyses. The analysis approach will focus on a combination of the Highway Economic Requirements System (HERS) model and the REMI model. HERS is a tool that uses program-level spending (rather than project-specific) to determine aggregate user benefits for a state (or the nation). The user benefits then will be translated into inputs to the REMI model to determine macroeconomic impacts of the five-year program and resource plan.
Montana Highway Reconfiguration Study Final Report
Cambridge Systematics, Inc. A1-14
Hybrid Modeling Systems
Indiana DOT’s Major Corridor Investment Benefit Analysis System (MCIBAS). Indiana identified economic development as a key strategy with its 1986 statewide trans-portation plan, adding corridors in 1991. The Indiana DOT since has designed sophisticated economic analysis tools to assess the impacts of major corridor improve-ments (16). These impacts are evaluated using a suite of planning tools, including a statewide travel demand model, a user benefit/cost analysis tool, and a highway needs analysis tool. Results from these tools are then fed into an economic analysis tool that builds upon an Indiana-specific REMI model. The model captures the impacts resulting from improved travel times, reliability and accessibility, as well as the geographical dispersion of the benefits. The economic analysis tool has four categories of impacts that sum to the macro-level impacts: 1) business competitiveness (user benefits); 2) business attraction potential; 3) tourism attraction; and 4) dynamic multiplier and feedback effects. MCIBAS was developed to be used for multiple highway investment projects, and currently is being employed on the I-69 Evansville to Indianapolis Environmental Impact Statement (EIS).
Pre/Post Case Studies
These studies typically gather “before and after” data on the localized development impacts attributed to transportation investments and occasionally compare changes over time in that region with economic changes in other regions. The Wisconsin DOT has studied the statewide impacts of highway investments through a number of in-house research reports that correlated growth in business locations and tourism with invest-ments in new highways, rehabilitation projects, and bypass routes (5). There have been at least two economic evaluations of the impact of the Appalachian Development Highways. One used regression analysis (17) to isolate the economic growth impact of construction roadways in the Appalachian region (by comparing economic growth to comparable locations not experiencing highway construction), while another study used the REMI model to simulate the impacts of the program over the past 25 years and assess potential future impacts. The regression analysis study found that Appalachian counties with highway investments benefited from statistically significant higher economic growth than comparable counties outside the Appalachian area. The REMI model study indicates that roughly 16,000 new jobs accrued to the Appalachian region by 1995 due to travel efficien-cies gained through highway investments and that this corresponds to a 1.32 benefit/cost ratio (18).
Sketch-Planning Tool
Another option to perform economic development impact analysis is to use a sketch-planning tool. Typically, this would be a more data-driven tool, relying on estimates of the relationship between transportation investments and economic activity. The term ‘sketch’ largely refers to the idea that the model may incorporate more un-modeled assumptions than a fully integrated traffic networked model/economic simulation model (which would take modeled user benefits to apply to the economic simulation model). The term ‘planning’ refers to the idea that the tool is designed to analyze many future alternative scenarios, using average relationships, with less project-specific information.

Montana Highway Reconfiguration Study Final Report
Cambridge Systematics, Inc. A1-15
One example would be to input approximate travel time savings, truck trips, and industries served into the sketch-planning tool and then calculate economic benefits in terms of employment and sales. The Columbus, Ohio Freight Transportation Investment Model (FTIM) example below provides more detail on this approach.
Columbus, Ohio Inland Port. The Mid-Ohio Regional Planning Commission (MORPC) has developed a sketch planning tool to analyze transportation projects (19). Recently, the MORPC has made a concerted effort to develop the Columbus area into an “inland port” for freight movements, primarily truck and rail. As part of the study to determine the fea-sibility of increasing freight movements and transfers in Columbus, Cambridge Systematics developed the Freight Transportation Investment Model (FTIM) to be used as a sketch-planning tool to quantify the economic impacts of freight-related projects. The economic impact methodology used project-specific data on travel time savings to motor carriers, annual truck trips, and value of time estimates to calculate direct and indirect economic impacts. The key steps in the estimation procedure are:
1. Estimate annual truck trips by truck type by project;
2. Exclude external-to-external trips and externally owned trucks;
3. Allocate truck trips by industry in the local area;
4. Calculate estimated travel time savings per trip, the value of time savings, and assign these savings to truck trips;
5. Distribute savings by private fleet versus for-hire trucks (using the Transportation Satellite Accounts) and by inputs versus value-added; and
6. Run the economic model to obtain economic indicators such as employment, sales, and income.
In the computerized version of FTIM, planners or engineers can determine the economic impact of any proposed project with annual truck volumes of up to two million and with estimated travel time savings of up to 30 minutes. Travel time savings can be estimated by using several methods ranging from simple traffic engineer estimates based on local knowledge to using sophisticated traffic network models. A three month lease of the REMI simulation model was used to estimate average economic benefits accruing to spe-cific industries due to cost savings, and this feature is built into FTIM for future analyses of projects. Projects then can be prioritized based on economic benefits relative to costs.
5.0 Review of Policies and Plans from Other States that Link Transportation and Economic Development
The previous sections provide a basic overview of the types of economic impacts that might be expected from transportation investments and common economic development impact modeling methodologies. This section focuses on existing state and regional pro-
Montana Highway Reconfiguration Study Final Report
Cambridge Systematics, Inc. A1-16
grams that attempt to link transportation and economic development, emphasizing corridor strategies. Several states have existing approaches to incorporate economic development considerations into their transportation planning activities. States have sev-eral ways of matching transportation investments to economic development, with a par-ticular focus on the way they identify areas in need.
• Promote Local Economic Development – Several states have special transportation investment programs to facilitate and promote economic development in local areas, often for specific business attraction/retention projects.
• Corridor Identification – Some states consider the expected economic development impacts as a factor in determining key economic corridors. Based on existing eco-nomic and population centers, traffic volumes, connections to other regions, etc., states designate key corridors to focus transportation investments and maintain levels of service.
• Program-Level Assessment – A few state DOTs and other transportation agencies consider the economic impacts of program-level investments.
• Impact Assessment of Large Projects – Many states consider the economic develop-ment impacts of large proposed projects as part of their broader environmental impact assessment process. For example, positive economic development impacts often are considered as a response to local concerns about the potential adverse effects of pro-posed projects. Often, contractors leading the technical analysis of large projects use sophisticated economic simulation models to both quantify the magnitude of pro-posed investments and compare/rank alternatives.
5.1 Promote Local Economic Development
These programs typically are geared to relatively small projects to help a specific firm or locality. The State ranks or prioritizes local projects that are the most worthy based on existing conditions and a qualitative assessment of future impacts.
There are two basic ways that states include economic development concerns into trans-portation planning efforts:
1. Transportation programs designed for economic development; and
2. Programs that include economic development as one of several criteria for prioritizing funding.
Transportation Programs Designed for Economic Development
Iowa’s RISE (Revitalize Iowa’s Sound Economy) Program for Roads (20). The best example of these programs is Iowa’s RISE Program for Roads, administered by the Iowa DOT Office of Project Planning. This program includes $31 million worth of funding for projects that show significant economic benefits, including economic diversification, new

Montana Highway Reconfiguration Study Final Report
Cambridge Systematics, Inc. A1-17
business attraction, small businesses development, increased exports or imports, and tourism growth. Funding is available for both immediate opportunity projects that will retain or attract a particular business or businesses and for longer-term local development projects that may target an industry more than a particular business. The RISE projects are evaluated against a number of criteria, including:
• Effect on competition;
• Economic benefits to the State;
• Amount of private capital leveraged;
• Number of jobs created or retained; and
• Regulatory violation history of the businesses being attracted
Two types of RISE projects have been identified:
1. Immediate Opportunity Projects – These projects present a definite and immediate opportunity for the creation or retention of permanent jobs. Jobs relocating from another part of the State are not considered. A 20 percent local match is required. These projects can be approved within a couple of weeks.
2. Local Development Projects – These projects have to demonstrate economic develop-ment benefits, but do not require an immediate commitment of funds. Examples include industrial parks and tourist attractions. Projects are evaluated on their devel-opment potential, local initiative and transportation and economic need demonstrated in the area of impact. Approval for development projects can take a few months.
Funding for the program comes from a dedicated fuel tax that yields approximately $31 million annually. Almost two-thirds of the available funds are spent on the state highway system, with the balance devoted to city and county roads. Job creation and retention commitments are important criteria in the project selection process and the State has subsequently tracked the extent to which those promised jobs actually have occurred.
Other Transportation Programs Designed for Economic Development. Several eco-nomic development programs provide targeted funding opportunities for specific, small-scale projects that attract employers. Wisconsin’s Transportation Economic Assistance (TEA) Program provides 50 percent funding grants ranging from $300,000 to $1 million to attract business. Eligible projects include railroad segments, access roads, widened inter-sections, airport runways, or harbor improvements. Applicants must show a measurable and permanent impact on jobs within three years. Applications are ranked on the basis of cost per job, local unemployment rate, benefits to regional transport, and proximity to other economic assistance projects. TEA committed approximately $37 million in grants to 152 projects in its first 11 years of operation.
New York’s Industrial Access Program provides funding for economic development using combined grants and interest-free loans up to a total of $1 million per project. Projects are for highway and bridge improvements that help create or retain non-retail jobs, but do not have another source of public support. Projects are selected based on the cost per job retained or created and the amount of private funds leveraged.

Montana Highway Reconfiguration Study Final Report
Cambridge Systematics, Inc. A1-18
Two states, Iowa and Maine, have specific industrial rail access programs that are targeted towards economic development. Maine’s Industrial Rail Access Program provides grants based on a project’s impacts on new employment, private investment, and new economic markets (12). Iowa’s Railroad Economic Development Program provides up to $100,000 per project for projects that stimulate economic development by providing or maintaining rail service.
Economic Development as Criterion
Several states address economic development as a criterion for project selection and their programs vary significantly.
The Kansas “System Enhancement Program” uses economic development enhancement as one of the criteria for selecting projects. Economic development constitutes 20 percent of the total score given to projects. The scores are based upon several factors: a narrative describing the benefits; estimates of business and job growth by industrial sector; a description of economic trends; estimates of changes to time, cost, and safety of travel; and descriptions of collateral infrastructure and other activities that will contribute to the project.
Ohio incorporates economic development criteria into its evaluation of major new projects (costs greater than $5 million) for inclusion in its statewide TIP. These criteria constitute 30 percent of the total score for these projects. Economic development criteria include expected non-retail job creation or retention; a measure of the severity of economic dis-tress; the cost effectiveness of investment; and the level of private sector, non-retail capital attracted to the State by the project. Rankings are determined by an expert panel, but are required to be quantitative rankings, rather than subjective statements of worth.
Pennsylvania considers economic development impacts during the needs assessment stage of its long-range planning and programming process. The Pennsylvania DOT uses a more informal calculation of economic development benefits and does not explicitly include scores for economic development concerns when selecting projects. The State incorporates economic development considerations through an examination of areas with closing industries and communities lobbying for programs that attract new industries or enhance job growth.
5.2 Corridor Strategies and Identification
Several states have identified major economic corridors that are used to target transporta-tion investments. States have different sets of criteria for selecting corridors, but the over-all focus is on ensuring state connections to regional, national, and international markets. Program examples include the following:
• Illinois’ transportation needs assessment and plan (Lifelines to the Economy) identifies formal “economic corridors” (emphasis on industrial activity) that provide direct access to rural areas and to national and international markets. In addition, an Economic Development Program was established in 1990 that provides state assistance

Montana Highway Reconfiguration Study Final Report
Cambridge Systematics, Inc. A1-19
to local governments for highway improvements needed to provide improved access to new or expanding industrial, distribution, or tourism developments. Originally, $25 million was authorized for the period 1990 to 1994. The current needs of the pro-gram are estimated at $136 million.
• The Indiana DOT identified economic development as a key strategy in its 1986 state-wide transportation plan, adding corridors in 1991. The Major Corridor Investment Benefit Analysis System (16) predicts the impacts of cost savings, business attraction, and tourism and forecasts regional changes in total employment, output, and personal income by industry.
• North Carolina’s Economic Development Highways. The Highway Trust Fund is a statewide program aimed at supporting “statewide growth and economic develop-ment objectives” by improving connections between population centers. Transportation 2001 aims to accelerate funding designated for “key economic development highways through the State” and specific corridors within the North Carolina Intrastate Highway System. To assess competing highway proposals, North Carolina incorpo-rates economic development considerations in a benefit/cost matrix (12).
• Oregon DOT maintains two separate highway funds: one for the operations, mainte-nance, and preservation of a “base system” of existing roads; and the other one for improvements to enhance the livability and economic opportunity in the State.
Detailed descriptions of corridor strategies and programs for Wisconsin, Minnesota, Mississippi, and Georgia are provided below.
Wisconsin DOT’s Translinks 21/ Corridors 2020 Highway Plan
Wisconsin DOT’s Translinks 21 planning document provides a multimodal framework for evaluating transportation priorities (21). In this process, alternative statewide transportation strategies were ranked in terms of how they affect the State’s key industries. Given this framework, more detailed plans were developed for highway, airport, rail, bicycle, and transit modes for the year 2020. The highway plan, referred to as Corridors 2020 designates 2,100 miles of roadway segments throughout Wisconsin that provide essential links between key economic centers. Divided into “backbone” and “connector” systems, these roadways link the State’s economic and tourism centers and tie Wisconsin communities to the Interstate system for improved access to national and world markets.
Ultimately, the objective is that nearly all towns in Wisconsin with a population of more than 5,000 will be within five miles of one of these routes. Roadways that are designated as corridors have performance standards regarding safety, comfort, width, passing opportunities, and congestion levels (if congestion levels are high, bypasses, widening, multi-laning, and alternative modes are considered).
Each highway considered for inclusion in Corridors 2020 was evaluated in terms of objec-tive criteria that involved a combination of operational and economic factors. Highways considered included:
Montana Highway Reconfiguration Study Final Report
Cambridge Systematics, Inc. A1-20
1. Multilane highways and existing two-lane highways with projected traffic volumes sufficient to require additional lanes by 2020;
2. Highway segments that service trade centers (trade centers were classified using the following factors: population, employment, employment diversity, property valua-tion, service receipts, retail trade, and wholesale trade);
3. Highway segments that service manufacturing centers (manufacturing centers were designated through a county by county assessment of manufacturing employment, value added by manufacture, and number of manufacturing establishments);
4. Highway segments that service agricultural centers (counties were ranked by agricul-tural production);
5. Highway segments that service forestry centers (forestry counties ranked by pulp-wood, pulp mills, and saw timber);
6. Highway segments that service recreation and tourism centers (several factors were used to determine the routes most critical to the recreation and tourism industry, including tourism establishments, employees, restaurants, lodging establishments, campgrounds, seasonal dwellings, marina berths and harbors, state parks, a number of downhill ski runs, and miles of snowmobile trails); and
7. Highway segments with average daily truck volumes greater than 1,250 in 1994 or seg-ments that are projected to have volumes greater than 2,100 by 2020.
The backbone system is intended to connect the top tier of economic and tourism centers to their principal markets and to the Interstate system. Using similar criteria as the back-bone system (but with lesser values), the connector system is intended to link lower tier economic and tourism centers to the backbone system.
Economic development also is part of the criteria used by Wisconsin’s Transportation Projects Commission when it considers bond financing for major transportation projects (e.g., building of four-lane roadways) and also is accounted for when prioritizing major highway projects in the State Transportation Improvement Plan (STIP). A multi-attribute “scoring system” is used to prioritize all major highway projects for inclusion in the STIP. Various methods are used to measure economic impacts, including the assessment of eco-nomic benefits using the REMI model, time series analyses to document how past high-way investments have affected local or statewide development (e.g., did highway corridor investments result in any industrial location decisions?), tracking business location and growth (e.g., use of surveys and GIS applications to track spatial patterns of business location and industrial concentration), and case studies (e.g., to determine the impacts of specific bypass projects).
Minnesota’s Interregional Corridor Study
Minnesota established a system of interregional corridors that will guide future decision-making through its “Interregional Corridor Study” completed in 1999 (22). This study is intended to guide the management of the important connections between the State’s

Montana Highway Reconfiguration Study Final Report
Cambridge Systematics, Inc. A1-21
regional trade centers. The improvement and protection of these connections are viewed as a strategic approach for enhancing the competitiveness and economic vitality of the State.
The economic importance of the corridors and corridor system was determined through a technical evaluation process, which provided an objective and quantitative basis for selecting the corridors. The following steps were taken:
• A set of routes to be analyzed as part of the Interregional Corridor Study was defined. With a few exceptions, these included all state highway principal arterial routes, and a limited number of minor arterial routes that were identified during initial small-group meetings.
• These routes were divided into different segments for which data on facility usage, connectivity, and growth were collected – daily traffic volumes, daily heavy commer-cial vehicle volumes, seasonal peaking characteristics, and growth in traffic volumes.
• A corridor connectivity factor was developed which gave a higher priority (impor-tance) to corridors that connect many centers or regions as opposed to corridors that serve fewer centers. Point weightings were established for connections to metropoli-tan areas (four points), primary centers (three points), secondary centers (two points) and shopping centers (one point). The weighting points were added along the corri-dor. The total number of points was divided by the total miles in the corridor to obtain the number of weighted points per mile.
• The final evaluation factor was future population growth. This factor was included to account for the location and magnitude of future population changes in Minnesota.
The above factors were used to analyze, group, and rank the corridors. A two tier approach7 was used to prevent the Minneapolis/St. Paul metro area from dominating the corridor rankings, because of higher volumes and overall activity. In addition, the inter-state routes were selected as interregional corridors, because they are part of the national system that links Minnesota to other parts of the country.
Grouping of the corridor segments into longer corridors was done through an iterative process, involving a large number of stakeholders. It was found that:
• Regional trade centers have population growth rates more than one-third higher than the prevailing average for the State;
• Regional trade centers are the primary generators of the State’s economic growth; and
• The corridors linking the regional trade centers showed substantial growth in traffic volumes over the past 10 years.
7Two tiers, the Metro Link and Greater Minnesota Tier, were identified.

Montana Highway Reconfiguration Study Final Report
Cambridge Systematics, Inc. A1-22
This approach seeks to ensure that the connections between the identified centers provide quick, safe, and predictable travel for individuals and businesses. To ensure future mobility, the study also identified the interregional corridor segments that are now or are at risk of performing poorly. Improving mobility on these short, but economically vital, sections of roadway is becoming a focus of Minnesota’s programming discussions.
Mississippi’s Economic Development Highway Program
Mississippi has initiated a statewide highway investment program (the 1987 Highway Program) largely for the purpose of economic development. This program aims to con-struct or improve highway segments in specific areas to encourage “high economic benefit projects.” These projects tend to be transportation investments at large developments, such as regional shopping malls, distribution centers, manufacturing process industries, warehousing, research and development, large hotels and resorts, or any air transporta-tion and maintenance facility.
Eligible economic projects leverage a new private investment of at least $50 million (or $20 million if the company already has a statewide capital investment of at least $1 billion) (23). Applicants also must show additional jobs and a positive benefit/cost analysis. Mississippi thus analyzes and prioritizes investment alternatives in terms of the number of additional jobs, and performs benefit/cost analyses based on user benefits. Investment impacts are not translated into a total value to the economy. Since 1987, Mississippi has built over 700 miles of four-lane highways. Cited benefits are improved safety and accel-erated economic and commercial growth.
The program is regulated through the Department of Community and Economic Development. Funds are administered through the Department of State Aid and the DOT coordinates the roadway designs and any construction to the state highways. The DOT also determines who will maintain the road(s) or transportation improvements once constructed.
Georgia: Economic Development Highways
The Governor’s Road Improvement Program (GRIP) was initiated in the 1980s by the Governor (Barnes) and represents a major state effort to widen two-lane roads and stimu-late economic development by improving the transportation network. The program con-sists of 16 “economic development highways”8 that aims to place 98 percent of the State’s cities (with a population of 2,000 or more) within 20 miles of a multi-lane highway. The program also will provide access for oversized trucks to all cities with a population of 2,000 or more (24).
During 1996, the Georgia Department of Transportation (GDOT) initiated a survey to quantify the importance of the Road Improvement program on local economies. Ques-tionnaires were sent to county commissioners and chamber of commerce officials of 100 8The economic development highways consist of existing primary routes and truck-connecting
routes.

Montana Highway Reconfiguration Study Final Report
Cambridge Systematics, Inc. A1-23
counties on or near an economic development highway.9 The following questions were included to measure the economic development impacts associated with these highways: 1) list any businesses that located in the county because of the highway; 2) pinpoint any businesses that have expanded because of the highway; and 3) indicate any businesses that did not locate in the county because the highway was not completed. Sixty-three of the 200 surveys sent out were returned – a response rate of 31.5 percent. Because the pro-gram is still being executed, its total economic impact could not be determined yet, but the preliminary study indicated substantial economic benefits associated with the Road Improvement Program.
5.3 Economic Successes of Regional and Rural Transportation Projects
Regional economic growth typically occurs when a region sells its goods and services to other regions, thereby, bringing new income into the region. Transportation provides access to markets in other regions, acting as an important link for economic growth. There also are more subtle links between the level of transportation service and the diversity of a region’s economy, and between congestion and the perceived quality of life in a region. For many rural regions, in particular, access to transportation networks can mean the dif-ference between isolation and inclusion. Highways connect rural residents to jobs, shop-ping, health care, and educational opportunities. This section provides several examples of how transportation investments have led to regional economic growth.
Appalachian Development Highway System (ADHS). The ADHS will improve access to national markets and provide intraregional linkages for portions of 13 southern and mid-Atlantic states.10 With 12 corridors and 1,400 miles of the proposed 3,025-mile network completed, the ADHS is creating thousands of new employment opportunities in retail, industry, and tourism; improving safety; and improving access to social services, health care, education, and shopping. These benefits, estimated to reach $5.5 billion over the life of the project (1965 to 2025), exceed highway construction and maintenance costs by $1.4 billion. These savings result from a greater number of lanes, improved road condi-tions, and higher speed limits. The ADHS corridors were estimated to have generated 16,000 jobs by 1995, and 42,000 jobs by 2015. These jobs are distributed across the con-struction, manufacturing, services, and retail trade sectors and would not have been cre-ated without the ADHS (18). Comparing counties in Appalachia with statistically paired counties outside the region offers additional evidence of the positive economic impact of highway building. Between 1969 and 1991, 110 Appalachian counties with development highways grew 49 percent faster in earnings, 69 percent faster in income, and six percent faster in population than their statistical twins (17).
Four Corners. A New Mexico highway widening project in the Four Corners – where Utah, Colorado, Arizona, and New Mexico come together – provides substantial economic development potential. The project is the key to improving economic development and
9There are 159 counties in Georgia. 10 The states are Alabama, Georgia, Kentucky, Maryland, Mississippi, New York, North Carolina,
Ohio, Pennsylvania, South Carolina, Tennessee, Virginia, and West Virginia.

Montana Highway Reconfiguration Study Final Report
Cambridge Systematics, Inc. A1-24
tourism opportunities in San Juan County, which has income levels only two-thirds the U.S. average (25). Widening of a 120-mile stretch of a two-lane highway (to be named U.S. 550) will provide direct four-lane access to the Mexican border in Santa Teresa. San Juan County expects a tourism boost from the project. Manufacturers in the Farmington area (including producers of conversion vans, utility trailers, anti-aircraft missiles, and hydrocoils) have already expanded in anticipation of the improved productivity that will result from better access to suppliers and markets. Agricultural producers in the region also expect to benefit from increased access to distant markets. In addition to promoting tourism and economic development, the NM 44 project has had a high level of community involvement and has generated jobs for underemployed workers. Contractors working on NM 44 received various tax and rebate credits by hiring workers who qualify for welfare-to-work programs. Training programs for commercial drivers’ licenses and the use of heavy equipment were made available to local residents, so they could take advantage of the income-generating opportunities offered by the project. By early 2000, more than 200 people had been trained with higher skill levels using these programs.11
West Virginia. In West Virginia, the construction of U.S. 19 between Sutton and Beckley caused a tourism boom in the region. Average daily traffic counts on U.S. 19 increased fourfold in the 16 years since its completion in 1978, from 2,800 vehicles to more than 10,000. By the mid-1990s, with traffic volumes well above official predictions, it became necessary to widen the road in places where two lanes had been built instead of four. New interchanges were added; further increasing tourism opportunities and the benefits to the local economy. Today, tourists come from across the country to take advantage of the region’s spectacular natural beauty and recreational opportunities, such as white water rafting. Nearly 250,000 people a year raft the New River, the Gauley River, and three other West Virginia rivers. In all, some 40 rafting businesses generate nearly $75 million a year. The less adventuresome come to admire the New River Gorge Bridge, the world’s longest single-arch steel bridge. A symbol of U.S. 19’s success as a tourist magnet, the bridge began drawing curious tourists even before its completion (26).
5.4 Conditions for Success
The case studies provide key examples of locations that successfully linked transportation investments to economic development opportunities. All of the examples involved more than just transportation investments. This Appendix provides an analysis of those pro-grams to demonstrate key sets of factors that helped lead to their success.
• Collateral Activities – Providing economic development opportunities for needy areas requires more than just investing in transportation. These areas often will need collateral activities to make the transportation investments useful. The New Mexico highway project in Four Corners included community involvement, job training, and tax credits that, in combination with the highway upgrades, comprised a total package of economic development. A complete economic investment package likely will
11 Cambridge Systematics interview with San Juan Economic Development Service, San Juan
County, New Mexico.

Montana Highway Reconfiguration Study Final Report
Cambridge Systematics, Inc. A1-25
include collateral activities like job training, business location or retention incentives, water/sewer infrastructure, etc.
• Access to Existing Markets – A key component of supporting economic development is the existence of product or labor markets to absorb increased production or provide appropriate labor. Transportation improvements that increase access to specialized labor and suppliers can increase the competitiveness and innovation of firms. Attracting the right mix of industries becomes especially important when the distances to market are large and the target area exports primary products (crops, ores, and other extraction products) without any value-added production. The North Country project in New York will provide improved connections to major markets in Syracuse and Albany. In New Mexico, the Four Corner’s project improved connections to potential markets for products and raw materials in Mexico. In Indianapolis, improvements to the downtown transportation infrastructure allowed existing business to improve their customer base and led to the return of businesses in an over-all economic development effort.
• Tourism Opportunities – Another type of potential economic opportunity comes in the form of tourism. Areas that have inherent tourism potential can use transportation investments to improve access to these activities, creating potential spill-over effects. In the North Country study, transportation improvements would provide better access to local casinos and natural attractions in northern New York. A major river for rafting was a major potential attraction in West Virginia. Further, a major bridge in that project proved to be an attraction of its own. In the Four Corners project, increased roadway capacity will improve access to natural features in the Southwest. A transportation project targeting tourism, however, may need to preserve the rural character and, thus, avoid widening a road or building an interchange.
• Existing Industries – Areas that have some existing industries are often in the best position to use transportation investments to expand those and related industries. In Boise, Idaho, transportation investments allowed Micron to go ahead with expansion plans that otherwise might have been much more difficult. These opportunities, how-ever, may require more scrutiny at the competitive position of the existing industries. Such scrutiny involves determining if they are losing market share to global competi-tion, whether or not the transportation investments sufficiently improve their cost structure, and if there is a potential to capture downstream value-added processing that would make a transportation investment more effective.
• Coordinated Investments – A commitment by private industries to invest in a particu-lar area helps ensure economic benefits. In Central Ohio, a transit center included the development of retail and service facilities to better ensure the potential for redevel-opment in the area. In New Mexico, coordination with the private sector ensured that local manufacturing plants began expansion plans to coincide with the opening of the highway, instead of waiting for the investment to be complete.

Montana Highway Reconfiguration Study Final Report
Cambridge Systematics, Inc. A1-26
5.5 Other Economic Development Considerations
The studies analyzed above point to a set of factors that shape the conditions necessary for transportation to positively affect economic development. Direct work in the field of eco-nomic development helps us to step back and consider broader conditions that define a successful intervention. This broader view is based largely on Forkenbrock’s (1990) review of economic development paradigms (27).
• Generative Versus Redistributive Impacts – One of the major considerations is whether the economic activity generated through investment creates new employment or industrial activity, or shifts from pre-existing locations, what Forkenbrock calls “raising the ante” (27, 28). Forkenbrock argues that states should not invest in an improvement that would create local jobs by shifting them from another locale. Some redistribution may be acceptable, however, if it shifts activities from high cost well-off areas to lower cost areas in need of economic development. For example, providing opportunities for back office employment in lower cost areas can shift jobs from high-cost areas to areas more needing of employment. Furthermore, these shifts may pro-duce generative impacts by lowering business costs.
• Spreading Out Impacts – Forkenbrock notes that geographic diversity is a key public policy dilemma for government. Spreading out public infrastructure investment can reduce subregional income or unemployment discrepancies, but may be at the expense of reducing the aggregate economic development potential of the region at large.
• Stimulating Private Investment – The economic development purpose of building transportation or other facilities is to facilitate private investment in an area. The level of this investment should be proportional to the cost of providing a new facility.
• Quality of Impacts – The studies reviewed rarely examine whether the economic impacts were needed or desired locally. They typically do not examine if the local population has the appropriate skills for newly created jobs or examine if wealth is retained locally. Appalachian development programs, in particular, have received some criticism for benefiting national corporations, rather than the local population (17). Though it is difficult to measure the “quality” of economic development, this should nevertheless be an important consideration in studying localized impacts.
• Cost-Effectiveness or Benefit/Cost of Impacts – Few of the studies reviewed have attempted to compare the actual impacts of the highway investments with their actual costs. Wilbur Smith Associates (1998) (18) estimated benefit/cost and net present value of the ADHS investments, although this was based on post-implementation modeling rather than empirical data collection. Cost-effectiveness also could be defined in terms of dollars spent per job created or unit of additional income, but again, this has rarely been done.

Montana Highway Reconfiguration Study Final Report
Cambridge Systematics, Inc. A1-27
6.0 Review of Site Location Literature/Importance of Highways
There has been a great deal of research over the past decade focusing on how transporta-tion affects business location decisions. This section of the literature review summarizes the highlights of this research and is organized into four subsections:
1. Surveys of business location decision-makers;
2. Guides for local investment to attract new business;
3. Analyses of specialized business location needs; and
4. Academic Research on business location patterns.
6.1 Surveys to Identify General Factors in the Site Selection Processes
There are a number of published studies which identify key considerations that influence business location decisions. Several themes concerning the basic requirements for busi-ness location and attraction (and hence conditions for economic development) consistently emerge. These include the adequacy of the region in terms of: labor force, transportation access, site infrastructure, and quality of life. These categories are interrelated, since transportation infrastructure characteristics also can affect broader transportation access patterns, as well as access to specific labor force skills. For instance:
• A national survey of leading business executives by Site Selection magazine (29) found that the top business location factors were: 1) labor availability and quality; 2) overall operating costs; 3) business climate; 4) transportation infrastructure; 5) financial incen-tives; 6) workforce training; 7) quality of life; 8) labor costs; 9) energy/utilities; and 10) proximity to large markets.
• A survey of development organizations by Site Selection magazine (30) focused on the quality of life factors that have the greatest effects on local attractiveness for corporate facilities. The survey found that recreation topped the list, followed by transportation access.
• A consortium of the nation’s major site selection consulting firms, working under the auspices of the Site Selection Task Force of the International Economic Development Council, developed “Site Selection Data Standards” (31). The standards provide mod-els for inventorying all of the key factors in site location decisions. These factors (unranked) include labor force access and costs, transportation access, utilities, education, taxes, and quality of life.
• The International City/County Management Association’s (ICMA) Guide to Business Attraction (32) lists site location requirements as labor force, location, transportation, site-specific infrastructure/utilities, financing, higher education, and quality of life.

Montana Highway Reconfiguration Study Final Report
Cambridge Systematics, Inc. A1-28
• The Business and Industrial Development Handbook (33) identifies the requirements for a successful industrial park as labor force (availability and quality); transportation service (access to expressways and airports); site conditions (topography, infrastructure, utilities, contamination); and quality of life (including housing affordability).
• The Council for Urban Economic Development’s (CUED) “Guide to What is Economic Development” (1997) (34) lists the top requirements (in rank order) as: labor availabil-ity; workforce skill levels; site and land availability; and transportation access and sound infrastructure.
• The PHH Fantus Benchmarking Study (1996) (35) listed the key factors (in rank order) to be used in site location screening as: labor availability; market access; utility service/ capacity; site and building availability; local infrastructure; and quality of life.
• An empirical survey reported in the CUED Strategies Report, Developing Strategies for Economic Stability and Growth (1987) (36), found that access to markets was the number one consideration for headquarters and R&D facilities while access to people was num-ber one for production facilities.
• A survey of research studies (37) concluded that, “the traditional location factors – markets, labor, raw materials, and transportation – remain the most important location factors.”
• An economic development guide for practitioners (38) identified 11 features of a pro-ductive economy: 1) land; 2) access to markets and materials; 3) labor; 4) capital; 5) energy; 6) finance; 7) management; 8) taxes; 9) regulatory climate; 10) research; and 11) quality of life.
• A study (39) on the components of “quality of life” noted that transportation-related fac-tors such as access to airports, colleges, and hospitals, as well as short commutes, were all leading influences on quality-of-life.
The relative importance of specific location factors differs by industry, so facilities, infra-structure, and access must be tailored to meet industry needs. A key point repeated by most of the reviewed studies is that these factors often represent necessary preconditions and each is necessary, at some level, for successful economic development.
6.2 Guides for Successful Attraction of Business to Local Industrial and Office Parks
Guidebooks on the development of office parks, industrial parks, technology parks, and other types of business parks are clear on common site location needs. Not surprisingly, the key needs for successful business parks bear a strong resemblance to the categories of individual firm needs that were cited previously. These considerations are specified in the industrial park guide, Business and Industrial Development Handbook (33). It is notable that highway access emerges as a crosscutting factor affecting three different elements of suc-cessful industrial parks: 1) labor force availability; 2) transportation service; and 3) quality
Montana Highway Reconfiguration Study Final Report
Cambridge Systematics, Inc. A1-29
of life. Access to airports with good flight service also emerges as a key location factor for office parks.
• The ULI Guide for Industrial Park Development notes the importance of analyzing the transportation network in terms of how well it provides access not only to markets and suppliers, but also to commercial services and residential neighborhoods. It fur-ther notes that, “One of the most important location considerations for a business park or a large, single-industrial site is the array of transportation services available at the site. The major difference between earlier planned industrial districts and parks, and modern business parks has been the new freedom in choice of locations made possible by the ‘clean’ uses now found in parks and by improved roads, especially the freeway network and the large trucking industry.” The guide also notes a general trend toward freeway locations for planned business parks.
• The ICMA guide to Business Attraction and Retention (32) specifies that “transporta-tion is necessary for corporate survival. To be attractive to business, a community must have access to the interstate and major state highways, easy access from high-ways to the site, guaranteed rail service with appropriately zoned adjacent lands, an airport within 30 minutes of the site and a modern telecommunications network. With respect to highways, the standard often put forth by corporate officials is that the site must be 15 to 30 minutes from an interstate or major highway.”
The general finding from the previously-noted studies and guides is that good highway access by itself is not sufficient for business attraction to occur, but that highway invest-ments – when accompanied by the continuation, upgrading, and/or strategic targeting of job skill and local site/infrastructure development – can make a difference. Explicitly rec-ognizing this fact, the Appalachian Regional Commission developed a business attraction targeting guide that is designed specifically for communities and regions receiving major highway improvements (40). The guide provides tools to assess improvements in high-way access to labor markets, customer markets, and supplier markets as well as incorpo-rate other elements related to business attraction (e.g., labor force). The guide also includes software that allows local and regional agencies to identify potential industry attraction targets and the needs that must be addressed in order to attract these industries.
6.3 Analyses of Specialized Labor and Product Delivery Needs for Business Attraction
Additional Role of Labor Force Market Access. Prior research is quite clear in estab-lishing that access to a workforce of “appropriate” size and skill level is a necessary loca-tion condition for most every type of business. In general, access to a trained and cost-competitive labor force requires: transportation access for workers; appropriate education levels for workers; and competitive labor rates for workers. Highway access defines the size of potential labor markets, while lack of highway access constrains it. Or, as bluntly stated by the ICMA Guide “Businesses will not go to places where they cannot get workers…”
Additional Role of Multimodal Freight Movement. The previously cited handbooks generally identify railroad freight handling as a consideration that is not uniformly

Montana Highway Reconfiguration Study Final Report
Cambridge Systematics, Inc. A1-30
applicable in business site location decisions, but is important for selected (rail-intensive) industries.
• The ULI’s Business and Industrial Development Handbook states that “depending on the type of industry served, transportation needs could center on a regional freeway network, railway links, air transport, or all three modes.”
• The ICMA Guide states, “Rail access is important only if a community wishes to attract firms that deal in bulk goods.”
• The Rating of Logistics Industry Sites in Expansion Management magazine (41) identi-fies 10 key factors, including industry climate, workforce, road infrastructure, conges-tion/safety, road conditions, interstate highways, taxes, railroads, water ports, and air service. It further notes, “The key to success is to be above average in the road trans-portation categories and to be strong in one or more of the others (air, sea, or rail). That pretty well mirrors what most companies are looking for when they scout out sites for a new distribution facility.”
• The IEDC Site Selection Standards (31) includes such transportation factors as motor carrier services, railroad services, commercial and general aviation airport services, and port services as critical measures in the site selection process.
Role of Reliability. Schedule reliability can be an issue for highway, rail, air, or water transportation. The research literature confirms that business sectors in which goods are perishable, costly or difficult to warehouse, high value, or subject to rapid changes in value are most sensitive to transport reliability (e.g., see Blackburn, 1991 (42)). For exam-ple, retail sellers of foods and other perishable items must use costly transport methods and cannot always stockpile goods to compensate for potential delays in incoming or out-going deliveries. Firms that produce high-technology goods face similar problems – because of rapid changes in the value of inventory, these firms and their suppliers attempt to minimize inventory levels and hence are more sensitive to the cost of delivery delays. Firms such as Federal Express and UPS, which serve these time-sensitive industries, have been locating many of their facilities outside of major cities and major commercial airports to avoid congestion, increase reliability, and better serve their customers. A study by Small et al. (1999) (43) also found that shipper and carrier surveys show dependability of service to be one of the most significant factors in the choice of carrier or mode.
6.4 Academic Studies of Highway Access and Business Location Patterns
There is a separate line of academic studies that do not look at individual business loca-tion decisions, but instead discern aggregate patterns or shifts in business location across the United States. These studies identify differences in the business attraction and growth among regions by using econometric models (44, 45, 46). The studies have found empiri-cal evidence demonstrating that shipping costs for specialized products and accessibility to specialized workforce skills explain wide differences in regional business location and productivity patterns.
Montana Highway Reconfiguration Study Final Report
Cambridge Systematics, Inc. A1-31
Some of these interregional studies have focused on the fact that it is total transportation costs rather than merely vehicle operating costs that affect business location and produc-tivity. Total logistics costs include the cost of ordering and inventory, as well as absolute travel costs (46). McCann shows that firms using heavy and bulky goods will be located close to the supplier or market, although a wider range of business location patterns also are affected by total transportation costs.
Another line of academic research studies has used statistical controls and comparisons to examine how highway access improvements affect business expansion and attraction in rural counties. Broder (1992) (47) found that most counties with new developmental highways benefited, although some were unaffected and a few experienced decline. Rephann and Isserman (1994) (48) found that the most growth occurred in counties with interstate highways and some degree of proximity to large cities or with some degree of prior urbanization.
7.0 Montana-Specific Transportation and Economic Development Documents
FHWA Economic Development Corridors Project – U.S. Route 2 – Roosevelt County/Fort Peck Indian Reservation, Montana
A 2001 study conducted by ICF Consulting for the FHWA Economic Development Corridors Project (49) describes the economic and transportation conditions in the Fort Peck Indian Reservation region and describes options for additional analysis of the impacts of transportation investment on economic development. The study examines the need for economic growth in the region, some of the challenges facing the region (e.g., high unemployment and environmental obstacles), and highlights some of the proactive measures taken by local tribes (e.g., promotion of Indian owned small businesses). The transportation infrastructure of the region is outlined along with its significance to the economy, particularly U.S. Route 2 – the east-west transportation corridor through the Reservation. Transportation issues, such as safety, planning, and current and future needs, are identified. The study concludes with the identification of multiples sources of government assistance for the funding of transportation investments in the region.
FHWA Economic Development Corridors Project – U.S. Highway 93 – Flathead Indian Reservation, Montana
Prior to the decision by the FHWA to cease all evaluation of the economic consequences of an expansion of U.S. 93 to a four-lane highway, ICF Consulting was retained to analyze the economic conditions and planned investments in the region (50). This report documents the findings of ICF’s study by describing the economic conditions of the region, particularly within the Flathead Indian Reservation, and outlining the economic benefits that would result from this particular transportation investment. The report documents the tribes’ successful economic achievements, despite being below the national

Montana Highway Reconfiguration Study Final Report
Cambridge Systematics, Inc. A1-32
and state economic standard of living, through the growth of their agricultural and tourism industries. The report further documents the significance of transportation to the economy, as well as the role U.S. Highway 93 plays in attracting and sustaining economic activity. The study found: that expansion of U.S. Highway 93 would stimulate the local economy through increased job opportunities during and after the construction; road improvements that would sustain the increased business generated during the summer tourism season and the growth of agricultural and lumber industries; and safety improvements that would reduce accidents and their associated societal costs.
An Economic Review of the Travel Industry in Montana
The Institute for Tourism and Recreation Research at the University of Montana studied the contribution of the travel industry to the Montana economy (51). The study examines how as the tourism industry grows, so does its impact on the State’s employment, income, tax revenue, and GSP. Residential and nonresident travel within the State is reviewed as well as the State’s contribution to the national tourism industry. The study found that the State achieved multiple economic benefits from the tourism industry, including a steady increase in nonresident travel expenditures which generated approximately 29,900 jobs, and 30 cents in personal income and eight cents in local tax revenue for each dollar spent by nonresident visitors. The State’s air and rail traffic also increased steadily, contributing to the overall benefits of tourism to the State.
Comprehensive Economic Development Strategies
Counties and regions within the U.S., under the guidance of the Economic Development Administration, prepare Comprehensive Economic Development Strategy (CEDS) plans. The CEDS incorporate an economic profile of the region, as well as an analysis of strengths, weaknesses, threats, recommendations, etc. Two CEDS documents, Beartooth and Bear Paw, are profiled here with respect to transportation issues (52, 53). Similar transportation strengths and issues are highlighted in each. For example, Interstate and state highways tend to be in good condition, though the regions do have some struggles in maintaining their rural road systems. It is noted that Montana receives $1.59 in Federal outlays for highways for every $1.00 paid by the State in Federal taxes. On the other hand, freight rail, dominated by Burlington Northern, is considered a hindrance as rates remain very high, largely due to a lack of competition. This has a big impact on Montana, whose considerable commodity and natural-resource based industries rely on rail as a less-expensive mode to ship their products. A final concern is that the trucking industry in Montana is dominated by inbound (import) shipments, and that there are not outbound (export) shipments for truckers to consistently have full truckloads for each leg of a trip. The CEDS indicates that higher levels of manufacturing activity in Montana would help alleviate this problem.
Montana Highway Reconfiguration Study Final Report
Cambridge Systematics, Inc. A1-33
8.0 References
1. Schrank, D., and T. Lomax, “The 2001 Urban Mobility Report,” Texas Transportation Institute, College Station, Texas (2001).
2. U.S. Department of Labor, Bureau of Labor Statistics, “Current Employment Statistics, Average Annual Averages for 2000,” http://www.bls.gov/sahome.html.
3. Nadiri, I., and T. P. Mamuneas, “Contributions of Highway Capital to Industry and National Productivity Growth,” Federal Highway Administration, Office of Policy Development, Washington, D.C. (September 1996).
4. The Florida Transportation Commission and Floridians for Better Transportation, “Transportation: An Investment in Florida’s Future,” Joint report of the Florida Transportation Commission and Floridians for Better Transportation (June 1996).
5. RESI Research and Consulting, “The Economic Impact of Maryland Highway Investment,” Towson, Maryland (1998).
6. Bell, M., and T. J. McGuire, “Macroeconomic Analysis of the Linkages Between Transportation Investments and Economic Performance,” NCHRP Report 389, Transportation Research Board, National Research Council, Washington, D.C. (1997).
7. Weisbrod, G., “Current Practices for Assessing Economic Development Impacts from Transportation Investments,” NCHRP Synthesis 290, Transportation Research Board (2000).
8. Weisbrod, G., “Guidance on Using Existing Economic Analysis Tools for Evaluating Transportation Investments (Final Report),” NCHRP Report 2-19(2), Transportation Research Board, National Research Council, Hagler Bailly Services, Inc. (October 1999).
9. Federal Highway Administration, Office of Freight Management and Operations, “Freight Benefit/Cost Study, Compilation of the Literature,” (Final Report), Prepared by the AECOM Team (ICF Consulting, HLB Decision Economics, Louis Berger Group) (February 9, 2001).
10. Federal Highway Administration, “Using Empirical Information to Measure the Economic Impact of Highway Investments,” Prepared by Economic Development Research Group and Cambridge Systematics, Inc. (April 2001).
11. Weisbrod, G., “Assessing the Economic Impact of Transportation Projects: How to Match the Appropriate Technique to Your Project,” Transportation Research Circular No. 477, Transportation Research Board, National Research Council, Washington D.C. (1997).
Montana Highway Reconfiguration Study Final Report
Cambridge Systematics, Inc. A1-34
12. MDT Transportation Planning Division, “Economic Development Performance Measures for Transportation Programming in Montana,” White Paper prepared by Cambridge Systematics (February 2001).
13. Kansas DOT, “System Enhancement Program,” (www.ksdot.org).
14. Development Authority of the North Country, “North Country Transportation Study: Social and Economic Development Impact,” Prepared by Cambridge Systematics, Inc. (in partnership with Wilbur Smith Associates) (2001).
15. Florida Department of Transportation, “Macroeconomic Impacts of the Florida DOT Work Program,” Cambridge Systematics, Inc. (February 2003).
16. Indiana Department of Transportation, “Major Corridor Investment-Benefit Analysis System,” Model Documentation, Prepared by Cambridge Systematics, Inc. (1998).
17. Isserman, A., and T. Rephann, “The Economic Effects of the Appalachian Regional Commission: An Empirical Assessment of 26 Years of Regional Development Planning,” Journal of the American Planning Association (summer 1995).
18. Wilbur Smith Associates, “Appalachian Development Highways Economic Impact Study,” Columbia, South Carolina (1998).
19. Mid-Ohio Regional Planning Commission, “MORPC Inland Port III Summary Report,” Cambridge Systematics, Inc. (March 1999).
20. Hunt, J., “Road Improvements to Promote Local Economic Development: An Iowa Case Study,” Center for Transportation Research and Education, Iowa State University (1996).
21. Wisconsin DOT, “Translinks 21,” (1994).
22. Minnesota DOT, “Interregional Corridor Study,” (1999).
23. Federal Highway Administration, “Linking the Delta Region with the Nation and the World,” (1996).
24. Georgia DOT, “Governor’s Road Improvement Program (GRIP),” (www.dot.state.ga.us/DOT/plan-prog/planning/programs/grip/Index.shtml).
25. Bureau of Economic Analysis, “Local Area Personal Income,” www.bea.doc.gov/bea/regional/reis.
26. Casto, J., “West Virginia’s Corridor L Opens the Door to Tourists,” Appalachia (May–August 1996); M. Mason, “Whitewater Rafting in West Virginia a Young But Exuberant Pastime,” Outside (August 20, 1998).

Montana Highway Reconfiguration Study Final Report
Cambridge Systematics, Inc. A1-35
27. Forkenbrock, D. J., T. F. Pogue, N. S. Foster, and D. J. Finnegan, “Road Investment to Foster Local Economic Development,” Public Policy Center, University of Iowa, Iowa City Iowa (1990).
28. Forkenbrock, D. J., “Putting Transportation and Economic Development into Perspective,” Transportation Research Record 1274, pp. 3-11 (1990).
29. Venable, T., “The New Business Location Process, Who’s Driving and Who’s Steering,” Site Selection (April 1996).
30. Venable, T., “Recreation, Transportation Top Quality of Life Improvements,” Site Selection (August 1990).
31. IEDC Site Selection Task Force, “Site Selection Data,” Standards, International Economic Development Council, Washington, D.C. (2001).
32. Kotval, Z. et al., “Business Attraction and Retention: Local Economic Development Efforts,” ICMA – International City/County Management Association, Washington, D.C. (1996).
33. Urban Land Institute, “Industrial and Office Park Council: Business and Industrial Development Handbook,” ULI – The Urban Land Institute, Washington, D.C. (1988).
34. Council for Urban Economic Development, “What is Economic Development?” Washington, D.C. (1997).
35. PHH Fantus Consulting and Council for Urban Economic Development, “Benchmarking Practices to Achieve Customer Driven Economic Development,” CUED – National Council for Urban Economic Development, Washington, D.C. (1996).
36. Council for Urban Economic Development, “Developing Strategies for Economic Stability and Growth,” CUED – National Council for Urban Economic Development, Washington, D.C. (1987).
37. Blair, J., “Local Economic Development: Analysis and Practice,” Sage Publications, Thousand Oaks, California (1995).
38. Lyons, S., and R. Hamlin, “Creating an Economic Development Action Plan: A Guide for Development Professionals,” Praeger Publishers, New York (1991).
39. Smith, M., and S. Nance-Nash, “The Best Places to Live Now,” Money (September 1993), pp. 124-129.
40. Economic Development Research Group, “Targeting Economic Development Opportunities from Appalachian Development Highways: A Guide,” Appalachian Regional Commission, Washington, D.C. (2001).
Montana Highway Reconfiguration Study Final Report
Cambridge Systematics, Inc. A1-36
41. King, B., and L. Gramkow, “The 100 Most Logistics Friendly Cities,” Expansion Management (September 2001).
42. Blackburn, J. T., “Time-Based Competition: The Next Battleground in Manufacturing,” Business One Irwin, Homewood, IL (1991).
43. Small, K. A., R. Noland, X. Chu, and D. Lewis, “Valuation of Travel-Time Savings and Predictability in Congested Conditions for Highway User-Cost Estimation,” NCHRP Report 431, Transportation Research Board, Washington, D.C. (1999).
44. Krugman, P., “Development, Geography, and Economic Theory,” The MIT Press (1995).
45. Ciccone, A., and R. Hall, “Productivity and Density of Economic Activity,” The American Economic Review, Vol. 86, No. 1, (1996), pp. 54-70.
46. McCann, P., “Rethinking the Theory of Industrial Location: The Logistics-Costs Argument.” 5th World Congress of the Regional Science Association International, Tokyo, Japan (1996).
47. Broder, J. M., T. D. Taylor, and K. T. McNamara, “Quasi-Experimental Designs for Measuring Impacts of Developmental Highways in Rural Areas,” Southern Journal of Agricultural Economics, Vol. 24, No. 1 (1992).
48. Rephann, T. J., and A. M. Isserman, “New Highways as Economic Development Tools: An Evaluation Using Quasi-Experimental Matching Methods,” Regional Science and Urban Economics, Vol. 24, No. 6 (1994).
49. Ostria, S., “FHWA Economic Development Corridors Project – U.S. Route 2 – Roosevelt County/Fort Peck Indian Reservation,” Federal Highway Administration, Prepared by ICF Consulting (July 2001).
50. Ostria, S., “FHWA Economic Development Corridors Project – U.S. Highway 93 – Flathead Indian Reservation,” Federal Highway Administration, Prepared by ICF Consulting (July 2001).
51. Institute for Tourism and Recreation Research, “An Economic Review of the Travel Industry in Montana – 2000 Edition,” The University of Montana (June 2000).
52. Beartooth Economic Development District, “Comprehensive Economic Development Strategy,” (December 2001).
53. Bear Paw Development Corporation of Northern Montana, “Comprehensive Economic Development Strategy 2002 Update,” (June 2002).

Montana Highway Reconfiguration Study Final Report
Cambridge Systematics, Inc. A2-1
Appendix A2. A Comparison of Commodity Flow Forecasting Techniques in Montana
Abstract
A comparison is described for two methods of developing commodity flow forecasts at a sub-state level of geography. The first process is a simplified method that relies entirely upon the commodity percentage increases provided at the state level in the Federal Highway Administration (FHWA) Freight Analysis Framework (FAF) database. The sec-ond method uses a combination of sub-state employment data and input-output analysis to distribute the forecasted growth for each commodity to each zone in the study area. The differences between these two methods are shown geographically and in table form at the county-level of detail. Additionally, a chi-squared goodness-of-fit test is used to determine whether the two forecasting methods are statistically different for inbound, outbound, and internal flows. The majority of the analysis in this paper is taken from the commodity flow freight forecast created for the Montana Department of Transportation Highway Reconfiguration Study. The results of this comparison are then discussed in the context of the transportation planning decisions that are potentially improved by using the enhanced rather than simplified forecasting method.
Introduction
This paper compares two commodity flow forecasting procedures to determine the bene-fits of using an enhanced forecasting technique that takes into account the relative growth rates of different industries at the county level as compared to simply applying state level commodity forecasts to all county-level flows. The simplified methodology is of interest, because state-to-state commodity flow forecasts are now available from the FHWA FAF. If these growth rates can effectively be applied to county-to-county base year commodity flow data (which many states are now obtaining from commercial sources), it will be pos-sible to easily develop commodity flow trip tables for sketch planning freight forecasting models, something that many states are interested in doing. On the other hand, if it is possible to enhance this methodology with generally available employment forecast information at the county level and inexpensive input-output tables, states will be able to apply the enhanced methods and improve their forecasting capabilities. The objective of
Montana Highway Reconfiguration Study Final Report
Cambridge Systematics, Inc. A2-2
this methodology is to compare the two approaches to see how different the results achieved may be so that states can make informed choices about which approach may be best for them.
Background on Freight Forecasting
A literature review of recent work in freight forecasting shows several examples of the allocation methods described in this paper. In 1983 an NCHRP report first discussed many of the basic methods for freight forecasting, including a schematic of the simplified and enhanced freight forecasting techniques described in this paper (1). Pendyala et al. (2, 3) and Stammer et al. (4) later provided comprehensive reviews of the development of freight modeling, including regional freight forecasting. In 1993, a separate NCHRP report surveyed the extent of freight forecasting, finding that neither freight forecasting, nor planning was major elements in the state transportation planning practices (5).
However, since 1993 a number of developments have been underway to incorporate freight forecasting into state transportation plans. Some states such as Indiana (5), Wisconsin (6), and California (7) employed simplified freight forecasting techniques into long range transportation plans. In Indiana, Black and Palmer describe how 1993 Commodity Flow Survey data was used to estimate both truck (and rail) trips to be dis-tributed throughout the State. In Wisconsin, forecasted freight flows were disaggregated from the state to the county level using an approach similar to the approach described in this paper. In California, historical trends from the 1995 TRANSEARCH Database by Reebie Associates were used to predict future freight movements for the Intermodal Transportation Management System (ITMS) database.
In parallel with the forecasting methods cited above, freight modeling applications began to employ the geographic allocation methods described in this paper as part of the “enhanced” freight flow analysis. Examples of some of the initial work using geographic allocation techniques are in Pennsylvania (8) and in the Southern California Association of Governments truck model (9, 10). Marker and Goulias included a description of disaggre-gating data in urban areas by employment and household data to Traffic Analysis Zones (TAZs) for the State of Pennsylvania. In Southern California, Fischer et al describes a process to aggregate county-level data to TAZs using employment, land use, and com-mercial facility data. Additionally, input-output modeling techniques were employed to determine allocation of inbound flows to both consumer demand and producing indus-tries. Similar regional freight modeling work has been done in Seattle (11), Portland (12), Ohio (13) and Montana (as described in this paper), and are currently underway in California for the ITMS forecast update.
This sample of available literature across several states suggests that freight forecasting and planning methods are becoming more widespread. This paper furthers research in freight forecasting by statistically quantifying the differences between the simplified and enhanced forecasting techniques.

Montana Highway Reconfiguration Study Final Report
Cambridge Systematics, Inc. A2-3
Description of Forecasting Methodologies
Existing Base and Future Year Commodity Flow and FAF Data
The base year commodity flow data for the Montana Highway Reconfiguration study is a truck trip table originating from the Reebie TRANSEARCH Database, and modified to represent county-to-county daily truck tons for the year 2001. This dataset used two-digit Standard Transportation Commodity Code (STCC) values to represent commodities for each trip record. The commodity flow data are at the county level within Montana, although outside the State, trips are grouped into external regions. Because Reebie routes county-to-county flows on a national network, a unique route is designated for each O-D pair. Based on these routings, external counties are grouped by specific routes entering or leaving the State. In total, there were 6 external regions. There are three links in the west, two in the east, and one directly south into Wyoming. These regions spread across all geographies that would most likely be served using the particular state highway that pro-vides access to each region.
The FHWA FAF systems analysis tool includes estimates of commodity flows at the state level by mode for 1998, 2010, and 2020 at the two-digit STCC code level. These commod-ity flow data were created by Reebie Associates and Global Insight as part of a major effort to quantify the freight flows in the country.
The base and forecast year for the Montana Highway reconfiguration study were 2001 and 2025 respectively. Therefore, the FAF data growth rates were modified by a straight-line method from 1998 to 2001 for the base year data and 2020 to 2025 for the long-term fore-cast data for application within the Montana study.
Simplified Forecasting Methodology
In the simplified forecasting methodology, commodity-specific growth rates from the FAF data in Montana are applied directly to the tonnages in the base year county-to-county commodity flow database. For example, forecasted truck tons for agriculture from Missoula County to Cascade County are estimated by taking the base year truck tons of 213 tons and applying the forecasted growth rate of 29 percent for internal truck tons for agriculture in the State of Montana from the FAF data. Forecasted truck tons for agriculture from Missoula County to regions outside of Montana are estimated by taking the base year agricultural truck tons of 78,085 tons and applying the growth rate of 30 percent for external truck tons for agriculture in the State of Montana. For the forecast of inbound data, a similar process was used based on the growth rates of the inbound commodities from the FAF data. Table 1 shows the calculation of the outbound growth rates for each commodity from the FAF data. Table 2 shows the calculation of the forecast of agriculture for a selection of origin-destination combinations for the Montana commodity flow database.
Montana Highway Reconfiguration Study Final Report
Cambridge Systematics, Inc. A2-4
Truck trips through the State of Montana (without an origin or destination inside the State) are estimated by applying the national FAF growth rates for each commodity rather than the state-level commodity forecasts.
Enhanced Forecasting Methodology
The enhanced forecasting methodology was employed in the creation of a commodity flow forecast for the State of Montana for the Montana Department of Transportation Highway Reconfiguration Study. Montana is currently examining the potential economic benefits of reconfiguring several two-lane rural highways into four-lane highways. Some citizens and business leaders in the State believe this will provide for improved freight mobility thus leading to business attraction and retention opportunities. In order to study this option and provide capability to examine other transportation/economic develop-ment issues, the State has commissioned the development of an analytical tool that builds on commodity flow analysis. The forecasting methodology described below was devel-oped as part of the analytical tool.
Internal and Outbound Truck Trips
The enhanced forecasting methodology uses sub-state level economic demographic data to geographically allocate the future year tonnages estimated from the FAF data to each of the sub-state zones. Forecasted growth in tons, as estimated in the FAF data, are used as a control total for the geographic allocation procedure. For the Montana freight forecast, the state-level FAF data were allocated to counties using county-level employment and population data.
Employment data was obtained from Woods and Poole Economics, Inc. and are summa-rized for each county in Montana by 13 industry categories from 1970 to 2025. For each county in the state, the change in employment for each industry over the study period was calculated. There are far fewer industry categories in the Woods and Poole employment data relative to the two-digit STCC codes in the commodity flow tables. Therefore, a con-version table was created to match each of the commodities in the truck trip table to one of the 13 industry categories in the employment data. The conversion table was created based on the primary commodities produced by each of the industries. Applying this conversion table to the existing employment data resulted in a distribution of employment for each commodity across each county.
The distribution of employment for each commodity across each county is then used to distribute the forecasted tons of each commodity to each county. A conceptual example of this process is shown in Table 3. The 300 tons of growth in outbound production of STCC A are distributed to each county, based on the distribution of employment in STCC A. The process is performed separately for outbound and internal trips.
It should be noted that the mechanics of this forecast process occasionally produce nega-tive forecast tons for cases when the growth in a commodity is negative. In this case, a correction was applied of setting the negative forecast to zero, and proportionally

Montana Highway Reconfiguration Study Final Report
Cambridge Systematics, Inc. A2-5
decreasing all of the positive flows for that commodity (for either internal or outbound trips). This eliminated any negative commodity flow forecasts, and ensured that the growth in tonnage was consistent with the control totals in the FAF data.
Inbound Truck Trips
For trips coming into the state of Montana, a modified methodology was applied to take into account the fact that the inbound goods are consumed in the state rather than pro-duced in the state. A particular commodity is often consumed by multiple industries and sometimes by individual consumers. As noted above, for internal and outbound flows, each commodity was matched to a single producing industry. For inbound flows, for each commodity, the distribution of this commodity to its consuming industries (and personal consumption) must be created. Therefore, the first step in the forecast process for inbound flows is to determine what share of an inbound commodity is consumed by each of the consuming industries and by personal consumption. These consumption shares can be calculated using an economic input-output (I/O) model.
In Montana, a one-digit industry I/O table was used to develop the distribution for each commodity. For each commodity, there is a matching consuming industry and consump-tion percentage. For example, if 20 percent of all STCC 1 inbound flows are consumed by the Agriculture Industry, then this percentage will be used to convert the total inbound commodity flows.
After allocating each commodity to consuming industries, the distribution of each inbound commodity to each county was calculated based on county-level employment data similar to the internal and outbound procedure described in the previous section. The commodities assigned to personal consumption were allocated to counties based on the relative growth in population from each county based on Woods and Poole population forecasts. The Woods and Poole population data came in the same format as the employ-ment data, for consecutive years between 1970 and 2025, where 2001 and 2025 data was used to determine growth rates.
Comparison of Forecasting Methodologies
Geographic Comparison of Two Forecasting Methodologies
The enhanced forecasting process creates a different future year commodity flow database compared to the simplified method. Figures 1 and 2 spatially show the difference by mapping the growth in tonnage for each county between the base year and forecast year for the simplified and enhanced methodologies, respectively. Because the simplified method allocated equal increases to all existing base year tons, the allocation method is proportional to the existing base year tonnages. The counties with the highest amount of base year tons (Yellowstone, Missoula, and Gallatin Counties) and the lowest existing tonnage (Golden Valley, Petroleum, and Deer Lodge) are represented proportionally in

Montana Highway Reconfiguration Study Final Report
Cambridge Systematics, Inc. A2-6
the forecast. In Figure 2, tonnage allocation based on the enhanced forecasting is based on employment changes in each county. Therefore, counties with the highest employment growth between 2001 and 2025 (Ravalli, Richland, and Gallatin) have the highest tonnage allocations. Additionally, the counties with the largest employment declines are allocated the fewest amounts of tons, such as in Sweet Grass, Roosevelt, and Cascade Counties.
Tabular Comparison of Two Forecasting Methodologies
The two forecasting methodologies produce different results for the final forecasts for the Montana truck trip table. For the inbound trips, the difference between the enhanced and simplified forecast methods was within 50 percent for only 12 of the 56 counties. Thirty-two of the 56 counties had differences greater than 100 percent between the two method-ologies. For outbound trips, 31 of the 56 counties had differences greater than 100 percent. While for internal trips 28 of the 56 counties had differences greater than 100 percent. Table 4 shows the base year tons and forecast tons for each of the two methodologies for outbound trips from each county.
From existing Montana truck trip data, the following counties had the highest commodity flow movement percentages: Yellowstone (30 percent), Missoula (15 percent), Gallatin (12 percent), Cascade (eight percent), and Jefferson (eight percent). These five counties currently comprise over 72 percent of the total state truck movements; while the top three counties account for over half of all statewide flow. Table 5 provides summary information regarding the base year, simplified forecast, and enhanced forecast for these five counties. The table shows that for these counties, the projected forecast allocations significantly differ over all trip types.
For the enhanced forecasting methodology, the counties with the largest tonnage alloca-tion are those with the highest employment growth between 2001 and 2025. Gallatin County, currently third in commodity flow movements, has a large employment growth between the study period base and future years. As shown in Table 5, Gallatin also has a high allocation of future year truck tons from the enhanced methodology forecast.
Statistical Comparison of Two Forecasting Methodologies
Chi-Squared tests were used to determine whether or not the distribution of tonnage from each of the two forecasting methods produced distributions that were statistically differ-ent. These tests were performed separately for internal, inbound, and outbound trips. The null hypothesis tested in each chi-squared test was that the distribution of tonnage from the simplified forecast was the same as the distribution of tonnage from the enhanced forecast.
The first distribution was sectioned from 56 counties (Yellowstone National Park County was not included), into four growth categories of 14 counties each. By splitting the initial forecast distribution into four uniformly-sized categories, the expected cell frequency into each category, for the second distribution being tested, would be 14 occurrences. The chi-

Montana Highway Reconfiguration Study Final Report
Cambridge Systematics, Inc. A2-7
squared test statistic for each test performed possessed three degrees of freedom. Therefore, with 90 percent confidence (α = 0.10), the null hypothesis would be rejected whenever X2 > 6.25. Table 6 has results of each of the chi-squared tests performed.
In each the internal, inbound, and outbound tests, the null hypothesis was rejected. The sums of squared errors for each trip type were 28.71, 38.57, and 48.99, respectively. Since none of these test had chi-squared results less than 6.25, the simplistic and enhanced fore-casts could never be assumed to have the same distribution. The varying forecast alloca-tion methods statistically produce significantly different results.
Commodity-Specific Comparison of Two Forecasting Methodologies
This section provides a commodity-specific comparison between the two noted fore-casting methods. The simplified and enhanced forecasts for the largest-volume commod-ity in Montana (agriculture/STCC 1) are shown in Figures 3 and 4. The total forecasted agricultural growth is 7.4 million tons for each method. In the simplified forecasting pro-cedure, the tonnage growth is distributed evenly, increasing each existing county total by 30.2 percent (the growth rate projected in the FAF). In the enhanced procedure, the growth is allocated across all the counties based on the distribution of employment growth in agriculture for each county. Table 7 shows the outbound base year and forecasted agricultural tons for five counties (with the highest existing agricultural tonnage movements).
The counties with the highest outbound tonnage in the base year are Lake, Gallatin, and Beaverhead Counties. The lowest base year movements are in Petroleum, Golden Valley, and Hill Counties. Figure 3 shows that for both the high- and low-volume counties, the simplified forecast allocates proportionally to the existing values. Similarly, the forecast patterns shown in Figure 2 (for all commodities) are similar to Figure 4 (commodity-specific). The highest outbound tonnage values are allocated to the counties with the largest growth in agricultural employment: Stillwater, Gallatin, and Flathead Counties. The white space on the map shows that the counties with the largest employment decline also have the lowest allocations.
These commodity-specific maps (Figures 3 and 4) look slightly different than the out-bound total commodity tonnage allocation maps (Figures 1 and 2). These differences may be due to the data sources used in the agricultural forecasts. The base year tonnage data was from the State of Montana Agricultural Commissioners Data, collected by crop across counties. Therefore, the simplified forecast method (and allocation) is very representative of agricultural movements across the state. The employment data from Woods and Poole, however, may be biased in agricultural employment locations. Some data may be misal-located from rural production areas to the urban centers where company headquarters are based. The map showing the outbound enhanced forecasting allocation shows future year tonnage concentrated in western Montana where the majority of population and employ-ment opportunities reside rather further east where many of the farms are actually located. Conceptually, this problem of headquarter-bias can be corrected by using a sur-rogate variable other than employment (such as farm acreage) to distribute the tons.
Montana Highway Reconfiguration Study Final Report
Cambridge Systematics, Inc. A2-8
Comparison of Enhanced Forecast by Truck Trip Type
Chi-squared comparisons already determined that the simplified and enhanced method forecasts differ slightly. Finally, to augment the analysis, a question among trip types – asking if forecasts across outbound, inbound, and internal trip forecasts had similar distri-butions – was considered. Three chi-squared goodness-of-fit tests were preformed com-paring the distribution of growth between the base year and the enhanced forecast method for each trip-type combination. Tests were performed between internal and out-bound, internal and inbound, and outbound and inbound commodity flow forecast distri-butions. The null hypothesis tested in each of the respective chi-squared tests, was that the second distribution in each set of trip type combinations would match the distribution of the first noted allocation distribution.
The set-up for these chi-squared tests was similar to that of the comparative forecast allo-cation tests noted above. The initial forecast distribution was split into four categories, with 14 occurrences expected for each cell frequency, for the second distribution being tested. The chi-squared test statistic for each test performed possessed three degrees of freedom, and with α = 0.10, the null hypothesis was rejected if X2 > 6.25. Table 8 has results of each of the chi-squared tests performed.
The first result of the three chi-squared tests showed that the internal and outbound fore-casts have similar distributions. Because the same methodology of allocating tonnage by destination-county employment was used for each of these trip type forecasts, the similar distribution patterns are expected. The sum of squared errors was 1.28 (which is < 6.25), saying that the outbound forecast fits the same enhanced-method internal forecast with a 90 percent confidence interval. Additional analysis found that each of these trip type fore-casts also matched the distribution of the statewide employment growth across counties (where compared to the employment distribution, the outbound forecast X2 = 3.85, and the internal forecast X2 = 1.14).
The second finding, as shown in Table 8, revealed that the inbound forecast distribution did not match the distribution for neither the internal nor outbound forecast. The respec-tive sums of squared errors for these tests were 25.43 and 23.14. In each of these cases, X2 is greater than 6.25 and the hypothesis that the respective distributions are similar is rejected. In the enhanced forecasting methodology, inbound trips were allocated based on both employment and population, in order to allocate commodities consumed by pro-ducing industries, as well as those used for personal consumption. An initial comparison of the employment and population distributions for growth between 2001 and 2025 found that these datasets did not have similar distributions either (where X2 = 12.43). The differ-ences in the employment and population data, and the methodology of forecasting inbound trips, employing each of these varying datasets, explains the previous results, where the inbound forecast distribution does not match neither the internal nor outbound forecasts. These findings indicate that by using the enhanced forecasting methodology, there will be statistical variation in the final allocation results by trip type.
Montana Highway Reconfiguration Study Final Report
Cambridge Systematics, Inc. A2-9
Conclusion
The analyses in this paper show that the enhanced methodology for forecasting freight flows which includes geographic allocation of growth based on employment growth pro-duces statistically different results from the simplified method that has no geographic allocation. This was found to be true for all trip types: outbound, inbound, and internal. Tabular results of the agricultural commodity also indicate that there are significant dif-ferences in the allocation of the forecasts at the commodity level between the two meth-ods. A separate statistical test indicates that the use of input-output data in the enhanced methodology for inbound trips results in a different distribution than the outbound and internal flows which do not require the use of input-output data to allocate the growth. Overall, the enhanced methodology produces a freight forecast that is statistically differ-ent from the simplified methodology in terms of both geography and trip type.
Implications for Transportation Planning
The significant differences between the two freight forecasting methods indicate that for transportation planning purposes the enhanced forecast methodology will provide a more accurate picture of freight flows for a region. The extent of the difference between the two forecasts depends on the spatial variability of employment in the region of concern rela-tive to the size of the internal zone structure, given that employment is used as a surrogate for goods production in a zone. In Montana, the differences were significant enough that it could influence the estimated impacts of various projects, and potentially influence project selection. However, because applying the enhanced forecasting method requires a significant amount of analytical resources, transportation agencies will need to tradeoff the planning benefits derived from the enhanced forecasting methodology with the time and resources needed to develop the enhanced forecast. Ultimately, incorporation of the enhanced forecasting method is more useful for long-term and larger regions. Further research could compare these forecasting methods for past data to see which forecast would most closely resemble current commodity flow values. An examination of the validity of forecasts in freight planning applications in general would be of interest.
Potential Improvements to Enhanced Methodology
An improved methodology for estimating through trips could determine the statewide outbound commodity growth rates for each unique origin-state record that passed through Montana rather than a single national growth rate. This improved method for forecasting tonnage to other states is currently being applied in other forecasting proce-dures such as for the ITMS Forecast Update for the California Department of Transportation. Another improvement on the enhanced methodology would include a more-detailed two-digit STCC I/O conversion application. This method has been employed in some other commodity flow calculations such as the development of the commodity flow table for the San Joaquin Valley truck model. Although we used Reebie

Montana Highway Reconfiguration Study Final Report
Cambridge Systematics, Inc. A2-10
statewide data, a final improvement could incorporate purchased county-level Reebie data in the methodology, as well.
Acknowledgments
The authors thank the staff of the Montana Department of Transportation, and especially Dick Turner and Susan Sillick (co-managers of the Reconfiguration Study), for permission to use the analysis from the Montana Highway Reconfiguration Study for this paper. In addition, the authors wish to thank all of the members of the Reconfiguration Study Steering Committee (RSSC) and the RSSC Chairman Dan Rice for their initiation and guidance of the study. The contents of this paper reflect the views of the authors, who are responsible for the facts and accuracy of the research presented. These views do not nec-essarily reflect the views or policies of the Montana Department of Transportation.
References
1. Memmot, F. W., “Application of Statewide Freight Demand Forecasting Techniques,” NCHRP Report 260, TRB, National Research Council, Washington, D.C. (1983).
2. Pendyala, R. M., V. N. Shankar, and R. G. McCullough, “Freight Travel Demand Modeling: Synthesis of Approaches and Development of a Framework,” TRB, National Research Council, Washington, D.C. (2000), pp. 9-16.
3. Shankar, V. N., and R. M. Pendyala, “Freight Travel Demand Modeling: Econometric Issues in Multi-Level Approaches,” The Leading Edge of Travel Behavior Research, Elsevier Science Publishers, B.V., The Netherlands (2001), pp. 629-644.
4. Stammer, R. E., Jr., and G. Pratt, “Statewide Modeling Practices and Prototype Statewide Model Development for Tennessee,” Report TNSPR-RES-1147, Tennessee Department of Transportation, Nashville, TN (2002).
5. Black, W. R., and J. Palmer, “Transport Flows In the State of Indiana: Commodity Database Development and Traffic Assignment Phase I,” Transportation Research Center, Indiana University, Bloomington, IN (1993).
6. Cambridge Systematics, Inc., “A Guidebook for Forecasting Freight Transportation Demand,” NCHRP Report 388, TRB, National Research Council, Washington, D.C. (1997).
7. “Directory of Transportation Data Sources,” Report DOT-VNTSC-BTS-95-1, BTS, U.S. Department of Transportation (1995).
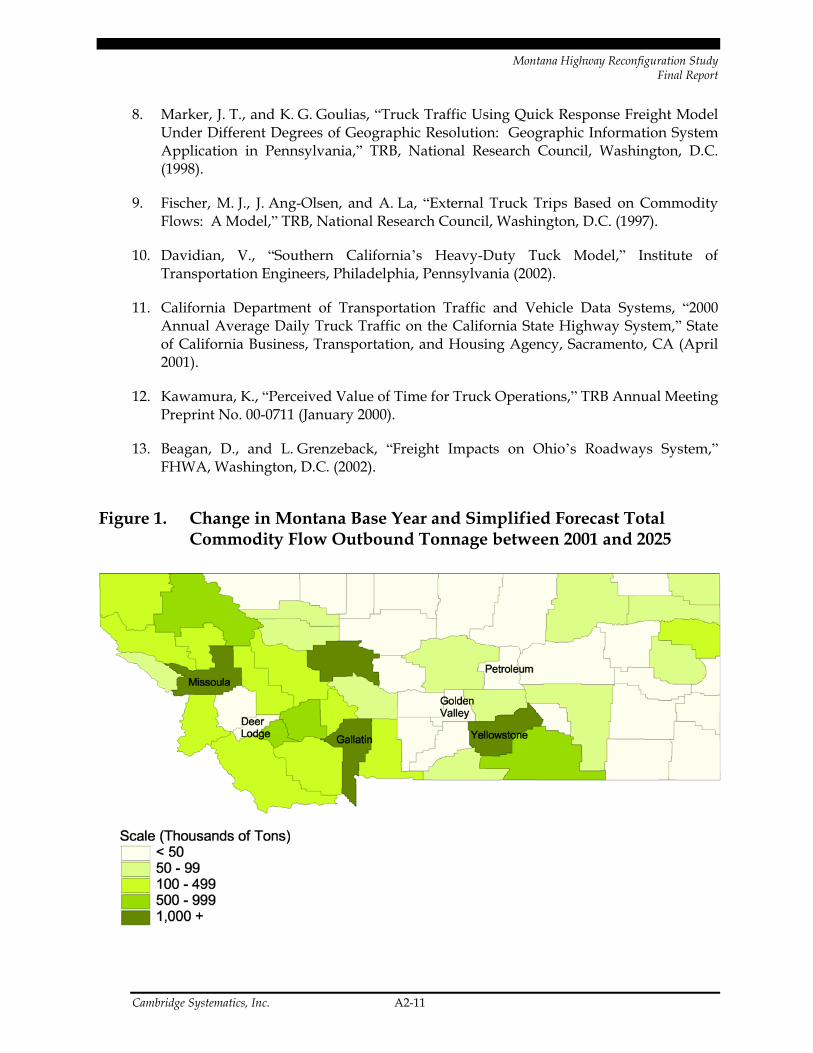
Montana Highway Reconfiguration Study Final Report
Cambridge Systematics, Inc. A2-11
8. Marker, J. T., and K. G. Goulias, “Truck Traffic Using Quick Response Freight Model Under Different Degrees of Geographic Resolution: Geographic Information System Application in Pennsylvania,” TRB, National Research Council, Washington, D.C. (1998).
9. Fischer, M. J., J. Ang-Olsen, and A. La, “External Truck Trips Based on Commodity Flows: A Model,” TRB, National Research Council, Washington, D.C. (1997).
10. Davidian, V., “Southern California’s Heavy-Duty Tuck Model,” Institute of Transportation Engineers, Philadelphia, Pennsylvania (2002).
11. California Department of Transportation Traffic and Vehicle Data Systems, “2000 Annual Average Daily Truck Traffic on the California State Highway System,” State of California Business, Transportation, and Housing Agency, Sacramento, CA (April 2001).
12. Kawamura, K., “Perceived Value of Time for Truck Operations,” TRB Annual Meeting Preprint No. 00-0711 (January 2000).
13. Beagan, D., and L. Grenzeback, “Freight Impacts on Ohio’s Roadways System,” FHWA, Washington, D.C. (2002).
Figure 1. Change in Montana Base Year and Simplified Forecast Total Commodity Flow Outbound Tonnage between 2001 and 2025

Montana Highway Reconfiguration Study Final Report
Cambridge Systematics, Inc. A2-12
Figure 2. Change in Montana Base Year and Enhanced Forecast Total Commodity Flow Outbound Tonnage between 2001 and 2025
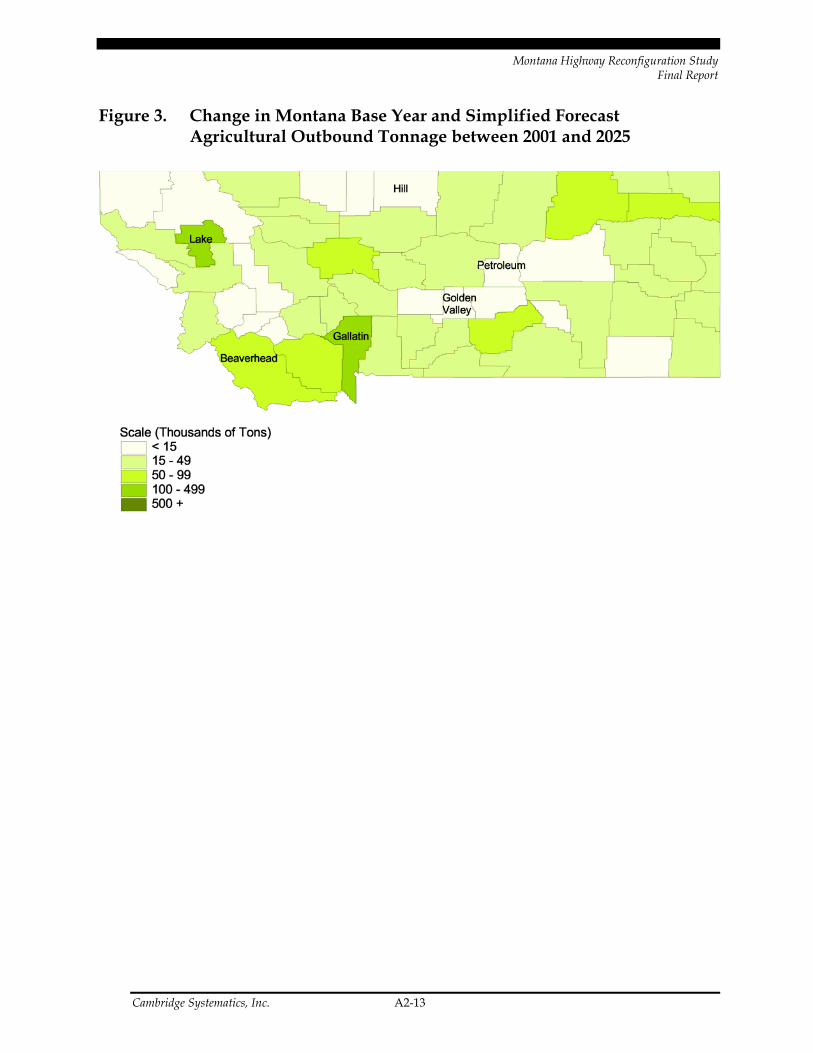
Montana Highway Reconfiguration Study Final Report
Cambridge Systematics, Inc. A2-13
Figure 3. Change in Montana Base Year and Simplified Forecast Agricultural Outbound Tonnage between 2001 and 2025

Montana Highway Reconfiguration Study Final Report
Cambridge Systematics, Inc. A2-14
Figure 4. Change in Montana Base Year and Enhanced Forecast Agricultural Outbound Tonnage between 2001 and 2025

Montana Highway Reconfiguration Study Final Report
Cambridge Systematics, Inc. A2-15
Table 1. FAF Base Year and Forecast Tonnages for Montana Outbound Flows
Commodity by STCC Commodity Description
Base Year Outbound
Flows (Thousands of
Tons)
Future Year Outbound
Flows (Thousands of
Tons)
Change Between Future and Base Year
Flows (Thousands of
Tons) Growth
Percentage 1 Farm Products 9,158 11,927 2,768 30% 8 Forest Products 0 0 0 0% 10 Metallic Ores 25 30 5 19% 11 Coal 290 307 17 6% 14 Nonmetallic Minerals 230 280 50 22% 20 Food and Kindred Products 1,060 2,624 1,564 148% 22 Textile Mill Products 0 1 1 310% 23 Apparel or Related Products 9 24 16 177% 24 Lumber or Wood Products 4,063 9,506 5,443 134% 25 Furniture of Fixtures 36 79 43 119% 26 Pulp, Paper, or Allied Products 244 478 234 96% 27 Printed Matter 17 42 25 147% 28 Chemicals or Allied Products 724 1,911 1,187 164% 29 Petroleum or Coal Products 2,910 8,368 5,457 188% 30 Rubber or Misc. Products 72 211 138 191% 31 Leather or Leather Products 1 3 2 149% 32 Clay, Concrete or Glass 915 2,462 1,547 169% 33 Primary Metal Products 299 525 226 76% 34 Fabricated Metal Products 2 6 4 200% 35 Machinery 9 66 57 651% 36 Electrical Equipment 5 23 18 406% 37 Transportation Equipment 146 292 146 100% 38 Instruments, Photo Equipment 8 30 22 274% 39 Misc. Manufacturing Products 3 7 5 169% 40 Waste or Scrap Material 0 0 0 0% 41 Misc. Freight Shipments 0 0 0 0% 42 Shipping Containers 0 0 0 0% 43 Mail or Contract Traffic 3 10 7 263% 46 Misc. Mixed Shipments 23 49 26 117% 48 Hazardous Waste 0 0 0 0% 50 Warehousing and Distribution 646 2,034 1,389 215% Total 20,898 41,295 20,397 98%
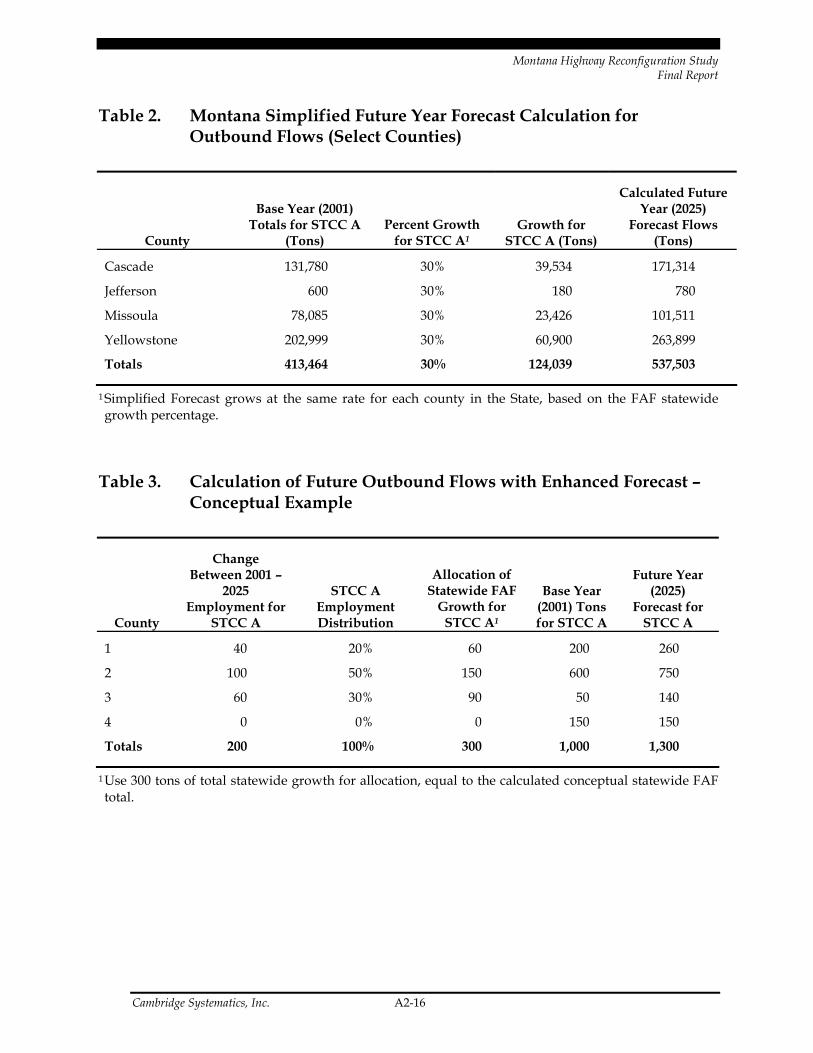
Montana Highway Reconfiguration Study Final Report
Cambridge Systematics, Inc. A2-16
Table 2. Montana Simplified Future Year Forecast Calculation for Outbound Flows (Select Counties)
County
Base Year (2001) Totals for STCC A
(Tons) Percent Growth
for STCC A1 Growth for
STCC A (Tons)
Calculated Future Year (2025)
Forecast Flows (Tons)
Cascade 131,780 30% 39,534 171,314
Jefferson 600 30% 180 780
Missoula 78,085 30% 23,426 101,511
Yellowstone 202,999 30% 60,900 263,899
Totals 413,464 30% 124,039 537,503
1 Simplified Forecast grows at the same rate for each county in the State, based on the FAF statewide growth percentage.
Table 3. Calculation of Future Outbound Flows with Enhanced Forecast – Conceptual Example
County
Change Between 2001 –
2025 Employment for
STCC A
STCC A Employment Distribution
Allocation of Statewide FAF
Growth for STCC A1
Base Year (2001) Tons for STCC A
Future Year (2025)
Forecast for STCC A
1 40 20% 60 200 260
2 100 50% 150 600 750
3 60 30% 90 50 140
4 0 0% 0 150 150
Totals 200 100% 300 1,000 1,300
1 Use 300 tons of total statewide growth for allocation, equal to the calculated conceptual statewide FAF total.
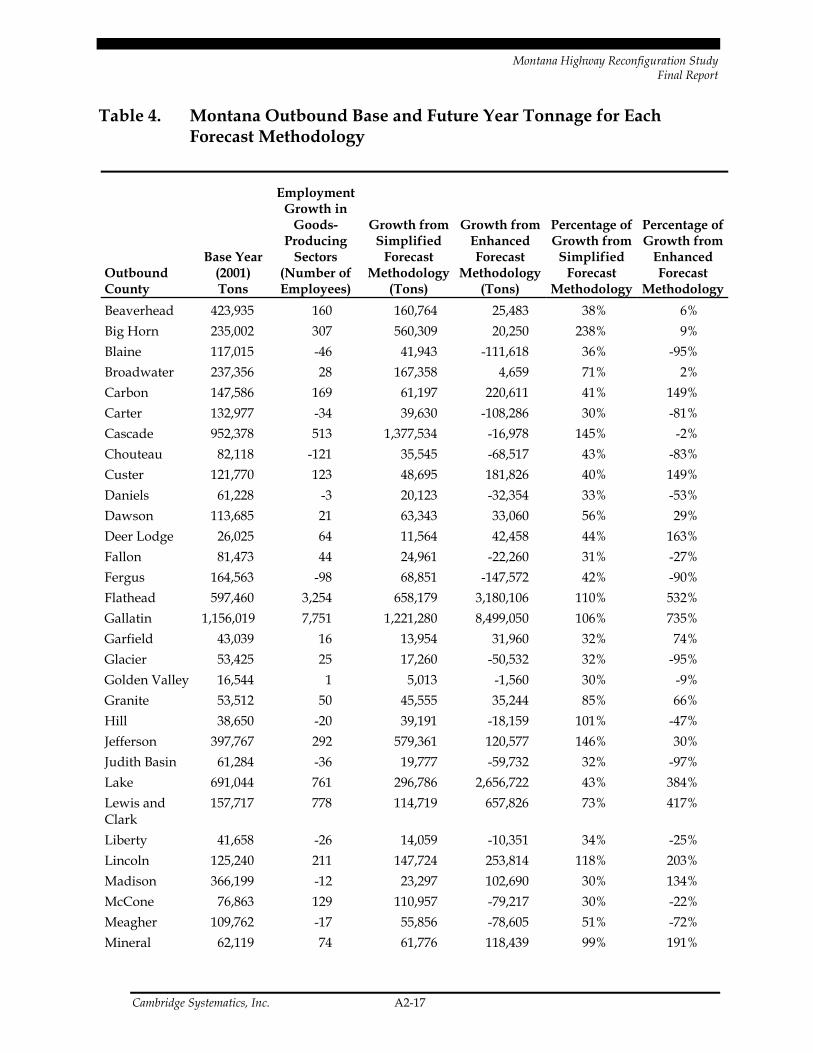
Montana Highway Reconfiguration Study Final Report
Cambridge Systematics, Inc. A2-17
Table 4. Montana Outbound Base and Future Year Tonnage for Each Forecast Methodology
Outbound County
Base Year (2001) Tons
Employment Growth in
Goods-Producing
Sectors (Number of Employees)
Growth from Simplified
Forecast Methodology
(Tons)
Growth from Enhanced Forecast
Methodology (Tons)
Percentage of Growth from
Simplified Forecast
Methodology
Percentage of Growth from
Enhanced Forecast
Methodology Beaverhead 423,935 160 160,764 25,483 38% 6% Big Horn 235,002 307 560,309 20,250 238% 9% Blaine 117,015 -46 41,943 -111,618 36% -95% Broadwater 237,356 28 167,358 4,659 71% 2% Carbon 147,586 169 61,197 220,611 41% 149% Carter 132,977 -34 39,630 -108,286 30% -81% Cascade 952,378 513 1,377,534 -16,978 145% -2% Chouteau 82,118 -121 35,545 -68,517 43% -83% Custer 121,770 123 48,695 181,826 40% 149% Daniels 61,228 -3 20,123 -32,354 33% -53% Dawson 113,685 21 63,343 33,060 56% 29% Deer Lodge 26,025 64 11,564 42,458 44% 163% Fallon 81,473 44 24,961 -22,260 31% -27% Fergus 164,563 -98 68,851 -147,572 42% -90% Flathead 597,460 3,254 658,179 3,180,106 110% 532% Gallatin 1,156,019 7,751 1,221,280 8,499,050 106% 735% Garfield 43,039 16 13,954 31,960 32% 74% Glacier 53,425 25 17,260 -50,532 32% -95% Golden Valley 16,544 1 5,013 -1,560 30% -9% Granite 53,512 50 45,555 35,244 85% 66% Hill 38,650 -20 39,191 -18,159 101% -47% Jefferson 397,767 292 579,361 120,577 146% 30% Judith Basin 61,284 -36 19,777 -59,732 32% -97% Lake 691,044 761 296,786 2,656,722 43% 384% Lewis and Clark
157,717 778 114,719 657,826 73% 417%
Liberty 41,658 -26 14,059 -10,351 34% -25% Lincoln 125,240 211 147,724 253,814 118% 203% Madison 366,199 -12 23,297 102,690 30% 134% McCone 76,863 129 110,957 -79,217 30% -22% Meagher 109,762 -17 55,856 -78,605 51% -72% Mineral 62,119 74 61,776 118,439 99% 191%

Montana Highway Reconfiguration Study Final Report
Cambridge Systematics, Inc. A2-18
Table 4. Montana Outbound Base and Future Year Tonnage for Each Forecast Methodology (continued)
Outbound County
Base Year (2001) Tons
Employment Growth in
Goods-Producing
Sectors (Number of Employees)
Growth from Simplified
Forecast Methodology
(Tons)
Growth from Enhanced Forecast
Methodology (Tons)
Percentage of Growth from
Simplified Forecast
Methodology
Percentage of Growth from
Enhanced Forecast
Methodology Missoula 2,442,830 1,703 3,468,077 518,205 142% 21% Musselshell 49,730 52 56,121 32,639 113% 66% Park 156,440 241 106,380 536,077 68% 343% Petroleum 18,692 -11 36,083 -9,078 193% -49% Phillips 68,510 -25 22,926 35,342 33% 52% Pondera 106,273 -53 56,294 -71,322 53% -67% Powder River 47,462 -49 14,496 -32,072 31% -68% Powell 121,202 106 142,709 147,402 118% 122% Prairie 67,975 0 20,740 -7,111 31% -10% Ravalli 242,153 2,230 176,716 2,688,343 73% 1110% Richland 207,013 235 118,797 375,440 57% 181% Roosevelt 195,636 55 71,257 50,137 36% 26% Rosebud 100,451 295 55,634 92,196 55% 92% Sanders 134,980 182 118,029 221,858 87% 164% Sheridan 97,207 85 59,688 -52,773 61% -54% Silver Bow 251,301 435 568,300 507,358 226% 202% Stillwater 92,982 605 36,784 1,314,954 40% 1414% Sweet Grass 63,851 57 28,053 53,563 44% 84% Teton 183,486 -58 76,517 -165,213 42% -90% Toole 26,115 22 10,272 -22,147 39% -85% Treasure 37,919 -6 11,542 -17,330 30% -46% Valley 187,463 21 58,521 21,913 31% 12% Wheatland 43,857 -26 28,504 -29,175 65% -67% Wibaux 50,590 -24 15,298 -30,566 30% -60% Yellowstone 6,451,540 1,615 11,352,330 1,283,087 176% 20% Totals 18,391,072 22,045 22,816,625 22,820,764 124% 124%

Montana Highway Reconfiguration Study Final Report
Cambridge Systematics, Inc. A2-19
Table 5. Forecast Summary Data for Five Largest Montana Counties
County by Trip Type
Base Year (2001)
Commodity Flow Total
(Tons)
Future Year (2025)
Commodity Flow Total
from Simplified
Forecast Method (Tons)
Future Year (2025)
Commodity Flow Total
from Enhanced Forecast
Method (Tons)
Percent Growth between Future and Base Year for Simplified
Forecast
Percent Growth between Future and Base Year for Enhanced
Forecast
Outbound
Yellowstone 6,451,540 17,803,870 7,734,626 176.0% 19.9%
Missoula 2,442,830 5,910,907 2,961,034 142.0% 21.2%
Gallatin 1,156,019 2,377,299 9,655,069 105.7% 735.2%
Cascade 952,378 2,329,912 935,400 144.6% -1.7%
Jefferson 397,767 977,128 518,344 145.7% 30.3%
Internal
Yellowstone 5,441,244 12,177,799 8,267,043 124% 52%
Missoula 4,423,426 12,125,325 5,563,586 174% 26%
Gallatin 4,766,628 12,054,788 21,514,149 153% 351%
Cascade 2,123,612 5,902,688 2,119,594 178% 0%
Jefferson 2,791,897 7,678,785 3,035,838 175% 9%
Inbound
Yellowstone 2,677,375 5,946,466 3,056,539 122% 14%
Missoula 968,354 2,031,197 1,167,501 110% 21%
Gallatin 200,595 461,044 2,436,109 130% 1114%
Cascade 567,609 1,227,327 555,030 116% -2%
Jefferson 21,912 54,742 53,292 150% 143%

Montana Highway Reconfiguration Study Final Report
Cambridge Systematics, Inc. A2-20
Table 6. Chi-Squared Results for Each Trip Type for Simplified and Enhanced Forecast Comparisons
Distribution Category1
Expected Occurrence of
Enhanced Forecast Method
Distribution
Resulting Internal
Distribution
Resulting Outbound
Distribution
Resulting Inbound
Distribution
1 14 30 34 23
2 14 3 0 1
3 14 9 5 3
4 14 14 17 27
X2 Total 28.71 48.99 38.57
1Category ranges vary for each of the three comparisons.
Table 7. Agriculture Forecast Summary Data for Five Montana Counties
County by Trip Type
Base Year (2001)
Agriculture Flow Total
(Tons)
Future Year (2025)
Agriculture Flows from Simplified
Forecast Method (Tons)
Future Year (2025)
Agriculture Flows from Enhanced Forecast Method (Tons)
Percent Growth between
Future and Base Year for
Simplified Forecast
Percent Growth between
Future and Base Year for
Enhanced Forecast
Outbound
Lake 592,860 772,141 283,158 30% -52%
Gallatin 418,133 544,577 1,118,096 30% 167%
Beaverhead 322,283 419,742 255,279 30% -21%
McCone 272,349 354,707 188,263 30% -31%
Yellowstone 202,999 264,385 541,853 30% 167%

Montana Highway Reconfiguration Study Final Report
Cambridge Systematics, Inc. A2-21
Table 8. Chi-Squared Results for Comparing Distributions of Enhanced Forecast Growth Across Trip Types
Distribution Category1
Expected Occurrence of
Enhanced Forecast Method
Distribution
Resulting Internal – Outbound
Distribution
Resulting Internal – Inbound
Distribution
Resulting Outbound –
Inbound Distribution
1 14 11 1 1
2 14 17 27 25
3 14 14 17 19
4 14 14 11 11
X2 Total 1.29 25.43 23.14
1Category ranges vary for each of the three comparisons.

Montana Highway Reconfiguration Study Final Report
Cambridge Systematics, Inc. A3-1
Appendix A3. Industrial Profiles
1.0 Introduction
As part of the Highway Reconfiguration Study, the consultant team prepared industrial profiles which incorporated standard data analysis and industry surveying. The industrial profiles report three types of background information: 1) industry trends, 2) non-transportation local advantages and disadvantages, and 3) transportation access or mobility issues. The preparation followed a three-step procedure:
1. The consultants selected major industries present in Montana that could be expected to benefit in some way from improved transportation based on the two-digit Standard Industrial Classification (SIC) codes and minimum thresholds on size (measured in output and employment). The industrial profiles focused on industries that are part of Montana’s economic base (i.e., those that tend to export goods and/or services outside the State). This selection process netted industries accounting for 16 percent of Montana’s employment and output.
2. The consultant team performed extensive research on each industry’s competitive position in the global, national, multi-state regional, and state level; and included these findings in each industry profile.
3. Consultant team members were assigned individual industry groups and economic development regions throughout the State and conducted face-to-face and telephone interviews with business leaders, lead agency personnel, and other economic stakeholders to synthesize the strengths, weaknesses, opportunities and threats to each industry, considering both transportation and non-transportation factors.
The resulting industrial profiles were used to provide guidance regarding the business attraction model and its parameters, and are also available to users of HEAT through the user interface for industry trend context while performing an economic impact evaluation of a highway improvement.
Industry Identification
The consultant team used in-state employment and number of firms according to the two-digit SIC to determine which Montana industries should be profiled. The consultant team sought the review and advice of the RSSC, MDT, and the economic development agencies throughout the State of Montana. On the final selection, the consensus was to limit the list to the industries listed in Table A3.1. This ranking scheme identified 13 preliminary major

Montana Highway Reconfiguration Study Final Report
Cambridge Systematics, Inc. A3-2
industry groups, and was subsequently supplemented by a profile of the military industry in Montana.
Table A3.1 Major Industry Groups in Montana
Industry Groups Output in Millions Employment
Number of Firms
1. Mining (coal, metal, and non-metal) $800 3,700 56
2. Oil (petroleum products and extraction) $191 1,561 78-84
3. Food processing $818 2,654 162
4. Industrial machinery $368 2,018 46
5. Lumber/wood products (include forestry) $1,417 8,991 ~154
6. Fabricated metal products $92 1,023 130
7. High-tech products (electrical/electronic equip. and instruments)
$9 863 ~96
8. Furniture manufacturing $69 815 84
9. Primary metals products $263 1,107 26
10. Farming (livestock and grain); $2,365 32,112 n/a
11. Stone, glass & clay products $218 1,306 90
12. Transportation equipment $110 581 33
13. Tourism $1,767 57,741 n/a
Source: IMPLAN 1998 and 2000, except tourism, which is from ICF Consulting.
Some additional industries were dropped, such as printing and publishing (which does include some large companies in Montana), because their sales were limited to major urban areas and not dependent on out-of-state roadway transportation. The list of potential, smaller industries included the following with the approximate number of establishments in parenthesis:
• Chemicals (42),
• Rubber/plastics (30),
• Printing/publishing (253),
• Paper products (5),
• Leather products (17), and
• Apparel/textiles (53).

Montana Highway Reconfiguration Study Final Report
Cambridge Systematics, Inc. A3-3
Industry Trends and Competitive Analysis
Before conducting its fieldwork, the consultant team researched each industry group based on available economic analysis literature and databases. The result was a set of layered trend analyses which helped interview teams understand the context of each business interviewed. The three-layered trends analysis consisted of:
1. National and global trends – Recent historical data (at least five years, but longer if necessary) on geographical concentration of production/activity, including historical or current shifts, reasons for this concentration with other not easily quantifiable industry trends highlighted (i.e., competition, trading patterns, location of significant suppliers and markets (customers)).
2. State/regional trends – These include size of industry (i.e., employment, output, and share of national/global market), recent performance, etc. and location of primary suppliers and markets. It also includes employment by sub-industry if appropriate, average wages, location quotients, and regional concentrations.
3. Montana firms – This analysis determined what percentage specific firms account for the total industry in Montana and identified which firms are more successful relative to the global, national, and state/regional trends.
Using a combination of interviews, literature, and statistics, the consultant team profiled the local (non-transportation) advantages and disadvantages for each industry group. These determinations addressed why the industry located in Montana and the benefits of their location. This effort also identified other types of economic development investments, initiatives, and programs that are needed to improve the industry in the State (i.e., collateral activities). This information was usually verified with economic development authorities.
Finally (and most important), the consultant team evaluated each industry’s transportation access/mobility issues. This analysis included:
• What are the primary modes used by the industry to transport goods (inbound and outbound shipments)? Are the industry’s transportation costs higher than the U.S. average?
• Assessments of the transportation access issues/problems facing the industry, including multimodal and intermodal, and border crossing issues.
• Determining what transportation improvements would benefit the industry. While the focus of the Reconfiguration Study is on highways, it was deemed useful and important to identify other transportation infrastructure that would be most critical to an industry or would be needed in addition to highway improvements in order to realize the benefits assumed with the highway investments (e.g., airports, rail, intermodal, cross-boarder or regulatory changes, etc.).

Montana Highway Reconfiguration Study Final Report
Cambridge Systematics, Inc. A3-4
• Describing the business owner’s expectations and the consultant’s conclusions regarding the degree to which improved highway(s) would improve the competitiveness of the industry and potentially lead to business relocations.
Data Gathering
The profiles in general, and the structured interviews in particular, helped identify local and regional concerns and expectations related to highway improvement and its impact on business expansion, attraction, and development. General topics covered in the interviews include:
• Access to customers, suppliers, and workers;
• Business impacts of proposed or potential highway improvements;
• Factors influencing business location decisions;
• Strengths and weaknesses of the highway corridor as a place to do business;
• Major trends in the regional economy;
• Factors contributing to or impeding business growth;
• Related economic development programs (collateral activities);
• Characteristics of the regional tourism market and its reliance on the highway corridor for tourist trips; and
• Marketing and outreach efforts.
Prior to the actual interviews, the consultant team members prepared an interview guide that emphasizes topics, such as industry mix, transportation investment programs, collateral economic development activities, socioeconomic trends, etc. This guide (which varied depending on the audience) was then used to document each industry’s current condition, outlook, and dependence on transportation. HEAT contains a profile for each of these industries.
The first interviews were with local economic development and tourism experts. These economic development officials provided an important perspective concerning:
• The region’s degree of success in retaining, expanding, and attracting business;
• Factors enhancing or constraining economic development success, especially how non-transportation activities could be coupled to – or used in lieu of – transportation investments to facilitate economic growth;
• The relative importance of transportation infrastructure/access for Montana firms; and

Montana Highway Reconfiguration Study Final Report
Cambridge Systematics, Inc. A3-5
• The sources of any business attraction (i.e., whether gains in the study region are offset by losses in other regions), and industries that regions of Montana are targeting for growth opportunities.
The industrial profiles document the critical points from the interviews of economic development officials, and were then used to set up personal or telephone interviews with business representatives. Business owners are in the best position to determine the relative role of transportation and other factors in affecting their business expansion, contraction, or location decisions. Interviews with business owners provided information on the role of transportation, among other factors, regarding:
• Business ratings of the regional factors constraining or enhancing their continuation and expansion opportunities;
• The extent of reliance on roadways and other transportation services for labor access, supplier access, or customer deliveries;
• Transportation needs or deficiencies (if any) in Montana that constrain economic opportunities; and
• The non-transportation constraints that would need to be resolved to allow transportation investments to provide the maximum benefit.
Summary of Findings
On the whole, business leaders were less likely to claim that new transportation investments were critical to their growth when they face larger impediments. They may acknowledge that the likely success of transportation investments to spur development will also depend on enabling collateral activities, such as private investment and business attraction. Many industries felt that highways are generally strong and sufficient for their needs, but limitations tend to be based on: 1) distance to markets; 2) labor force quality and quantity; and 3) other non-highway factors such as global market competition, scale economies, lack of rail competition, etc. – Nevertheless, there are some instances of highway deficiencies that could improve economic opportunities
The complete industry profiles are provided in the following subsections.
2.0 Mining (Coal, Metal, and Non-Metal)
Overview
Mining is a significant industry in Montana, accounting for 3.6 percent of gross state product. The mining industry is composed of three distinct segments – coal mining, metal
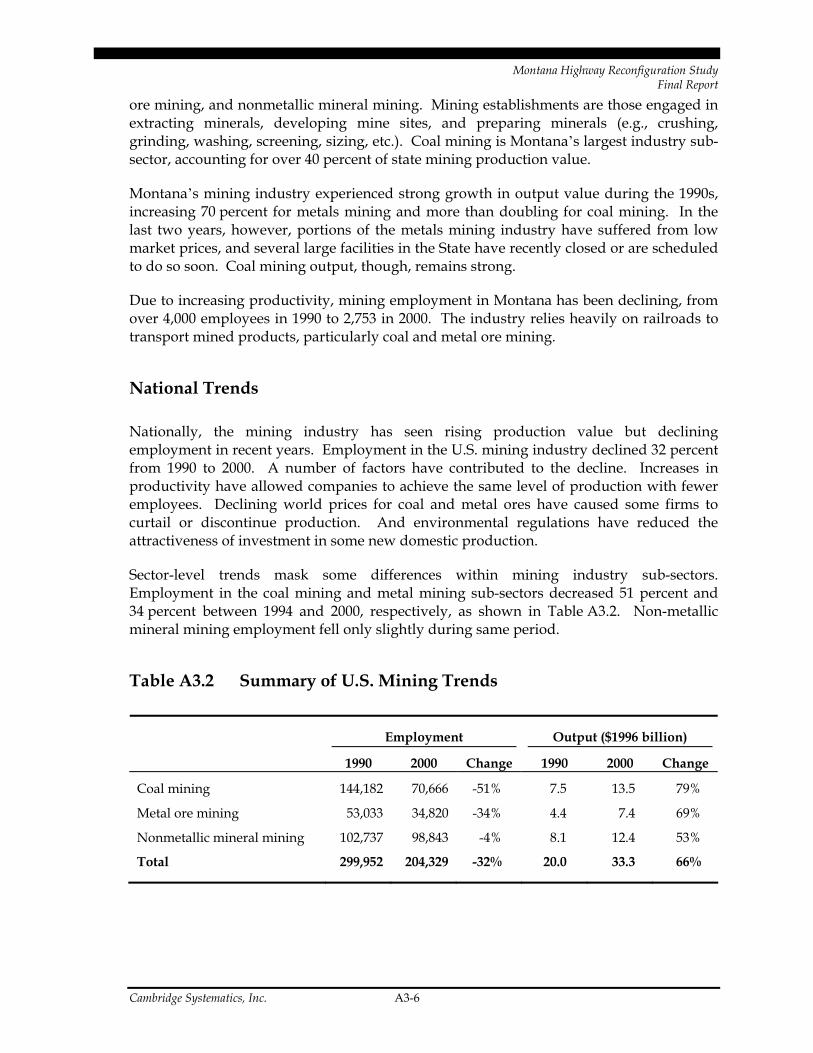
Montana Highway Reconfiguration Study Final Report
Cambridge Systematics, Inc. A3-6
ore mining, and nonmetallic mineral mining. Mining establishments are those engaged in extracting minerals, developing mine sites, and preparing minerals (e.g., crushing, grinding, washing, screening, sizing, etc.). Coal mining is Montana’s largest industry sub-sector, accounting for over 40 percent of state mining production value.
Montana’s mining industry experienced strong growth in output value during the 1990s, increasing 70 percent for metals mining and more than doubling for coal mining. In the last two years, however, portions of the metals mining industry have suffered from low market prices, and several large facilities in the State have recently closed or are scheduled to do so soon. Coal mining output, though, remains strong.
Due to increasing productivity, mining employment in Montana has been declining, from over 4,000 employees in 1990 to 2,753 in 2000. The industry relies heavily on railroads to transport mined products, particularly coal and metal ore mining.
National Trends
Nationally, the mining industry has seen rising production value but declining employment in recent years. Employment in the U.S. mining industry declined 32 percent from 1990 to 2000. A number of factors have contributed to the decline. Increases in productivity have allowed companies to achieve the same level of production with fewer employees. Declining world prices for coal and metal ores have caused some firms to curtail or discontinue production. And environmental regulations have reduced the attractiveness of investment in some new domestic production.
Sector-level trends mask some differences within mining industry sub-sectors. Employment in the coal mining and metal mining sub-sectors decreased 51 percent and 34 percent between 1994 and 2000, respectively, as shown in Table A3.2. Non-metallic mineral mining employment fell only slightly during same period.
Table A3.2 Summary of U.S. Mining Trends
Employment Output ($1996 billion)
1990 2000 Change 1990 2000 Change
Coal mining 144,182 70,666 -51% 7.5 13.5 79%
Metal ore mining 53,033 34,820 -34% 4.4 7.4 69%
Nonmetallic mineral mining 102,737 98,843 -4% 8.1 12.4 53%
Total 299,952 204,329 -32% 20.0 33.3 66%

Montana Highway Reconfiguration Study Final Report
Cambridge Systematics, Inc. A3-7
Despite the overall reduction in employment, U.S. mining output grew by 66 percent during the 1990s. These trends indicate that the industry is becoming more capital intensive, increasing output per employee. Mining currently accounts for 0.36 percent of the nation’s total economy.
Nationally, the mining industry is heavily dependent on rail transportation. More than 99 percent of coal tonnage moves by rail in the U.S. Railroads also haul about 95 percent of the ton-miles of metallic ores and 50 percent of the ton-miles of non-metallic ores, according to the 1997 Commodity Flow Survey.
Montana Trends
Mining employment in Montana has fallen significantly over the last 10 years, even as output value has risen. As shown in Table A3.3, 2000 employment in mining was 2,753, a 32 percent drop since 1990 (same as the U.S.). Montana mining wages are higher than the U.S. average.
Table A3.3 Montana and U.S. Mining Industry Summary
Montana U.S.
1990 2000 1990 2000
Employment 4,065 2,753 299,952 204,329
Annual Payroll (000) $146,139 $143,725 $10,394,678 $9,344,103
Number of Establishments 83 56 9,781 7,231
Average Wage $35,951 $52,207 $34,654 $45,731
Employees per Establishment 49 49 31 28
Mining output value has grown strongly, particularly coal. Figure A3.1 shows Montana mining output trends for the three industry sub-sectors. During the 1990s, coal output increased nearly 150 percent in inflation-adjusted terms, nearly twice the national rate. Metal mining output grew nearly 70 percent, and non-metallic mineral mining grew 35 percent – both of these figures are slightly less than national growth rates. Mining accounts for 3.6 percent of Montana’s economy, up from 2.5 percent in 1990. With such strong output growth, but slight declines in overall payroll, it is clear that expanded mining sales are the result of increased capital inputs.

Montana Highway Reconfiguration Study Final Report
Cambridge Systematics, Inc. A3-8
Figure A3.1 Montana Mining Output by Industry Segment ($1996)
0
50
100
150
200
250
300
350
400
1990 1991 1992 1993 1994 1995 1996 1997 1998 1999 2000
Out
put (
$mill
ion)
Metal miningCoal miningNonmetalic minerals
Montana is active in mining a number of different mineral resources. Table A3.4 shows the value of minerals produced in the State in 1999. Because of the small number of firms involved, production values are not reported separately for some significant commodities (such as copper). By value, coal is Montana’s leading mineral, followed by palladium, copper, and gold. Each of these mining sectors is discussed in more detail below.
Table A3.4 Mineral Industry Annual Production Value (1999)
Mineral Value ($) Percent Coal 362,519,640 42% Palladium 114,000,000 13% Gold 68,100,000 8% Sand and Gravel (Construction) 50,700,000 6% Platinum 35,600,000 4% Zinc 26,100,000 3% Stone (Crushed) 13,300,000 2% Lead 7,660,000 1% Stone (Dimension) 1,440,000 0% Gemstones 294,000 0% Others * 180,000,000 21% Total 859,713,640 100%
* Others include cement, clays, copper, garnet, iron ore, lime, molybdenum, peat, industrial sand and gravel, silver, talc, and pyrophyllite.

Montana Highway Reconfiguration Study Final Report
Cambridge Systematics, Inc. A3-9
Twenty-five Montana counties have employment in mining, but most employment is concentrated in five counties. Stillwater County has the State’s largest number of mining employees, primarily due to palladium mining at the Stillwater Mine. Big Horn and Rosebud Counties contain the State’s most important coal mines. Jefferson and Silver Bow Counties are home to significant gold, copper, and other metal mining.
Coal Mining
Coal is the State’s most important mining commodity, accounting for over 40 percent of the value of Montana mineral production. Montana has an estimated 120 billion tons of coal reserves, 25 percent of the U.S. total. In 1999, 41 million tons of coal were produced in Montana. Most Montana coal is low sulfur coal drawn from the Powder River Basin (Big Horn and Rosebud Counties) in the southeastern part of the State. The largest mine in the State is the Rosebud Mine operated by the Western Energy Company. Montana’s only lignite producer is the Savage strip mine, operated by Knife River Coal Company in Richland County. Coal production expanded rapidly in the 1970s and 1980s. Production volumes have been relatively stable during the 1990s, with an average annual growth rate of about one percent.1
Palladium/Platinum Mining
The Stillwater Mining Company produces almost all of the palladium and platinum in Montana. In fact, the company is the only significant primary producer of palladium in the world. Stillwater Mining’s principal facility is the Stillwater Mine, located approximately five miles west of the town of Nye in Stillwater County. Stillwater Mining is also developing the East Boulder Project (approximately 13 miles west of the Stillwater Mine). The company’s smelter and base metals refinery are located in Columbus along Interstate 90.
Palladium and platinum production volumes increased significantly in the late 1990s. However, the company has been hurt recently by substantial decreases in palladium prices and production volumes have been lower than expected in 2002. The Stillwater Mining Company estimates that approximately 85 percent of its product is purchased for use in catalytic converters. Price increases for palladium have caused some manufacturers of catalytic converters to switch back to using platinum. This reduction in demand for palladium has caused prices to decline by as much as 75 percent. As price differentials between the two metals stabilize, the company expects demand to increase again in the future.
1 A 1998 canvas of mining operations found production volumes increasing at the Rosebud Mine
and the Spring Creek Mine (Spring Creek Coal Company). Significant production decreases were found at the West Decker Mine near Decker (Decker Coal Company) and the Big Sky Mine, near Colstrip (Peabody Coal Company).

Montana Highway Reconfiguration Study Final Report
Cambridge Systematics, Inc. A3-10
Copper Mining
In the late 19th century, Montana was the largest producer of copper in the world. Butte, Montana and the Anaconda Copper Company held a virtual monopoly position in copper production. While no longer the dominant player, Montana is one of the top five copper producing states in the U.S. Major copper mines in Montana include the following:2
• The Troy Mine, located in Lincoln County and owned by Grupo Mexico SA de CV;
• The New World Mine, located near Cooke City (Park County) and owned by Crown Butte Resources Ltd. The mine produces both gold and copper;
• The Montanore Mine, located in Libby (Lincoln County) and owned by Noranda, Inc.; and
• The Continental Mine, located in Butte and owned by Grupo Mexico SA de CV.
Over-capacity and low prices have plagued the industry in recent years. Noranda announced in August 2002 that it would abandon the Montanore copper-silver project in Montana due to a slump in world prices.
Gold Mining
Montana gold production has declined significantly in recent years, from 321,000 ounces in 1997 to 212,000 ounces in 2000. Major Montana gold mines include:3
• The Beal Mountain Mine, located in the Pioneer Mountains, between Butte and Anaconda, and owned by Pegasus Gold Inc.
• Golden Sunlight Mine, located near Butte in Jefferson County and owned by Placer Dome Inc.
• The McDonald Mine, located near Lincoln (Lewis and Clark County) and owned by Canyon Resources Corporation.
• The Mineral Hill Mine, located in Gardner and owned by TVX Gold Inc.
• Montana Tunnels Mine, located 25 miles km south of Helena. It produces gold, lead and zinc and is owned by the Apollo Gold Corporation.
• New World Mine, located near Cooke City (Park County). It produces gold and copper and is owned by Crown Butte Resources Ltd.
2 Clementine database, AME Research. 3 Clementine database, AME Research.
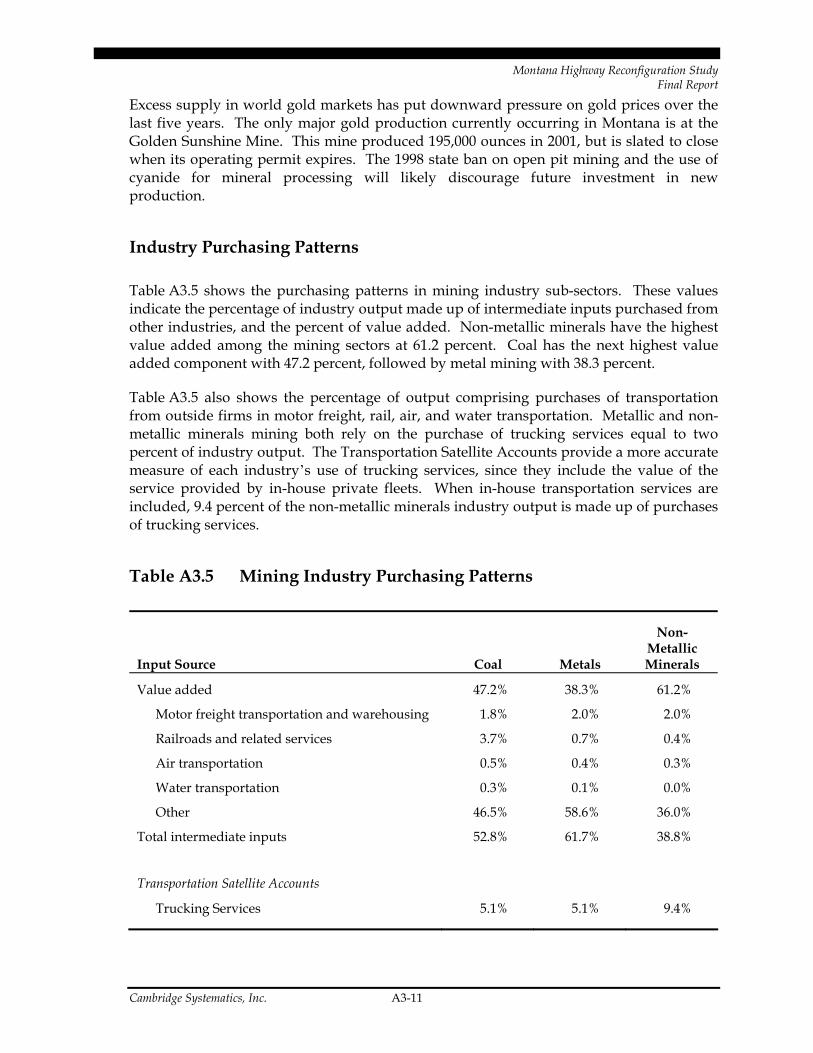
Montana Highway Reconfiguration Study Final Report
Cambridge Systematics, Inc. A3-11
Excess supply in world gold markets has put downward pressure on gold prices over the last five years. The only major gold production currently occurring in Montana is at the Golden Sunshine Mine. This mine produced 195,000 ounces in 2001, but is slated to close when its operating permit expires. The 1998 state ban on open pit mining and the use of cyanide for mineral processing will likely discourage future investment in new production.
Industry Purchasing Patterns
Table A3.5 shows the purchasing patterns in mining industry sub-sectors. These values indicate the percentage of industry output made up of intermediate inputs purchased from other industries, and the percent of value added. Non-metallic minerals have the highest value added among the mining sectors at 61.2 percent. Coal has the next highest value added component with 47.2 percent, followed by metal mining with 38.3 percent.
Table A3.5 also shows the percentage of output comprising purchases of transportation from outside firms in motor freight, rail, air, and water transportation. Metallic and non-metallic minerals mining both rely on the purchase of trucking services equal to two percent of industry output. The Transportation Satellite Accounts provide a more accurate measure of each industry’s use of trucking services, since they include the value of the service provided by in-house private fleets. When in-house transportation services are included, 9.4 percent of the non-metallic minerals industry output is made up of purchases of trucking services.
Table A3.5 Mining Industry Purchasing Patterns
Input Source Coal Metals
Non-Metallic Minerals
Value added 47.2% 38.3% 61.2%
Motor freight transportation and warehousing 1.8% 2.0% 2.0%
Railroads and related services 3.7% 0.7% 0.4%
Air transportation 0.5% 0.4% 0.3%
Water transportation 0.3% 0.1% 0.0%
Other 46.5% 58.6% 36.0%
Total intermediate inputs 52.8% 61.7% 38.8%
Transportation Satellite Accounts
Trucking Services 5.1% 5.1% 9.4%

Montana Highway Reconfiguration Study Final Report
Cambridge Systematics, Inc. A3-12
Transportation Needs
Interviews with mining firms suggest that transportation is generally not an impediment to industry growth in the State. The future prospects of the mining industry are largely determined by world mineral prices and the development of new resources.
Mining industry sub-sectors vary considerably in their use of transportation services. Most important coal mines have direct access to rail transportation and ship all mined coal by rail, although a few smaller mines use trucks to move coal to rail terminals. According to the 1997 Commodity Flow Survey, 99 percent of coal shipments originating in the State move by rail. Interviews with coal mining industry executives suggest that the cost and reliability of rail transportation is an important transportation issue for the industry. Some in the industry believe that the lack of competition causes high prices for rail services.
Precious metals firms often ship product by expedited delivery service (such as FedEx). Input supplies are frequently brought in by truck. Some Montana firms believe that they pay higher freight rates than their out-of-state competitors, and this price differential is due in part to the fact that they are more distant from their suppliers. Industry executives also note that their freight rates often include a transportation fuel surcharge, assessing them an additional fee for the cost of fuel in Montana and the low density of freight traffic in the area. Montana metals mining firms suggest that the inability of workers to get to work sites during bad weather can have significant effects on the cost of doing business.
3.0 Oil (Petroleum Products and Extraction)
Overview
The oil and gas extraction industry develops and operates oil and gas field properties. These activities may include: exploration for crude petroleum and natural gas; drilling, completing, and equipping wells; operating separators, emulsion breakers, desilting equipment, and field gathering lines for crude petroleum; and all other activities in the preparation of oil and gas up to the point of shipment from the producing property. This industry includes the production of crude petroleum, the mining and extraction of oil from oil shale and oil sands, and the production of natural gas and recovery of hydrocarbon liquids.
As a whole, the oil and gas extraction industry has been declining in Montana. The industry currently employs approximately 600 people and accounts for 1.4 percent of gross state product (GSP). However, this trend masks important differences within industry sub-sectors: a steep decline in petroleum production (concentrated in northeastern Montana) and growth in natural gas production (concentrated in north-central Montana).

Montana Highway Reconfiguration Study Final Report
Cambridge Systematics, Inc. A3-13
Industry growth is largely driven by market prices for oil and gas. All output of this industry is transported by pipeline, and thus the State’s surface transportation system is not viewed as a significant impediment to industry growth.
National Trends
Oil and gas extraction activity is driven heavily by world prices for the commodities. After a slowing decline through the 1990s, both world crude oil prices and imported natural gas prices have risen in recent years, as shown in Figure A3.2.
Figure A3.2 Trends in World Oil and Gas Prices
0
10
20
30
40
50
60
70
80 81 82 83 84 85 86 87 88 89 90 91 92 93 94 95 96 97 98 99 00
Year
Rea
l Dol
lars
per
Bar
rel (
Oil)
0
1
2
3
4
5
6
7
8
9
Rea
l Dol
lars
per
Tho
usan
d C
ubic
Fee
t (G
as)
Oil
Gas
Source: Energy Information Administration, U.S. Department of Energy.
Nationally, the number of employees in the oil and gas industry and the level of exploration and production has fluctuated over time, driven by changes in the price of oil and gas. As shown in Table A3.6, employment in the industry dropped 14 percent at the national level and 17 percent in Montana between 1998 and 2000. The average annual wage in the industry is $65,000 nationally and $53,000 in Montana. Within the oil and gas sector, U.S. crude oil production has been falling over time, while U.S. natural gas production has experienced gradual growth.
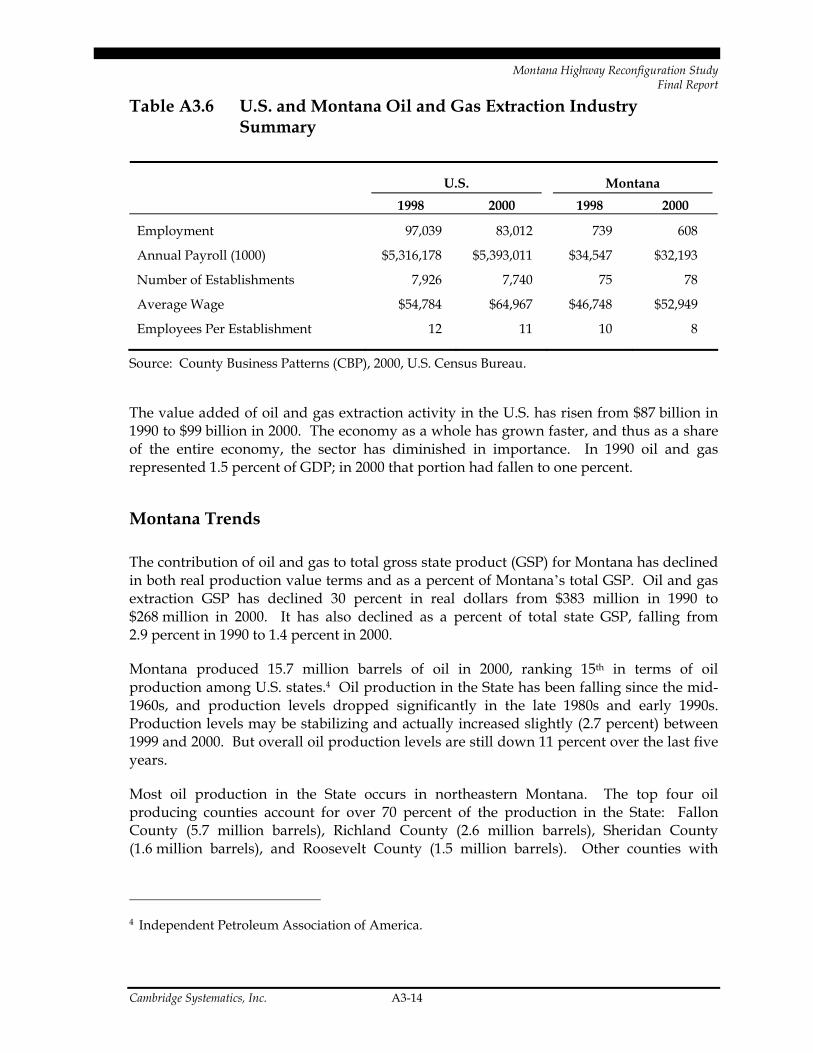
Montana Highway Reconfiguration Study Final Report
Cambridge Systematics, Inc. A3-14
Table A3.6 U.S. and Montana Oil and Gas Extraction Industry Summary
U.S. Montana 1998 2000 1998 2000
Employment 97,039 83,012 739 608
Annual Payroll (1000) $5,316,178 $5,393,011 $34,547 $32,193
Number of Establishments 7,926 7,740 75 78
Average Wage $54,784 $64,967 $46,748 $52,949
Employees Per Establishment 12 11 10 8
Source: County Business Patterns (CBP), 2000, U.S. Census Bureau.
The value added of oil and gas extraction activity in the U.S. has risen from $87 billion in 1990 to $99 billion in 2000. The economy as a whole has grown faster, and thus as a share of the entire economy, the sector has diminished in importance. In 1990 oil and gas represented 1.5 percent of GDP; in 2000 that portion had fallen to one percent.
Montana Trends
The contribution of oil and gas to total gross state product (GSP) for Montana has declined in both real production value terms and as a percent of Montana’s total GSP. Oil and gas extraction GSP has declined 30 percent in real dollars from $383 million in 1990 to $268 million in 2000. It has also declined as a percent of total state GSP, falling from 2.9 percent in 1990 to 1.4 percent in 2000.
Montana produced 15.7 million barrels of oil in 2000, ranking 15th in terms of oil production among U.S. states.4 Oil production in the State has been falling since the mid-1960s, and production levels dropped significantly in the late 1980s and early 1990s. Production levels may be stabilizing and actually increased slightly (2.7 percent) between 1999 and 2000. But overall oil production levels are still down 11 percent over the last five years.
Most oil production in the State occurs in northeastern Montana. The top four oil producing counties account for over 70 percent of the production in the State: Fallon County (5.7 million barrels), Richland County (2.6 million barrels), Sheridan County (1.6 million barrels), and Roosevelt County (1.5 million barrels). Other counties with
4 Independent Petroleum Association of America.

Montana Highway Reconfiguration Study Final Report
Cambridge Systematics, Inc. A3-15
significant oil production (more than 250,000 barrels) include Carbon County, Dawson County, Glacier County, Musselshell County, Toole County, and Wibaux County.
Montana produced 71.3 million cubic feet (MCF) of natural gas in 2000, ranking 20th among U.S. states.5 In contrast to oil, natural gas production has been increasing in the State. Production of non-associated gas is up 25 percent over the last five years.6 The top five gas producing counties produce 75 percent of Montana’s total gas volume, and the top 12 counties account for 95 percent of production. Table A3.7 below shows gas production for those 12 counties.
Table A3.7 Natural Gas Production Top Producing Counties (in Thousand MCF)
County Gas Associated Gas Total
Blaine 17,076 0 17,076 Phillips 12,799 0 12,799 Hill 11,620 1 11,621 Fallon 6,149 1,693 7,842 Toole 4,509 130 4,639 Big Horn 3,495 0 3,495 Richland 1 2,125 2,126 Glacier 1,782 178 1,960 Liberty 1,751 22 1,773 Chouteau 1,539 0 1,539 Carbon 916 309 1,225 Wibaux 1,009 156 1,165
Source: Montana Board of Oil and Gas Conservation, 2000 Annual Review.
Tables A3.8 and A3.9 show the top producers of oil and gas in Montana. While some of these entities are subsidiaries or partnerships established by larger corporations, the data provide a measure of the industry’s concentration. The top three gas producers account for approximately 60 percent of production, while the top three oil producers account for about 50 percent of production.
5 Independent Petroleum Association of America. 6 The term “associated gas” refers to natural gas that is found in contact with significant quantities
of oil, but not dissolved in that oil.

Montana Highway Reconfiguration Study Final Report
Cambridge Systematics, Inc. A3-16
Table A3.8 Top Montana Oil Producing Companies
Company 2000 Production (Barrels)
Encore Operating LP 4,810,671
Burlington Resources Oil & Gas Company LP 1,678,012
Nance Petroleum Corporation 1,234,137
Howell Petroleum Corp. 600,997
Berco Resources, Inc. 448,328
Headington Oil LP 393,639
Flying J Oil and Gas, Inc. 385,165
Nexen Oil & Gas USA, Inc. 360,943
Continental Resources Inc 338,532
Whiting Petroleum Corporation 279,875
Source: Montana Board of Oil and Gas Conservation, 2000 Annual Review.
Table A3.9 Top Montana Gas Producing Companies
Company 2000 Production (MCF)
Ocean Energy, Inc. 19,671,018 Fidelity Exploration & Production Co. 16,083,701 PanCanadian Energy Resources 6,279,853 Klabzuba Oil & Gas, Inc. 6,198,216 Samedan Oil Corporation 5,675,844 Brown, J Burns Operating Company 1,729,366 Fulton Fuel Company 814,831 Jurassic Resources Development NA LLC 764,599 NRC Development, LLC 576,750 Western Natural Gas Company 564,699
Source: Montana Board of Oil and Gas Conservation, 2000 Annual Review.
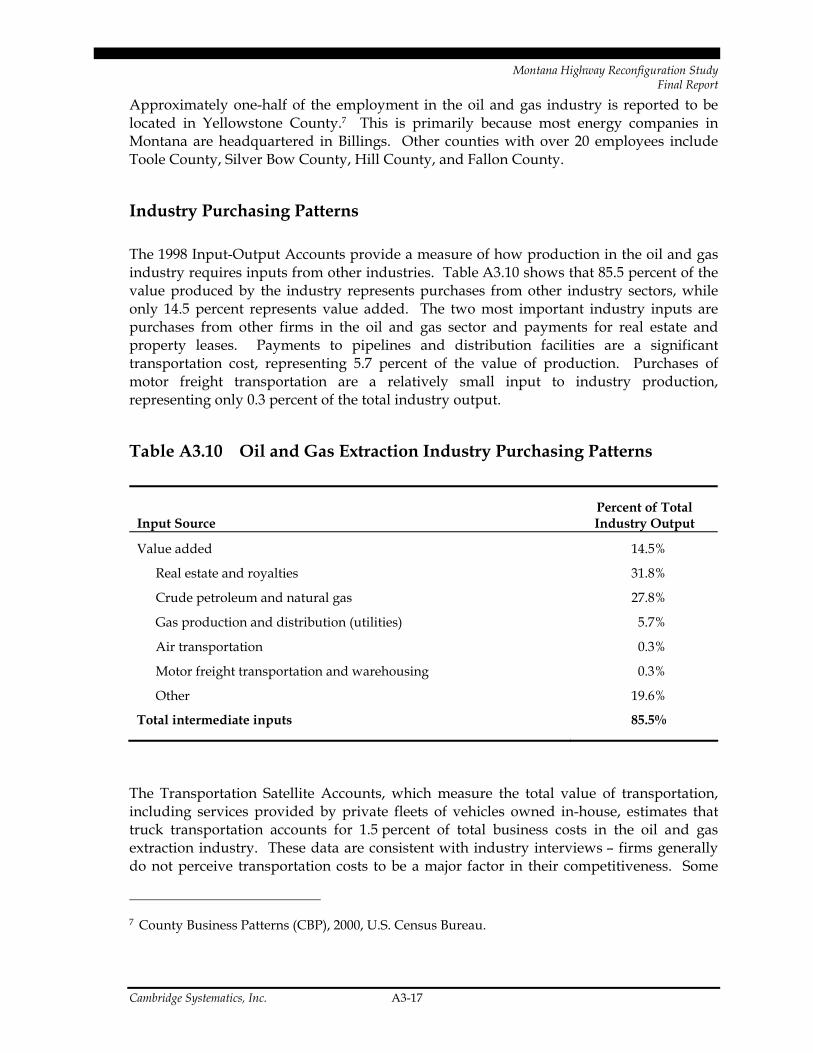
Montana Highway Reconfiguration Study Final Report
Cambridge Systematics, Inc. A3-17
Approximately one-half of the employment in the oil and gas industry is reported to be located in Yellowstone County.7 This is primarily because most energy companies in Montana are headquartered in Billings. Other counties with over 20 employees include Toole County, Silver Bow County, Hill County, and Fallon County.
Industry Purchasing Patterns
The 1998 Input-Output Accounts provide a measure of how production in the oil and gas industry requires inputs from other industries. Table A3.10 shows that 85.5 percent of the value produced by the industry represents purchases from other industry sectors, while only 14.5 percent represents value added. The two most important industry inputs are purchases from other firms in the oil and gas sector and payments for real estate and property leases. Payments to pipelines and distribution facilities are a significant transportation cost, representing 5.7 percent of the value of production. Purchases of motor freight transportation are a relatively small input to industry production, representing only 0.3 percent of the total industry output.
Table A3.10 Oil and Gas Extraction Industry Purchasing Patterns
Input Source Percent of Total Industry Output
Value added 14.5%
Real estate and royalties 31.8%
Crude petroleum and natural gas 27.8%
Gas production and distribution (utilities) 5.7%
Air transportation 0.3%
Motor freight transportation and warehousing 0.3%
Other 19.6%
Total intermediate inputs 85.5%
The Transportation Satellite Accounts, which measure the total value of transportation, including services provided by private fleets of vehicles owned in-house, estimates that truck transportation accounts for 1.5 percent of total business costs in the oil and gas extraction industry. These data are consistent with industry interviews – firms generally do not perceive transportation costs to be a major factor in their competitiveness. Some
7 County Business Patterns (CBP), 2000, U.S. Census Bureau.

Montana Highway Reconfiguration Study Final Report
Cambridge Systematics, Inc. A3-18
firms in this sector are more sensitive to transportation costs than others, however. For instance, a firm that specializes in geological mapping and conducting seismic surveys reports that long transit time to job sites often imposed significant costs on their operations.
Transportation Needs
Interviews suggest that most Montana firms in this industry perceive that the transportation system currently serves their needs well. All output of the industry is moved by pipeline, and transportation is not viewed as a major impediment to the ability of the industry to grow. The most important factor affecting industry prospects is the price of oil and gas in world markets. Potential for industry growth in the near term appears robust as uncertainty in the Middle East and OPEC supply curtailment have increased world prices.
Highway transportation is most important to the industry for the movement of small quantities of input supplies, such as pipes or drilling equipment. It also affects the costs of deploying teams into the field. A significant amount of this travel occurs on private property or on local roads in remote areas.
4.0 Food Processing
Overview
The food manufacturing industry includes firms such as dairies, pasta plants, bakeries, and sugar refineries that transform livestock and agricultural products into food products for intermediate or final consumption. In Montana, the industry is large, accounting for almost 10 percent of the State’s manufacturing jobs and nine percent of the total value of its manufacturing shipments. Nationally and in Montana, food manufacturing has experienced consolidation, reflected in declining employment and output over the long term. However, since 1990, the industry in Montana has stabilized to some extent and has recently demonstrated increasing value added per shipment. The industry relies heavily on truck transportation for accessing both supplies and consumer markets. Many in the industry feel that insufficient truck service and high freight rates in Montana hinder business growth.
National and Global Trends
In 2000, the food manufacturing industry accounted for 8.1 percent of the nation’s manufacturing sector gross domestic product and 1.4 percent of total gross domestic product. While output value of the food products industry increased during the 1990s by

Montana Highway Reconfiguration Study Final Report
Cambridge Systematics, Inc. A3-19
eight percent in real terms, the industry’s portion of total gross domestic product has declined from its 1990 level of 1.7 percent. This trend mirrors the national decline in the importance of the manufacturing sector as a whole.
Domestic exports of food manufacturing products increased (2.8 percent) during the period 1997 to 2001, with the biggest increase (6.1 percent) occurring between 2000 and 2001, at a time when most manufactured products exhibited decline in export value. In 2001, food manufacturing exports made up four percent of all domestic exports.
All stages of the vertical food production process are becoming more concentrated as larger operations increase their size. The processing stage has the fewest number of establishments in this system, but the processor/food manufacturer is often considered the most influential firm in the system. About 80 percent of all raw domestic food products pass through this stage, with only produce and eggs avoiding processing since they only require minimal market preparation services. According to a recent study, the largest 100 food and tobacco processors accounted for nearly 80 percent of the industry’s value added in 1995, almost doubling their share since 1954. The top 100 is itself skewed toward very large firms, with the top 20 accounting for over 50 percent of total value-added in 1995 (1).
Food processor location decisions involve a tradeoff between various production costs, including input costs and the costs of delivering finished products to consumers. Since most of the country’s consumers live near the coasts and most of the raw agricultural foodstuffs come from the middle of the country, the location decision is not straightforward. Over time, with modern transportation and refrigeration technologies, the balance has shifted to locating where the inputs are produced rather than where consumers live.
Montana Trends
The food manufacturing industry in Montana plays an important role in the State’s economy. In 2000, the industry accounted for nine percent of the total value of the State’s manufactured shipments (see Table A3.11). Food manufacturing output accounts for 0.5 percent of Montana’s gross state product. Montana’s food manufacturing industry has similar characteristics to the national industry. Both demonstrated increasing value added per shipment for the 1997 to 2000 period, with food manufacturing increasing from 32 to 43 percent. This contrasts with the manufacturing sector as a whole in Montana, which has exhibited declining value added per shipment from 38 to 30 percent during the same period.
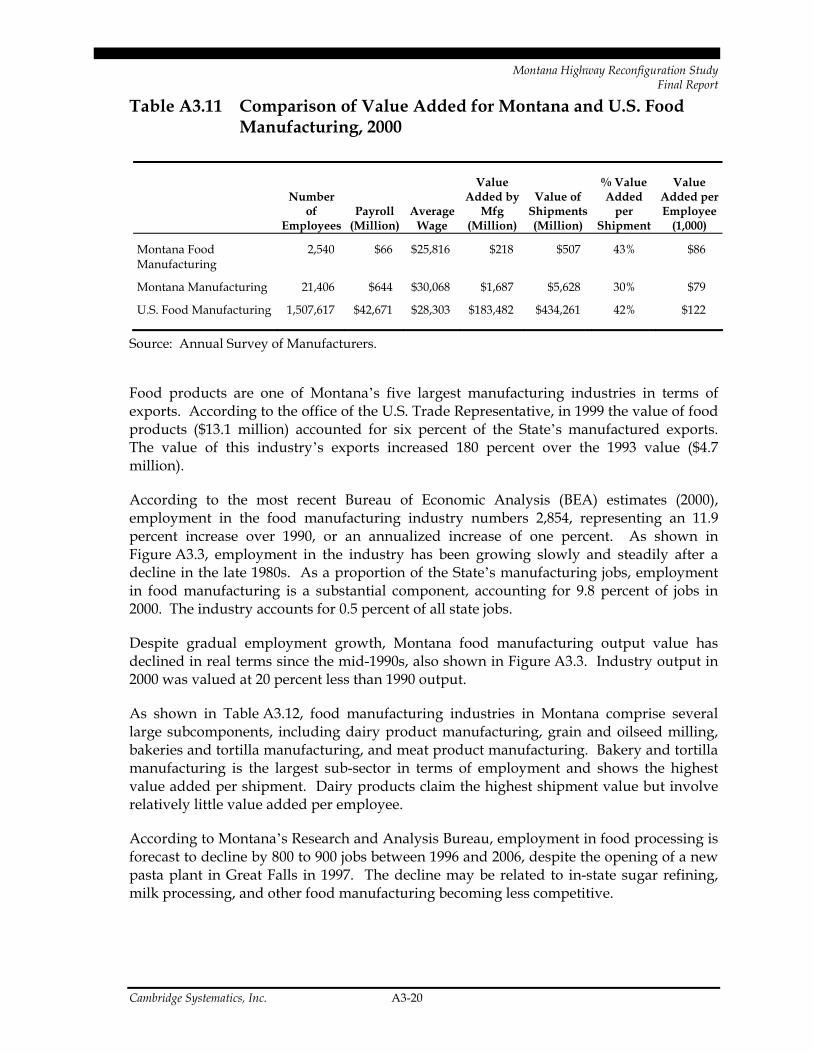
Montana Highway Reconfiguration Study Final Report
Cambridge Systematics, Inc. A3-20
Table A3.11 Comparison of Value Added for Montana and U.S. Food Manufacturing, 2000
Number of
Employees Payroll
(Million) Average
Wage
Value Added by
Mfg (Million)
Value of Shipments (Million)
% Value Added
per Shipment
Value Added per Employee
(1,000)
Montana Food Manufacturing
2,540 $66 $25,816 $218 $507 43% $86
Montana Manufacturing 21,406 $644 $30,068 $1,687 $5,628 30% $79
U.S. Food Manufacturing 1,507,617 $42,671 $28,303 $183,482 $434,261 42% $122
Source: Annual Survey of Manufacturers.
Food products are one of Montana’s five largest manufacturing industries in terms of exports. According to the office of the U.S. Trade Representative, in 1999 the value of food products ($13.1 million) accounted for six percent of the State’s manufactured exports. The value of this industry’s exports increased 180 percent over the 1993 value ($4.7 million).
According to the most recent Bureau of Economic Analysis (BEA) estimates (2000), employment in the food manufacturing industry numbers 2,854, representing an 11.9 percent increase over 1990, or an annualized increase of one percent. As shown in Figure A3.3, employment in the industry has been growing slowly and steadily after a decline in the late 1980s. As a proportion of the State’s manufacturing jobs, employment in food manufacturing is a substantial component, accounting for 9.8 percent of jobs in 2000. The industry accounts for 0.5 percent of all state jobs.
Despite gradual employment growth, Montana food manufacturing output value has declined in real terms since the mid-1990s, also shown in Figure A3.3. Industry output in 2000 was valued at 20 percent less than 1990 output.
As shown in Table A3.12, food manufacturing industries in Montana comprise several large subcomponents, including dairy product manufacturing, grain and oilseed milling, bakeries and tortilla manufacturing, and meat product manufacturing. Bakery and tortilla manufacturing is the largest sub-sector in terms of employment and shows the highest value added per shipment. Dairy products claim the highest shipment value but involve relatively little value added per employee.
According to Montana’s Research and Analysis Bureau, employment in food processing is forecast to decline by 800 to 900 jobs between 1996 and 2006, despite the opening of a new pasta plant in Great Falls in 1997. The decline may be related to in-state sugar refining, milk processing, and other food manufacturing becoming less competitive.

Montana Highway Reconfiguration Study Final Report
Cambridge Systematics, Inc. A3-21
Figure A3.3 Food Manufacturing Output Value and Employment, 1986 – 2000
020406080
100120140160
1986
1987
1988
1989
1990
1991
1992
1993
1994
1995
1996
1997
1998
1999
2000
Out
put (
GSP
in m
illio
n $1
996)
0
500
1,000
1,500
2,000
2,500
3,000
3,500
Empl
oym
ent
OutputEmployment
Source: U.S. Bureau of Economic Analysis, Regional Accounts Data.
Table A3.12 Profile of Montana Manufacturing Industry and Subcomponents, 1997
Industry Sector Total Estab.
Estab. w/ 20+ Emp. Employees
Payroll (000)
Value Added by Mfg (000)
Value of shipments
(000)
Value Added
per Ship-ment
Value Added
per Employee
Manufacturing 1,160 179 19,611 $560,115 $1,732,158 $4,866,279 36% $88
Food Manufacturing
145 18 2,024 $52,348 $151,410 $466,563 32% $75
Animal food mfg
17 2 133 $3,192 $10,019 $31,202 32% $75
Grain & oilseed milling
9 3 151 $4,946 $23,214 $76,525 30% $154
Sugar & confectionery
14 2 250-499 D D D
Dairy product mfg
11 4 330 $10,389 $4,241 $89,833 5% $13
Meat product mfg
40 2 303 $5,738 $14,948 $53,190 28% $49
Bakery & tortilla mfg
35 4 618 $14,682 $36,970 $53,759 69% $60
Source: U.S. Economic Census, 1997. D: Withheld to avoid disclosing data of individual companies; data are included in higher-level totals.

Montana Highway Reconfiguration Study Final Report
Cambridge Systematics, Inc. A3-22
Regional Concentration
Much of Montana’s food manufacturing industry is concentrated in the State’s major metropolitan areas. The Billings MSA (Yellowstone County) and the Great Falls MSA (Cascade County) together account for more than one-half of the food manufacturing shipment value and 43 percent of annual payroll.8 Great Falls is home to Pasta Montana, one of the State’s largest food manufacturing firms. Table A3.13 shows the top six counties in terms of annual payroll and employment. These six counties are home to approximately 60 percent of food manufacturing jobs and annual payroll.
Table A3.13 Comparison of Food Manufacturing in Top 6 Montana Counties, 2000
Rank County Annual Payroll
(000) Employees Establishments
1 Yellowstone $18,898 602 24
2 Cascade $9,418 298 15
3 Missoula $5,797 269 9
4 Flathead $3,203 127 11
5 Gallatin $2,290 110 16
6 Lewis and Clark $1,410 82 8
Source: County Business Patterns (CBP).
Accessing Market and Supplies
Interviews with large Montana-based food manufacturing firms confirm that location is determined to a large extent by proximity to the raw agricultural input(s). As a consequence, the firms rely heavily on the transportation infrastructure to ship products to customers, often located far from the production and processing centers. Food manufacturing firms in the State note primary markets in the Midwestern U.S., the U.S. East Coast, as well as international markets such as Japan.
Montana food manufacturers generally receive supplies by truck, in part because of the perishability of supplies and also because of poor railhead access. Outgoing supplies move to markets using both truck and rail. Manufacturers of lower value, bulk foods often ship the majority of their product by rail, while higher value and perishable products (such 8 U.S. Economic Census; CBP.

Montana Highway Reconfiguration Study Final Report
Cambridge Systematics, Inc. A3-23
as baked goods) are shipped entirely by truck. Some firms report using a combination of truck and rail for outbound shipments. Firms may depend on highway transport in order to access distant railheads. One firm reports trucking food products to the closest railhead 90 miles from their processing facility.
Some Montana firms report being hampered by insufficient truck service. With so few goods coming into parts of the State, there are few trucks that can be loaded for outgoing shipments, which means that firms pay more to transport products via road. Firms have responded to this situation by shipping via rail to distribution centers in the eastern U.S., and then transferring goods to trucks in order to reach markets.
Transportation Needs
Interviews with Montana firms suggest that freight costs in the State often hinder access to markets and supplies. Several firms report that transportation costs account for as much as 25 percent of total production costs. This compares to the national industry average of only 2.6 percent, as reported in the Transportation Satellite Accounts. Montana firms also report paying more than out-of-state competitors for transportation.
All firms interviewed noted that improvements to the transportation infrastructure, especially roadways, would support business expansion. Lower freight rates would improve market and supplier access as well as enhance competitiveness. One firm noted that it would like to expand its markets in the eastern U.S., but that the lack of freight carriers going east resulted in prohibitively high freight rates. If freight rates were lowered, it would pursue expansion plans in this region.
Montana food manufacturers feel that there is potential for development of backward and forward linked industries. One firm noted that improvements in regional access would not only support development of related industries, but would also support general growth of industries in the region, which could lead to lower transportation costs as more companies could share the cost of freight.
5.0 Industrial Machinery
Industry Overview
The machinery sector in Montana includes firms that make machinery for specific and general industrial applications, as well firms that serve the agricultural and mining sectors. Manufacturers in Montana have experienced strong growth in exports in the last few years. Both the increased reliance on industrial sales and the growth in exports appear to be tied to the decline in the mining sector in Montana. Some companies interviewed report that they do not currently have sales in Montana, though Montana’s agriculture and mining industries were the original reason for establishing industrial machinery
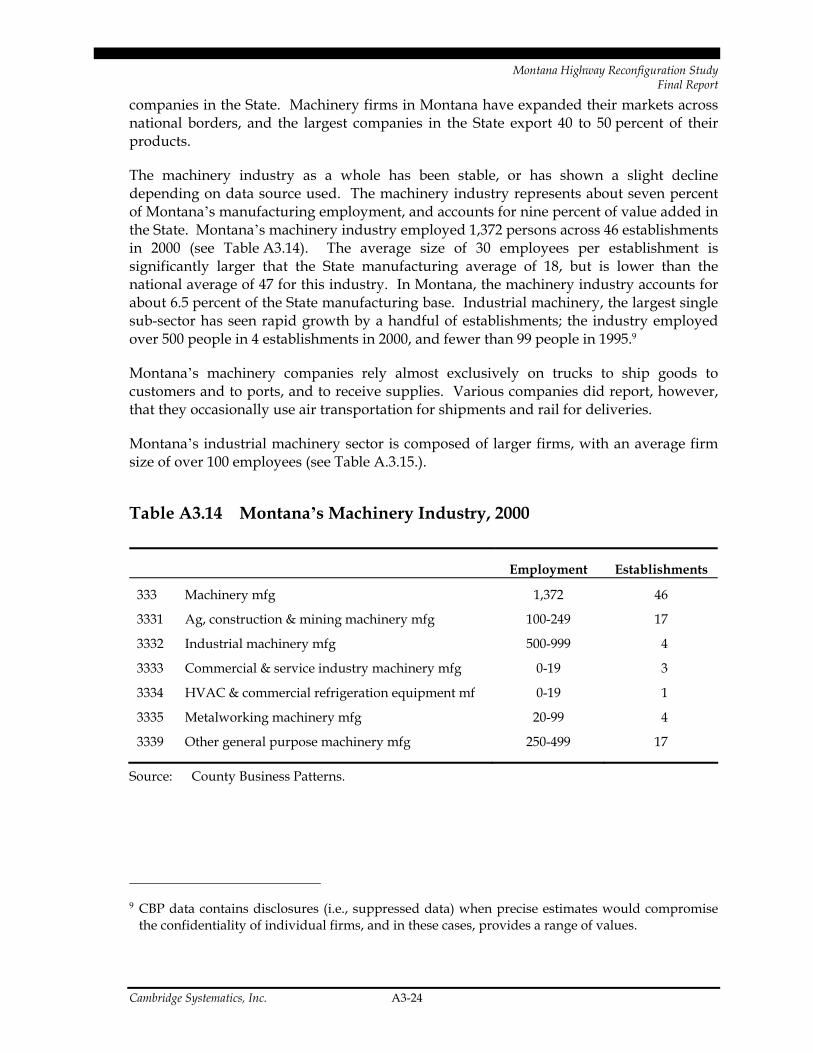
Montana Highway Reconfiguration Study Final Report
Cambridge Systematics, Inc. A3-24
companies in the State. Machinery firms in Montana have expanded their markets across national borders, and the largest companies in the State export 40 to 50 percent of their products.
The machinery industry as a whole has been stable, or has shown a slight decline depending on data source used. The machinery industry represents about seven percent of Montana’s manufacturing employment, and accounts for nine percent of value added in the State. Montana’s machinery industry employed 1,372 persons across 46 establishments in 2000 (see Table A3.14). The average size of 30 employees per establishment is significantly larger that the State manufacturing average of 18, but is lower than the national average of 47 for this industry. In Montana, the machinery industry accounts for about 6.5 percent of the State manufacturing base. Industrial machinery, the largest single sub-sector has seen rapid growth by a handful of establishments; the industry employed over 500 people in 4 establishments in 2000, and fewer than 99 people in 1995.9
Montana’s machinery companies rely almost exclusively on trucks to ship goods to customers and to ports, and to receive supplies. Various companies did report, however, that they occasionally use air transportation for shipments and rail for deliveries.
Montana’s industrial machinery sector is composed of larger firms, with an average firm size of over 100 employees (see Table A.3.15.).
Table A3.14 Montana’s Machinery Industry, 2000
Employment Establishments
333 Machinery mfg 1,372 46
3331 Ag, construction & mining machinery mfg 100-249 17
3332 Industrial machinery mfg 500-999 4
3333 Commercial & service industry machinery mfg 0-19 3
3334 HVAC & commercial refrigeration equipment mf 0-19 1
3335 Metalworking machinery mfg 20-99 4
3339 Other general purpose machinery mfg 250-499 17
Source: County Business Patterns.
9 CBP data contains disclosures (i.e., suppressed data) when precise estimates would compromise
the confidentiality of individual firms, and in these cases, provides a range of values.
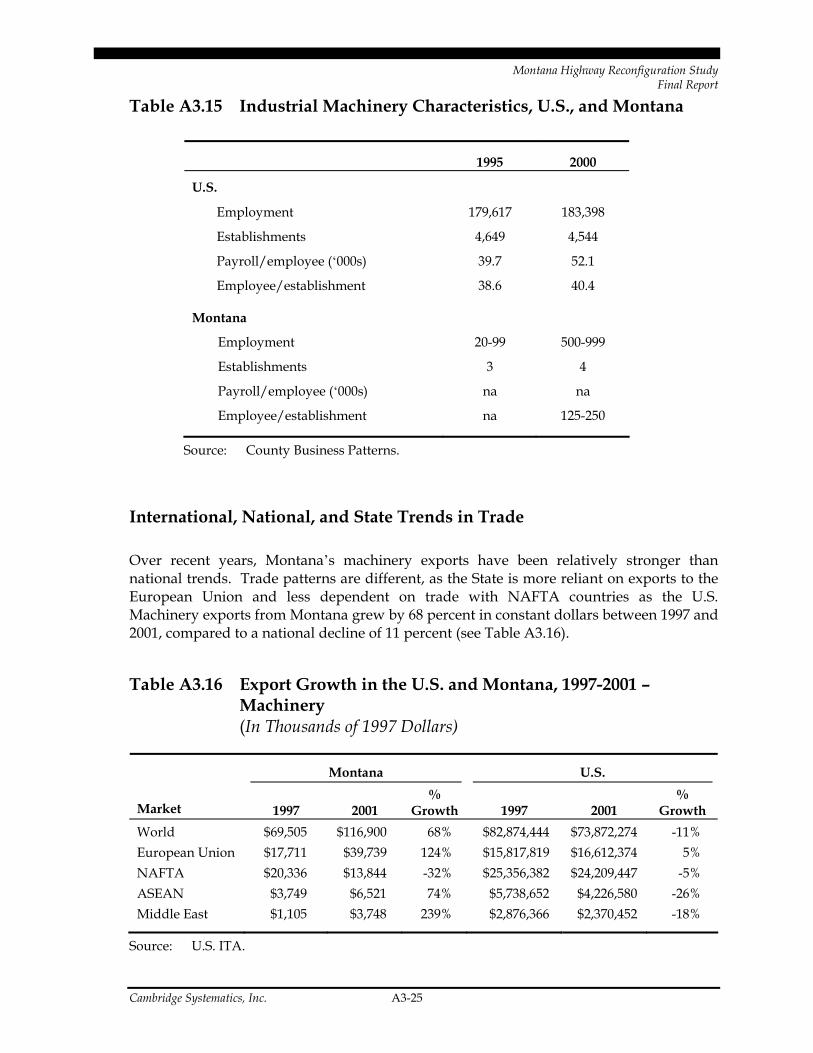
Montana Highway Reconfiguration Study Final Report
Cambridge Systematics, Inc. A3-25
Table A3.15 Industrial Machinery Characteristics, U.S., and Montana
1995 2000
U.S.
Employment 179,617 183,398
Establishments 4,649 4,544
Payroll/employee (‘000s) 39.7 52.1
Employee/establishment 38.6 40.4
Montana
Employment 20-99 500-999
Establishments 3 4
Payroll/employee (‘000s) na na
Employee/establishment na 125-250
Source: County Business Patterns.
International, National, and State Trends in Trade
Over recent years, Montana’s machinery exports have been relatively stronger than national trends. Trade patterns are different, as the State is more reliant on exports to the European Union and less dependent on trade with NAFTA countries as the U.S. Machinery exports from Montana grew by 68 percent in constant dollars between 1997 and 2001, compared to a national decline of 11 percent (see Table A3.16).
Table A3.16 Export Growth in the U.S. and Montana, 1997-2001 – Machinery (In Thousands of 1997 Dollars)
Montana U.S.
Market 1997 2001 %
Growth 1997 2001 %
Growth World $69,505 $116,900 68% $82,874,444 $73,872,274 -11% European Union $17,711 $39,739 124% $15,817,819 $16,612,374 5% NAFTA $20,336 $13,844 -32% $25,356,382 $24,209,447 -5% ASEAN $3,749 $6,521 74% $5,738,652 $4,226,580 -26% Middle East $1,105 $3,748 239% $2,876,366 $2,370,452 -18%
Source: U.S. ITA.

Montana Highway Reconfiguration Study Final Report
Cambridge Systematics, Inc. A3-26
Despite the growth in exports from Montana in the late 1990s, average exports per employee of nearly $63,000 remained well below the national average of $149,000. Although domestic sales per employee were higher in Montana than nationally, the difference did not fully compensate for lower export figures since overall sales per employee are lower in Montana than nationally (see Table A3.17).
Table A3.17 Domestic Sales and Exports Per Employee in the Industrial Machinery Industry in 2000, U.S. and Montana
U.S. Montana
Export Sales/EMP $149,433 $62,729
Domestic Sales/EMP $65,700 $105,263
Source: U.S. ITA and U.S. Department of Census.
National Industry Characteristics
About one-half the income generated by companies in the special industrial machinery sector and the general industrial machinery sector are profits and wages (value added) and one-half are purchases of goods and service from outside suppliers (intermediate inputs), of which eight to 10 percent are from other companies within the industry. This relatively high percentage of profits and wages indicate that the machinery industry in Montana generates a lot of its income within the State. Together, about 60 percent of each sector’s value of final goods is produced by firms within the industry (see Tables A3.18 and A3.19).
Data from the Annual Survey of Manufactures (ASM) suggest that in 2000, wages in Montana’s entire machinery sector were almost 20 percent lower than the U.S. average ($33,512 versus $39,948). In 2000, just 44 percent of Montana’s machinery workers were engaged in production, compared with an average of 65.6 percent nationally (see Table A3.20).

Montana Highway Reconfiguration Study Final Report
Cambridge Systematics, Inc. A3-27
Table A3.18 Purchasing Patterns in Special Industrial Machinery and Equipment Sector, 1998 (Value in Millions Dollars)
Value % of
Value
T Total Industry Output $32,818
VA Value added 15,261 46.5%
I Total intermediate inputs 17,557 53.5%
Key Purchases by Commodity
69A Wholesale trade $2,439 7.4%
48 Special industry machinery and equipment 2,241 6.8%
37 Primary iron and steel manufacturing 1,783 5.4%
38 Primary nonferrous metals manufacturing 1,338 4.1%
50 Miscellaneous machinery, except electrical 1,204 3.7%
53 Electrical industrial equipment and apparatus 1,145 3.5%
42 Other fabricated metal products 933 2.8%
49 General industrial machinery and equipment 732 2.2%
32 Rubber and miscellaneous plastics products 560 1.7%
40 Heating, plumbing, and fabricated structural metal products 539 1.6%
73C Other business and professional services, except medical 443 1.3%
41 Screw machine products and stampings 359 1.1%
71B Real estate and royalties 321 1.0%
Source: U.S. Bureau of Economic Analysis, I-O Accounts.

Montana Highway Reconfiguration Study Final Report
Cambridge Systematics, Inc. A3-28
Table A3.19 Purchasing Patterns in General Industrial Machinery and Equipment Sector, 1998 (Value in $ Millions)
Value % of
Value T Total Industry Output $42,237 VA Value added 21,731 51.5% I Total intermediate inputs 20,506 48.5% Key Purchases by Commodity 49 General industrial machinery and equipment $3,289 7.8% 37 Primary iron and steel manufacturing 2,931 6.9% 69A Wholesale trade 2,529 6.0% 53 Electrical industrial equipment and apparatus 1,414 3.3% 50 Miscellaneous machinery, except electrical 1,311 3.1% 38 Primary nonferrous metals manufacturing 1,096 2.6% 32 Rubber and miscellaneous plastics products 997 2.4% 73C Other business and professional services, except medical 666 1.6% 42 Other fabricated metal products 574 1.4% 40 Heating, plumbing, and fabricated structural metal products 506 1.2% 41 Screw machine products and stampings 493 1.2%
Source: U.S. Bureau of Economic Analysis, I-O Accounts.
Table A3.20 Industry Structure in the Machinery Industry, U.S., and Montana, 2000
U.S. MT Employment 1,402,534 1,583 Value Added 148,798,108 148,431 Shipments 295,753,646 230,486 Payroll 56,028,282 53,049 Production workers 920,112 696 Value Added/shipments 50.3% 64.4% Value Added/employee 106.1 93.8 Production as % of Employment. 65.6% 44.0% Payroll/employee 39,948 33,512
Source: Annual Survey of Manufactures, 2000.

Montana Highway Reconfiguration Study Final Report
Cambridge Systematics, Inc. A3-29
Sub-State Locational Patterns10
Data on machine industry establishments, with 10 or more employees indicate that South-central Montana, specifically, the area in and around Billings in Yellowstone County, dominates the manufacturing (rather than machining) portion of the State’s activity, accounting for 10 the 17 large firms in this sector. The State’s machining strength is clustered in western Montana (see Tables A3.21 and A3.22).
Table A3.21 Establishment Characteristics, Montana’s Industrial Machinery and Equipment Industry (Establishments of 10 or More Employees)
Location # EST Ave. – Emp Ave. Sales Sales/Emp
Northwest 3 19 5,517,667 290,404
Southwest 2 51 3,734,000 73,216
North-central 2 20 4,844,000 242,200
South-central 10 39 12,063,600 310,918
East - - - -
Total 17 35 9,079,118 262,939
Source: InfoUSA Establishment Data.
10 This section uses data from CBP and Establishment Database to examine substate locational
patterns in the wood products industry. Both data sources have limitations: CBP employment data are often suppressed at the country level and establishment data record only those firms with 10 or more employees. Together, though, they can provide an overview of the location of the machinery industry within Montana. Because CBP county data might be suppressed in one year but not another, locational patterns are shown for each year in the 1990 to 1997 period along with an average for that period and for 2000.

Montana Highway Reconfiguration Study Final Report
Cambridge Systematics, Inc. A3-30
Table A3.22 Establishment Characteristics, Montana’s Machine Shops, and Equipment Industry Establishments of 10 or More Employees
Location # Est Ave. – Emp Ave. Sales Sales/Emp
Northwest 4 22 2,675,250 123,000
Southwest 5 17 2,115,600 123,000
North-central - - - -
South-central 2 15 1,783,500 123,000
East - - - -
Total 11 18 2,258,727 123,000
Source: InfoUSA Establishment Data.
More than one-third of the State’s “large” firms are located in Yellowstone County, which also accounts for 45 percent of the State’s employment (Table A3.23). This supports the conclusion that the most recent CBP data underestimate the importance of south-central Montana and overestimate the importance of western Montana to the machinery industry. Establishment data do suggest that activity is concentrated in a few places: just three counties – Yellowstone and the western counties of Gallatin and Missoula – account for over 70 percent of the State’s establishments and over 65 percent of the State’s employment in the machinery industry.
Table A3.23 Machinery Industry Employment by County
County Number of
Establishments Employment Average
Employment
Yellowstone 10 352 35.2 Gallatin 6 98 16.3 Missoula 4 74 18.5 Cascade 2 40 20.0 Fergus 2 65 32.5 Deer Lodge 1 90 90.0 Flathead 1 23 23.0 Lincoln 1 13 13.0 Sanders 1 34 34.0 Totals 28 789 28.2
Source: InfoUSA Establishment Data.

Montana Highway Reconfiguration Study Final Report
Cambridge Systematics, Inc. A3-31
II. The Role of Transportation in Performance in the Machinery Industry
Companies rely exclusively on trucks to ship goods to customers and to ports, and interviewees note that their transportation costs are high because in-coming and outgoing goods must be shipped such long distances. This means that Montana’s firms are often shipping goods farther than their competitors and thus, incurring higher transportation costs. One informant noted that his company’s competitors are serving mostly local customers.
Informants reported other transportation- and non-transportation related impediments to firm growth. Issues related to transportation include:
• Restrictions on one-ton trucks. According to one informant, DOT regulates its sales people who drive one-ton trucks, including requirements that they log their hours. Companies that obey these regulations are at a competitive disadvantage with the firms that don’t comply.
• Finding independent truckers for small loads.
• Difficulty in arranging over-sized loads. One informant reports that it can be difficult in Montana to get permits to carry these loads. However, the informant acknowledged that there are states in which it’s easier and some states where it’s harder, to get these permits than it is Montana.
Non-transportation business impediments include:
• The decline of the customer base in Montana, especially mining. One informant explains this decline by reference to changing environmental ethics: little did the company know that the “the State would become so green.”
• Limited access to capital.
• Overseas competition, including by firms that have developed “copycat” products.
Transportation in the Machinery Industry
Changes in the mining and lumber industries have had a direct effect on transportation costs. The losses of local customer bases for firms that serve the mining industry mean that these companies must ship goods farther than their competitors to remain viable. As a result, their transportation costs are higher. The decline of the lumber industry was also cited as having an important, if indirect, effect on transportation costs. One informant reports that its biggest transportation problem is finding independent truckers to carry its loads, which are small by trucking standards. The company’s shipments aren’t large enough to fill a truck and truckers are generally unwilling to take a partial truckload. In the past, the company would split truckloads with other firms, usually lumber firms. The decline in the lumber industry, though, makes such load-sharing more difficult today. As

Montana Highway Reconfiguration Study Final Report
Cambridge Systematics, Inc. A3-32
a result, the firm must “pay for a truck that is one-half full,” a practice that increases its transportation costs.
One industry interviewee believes that his company’s transportation costs are lower than most of its competitors, an advantage attributed to the company’s location. In 1990, this company moved from Wolf’s Point, MT to its current location near Billings. After operating with the transportation in Wolf’s Point, Billings seems “almost optimal”: pricing is a lot better, as is speed of shipments. At its previous location, the company did not receive discounts from carriers on its shipments. Now, the company now typically receives about 60 percent discounts on outgoing freight – much of which is sent by UPS – and “average” discounts on in-coming freight. The large discounts on outgoing freight are due to low demand: “nothing goes out of Billings,” so carriers are willing to offer discounts. According to this informant, his company’s shipments travel faster now, as well: from its previous location, the company had to ship everything through Billings anyway, which added a day or two to shipment time.
Some of these same adverse conditions, however, have been turned into competitive advantage for individual firms. One informant suggests that low demand for freight space in trucks leaving Montana makes trucking firms willing to negotiate low rates for outgoing freight. This results in huge discounts for firms sending shipments out of central sites like Billings. Similarly, the decline in traditional industries in Montana has created pockets of under- and unemployment that can be used to the advantage of individual firms. One mining machinery firm reported that it has been able to survive because of the low wages workers will accept: “I hate to say it, but we have survived because we pay our workers less…but we’d like to pay them more.”
Firms report that they ship 70 to 100 percent of product by truck. Exporting firms have reported using air shipment for up to 30 percent, depending on the required speed of delivery. Far more frequently, product is trucked to distributors in Los Angeles, Chicago, and New York, or to ports in California, Texas, and Florida for international shipment. One company reported flying 20 percent of his company’s shipments directly to customers, some in foreign markets, thus by-passing distributors and speeding up delivery.
Supplies arrive almost exclusively by truck. One company, though, did report receiving a few shipments from local firms by rail. The heavy reliance on trucks may be due to limited rail alternatives but also because rail services don’t fit well with the company’s transportation needs: rail “isn’t that inexpensive,” it takes a month to get goods to customers, and rail shipments require 100-ton blocks of freight, which is too much freight for his company.
Conclusion
Nationally, transportation costs in the industrial machinery sector are not significant, averaging just 2.0 percent of all production costs, which ranks it 41st of the
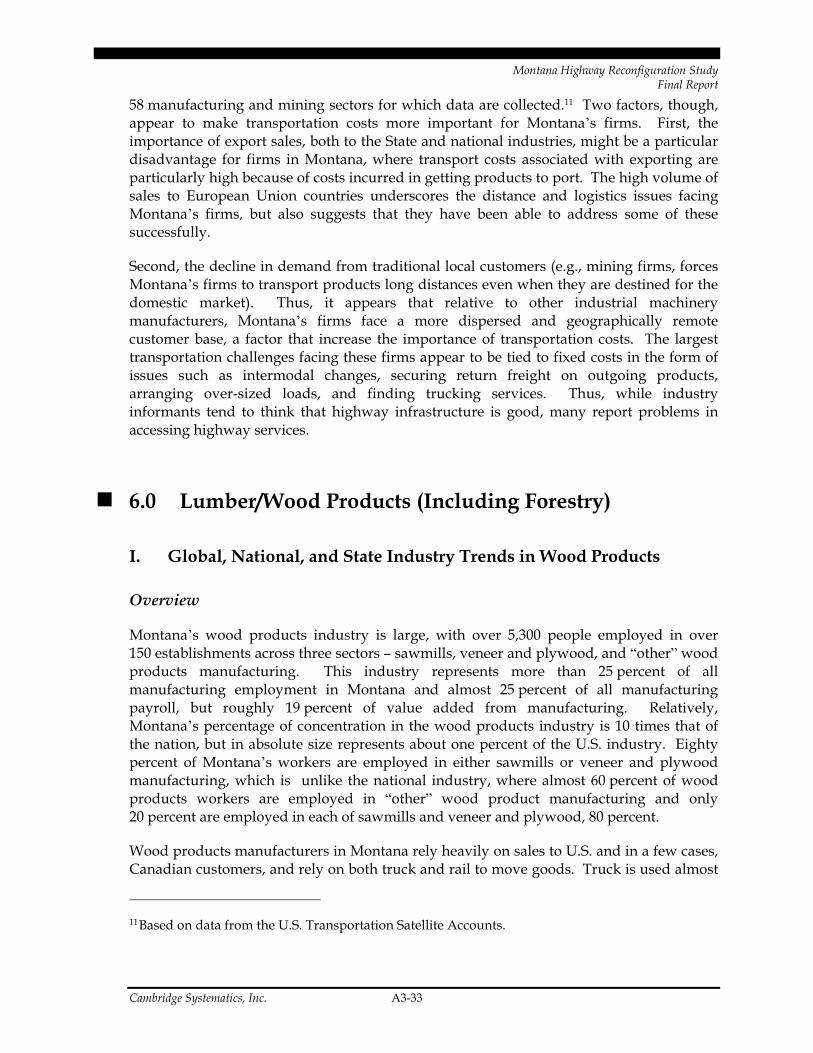
Montana Highway Reconfiguration Study Final Report
Cambridge Systematics, Inc. A3-33
58 manufacturing and mining sectors for which data are collected.11 Two factors, though, appear to make transportation costs more important for Montana’s firms. First, the importance of export sales, both to the State and national industries, might be a particular disadvantage for firms in Montana, where transport costs associated with exporting are particularly high because of costs incurred in getting products to port. The high volume of sales to European Union countries underscores the distance and logistics issues facing Montana’s firms, but also suggests that they have been able to address some of these successfully.
Second, the decline in demand from traditional local customers (e.g., mining firms, forces Montana’s firms to transport products long distances even when they are destined for the domestic market). Thus, it appears that relative to other industrial machinery manufacturers, Montana’s firms face a more dispersed and geographically remote customer base, a factor that increase the importance of transportation costs. The largest transportation challenges facing these firms appear to be tied to fixed costs in the form of issues such as intermodal changes, securing return freight on outgoing products, arranging over-sized loads, and finding trucking services. Thus, while industry informants tend to think that highway infrastructure is good, many report problems in accessing highway services.
6.0 Lumber/Wood Products (Including Forestry)
I. Global, National, and State Industry Trends in Wood Products
Overview
Montana’s wood products industry is large, with over 5,300 people employed in over 150 establishments across three sectors – sawmills, veneer and plywood, and “other” wood products manufacturing. This industry represents more than 25 percent of all manufacturing employment in Montana and almost 25 percent of all manufacturing payroll, but roughly 19 percent of value added from manufacturing. Relatively, Montana’s percentage of concentration in the wood products industry is 10 times that of the nation, but in absolute size represents about one percent of the U.S. industry. Eighty percent of Montana’s workers are employed in either sawmills or veneer and plywood manufacturing, which is unlike the national industry, where almost 60 percent of wood products workers are employed in “other” wood product manufacturing and only 20 percent are employed in each of sawmills and veneer and plywood, 80 percent.
Wood products manufacturers in Montana rely heavily on sales to U.S. and in a few cases, Canadian customers, and rely on both truck and rail to move goods. Truck is used almost
11 Based on data from the U.S. Transportation Satellite Accounts.
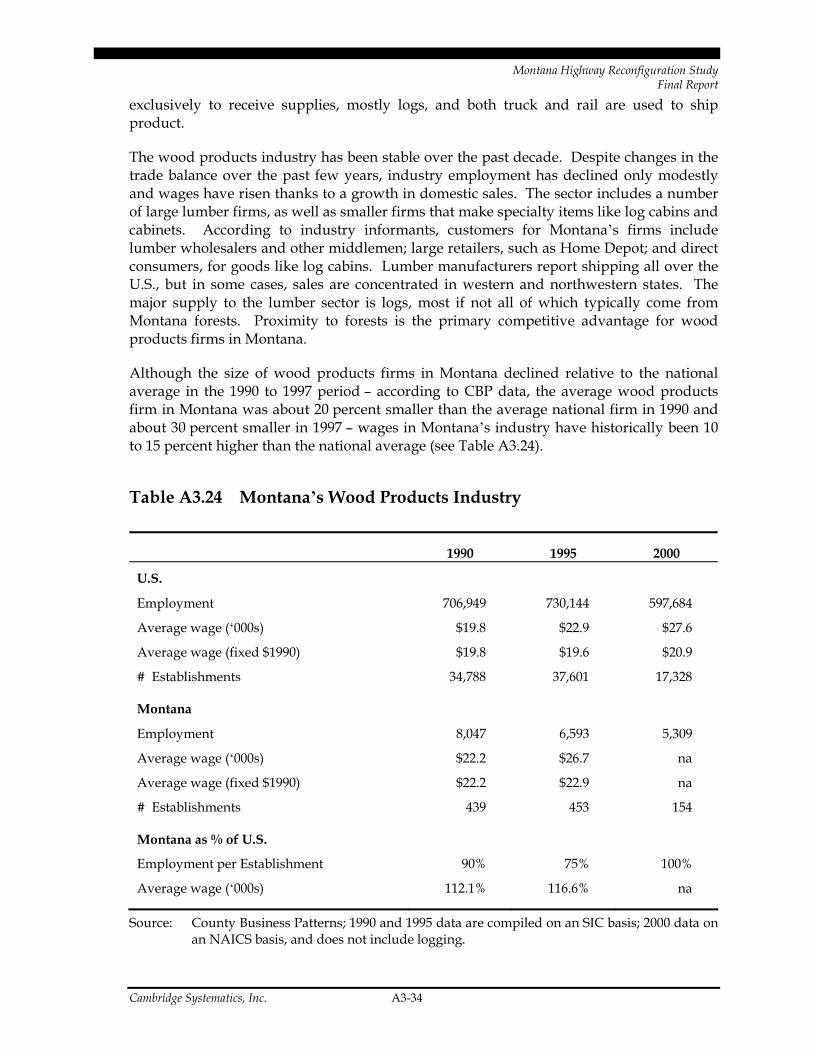
Montana Highway Reconfiguration Study Final Report
Cambridge Systematics, Inc. A3-34
exclusively to receive supplies, mostly logs, and both truck and rail are used to ship product.
The wood products industry has been stable over the past decade. Despite changes in the trade balance over the past few years, industry employment has declined only modestly and wages have risen thanks to a growth in domestic sales. The sector includes a number of large lumber firms, as well as smaller firms that make specialty items like log cabins and cabinets. According to industry informants, customers for Montana’s firms include lumber wholesalers and other middlemen; large retailers, such as Home Depot; and direct consumers, for goods like log cabins. Lumber manufacturers report shipping all over the U.S., but in some cases, sales are concentrated in western and northwestern states. The major supply to the lumber sector is logs, most if not all of which typically come from Montana forests. Proximity to forests is the primary competitive advantage for wood products firms in Montana.
Although the size of wood products firms in Montana declined relative to the national average in the 1990 to 1997 period – according to CBP data, the average wood products firm in Montana was about 20 percent smaller than the average national firm in 1990 and about 30 percent smaller in 1997 – wages in Montana’s industry have historically been 10 to 15 percent higher than the national average (see Table A3.24).
Table A3.24 Montana’s Wood Products Industry
1990 1995 2000
U.S.
Employment 706,949 730,144 597,684
Average wage (‘000s) $19.8 $22.9 $27.6
Average wage (fixed $1990) $19.8 $19.6 $20.9
# Establishments 34,788 37,601 17,328
Montana
Employment 8,047 6,593 5,309
Average wage (‘000s) $22.2 $26.7 na
Average wage (fixed $1990) $22.2 $22.9 na
# Establishments 439 453 154
Montana as % of U.S.
Employment per Establishment 90% 75% 100%
Average wage (‘000s) 112.1% 116.6% na
Source: County Business Patterns; 1990 and 1995 data are compiled on an SIC basis; 2000 data on an NAICS basis, and does not include logging.

Montana Highway Reconfiguration Study Final Report
Cambridge Systematics, Inc. A3-35
Wood products before 1997 included logging as a component. In 1997, Montana hosted 1,194 logging jobs of 6,441 employed in the total industry. From 1998 on, Montana’s logging employment has been reported as a range of 1,000 to 2,499. Thus, declines in the wood products industry from 1997 is primarily due to changes in Federal “counting” systems. Thus over logging 1,000 jobs need to be added back to employment totals after 1997 for employment in Montana’s wood products industry to be compatible with employment in the industry during previous years.
International, National, and State Trends in Trade
In 2001, Montana accounted for only 0.4 percent of U.S. trade in wood products, which is less than one-half of its relative concentration compared to the nation when measured by employment, wages and value added. Exports per employee averaged about $7,831 (in 1997$) in the U.S. wood products industry in 2000 compared with only $3,105 per employee in Montana. From 1997-2000, exports per employee were 2.5 to 3.0 times higher in the U.S. than in Montana, though the differences have been declining (see Table A3.25). Montana’s domestic sales per employee, though, are about 20 percent higher than the average across the U.S.12 (see Table A3.26).
Table A3.25 Exports Per Employee in the Wood Products Industry, U.S., and Montana (In 1997 Dollars)
1997 1998 1999 2000
U.S. $7,411 $7,892 $7,864 $7,831
Montana $2,449 $2,773 $3,020 $3,105
Source: Calculated by the author from data from U.S. ITA and U.S. Department of Census.
12 Exports per employee calculated by the author using data from U.S. ITA (export data) and
Department of Census, County Business Patterns (employment data). Domestic sales per employee were calculated by the author using data from U.S. ITA, County Business Patterns, and Department of Census, Annual Survey of Manufactures (value of shipments data).

Montana Highway Reconfiguration Study Final Report
Cambridge Systematics, Inc. A3-36
Table A3.26 Domestic Sales and Exports Per Employee in the Wood Products Industry in 2000, U.S. and Montana
U.S. Montana
Export Sales/EMP $8,402 $3,331
Domestic Sales/EMP $148,483 $176,089
Source: Calculated by the author from data from U.S. ITA and U.S. Department of Census.
National Industry Characteristics
In the wood products industry, 38 percent of income generated is profits and wages (value added) and 62 percent are purchases of goods and service from outside suppliers (intermediate inputs). Among these purchases, however, about 37 percent of the total industry output is in purchases from companies in the lumber and wood products or forestry industries. Thus 75 percent of the income of this industry is traced to companies with a strong presence in Montana, indicating that the wood products industry directly or indirectly generates a lot of its income within the State (see Table A3.27).
Table A3.27 Purchasing Patterns in Wood Products, 1998 (Value in Millions Dollars)
Value % of
Value
Total Industry Output $118,243 100% VA Value added 44,774 38% I Total intermediate inputs 73,469 62% Key Purchases by Commodity 20+21 Lumber and wood products 35,867 30% 3 Forestry and fishery products 8,652 7% 69A Wholesale trade 7,955 7% 65B Motor freight transportation and warehousing 3,264 3% 73C Other business and professional services, except medical 1,518 1% 42 Other fabricated metal products 1,173 1%
Source: U.S. Bureau of Economic Analysis, I-O accounts.
Montana’s wood products industry has a similar industry structure as the national profile. Both industries have an average value added per employee of about $60,000; production

Montana Highway Reconfiguration Study Final Report
Cambridge Systematics, Inc. A3-37
workers comprise 83 to 88 percent of all workers; and value added per shipments, while slightly higher in the U.S., is similar in the State and national industries. In this way, the wood products industry is different than some other manufacturing sectors in Montana, such as transportation equipment, which exhibit fundamentally different wage and value added structures than the national industry (see Table A3.28 below). Note that data in Tables A3.27 and A3.28 are not strictly comparable because they refer to different years and are compiled by different agencies.
Table A3.28 Industry Structure of U.S. and Montana Wood Products Industries, 2000 (In Thousands Dollars)
U.S. MT
Employment 585,035 5,300 Production Employment 486,720 4,670 Value Added $36,093,437 $319,514 Shipments $93,767,402 $952,538 Payments ( wages) $16,135,745 $158,277 VA/Shipment 38.5% 33.5% VA/Employee $61.7 $60.3 % Production Employment 83.2% 88.1%
Source: Department of Census, Annual Survey of Manufactures.
Sub-state Locational Patterns
The wood products industry to be heavily concentrated in northwest Montana, where about 75 percent of all wood products workers were employed throughout the 1990 to 1997 period, and a reported 93 percent were employed in 2000 (see Table A3.29). The difference in the 1990 to 1997 and 2000 patterns likely attributable to a combination of a change in sector definition – data for 2000 are based on NAICS codes which, unlike SIC codes used for earlier years, do not include logging under the wood products sector – and problems caused by data suppression in the 2000 CBP.)

Montana Highway Reconfiguration Study Final Report
Cambridge Systematics, Inc. A3-38
Table A3.29 Employment in Montana’s Wood Products by Sub-state Region
Northwest Southwest North-Central
South-Central East
1990 77% 13% 4% 4% 2%
1995 74% 15% 8% 3% 0
1997 72% 13% 5% 9% 1%
2000 (does not include logging)
93% 5% 0% 3%% 0
Average, 1990-1997
75% 14% 5% 5% 1%
Source: County Business Patterns.
Companies in the wood products-logging industry that employ 10 or more people provide more than 5,000 jobs in the State (see Table A3.31). These data are SIC based and include logging). Missoula County accounts for almost 23 percent of all Montana employment, but less than 11 percent of establishments among these larger wood products companies. Moreover, the northwestern counties of Missoula Flathead, Lincoln, and Ravalli, account for 65 percent of state employment in the industry among large establishments, and about 54 percent of the number of large establishments in this industry. Twenty counties in Montana are home to at least one company in this sector with 10 or more workers (see Table A3.30).
Fifteen of these 104 establishments are logging companies, and they are heavily concentrated in the northwest, with six in Lincoln County, four in Flathead, and single establishments in Missoula, Sanders, and Lake Counties (see Table A3.31). Overall the 15 largest logging establishments average 17 employees, and $3.7 million in sales, while the remaining 89 large establishments in the wood products industry average 56 workers and $13.3 million in sales.

Montana Highway Reconfiguration Study Final Report
Cambridge Systematics, Inc. A3-39
Table A3.30 Wood Products Employment by County Establishments of 10 or More Employees
County Number of
Establishments Employment Average
Employment Missoula 11 1,189 108 Flathead 16 917 57 Lincoln 12 714 60 Ravalli 19 604 32 Gallatin 9 384 43 Lake 7 286 41 Powell 1 200 200 Sanders 4 152 38 Yellowstone 6 123 21 Cascade 4 113 28 Custer 1 115 28 Mineral 3 105 35 Stillwater 2 105 53 Broadwater 1 87 87 Richland 1 45 45 Granite 1 40 40 Lewis Clark 2 35 18 Carbon 1 26 26 Jefferson 2 21 11 Park 1 10 10 Total 104 5,271 51
Source: InfoUSA Establishment Data Base.
Table A3.31 Logging Employment by County Establishments of 10 or More Employees (Subset of Table A3.30)
County Number of
Establishments Employment Average Employment Lincoln 6 86 14 Flathead 4 93 23 Missoula 1 25 25 Ravalli 1 12 12 Sanders 1 16 16 Gallatin 1 12 12 Lake 1 17 17 Total 15 261 17

Montana Highway Reconfiguration Study Final Report
Cambridge Systematics, Inc. A3-40
II. The Role of Transportation in Industry Performance: Wood Products Industry
Companies report only minor problems with transportation of in-coming goods. For example, in some cases, logs must be transported through secondary (and not always well-maintained) roads, thus slowing delivery of goods. Other stated concerns were traffic on Route 93, which can cause bottlenecks; and the lack of secondary roads into forests, which depresses the availability of forest products. Issues raised concerning outgoing product reflect the supply of trucks and rail cars, and not the conditions of roadways.
Informants reported both additional transportation- and non-transportation related impediments to growth and/or maintenance. Issues related to transportation include:
• Tight transportation supply during peak season, especially availability of rail cars. All informants, who noted that the cyclical nature of the industry plays a large role in creating transportation bottlenecks during some periods, mentioned this problem. Rail, which is reported to be cheaper and quicker for transporting finished products, seems to suffer from the most acute shortages, perhaps because wood products firms demand not only rail service, but also particular types of cars. Still, informants report difficulty with the availability of trucking services in the spring and summer, as well.
• Construct more secondary roads near logging activity. Informants mentioned availability, price, and stability of raw material supplies as critical to current competitiveness and future growth. Two specific factors that affect raw material availability were mentioned: the inability of the Forest Service to get successful timber sales out for bid; and the difficulty of accessing more remote sources of logs. The latter problem, an informant suggested, could be remedied by investments in secondary roads close to logging activity.
Issues not related to transportation include:
• Poor state industry conditions: One informant suggested that any future growth would have to come through productivity improvements, because the wood products market can’t absorb any more products.
• Industry mix in Montana: Overall industry performance nationally has been stronger than in Montana: between 1990 and 1997, when Montana’s wood products employment fell by 20 percent, overall employment growth in the U.S. was over five percent. This suggests that there exist significant competitive issues specific to Montana. One such issue is industry mix. Historically, sawmills have comprised a much larger portion, and “other” wood products (e.g., containers) a smaller portion of the industry activity in Montana compared to the rest of the nation. This can likely

Montana Highway Reconfiguration Study Final Report
Cambridge Systematics, Inc. A3-41
explain some of the difference in performance: during the 1990s, sawmill activity experienced a decline in the U.S., while “other” wood products grew rapidly.13
• Availability of workers: Various, often unrelated factors appear to be converging to create labor force issues for firms. First, one informant suggested that values are changing, making young workers less willing to accept industrial jobs in lieu of alternatives like travel. This informant also complained that younger workers who have accepted jobs sometimes skip – or even quit – work without notifying the firm. Second, the influx of second-home buyers into Montana has pushed the cost of living up in some areas, thus keeping potential employees from moving into such areas.
Cost of Transportation
According to the U.S. Transportation Satellite Accounts, companies in the wood products sector pay 4.2 percent of their total production costs for transportation services.14 At first glance, 4.2 percent might seem low given the nature of the industry, which tends to be in high-weight, low-value added goods.
Interviews with companies in Montana, though, dissected the cost of transportation. While interviewees believed that their transportation costs were no higher than either 4.2 percent or the costs borne by their direct competitors, some also reported that their customers handle transportation arrangements, suggesting that related costs are borne by the purchasing rather than supplying firm. Because of the seeming prevalence of this arrangement, it is possible that transportation costs in MT are in fact different than in other states. A precise estimate of these differences, however, would require a comparison the costs of moving final goods out of Montana relative to moving similar goods out of other states with wood products industries. In any case, it is likely that costs differ from site to site and influence purchasing patterns of major buyers. These costs, though, are not transparent and might not be apparent to the supplying firms but only to purchasing firms.
13 Because of the change in sectoral definitions between SIC and NAICS, it is difficult to make
sectoral comparisons for the 1990s. However, SIC-based data for 1993 to 1997 show that logging and sawmill activity experienced almost no employment growth, while millwork employment grew by 9.1 percent, and “other” wood sector employment grew by 24.2 percent. By 1997, almost one-half (49.7 percent) of Montana’s wood products employment was in sawmill activity, compared to just 26.7 percent nationally. According to (NAICS-based) CBP data, by 2000, “sawmills and wood preservation” accounted for 41 percent of employment in Montana, compared to just 22 percent nationally.
14 The U.S. Transportation Satellite Accounts are generated jointly by the U.S. Bureau of Transportation Statistics and the U.S. Bureau of Economic Analysis to assess each industry’s use of transportation services in the production process.

Montana Highway Reconfiguration Study Final Report
Cambridge Systematics, Inc. A3-42
Transportation in the Wood Product Industry
Industry informants in this sector report that supplies for companies (primarily logs) arrive almost exclusively by truck. One company does report using rail as a back-up transportation mode, but estimates that only 10 percent of logs come by rail. The heavy reliance on trucks is due to the location of forests and logging activity, which tend to be away from rail sources. The cost of transporting supplies was not apparent to the interviewees, because such costs are included in the log costs quoted by suppliers.
For outgoing products, both truck and rail are used. These range from a truck to rail split of 65 percent and 35 percent to 20 percent and 80 percent. In the latter case, however, the firm is located near two rail stations, so its reliance on rail might not be typical of firms in Montana.
Some firms reported outsourcing transportation functions to local haulers, both to bring in supplies (here, logs) and for other purposes. According to these informants, it is not cost-effective to maintain in-house trucking capabilities because: 1) it is difficult to keep trucks busy; 2) the source of logs can change rapidly (i.e., suppliers vary and are geographically dispersed); and 3) industry demand is cyclical.
The cyclical nature of the business causes other problems with transportation: in the spring and summer, when industry activity is at its highest, it is difficult to obtain rail cars, especially the types needed to move lumber products, and local “jobbers” who move product in and out can be hard to find. The latter problem is especially acute for product going to customers in remote areas; in these cases, it is difficult for truckers to secure return freight, thus making them reluctant to accept outgoing jobs. Because of these problems, firms can experience delays of 1 to 3 weeks in securing the necessary transportation services, thus making it difficult to get on-time deliveries.
Conclusion
Highways are of critical importance to the wood products industry, especially for in-coming supplies of logs. Because of the nature of wood supplies, which are fixed by the location of loggable forests, new supply channels are difficult to develop; and the logistics associated with obtaining and transporting logs make trucks the most cost-effective means of transport. Even firms with ready access to rail and high dependence on rail for shipping finished products use highways almost exclusively for bringing in supplies. Given the nature of the industry, this is unlikely to ever change.
Montana Highway Reconfiguration Study Final Report
Cambridge Systematics, Inc. A3-43
7.0 Fabricated Metal Products
Overview
Manufacturers of fabricated metal products transform metal into intermediate or end products. Important fabricated metal processes are forging, stamping, bending, forming, and machining, used to shape individual pieces of metal, and other processes, such as welding and assembling, used to join separate parts together. The sector excludes the manufacture of machinery, computers and electronics, and metal furniture. It also excludes firms that make fabricated metal products from raw materials. For example, an establishment that manufactures steel, draws it into wire, and makes wire products would be classified in the primary metal manufacturing sector.
In Montana, the fabricated metal products industry is relatively small but growing rapidly. Industry employment in Montana has increased 2.5 times since 1990 to approximately 1,900 workers, and payroll more than tripled during that period. Fabricated metals firms in the State rely heavily on the highway network to receive supplies and ship products.
National and Global Trends
Nationally, the fabricated metal products industry is growing on par with the overall U.S. economy. The value of output from the industry increased 31 percent between 1990 and 2000 in real terms. The industry accounts for 6.2 percent of U.S. manufacturing output and 1.1 percent of total output. The industry’s share of manufacturing output has declined somewhat in recent years, from 6.7 percent in 1990.
Employment in the U.S. fabricated metal industry has grown by 21 percent between 1990 and 2000. Table A3.32 shows trends in the number of establishments and employees in the industry for the U.S. and Montana. Output per employee is rising in the industry, indicating that the industry has become more productive and capital intensive.
The market for fabricated metal products is becoming more global. Firms in the developing world are increasingly able to compete with U.S. firms for the manufacture of metal products. Some U.S. firms are outsourcing components of their production to developing countries. Overall, global demand for fabricated metal products has remained relatively strong. U.S. firms that manufacture customized products or products not easily shipped long distances (including some major Montana firms) have been less affected by global competition.

Montana Highway Reconfiguration Study Final Report
Cambridge Systematics, Inc. A3-44
Table A3.32 U.S. and Montana Fabricated Metal Product Manufacturing Industry Summary
U.S. Montana
1990 2000 Change 1990 2000 Change
Employment 1,483,334 1,790,817 21% 552 1,911 246%
Annual Payroll (000) $39,637,787 $64,244,450 62% $10,758 $47,629 343%
Number of Establishments
37,683 61,144 62% 52 130 150%
Average Wage $26,722 $35,874 34% $19,489 $24,924 28%
Employees Per Establishment
39 29 -26% 11 15 38%
Source: County Business Patterns.
State Trends
In Montana, the fabricated metal products industry is growing rapidly, though it remains relatively small. Industry employment in Montana increased 2.5 times since 1990 as shown in Table A3.32. Montana payroll more than tripled during that period.
Figure A3.4 shows the real value of fabricated metal manufacturing output over time in Montana and the U.S. Output in the industry has grown by 59 percent, nearly twice the growth rate of Montana’s total economy. Still, fabricated metal output remains only 0.17 percent of Montana’s total output. Although Montana’s fabricated metal industry is relatively small, its share of total economic activity has grown over the last decade.
Montana’s fabricated metal industry includes a number of different types of manufacturers, including industrial metal fabricators, consumer product manufacturers, and integrated fabrication and design operations. Brief profiles of two major employers are provided below.
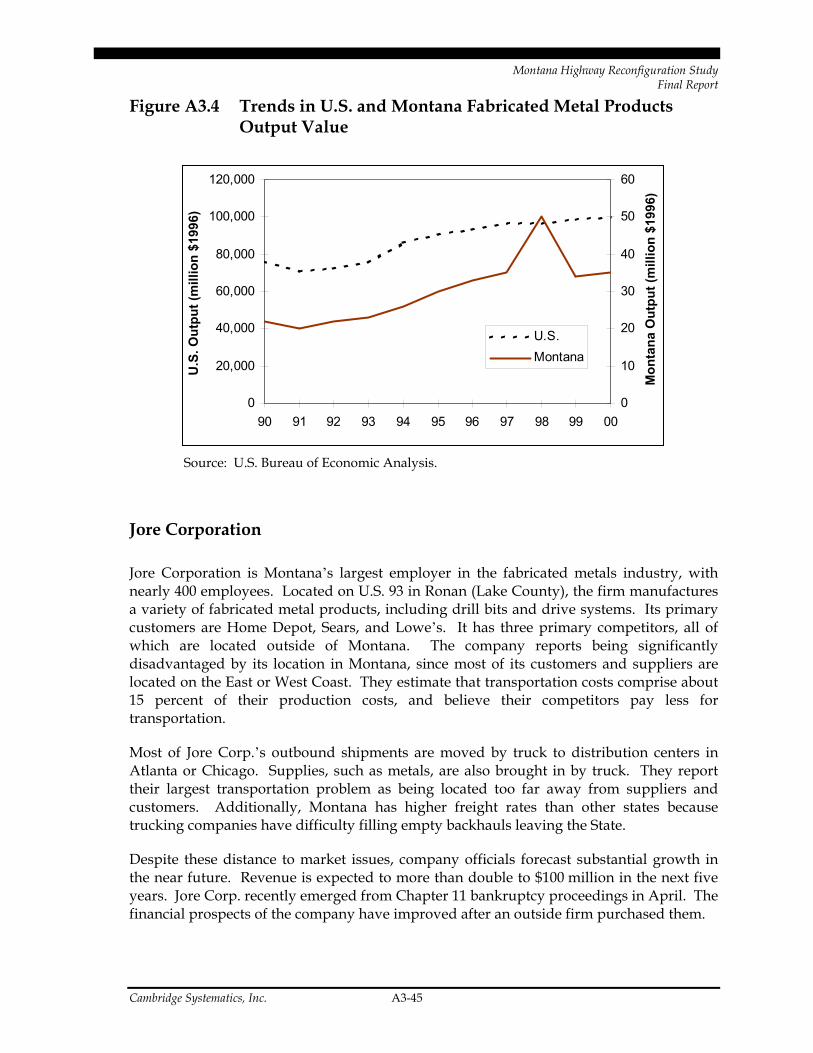
Montana Highway Reconfiguration Study Final Report
Cambridge Systematics, Inc. A3-45
Figure A3.4 Trends in U.S. and Montana Fabricated Metal Products Output Value
0
20,000
40,000
60,000
80,000
100,000
120,000
90 91 92 93 94 95 96 97 98 99 00
U.S
. Out
put (
mill
ion
$199
6)
0
10
20
30
40
50
60
Mon
tana
Out
put (
mill
ion
$199
6)
U.S.Montana
Source: U.S. Bureau of Economic Analysis.
Jore Corporation
Jore Corporation is Montana’s largest employer in the fabricated metals industry, with nearly 400 employees. Located on U.S. 93 in Ronan (Lake County), the firm manufactures a variety of fabricated metal products, including drill bits and drive systems. Its primary customers are Home Depot, Sears, and Lowe’s. It has three primary competitors, all of which are located outside of Montana. The company reports being significantly disadvantaged by its location in Montana, since most of its customers and suppliers are located on the East or West Coast. They estimate that transportation costs comprise about 15 percent of their production costs, and believe their competitors pay less for transportation.
Most of Jore Corp.’s outbound shipments are moved by truck to distribution centers in Atlanta or Chicago. Supplies, such as metals, are also brought in by truck. They report their largest transportation problem as being located too far away from suppliers and customers. Additionally, Montana has higher freight rates than other states because trucking companies have difficulty filling empty backhauls leaving the State.
Despite these distance to market issues, company officials forecast substantial growth in the near future. Revenue is expected to more than double to $100 million in the next five years. Jore Corp. recently emerged from Chapter 11 bankruptcy proceedings in April. The financial prospects of the company have improved after an outside firm purchased them.

Montana Highway Reconfiguration Study Final Report
Cambridge Systematics, Inc. A3-46
Jore Corp. believes that the transportation infrastructure available to them is generally adequate. However, access to reliable rail service could benefit the firm by making it easier to purchase in bulk from suppliers and receive discounts. The firm also feels that widening U.S. 93 to a four-lane road might also benefit travel time and safety for their transportation providers.
Selway Corporation
Selway Corporation is an important employer in the fabricated metals industry in Montana, with 130 employees. Located in Stevensville (Ravalli County), the firm forms flat steel into tanks, hoppers, and other shapes. Most of its customers are in the mining industry in western states such as Utah and Nevada. Recently, the firm expanded into conveyer systems manufacturing. The firm is the only integrated designer and manufacturer of conveyer systems in the country. Several other U.S. firms design conveyer systems, but these companies outsource the manufacturing. Most of Selway’s conveyer systems are used in mining operations. The company expects to achieve substantial sales growth, driven primarily by expansion in their conveyer system products.
Selway Corp. came to be located in Montana primarily because a large industrial building was vacant and could be obtained at reasonable cost. Selway was able to use an industrial revenue bond to finance their operations. The firm imports raw steel from Oregon, Utah, and Washington. Supplies from the West are shipped by truck. Some steel is also brought in from the southeast U.S. and can be shipped by rail.
Finished products are moved by truck and are often oversized loads. Transportation is important to their competitiveness. In some cases, competitors in Utah and Nevada have an advantage in winning work because of their proximity to customers. Selway estimates that transportation is 8 to 10 percent of their total costs. They subcontract out the movement of freight to trucking companies.
Selway has a number of unique transportation problems because many of their loads are oversized. Selway finds the procedures for obtaining special permits to operate trucks over 80,000 lbs. cumbersome. Montana is fairly flexible in issuing permits, but Selway is also required to obtain permits from every state that a load moves through.
It is difficult to move oversized loads on narrow roads. Selway believes that roadway improvements, such as widening U.S. 93 to four lanes, would lower their freight costs by requiring the use of fewer pilot cars for moving oversized loads. Another problem associated with moving oversized loads is that utility lines sometimes need to be raised. Recent changes in the law have moved the burden of paying for these changes from the utility to the shipper. There is currently no standard for line height that all utilities are required to adhere to.

Montana Highway Reconfiguration Study Final Report
Cambridge Systematics, Inc. A3-47
Purchasing Patterns
Table A3.33 shows purchasing patterns in the heating, plumbing, and fabricated structural metal products industry. The data is drawn from the 1998 input-output accounts for the U.S. These figures specify the percentage of industry output made up of intermediate inputs purchased from other industries, and the percent of value added. Fabricated metal products industry has a relatively high value added component of 46 percent of output.
Table A3.33 also shows the percent of output made up of transportation purchases from outside firms in rail, air, and motor freight transportation. Nationally, the fabricated metal industry spends 1.4 percent of output on outsourced motor freight transportation and warehousing, 0.33 percent on air transportation, and 0.27 percent of output on rail service. The Transportation Satellite Accounts provide a more accurate measure of each industry’s use of trucking services, since they include the value of the service provided by in-house private fleets. This data show that when in-house transportation services are included, 8.2 percent of the fabricated metals industry output is comprised of purchases of trucking services, indicating that this industry typically provides much of its own trucking services.
Table A3.33 Purchasing Patterns for Heating, Plumbing, and Fabricated Structural Metal Products
Input Source Percent of Total Industry Output
Value added 46.1%
Primary iron and steel manufacturing 15.2%
Primary nonferrous metals manufacturing 7.7%
Wholesale trade 5.4%
Heating, plumbing, and fabricated structural metal products 5.2%
Other fabricated metal products 3.3%
Other business and professional services 2.5%
Motor freight transportation and warehousing 1.4%
Air transportation 0.3%
Railroads and related services 0.3%
Other 12.5%
Total intermediate inputs 53.9%
Transportation Satellite Accounts
Trucking Services 8.2%

Montana Highway Reconfiguration Study Final Report
Cambridge Systematics, Inc. A3-48
Regional Concentrations
There are 28 counties in Montana with employment in fabricated metals manufacturing. Table A3.34 shows the number of establishments and employees in the top nine counties. Due to the small number of establishments in many counties, the data provide high and low ranges for the employment data in some counties to avoid disclosing proprietary information. The top five counties have approximately 80 percent of the State’s employment in the industry. Lake County leads the State in fabricated metal manufacturing employment because of the location of Jore Corp. In Yellowstone County, Roscoe Steel & Culvert Company is a major fabricated metals employer, with 140 employees. A large fraction of fabricated metals employees in Ravalli County work for Selway Corporation, which employs 130 people. Midwest Industries is an important employer in Gallatin County, with 50 employees.
Table A3.34 Tops Counties with Fabricated Metal Products Manufacturing Employment
County Establishments Employment
Lake County 2 500 – 999
Yellowstone County 22 337
Ravalli County 12 159
Gallatin County 16 144
Missoula County 12 131
Flathead County 17 96
Sweet Grass County 3 20 – 99
Silver Bow County 2 20 – 99
Fergus County 4 20 – 99
Role of Transportation and Future Growth
Transportation plays a significant role in determining the competitiveness and market area of the fabricated metals manufacturing industry. All of the firms interviewed cite transportation as a significant factor in competition. Montana firms report that transportation-related costs and lack of proximity to their customers sometimes prevent them from winning work. Nonetheless, most of the major Montana firms have a significant portion of out-of-state business.
Montana Highway Reconfiguration Study Final Report
Cambridge Systematics, Inc. A3-49
Most Montana firms in this industry believe they are generally well served by the roadway infrastructure available to them. A number of interviewees suggested that widening major highways would lower their transportation costs. Transportation costs (and freight shipping rates) are perceived to be higher in the State due to the low density of freight traffic and problems associated with moving oversized loads. Still, firms interviewed expect to grow significantly in the near future, consistent with the increases in employment over the last decade.
8.0 High-Tech Products (Electrical/Electronic Equipment and Instruments)
I. National and Global Trends
Industry Overview
For this analysis, we consider a group of technology industries together under the general label of “high-tech.” Over the past decade, Montana has seen new and emerging economic activity in communication equipment, semiconductor machinery manufacturing, semiconductors, and other electronic components, and instruments, including medical devices. We grouped these sectors together because singularly they are small industries in the State, but share some important characteristics. With one exception, the industries are composed of small businesses that employ far fewer people per establishment than equivalent “high-tech” industries nationally, and pay significantly lower wages than national industry norms. The industries also tend to produce high value-low weight output, which presents a profile different from the goods that have been traditionally produced by Montana industries. High-tech establishments in Montana use parcel services to deliver goods domestically and internationally. Companies also use less-than-truckload (LTL) trucking and air-ride trucks to ship their heavier goods.
Over 1,200 people work in 26 “high-tech” establishments in Montana, which account for slightly less than six percent of Montana’s manufacturing employment, but more than one-half of this employment is in one company. Companies in this sector are located in the western and central regions of the State, are spread-out among counties, and are not geographically clustered. Starting with a very small base, employment in Montana’s high-tech industries increased over the 1998-2000 period, while employment in similar technologies declined across the nation.15 In addition, the rate of growth of exports from Montana’s high-tech industries far exceeded national averages. Similar to other U.S. firms
15 With the dramatic changes in sectoral definitions among high-tech industries initiated by the
change from SIC to NAICS definitions in 1998, it is difficult to compile time series data for the computer and electronics industries. Instead, Table A3.35 compares basic characteristics of the computer and electronics industries in Montana and the U.S. for 1998 to 2000.
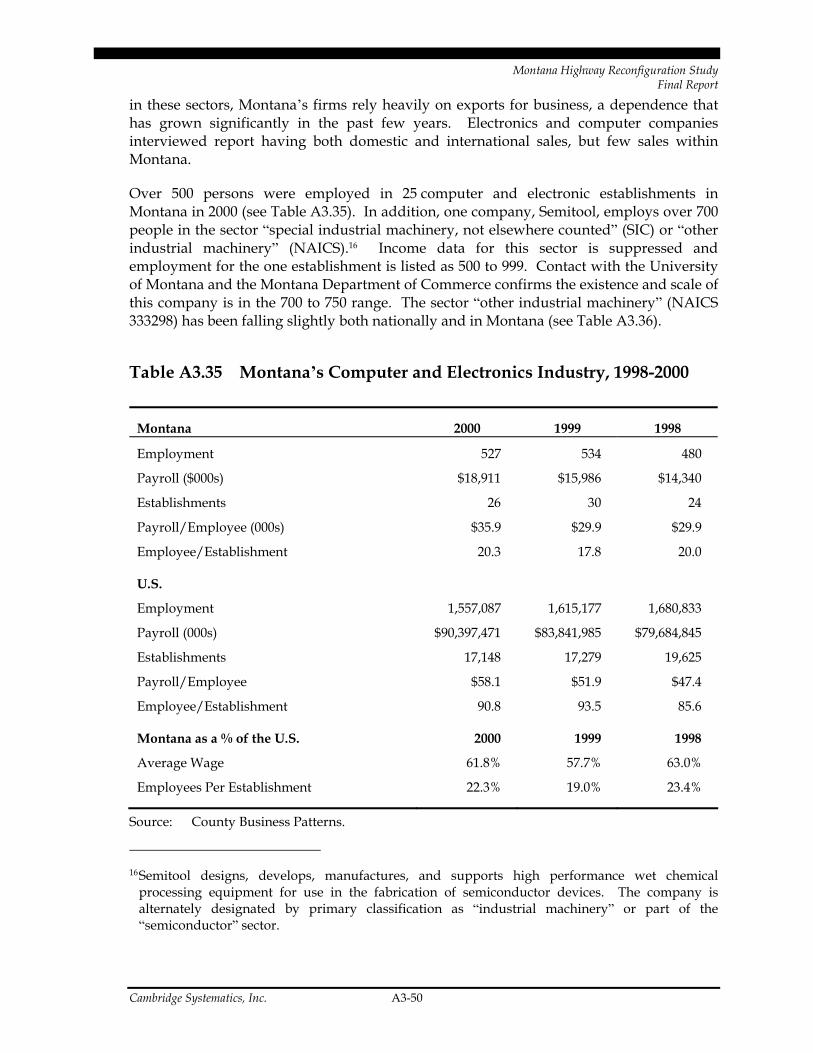
Montana Highway Reconfiguration Study Final Report
Cambridge Systematics, Inc. A3-50
in these sectors, Montana’s firms rely heavily on exports for business, a dependence that has grown significantly in the past few years. Electronics and computer companies interviewed report having both domestic and international sales, but few sales within Montana.
Over 500 persons were employed in 25 computer and electronic establishments in Montana in 2000 (see Table A3.35). In addition, one company, Semitool, employs over 700 people in the sector “special industrial machinery, not elsewhere counted” (SIC) or “other industrial machinery” (NAICS).16 Income data for this sector is suppressed and employment for the one establishment is listed as 500 to 999. Contact with the University of Montana and the Montana Department of Commerce confirms the existence and scale of this company is in the 700 to 750 range. The sector “other industrial machinery” (NAICS 333298) has been falling slightly both nationally and in Montana (see Table A3.36).
Table A3.35 Montana’s Computer and Electronics Industry, 1998-2000
Montana 2000 1999 1998
Employment 527 534 480
Payroll ($000s) $18,911 $15,986 $14,340
Establishments 26 30 24
Payroll/Employee (000s) $35.9 $29.9 $29.9
Employee/Establishment 20.3 17.8 20.0
U.S.
Employment 1,557,087 1,615,177 1,680,833
Payroll (000s) $90,397,471 $83,841,985 $79,684,845
Establishments 17,148 17,279 19,625
Payroll/Employee $58.1 $51.9 $47.4
Employee/Establishment 90.8 93.5 85.6
Montana as a % of the U.S. 2000 1999 1998
Average Wage 61.8% 57.7% 63.0%
Employees Per Establishment 22.3% 19.0% 23.4%
Source: County Business Patterns.
16 Semitool designs, develops, manufactures, and supports high performance wet chemical
processing equipment for use in the fabrication of semiconductor devices. The company is alternately designated by primary classification as “industrial machinery” or part of the “semiconductor” sector.

Montana Highway Reconfiguration Study Final Report
Cambridge Systematics, Inc. A3-51
Table A3.36 Other Industrial Machinery, Montana, and the United States, 1997-2000
Employment
Year Montana U.S.
1997 1,000-2,499 53,106
1998 1,000-2,499 57,009
1999 500-999 50,906
2000 500-999 50,852
Source: County Business Patterns.
International Production and Trade
In recent years, exports from Montana grew much faster than exports from the rest of the U.S. Although Montana and the U.S. suffered a large decline in exports in 2001, overall export growth for the 1997 to 2001 period was 90 percent for Montana in constant dollars, compared to one percent for the U.S. During this period, Montana’s exports to Europe rose much faster than U.S. exports to Europe (161 percent versus two percent), and to NAFTA countries (55 percent versus 16 percent) (see Table A3.37). Despite Montana’s strong export performance in the late 1990s, exports per employee were still just slightly more than one-half the national average in 2000 (the last year for which comparable state and national data are available) (see Table A3.38).
The computer and electronic products industry has, over the past decade, driven much of the economic growth of the advanced economies in Europe, Asia, and North America, as well as in developing and emerging economies across the globe. Computers and related products and the components used in their manufacture accounted for 5.7 percent of total global trade in 1999, an increase from 3.8 percent in 1990. Much of the growth in global exports has come from developing economies which now account for 25 percent of world exports of office machines and 44 percent of the components used to make computers and other data-processing and office machines. Moreover, accessories and component exports (Sector 759) from developing economies grew from 17.5 to 43.8 percent of global exports between 1990 and 1999.

Montana Highway Reconfiguration Study Final Report
Cambridge Systematics, Inc. A3-52
Table A3.37 Computer and Electronics Exports from the U.S. and Montana, 1997-2001 (In Thousands of 1997 Dollars)
Montana U.S.
Market 1997 2001 %
Growth 1997 2001 %
Growth
World $12,064 $22,972 90% $152,896,164 $ 154,110,967 1%
ASEAN 628 291 -54% 21,806,376 18,523,119 -15%
European Union 4,759 12,405 161% 35,070,009 35,862,688 2%
NAFTA 2,886 4,461 55% 37,742,803 43,773,865 16%
Other 2,992 13,685 357% 39,108,656 38,828,662 -1%
Source: U.S. ITA.
Table A3.38 Exports Per Employee in the High-Technology Industries – U.S. and Montana in 2000
U.S. $119,335
Montana $65,338
Source: U.S. ITA and U.S. Department of Census.
National Industry Characteristics
About 13 percent of income generated in the computer and electronics industry are profits and wages (value added) and almost 87 percent are purchases of goods and service from outside suppliers (intermediate inputs), including about 31 percent from other companies within the industry. The low percentage of value added demonstrates the high degree of outsourcing that characterizes the industry. Given that computers and electronics are small industries in Montana, the State is probably not significantly helped by the high proportion of the value of final goods that is purchased from other firms in these industries. Purchases made from other technology companies in the computer and electronics sectors account for over 45 percent of the total value of final goods (30.6 percent plus 14.8 percent, Table A3.39). This is almost three and one-half times the value of product produced in-house at computer and electronics firms and suggests the importance of either co-locating with other firms in the industry or having access to transportation networks that can serve these supply needs.

Montana Highway Reconfiguration Study Final Report
Cambridge Systematics, Inc. A3-53
Table A3.39 Purchasing Patterns in the Computer and Electronics Industry, 1998 (Value in Millions Dollars)
Value % of
Value
T Total Industry Output 104,722
VA Value added 13,989 13.4%
I Total intermediate inputs 90,733 86.6%
Key Purchases by Commodity
57 Electronic components and accessories 32,051 30.6%
51 Computer and office equipment 15,474 14.8%
VA Value added 13,989 13.4%
69A Wholesale trade 13,306 12.7%
80 Noncomparable imports 6,544 6.2%
53 Electrical industrial equipment and apparatus 2,517 2.4%
73C Other business and professional services, except medical 1,941 1.9%
32 Rubber and miscellaneous plastics products 1,749 1.7%
73A Computer and data processing services, including own-account software
1,674 1.6%
71B Real estate and royalties 1,622 1.5%
73D Advertising 1,378 1.3%
38 Primary nonferrous metals manufacturing 1,194 1.1%
73B Legal, engineering, accounting, and related services 1,173 1.1%
70A Finance 1,108 1.1%
41 Screw machine products and stampings 1,095 1.0%
Source: U.S. Bureau of Economic Analysis, I-O Accounts
The value of shipments in different high-tech sectors increased nationally during the 1997-2000 period in the specific computer and electronics sectors of most interest to Montana –optical instruments, medical equipment and devices, and semiconductors. Employment, however, shows mixed trends among the various sectors. General employment in optical instruments is rising, but the levels of production workers are falling. Employment in other instrument sectors is declining for both production and non-production workers. Employment in medical devices and the semi-conductor industry is growing (see Table A3.40).

Montana Highway Reconfiguration Study Final Report
Cambridge Systematics, Inc. A3-54
Table A3.40 Recent Trends in Computer and Electronic Products in the U.S., 1997-2000
1997 2000 % Change 1997-2000
Optical instrument & lens mfg (NAICS 333314 )
Value of Shipments ($1997) 3,140 3,722 18.5%
Employment 20.4 22.1 8.3%
Production Workers 12.1 11.4 -5.8%
Semiconductor machinery mfg (NAICS 333295 )
Value of Shipments ($1997) 11,163 20,834 86.6%
Employment 40.1 51.4 28.2%
Production Workers 20.9 26.7 27.8%
Medical equipment & supplies mfg (NAICS 3391)
Value of Shipments ($1997) 44,894 51,724 15.2%
Employment 292 307 5.1%
Production Workers 185 192 3.8%
Navigation/measuring/medical/control instruments mfg (NAICS 3345 )
Value of Shipments ($1997) 89,466 107,995 20.7%
Employment 484 469 -3.1%
Production Workers 209 197 -5.7%
Source: County Business Patterns.
Sub-state Locational Patterns
High-tech industries in Montana are primarily found in the western region of the State, with some activities scattered elsewhere. All of the State’s 7 “large” establishments (those with 10+ employees) in semiconductors and circuit boards are located in western Montana, with 92 percent of employees located in northwest Montana due to the location of Semitool in Kalispell. Other electronics firms are found in southwestern Montana and north-central Montana, each of which include about 40 percent of the State’s employees in these sector, not including Semitool and the semiconductor sector (see Tables A3.41 and A3.42.)

Montana Highway Reconfiguration Study Final Report
Cambridge Systematics, Inc. A3-55
Table A3.41 Montana’s Semiconductor and Circuit Board Establishments (With 10 or More Employees by Region)
Region # Establishments Employment
Circuit Boards, Semi-Conductors: 367*
Northwest 4 1,281
Southwest 3 114
Total 7 1,395
Note: The counts Semitool in this sector at an employment level that is approximately 400 greater than Montana sources indicate. In this table, we use the employment level and SIC classification provided in the Establishment Database.
Source: InfoUSA Establishment Data
Table A3.42 Montana’s Electronics Establishments (Except Semiconductors and Circuit Boards) with 10 or More Employees by Region
Region # Establishments Employment
Other Electronic Equipment: 36*, Except 367
Northwest – –
Southwest 3 48
North-central 3 48
East 1 15
South-central 1 10
Total 8 121
Source: InfoUSA Establishment Data.
County-Level Activity
The 23 high-tech establishments in Montana with 10 or more employees are scattered over the western third of the State (16 establishments), the central counties of the State (six establishments) and in the east (one establishment). With two exceptions, single counties do not house establishments from more than one of these three industries: semiconductors and circuit boards, other electronics, and medical instruments. The exceptions are Gallatin County, which is home to at least one firm in each of the three sectors, and Yellowstone County, which is home to one electronics and two medical device firms (see Tables A3.43,

Montana Highway Reconfiguration Study Final Report
Cambridge Systematics, Inc. A3-56
A3.44, and A3.45.) High-tech activity in Gallatin County and Bozeman benefits from the engineering school at Montana State University.
Table A3.43 Electronic Components and Accessories (SIC 367) Establishments with Employment of 10 or more by County
County Number of Establishments Employment
Flathead 2 1,157
Gallatin 1 49
Lake 2 124
Park 1 25
Silver Bow 1 40
Total 7 1,355
Source: InfoUSA Establishment Data.
Table A3.44 Electronics (SIC 36 Other than SIC 367) Establishments with Employment of 10 or more by County
County Number of
Establishments Employment
Cascade 2 20
Gallatin 2 20
Lewis Clark 1 25
Madison 1 12
Valley 1 15
Yellowstone 1 10
Total 8 102
Source: InfoUSA Establishment Data.
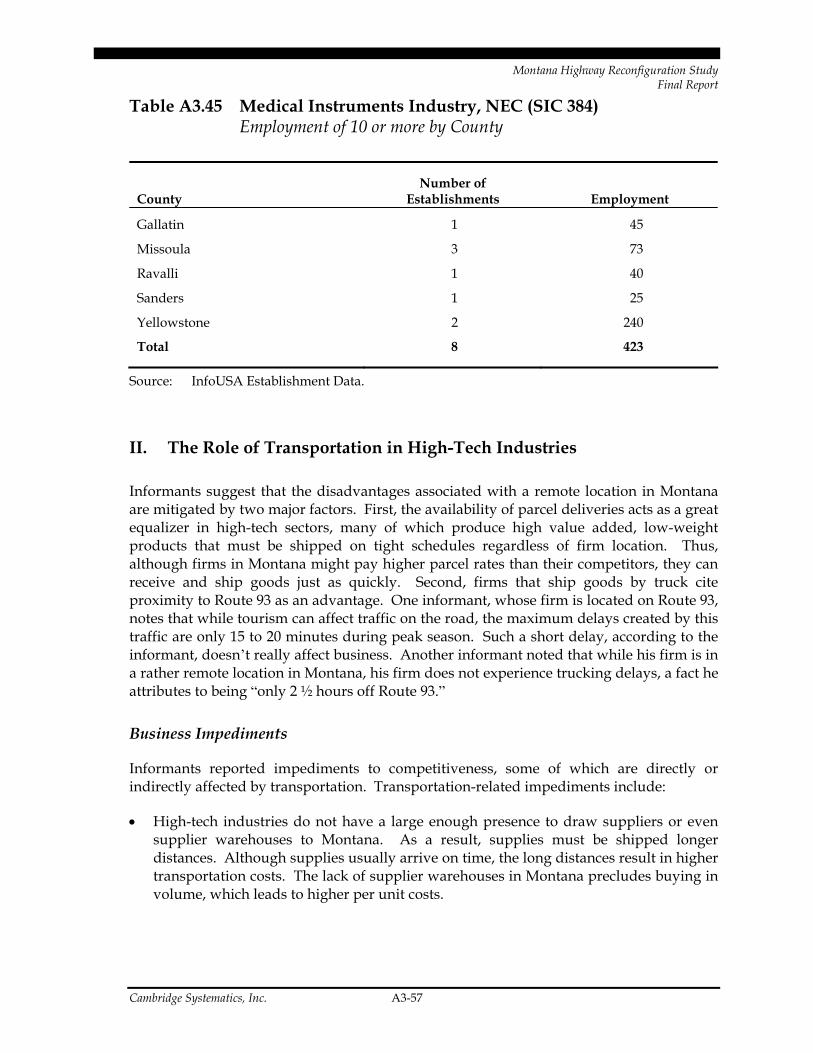
Montana Highway Reconfiguration Study Final Report
Cambridge Systematics, Inc. A3-57
Table A3.45 Medical Instruments Industry, NEC (SIC 384) Employment of 10 or more by County
County Number of
Establishments Employment
Gallatin 1 45
Missoula 3 73
Ravalli 1 40
Sanders 1 25
Yellowstone 2 240
Total 8 423
Source: InfoUSA Establishment Data.
II. The Role of Transportation in High-Tech Industries
Informants suggest that the disadvantages associated with a remote location in Montana are mitigated by two major factors. First, the availability of parcel deliveries acts as a great equalizer in high-tech sectors, many of which produce high value added, low-weight products that must be shipped on tight schedules regardless of firm location. Thus, although firms in Montana might pay higher parcel rates than their competitors, they can receive and ship goods just as quickly. Second, firms that ship goods by truck cite proximity to Route 93 as an advantage. One informant, whose firm is located on Route 93, notes that while tourism can affect traffic on the road, the maximum delays created by this traffic are only 15 to 20 minutes during peak season. Such a short delay, according to the informant, doesn’t really affect business. Another informant noted that while his firm is in a rather remote location in Montana, his firm does not experience trucking delays, a fact he attributes to being “only 2 ½ hours off Route 93.”
Business Impediments
Informants reported impediments to competitiveness, some of which are directly or indirectly affected by transportation. Transportation-related impediments include:
• High-tech industries do not have a large enough presence to draw suppliers or even supplier warehouses to Montana. As a result, supplies must be shipped longer distances. Although supplies usually arrive on time, the long distances result in higher transportation costs. The lack of supplier warehouses in Montana precludes buying in volume, which leads to higher per unit costs.
Montana Highway Reconfiguration Study Final Report
Cambridge Systematics, Inc. A3-58
• Low levels of economic activity in rural areas can make it difficult to find specialized trucks, which can slow deliveries, and also contributes to higher transportation costs because of “dead heading.”
• Parcel rates are probably higher because of low-density economic geography.
• Poorly maintained arterial roads increase weather-related work absences.
• Low-wage workers without access to public transportation often cannot afford reliable transportation, which is exacerbated by poor road conditions in rural areas.
Non-transportation business impediments include:
• Lack of buying power. One informant reported that the biggest impediment to growth for his firm is its lack of buying power for materials, a problem related to the size of his firm, although the firm has been able (so far) to leverage some of their customers’ buying clout. An informant in the telecommunications sector made a similar point: as the firm’s size has declined with the rest of the industry, it has had to pay a lot more for supplies. In some cases, for example, the minimum order for a part might be 1,000 units, while the firm needs only 500 units. As a result, the firm has to buy thousands of dollars in supplies that it doesn’t need.
• Difficulties in finding specialized technical and professional help, including management. These workers have to be recruited from outside of Montana, which is expensive, and they often demand the same salaries they make elsewhere. Unlike in Silicon Valley, “These people are never working across the street…specialized skills can’t be found locally.”
Cost of Transportation
Firms in computers, electronics, and medical devices spend, on average, one to two percent of total production costs on transportation-related services.17 Although informants could not specify how much they spent on transportation, most believe that because of the distances goods must travel, their costs are likely higher than competitors elsewhere.
In addition, firms believe that distance from suppliers probably puts them at a cost disadvantage vis-à-vis their competitors. This disadvantage can be traced to costs of delivering parcels to the relatively remote, low-density areas in which these firms are located, as well as direct purchasing costs in Montana relative to other sites. In major hubs
17 Based on data from the U.S. Transportation Satellite Accounts, which are generated jointly by the
U.S. Bureau of Transportation Statistics and the U.S. Bureau of Economic Analysis to assess each industry’s use of transportation services in the production process. Transportation costs for specific industries are as follows: “scientific and controlling instruments,” 1.1 percent; “computer and office equipment,” 1.0 percent; “electronic components and accessories,” 1.4 percent; and “miscellaneous electrical machinery and supplies,” 1.9 percent.

Montana Highway Reconfiguration Study Final Report
Cambridge Systematics, Inc. A3-59
like Portland, Seattle, Salt Lake City, and Denver, suppliers set up warehouses and bring in large shipments. Purchasing firms in these areas benefit from the advantages generated by these large volumes.
Transportation in the Montana’s High-Tech Industries
Computer and electronics firms report having few local suppliers, largely because of the specialized nature of the inputs they use. Supplies are often brought in by parcel. High-tech firms report that on a piece basis, 80 to 100 percent of supplies are delivered by parcel service. Informants report that distance from suppliers does not cause problems with speed or timeliness of deliveries – “overnight is overnight wherever you’re located” – and one informant noted that because of short lead times in his sector, his firm would rely on overnight deliveries wherever the company is situated. Another firm, however, did note that although on a piece basis his firm receives 80 to 90 percent of supplies by parcel, on a weight basis, freight makes up a greater portion because it is used for heavy items like steel, motors, and heavy plastics (2). 18
The reliance on parcel services in Montana makes it difficult for informants at high-tech firms to estimate whether and how highway improvements would affect transportation costs. They recognize that the economic geography of Montana likely results in higher parcel rates than in high-tech areas like Chicago, California, Seattle, or Massachusetts: as one informant noted, “FedEx and UPS drivers pick up as much freight in 10 minutes in Seattle as they do in an hour in Montana.” Informants also note, however, that while highway improvements might have a direct effect on the rates charged by smaller, local couriers, it is not clear whether or how they would affect the rates charged by the major couriers (e.g., UPS, FedEx) on which they rely.
One informant emphasized that the importance of highways for his firm lies in their role in transporting workers, not goods. This company, a contract manufacturer in electronics, has tried to stay competitive by focusing on customer service. As such, if workers have difficulty getting to the plant, it can undermine the high levels of service the firm needs to provide. Many of the roads on which the workers travel are unpaved arterial roads maintained by the county, so inclement weather can have a large effect on employee turnout. Compounding this issue is the role of wages in the company’s competitive strategy: although the company benefits from low wage rates in the area, many of its production workers (who start at minimum wage) often cannot afford reliable transportation.
18 Dependence on parcel service appears to be a common phenomenon in this and related sectors in
Montana: in 1997 (the most recent year for which data are available), 81 percent of shipments by Montana’s precision instrument firms were shipped by parcel, compared to just 48 percent nationally.

Montana Highway Reconfiguration Study Final Report
Cambridge Systematics, Inc. A3-60
Conclusion
Montana’s agglomeration of hi-tech industries is small, and with the exception of Semitool, is composed of small and scattered businesses. The “infrastructure” of parcel delivery services, such as UPS and FedEx, in part mitigates Montana’s competitive disadvantage of long distances. It appears, therefore, that roadway infrastructure in Montana will be a critical factor in the State’s success or failure to build high-tech industries from its current base.
9.0 Furniture Manufacturing
I. Global, National and State Industry Trends in the Furniture Industry
Industry Overview
Montana’s furniture industry is small, but rapidly growing. The industry accounts for about four percent of the state manufacturing base, but has gown four-fold in employment since 1990. The Montana industry employs 914 people in 84 establishments, and is dominated by producers of household and institutional furniture, which account for 75 of the establishments. This industry is composed of small businesses; the furniture industry in Montana averages 11 workers per establishment, compared to 32 employees nationally in this industry and 18 overall per manufacturing establishment in the State. Furniture manufacturers in Montana rely heavily on domestic sales and do not show a high export profile. Customers for Montana’s firms include large local and regional institutional buyers, such as schools and other public organizations; wholesalers and other middlemen; purchasers of specialized furniture used in medical and therapeutic applications; and local consumers of economy goods, like cabinets or bookshelves. Companies in the State ship product primarily on truck, and secondarily by air, and rely almost exclusively on truck for receiving supplies.
Montana’s employment grew from 226 in 1990 to 527 in 1997 and 914 in 2000, an increase of more than 300 percent for this small industry. Nationally, employment increased 25 percent over this period, though all manufacturing employment declined by 14 percent.
Wage growth in furniture establishments in Montana, however, did not keep pace with the national average. In 1990, Montana wages were 95 percent of the national rate per worker, but averaged only about 75 percent of the national rate during 1995 to 2000. Moreover, purchasing power of wages in Montana declined during the 1990s, while rising in the national industry. In part explaining low wage rates, Montana furniture establishments tend to be much smaller than the national average (see Table A3.46).
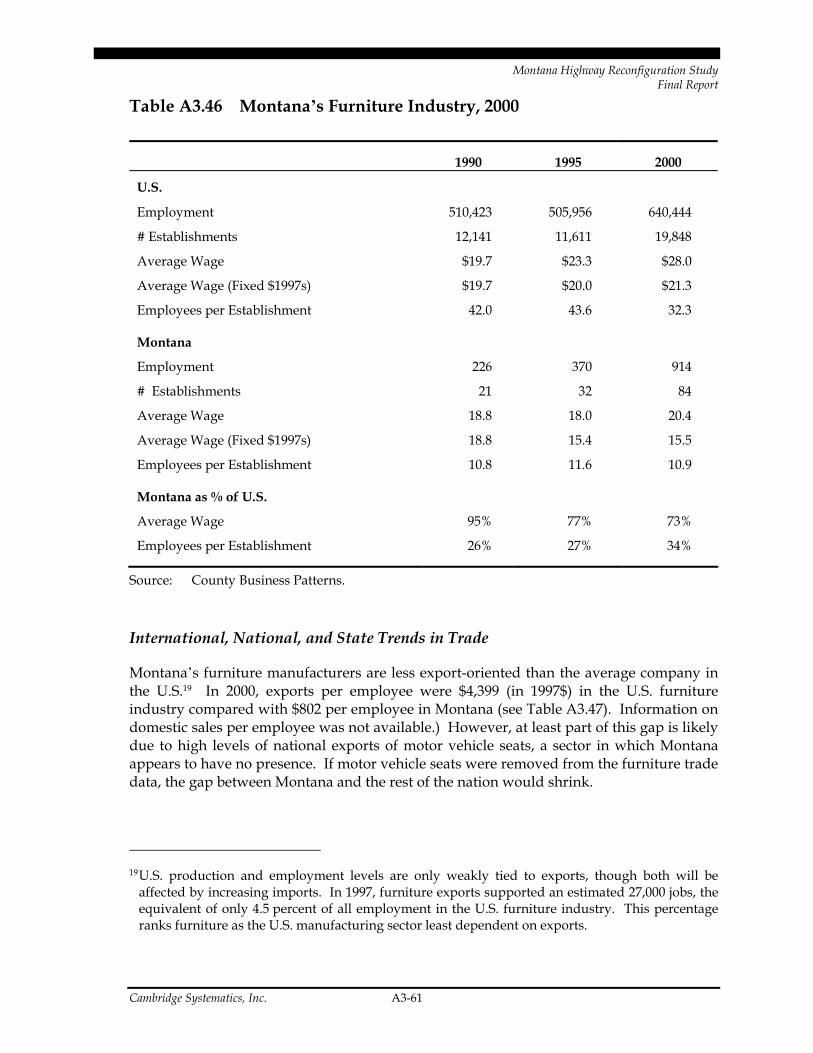
Montana Highway Reconfiguration Study Final Report
Cambridge Systematics, Inc. A3-61
Table A3.46 Montana’s Furniture Industry, 2000
1990 1995 2000
U.S.
Employment 510,423 505,956 640,444
# Establishments 12,141 11,611 19,848
Average Wage $19.7 $23.3 $28.0
Average Wage (Fixed $1997s) $19.7 $20.0 $21.3
Employees per Establishment 42.0 43.6 32.3
Montana
Employment 226 370 914
# Establishments 21 32 84
Average Wage 18.8 18.0 20.4
Average Wage (Fixed $1997s) 18.8 15.4 15.5
Employees per Establishment 10.8 11.6 10.9
Montana as % of U.S.
Average Wage 95% 77% 73%
Employees per Establishment 26% 27% 34%
Source: County Business Patterns.
International, National, and State Trends in Trade
Montana’s furniture manufacturers are less export-oriented than the average company in the U.S.19 In 2000, exports per employee were $4,399 (in 1997$) in the U.S. furniture industry compared with $802 per employee in Montana (see Table A3.47). Information on domestic sales per employee was not available.) However, at least part of this gap is likely due to high levels of national exports of motor vehicle seats, a sector in which Montana appears to have no presence. If motor vehicle seats were removed from the furniture trade data, the gap between Montana and the rest of the nation would shrink.
19 U.S. production and employment levels are only weakly tied to exports, though both will be
affected by increasing imports. In 1997, furniture exports supported an estimated 27,000 jobs, the equivalent of only 4.5 percent of all employment in the U.S. furniture industry. This percentage ranks furniture as the U.S. manufacturing sector least dependent on exports.
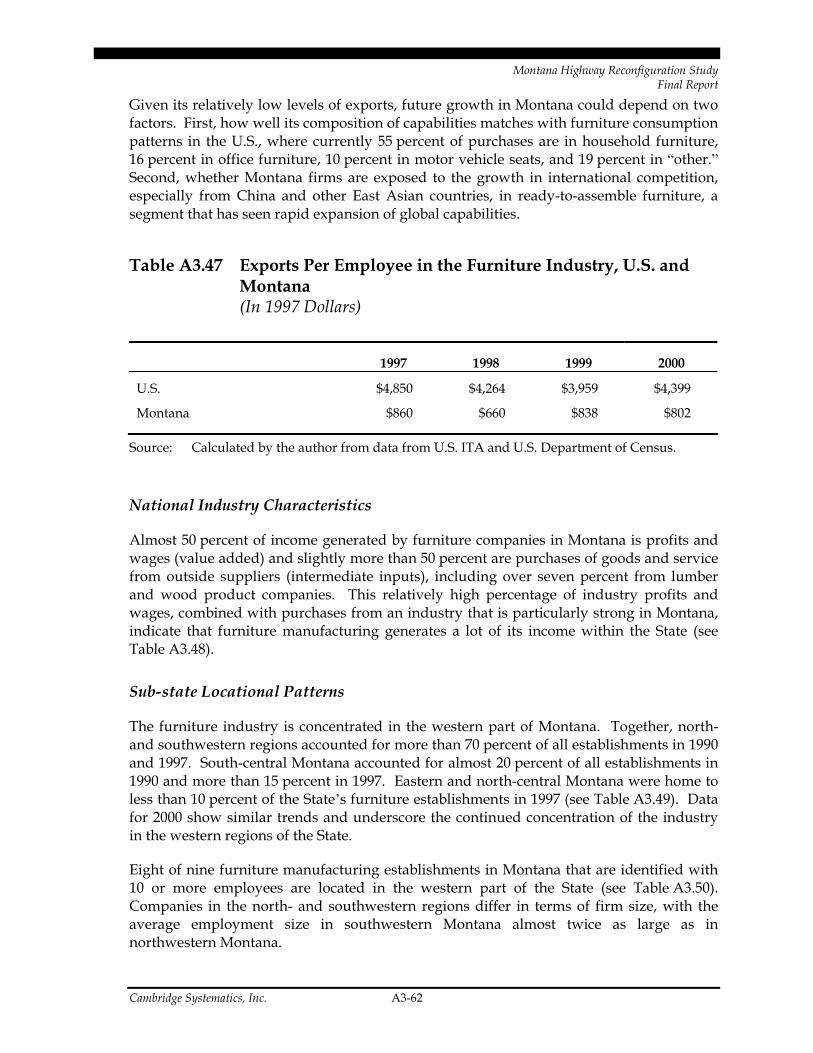
Montana Highway Reconfiguration Study Final Report
Cambridge Systematics, Inc. A3-62
Given its relatively low levels of exports, future growth in Montana could depend on two factors. First, how well its composition of capabilities matches with furniture consumption patterns in the U.S., where currently 55 percent of purchases are in household furniture, 16 percent in office furniture, 10 percent in motor vehicle seats, and 19 percent in “other.” Second, whether Montana firms are exposed to the growth in international competition, especially from China and other East Asian countries, in ready-to-assemble furniture, a segment that has seen rapid expansion of global capabilities.
Table A3.47 Exports Per Employee in the Furniture Industry, U.S. and Montana (In 1997 Dollars)
1997 1998 1999 2000
U.S. $4,850 $4,264 $3,959 $4,399
Montana $860 $660 $838 $802
Source: Calculated by the author from data from U.S. ITA and U.S. Department of Census.
National Industry Characteristics
Almost 50 percent of income generated by furniture companies in Montana is profits and wages (value added) and slightly more than 50 percent are purchases of goods and service from outside suppliers (intermediate inputs), including over seven percent from lumber and wood product companies. This relatively high percentage of industry profits and wages, combined with purchases from an industry that is particularly strong in Montana, indicate that furniture manufacturing generates a lot of its income within the State (see Table A3.48).
Sub-state Locational Patterns
The furniture industry is concentrated in the western part of Montana. Together, north- and southwestern regions accounted for more than 70 percent of all establishments in 1990 and 1997. South-central Montana accounted for almost 20 percent of all establishments in 1990 and more than 15 percent in 1997. Eastern and north-central Montana were home to less than 10 percent of the State’s furniture establishments in 1997 (see Table A3.49). Data for 2000 show similar trends and underscore the continued concentration of the industry in the western regions of the State.
Eight of nine furniture manufacturing establishments in Montana that are identified with 10 or more employees are located in the western part of the State (see Table A3.50). Companies in the north- and southwestern regions differ in terms of firm size, with the average employment size in southwestern Montana almost twice as large as in northwestern Montana.

Montana Highway Reconfiguration Study Final Report
Cambridge Systematics, Inc. A3-63
Table A3.48 Purchasing Patterns in Furniture and Fixtures Industry, 1998 (Value in $ Millions)
Value % of
Value
T Total Industry Output $65,889
VA Value added 31,888 48.4% I Total intermediate inputs 34,001 51.6% Key Purchases by Commodity 20+21 Lumber and wood products $4,845 7.4% 69A Wholesale trade 4,259 6.5% 42 Other fabricated metal products 3,203 4.9% 16 Broad and narrow fabrics, yarn and thread mills 2,843 4.3% 32 Rubber and miscellaneous plastics products 2,539 3.9% 37 Primary iron and steel manufacturing 2,308 3.5% 17 Miscellaneous textile goods and floor coverings 2,003 3.0% 73C Other business and professional services, except
medical 1,295 2.0%
65B Motor freight transportation and warehousing 915 1.4% 25 Paperboard containers and boxes 885 1.3% 41 Screw machine products and stampings 836 1.3% 38 Primary nonferrous metals manufacturing 682 1.0% 71B Real estate and royalties 671 1.0% 73D Advertising 665 1.0%
Source: U.S. Bureau of Economic Analysis, I-O accounts.
Table A3.49 Montana’s Furniture Establishments by Region
Northwest Southwest North-Central
South-Central East
1990 52% 19% 10% 19% na 1997 44% 29% 7% 16% 4% 2000 50% 30% 13% 7% 0% Average, 1990-1997
45% 29% 10% 13% 6%
Source: County Business Patterns.
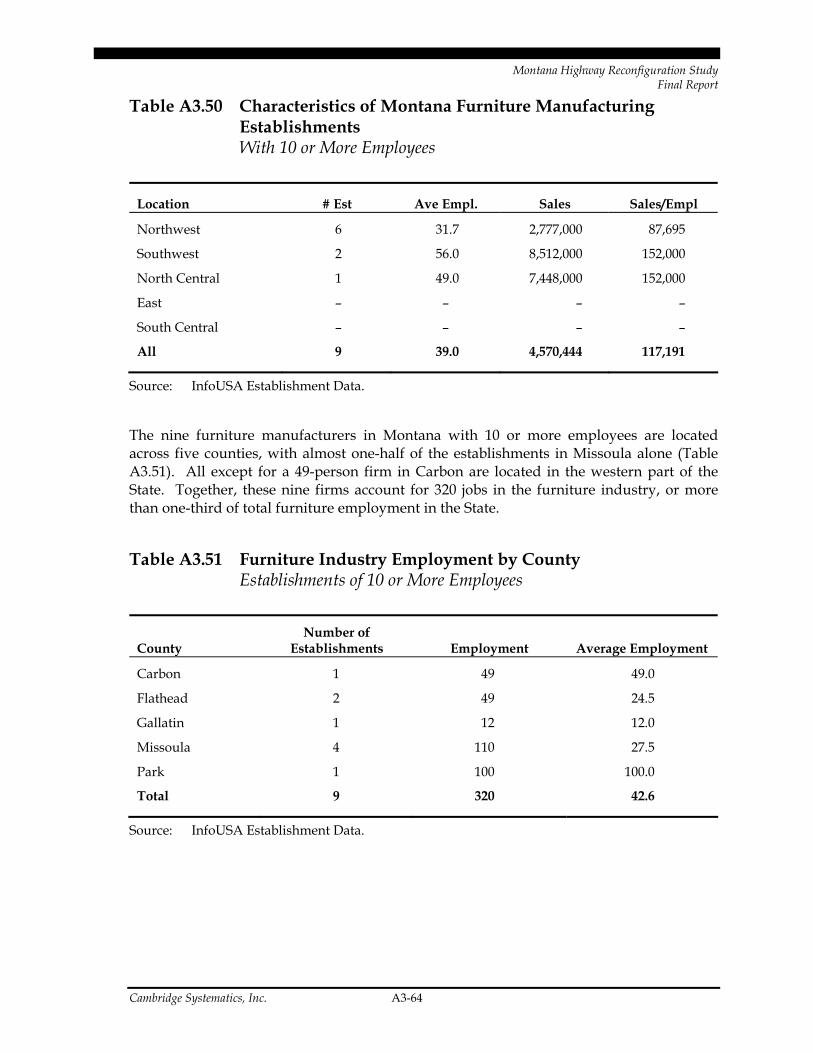
Montana Highway Reconfiguration Study Final Report
Cambridge Systematics, Inc. A3-64
Table A3.50 Characteristics of Montana Furniture Manufacturing Establishments With 10 or More Employees
Location # Est Ave Empl. Sales Sales/Empl
Northwest 6 31.7 2,777,000 87,695
Southwest 2 56.0 8,512,000 152,000
North Central 1 49.0 7,448,000 152,000
East – – – –
South Central – – – –
All 9 39.0 4,570,444 117,191
Source: InfoUSA Establishment Data.
The nine furniture manufacturers in Montana with 10 or more employees are located across five counties, with almost one-half of the establishments in Missoula alone (Table A3.51). All except for a 49-person firm in Carbon are located in the western part of the State. Together, these nine firms account for 320 jobs in the furniture industry, or more than one-third of total furniture employment in the State.
Table A3.51 Furniture Industry Employment by County Establishments of 10 or More Employees
County Number of
Establishments Employment Average Employment
Carbon 1 49 49.0
Flathead 2 49 24.5
Gallatin 1 12 12.0
Missoula 4 110 27.5
Park 1 100 100.0
Total 9 320 42.6
Source: InfoUSA Establishment Data.

Montana Highway Reconfiguration Study Final Report
Cambridge Systematics, Inc. A3-65
II. The Role of Transportation in Industry Performance in the Furniture Industry
Furniture manufacturers interviewed exhibit a broad range of customer bases – in some cases, all sales are to local consumers through small retail shops scattered throughout Montana; in others, producers report selling no products within the State and relying instead on sales throughout the U.S. and in some cases, the world. With the exception of some wood products, many of the supplies used in furniture production are reported to come from outside Montana, sometimes as far away as China and Taiwan. Informants reported other transportation- and non-transportation related impediments to firm growth. Issues related to transportation include:
• Service and quality of LTL carriers. One informant reported that goods are often damaged by these “less-than-truckload” carriers and that quality and service tends to be low. Another suggested that packaging requirements of outside trucking firms precludes outsourcing shipping of low-cost products.
• Traffic around state and national park areas can be congested. This raised concerns about the safety of truckers and visitors driving in these areas.
• Lack of direct rail service makes exporting overseas costly, as it generally requires three transportation modes: truck, rail, and ship. Greater availability of rail would allow firms to load cargo containers near their plants, thus obviating the need for trucking.
One informant suggested that Federal government regulations impede good construction. For one local project, the widening of an 11-mile road, Federal regulations required that the old road be ripped up before a new one could be installed. The informant believes that the widening could have been achieved without ripping up the old road and that the costs would have been much lower.
Issues not related to transportation include:
• The rise of large retailers, like Costco, has hurt small local retailers and the firms that traditionally serve them.
• Availability of workers, due to out-migration; changing values among the young; and different demands by the high-tech industry.
• Growth in demand for ready-to-assemble furniture and the rise of imports from China.
Labor markets were cited as both a large competitive advantage and a large disadvantage: some firms report that low wages and low turnover have improved their companies’ competition position; others lament the difficulty of finding specific types of workers and fear that labor shortages could eventually threaten the existence of their firms.
Montana Highway Reconfiguration Study Final Report
Cambridge Systematics, Inc. A3-66
Cost of Transportation
According to the Transportation Satellite Accounts, U.S. furniture companies pay an average of 4.8 percent of their total production costs for transportation services.20 Some informants could not estimate transportation costs, but two that could estimate that costs were seven and 10 percent. All informants believed that their transportation costs were higher than their out-of-state competitors, because of the long distances that supplies and final goods had to travel.
Firms cited high transportation costs as a difficulty of operating in Montana, but noted that these costs are a function of geographical distance from suppliers and customers and not of poor quality or availability of highways. Mention was made, however, of the danger posed to truckers and other drivers by the congestion near state and national park areas. Another transportation impediment reported was the quality of service provided by LTL carriers (though satisfaction was generally reported regarding local contract carriers). Though LTL shipments might be most advantageous, a lack of confidence in the service may lead companies to ship product by more expensive modes.
Transportation in the Furniture Manufacturing Industry
Our interviews establish that supplies for the furniture industry, which include wood products, hardware, and various materials (e.g., vinyl) for companies (primarily logs) arrive by truck. Some of these goods are carried on suppliers’ trucks; some by LTL (less-than-truckload) carriers; some by parcel service (e.g., UPS, FedEx); and other by local contract carriers. The heavy reliance on trucks is due to the nature of the supplies – some, like wood products, are large and bulky; others, like some hardware, is small enough to ship by parcel – and cost considerations. Companies report only minor problems with transportation of in-coming goods.
For outgoing products, primarily truck, but also air was reported as being used. The absence of rail transport can be explained by a range of factors – in one case, an informant at a producer of specialty medical tables reported that rail was the preferred transport mode, especially for exports. His company had access to rail in the past, but the station was closed. Without direct access to rail or water, the company has to go through an extra step rather than ship directly overseas by loading containers onto rail, a process that raises transportation costs on exports to two to three times what their competitors in California pay. In other cases, informants report that cost and speed advantages – especially with large, bulky items common in the furniture sector – make truck the preferred method. One firm sends about 25 percent of its products by air. In this case, air is used to send larger products (small products are sent by FedEx ground), which costs “about $500 a pop,” but ensures that goods get to their destination intact.
20 Based on data from the U.S. Transportation Satellite Accounts, which are generated jointly by the
U.S. Bureau of Transportation Statistics and the U.S. Bureau of Economic Analysis to assess each industry’s use of transportation services in the production process.
Montana Highway Reconfiguration Study Final Report
Cambridge Systematics, Inc. A3-67
Some firms reported outsourcing trucking functions to a variety of carriers. Other firms, though, keep trucking functions in-house. One of these firms is a specialty producer of cabinet products for large, often public installations, such as stadiums, schools, and court houses. Most of their work is outside Montana, concentrated in urban areas in Colorado. This informant cited a number of reasons for keeping trucking in-house. First, as a small firm ($5 million to $6 million in annual sales), the company is not so large that a small percentage savings on transportation would generate significant cost savings. According to this informant, “saving two percent on millions [in transport costs]” results in large savings, but for this firm, transport costs are not a “big deal.” Second, keeping trucking in-house improves reliability and service: if a project required it, the firm could be unloading a truck in Denver tomorrow morning. Third, outsourcing would mean greater reliance on LTL carriers and as noted above, concerns were voiced about the service and quality provided by these carriers.
In general, informants did not attribute high transportation costs to highway conditions or availability. Rather, all attributed high transportation costs to the long distances that supplies and final goods have to travel. In one case, in fact, an informant suggested that improvements in highway infrastructure had hurt his firm’s business by making large retailers, like Costco, accessible to greater portions of the Montana population, which has decimated the small retail stores his company has historically served. One informant at a firm with a national customer base said that his firm is in the process of setting up mini-warehouses across the U.S. in order to reduce transportation costs. Such warehouses, he suggested, will allow his firm to re-distribute products from central warehouses, thus alleviating the need to ship every order from Montana, which will bring down delivery costs. One informant did suggest that access to rails would improve his company’s position, especially in export markets, by allowing the firm to load containers in Montana and shipping these to port by rail.
Conclusion
Taken together, state, national, and international trends paint a picture of an industry increasingly threatened at the low-end by rising imports, advances in ready-to-assemble furniture, and the reconfiguring of the retail sector towards large chains that sell these types of products. These trends suggest that production-related costs, especially labor and transportation costs, which are nationwide are high relative to other manufacturing sectors, will become increasingly important vectors of competition. While firms in Montana report that their geographic position (rather than quality or availability of highways) creates high transportation costs, geographic isolation has also slowed the influx of the large retailers that challenge small, local producers. Together, these factors suggest that improvement in highway infrastructure could have two distinct effects: while it would improve the competitive position of high-end firms that export, it might also further undermine small, low-end producers that currently serve local, usually rural, markets.
Montana Highway Reconfiguration Study Final Report
Cambridge Systematics, Inc. A3-68
10.0 Primary Metals Products
Overview
The primary metal manufacturing industry is engaged in smelting and/or refining ferrous and nonferrous metals from ore and scrap, using electrometallurgical processes and other techniques. Establishments in this sector also manufacture metal alloys by introducing other chemical elements to pure metals. The output of smelting and refining, usually in ingot form, is used in rolling, drawing, and extruding operations to make sheet, strip, bar, rod, or wire, and in molten form to make castings and other basic metal products. This sector excludes establishments primarily engaged in metal forging and stamping, which are classified as fabricated metal product manufacturing.
The primary metal manufacturing industry is relatively small in Montana, employing approximately 1,000 people and accounting for 0.42 percent of the State’s economy. The industry is dominated by a handful of large companies, including the Columbia Falls Aluminum Company, located in Flathead County, and Asarco, which operates lead smelting in East Helena. Throughout the 1990s, industry output remained fairly constant, and employment rose slightly. In the last two years, however, high electricity rates and a slump in prices for primary metal products have forced closure or curtailment at several large Montana plants. The future of the industry in the State depends heavily on these two factors.
National Trends
Nationally, output value in the primary metal manufacturing industry grew 31 percent between 1990 and 2000 in real terms. As a share of the nation’s total economy, the industry fell from 0.66 percent to 0.62 percent during that period. Employment in U.S. primary metal manufacturing decreased by 16.7 percent during the 1990s as the industry became more productive and capital intensive. Table A3.52 shows trends in the number of establishments and employees in the industry for the U.S. and Montana.
Aluminum is the most important component of Montana’s primary metals manufacturing industry. The global market for aluminum has been growing at a 2.9 percent annual rate over the last decade. However, production capacity increases in Europe, Russia, and China are adding to the excess production capacity that already exists in the industry, putting downward pressure on prices.

Montana Highway Reconfiguration Study Final Report
Cambridge Systematics, Inc. A3-69
Table A3.52 Montana and U.S. Primary Metal Manufacturing Industry Summary
U.S. Montana
1992 1999 1992 1999
Employment 664,576 597,623 1,114 1,245
Annual Payroll (000) $22,321,850 $24,765,637 $40,959 $56,026
Number of Establishments 6,818 5,900 13 22
Average Wage $33,588 $41,440 $36,768 $45,001
Employees Per Establishment 97 101 86 57
Source: County Business Patterns. Note that 2000 data are not shown because they present only a range for Montana employment.
Montana Trends
Employment in Montana’s primary metal manufacturing industry remained fairly constant over the last decade, although market forces have recently forced closure or curtailment at the State’s two largest operations. Meanwhile, the number of firms has doubled, indicating a smaller average firm size. As of 1999 (the most recent year with data available), employment in the industry was 1,245, up 12 percent from 1992. Current state employment is estimated to be in the range of 900 to 1,000. Wages in the industry remain about nine percent higher than the national average (see Table A3.52).
Figure A3.5 shows output from Montana’s primary metal manufacturing industry. With the exception of a spike in 1998 (possibly due to rapid price fluctuations), output has remained fairly constant. Primary metals manufacturing accounts for 0.42 percent of Montana’s economy. As at the national level, this share has been falling in recent years.
Montana’s primary metal manufacturing industry is concentrated in a small number of firms. While the State is home to 26 establishments and approximately 1,200 employees, more than 875 employees are concentrated in the two largest companies. The Columbia Falls Aluminum Company is the largest employer in the industry, with approximately 600 workers when operating at full capacity. Asarco (lead smelting) is the second largest employer with 275 employees. A variety of smaller firms make up the remainder of the State’s industry, including bronze foundries, steel foundries, and a number of art casting firms. Columbia Falls Aluminum, Asarco, and the art casting industry segment are discussed in greater detail below.
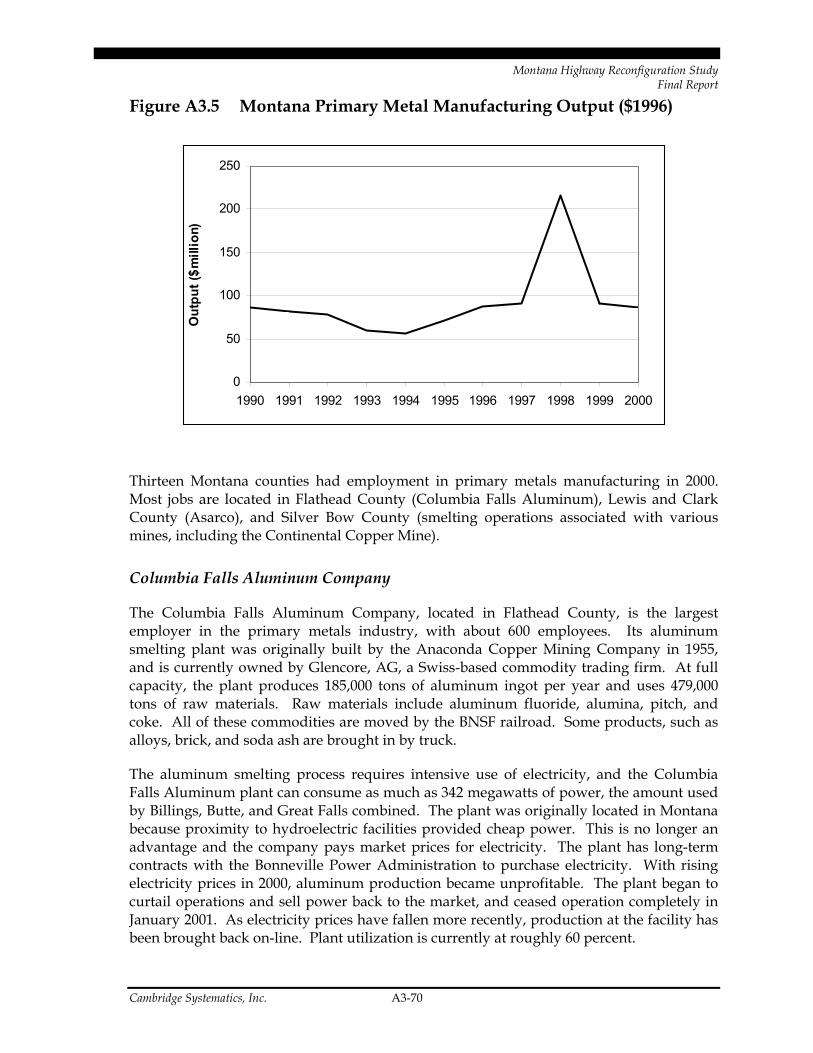
Montana Highway Reconfiguration Study Final Report
Cambridge Systematics, Inc. A3-70
Figure A3.5 Montana Primary Metal Manufacturing Output ($1996)
0
50
100
150
200
250
1990 1991 1992 1993 1994 1995 1996 1997 1998 1999 2000
Out
put (
$mill
ion)
Thirteen Montana counties had employment in primary metals manufacturing in 2000. Most jobs are located in Flathead County (Columbia Falls Aluminum), Lewis and Clark County (Asarco), and Silver Bow County (smelting operations associated with various mines, including the Continental Copper Mine).
Columbia Falls Aluminum Company
The Columbia Falls Aluminum Company, located in Flathead County, is the largest employer in the primary metals industry, with about 600 employees. Its aluminum smelting plant was originally built by the Anaconda Copper Mining Company in 1955, and is currently owned by Glencore, AG, a Swiss-based commodity trading firm. At full capacity, the plant produces 185,000 tons of aluminum ingot per year and uses 479,000 tons of raw materials. Raw materials include aluminum fluoride, alumina, pitch, and coke. All of these commodities are moved by the BNSF railroad. Some products, such as alloys, brick, and soda ash are brought in by truck.
The aluminum smelting process requires intensive use of electricity, and the Columbia Falls Aluminum plant can consume as much as 342 megawatts of power, the amount used by Billings, Butte, and Great Falls combined. The plant was originally located in Montana because proximity to hydroelectric facilities provided cheap power. This is no longer an advantage and the company pays market prices for electricity. The plant has long-term contracts with the Bonneville Power Administration to purchase electricity. With rising electricity prices in 2000, aluminum production became unprofitable. The plant began to curtail operations and sell power back to the market, and ceased operation completely in January 2001. As electricity prices have fallen more recently, production at the facility has been brought back on-line. Plant utilization is currently at roughly 60 percent.

Montana Highway Reconfiguration Study Final Report
Cambridge Systematics, Inc. A3-71
Asarco
Asarco was organized in 1899 as American Smelting and Refining Company. Originally a consolidation of a number of lead-silver smelting companies, the company has evolved over the years into an integrated producer of copper as well as a producer of other metals. Asarco now operates as a wholly-owned subsidiary of Grupo Mexico’s Americas Mining Corporation.
Asarco has two operations in Montana. One is a lead smelting operation in East Helena whose operations were suspended in April 2001. When operational, the East Helena smelter employed 275 full-time employees, a significant fraction of the primary metals manufacturing employment in the State. In conjunction with Montana Resources, Asarco also operates the Continental open pit copper mine in Butte, although this facility suspended operations in July 2000.
A number of factors have made it difficult to profitably operate smelters in Montana recently, including rising electricity prices, sluggish demand and over-supply in world markets, and environmental regulations that are more stringent than those faced by overseas competitors. Future industry growth will require a recovery of the global economy and world demand for smelted metals.
Art Casting
There are 15 art casting firms in Montana. These small businesses account for over one-half of the establishments in the State’s primary metals industry. Art casting firms produce metal sculptures from artist renderings. Typically, artists send items they want caste in bronze or some other metal. From these, molds are created into which molten metal is poured and caste into statues or other forms. Location in Montana is advantageous for these types of firms because of the State’s low labor costs.
Purchasing Patterns
Table A3.53 shows purchasing patterns in the non-ferrous metal manufacturing industry segment, the primary metals industry segment that is most representative of those in Montana. The data indicate the percentage of industry output made up of intermediate inputs purchased from other industries, and the percent of output made up of value added. The data show that non-ferrous metal manufacturing has a relatively small value added component of 31 percent of output.
Table A3.53 also shows the percent of output comprising purchases of transportation from outside firms in rail and motor freight transportation. The non-ferrous metal manufacturing industry spends about 2.95 percent of output on outsourced motor freight transportation and warehousing and about 0.75 percent of output on rail service. The Transportation Satellite Accounts provide a more accurate measure of each industry’s use of trucking services, since they include the value of the service provided by in-house private fleets. This data shows that when in-house transportation services are included,
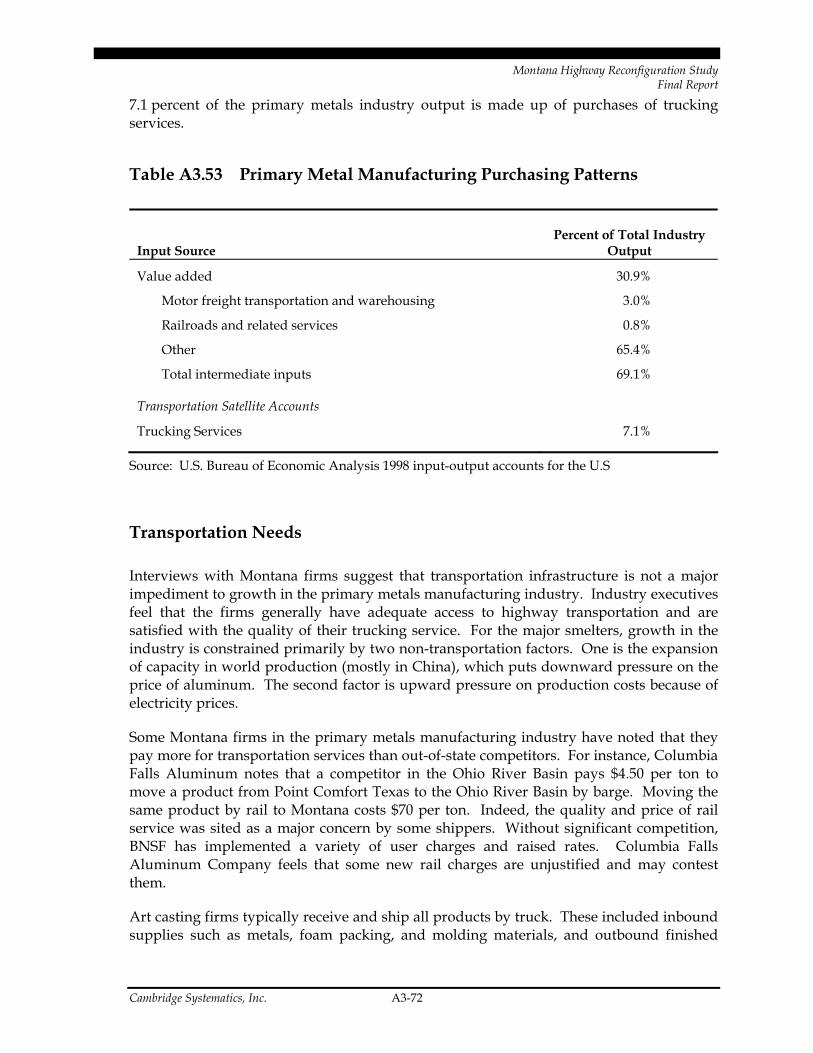
Montana Highway Reconfiguration Study Final Report
Cambridge Systematics, Inc. A3-72
7.1 percent of the primary metals industry output is made up of purchases of trucking services.
Table A3.53 Primary Metal Manufacturing Purchasing Patterns
Input Source Percent of Total Industry
Output
Value added 30.9%
Motor freight transportation and warehousing 3.0%
Railroads and related services 0.8%
Other 65.4%
Total intermediate inputs 69.1%
Transportation Satellite Accounts
Trucking Services 7.1%
Source: U.S. Bureau of Economic Analysis 1998 input-output accounts for the U.S
Transportation Needs
Interviews with Montana firms suggest that transportation infrastructure is not a major impediment to growth in the primary metals manufacturing industry. Industry executives feel that the firms generally have adequate access to highway transportation and are satisfied with the quality of their trucking service. For the major smelters, growth in the industry is constrained primarily by two non-transportation factors. One is the expansion of capacity in world production (mostly in China), which puts downward pressure on the price of aluminum. The second factor is upward pressure on production costs because of electricity prices.
Some Montana firms in the primary metals manufacturing industry have noted that they pay more for transportation services than out-of-state competitors. For instance, Columbia Falls Aluminum notes that a competitor in the Ohio River Basin pays $4.50 per ton to move a product from Point Comfort Texas to the Ohio River Basin by barge. Moving the same product by rail to Montana costs $70 per ton. Indeed, the quality and price of rail service was sited as a major concern by some shippers. Without significant competition, BNSF has implemented a variety of user charges and raised rates. Columbia Falls Aluminum Company feels that some new rail charges are unjustified and may contest them.
Art casting firms typically receive and ship all products by truck. These included inbound supplies such as metals, foam packing, and molding materials, and outbound finished

Montana Highway Reconfiguration Study Final Report
Cambridge Systematics, Inc. A3-73
statues shipped to galleries around the world. These firms often ship by parcel delivery such as UPS. One firm noted that UPS allows them to ship or receive products anywhere within two days, which is adequate for their needs. Although none of their shipments have ever been late, they maintain buffers of critical supplies as an insurance policy.
Interviews with these smaller firms suggest that they are pleased with their transportation service, and do not see transportation infrastructure as an impediment to growth. The biggest limitation on growth in the art casting business is the overall health of the economy, which determines the demand for art.
11.0 Farming (Livestock and Grain)
Overview
Agriculture is Montana’s largest industry, generating over $2 billion annually and supporting more than 32,000 jobs in the State. Only Texas has more land devoted to farms and ranches. Livestock and wheat are the State’s principal products, accounting for over three-quarters of Montana agricultural cash receipts. Other significant products include barley, hay, sugar beets, and dairy products. Outgoing shipments of livestock are transported exclusively by truck. Grain tends to be shipped via rail, but typically requires road transport to railheads. The bulk of Montana wheat goes to the western U.S., principally to Pacific Northwest ports for export.
Given the growth forecast for wheat and livestock, the agriculture outlook for the State is strong. Montana has embarked on a program to substantially increase income from its agricultural sector, including focusing on higher value products such as beef, for which domestic and international demand is expected to increase. The road transportation network is critical in supporting the operation of the industry, particularly in the movement of livestock.
National and Global Trends
The U.S. agricultural sector currently generates $79 billion in gross domestic product and supports more than 3 million jobs. The sector has experienced increasing output and declining employment for many years. Since 1990, agriculture output value has grown at an annual rate of three percent in real terms, while the number of farm jobs has declined by more than 40,000. More than 688,000 U.S. farm jobs have been lost since 1980. As shown in Figure A3.6, the gains in agricultural output have occurred as the level of inputs has declined. The resulting rise in productivity has been one of the most important developments in farming during the second half of the twentieth century. New technologies have accelerated the mechanization of the industry and reduced demand for farm labor.

Montana Highway Reconfiguration Study Final Report
Cambridge Systematics, Inc. A3-74
Figure A3.6 U.S. Agricultural Productivity Index, 1980-1996 (1987 = 1)
0.7
0.8
0.9
1
1.1
1.2
1.3
1980
1981
1982
1983
1984
1985
1986
1987
1988
1989
1990
1991
1992
1993
1994
1995
1996
OUTPUTINPUTPRODUCTIVITY
Source: U.S. Department of Agriculture.
In terms of the global market, the export value and market cash receipts to U.S. farmers have improved since the late 1990s when large global production and weak global demand depressed prices and trade.
According to a recent report by the USDA, the long-term outlook for U.S. agriculture is promising (3). For the period 2002 to 2011, strengthened domestic and international growth is expected to result in gains in trade and U.S. agricultural exports, rising market prices, elevated farm income, and improved financial conditions for the U.S. agricultural sector.
National Crops Trends
Wheat output value and production is closely linked with wheat prices. The wheat market has experienced volatility over the last two decades. After falling to a low of $2.48 per bushel in 1999, a reduction in global stocks has led to a partial recovery of wheat prices. National wheat production in 2001 was 1.96 million bushels, significantly lower than the 1990 peak of 2.7 million bushels.
In the future, economic growth is expected to support increases in consumption, trade, and exports for most U.S. field crops, though gains in exports are constrained by a strong U.S. dollar and continued strong trade competition. The domestic market is the main source of demand for most major field crops, but the export market is projected to increase for several commodities, including wheat and sorghum.
The U.S. wheat production is expected to rise during the period 2002 to 2011. The key growth markets for global wheat imports are China, Pakistan, Brazil, North Africa, and the Middle East. The U.S. will face steady competition from Australia, Canada, and the EU, with competition expected to increase from Eastern Europe, Ukraine, and Russia.

Montana Highway Reconfiguration Study Final Report
Cambridge Systematics, Inc. A3-75
Continued competition is forecast to hold the U.S. share of global wheat trade below the levels of the late 1990s.
National Livestock Trends
After considerable growth during the post-WWII period, U.S. livestock production (cattle, broilers, hogs, and turkeys) has remained relatively constant since 1970. In contrast, the dairy industry has achieved production gains in recent decades, with 1999 milk production 39 percent higher than 1970 levels, and annual average production per cow increasing 82 percent for the same period.
In the future, domestic increases in demand and in meat exports are expected to encourage higher total red meat and poultry production, with poultry production growing more rapidly than cattle. Trends toward larger and more commercialized livestock and dairy systems are expected to continue throughout the period.
Beef production is forecast to continue shifting toward a larger proportion of higher quality fed beef and a higher graded product being directed toward the export and domestic hotel-restaurant markets. The U.S. is forecast to become a net exporter towards the end this decade, with beef exports rising from about eight percent of all production to 10 percent. High-quality beef exports are projected to continue to increase through the period, primarily to Pacific Rim nations. As strong demand for higher quality beef continues, vertical alliances are expected to increase in the beef sector.
State Agriculture Trends
Agriculture is Montana’s largest industry, generating more than $2 billion annually for the last five years, as shown in Table A3.54. Direct government payments to the sector have been substantial and increasing over the period.
Table A3.54 Agriculture Output
1996 1997 1998 1999 2000
Final Agriculture Sector Output $2,187 $2,274 $2,044 $2,100 $1,967
Net Government Transactions $108 $95 $223 $362 $336
Total $2,295 $2,368 $2,267 $2,462 $2,303
Source: Montana Agricultural Statistics Service.
There are 28,000 farms and ranches in Montana, accounting for 63 percent of the State’s land. As shown in Table A3.55, farming employment in the State increased 6.3 percent during the 1990s, although personal income fell 5.2 percent. Farming as a percent of total employment has also fallen, from 7.5 percent in 1990 to 6.1 percent in 2000.
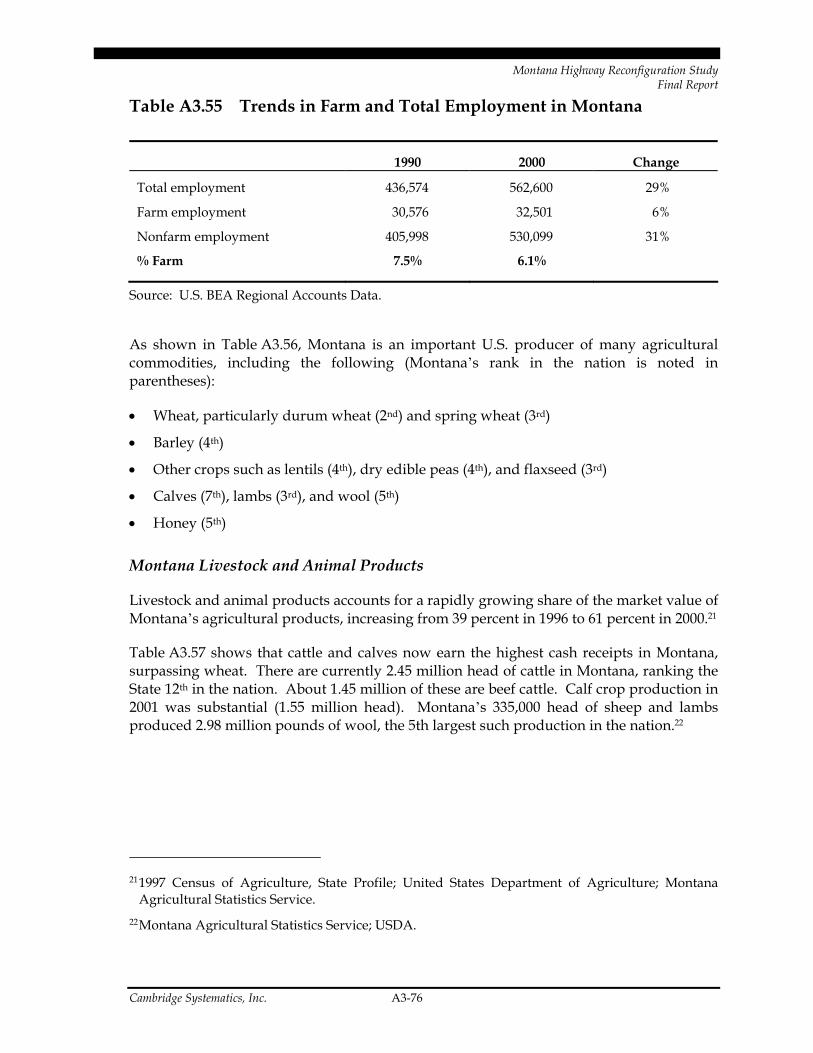
Montana Highway Reconfiguration Study Final Report
Cambridge Systematics, Inc. A3-76
Table A3.55 Trends in Farm and Total Employment in Montana
1990 2000 Change
Total employment 436,574 562,600 29%
Farm employment 30,576 32,501 6%
Nonfarm employment 405,998 530,099 31%
% Farm 7.5% 6.1%
Source: U.S. BEA Regional Accounts Data.
As shown in Table A3.56, Montana is an important U.S. producer of many agricultural commodities, including the following (Montana’s rank in the nation is noted in parentheses):
• Wheat, particularly durum wheat (2nd) and spring wheat (3rd)
• Barley (4th)
• Other crops such as lentils (4th), dry edible peas (4th), and flaxseed (3rd)
• Calves (7th), lambs (3rd), and wool (5th)
• Honey (5th)
Montana Livestock and Animal Products
Livestock and animal products accounts for a rapidly growing share of the market value of Montana’s agricultural products, increasing from 39 percent in 1996 to 61 percent in 2000.21
Table A3.57 shows that cattle and calves now earn the highest cash receipts in Montana, surpassing wheat. There are currently 2.45 million head of cattle in Montana, ranking the State 12th in the nation. About 1.45 million of these are beef cattle. Calf crop production in 2001 was substantial (1.55 million head). Montana’s 335,000 head of sheep and lambs produced 2.98 million pounds of wool, the 5th largest such production in the nation.22
21 1997 Census of Agriculture, State Profile; United States Department of Agriculture; Montana
Agricultural Statistics Service. 22 Montana Agricultural Statistics Service; USDA.

Montana Highway Reconfiguration Study Final Report
Cambridge Systematics, Inc. A3-77
Table A3.56 Montana’s Rank in the Nation’s Agriculture (2001)
Number Unit Rank % U.S. Total Land in farms and ranches 56,500,000 Acres 2 6% Number of farms and ranches 26,600 Farms/ranches 31 1%
Income from cash receipts, excluding government payments
Total 1,806 Million dollars 34 1% Crops 704 Million dollars 33 1% Livestock 1,102 Million dollars 29 1%
Livestock Inventory All Cattle & Calves 2,450,000 Head 12 3% All Cows 1,470,000 Head 9 4% Beef Cows 1,451,000 Head 7 4% Milk Cows 19,000 Head 42 0% Cattle on Feed 70,000 Head 21 1% Sheep and Lambs 335,000 Head 7 5% Hogs and Pigs 170,000 Head 26 0% Chickens 480,000 Birds 40 0%
Livestock Production Calf Crop 1,550,000 Head 7 4% Lamb Crop 340,000 Head 3 8% Pig Crop 341,000 Head 26 0% Wool Production 2,978,000 Pounds 5 7% Egg Production 95,000,000 Eggs 40 0% Honey Production 13,872,000 Pounds 5 8%
Crop Production All Wheat 96,570,000 Bushels 6 5% Winter Wheat 19,140,000 Bushels 17 1% Durum Wheat 11,880,000 Bushels 2 14% Spring Wheat other than Durum 65,550,000 Bushels 3 13% Barley 29,520,000 Bushels 3 12% Oats 2,400,000 Bushels 13 2% All Hay 4,445,000 Tons 15 3% Alfalfa Hay 3,045,000 Tons 12 4% Dry Beans 332,000 CWT 11 2% Pinto Beans 200,000 CWT 8 2% Garbanzo Beans 127,000 CWT 6 8% Lentils 220,000 CWT 4 8% Dry Edible Peas 294,000 CWT 4 8% Potatoes (fall) 3,040,000 CWT 13 1% Sugar Beets 1,150,000 Tons 6 5% Flaxseed 180,000 Bushels 3 2%
Source: Montana Agricultural Statistics Service.

Montana Highway Reconfiguration Study Final Report
Cambridge Systematics, Inc. A3-78
Table A3.57 Cash Receipts from Marketings by Commodities, Montana, 1996-2000
1996 2000 Value (1000) % of Total Value (1000) % of Total
Livestock and Products Cattle and calves $655,770 32.1% $966,017 53.5% Dairy products $44,688 2.2% $38,656 2.1% Sheep and lambs $28,797 1.4% $24,244 1.3% Wool $3,727 0.2% $1,227 0.1% Hogs and pigs $37,900 1.9% $30,527 1.7% Eggs $5,940 0.3% $3,220 0.2% Honey $6,178 0.3% $7,510 0.4% All other livestock $15,138 0.7% $30,655 1.7% Subtotal $798,138 39.1% $1,102,056 61.0%
Crops Wheat $847,134 41.5% $410,313 22.7% Barley $147,532 7.2% $92,228 5.1% Sugar beets $62,530 3.1% $53,368 3.0% Hay $100,234 4.9% $72,795 4.0% Potatoes $24,571 1.2% $15,035 0.8% Oil crops $7,457 0.4% $12,433 0.7% Oats $3,966 0.2% $1,631 0.1% Dry beans $4,283 0.2% $8,601 0.5% Corn $4,980 0.2% $4,084 0.2% Cherries $893 0.0% $1,569 0.1% All other crops $38,034 1.9% $32,258 1.8% Subtotal $1,241,614 60.9% $704,315 39.0%
Total All Commodities $2,039,752 100% $1,806,371 100%
Source: Montana Department of Agriculture.
The increase in cash receipts for cattle and calves has been associated with increasing prices for these commodities. As shown in Figure A3.7, 2000 prices for beef cattle and calves were at their highest point in a decade, despite relatively constant production.

Montana Highway Reconfiguration Study Final Report
Cambridge Systematics, Inc. A3-79
Figure A3.7 Production and Price for Montana Cattle and Calves, 1991-2000
40
50
60
70
80
90
100
110
1991 1992 1993 1994 1995 1996 1997 1998 1999 2000
Dolla
rs/C
WT
0
200
400
600
800
1000
1200
Mill
ion
Poun
ds
Cattle PriceCalf PriceProduction
Source: Montana Agricultural Statistics Service.
Montana Crops
Crops accounted for 39 percent of the market value of Montana’s agricultural products in 2000. Cash receipts have fallen 43 percent since 1996. Wheat makes up the majority of cash receipts (23 percent), with State production of all wheat ranking 6th in the nation. However, cash receipts from wheat in 2000 are 52 percent lower than 1996 receipts, though commodity production and prices have varied considerably over time. As shown in Figure A3.8, this decline in cash receipts is associated with a considerable drop in wheat prices from 1995, and a decline in Montana wheat production.
Barley is the State’s second largest crop, accounting for 5.1 percent of cash receipts, and ranking third in U.S. production. Other important crops in terms of cash receipts include sugar beets, and hay.

Montana Highway Reconfiguration Study Final Report
Cambridge Systematics, Inc. A3-80
Figure A3.8 Production and Price for Montana Wheat, 1991-2000
0
500
1000
1500
2000
2500
3000
1982
1983
1984
1985
1986
1987
1988
1989
1990
1991
1992
1993
1994
1995
1996
1997
1998
1999
2000
2001
Mill
ion
bush
els
0
0.5
1
1.5
2
2.5
3
3.5
4
4.5
5
Dol
lars
per
bus
hel
ProductionPrice per Bushel
Source: Montana Agricultural Statistics Service.
Exports
The State’s agricultural exports reached an estimated $260 million in 2000, or 14 percent of farm cash receipts. Montana’s top five agricultural exports in 2000 were:
• Wheat and related products ($180 million);
• Feed grains and products ($33 million);
• Feeds and fodders ($33 million);
• Live animals and red meats ($11 million); and
• Seeds ($4 million).
Montana Agriculture Forecasts
Montana is attempting to substantially increase income from its agricultural sector over the next several years through a growth program, Vision 2005. The goals of the program are to:
Montana Highway Reconfiguration Study Final Report
Cambridge Systematics, Inc. A3-81
• Increase domestic and international Montana agricultural product sales by 500 percent;
• Increase Montana irrigated acres by 500,000;
• Develop new niche and foreign markets, including promoting valued added opportunities for Montana’s nearly 700 food producers;
• Market 1 million hogs annually by 2005 and 2 million hogs annually by 2010;
• Double the value of Montana’s beef cattle industry through adding value to the current production and increased marketing efforts, with a view to expanding current market to Canada, Japan and China;
• Double the value of the State’s sheep industry through adding value to current production and increasing marketing efforts; and
• Develop marketing and production of alternative livestock (e.g., bison and emu) and crops (e.g., organic products).
Long-term projections available from the Montana Department of Commerce show that farm employment is expected to drop by 13 percent but real income from farming is expected to rise by 25 percent, closely tracking national trends. 23 24
Regional Concentrations
The most productive Montana counties for livestock production are concentrated in the central part of the State (see Table A3.58). Wheat growing occurs throughout the eastern one-half of the State, with the most productive counties located along the Hi-Line.
Table A3.59 shows the counties with the most agriculture employees. While some of these counties also rank high in terms of cash receipts, others (such as Ravalli and Lake Counties) do not.
23 Provided by NPA Data Services. 24 TranPlan 21, Montana DOT.
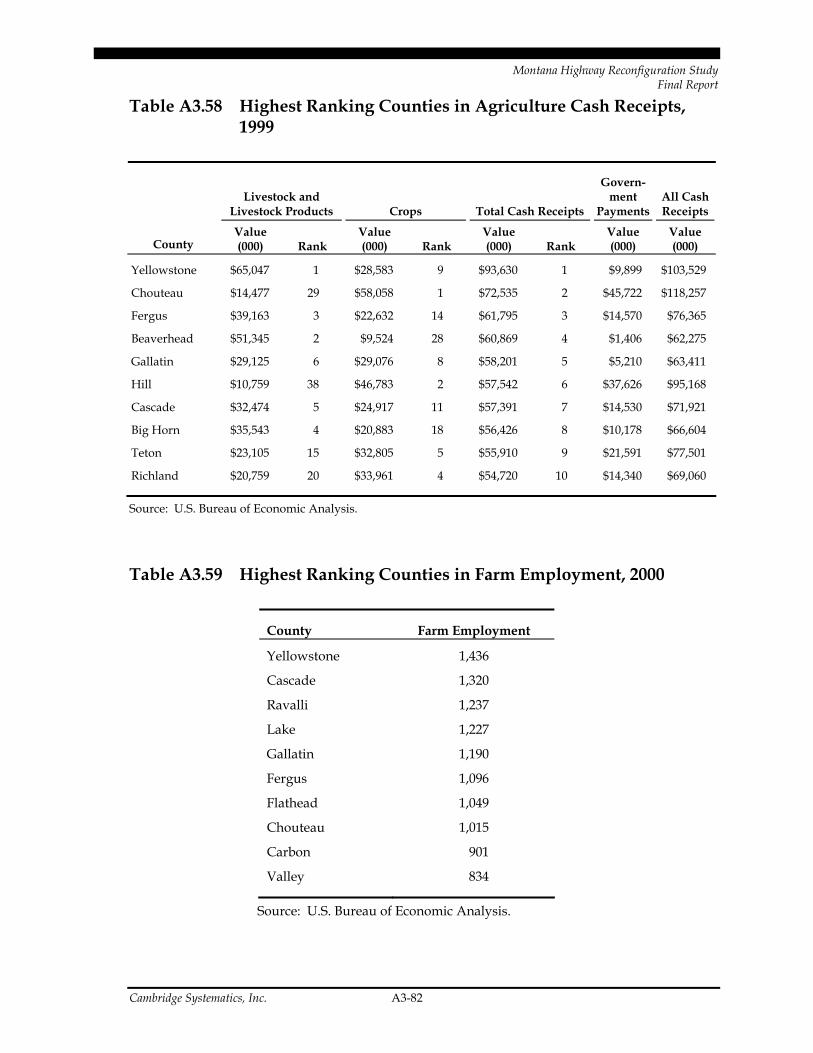
Montana Highway Reconfiguration Study Final Report
Cambridge Systematics, Inc. A3-82
Table A3.58 Highest Ranking Counties in Agriculture Cash Receipts, 1999
Livestock and Livestock Products Crops Total Cash Receipts
Govern-ment
Payments All Cash Receipts
County Value (000) Rank
Value (000) Rank
Value (000) Rank
Value (000)
Value (000)
Yellowstone $65,047 1 $28,583 9 $93,630 1 $9,899 $103,529
Chouteau $14,477 29 $58,058 1 $72,535 2 $45,722 $118,257
Fergus $39,163 3 $22,632 14 $61,795 3 $14,570 $76,365
Beaverhead $51,345 2 $9,524 28 $60,869 4 $1,406 $62,275
Gallatin $29,125 6 $29,076 8 $58,201 5 $5,210 $63,411
Hill $10,759 38 $46,783 2 $57,542 6 $37,626 $95,168
Cascade $32,474 5 $24,917 11 $57,391 7 $14,530 $71,921
Big Horn $35,543 4 $20,883 18 $56,426 8 $10,178 $66,604
Teton $23,105 15 $32,805 5 $55,910 9 $21,591 $77,501
Richland $20,759 20 $33,961 4 $54,720 10 $14,340 $69,060
Source: U.S. Bureau of Economic Analysis.
Table A3.59 Highest Ranking Counties in Farm Employment, 2000
County Farm Employment
Yellowstone 1,436
Cascade 1,320
Ravalli 1,237
Lake 1,227
Gallatin 1,190
Fergus 1,096
Flathead 1,049
Chouteau 1,015
Carbon 901
Valley 834
Source: U.S. Bureau of Economic Analysis.
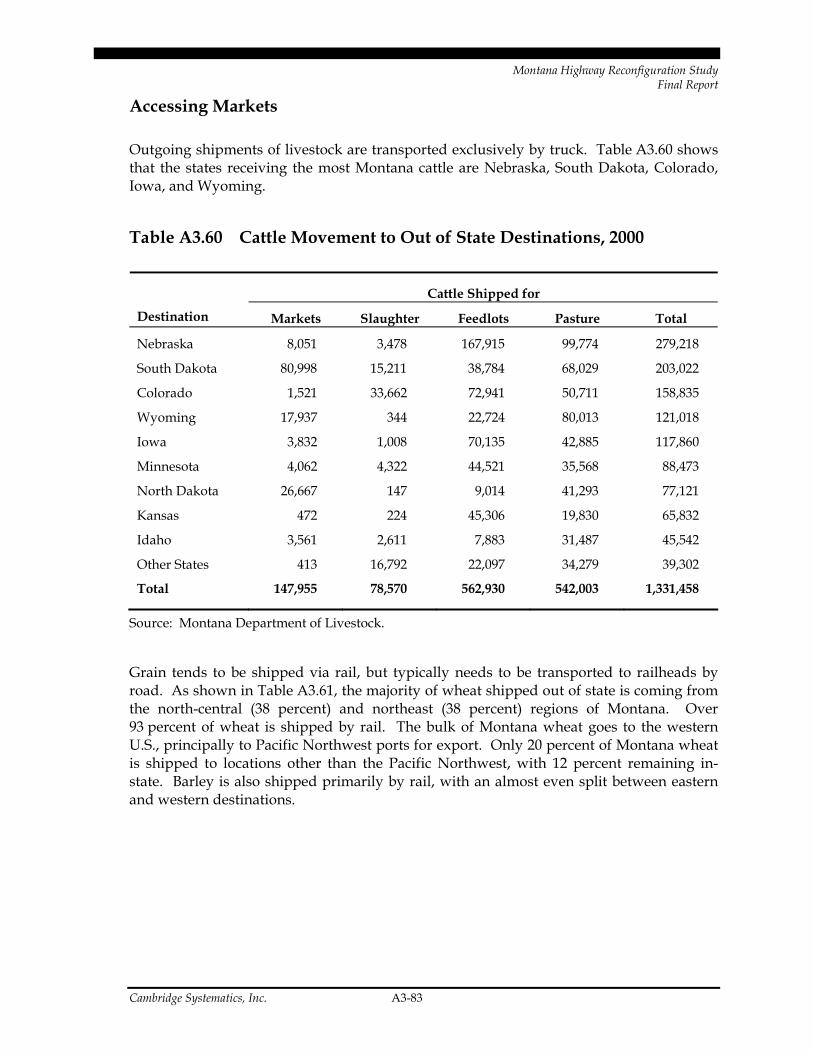
Montana Highway Reconfiguration Study Final Report
Cambridge Systematics, Inc. A3-83
Accessing Markets
Outgoing shipments of livestock are transported exclusively by truck. Table A3.60 shows that the states receiving the most Montana cattle are Nebraska, South Dakota, Colorado, Iowa, and Wyoming.
Table A3.60 Cattle Movement to Out of State Destinations, 2000
Cattle Shipped for
Destination Markets Slaughter Feedlots Pasture Total
Nebraska 8,051 3,478 167,915 99,774 279,218
South Dakota 80,998 15,211 38,784 68,029 203,022
Colorado 1,521 33,662 72,941 50,711 158,835
Wyoming 17,937 344 22,724 80,013 121,018
Iowa 3,832 1,008 70,135 42,885 117,860
Minnesota 4,062 4,322 44,521 35,568 88,473
North Dakota 26,667 147 9,014 41,293 77,121
Kansas 472 224 45,306 19,830 65,832
Idaho 3,561 2,611 7,883 31,487 45,542
Other States 413 16,792 22,097 34,279 39,302
Total 147,955 78,570 562,930 542,003 1,331,458
Source: Montana Department of Livestock.
Grain tends to be shipped via rail, but typically needs to be transported to railheads by road. As shown in Table A3.61, the majority of wheat shipped out of state is coming from the north-central (38 percent) and northeast (38 percent) regions of Montana. Over 93 percent of wheat is shipped by rail. The bulk of Montana wheat goes to the western U.S., principally to Pacific Northwest ports for export. Only 20 percent of Montana wheat is shipped to locations other than the Pacific Northwest, with 12 percent remaining in-state. Barley is also shipped primarily by rail, with an almost even split between eastern and western destinations.
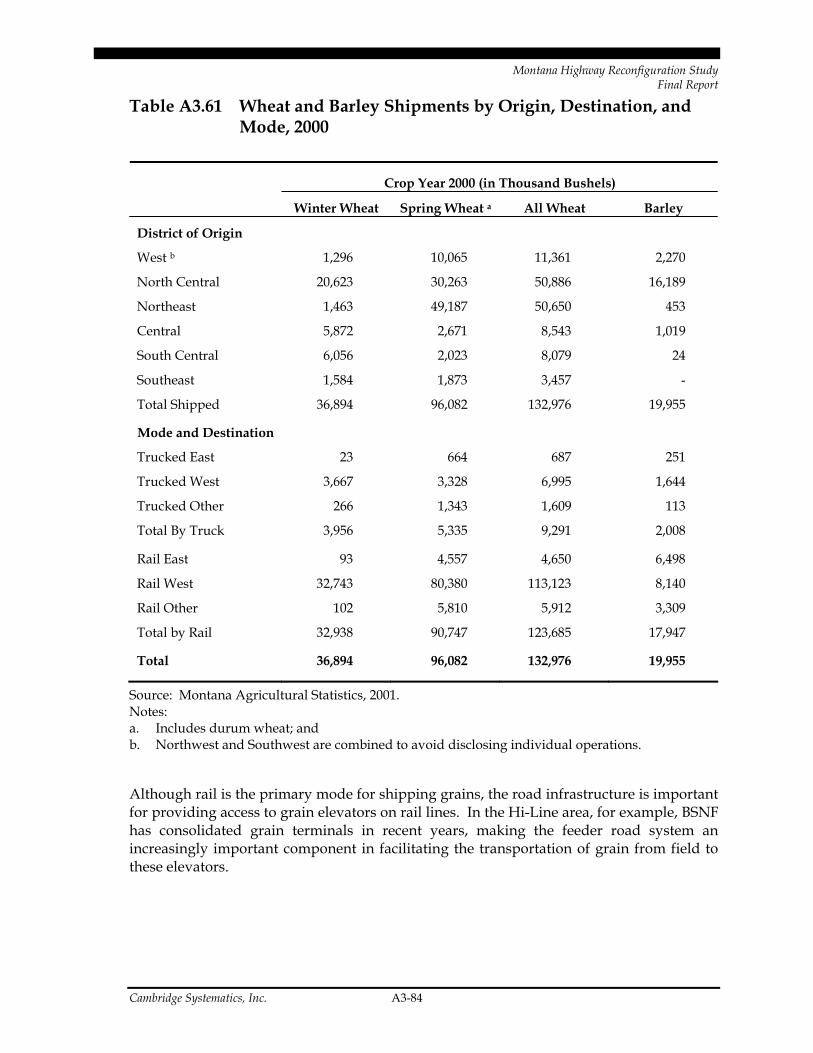
Montana Highway Reconfiguration Study Final Report
Cambridge Systematics, Inc. A3-84
Table A3.61 Wheat and Barley Shipments by Origin, Destination, and Mode, 2000
Crop Year 2000 (in Thousand Bushels)
Winter Wheat Spring Wheat a All Wheat Barley
District of Origin
West b 1,296 10,065 11,361 2,270
North Central 20,623 30,263 50,886 16,189
Northeast 1,463 49,187 50,650 453
Central 5,872 2,671 8,543 1,019
South Central 6,056 2,023 8,079 24
Southeast 1,584 1,873 3,457 -
Total Shipped 36,894 96,082 132,976 19,955
Mode and Destination
Trucked East 23 664 687 251
Trucked West 3,667 3,328 6,995 1,644
Trucked Other 266 1,343 1,609 113
Total By Truck 3,956 5,335 9,291 2,008
Rail East 93 4,557 4,650 6,498
Rail West 32,743 80,380 113,123 8,140
Rail Other 102 5,810 5,912 3,309
Total by Rail 32,938 90,747 123,685 17,947
Total 36,894 96,082 132,976 19,955
Source: Montana Agricultural Statistics, 2001. Notes: a. Includes durum wheat; and b. Northwest and Southwest are combined to avoid disclosing individual operations.
Although rail is the primary mode for shipping grains, the road infrastructure is important for providing access to grain elevators on rail lines. In the Hi-Line area, for example, BSNF has consolidated grain terminals in recent years, making the feeder road system an increasingly important component in facilitating the transportation of grain from field to these elevators.

Montana Highway Reconfiguration Study Final Report
Cambridge Systematics, Inc. A3-85
Transportation Costs, Business Expansion and Transportation Improvements
Some Montana agriculture firms (though not all) believe their transportation costs to be higher than out-of-state competitors and prohibit accesses to markets. A grower of specialized high-value crops reports the following freight rates as prohibiting competitive access to out-of-state markets:
• Less than 200 miles, freight rate is 10 percent of total purchase price;
• Over 200 miles, freight rate is 12 percent of total purchase price; and
• Over 400 miles, freight rate is 15 percent of total purchase price.
This firm also notes the expense of receiving supplies into Montana because of the lack of direct routes. Often, supplies that arrive from Canada and California are delayed at a cross-docking station in Billings.
Livestock producers report that freight costs are comparable with out-of-state competitors. But one firm has noted that it is cheaper per mile to ship to ranches in Kansas (approximately $2.20 per loaded mile) than to ranches in Montana ($2.50 per loaded mile). These costs may deprive the State of value-adding processing facilities. Another livestock producer typically ships to North Dakota for processing because comparable facilities in Montana are lacking. Still another Montana firm reports benefiting from subsidized transportation rates, which result in relatively lower freight rates compared to its out-of-state competitors.
Interviews with Montana firms suggest that the State’s two-lane highways can increase delivery time, driver hours, and thus total transportation costs for some agricultural shipments. Some firms believe that limited north-south road access presents challenges for accessing markets within Montana (for example between Bozeman and Kalispell) as well as out-of-state markets in Idaho.
Some Montana firms believe that transportation improvements would support business expansion. One firm reports that the cost of freight is preventing the firm from expanding into potentially lucrative Western U.S. markets where demand already exists for its products. Factoring in freight costs as high as 17 percent of total purchase price, the firm cannot compete with Washington and Oregon companies that pay 15 percent of total purchase price for freight. Given the perishability of its products, rail is not an option for this Montana firm. As such, the firm may have to redirect its expansion strategy, focusing more on a localized Montana market.
At least one Montana firm believes that the distances in accessing Montana markets, combined with current limited transportation infrastructure, helps to protect Montana-based firms from out-of-state competitors. Nevertheless, the same firm also commented that improved transportation infrastructure would improve hauling products between farms and processing plants and lower transportation costs.

Montana Highway Reconfiguration Study Final Report
Cambridge Systematics, Inc. A3-86
A livestock producer reports that freight costs are not an impediment to business expansion or prohibitive to current operations. This firm is currently paying approximately five percent of its gross sales value of animals towards transportation costs. The firm cites limitations to growth as being tied more to land price and land availability than transportation issues.
12.0 Stone, Glass, and Clay Products
I. Global, National and State Trends in the Stone, Clay, and Glass Industry
Industry Overview
The stone, clay, and glass (SCG) industry includes clay products; glass and glass products; cement and cement products; lime and gypsum; and other nonmetallic mineral products. With 1,333 people employed in 90 establishments, SCG in Montana is relatively small, comprising six percent of Montana’s manufacturing employment base and seven percent of its value added. Within Montana, this industry is concentrated in the cement and concrete manufacturing sector, which accounts for over 1,000 jobs and 65 establishments. Employment per SCG establishment in Montana averages 15, which is less than one-half of the national average of 32 employees, and less than the average employees per manufacturing establishment in the State (18). From an employment perspective, the industry is growing in Montana at a much faster rate than the nation, but wages per worker are falling relative to the national industry (see Table A3.62).
Characteristics of cement and asphalt, which are relatively high weight and low value added, dictate that most sales are within a fixed area around a company’s plants. However, the emergence of countries like Thailand and Indonesia as major international exporters illustrates that cement and asphalt products can be shipped long distances. Firms in Montana report that their primary sales areas can extend hundreds of miles from the plant and often include sites in Canada, where virtually all of Montana’s exports are sent. The industry uses truck and rail to transport product, and is dependent on rail for supplies of coal.
Firms in this sector reported that they face congestion in and close to state and national parks, and raised concerns about the safety of truckers and visitors driving in these areas. They also noted development near existing plants, especially increased population density, which trigger a lowering of speed limits and an increase in congestion.

Montana Highway Reconfiguration Study Final Report
Cambridge Systematics, Inc. A3-87
Table A3.62 The Stone, Clay, and Glass Industry – Montana and the U.S.
U.S. 1990 1995 2000
Employment 522,856 491,795 523.698
# Establishments 16,155 16,214 16,537
Average Wage (‘000s) $26.3 $30.6 $36.5
Average Wage (fixed $1997s) $26.3 $26.2 $27.7
Employees per Establishment 32.4 30.3 31.7
Montana
Employment 792 1,093 1,333
# Establishments 83 89 90
Average Wage (‘000s) $27.2 $30.0 $31.6
Average Wage (fixed $1997s) $27.2 $25.7 $24.0
Employees per Establishment 9.5 12.3 14.8
Montana as % of U.S.
Average wage 103.7% 97.9% 86.7%
Employees per Establishment 29.5% 40.5% 46.8%
Source: County Business Patterns.
International, National, and State Trends in Trade
In the SCG sector in which Montana’s industry is concentrated – cement – the percentage of world exports originating in developing economies grew by nine percent in the 1990s, from 27 to 36 percent. Indonesia and Thailand, for example, have become large exporters of cement (4). Thus, it is likely that Montana’s firms are facing increased competition from low-wage countries around the globe. Still, at least one source suggests that the U.S. will need more rather than less capacity to meet expected future demand (4). The demand for capacity is likely tied to the strong internal demand for cement: the U.S. ranks second, behind only China, in consumption of cement (4). At the same time, reliance on strong internal demand also makes the industry vulnerable to domestic economic cycles, especially spending on housing and infrastructure, including road, construction. Dependence on domestic activity is high in the SCG industry, and Montana’s companies are less export-oriented than the average firm in the U.S. This may be a reason that wages are lower in Montana than the U.S., but it also might better insulate Montana’s industry from international competition from low-wage nations (see Tables A3.63 and A3.64).

Montana Highway Reconfiguration Study Final Report
Cambridge Systematics, Inc. A3-88
Table A3.63 Exports Per Employee in SCG Industry, U.S., and Montana (in 1997 Dollars)
1997 1998 1999 2000
U.S. $12,800 $12,013 $12,331 $14,540
Montana $9,500 $7,680 $7,900 $8,109
Table A3.64 Domestic Sales and Exports Per Employee in the SCG Industry in 2000
U.S. Montana
Export Sales/EMP $15,600 $8,700
Domestic Sales/EMP $170,535 $135,124
Source: Calculated by the author from data from U.S. ITA and U.S. Department of Census.
National Industry Characteristics
About 50 percent of income generated in the SCG sector are profits and wages (value added) and 50 percent are purchases of goods and services from outside suppliers (intermediate inputs), including about 11 percent from other companies within the industry. This relatively high percentage of profits and wages indicates that the Montana SCG industry generates much of its income within the State. Together, about 60 percent of each sector’s value of final goods is produced by firms within the sector (see Tables A3.65 and A3.66).
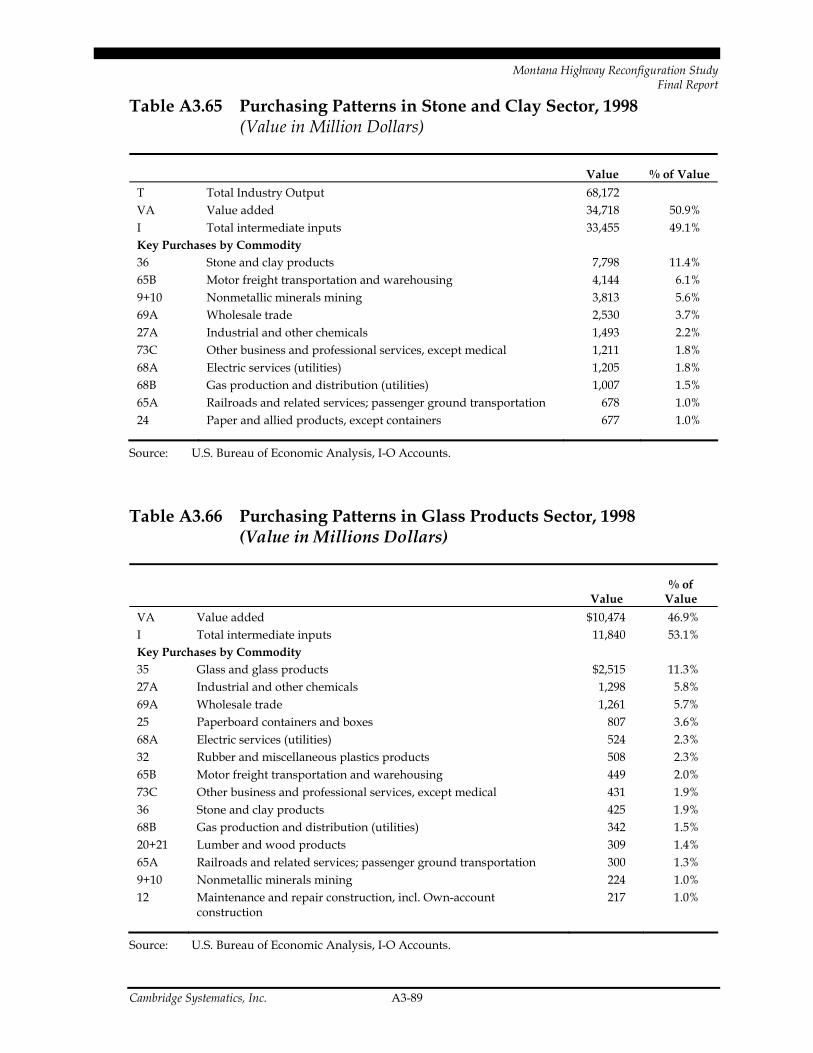
Montana Highway Reconfiguration Study Final Report
Cambridge Systematics, Inc. A3-89
Table A3.65 Purchasing Patterns in Stone and Clay Sector, 1998 (Value in Million Dollars)
Value % of Value T Total Industry Output 68,172 VA Value added 34,718 50.9% I Total intermediate inputs 33,455 49.1% Key Purchases by Commodity 36 Stone and clay products 7,798 11.4% 65B Motor freight transportation and warehousing 4,144 6.1% 9+10 Nonmetallic minerals mining 3,813 5.6% 69A Wholesale trade 2,530 3.7% 27A Industrial and other chemicals 1,493 2.2% 73C Other business and professional services, except medical 1,211 1.8% 68A Electric services (utilities) 1,205 1.8% 68B Gas production and distribution (utilities) 1,007 1.5% 65A Railroads and related services; passenger ground transportation 678 1.0% 24 Paper and allied products, except containers 677 1.0%
Source: U.S. Bureau of Economic Analysis, I-O Accounts.
Table A3.66 Purchasing Patterns in Glass Products Sector, 1998 (Value in Millions Dollars)
Value % of
Value VA Value added $10,474 46.9% I Total intermediate inputs 11,840 53.1% Key Purchases by Commodity 35 Glass and glass products $2,515 11.3% 27A Industrial and other chemicals 1,298 5.8% 69A Wholesale trade 1,261 5.7% 25 Paperboard containers and boxes 807 3.6% 68A Electric services (utilities) 524 2.3% 32 Rubber and miscellaneous plastics products 508 2.3% 65B Motor freight transportation and warehousing 449 2.0% 73C Other business and professional services, except medical 431 1.9% 36 Stone and clay products 425 1.9% 68B Gas production and distribution (utilities) 342 1.5% 20+21 Lumber and wood products 309 1.4% 65A Railroads and related services; passenger ground transportation 300 1.3% 9+10 Nonmetallic minerals mining 224 1.0% 12 Maintenance and repair construction, incl. Own-account
construction 217 1.0%
Source: U.S. Bureau of Economic Analysis, I-O Accounts.
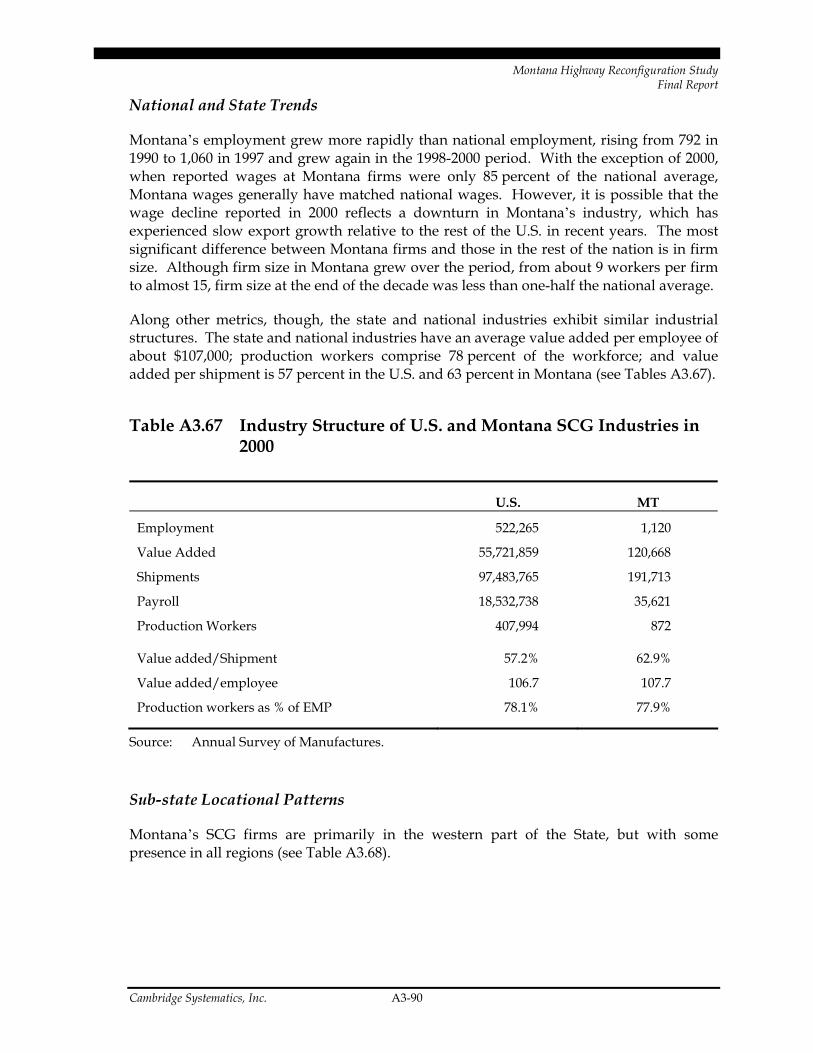
Montana Highway Reconfiguration Study Final Report
Cambridge Systematics, Inc. A3-90
National and State Trends
Montana’s employment grew more rapidly than national employment, rising from 792 in 1990 to 1,060 in 1997 and grew again in the 1998-2000 period. With the exception of 2000, when reported wages at Montana firms were only 85 percent of the national average, Montana wages generally have matched national wages. However, it is possible that the wage decline reported in 2000 reflects a downturn in Montana’s industry, which has experienced slow export growth relative to the rest of the U.S. in recent years. The most significant difference between Montana firms and those in the rest of the nation is in firm size. Although firm size in Montana grew over the period, from about 9 workers per firm to almost 15, firm size at the end of the decade was less than one-half the national average.
Along other metrics, though, the state and national industries exhibit similar industrial structures. The state and national industries have an average value added per employee of about $107,000; production workers comprise 78 percent of the workforce; and value added per shipment is 57 percent in the U.S. and 63 percent in Montana (see Tables A3.67).
Table A3.67 Industry Structure of U.S. and Montana SCG Industries in 2000
U.S. MT
Employment 522,265 1,120
Value Added 55,721,859 120,668
Shipments 97,483,765 191,713
Payroll 18,532,738 35,621
Production Workers 407,994 872
Value added/Shipment 57.2% 62.9%
Value added/employee 106.7 107.7
Production workers as % of EMP 78.1% 77.9%
Source: Annual Survey of Manufactures.
Sub-state Locational Patterns
Montana’s SCG firms are primarily in the western part of the State, but with some presence in all regions (see Table A3.68).

Montana Highway Reconfiguration Study Final Report
Cambridge Systematics, Inc. A3-91
Table A3.68 Montana’s SCG Establishments Within Montana
Distribution of Establishments by District Northwest Southwest
North-Central East
South-Central
1990 20% 25% 18% 16% 20%
1997 24% 32% 17% 11% 17%
2000 22% 57% 6% 0% 15%
Average 1990-97 24% 31% 22% 11% 12%
Source: Calculated by the author based on County Business Patterns.
The 29 establishments in Montana with 10 or more employees show slightly different trends and are found more proportionally in the Southwest and the South Central area of the State (24 percent of large establishments but only 12 percent of all establishments). Moreover, fewer large establishments are in eastern Montana relative to all establishments (three percent of larger establishments and 11 percent of all establishments) (see Table A3.69).
Table A3.69 Characteristics of Firms with 10 or More Employees, Montana’s SCG Industry
District # EST Average –
EMP SALES % of EST % of EMP
Northwest 7 34.9 8,435,429 24% 17%
Southwest 10 98.0 17,130,500 34% 70%
North Central 4 11.5 1,846,750 14% 3%
East 1 10.0 2,420,000 3% 1%
South Central 7 17.7 5,742,571 24% 9%
All 29 48.4 9,667,517 na Na
Source: InfoUSA Establishment Data.
Among establishments of 10 or more employees, four counties – Yellowstone, Missoula, Lewis Clark, and Jefferson – account for two-thirds of the state employment in the SCG industry (see Table A3.70). These counties house only 38 percent of the larger employers in Montana, meaning that the firms in these counties are, on average, about two times bigger than firms in other counties in the State. Gallatin County houses the highest
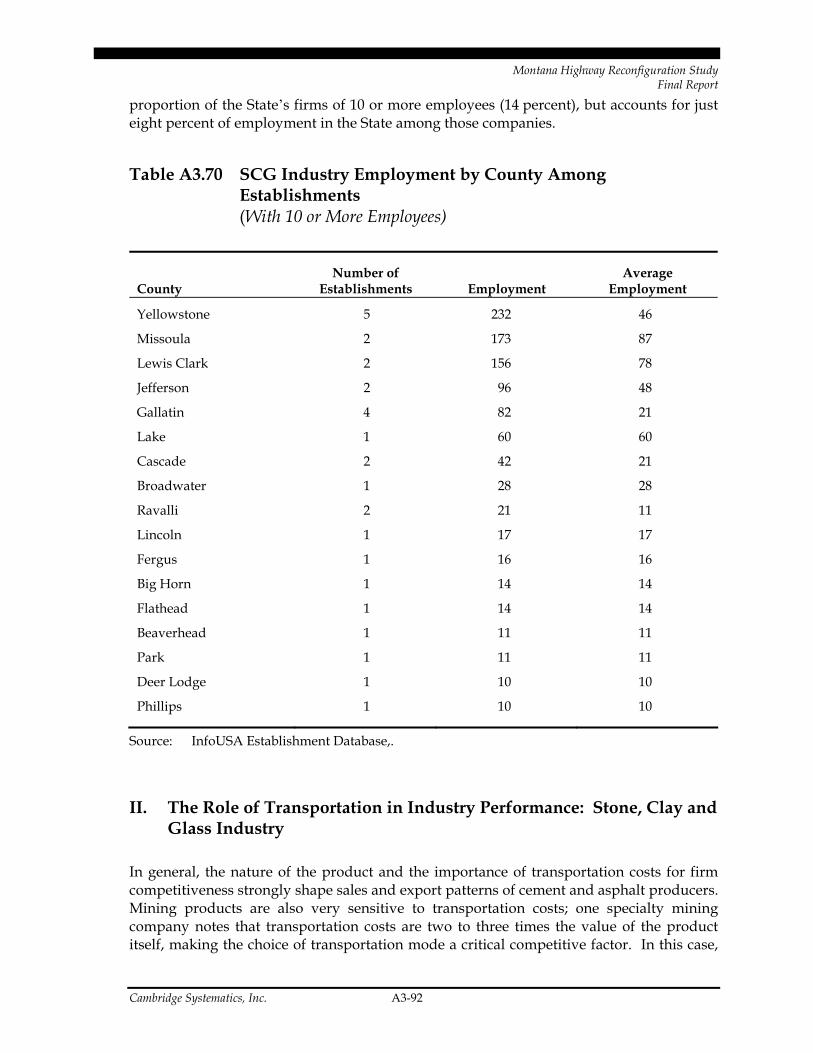
Montana Highway Reconfiguration Study Final Report
Cambridge Systematics, Inc. A3-92
proportion of the State’s firms of 10 or more employees (14 percent), but accounts for just eight percent of employment in the State among those companies.
Table A3.70 SCG Industry Employment by County Among Establishments (With 10 or More Employees)
County Number of
Establishments Employment Average
Employment
Yellowstone 5 232 46
Missoula 2 173 87
Lewis Clark 2 156 78
Jefferson 2 96 48
Gallatin 4 82 21
Lake 1 60 60
Cascade 2 42 21
Broadwater 1 28 28
Ravalli 2 21 11
Lincoln 1 17 17
Fergus 1 16 16
Big Horn 1 14 14
Flathead 1 14 14
Beaverhead 1 11 11
Park 1 11 11
Deer Lodge 1 10 10
Phillips 1 10 10
Source: InfoUSA Establishment Database,.
II. The Role of Transportation in Industry Performance: Stone, Clay and Glass Industry
In general, the nature of the product and the importance of transportation costs for firm competitiveness strongly shape sales and export patterns of cement and asphalt producers. Mining products are also very sensitive to transportation costs; one specialty mining company notes that transportation costs are two to three times the value of the product itself, making the choice of transportation mode a critical competitive factor. In this case,

Montana Highway Reconfiguration Study Final Report
Cambridge Systematics, Inc. A3-93
limited international supply of the particular mineral creates worldwide demand for the company’s product, which is mined and manufactured in Wyoming, but sold and managed out of Montana. Informants reported other transportation- and non-transportation related impediments to firm growth. Issues related to transportation include:
• Low levels of freight rail competition and high prices charged by national railways.
• Cost of intra-shipment goods transfer between railway carriers, e.g., Montana Rail Link (MRL) and Burlington Northern (BN).
• Development, especially increased population density around existing plants, which can trigger a lowering of speed limits and an increase in congestion.
• Traffic and congestion around state and national parks. This raised concerns about the safety of truckers and visitors driving in these areas.
Issues not related to transportation include:
• State budget deficits, which could reduce new construction and transportation projects.
• Anti-growth initiatives.
• Overall market conditions.
• Foreign competition, especially for mining products.
• One informant noted that the prevalence of state budget deficits around the U.S. bodes poorly for his firm, as it suggests that state governments are likely to cut back on new highway construction, a typical end-market for his firm’s products. Thus, in this sector, transportation infrastructure improvements have both a direct and indirect effect on local firms: highway and other infrastructure development will directly affect demand for product, as well as improve the availability and ease of transporting goods.
Cost of Transportation
Nationally, transportation accounts for 9.3 percent of all production costs of firms in the stone and clay products industry.25 Generally costs in Montana appear slightly lower. At the extreme, one informant estimated that transportation consumes only one to three percent of all production costs, but noted that his plant is located on the site of its major quarry, thus eliminating transport costs of one major material.
25Based on data from the U.S. Transportation Satellite Accounts, which are generated jointly by the
U.S. Bureau of Transportation Statistics and the U.S. Bureau of Economic Analysis to assess each industry’s use of transportation services in the production process.

Montana Highway Reconfiguration Study Final Report
Cambridge Systematics, Inc. A3-94
Transportation in the Stone, Clay and Glass Industry
Transportation costs can be traced, in part, to the industry’s heavy consumption of coal, which is shipped by rail. One informant estimated that one-half of the total cost of coal (about $11 per ton) is attributable to the cost of transporting coal. Most of these costs can be attributed to high rail rates on the portion of Montana’s rail system run by national rail companies which, in this case, charge 60 percent more than regional rail service for an equivalent distance. This informant noted that for coal shipments, truck is becoming almost as competitive as rail: if his firm could guarantee a backload on coal shipments, it would cost about $13 per ton to ship coal by truck.26 It is hard to find backhaul loads from the coal strips, though, and with no back haul, trucking costs for coal are likely $17 to $18 per ton. Other informants note that the use of multiple rail systems adds costs, as the firm must pay each time product is shifted from one system to another, e.g., from Burlington National to Montana Rail Link. One informant suggested that Canadian competitors might be at an advantage because of better and more competitive rail and that his firm is exploring bringing coal in from Canada for this reason.
With the exception of coal, however, most of the major supplies in the SCG industry are brought in by truck. This accords with the transportation patterns of firms nationally, which use trucks to meet 92 percent of transportation needs.27 For some firms, production is co-located with mining activities, which can greatly reduce transportation costs of these products. However, one informant noted that his plant was intentionally established in the “middle of nowhere,” in an unpopulated area two miles from the plant’s quarry. After the firm built a road from the plant to the quarry, however, other development came and traffic between the two spots has slowed considerably. There is now consideration of setting up a rotary on the road, a project the firm supports – although rotaries tend to slow down traffic, they also keep traffic moving, which is more important.
Outgoing product is shipped by both rail and truck. One firm, whose customers are located almost exclusively in Montana, reports that all product (ready-mix cement and asphalt) is shipped by truck and that the firm handles most of the trucking internally. Other producers of Portland cement, which sell to ready-mix operations and have customer bases that expand beyond state borders, report using a 50:50 mix of rail and truck and note that when trucks are used, customers often provide the trucks and pick up product at the plant. One informant noted that the choice between rail and truck is based on price and that rail can be cheaper, especially for longer distances. An informant at a mineral producer supported this claim, noting that unlike trucks, rail costs are not mileage based, which makes rail more competitive when distances are greater than 500 or 600 miles.
26 Normally a “backload” is the load transported by a trucking company that fills a truck returning
from a delivery destination. 27 U.S. Transportation Satellite Accounts.
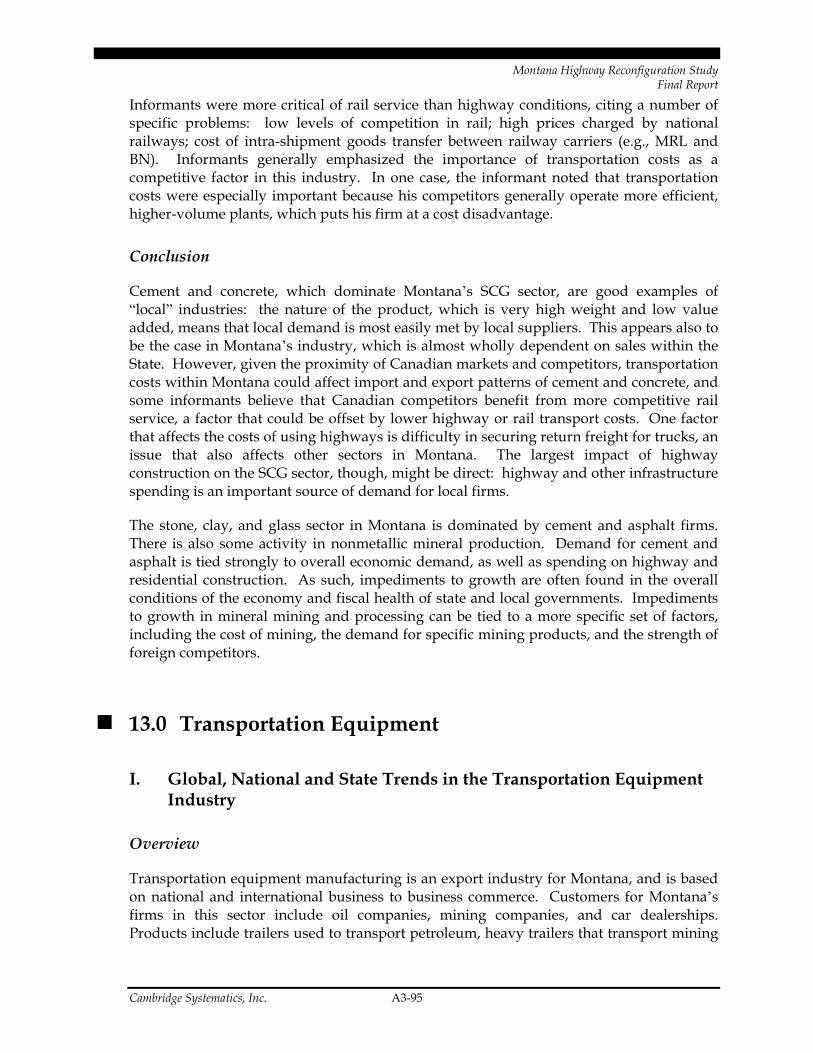
Montana Highway Reconfiguration Study Final Report
Cambridge Systematics, Inc. A3-95
Informants were more critical of rail service than highway conditions, citing a number of specific problems: low levels of competition in rail; high prices charged by national railways; cost of intra-shipment goods transfer between railway carriers (e.g., MRL and BN). Informants generally emphasized the importance of transportation costs as a competitive factor in this industry. In one case, the informant noted that transportation costs were especially important because his competitors generally operate more efficient, higher-volume plants, which puts his firm at a cost disadvantage.
Conclusion
Cement and concrete, which dominate Montana’s SCG sector, are good examples of “local” industries: the nature of the product, which is very high weight and low value added, means that local demand is most easily met by local suppliers. This appears also to be the case in Montana’s industry, which is almost wholly dependent on sales within the State. However, given the proximity of Canadian markets and competitors, transportation costs within Montana could affect import and export patterns of cement and concrete, and some informants believe that Canadian competitors benefit from more competitive rail service, a factor that could be offset by lower highway or rail transport costs. One factor that affects the costs of using highways is difficulty in securing return freight for trucks, an issue that also affects other sectors in Montana. The largest impact of highway construction on the SCG sector, though, might be direct: highway and other infrastructure spending is an important source of demand for local firms.
The stone, clay, and glass sector in Montana is dominated by cement and asphalt firms. There is also some activity in nonmetallic mineral production. Demand for cement and asphalt is tied strongly to overall economic demand, as well as spending on highway and residential construction. As such, impediments to growth are often found in the overall conditions of the economy and fiscal health of state and local governments. Impediments to growth in mineral mining and processing can be tied to a more specific set of factors, including the cost of mining, the demand for specific mining products, and the strength of foreign competitors.
13.0 Transportation Equipment
I. Global, National and State Trends in the Transportation Equipment Industry
Overview
Transportation equipment manufacturing is an export industry for Montana, and is based on national and international business to business commerce. Customers for Montana’s firms in this sector include oil companies, mining companies, and car dealerships. Products include trailers used to transport petroleum, heavy trailers that transport mining

Montana Highway Reconfiguration Study Final Report
Cambridge Systematics, Inc. A3-96
and agriculture products, as well as helicopter parts and truck bodies (such as standard van body or a customized body, flatbed or grain box). This is a small industry in the State, representing about two percent of manufacturing employment. Within this industry, the dominant sector in Montana is motor vehicle body and trailer manufacturing; the second largest sector is the aircraft industry. This industry relies on motor freight to transport products to customers or ports and to receive in-coming supplies, with some deliveries arriving by parcel services and air freight.
Although the average transportation equipment manufacturing establishment size in Montana has increased from 10 to 15 workers since 1990, the average in-state company in Montana’s transportation sector is only about one-eight the size of the average U.S. company in the industry (Table A3.71). Moreover, wages in Montana’s transportation sector have climbed relative to the national average, but remain about one-third lower. The average wage in Montana’s transportation sector was just over one-half the national average in 1990, but by 1997, wages had risen to more than 64 percent of the national average. In that same time span, industry employment nearly doubled. Since 1997, however, statewide transportation equipment employment has decreased from over 500 to fewer than 500. (Due to data suppression issues, 1997 is the last year that Montana’s employment counts and wages are readily available in transportation equipment manufacturing.)
Table A3.71 Montana’s Transportation Equipment Sector
U.S. 1990 1995 1997 2000
Employment 1,797,524 1,543,731 1,573,789 1,872,630
# of Establishments 10,787 11,256 12,677 12,766
Average Wage (‘000s) $ 35.1 $ 41.9 $ 44.6 $47.3
Average Wage (Fixed $1990s) $35.1 $ 35.9 $ 36.3 $35.9
Employees per Establishment 166.6 137.1 124.1 146.7
Montana
Employment 282 520 531 250-499
# of Establishments 21 30 35 33
Average Wage (‘000s) $ 18.5 $ 24.8 $ 28.6 na
Average Wage (Fixed $1990s) $ 18.5 $ 21.3 $ 23.3 na
Employees per Establishment 13.4 17.3 15.2 7.6-15.1
Montana as % of U.S.
Average Wage 52.9% 59.2% 64.1% –
Employees per Establishment 8.1% 12.6% 12.2% –
Source: County Business Patterns.

Montana Highway Reconfiguration Study Final Report
Cambridge Systematics, Inc. A3-97
International, National, and State Trends in Trade
Montana’s trade in transportation equipment products is relatively low and has experienced only modest growth in the past five years. Between 1997 and 2001, Montana experienced a six percent growth while the U.S. transportation products trade grew by 10 percent. As shown in Table A3.72, exports per employee averaged almost $64,000 (in 1997 dollars) in the U.S. transportation sector in 2000 compared with only $20,505 per employee in Montana. (Information on domestic sales per employee was not available.) Although Montana exports within NAFTA, it is not strongly integrated into the rest of the global economy: in 2001, only one-third of Montana’s exports were outside of the NAFTA region, compared with over one-half nationally.
The transport sector is one of the most global of all industrial sectors. The transport industry accounted for 11.5 percent of global trade in 1999, and is dominated by three sectors: passenger motor vehicles; parts and accessories for vehicles, and aircraft and associated equipment.28 Despite its significance to global trade, vehicle parts and accessories declined as a proportion of total global trade in the 1990s, a shift likely due to the trend towards co-location of original equipment manufacturers (OEMs) and suppliers, especially in the automotive sector. The other sectors that experienced a relative decline in the 1990s were “motor vehicles for the transport of goods” and “trailers and other vehicles, not motorized.”
In Montana, the majority of transport-related manufacturing is in trailer and vehicle body manufacturing, and therefore changes in the economies of developing countries could have strong implications for the State. The rapid rise in developing country capabilities suggests that Montana firms in trailer and vehicle body manufacturing could be forced to reduce costs further, in order to compete with lower-wage economies; enter high value added, niche product lines, in order to avoid direct competition; or face the prospect of losing sales and employment to these new competitors. Those firms that sell mainly aircraft and related products could remain sheltered from such competition, given that to date, developing countries have made few inroads in this global market, accounting for only 5.6 percent of world exports.
28 Except where noted, data on trends in global trade are derived from the United Nations trade
database; data on state and national trends are from U.S. International Trade Administration’s state export database.

Montana Highway Reconfiguration Study Final Report
Cambridge Systematics, Inc. A3-98
Table A3.72 Exports Per Employee in the Transportation Equipment Industry U.S. and Montana (in 1997 Dollars)
1997 1998 1999 2000
U.S. $75,000 $67,941 $66,762 $63,752
Montana $14,300 $12,013 $28,997 $20,505
Source: Calculated by the author from data from U.S. ITA and U.S. Department of Census.
National Industry Characteristics
Trailers and motor vehicle parts are classified as “truck and bus bodies, trailers, and motor vehicles parts.” About 29 percent of this sector’s income is generated by companies through value added activity (wages and profits) and 71.4 percent of the value of products is represented by purchases from outside firms (intermediate inputs). The largest suppliers are in its own “bodies, trailers, and parts” industry, which accounts for 9.5 percent of all purchases and various metals manufacturing sectors, including iron and steel manufacturing, nonferrous metals manufacturing, and various metal products. Together, these metals sectors provide 24 percent of the value of final goods produced by the sector and about one-third of all outside purchases. This means that even though there is a low level of value-added within the truck and body sector, purchases in industries where Montana has a presence provides opportunity for income to remain in the State (see Table A3.73).
The aircraft sector, with a very different purchasing pattern than trucks and trailers, produces two-thirds of its value in-house (50.6 percent) or purchased by firms in the same sector (17.2 percent). Other major purchases are for scientific and controlling instruments, which account for 6.6 percent of the value of final goods and over 10 percent of the all outside purchases. Thus, in contrast to the “bodies, trailers, and parts” sector, which relies on a range of manufactured products, including basic metals products, purchases by aircraft firms tend to be produced in-house or purchased from a small number of other high-tech sectors.
Sub-state Locational Patterns
The transportation sector is concentrated in western Montana, which accounted for nearly 70 percent of establishments in 1997, the last year that county-specific data are available (see Table A3.73).
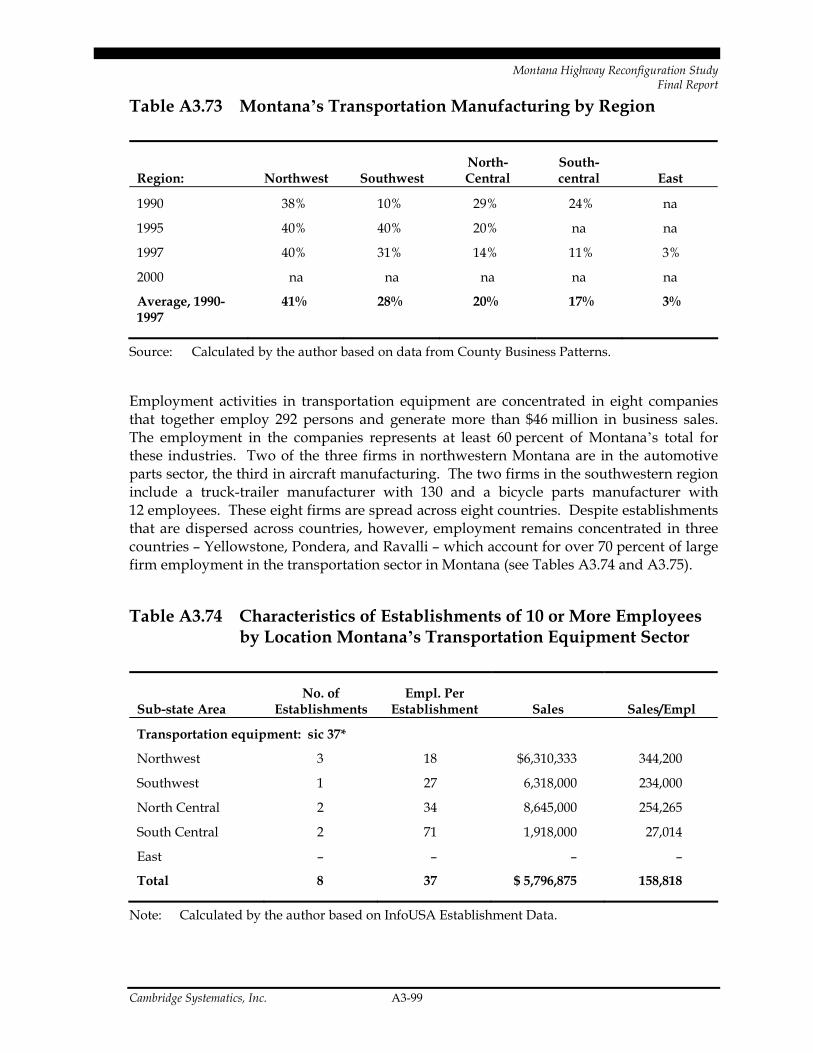
Montana Highway Reconfiguration Study Final Report
Cambridge Systematics, Inc. A3-99
Table A3.73 Montana’s Transportation Manufacturing by Region
Region: Northwest Southwest North-Central
South-central East
1990 38% 10% 29% 24% na
1995 40% 40% 20% na na
1997 40% 31% 14% 11% 3%
2000 na na na na na
Average, 1990-1997
41% 28% 20% 17% 3%
Source: Calculated by the author based on data from County Business Patterns.
Employment activities in transportation equipment are concentrated in eight companies that together employ 292 persons and generate more than $46 million in business sales. The employment in the companies represents at least 60 percent of Montana’s total for these industries. Two of the three firms in northwestern Montana are in the automotive parts sector, the third in aircraft manufacturing. The two firms in the southwestern region include a truck-trailer manufacturer with 130 and a bicycle parts manufacturer with 12 employees. These eight firms are spread across eight countries. Despite establishments that are dispersed across countries, however, employment remains concentrated in three countries – Yellowstone, Pondera, and Ravalli – which account for over 70 percent of large firm employment in the transportation sector in Montana (see Tables A3.74 and A3.75).
Table A3.74 Characteristics of Establishments of 10 or More Employees by Location Montana’s Transportation Equipment Sector
Sub-state Area No. of
Establishments Empl. Per
Establishment Sales Sales/Empl
Transportation equipment: sic 37*
Northwest 3 18 $6,310,333 344,200
Southwest 1 27 6,318,000 234,000
North Central 2 34 8,645,000 254,265
South Central 2 71 1,918,000 27,014
East – – – –
Total 8 37 $ 5,796,875 158,818
Note: Calculated by the author based on InfoUSA Establishment Data.

Montana Highway Reconfiguration Study Final Report
Cambridge Systematics, Inc. A3-100
Table A3.75 Characteristics by County of Establishments with 10 or More Employees Transportation Industry
County Number of Establishments Employment
Yellowstone 1 130
Pondera 1 50
Ravalli 1 29
Gallatin 1 27
Cascade 1 18
Missoula 1 15
Sweet Grass 1 12
Flathead 1 11
Total 8 292
Source: InfoUSA Establishment Data.
II. The Role of Transportation in Industry Performance in the Transportation Equipment Industry
Cost of Transportation
Companies in Montana’s transportation equipment industry rely on motor freight to transport final product and to bring in supplies, with some deliveries arriving by parcel services and air freight. These patterns are similar to national trends, where about three-fourths of transportation expenditures of transportation manufacturing firms are for trucking (rather than rail or air) services.29 All companies reported a reliance on highways for both receiving supplies and shipping products. Smaller parts may be brought in by parcel services and/or airfreight. Companies reported that they do not experience transportation bottlenecks and that the roadway system works fine: speed is adequate, and no problems were reported with access to, or operating conditions of, highways in the State.
29 This statement refers to motor vehicle, truck, and “other” transportation firms. Firms in the
aircraft sector rely less heavily (about 40% of expenditures) on trucks and more heavily on air transportation. Calculations assume that in-house expenditures go to truck (rather than rail or air) services. Numbers based on data from the U.S. Transportation Satellite Accounts, which are generated jointly by the U.S. Bureau of Transportation Statistics and the U.S. Bureau of Economic Analysis to assess each industry’s use of transportation services in the production process.

Montana Highway Reconfiguration Study Final Report
Cambridge Systematics, Inc. A3-101
According to the Transportation Satellite Accounts, companies in the transportation manufacturing equipment sector (except for aircraft and parts) pay about three percent of their production costs for transportation services.30 Companies in Montana, however, estimate much higher transportation costs: the range of reported costs was from five percent to more than nine percent. Transportation costs, according to informants, exceed out-of-state competitors because competitors are located closer to ports and/or core customer and supplier concentrations in the Midwest. Distance from suppliers in the “rust-belt” area can, at times, force companies in Montana to wait for supplies. In addition, the distance from key suppliers requires companies to choose between carrying large inventories or purchasing low volumes of supplies, for which they must pay higher unit costs.
In addition to high costs, informants reported transportation- and non-transportation related impediments to firm growth. Issues related to transportation include:
• Freight rates charged by distribution companies are higher than the rest of U.S. A related problem reported is in coordinating schedules with shipping companies (causing delays referred to above).
• One company reported that sometimes it experiences delays in getting permits from State.
• Indirectly, Montana’s heavy trailer manufacturing industry could be boosted by an expansion in the state highway network. Montana’s extractive companies are potential customers for heavy trailers. These industries could be best helped by developing north-south highways to improve flows to and from Denver and north to Great Falls, essentially requiring the connection between Great Falls and Billings. One informant commented that the current route of Highway 3 to 12 to 89 is not conducive to night-time driving.
Non-transportation business impediments:
• The availability of skilled labor: Companies in this sector need highly-skilled labor (or workers that can be trained for highly-skilled jobs). One company reported that it would not locate in MT now–it would instead look for a more central location. This company, though, will not relocate because of the strong, highly skilled labor that has been nurtured at the plant. Other companies reported that skilled labor is in short supply.
• Costs of fuel and aluminum.
30 According to the TSAs, transportation costs as a percent of total production costs in 196 were:
motor vehicles, 3.4 percent; truck and bus bodies, trailers, and motor vehicles parts, 3.2 percent; aircraft and parts, 1.6 percent; other transportation equipment, 2.8 percent.

Montana Highway Reconfiguration Study Final Report
Cambridge Systematics, Inc. A3-102
• Overall economic conditions: When overall demand is high, trucks are active and large amounts of fuel are consumed, requiring fuel tankers. Also, high levels of trucking activity cause wear and tear on roadways, requiring repairs and increasing demand for heavy trailers that can haul road supplies and debris. With a weak economy, less gasoline is being consumed, fewer tax dollars are flowing into the highway trust fund, and less repair work is being contracted.
• Access to fast telecommunications.
Transportation in the Furniture Manufacturing Industry
Key destinations for Montana products include ports of Houston and Tacoma; car dealers located between Illinois and the West Coast; and large core markets, such as Denver, Oklahoma City, St. Louis, Minneapolis-St. Paul, Chicago, and Salt Lake City.
Supplies flowing to Montana companies include steel, new and used axles, aluminum sheeting, wheels, suspensions and tanker valves. Locations of suppliers are concentrated in the Southeast and industrial Midwest, but supplies are also brought in from sites across the U.S., and rest of the world. Locations of key suppliers mentioned include Davenport Iowa; Parkersburg, West Virginia; Montgomery, Alabama; Cleveland OH; Springfield MO; and Kansas City, KS. One company reported an effort to buy locally, and reported that about 50 percent of all supplies are purchased from Montana businesses. A second company reported that suppliers in Montana and neighboring states provide services, welding supplies and fasteners.
Conclusion
Core suppliers for the industry and much of the customer base are located east of the Mississippi River. In addition, reaching international customers requires access to shipping ports. Montana-based companies pay more than out-of-state competitors that are located in the industrial Midwest and Mid-Atlantic states, or closer to ports, or where there is more competition among freight companies. A significant segment of this industry, however, includes providing service to customers. In this respect, Montana provides a locational advantage for servicing western customers (identified as an under-served market). Montana-based companies are also located within a concentration of mining and agriculture industries, which benefits heavy trailer manufacturers.
14.0 Tourism
Overview
Tourism is Montana’s third largest industry, supporting 32,440 jobs in the State. Tourism establishments include hotels and lodging facilities, eating and drinking places, and

Montana Highway Reconfiguration Study Final Report
Cambridge Systematics, Inc. A3-103
amusement and recreation services. Tourism in Montana continues to grow in terms of travel volume, total spending, and employment. The State received over 9.55 million nonresident visitors in 2001, a 27 percent increase since 1990. Yellowstone National Park and Glacier National Park are by far the most popular visitor destinations in Montana, drawing more than 4.3 million visitors annually.
Montana receives 90 percent of visitors from other U.S. states, eight percent from Canada, and two percent from foreign countries. Most U.S. visitors to Montana come from near-by states, with Washington sending the largest number followed by California, Idaho, North Dakota, and Wyoming. At least one-fifth of non-resident visitors fly to Montana, most of them renting a car to travel in the State.
National Trends
As shown in Table A3.76, the direct and indirect impacts of the travel and tourism economy in the U.S. generated $1.2 trillion in output in 2001, or 11.3 percent of total gross domestic product. The industry supports 16.4 million jobs, 12 percent of total U.S. employment. The U.S. is the largest consumer in absolute terms of travel and tourism in the world. In 2000, international visitors accounted for 14.5 percent of total travel expenditures in the United States.
The tourism industry has experienced substantial growth in recent years. Between 1992 and 1997, final domestic demand for travel and tourism grew at an annual average rate of 6.9 percent. Tourism employment increased during this period at an annual rate of 2.7 percent, exceeding the two percent growth in total U.S. employment. Between 1997 and 2000, travel and tourism demand increased at an annual rate of 5.1 percent.
Although the events of September 11, 2001 have had a negative impact on the tourism sector, the outlook is still one of growth. Sales in the first quarter of 2002 have increased 5.6 percent, lead by hotels and lodging places and air transportation.31 This follows three consecutive quarters of significant declines. Travel and tourism demand is expected to grow by 3.0 percent per annum in real terms over the next 10 years, and the industry’s contribution to gross domestic product is forecast to rise to 11.5 percent by 2012. Total international visitors are forecast to increase six percent between 2000 and 2004, and domestic person trips are forecast to increase 8.4 percent for the same period. Arrivals from Canada are expected to remain around 30 percent of total international arrivals.
31 BEA Travel and Tourism Satellite Accounts, Sales of U.S. Tourism Industries.
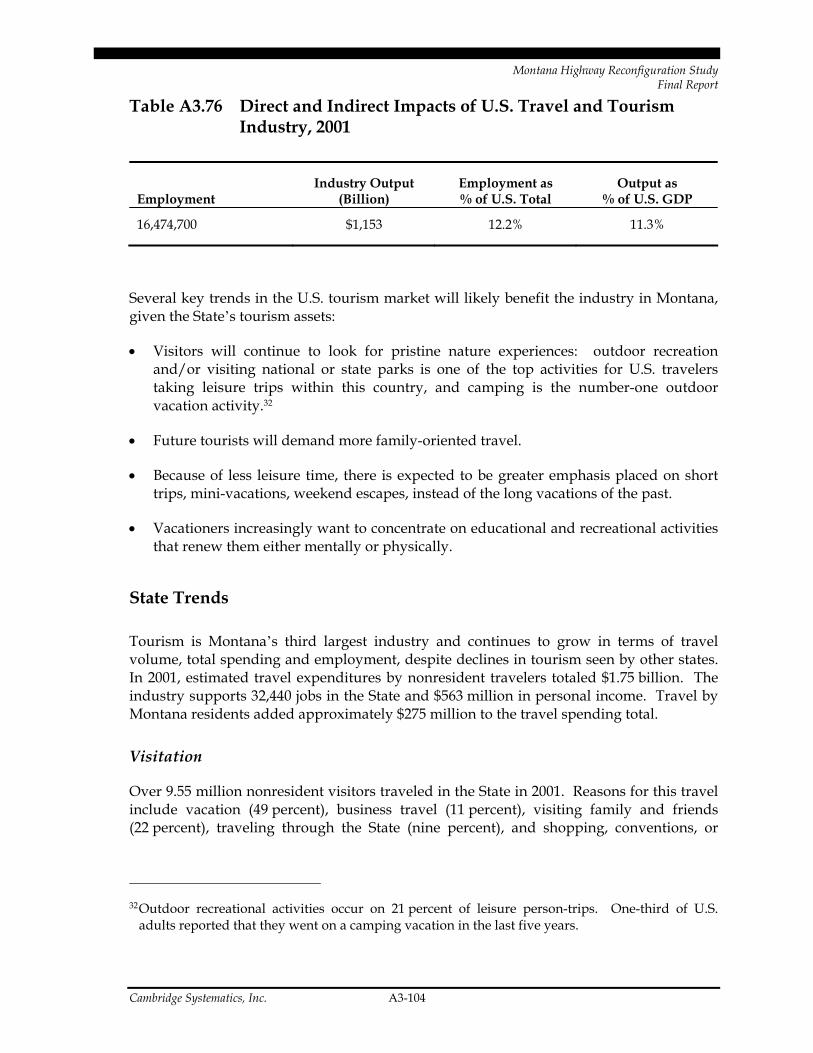
Montana Highway Reconfiguration Study Final Report
Cambridge Systematics, Inc. A3-104
Table A3.76 Direct and Indirect Impacts of U.S. Travel and Tourism Industry, 2001
Employment Industry Output
(Billion) Employment as % of U.S. Total
Output as % of U.S. GDP
16,474,700 $1,153 12.2% 11.3%
Several key trends in the U.S. tourism market will likely benefit the industry in Montana, given the State’s tourism assets:
• Visitors will continue to look for pristine nature experiences: outdoor recreation and/or visiting national or state parks is one of the top activities for U.S. travelers taking leisure trips within this country, and camping is the number-one outdoor vacation activity.32
• Future tourists will demand more family-oriented travel.
• Because of less leisure time, there is expected to be greater emphasis placed on short trips, mini-vacations, weekend escapes, instead of the long vacations of the past.
• Vacationers increasingly want to concentrate on educational and recreational activities that renew them either mentally or physically.
State Trends
Tourism is Montana’s third largest industry and continues to grow in terms of travel volume, total spending and employment, despite declines in tourism seen by other states. In 2001, estimated travel expenditures by nonresident travelers totaled $1.75 billion. The industry supports 32,440 jobs in the State and $563 million in personal income. Travel by Montana residents added approximately $275 million to the travel spending total.
Visitation
Over 9.55 million nonresident visitors traveled in the State in 2001. Reasons for this travel include vacation (49 percent), business travel (11 percent), visiting family and friends (22 percent), traveling through the State (nine percent), and shopping, conventions, or
32 Outdoor recreational activities occur on 21 percent of leisure person-trips. One-third of U.S.
adults reported that they went on a camping vacation in the last five years.

Montana Highway Reconfiguration Study Final Report
Cambridge Systematics, Inc. A3-105
other purposes (nine percent). Over the last 10 years, travel volume to Montana has grown by 2.2 million visitors, a 27 percent increase, as shown in Figure A3.9.
Figure A3.9 Montana Travel Volume, 1991-2001
0
2000
4000
6000
8000
10000
12000
1991 1992 1993 1994 1995 1996 1997 1998 1999 2000 2001
Year
Vis
itors
(tho
usan
ds)
Source: Institute of Tourism and Recreation Research.
Direct and Indirect Impacts and Spending
Direct and indirect economic impacts of nonresident travel in 2001 totaled $1.75 billion for Montana. Travel spending has steadily increased over the last decade; spending in 2001 was 25 percent higher than spending in 1992. Montana ranks 43rd in the nation in terms of total spending by tourists but ranks 13th in terms of per capita tourism spending.
Montana residents spend $1.02 billion annually on pleasure travel, equal to 4.8 percent of personal income. Of this amount, $275 million (27 percent) is spent within the State. Of all pleasure trips taken by Montana residents, 44 percent are day trips within the State, 29 percent are overnight trips within the State, and 27 percent of trips are to destinations outside of Montana.
Employment
Nonresident travel expenditures directly and indirectly contributed to the generation of 32,440 Montana jobs during 2000 (six percent of all jobs in State). Table A3.77 shows that travel-related jobs have increased by almost 5,000 over the last decade, though the industry’s share of total state employment has fallen slightly.
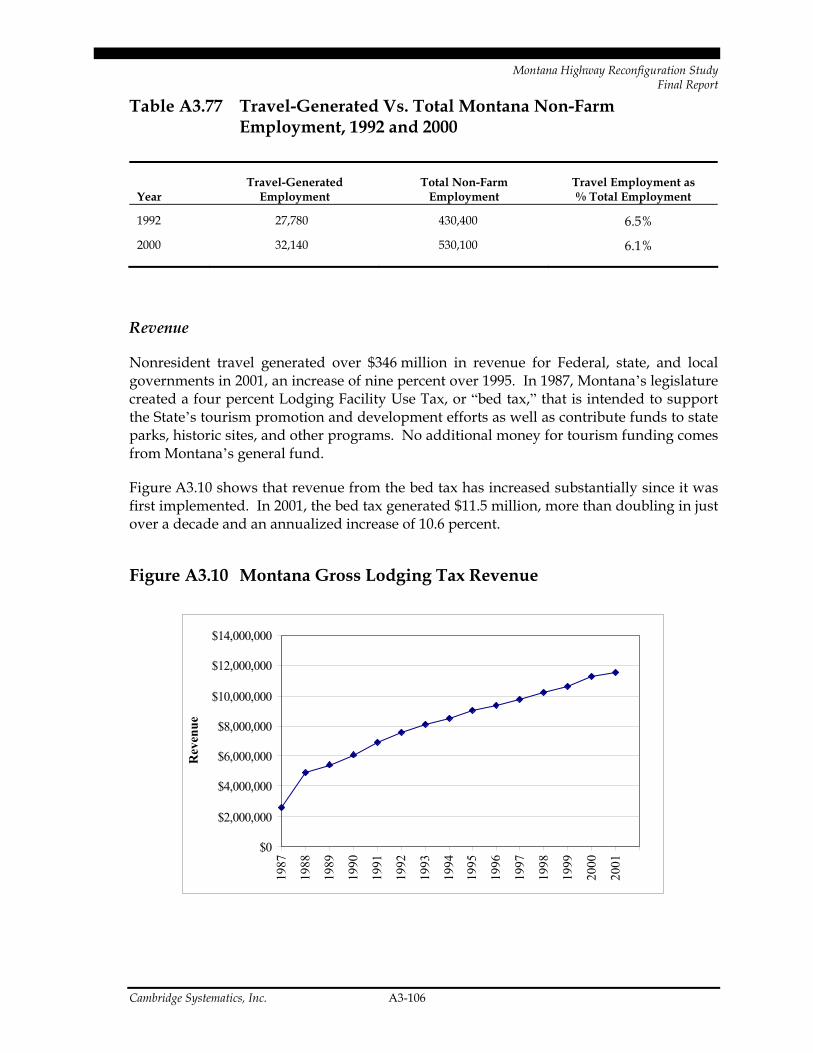
Montana Highway Reconfiguration Study Final Report
Cambridge Systematics, Inc. A3-106
Table A3.77 Travel-Generated Vs. Total Montana Non-Farm Employment, 1992 and 2000
Year Travel-Generated
Employment Total Non-Farm
Employment Travel Employment as % Total Employment
1992 27,780 430,400 6.5%
2000 32,140 530,100 6.1%
Revenue
Nonresident travel generated over $346 million in revenue for Federal, state, and local governments in 2001, an increase of nine percent over 1995. In 1987, Montana’s legislature created a four percent Lodging Facility Use Tax, or “bed tax,” that is intended to support the State’s tourism promotion and development efforts as well as contribute funds to state parks, historic sites, and other programs. No additional money for tourism funding comes from Montana’s general fund.
Figure A3.10 shows that revenue from the bed tax has increased substantially since it was first implemented. In 2001, the bed tax generated $11.5 million, more than doubling in just over a decade and an annualized increase of 10.6 percent.
Figure A3.10 Montana Gross Lodging Tax Revenue
$0
$2,000,000
$4,000,000
$6,000,000
$8,000,000
$10,000,000
$12,000,000
$14,000,000
1987
1988
1989
1990
1991
1992
1993
1994
1995
1996
1997
1998
1999
2000
2001
Rev
enue
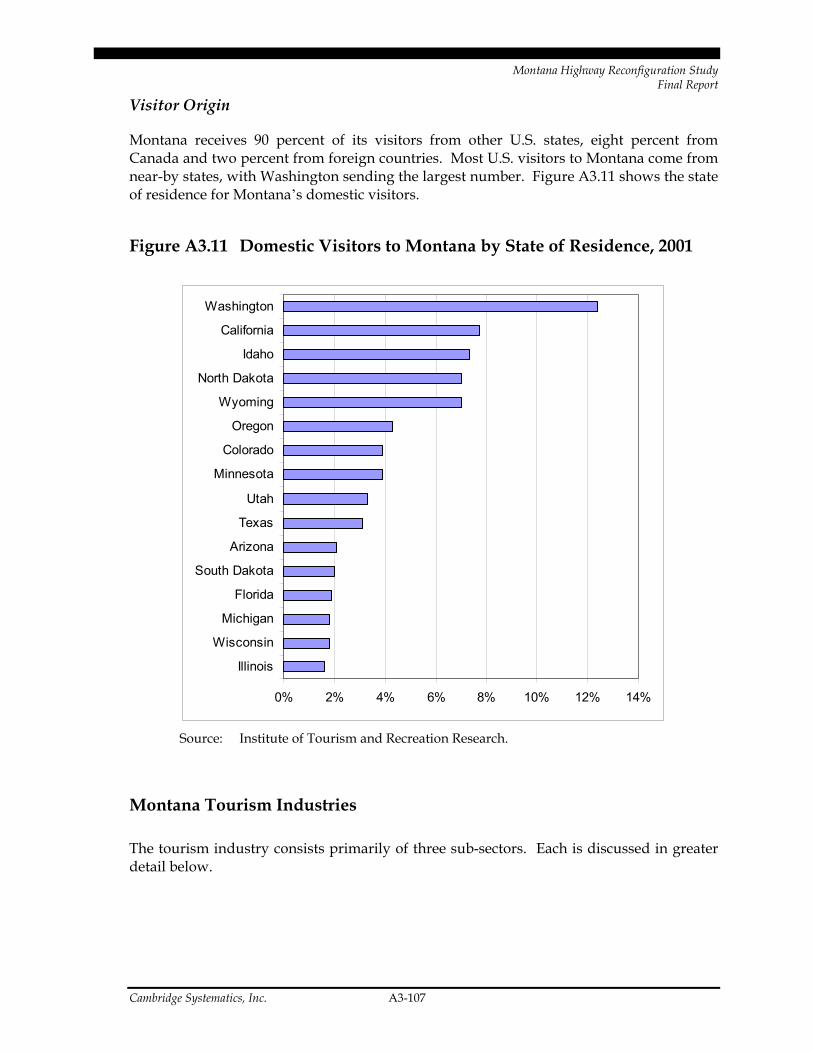
Montana Highway Reconfiguration Study Final Report
Cambridge Systematics, Inc. A3-107
Visitor Origin
Montana receives 90 percent of its visitors from other U.S. states, eight percent from Canada and two percent from foreign countries. Most U.S. visitors to Montana come from near-by states, with Washington sending the largest number. Figure A3.11 shows the state of residence for Montana’s domestic visitors.
Figure A3.11 Domestic Visitors to Montana by State of Residence, 2001
0% 2% 4% 6% 8% 10% 12% 14%
Illinois
Wisconsin
Michigan
Florida
South Dakota
Arizona
Texas
Utah
Minnesota
Colorado
Oregon
Wyoming
North Dakota
Idaho
California
Washington
Source: Institute of Tourism and Recreation Research.
Montana Tourism Industries
The tourism industry consists primarily of three sub-sectors. Each is discussed in greater detail below.
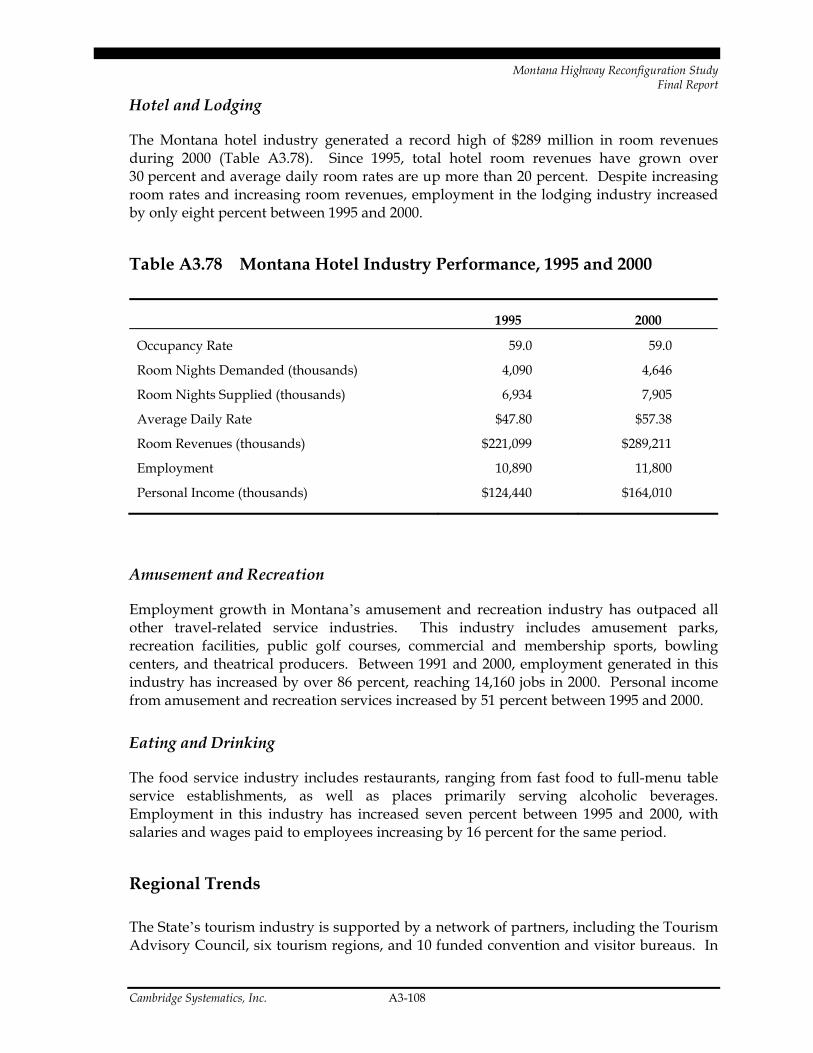
Montana Highway Reconfiguration Study Final Report
Cambridge Systematics, Inc. A3-108
Hotel and Lodging
The Montana hotel industry generated a record high of $289 million in room revenues during 2000 (Table A3.78). Since 1995, total hotel room revenues have grown over 30 percent and average daily room rates are up more than 20 percent. Despite increasing room rates and increasing room revenues, employment in the lodging industry increased by only eight percent between 1995 and 2000.
Table A3.78 Montana Hotel Industry Performance, 1995 and 2000
1995 2000
Occupancy Rate 59.0 59.0
Room Nights Demanded (thousands) 4,090 4,646
Room Nights Supplied (thousands) 6,934 7,905
Average Daily Rate $47.80 $57.38
Room Revenues (thousands) $221,099 $289,211
Employment 10,890 11,800
Personal Income (thousands) $124,440 $164,010
Amusement and Recreation
Employment growth in Montana’s amusement and recreation industry has outpaced all other travel-related service industries. This industry includes amusement parks, recreation facilities, public golf courses, commercial and membership sports, bowling centers, and theatrical producers. Between 1991 and 2000, employment generated in this industry has increased by over 86 percent, reaching 14,160 jobs in 2000. Personal income from amusement and recreation services increased by 51 percent between 1995 and 2000.
Eating and Drinking
The food service industry includes restaurants, ranging from fast food to full-menu table service establishments, as well as places primarily serving alcoholic beverages. Employment in this industry has increased seven percent between 1995 and 2000, with salaries and wages paid to employees increasing by 16 percent for the same period.
Regional Trends
The State’s tourism industry is supported by a network of partners, including the Tourism Advisory Council, six tourism regions, and 10 funded convention and visitor bureaus. In
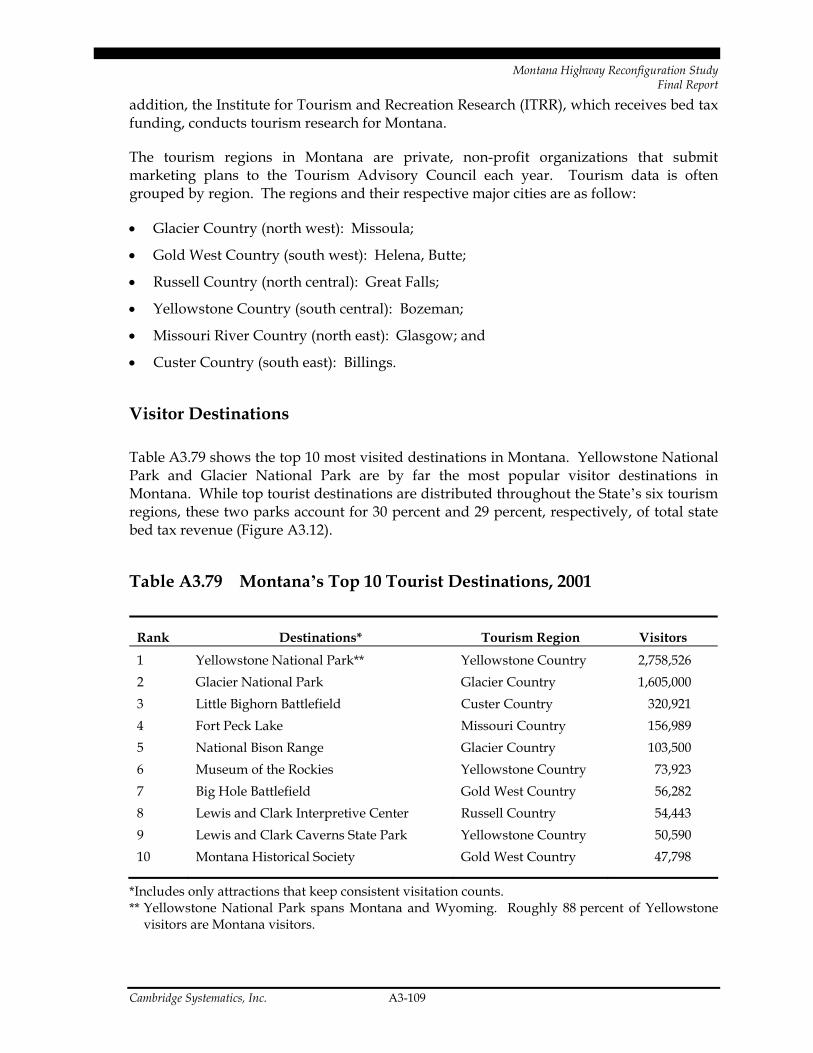
Montana Highway Reconfiguration Study Final Report
Cambridge Systematics, Inc. A3-109
addition, the Institute for Tourism and Recreation Research (ITRR), which receives bed tax funding, conducts tourism research for Montana.
The tourism regions in Montana are private, non-profit organizations that submit marketing plans to the Tourism Advisory Council each year. Tourism data is often grouped by region. The regions and their respective major cities are as follow:
• Glacier Country (north west): Missoula;
• Gold West Country (south west): Helena, Butte;
• Russell Country (north central): Great Falls;
• Yellowstone Country (south central): Bozeman;
• Missouri River Country (north east): Glasgow; and
• Custer Country (south east): Billings.
Visitor Destinations
Table A3.79 shows the top 10 most visited destinations in Montana. Yellowstone National Park and Glacier National Park are by far the most popular visitor destinations in Montana. While top tourist destinations are distributed throughout the State’s six tourism regions, these two parks account for 30 percent and 29 percent, respectively, of total state bed tax revenue (Figure A3.12).
Table A3.79 Montana’s Top 10 Tourist Destinations, 2001
Rank Destinations* Tourism Region Visitors
1 Yellowstone National Park** Yellowstone Country 2,758,526 2 Glacier National Park Glacier Country 1,605,000 3 Little Bighorn Battlefield Custer Country 320,921 4 Fort Peck Lake Missouri Country 156,989 5 National Bison Range Glacier Country 103,500 6 Museum of the Rockies Yellowstone Country 73,923 7 Big Hole Battlefield Gold West Country 56,282 8 Lewis and Clark Interpretive Center Russell Country 54,443 9 Lewis and Clark Caverns State Park Yellowstone Country 50,590 10 Montana Historical Society Gold West Country 47,798
*Includes only attractions that keep consistent visitation counts. ** Yellowstone National Park spans Montana and Wyoming. Roughly 88 percent of Yellowstone
visitors are Montana visitors.

Montana Highway Reconfiguration Study Final Report
Cambridge Systematics, Inc. A3-110
Figure A3.12 Lodging Tax Revenue by Tourism Region, 2001
Custer$2,019,523
Yellowstone$3,334,238
Russell$1,070,945
Missouri River$205,695
Gold West$1,421,377
Glacier$3,487,764
Given the huge draw of Glacier and Yellowstone National Parks, it is important to explore the visitor characteristics of these two parks in more detail. A recent report by the Institute of Tourism and Recreation Research found 62 percent of nonresident visitors to Montana visit Glacier, Yellowstone, or both parks. Although most of Yellowstone is located in Wyoming, most visitors to the park (88 percent) stay in Montana, with an average stay of four nights.
Visitors to Glacier National Park tend to come from the west, with 43 percent from Alberta, California, Washington, Idaho, Oregon, and British Columbia. Visitors to Yellowstone National Park represent more states and provinces than Glacier, with the largest portion from California (13 percent) and Washington (10 percent). At both parks, one fifth of the visitors fly on a portion of their trip. Of the fly-in visitors to Glacier National Park, 16 percent rent cars, mostly in Montana or Washington. Of the fly-in visitors to Yellowstone, 23 percent rent cars, mostly in Montana or Utah.
Many visitors to Glacier National Park also visit Flathead Lake (49 percent), the Lewis and Clark Interpretive Center (10 percent), the National Bison Range (nine percent), and Little Bighorn Battlefield (eight percent). Many visitors to Yellowstone National Park also visit Little Bighorn Battlefield (19 percent), the Museum of the Rockies (eight percent), Bighorn Canyon Recreation Area (seven percent), and the Lewis and Clark Interpretive Center (six percent).
Nonresident visitors who did not visit either of the national parks (38 percent) typically spend their time along the Interstate corridors. First-time visitors tend to “do it all” while in Montana, visiting both parks and many attractions between them. As such, the Institute
Montana Highway Reconfiguration Study Final Report
Cambridge Systematics, Inc. A3-111
of Tourism and Recreation Research report concludes that it is important to develop travel corridors to promote the ease of visiting both parks.
Tourism and Transportation
Most nonresidents visitors use road travel to access destinations within Montana. Approximately one-fifth of nonresident visitors to Montana fly on some portion of their trip, with 43 percent renting a car in Montana and 12 percent renting a car in Utah or Wyoming. Amtrak provides rail transit service across the State, running the “Empire Builder” train daily from Chicago to Seattle along the Hi-line parallel to U.S. Route 2. Amtrak ridership declined substantially between 1998 and 2001, with boarding and deboardings falling by almost 15 percent. Nonetheless, some communities along the Hi-Line are developing local tourism strategies based on Amtrak service.
Interviews with tourism-related businesses in the State confirm that visitors are using both air and roadway to access destinations in the State, with limited use of rail. In the Yellowstone National Park region, firms have noted that the narrowness and poor conditions of some two-lane highways can create problems for tourists trying to access destinations. In the Custer region, tourism businesses have noted the poor (gravel) state of highways and the lack of north-south connectivity. Some in the industry feel that paving specific roads in that region would have a major economic impact by improving accessibility to the region’s destinations, as well as promoting growth in other industries. In the Missoula region, industry contacts have suggested that the road infrastructure is not an impediment to tourism growth, although north-south connectivity is felt to be inadequate. All Montana’s tourism regions recognize air travel as an important mode for visitors. Finally, the lack of air traffic in the Missoula region has been cited as an impediment to tourism growth there.
15.0 Military Activity
Industry Overview
The military sector employs over 8,200 workers in Montana (see Table A3.80) and directly accounts for about two percent of the Montana economy measured by employment and gross state product (GSP). Moreover, although the impact of direct military spending in the State has declined in the last decade, the most recent defense appropriation bill provides for $15.6 million for military construction and another $26 million in defense-related projects in the State.

Montana Highway Reconfiguration Study Final Report
Cambridge Systematics, Inc. A3-112
Table A3.80 The Military in the Montana’s Economy, 2000
Year 1990 1995 2000
Employment 10,516 9,540 8,263
GSP (millions of $1990s) $263 $259 $249
Source: County Business Patterns, Bureau of Economic Analysis.
The major military installation in Montana is the Malstrom Air Force Base (MAFB) in Great Falls, which directly employs almost 3,700 of the 8,000 plus uniformed and civilian defense employees in the State. The mission of the MAFB is to maintain and be ready to operate 200 ICBM-3 missiles, which are spread over 23,500 square miles in nine counties of central Montana. In addition to the main base, Malstrom includes 20 missile alert facilities. Malstrom is in continuous operation 24 hours per day, every day of the year.
Other concentrations of military employment include the 120th Fighter Wing of the Montana Air National Guard co-located at the Great Falls International Airport and Fort Harrison outside of Helena. Fort Harrison is the headquarters of the State’s Army and Air Force National Guard, and is a major training center. Statewide, the army National Guard employs 477 full-time staff and has a total strength of 2,500, of which 889 are based at Fort Harrison.33
National and State Trends
Military spending is a function of national policy, and therefore the distribution of military employment and income among the states depends on policy-makers and administrators in Washington D.C. more than local inducements. Montana’s western location, spacious land area, and sparse population provide advantages for certain military activities. Even following the closure of the Glasgow Air Force Base, the military has a stronger presence in the Montana economy than overall in the nation when measured by employment and gross state product (see Table A3.81).
33 These employment numbers do not include civilian contractors. Over 950 contractors in various
industries are employed at Malstrom Air Force Base, for example. Some of these workers are counted in other industry profiles.

Montana Highway Reconfiguration Study Final Report
Cambridge Systematics, Inc. A3-113
Table A3.81 Military Employment and Gross State Product in the United States and Montana 1990 – 2000
Military Employment as Percent of Overall Economy 1990 1995 2000
Military Employment
Change 1990-2000
% of Montana Economy 2.4% 1.9% 1.5% -21.4%
% of U.S. Economy 1.9% 1.5% 1.2% -23.7%
Military Gross State Product As Percent of Overall Economy 1990 1995 2000
GSP Change 1990-2000
(in 1990 Dollars)
% of Montana Economy 2.0% 1.7% 1.5% -5.3%
% of U.S. Economy 1.4% 1.2% 1.0% -10.1%
Source: U.S. Bureau of Economic Analysis.
National defense budgets in real terms, and therefore military employment, declined annually from 1989 through 1998, with the exception of the Gulf War period in 1991 to 1992, and began increasing again in small increments. National defense spending has been growing significantly in the aftermath of 9/11, however, and Montana’s portion of the most recent defense appropriation represents approximately a 12 percent boost above recorded 2000 GSP levels for the State. In addition, the Department of Defense projects real increases though 2007 (see Table A3.82).
Table A3.82 Department of Defense Outlays for the United States
Year Outlay in Millions
of 2003 Dollars
1990 $409,471
1995 $316,410
2000 $305,160
2003 $360,693
2007 $384,209
Source: National Defense Budget Estimates for FY 2003, U.S. Department of Defense.

Montana Highway Reconfiguration Study Final Report
Cambridge Systematics, Inc. A3-114
Sub-state Locational Patterns
The core of the military presence is in Great Falls (Cascade County) and secondarily in Helena (Lewis and Clark County). The two largest military establishments in Montana are located in Great Falls. MAFB, headquartered at the outskirts of the city, includes 3,670 uniformed and civilian employees and also houses 953 private contract workers. However, the 200 Intercontinental Ballistics Missiles overseen by MAFB personnel are spread in silos across 23,500 acres in nine counties of central and northern Montana. The 120th fighter wing of the Montana Air National Guard is based at the Great Falls Airport, and employs 350 full-time personnel, which swells to over 1,000 during periodic Guard drills. Nine counties in Montana are associated with the Malstrom Air force Base:
1. Cascade,
2. Choteau,
3. Fergus,
4. Judith Basin,
5. Lewis and Clark,
6. Pondera,
7. Teton,
8. Toole, and
9. Wheatland.
Fort Harrison in Helena (Lewis and Clark County) is the headquarters of the Montana’s Army National Guard (ANG). The strength of the ANG in Helena is 889 (full and part-time) out of a total force of 2,500 statewide.
Outside of concentrations in Great Falls and Helena, regional installations are relatively small, including small units and Army National Guard armories with a core of full-time staff augmented by periodic call-ups and drills.
National Guard employment is spread across Montana. In addition to the state headquarters at Fort Harrison, key guard armories (of 30 armories in the State) are located in Sidney and Culberston in eastern Montana and Libby in the northwest corner of the State. The following 10 locations of key units and armories of the Army National Guard are:
1. Helena
2. Billings
3. Butte
4. Culbertson
5. Great Falls
6. Kalispell
7. Libby
8. Malta
9. Miles City
10. Missoula
During the peak of the cold-war, Montana also housed the Glasgow Air Force Base in northeastern Montana on Highway 2, which was part of the Strategic Air Command. When the base closed, 16,000 people left the Glasgow area.
Montana Highway Reconfiguration Study Draft Final Report
Cambridge Systematics, Inc. A3-115
The Role of Civilian Transportation in Performance of Military Activities
The military relies on Montana highways to move personnel and heavy equipment. Informants note that the condition of Montana’s roadways are generally good, but need improvement. They also note that military presence in Montana, meaning the stationing of troops and investments in military installations, is a function of national policy and is not directly dependent on the adequacy of the State’s roadway network. With recent defense appropriations, MAFB is now modernizing its facilities; as one informant put it, “we’re not going anywhere.”
In many ways, the military sector is like any other sector of the economy. Suppliers ship products by truck such as furniture, paper, computers, and tools. Employees, both civilian and uniformed, drive to work. In addition, the size of Montana and dispersion of some auxiliary units and facilities induces considerable roadway travel for employees and suppliers.
The major difference between civilian and military transportation needs on public roads is that the missions of Malstrom Air Force Base and the Army and Air National Guards inherently require substantial intrastate transportation over Montanan highways and other roadways. With reserves, major transportation needs include moving equipment and personnel from Fort Harrison in Helena and the 120th Fighter Wing in Great Falls to armories and recruiting locations across the State, as well as between locations that do not involve the main bases. Products moved over Montana’s roadways can range from mundane supplies and light arms to heavy equipment. An informant from the Air National Guard mentioned that the Guard hauls airplanes overland to set up recruiting expeditions. Malstrom Air Force Base relies on public roadways to administer its facilities that extend for 23,500 square miles.
Base personnel stationed at the Malstrom Air Force Base drive 7.2 million miles per year in heavy vehicles on civilian roadways. The lightest vehicles used are Ford Expeditions and the heaviest are 18 wheeler “transporter erectors” that can transport an ICBM-3 missile. Roadway transportation is critical to transport personnel for work-shift rotations, security, maintenance crews and to provide for other operational needs (which might include transporting goods and staff for routine needs such as bringing meals or office supplies to the field). In addition, roadways are used to transport missiles from their silos to maintenance and repair facilities when warranted.
Over its nine-county operational area, MAFB uses 6.2 million linear miles of civilian roadways, of which two million are paved and 4.2 million miles are gravel roads. For safety concerns, informants at the base report that paving additional roadways is an important need, and is the most significant “civilian” transportation priority for the base. As a backup, Malstrom uses helicopters for transportation if the gravel roadways are not passable due to poor surface conditions induced by weather.
Informants at the Great Falls-based 120th Fighter Wing of the Montana Air National Guard report that routine supplies are delivered by out-of-state commercial carriers. The base owns semi-tractor trailer tucks to haul heavy goods, including jet engines and other air
Montana Highway Reconfiguration Study Draft Final Report
Cambridge Systematics, Inc. A3-116
support equipment. About 50 percent of traffic generated by the 120th Fighter Wing is north-south along I-15. Other major traffic flows are east-west from Great Falls to Billings.
The Army National Guard transports soldiers and equipment along Montana’s roadways in trucks. The Guard heavily uses Interstates 15, 90 and 94, and an informant notes that the stretch of I-94 between Billings and Glendive is particularly important.
The Guard armories in Montana are close to small cities, but out of town, or as one informant put it, “off the beaten path.” As a consequence, the Guard relies on state highways and county roads more than established Interstates, although in an informant’s opinion the roadways between Helena and the armories are in “as close to a straight line as could be hoped.” Key non-Interstate roadways for the Army National Guard include Routes 93, 200, 87, and 2.
Potential Transportation Constraints to Military Activity
Transportation impediments reported by the military in Montana include:
• Low overpasses on secondary roads, which at times impede hauling heavy equipment.
• Congestion caused by farm implements on roadways. The farming vehicles are difficult to pass with semi-tractor trailers.
• The winter roadway conditions of Highway 2 cause safety concerns.
• Gravel roads in central Montana are a safety concern when transporting heavy equipment.
• U.S. routes (not Interstates) and state highways are important arteries for the National Guard, but can be dangerous when using large vehicles. These roadways include Routes 93, 200, 87, and 2.
National defense policies and geography appear more important than roadways in Montana in terms of influencing location decisions of the United States military in the State. However, it is clear that civilian roadways play a critical role in allowing the Air Force and Montana Air and Army National Guards to efficiently accomplish their missions. In this respect, transportation costs were never mentioned as an important issue, but safety and congestion were reported to be significant issues.
16.0 References
1. Rogers, R. T., “Structural Change in U.S. Food Manufacturing, 1958 to 1997,” Department of Resource Economics, University of Massachusetts-Amherst.

Montana Highway Reconfiguration Study Draft Final Report
Cambridge Systematics, Inc. A3-117
2. “1997 Commodity Flow Survey: Montana,” Department of Transportation (Bureau of Transportation Statistics) and Department of Census (December 1999).
3. “USDA Agricultural Baseline Projections to 2011,” U.S. Department of Agriculture (February 2002).
4. “The Global Cement Report,” summary available on www.cemnet.co.uk.

Montana Highway Reconfiguration Study Final Report
Cambridge Systematics, Inc./ Economic Development Research Group, Inc. A4-1
Appendix A4. Business Attraction Model
1.0 Objectives
Concept Definition
The analysis of economic benefits within HEAT makes a distinction between “business expansion” and “business attraction.” The difference between these terms is quite impor-tant, though the words in these labels can be misleading. Basically,
• “Business expansion” impacts, in the context of this study, refer to economic growth that is due solely to transportation cost savings associated with reduced time and expense – for existing trips on Montana roads that are generated by existing business activities located within Montana.
• In contrast, “business attraction” impacts, in the context of this study, refer to addi-tional economic growth that is above and beyond that itemized above. This is specifi-cally referring to business growth attributable to improved strategic connections and accessibility to locations, allowing for wider supply and product delivery areas, larger labor market areas, and economies of scale in business production because of those expanded markets. (All of these effects can lead to additional business investment in Montana to create business activity that is not currently occurring, though that busi-ness growth may actually occur either at new business entities moving into the State or at existing business entities in the State.)
Methodology Approach
The business expansion analysis developed prior to the development of HEAT and the Business Attraction Model in HEAT use very different methods. The business expansion impacts are automatically estimated by the REMI economic simulation model as a result of changing business operating costs – specifically changing the dollar magnitude of highway system user costs for the affected business sectors in the affected areas. The business attraction impacts, in contrast, are estimated separately. They are dependent on the location of highway investments, the linkages such investments create, and the effect of such investments on market reach of businesses located in affected areas. These esti-mates of direct impacts on business attraction are analyzed independently and then input

Montana Highway Reconfiguration Study Final Report
Cambridge Systematics, Inc./ Economic Development Research Group, Inc. A4-2
to the economic simulation model in order to calculate the total (direct, indirect, and induced) impacts on the economy analysis.
The business attraction module embedded in HEAT was designed by Economic Development Research Group to consider how highway investments will influence busi-ness location decisions, given that a variety of other (non-highway) factors also affect business location decisions. The analysis utilizes a combination of inputs, including data on highway and non-highway business location attraction factors and trends in the local and national economies. The information is then used as a basis for calculating potential highway impacts on business attraction. HEAT includes the automated business attrac-tion analysis tool to conduct these calculations. That tool formalizes a series of calcula-tions, each consistent with accepted economic development analysis practices.
Figure A.4.1 shows the position of the business attraction analysis in the sequence of steps used to generate the direct economic benefits that fed into the REMI model.
Figure A.4.1 Elements of the Economic Impact Analysis System
Existing Business Savings
Existing Business Savings
New Business Attraction
New Business Attraction
REMI BridgeREMI
BridgeEconomic
ModelEconomic
Model
Highway NetworkHighway Network
Geographic Info SystemGeographic Info System
Source: Economic Development Research Group, Inc.
2.0 Estimation of Business Attraction Impacts
Overview of Business Attraction Analysis
The business attraction model is comprised of eight modules (see Figure A.4.2). They are:
• TDG – Transportation Data and GIS,
• PIN – Primary Impact Nodes,
• MAR – Market Access Rating,
• ACS – Attraction Competitiveness Screener,
• EPS – Economic Performance Screener,
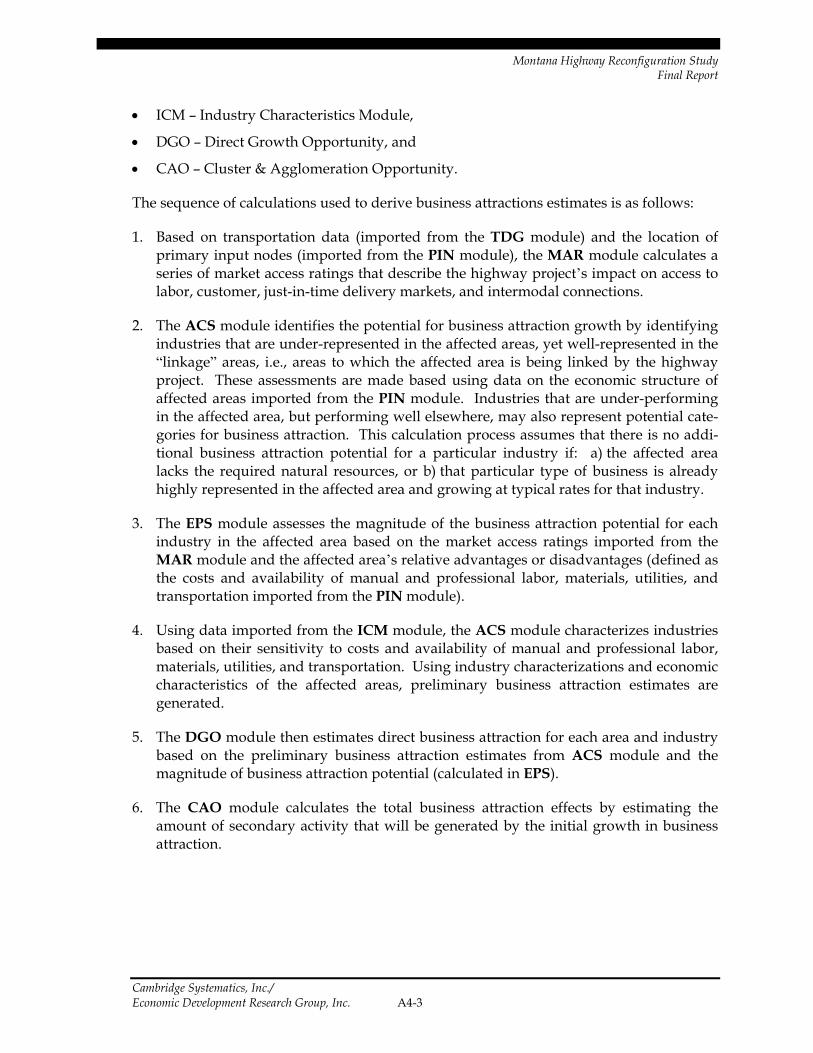
Montana Highway Reconfiguration Study Final Report
Cambridge Systematics, Inc./ Economic Development Research Group, Inc. A4-3
• ICM – Industry Characteristics Module,
• DGO – Direct Growth Opportunity, and
• CAO – Cluster & Agglomeration Opportunity.
The sequence of calculations used to derive business attractions estimates is as follows:
1. Based on transportation data (imported from the TDG module) and the location of primary input nodes (imported from the PIN module), the MAR module calculates a series of market access ratings that describe the highway project’s impact on access to labor, customer, just-in-time delivery markets, and intermodal connections.
2. The ACS module identifies the potential for business attraction growth by identifying industries that are under-represented in the affected areas, yet well-represented in the “linkage” areas, i.e., areas to which the affected area is being linked by the highway project. These assessments are made based using data on the economic structure of affected areas imported from the PIN module. Industries that are under-performing in the affected area, but performing well elsewhere, may also represent potential cate-gories for business attraction. This calculation process assumes that there is no addi-tional business attraction potential for a particular industry if: a) the affected area lacks the required natural resources, or b) that particular type of business is already highly represented in the affected area and growing at typical rates for that industry.
3. The EPS module assesses the magnitude of the business attraction potential for each industry in the affected area based on the market access ratings imported from the MAR module and the affected area’s relative advantages or disadvantages (defined as the costs and availability of manual and professional labor, materials, utilities, and transportation imported from the PIN module).
4. Using data imported from the ICM module, the ACS module characterizes industries based on their sensitivity to costs and availability of manual and professional labor, materials, utilities, and transportation. Using industry characterizations and economic characteristics of the affected areas, preliminary business attraction estimates are generated.
5. The DGO module then estimates direct business attraction for each area and industry based on the preliminary business attraction estimates from ACS module and the magnitude of business attraction potential (calculated in EPS).
6. The CAO module calculates the total business attraction effects by estimating the amount of secondary activity that will be generated by the initial growth in business attraction.
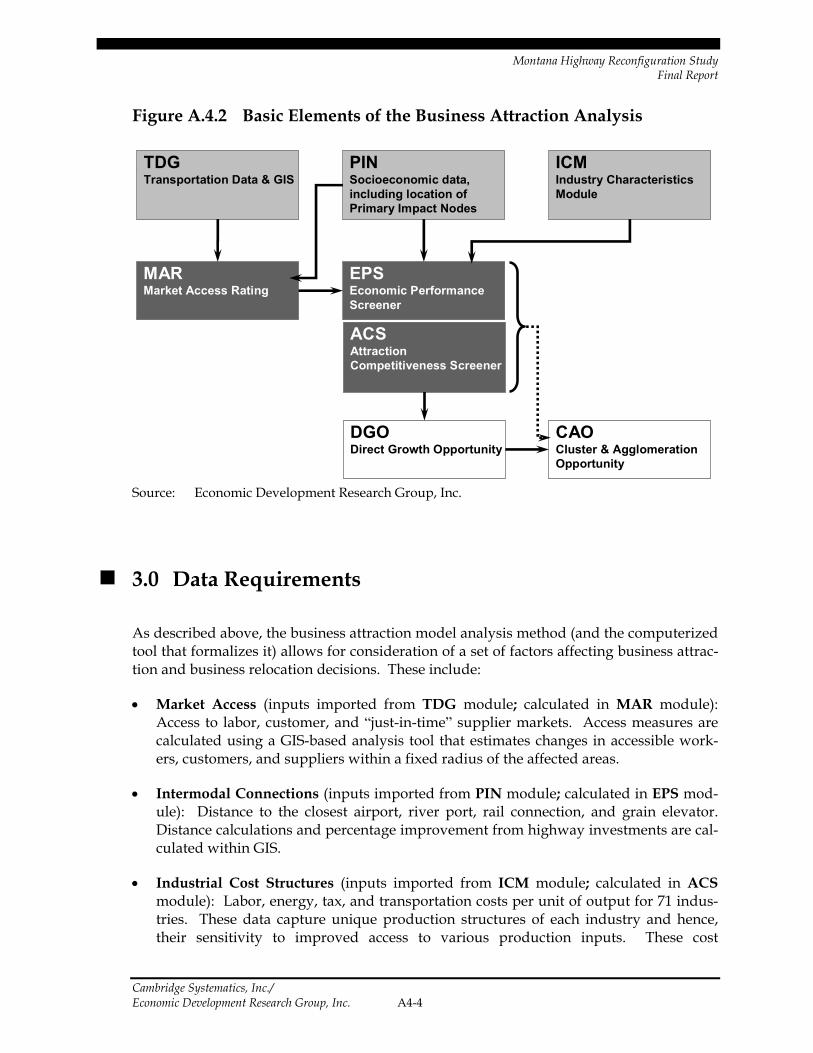
Montana Highway Reconfiguration Study Final Report
Cambridge Systematics, Inc./ Economic Development Research Group, Inc. A4-4
Figure A.4.2 Basic Elements of the Business Attraction Analysis
TDGTransportation Data & GIS
PINSocioeconomic data, including location of Primary Impact Nodes
ICMIndustry Characteristics Module
MARMarket Access Rating
EPSEconomic Performance Screener
ACSAttraction Competitiveness Screener
CAOCluster & Agglomeration Opportunity
DGODirect Growth Opportunity
Source: Economic Development Research Group, Inc.
3.0 Data Requirements
As described above, the business attraction model analysis method (and the computerized tool that formalizes it) allows for consideration of a set of factors affecting business attrac-tion and business relocation decisions. These include:
• Market Access (inputs imported from TDG module; calculated in MAR module): Access to labor, customer, and “just-in-time” supplier markets. Access measures are calculated using a GIS-based analysis tool that estimates changes in accessible work-ers, customers, and suppliers within a fixed radius of the affected areas.
• Intermodal Connections (inputs imported from PIN module; calculated in EPS mod-ule): Distance to the closest airport, river port, rail connection, and grain elevator. Distance calculations and percentage improvement from highway investments are cal-culated within GIS.
• Industrial Cost Structures (inputs imported from ICM module; calculated in ACS module): Labor, energy, tax, and transportation costs per unit of output for 71 indus-tries. These data capture unique production structures of each industry and hence, their sensitivity to improved access to various production inputs. These cost

Montana Highway Reconfiguration Study Final Report
Cambridge Systematics, Inc./ Economic Development Research Group, Inc. A4-5
structures were developed from publicly available information from the U.S. Bureau of Economic Analysis, U.S. Department of Energy, and studies of business locations.
• Location Cost Considerations (inputs imported from PIN module; calculated in EPS module): Costs per unit for energy, labor, taxes, and transportation for each county in Montana; the States of Idaho, Wyoming, North Dakota, and South Dakota; and the entire U.S. Data sets were developed from publicly available information like U.S. Department of Commerce and U.S. Department of Energy.
• Business Mix Considerations (inputs imported from PIN module; calculated in ACS module): Captures strengths, weaknesses, and specialties of the economic areas. Data set includes current and past employment in 71 industries and demographic informa-tion (e.g., population, labor force participation rates, education levels) for each county in Montana; the States of Idaho, Wyoming, North Dakota, and South Dakota; and the entire U.S. Data sets developed from publicly available information, including the U.S. Department of Census, and data purchased from private sources.
• Input-Output Relationships (inputs imported from ICM module; calculated in CAO module): Captures the second-round effects of an increase in business attraction. Spe-cifically, calculates the growth in demand for inputs generated by the predicted increase in business attraction. Input-output data were gathered from publicly avail-able information released by the U.S. Bureau of Economic Analysis.
4.0 Model Calibration for Montana
The model was calibrated for Montana by incorporating economic information for the counties of Montana and the surrounding states. The model was then tested by running highway investment scenarios and analyzing the outputs from each sub-module in the BAM to assure the each sub-module was working correctly. After sub-modules were tested for accuracy and consistency, scenario results were compared with versions of the BAM created for other areas. Results from the MT BAM were then analyzed closely to ensure that differences in estimated impacts are the result of specific characteristics of the Montana economy, including the economic bases of its counties and the relative costs of production inputs.
5.0 Model Sensitivities and Limitations
The BAM estimates employment impacts associated with new business attraction in areas affected by highway investments. Actual business location, in any area, will be strongly influenced by macroeconomic cycles and the overall level of investment nationally. In addition, because BAM estimates extrapolate from past trends, they do not incorporate

Montana Highway Reconfiguration Study Final Report
Cambridge Systematics, Inc./ Economic Development Research Group, Inc. A4-6
activities in entirely new sectors. Both of these factors will decrease the accuracy of BAM estimates.

Montana Highway Reconfiguration Study Final Report
Cambridge Systematics, Inc. A5-1
Appendix A5. Cost Estimation Methodology
1.0 General Description
This cost estimation spreadsheet was designed to assist planning staff in comparing approximate probable costs to construct various project alternatives. While allowing the flexibility to change roadway widths and typical section thicknesses, this spreadsheet will perform quantity calculations and incorporate them into MDT’s standard cost estimation spreadsheet format utilizing the most common standard bid item numbers. Unit bid prices may be modified to match current versions of MDT’s average price items catalog or district specific bid tabulations. A separate maintenance and operating cost worksheet is also included which performs a cost analysis over a 30-year default time period based on inputs for construction dates and unit operation and maintenance costs.
The bid items and prices considered in this cost estimation spreadsheet are shown in Table A5.1.
All item numbers listed above coincide with MDT’s Contract Plans Section Items Catalog. Current average bid prices are tabulated in this catalog and are updated every six months. Bid prices for items that do not have an item number are determined by comparing recent bid tabulations for similar work. These bid tabulations can be found on MDT’s web site at: http://www.mdt.state.mt.us/cntrct/contract.htm.
Please note that this cost estimation spreadsheet was developed to handle specific road-way characteristics. If a project has varying characteristics from beginning to end (i.e., 30 percent mountainous and 20 percent urban), the cost module will need to be run multi-ple times for an individual project.
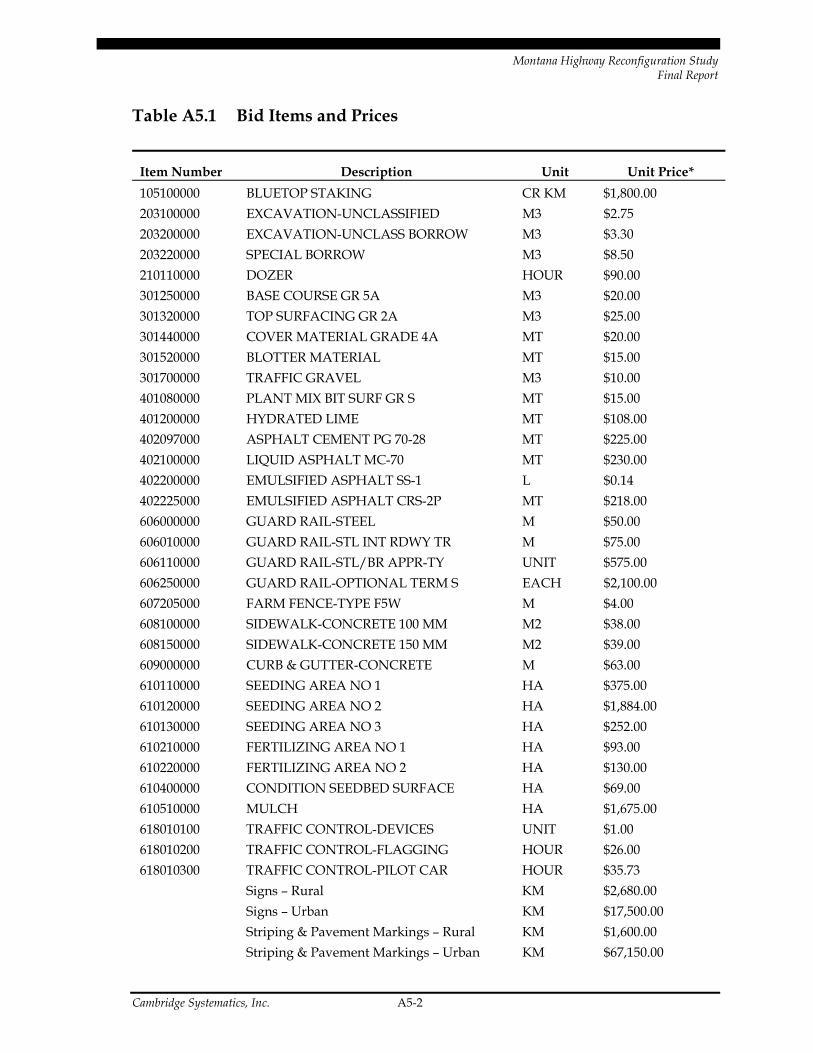
Montana Highway Reconfiguration Study Final Report
Cambridge Systematics, Inc. A5-2
Table A5.1 Bid Items and Prices
Item Number Description Unit Unit Price* 105100000 BLUETOP STAKING CR KM $1,800.00 203100000 EXCAVATION-UNCLASSIFIED M3 $2.75 203200000 EXCAVATION-UNCLASS BORROW M3 $3.30 203220000 SPECIAL BORROW M3 $8.50 210110000 DOZER HOUR $90.00 301250000 BASE COURSE GR 5A M3 $20.00 301320000 TOP SURFACING GR 2A M3 $25.00 301440000 COVER MATERIAL GRADE 4A MT $20.00 301520000 BLOTTER MATERIAL MT $15.00 301700000 TRAFFIC GRAVEL M3 $10.00 401080000 PLANT MIX BIT SURF GR S MT $15.00 401200000 HYDRATED LIME MT $108.00 402097000 ASPHALT CEMENT PG 70-28 MT $225.00 402100000 LIQUID ASPHALT MC-70 MT $230.00 402200000 EMULSIFIED ASPHALT SS-1 L $0.14 402225000 EMULSIFIED ASPHALT CRS-2P MT $218.00 606000000 GUARD RAIL-STEEL M $50.00 606010000 GUARD RAIL-STL INT RDWY TR M $75.00 606110000 GUARD RAIL-STL/BR APPR-TY UNIT $575.00 606250000 GUARD RAIL-OPTIONAL TERM S EACH $2,100.00 607205000 FARM FENCE-TYPE F5W M $4.00 608100000 SIDEWALK-CONCRETE 100 MM M2 $38.00 608150000 SIDEWALK-CONCRETE 150 MM M2 $39.00 609000000 CURB & GUTTER-CONCRETE M $63.00 610110000 SEEDING AREA NO 1 HA $375.00 610120000 SEEDING AREA NO 2 HA $1,884.00 610130000 SEEDING AREA NO 3 HA $252.00 610210000 FERTILIZING AREA NO 1 HA $93.00 610220000 FERTILIZING AREA NO 2 HA $130.00 610400000 CONDITION SEEDBED SURFACE HA $69.00 610510000 MULCH HA $1,675.00 618010100 TRAFFIC CONTROL-DEVICES UNIT $1.00 618010200 TRAFFIC CONTROL-FLAGGING HOUR $26.00 618010300 TRAFFIC CONTROL-PILOT CAR HOUR $35.73 Signs – Rural KM $2,680.00 Signs – Urban KM $17,500.00 Striping & Pavement Markings – Rural KM $1,600.00 Striping & Pavement Markings – Urban KM $67,150.00

Montana Highway Reconfiguration Study Final Report
Cambridge Systematics, Inc. A5-3
Table A5.1 Bid Items and Prices (continued)
Item Number Description Unit Unit Price* Drainage Pipe KM $75,000.00 New Interchange – Rural LS $7,500,000.00 New Interchange – Urban LS $12,000,000.00 Remove Interchange LS $50,000.00 New Overpass LS $1,000,000.00 Remove Overpass LS $50,000.00 Railroad – new track only (no xings, signals,
etc.) KM $375,000.00
Signals LS $200,000.00 Lights – Urban KM $120,690.00
Source: SEH Inc. and Montana Department of Transportation. *Last updated in 2003.
2.0 User Guide
Begin by making sure macros are enabled when opening the cost estimation spreadsheet. The spreadsheet will not function properly if macros cannot be used. Select the Enter Information worksheet tab at the bottom of the spreadsheet.

Montana Highway Reconfiguration Study Final Report
Cambridge Systematics, Inc. A5-4
All pertinent roadway characteristics and design parameters will be entered within this worksheet as follows:
1. Project units. Select either Metric or English units. Currently, MDT is using Metric units to design and construct projects. It is important to note that if you decide to come back to this step and change the working units, the project information and typi-cal section dimensions in Sections 5 and 6, respectively, will need to be reentered.
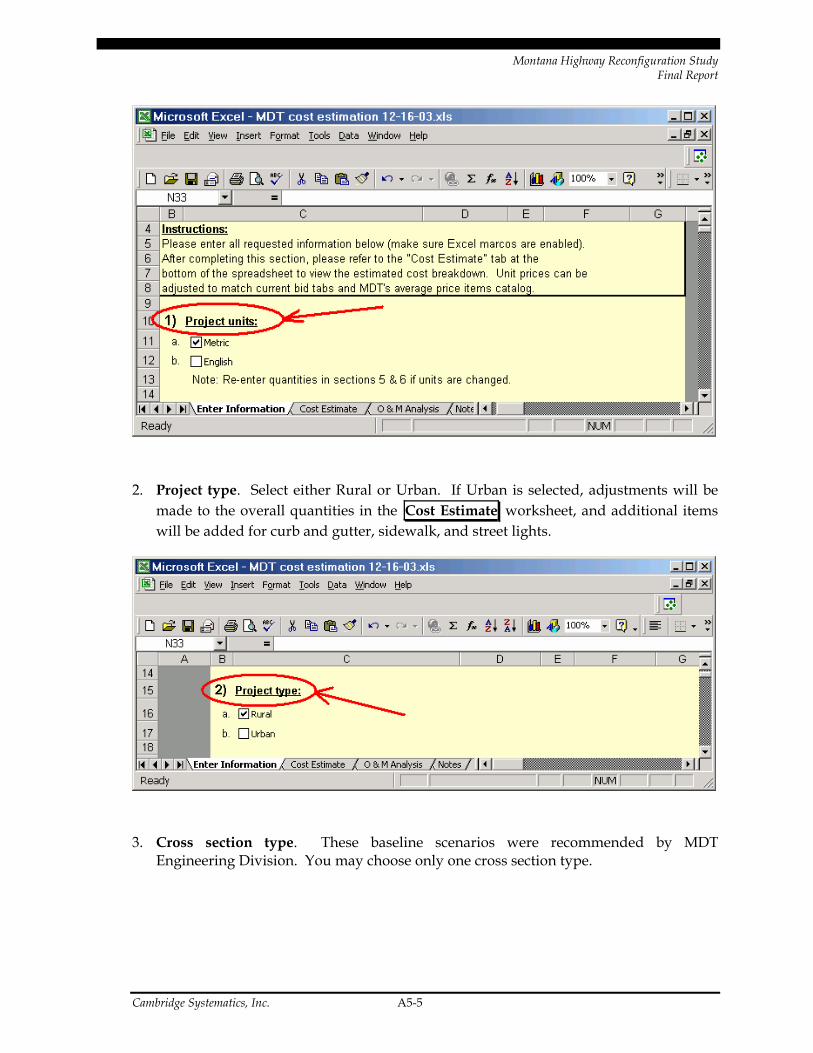
Montana Highway Reconfiguration Study Final Report
Cambridge Systematics, Inc. A5-5
2. Project type. Select either Rural or Urban. If Urban is selected, adjustments will be made to the overall quantities in the Cost Estimate worksheet, and additional items will be added for curb and gutter, sidewalk, and street lights.
3. Cross section type. These baseline scenarios were recommended by MDT Engineering Division. You may choose only one cross section type.
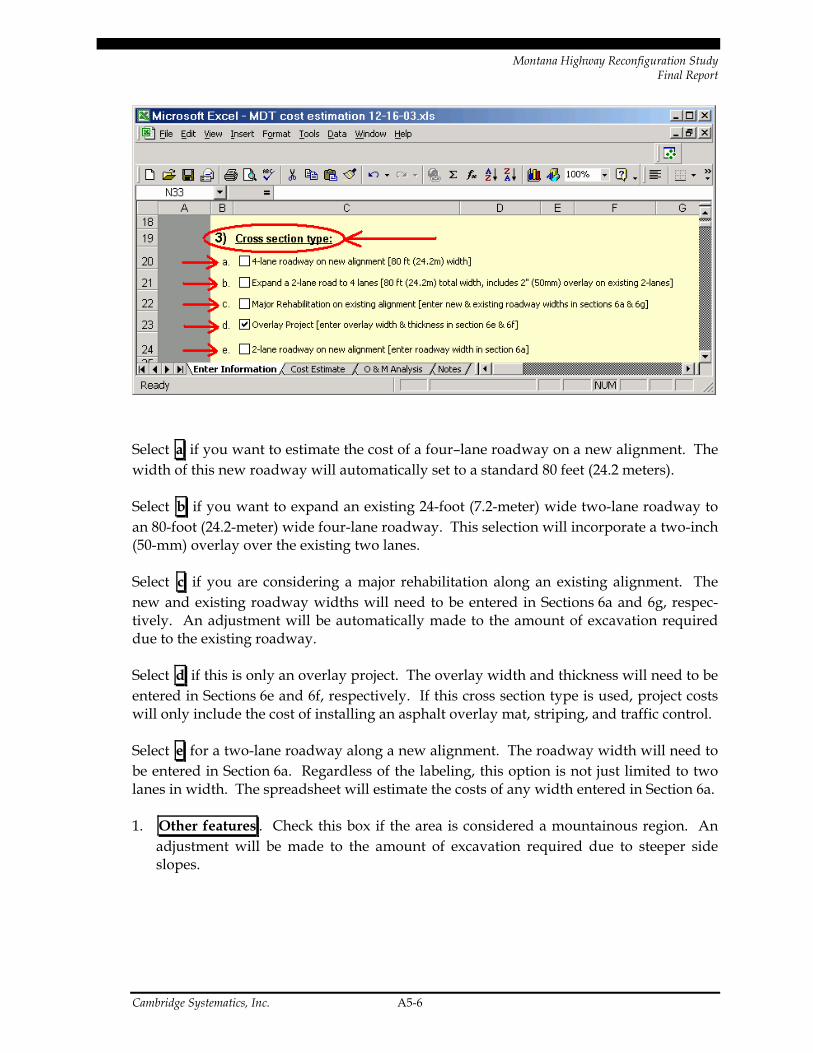
Montana Highway Reconfiguration Study Final Report
Cambridge Systematics, Inc. A5-6
Select a if you want to estimate the cost of a four–lane roadway on a new alignment. The width of this new roadway will automatically set to a standard 80 feet (24.2 meters).
Select b if you want to expand an existing 24-foot (7.2-meter) wide two-lane roadway to an 80-foot (24.2-meter) wide four-lane roadway. This selection will incorporate a two-inch (50-mm) overlay over the existing two lanes.
Select c if you are considering a major rehabilitation along an existing alignment. The new and existing roadway widths will need to be entered in Sections 6a and 6g, respec-tively. An adjustment will be automatically made to the amount of excavation required due to the existing roadway.
Select d if this is only an overlay project. The overlay width and thickness will need to be entered in Sections 6e and 6f, respectively. If this cross section type is used, project costs will only include the cost of installing an asphalt overlay mat, striping, and traffic control.
Select e for a two-lane roadway along a new alignment. The roadway width will need to be entered in Section 6a. Regardless of the labeling, this option is not just limited to two lanes in width. The spreadsheet will estimate the costs of any width entered in Section 6a.
1. Other features . Check this box if the area is considered a mountainous region. An adjustment will be made to the amount of excavation required due to steeper side slopes.
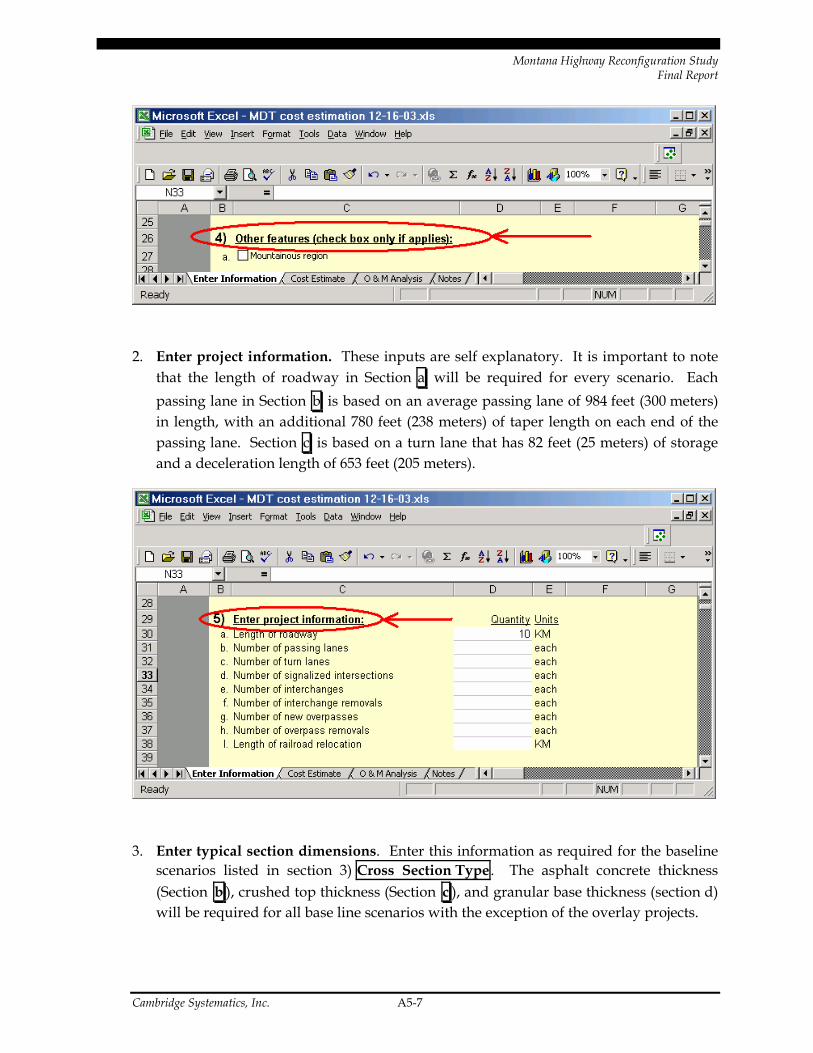
Montana Highway Reconfiguration Study Final Report
Cambridge Systematics, Inc. A5-7
2. Enter project information. These inputs are self explanatory. It is important to note that the length of roadway in Section a will be required for every scenario. Each passing lane in Section b is based on an average passing lane of 984 feet (300 meters) in length, with an additional 780 feet (238 meters) of taper length on each end of the passing lane. Section c is based on a turn lane that has 82 feet (25 meters) of storage and a deceleration length of 653 feet (205 meters).
3. Enter typical section dimensions. Enter this information as required for the baseline scenarios listed in section 3) Cross Section Type . The asphalt concrete thickness (Section b ), crushed top thickness (Section c ), and granular base thickness (section d) will be required for all base line scenarios with the exception of the overlay projects.
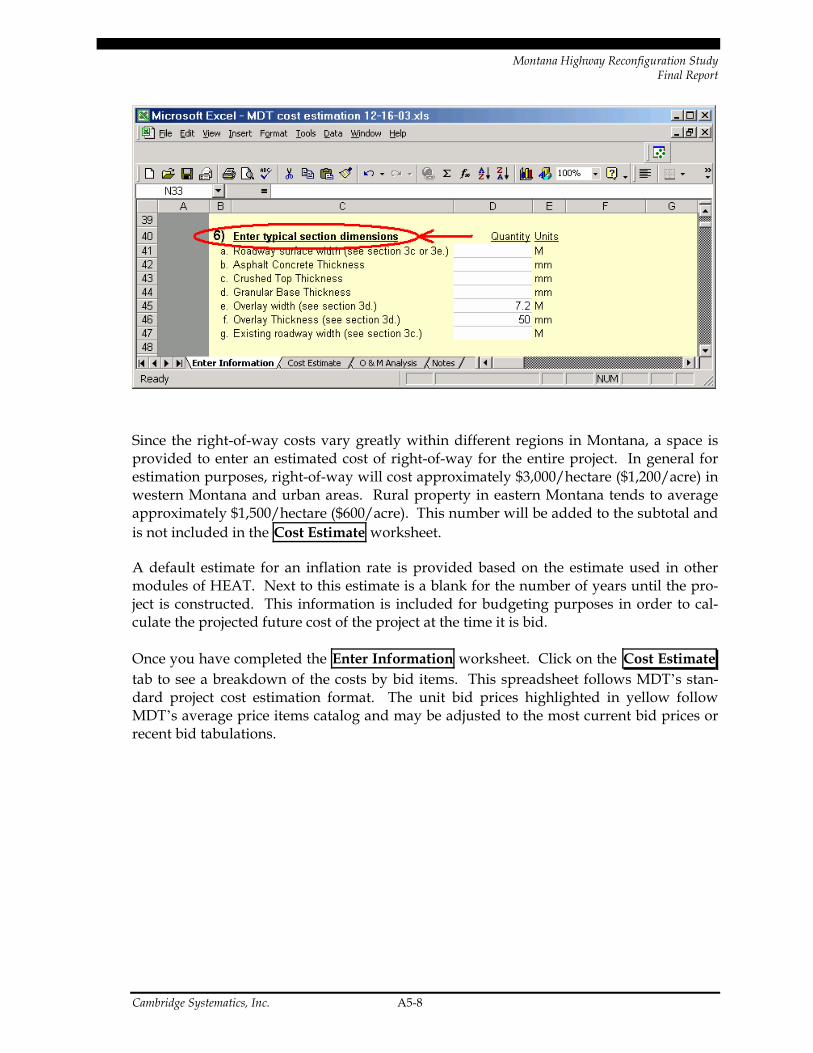
Montana Highway Reconfiguration Study Final Report
Cambridge Systematics, Inc. A5-8
Since the right-of-way costs vary greatly within different regions in Montana, a space is provided to enter an estimated cost of right-of-way for the entire project. In general for estimation purposes, right-of-way will cost approximately $3,000/hectare ($1,200/acre) in western Montana and urban areas. Rural property in eastern Montana tends to average approximately $1,500/hectare ($600/acre). This number will be added to the subtotal and is not included in the Cost Estimate worksheet.
A default estimate for an inflation rate is provided based on the estimate used in other modules of HEAT. Next to this estimate is a blank for the number of years until the pro-ject is constructed. This information is included for budgeting purposes in order to cal-culate the projected future cost of the project at the time it is bid.
Once you have completed the Enter Information worksheet. Click on the Cost Estimate tab to see a breakdown of the costs by bid items. This spreadsheet follows MDT’s stan-dard project cost estimation format. The unit bid prices highlighted in yellow follow MDT’s average price items catalog and may be adjusted to the most current bid prices or recent bid tabulations.

Montana Highway Reconfiguration Study Final Report
Cambridge Systematics, Inc. A5-9
Click on the O&M Analysis worksheet tab to view the operations and maintenance analysis. The required inputs for this worksheet are highlighted in yellow and are self explanatory. The annual operating and maintenance (O&M) costs are listed in the table directly below the inputs. These average O&M costs are for everything that MDT Maintenance does. These numbers do not reflect periodic construction projects such as a pavement reconstruction or a major mill and overlay that may occur during the 30-year life of the project and would be completed under separate funding. Nevertheless, the cost model will include a thin overlay 15 years after the project is completed as a default maintenance costs. The user may override this assumption if a more project-specific maintenance regime and/or schedule is appropriate.

Montana Highway Reconfiguration Study Final Report
Cambridge Systematics, Inc. A6-1
Appendix A6. Value of Time (1)
1.0 Different Perspectives for Measurement and Use
In the context of HEAT, the value of time is important because it is used as one component of the measurement of total economic benefits from alternative highway improvement projects. This objective is important to keep in mind, because some other studies adopt values for time for different purposes – such as to predict how travelers would react to tradeoffs between travel time and travel cost in making highway routing decisions, or travel mode choices, or time-of-day travel decisions. There are also different uses of value of time for evaluating proposed tolls, new highway connections, highway widening, or lane use policies affecting peak period capacity. The right way to view the value of time can differ depending on the specific type of user decision being considered and the spe-cific type of application for it.
In general, most research studies measure the value of time based on behavior by affected parties. But even then, there can be dramatic difference, for various studies may focus on the value of time savings as seen from the perspective of: 1) the driver, 2) the vehicle owner, 3) the transportation user, and 4) the ultimate beneficiary.
In the case of personal auto travel, the same person usually represents all four perspec-tives. On the other hand, in the case of trucking, there can be a different party repre-senting each of the four perspectives – the driver working for a trucking company, the trucking company itself, the shipper sending out the product (who is using the transpor-tation service), and the receiver who actually benefits from receiving the product. This classification is summarized for these and selected other types of trips in Table A6.1 that follows.
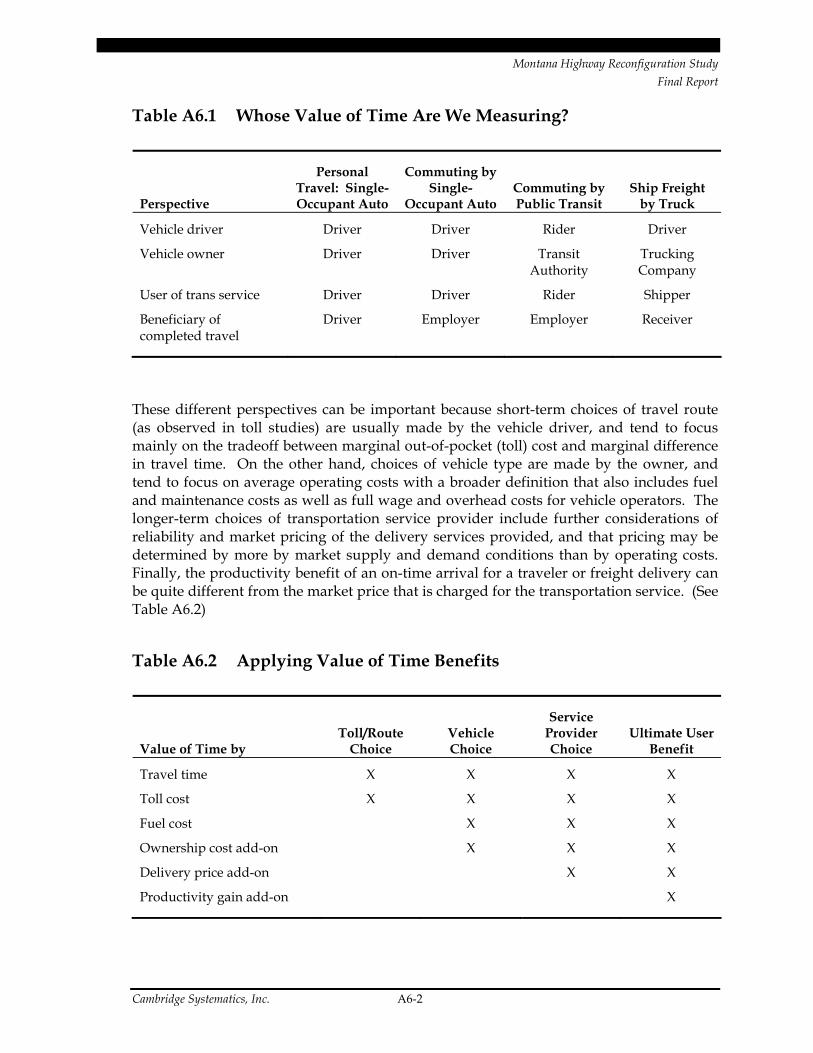
Montana Highway Reconfiguration Study Final Report
Cambridge Systematics, Inc. A6-2
Table A6.1 Whose Value of Time Are We Measuring?
Perspective
Personal Travel: Single-Occupant Auto
Commuting by Single-
Occupant Auto Commuting by Public Transit
Ship Freight by Truck
Vehicle driver Driver Driver Rider Driver
Vehicle owner Driver Driver Transit Authority
Trucking Company
User of trans service Driver Driver Rider Shipper
Beneficiary of completed travel
Driver Employer Employer Receiver
These different perspectives can be important because short-term choices of travel route (as observed in toll studies) are usually made by the vehicle driver, and tend to focus mainly on the tradeoff between marginal out-of-pocket (toll) cost and marginal difference in travel time. On the other hand, choices of vehicle type are made by the owner, and tend to focus on average operating costs with a broader definition that also includes fuel and maintenance costs as well as full wage and overhead costs for vehicle operators. The longer-term choices of transportation service provider include further considerations of reliability and market pricing of the delivery services provided, and that pricing may be determined by more by market supply and demand conditions than by operating costs. Finally, the productivity benefit of an on-time arrival for a traveler or freight delivery can be quite different from the market price that is charged for the transportation service. (See Table A6.2)
Table A6.2 Applying Value of Time Benefits
Value of Time by Toll/Route
Choice Vehicle Choice
Service Provider Choice
Ultimate User Benefit
Travel time X X X X
Toll cost X X X X
Fuel cost X X X
Ownership cost add-on X X X
Delivery price add-on X X
Productivity gain add-on X
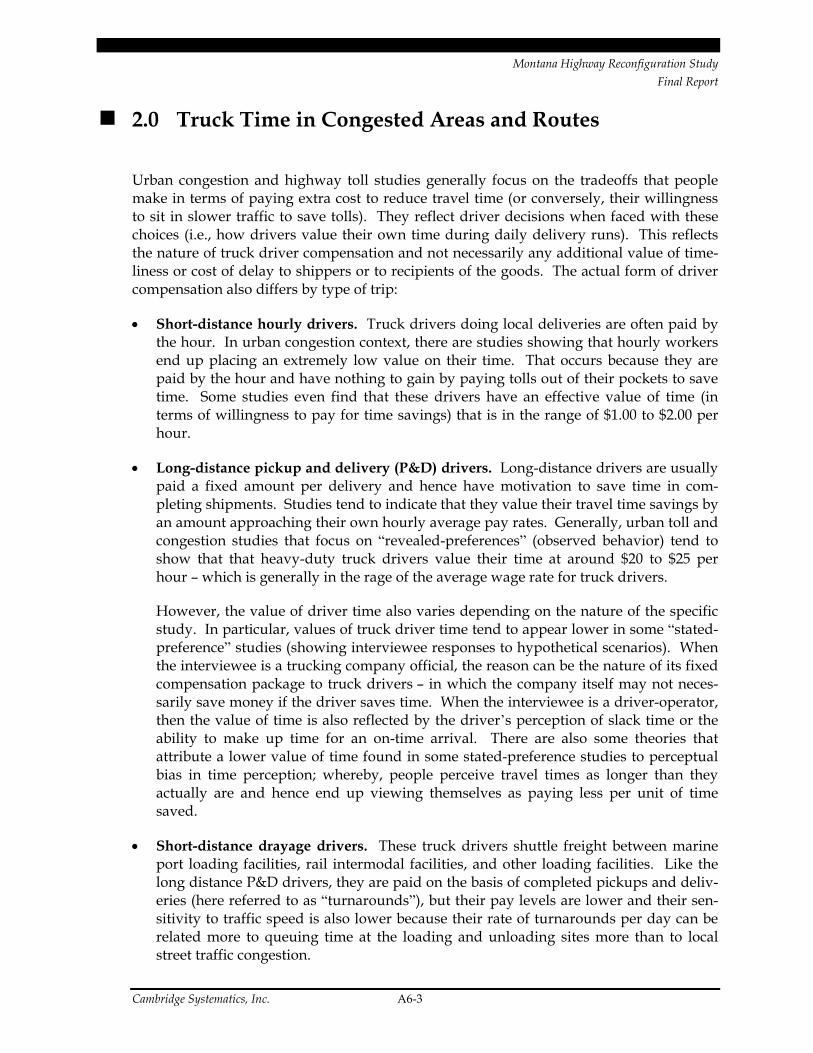
Montana Highway Reconfiguration Study Final Report
Cambridge Systematics, Inc. A6-3
2.0 Truck Time in Congested Areas and Routes
Urban congestion and highway toll studies generally focus on the tradeoffs that people make in terms of paying extra cost to reduce travel time (or conversely, their willingness to sit in slower traffic to save tolls). They reflect driver decisions when faced with these choices (i.e., how drivers value their own time during daily delivery runs). This reflects the nature of truck driver compensation and not necessarily any additional value of time-liness or cost of delay to shippers or to recipients of the goods. The actual form of driver compensation also differs by type of trip:
• Short-distance hourly drivers. Truck drivers doing local deliveries are often paid by the hour. In urban congestion context, there are studies showing that hourly workers end up placing an extremely low value on their time. That occurs because they are paid by the hour and have nothing to gain by paying tolls out of their pockets to save time. Some studies even find that these drivers have an effective value of time (in terms of willingness to pay for time savings) that is in the range of $1.00 to $2.00 per hour.
• Long-distance pickup and delivery (P&D) drivers. Long-distance drivers are usually paid a fixed amount per delivery and hence have motivation to save time in com-pleting shipments. Studies tend to indicate that they value their travel time savings by an amount approaching their own hourly average pay rates. Generally, urban toll and congestion studies that focus on “revealed-preferences” (observed behavior) tend to show that that heavy-duty truck drivers value their time at around $20 to $25 per hour – which is generally in the rage of the average wage rate for truck drivers.
However, the value of driver time also varies depending on the nature of the specific study. In particular, values of truck driver time tend to appear lower in some “stated-preference” studies (showing interviewee responses to hypothetical scenarios). When the interviewee is a trucking company official, the reason can be the nature of its fixed compensation package to truck drivers – in which the company itself may not neces-sarily save money if the driver saves time. When the interviewee is a driver-operator, then the value of time is also reflected by the driver’s perception of slack time or the ability to make up time for an on-time arrival. There are also some theories that attribute a lower value of time found in some stated-preference studies to perceptual bias in time perception; whereby, people perceive travel times as longer than they actually are and hence end up viewing themselves as paying less per unit of time saved.
• Short-distance drayage drivers. These truck drivers shuttle freight between marine port loading facilities, rail intermodal facilities, and other loading facilities. Like the long distance P&D drivers, they are paid on the basis of completed pickups and deliv-eries (here referred to as “turnarounds”), but their pay levels are lower and their sen-sitivity to traffic speed is also lower because their rate of turnarounds per day can be related more to queuing time at the loading and unloading sites more than to local street traffic congestion.

Montana Highway Reconfiguration Study Final Report
Cambridge Systematics, Inc. A6-4
3.0 Trucking Choice Context: Focus on Driver + Vehicle
Businesses that own and operate trucks – whether they be in-house trucking fleets or separate trucking service companies – make decisions about the types of vehicles to pur-chase and their utilization based on the full costs of vehicle operation (vehicle fuel and maintenance cost, as well as driver wage and fringe cost) and the full cost of ownership (depreciable purchase value). These factors are continually evaluated in terms of life cycle, annual costs, and incremental costs. Highway system improvements that affect expected travel times and/or travel distances will, thus, be seen as affecting the incremental cost of vehicle operation (fuel, maintenance and driver wage + fringe cost).
In this context, a trucking service operator fleet operator can face average driver costs in the range of $20 per hour, average driver fringe costs in the range of $5.00 per hour, and total vehicle (ownership and operating) costs in the range of $9.00 per hour. For trucking businesses with associated inventory warehousing or storage costs, the additional inven-tory cost may add another cost in the range of $2.00 per hour, raising the total to around $36 per hour. (All of these figures are generally consistent with a 2003 update of HERS values). While driver fringe benefits and vehicle ownership costs are “sunk” costs that are not variable in the short run when day-to-day travel route decisions are made, they are indeed variable in the longer run when business choices of location, vehicle/mode, driver/vehicle scheduling and overall costing or pricing are made.
It is also worth noting that the value of time savings and value of distance changes tend to interplay differently in urban and rural contexts. In a congested urban network, the opening of road or bridge links with new capacity is most likely to reduce travel times (VHT), though with a partially offsetting increase in travel distances (VMT) as some traffic diverts to a slightly longer route in order to save more travel time. Vehicle operating costs are affected simultaneously in two directions – these costs are reduced as motor running time is minimized, but these costs are increased as mileage is expanded. However, in a sparse rural network, the impact is more unidirectional. The opening of a new road is likely to reduce travel times (VHT) and also reduce travel distances (VMT). Rural high-way system improvements that add passing lanes, bypass local downtowns or reduce rail-road grade crossings are also likely to reduce travel times (VHT), though with little appre-ciable change in travel distances (VMT).
4.0 Total User Benefit for Truck Deliveries
It is quite clear that the truck driver is NOT the user of the freight being delivered. In most cases, the shipper pays for the delivery service and hence can be viewed as the user of that service. We do know that a) the shipper’s value of having the delivery completed must exceed b) the market price charged by the delivery company, or else the transaction would not occur. And we know that b) the market prices for shipping must, in turn,

Montana Highway Reconfiguration Study Final Report
Cambridge Systematics, Inc. A6-5
exceed c) the average cost to the operator or else the operator would not stay in business. (For the moment, let’s ignore the fact that a record number of trucking companies are going bankrupt!) So if a>b and b>c, then ergo a>c. In English, this means that there is always some added value to shippers that exceeds the cost of operating the truck and paying the driver.
Ultimately, though, the receiver of the freight either pays explicitly for the choice of ship-ping method for FOB purchases (priced as freight on board – at loading dock, with ship-ping charged separately), or else implicitly as part of an embedded markup in the deliv-ered price of the goods. And we know that the productivity value of on-time delivery to recipients is larger than the cost of the delivery or else the transaction would not occur. There are numerous case studies showing that these productivity benefits for some industries can be dramatically higher than the transportation prices they pay. The reason is that reduced transit times and more reliable deliveries can allow some firms to stream-line logistics, reduce warehousing times, tighten scheduling, and increase utilization of production resources. A survey of freight carriers by Small found values of freight transit time in the range of $144 to $193 per hour, and savings in late schedule delays of $371 per hour. Additional case studies of the large value of “just-in-time” processing and sched-uling benefits (often exceeding $100 per hour) are shown in reports of NCHRP 2-18 (2), NCHRP 2-21 (3), and the FHWA Freight Benefit-Cost Study (4).
The extent of these additional productivity benefits and the situations in which they are applicable vary by industry. Focusing on the implications of travel time delays, we can identify two major categories of shipper and receiver situations:
• When businesses do not care about timeliness – For some businesses that ship out-going goods, there is little or no cost incurred for late pickup of their products or delivery of their goods, aside from the incremental cost of paying for additional driver time based on the amount of time delay and frequency of recurrence. For some busi-nesses that receive incoming goods, there is also little or no cost incurred for materials that arrive at a later time but within 24 hours of the scheduled time. These conditions apply to some stocked goods and commodities. The 24-hour limit is important since most truck pickups and deliveries that are delayed by traffic slowdowns can still be completed within the same day, or by the next morning.
• When businesses do care about timeliness – Other kinds of businesses do incur a pen-alty – either additional costs or lost revenues – when a late pickup or delivery is late. These penalties apply largely to construction and technology-based manufacturing and includes the following categories:
− User overtime – paying overtime at loading docks for late deliveries;
− User product spoilage (e.g., concrete/cement after one hour);
− User stock-out – leading to lost sales opportunities;
− User stock-out – leading to JIT penalties or plant output reduction/shutdown; and
− Missed delivery –deliveries that arrive after the gate or loading dock is closed for the day.
Montana Highway Reconfiguration Study Final Report
Cambridge Systematics, Inc. A6-6
The various timeliness penalties cited above can occur from either “recurrent” or “non-recurrent” (sporadic) delays. In urban areas, heavy congestion is the leading cause of spo-radic slowdowns (non-recurrent delays) and also increases the incidence and severity of delays associated with traffic accidents and vehicle breakdowns. In rural areas, sporadic delays can also come from at-grade railroad crossings, delays in ability to pass slow-moving vehicles (including tractors and other agricultural vehicles, as well as tourists slowing for scenic views), and delays associated with grain loading or other intermodal facilities. These sporadic delays in rural areas typically occur without any resulting ability for vehicles to shift travel routing – which would change travel distances. However, even without any impact on VHT, these delays increase fuel and other vehicle operating costs that are associated with vehicle idling or motoring time.
When delays are sufficiently recurrent in terms of frequency, then it is possible to calculate a probability-based “expected value” of the penalty cost incurred by businesses. The avoidance of these costs represents the benefit of schedule padding, and can be directly compared to the up-front cost of actually padding the schedule with a planned earlier arrival. It is logical economic behavior that those firms that do care about timeliness should make that calculation and indeed pad their travel times (or deviate them from normally optimal times) when there are net benefits of doing so. However, it is important to note that not all of these events adhere to exact schedules, and many of them can only be avoided by rescheduling deliveries to a different part of the day – all of which can involve substantial additional costs in terms of lost production and delivery cycles that may be much larger than any savings in driver time.
5.0 Additional Issues of Truck Access and Delivery in the Rural Context
Economic development studies have found that there can be additional cost penalties for business shippers and receivers located on some rural two-lane roads. Across the nation, trucking companies focus their travel routes on four-lane highways (due to higher average speeds and increased reliability associated with passing lanes) and tend to have a reduced presence serving businesses located along two-lane highways when faster alternatives are available. For businesses with their own truck fleets, that is not a concern since they can ply whatever roads they desire. But for rural businesses that rely on trucking companies for their freight deliveries, those located along two-lane routes in isolated areas often report high costs and low reliability for trucking services. The reason is usually a combi-nation of two key factors: a) avoidance of deadheading – trucking companies tend to give higher priority to sending trucks to more profitable areas where they carry freight both directions, as opposed to areas where the trucks consistently run full in one direction and empty in the other direction; and b) priority for through routes – trucking travel is focused on intercity routings that are fastest, so businesses located along the faster highway routes tend to have access to a greater frequency and availability of service than those located along highway routes that are considered to be more slow and arduous. Often the result

Montana Highway Reconfiguration Study Final Report
Cambridge Systematics, Inc. A6-7
is unexpected delays due to a “shortage of available trucks” – which really occurs because other areas and routes receive higher priority. Producers and suppliers affected by such shortages can incur additional schedule penalties associated with trucks arriving days late. The importance of these factors is that highway reconfiguration can, in some places, potentially reduce or eliminate the high penalty cost of these situations.
6.0 Travel by Individuals: Car and Light Trucks
Travel by individuals in cars and light trucks is commonly classified in three groups: 1) ”on the clock” travel during the workday; 2) commuting to/from work; and 3) personal travel (including social, recreation, and personal business trips). The value of time is treated differently for each.
• Cars (and light trucks): on the clock travel. The class covers trips conducted by workers during the workday as part of their jobs to provide repair services or conduct meetings. Since the costs of excess worker time are borne by businesses, there is a general consensus that the value of travel time includes the value of worker’s wage and fringe/overhead costs. The U.S. Department of Transportation (DOT) recom-mends using $21.20 per hour for on-the-clock business travel. However, it is impor-tant to note that relatively few trips are “on the clock” business travel that is using a personal vehicle, and most of these trips are concentrated in urban areas.
• Cars (and light trucks): commuting trips. In most regional travel demand forecasting and simulation models (as in Montana), the term “work trips” refer to peak period commuting to and from work. The value of time for commuting trips is usually defined roughly one-half of the business cost. Some research studies have found that the value of travel time is actually higher for commuting trips than for personal busi-ness and recreational travel. This includes studies in the United Kingdom (Mackie, 2003) (5). Some research in the U.S. has also shown that the value of commuting trips varies by industry and occupation (Forkenbrock and Weisbrod, 2001) (6). The U.S. DOT currently recommends using a value of local commuting travel of $10.60 per hour in 2000 dollars.
• Cars (and light trucks: personal travel. This class includes travel for shopping, per-sonal business, and social and recreational purposes. In travel demand modeling, the most commonly-accepted methods for determining the value of travelers’ time for non-work trips is to use a figure of roughly one-half of the average wage rate. This is based on a variety of research studies, including both stated- and revealed-preference research, about the tradeoffs between time and cost that travelers make when they are not traveling to work. In 2000 dollars, the U.S. DOT recommended using an average of $10.60 for local personal travel and $14.80 for intercity personal travel (values in year 2000 dollars). However, it is important to note this value of personal time savings is based on decision-making tradeoffs. This is in contrast to work-related travel, where some or all of the time savings can translate into additional money saved by

Montana Highway Reconfiguration Study Final Report
Cambridge Systematics, Inc. A6-8
business operations or net salaries of individuals. Thus, for purposes of calculating benefits to the economy, these values are not necessarily applicable.
7.0 Recommended Values for Montana
Automobile Time – Montana’s ES-202 database indicates that the average wage per job in Montana as of 2001 was $25,194, with an hourly wage average of $12.25 per hour. Adding fringe benefits (25 percent) and updating from 2001 to 2004 dollars (nine percent) would yield a value of roughly $17 per hour, so taking one-half of that value would yield a local default value of $17 per hour for value of “on-the-clock” travel time savings, and $8.50 for value of commuting travel time savings.
Alternatively, we can use the national recommendations of the Secretary of U.S. Dot, which are $21.20 for the value of “on-the-clock” time and $10.60 for the value of com-muting time. One argument for use of the national values is in the California benefit-cost web guide, which warns against varying the value of time by states or regions, since that would imply that time-saving transportation improvements should be given greater value in richer states and regions areas rather than in poorer areas.
For this study, we consider the business (weighted average of combined commuting and “on-the-clock” trip) value of time to be roughly $12, plus a labor market access and pro-ductivity benefit to employers that increases the value to $13 per hour. We adopt an eco-nomic value personal travel at roughly $6, reflecting one-half of the basic wage rate.
Truck Time – For trucking, the BLS 2001 National Occupational Employment and Wage Estimates show an average hourly wage for heavy truck drivers of $15.78 for the U.S. average and $13.86 in Montana as of 2000. Since many of the truck drivers are not Montana residents, we are better off using the national average. Adding 25 percent fringe plus inflation brings this cost to roughly $20 per hour. Thus the default value of for truck driver time ($20.50) appears about right if we are only recognizing the driver value of time. However, we need to recognize additional costs of trucking time that are beyond the incremental truck driver time. As previously noted, delays associated with congestion and road or intersection design factors (such as railroad crossings, national parks, lack of passing lanes, etc.) have implications for truck operating costs that are related to motor running time rather than vehicle-miles traveled. HERS values of truck motoring time (reported in NCHRP 2-21 [3]) indicates a total value of travel time for combination tractor-trailer trucks that is $31.58 per hour – including $21.95 for truck drivers and $9.63 for other vehicle and inventory carrying costs. Updating from 1997 to 2003 brings the total driver + vehicle cost for trucks to approximately $38 per hour.
Beyond the above-cited transportation cost, there are additional user productivity benefits of truck pickup and delivery time savings for production processes and export shipments that depend on timely deliveries. The extent of these benefits varies by industry, depending on the mix of commodities used (as per input-output table), the form and

Montana Highway Reconfiguration Study Final Report
Cambridge Systematics, Inc. A6-9
utilization of just-in-time scheduling processes among those industries (as per business productivity case studies), relative reliance on time-sensitive international air and sea exports, and relative cost and productivity of labor and equipment in those industries in Montana.
We apply our analysis model to combines these sources in order to derive the productivity value of time savings for the ultimate beneficiaries, and add them to the basic $38 per hour average truck transportation cost (cited above) to yield the following values for freight value of time: Non-Durables Manufacturing Goods – $53, Durables Manufacturing Goods – $66, Agriculture – $41, Mining & Resources – $39, Miscellaneous Transport Services – $42 and Drayage and Warehousing – $40. (see Table A6.3)
It is important to note that these values are highly specific to Montana and its economic cost structure, product mix and export structure. In this model, the productivity value of time for some manufactured goods that are highly dependent on just-in-time processes rises as high as $150 per hour. Some prior studies have found that actual productivity values of time delay can greatly exceed that level for some types of production processes in some types of situations. At the same time, we also recognize that for every industry with a dramatically large value of time delay, there are many more types of manufactured goods and production processes have little or no additional productivity impact of incre-mental time savings. Thus, the values estimated for purposes of this study are intended to represent a conservative valuation of average benefits for many types of production proc-esses in many types of situation.
It is also important to note that the highest benefits of timely freight delivery accrue to recipients of the product, although the CS categorization of commodities to industries is based on allocation by sender of the product. For this analysis of benefits, we had to allo-cate the commodities to the recipients that actually depend on the timely arrival of those materials in order to complete their production processes. In other words, we do not assign any intrinsic productivity benefit of time savings for coal deliveries to the coal mining companies or coal transporters, though we do allocate a small expected value of benefit to the electric power companies that depend on those shipments. Similarly, we do not assign any intrinsic productivity benefit of time savings for agricultural products to the farmers or agricultural coops, though we do allocate a small expected value of benefit to the food product manufacturers who depend on those shipments. Thus, all of the incremental benefits (above $38 per hour) shown here for non-manufacturing shipments actually accrue from their use by manufacturing or utilities sectors of the economy. These values can be viewed as conservative in light of some of the available research on full business costs of time delay.

Montana Highway Reconfiguration Study Final Report
Cambridge Systematics, Inc. A6-10
Table A6.3 Summary: Value of Time Delay for the Montana Reconfiguration Study
Non-Durables Manufacturing Goods $53
Durables Manufacturing Goods $66
Agriculture $41
Mining & Wood Resources $39
Misc. Transport Services $42
Drayage & Warehousing $40
Non-Freight (Service Delivery) $38
Auto – Work $13
Auto – Non-Work $6
Source: Highway Economic Requirements System (HERS) by Cambridge Systematics, Inc. Montana ES-202 wage statistics, and industry cost economic analysis model by Economic Development Research Group, Inc. (incorporating a meta study of time benefits associ-ated with logistics and just-in-time processing).
8.0 References
1. Weisbrod, G., “Issues in Assigning an Appropriate Value of Time,” Working Paper 03-04, Economic Development Research Group, Inc. (September 2003).
2. Lewis, D., “Research Strategies for Improving Highway User Cost-Estimating Methodologies,” NCHRP Report 2-18, Transportation Research Board, National Research Council, Washington, D.C. (April 1994).
3. Vary, D., G. Weisbrod, and G. Treyz, “Economic Implications of Congestion,” NCHRP Report 2-21, Transportation Research Board, National Research Council, Washington, D.C. (March 2001).
4. AECOM Group, “Freight Benefit/Cost Study: Compilation of the Literature,” Prepared for the Federal Highway Administration Office of Freight Management and Operations, February 9, 2001.
5. Mackie, P. J., et al., “Value of Travel Time Savings in the UK – Summary Report,” Institute for Transport Studies, University of Leeds, for the UK Department of Transport (2003).

Montana Highway Reconfiguration Study Final Report
Cambridge Systematics, Inc. A6-11
6. Forkenbrock, D. J., and G. Weisbrod, “Changes in Travel Time,” NCHRP Report 456, Chapter 2 in Guidebook for Assessing the Social and Economic Effects of Transportation Projects, Transportation Research Board, National Academy Press (2001).

Montana Highway Reconfiguration Study Final Report
Cambridge Systematics, Inc. A7-1
Appendix A7. Bibliography
1.0 Printed Documents
“1997 Commodity Flow Survey: Montana,” Department of Transportation (Bureau of Transportation Statistics) and Department of Census (December 1999).
“1997 Vehicle Inventory and Use Survey (VIUS): Montana”, Bureau of the Census.
AECOM Group, “Freight Benefit/Cost Study: Compilation of the Literature,” Prepared for the Federal Highway Administration Office of Freight Management and Operations, February 9, 2001.
Alward, G. S., and S. Lindall, “Deriving SAM Multiplier Models Using IMPLAN,” National IMPLAN Users Conference (August 1996). (IMPLAN)
Apogee Research, Inc., and Greenhorne & O’Mara, “Research on the Relationship Between Economic Development and Transportation Investment,” NCHRP Report 2-19 (May 1997).
Aschauer, D.A., "Is Public Expenditure Productive?" Journal of Monetary Economics (1989).
Bear Paw Development Corporation of Northern Montana, “Comprehensive Economic Development Strategy – 2002 Update” (June 27, 2002).
Beartooth Resource Conservation & Development Economic Development District, “Comprehensive Economic Development Strategy” (December 2001).
Bell, M., and T. J. McGuire, “Macroeconomic Analysis of the Linkages Between Transportation Investments and Economic Performance,” NCHRP Report 389, Transportation Research Board, National Research Council, Washington, D.C. (1997).
Bell, M., and E. Feitelson, “Bottlenecks and Flexibility: Key Concepts for Identifying Economic Development Impacts of Transportation Services,” Transportation Research Record 1274: Transportation and Economic Development 1990, Transportation Research Board, National Research Council, Washington D.C. (1990).
“Benefits: Travel Time” in Benefits-Cost Analysis for Transportation, web site, developed by the Institute of Transportation Studies at the University of California at Berkeley, with California Polytechnic State University and Economic Development Research Group for California Department of Transportation (2004).

Montana Highway Reconfiguration Study Final Report
Cambridge Systematics, Inc. A7-2
Bernardin Lochmueller & Associates, Inc., “Final Report 3: Economic Impacts, Kentucky 69, Hartford to Hawesville,” Prepared for the Kentucky Transportation Cabinet (July 1997).
Bernardin, Lochmueller & Associates, “Indiana Reference Modeling System,” 1995. (NET BC)
Bise, C., Tichler & Associates, Personal Communication. (FISCALS)
Blackburn, J. T., “Time-Based Competition: The Next Battleground in Manufacturing,” Business One Irwin, Homewood, IL (1991).
Blair, J., “Local Economic Development: Analysis and Practice,” Sage Publications, Thousand Oaks, California (1995).
Booz-Allen & Hamilton Inc., “California Life-Cycle Benefit/Cost Analysis Model (Cal-B/C)” (September 1999).
Broder, J. M., T. D. Taylor, and K. T. McNamara, “Quasi-Experimental Designs for Measuring Impacts of Developmental Highways in Rural Areas,” Southern Journal of Agricultural Economics, Vol. 24, No. 1 (1992).
Burchell, R., Rutgers University, Center for Urban Policy Research, Personal Communication. (PC I/O, REMI, RIMS II)
Bureau of Economic Analysis, “Local Area Personal Income,” www.bea.doc.gov/bea/regional/reis.
Cambridge Systematics, “HERS-ST v20: Highway Economic Requirements System – State Version Technical Report,” Federal Highway Administration, FHWA-IF-02-060, available at http://isddc.dot.gov/OLPFiles/FHWA/010945.pdf.
Casto, J., “West Virginia’s Corridor L Opens the Door to Tourists,” Appalachia (May–August 1996); M. Mason, “Whitewater Rafting in West Virginia a Young But Exuberant Pastime,” Outside (August 20, 1998).
Chiang, A. C., “Fundamental Methods of Mathematical Economics,” 3rd Edition, Input-Output Economics, pp. 116-123.
Ciccone, A., and R. Hall, “Productivity and Density of Economic Activity,” The American Economic Review, Vol. 86, No. 1, (1996), pp. 54-70.
Council for Urban Economic Development, “Developing Strategies for Economic Stability and Growth,” CUED – National Council for Urban Economic Development, Washington, D.C. (1987).
Council for Urban Economic Development, “What is Economic Development?” Washington, D.C. (1997).

Montana Highway Reconfiguration Study Final Report
Cambridge Systematics, Inc. A7-3
DeJong, G., “Value of Freight Travel-Time Savings,” in Hensher, D. A., and K. J. Button (editors): Handbook of Transport Modeling, Elsevier Publishing, Amsterdam (2000).
Development Authority of the North Country, “North Country Transportation Study: Social and Economic Development Impact,” Prepared by Cambridge Systematics, Inc. (in partnership with Wilbur Smith Associates) (2001).
DiNitto, D., Regional Account Manager, Standard & Poor’s, Personal Communication. (DRI)
Duffy-Deno, K., and E. Randall, “Public Infrastructure and Regional Economic Development: A Simultaneous Equations Approach,” Journal of Urban Economics (1991), Vol. 30, pp. 329-343.
Economic Development Research Group and Cambridge Systematics, Inc., “Using Empirical Information to Measure the Economic Impact of Highway Investments,” Prepared for the Federal Highway Administration (April 2001).
Economic Development Research Group, “Targeting Economic Development Opportunities from Appalachian Development Highways: A Guide,” Appalachian Regional Commission, Washington, D.C. (2001).
“Economic Justification Spreadsheets User’s Manual,” University of Kentucky Center for Business and Economic Research, Lexington, Kentucky (August 1997).
Federal Aviation Administration, “Economic Values for Evaluation of Federal Aviation Administration Investment and Regulator Programs,” FAA-APO-98-8 (June 1998).
Federal Highway Administration and Cambridge Systematics, Inc., “STEAM User’s Manual” (1997). (STEAM)
Federal Highway Administration, “Highway Capacity Manual 2000 (HCM 2000),” (2000).
Federal Highway Administration, “Land Use and Economic Development in Statewide Transportation Planning,” U.S. Department of Transportation (1999).
Federal Highway Administration, “Linking the Delta Region with the Nation and the World,” (1996).
Federal Highway Administration, “Using Empirical Information to Measure the Economic Impact of Highway Investments,” Prepared by Economic Development Research Group and Cambridge Systematics, Inc. (April 2001).
Federal Highway Administration, Office of Freight Management and Operations, “Freight Benefit/Cost Study, Compilation of the Literature,” (Final Report), Prepared by the AECOM Team (ICF Consulting, HLB Decision Economics, Louis Berger Group) (February 9, 2001).

Montana Highway Reconfiguration Study Final Report
Cambridge Systematics, Inc. A7-4
Florida Department of Transportation, “Macroeconomic Impacts of the Florida DOT Work Program,” Cambridge Systematics, Inc. (February 2003).
Florida Department of Transportation, “Florida DOT Macroeconomic Analysis Study – Review of State and National Studies and Techniques,” Cambridge Systematics, Inc. (2001).
Forkenbrock, D. J., “Putting Transportation and Economic Development into Perspective,” Transportation Research Record 1274, Transportation and Economic Development, Transportation Research Board, National Research Council, Washington D.C. (1990), pp. 3-11.
Forkenbrock, D. J., and N. S. J. Foster, “Economic Benefits of a Corridor Highway Investment,” Transpn. Res.-A (1990), Vol. 24A, No. 4, pp. 303-312.
Forkenbrock, D. J., T. F. Pogue, N. S. Foster, and D. J. Finnegan, “Road Investment to Foster Local Economic Development,” Public Policy Center, University of Iowa, Iowa City Iowa (1990).
Forkenbrock, D. J., and G. Weisbrod, “Changes in Travel Time,” NCHRP Report 456, Chapter 2 in Guidebook for Assessing the Social and Economic Effects of Transportation Projects, Transportation Research Board, National Academy Press (2001).
Frankel, E., “Revised Departmental Guidance: Valuation of Travel Time in Economic Analysis,” available at http://ostpxweb.dot.gov/policy/Data/VOTrevision1_2-11-03.pdf 2003).
Georgia DOT, “Governor’s Road Improvement Program (GRIP),” (www.dot.state.ga.us/DOT/plan-prog/planning/programs/grip/Index.shtml).
Glaeser, E. L., and J. E. Kohlhase, “Cities, Regions, and the Decline of Transport Costs,” Harvard Institute of Economic Research, Discussion Paper Number 2014, (July 2003).
Governor’s Commission on Transportation Policy, “Final Report by the Governor’s Commission on Transportation Policy,” Virginia (2000).
Grovak, M., Bernardin, Lochmueller & Associates, Inc., Personal Communication. (NET BC)
“Guide to Benefit-Cost Analysis in Transport Canada,” Economic Evaluation Branch, Transport Canada, Ottawa (1994).
Hagler Bailly Services, Inc., and G. Weisbrod, “Guidance on Using Existing Economic Analysis Tools for Evaluating Transportation Investments,” Prepared for NCHRP, Transportation Research Board National Research Council, Washington, D.C. (October 1999).
Montana Highway Reconfiguration Study Final Report
Cambridge Systematics, Inc. A7-5
HLB Inc., “Social Cost Pricing and the External Benefits of Trucking,” American Trucking Association Foundation (December 1997).
Hodge, D. J., G. Weisbrod, and A. Hart, “Do New Highways Attract Businesses?” Case Study for North Country, New York, Transportation Research Record No. 1839 (2003), pp. 150-158.
http://www.dot.state.oh.us/
http://www.dot.state.wi.us/dtim/bop/gati.html
Hunt, J., “Road Improvements to Promote Local Economic Development: An Iowa Case Study,” Center for Transportation Research and Education, Iowa State University (1996).
IEDC Site Selection Task Force, “Site Selection Data,” Standards, International Economic Development Council, Washington, D.C. (2001).
Illinois Department of Transportation, “State of Transportation in Illinois: Lifelines to the Economy” (1997).
Indiana Department of Transportation, “Major Corridor Investment-Benefit Analysis System,” Model Documentation, Prepared by Cambridge Systematics, Inc. (1998).
Institute for Tourism and Recreation Research, “An Economic Review of the Travel Industry in Montana,” University of Montana, Missoula, Montana (June 2000).
Isserman, A., and T. Rephann, “The Economic Effects of the Appalachian Regional Commission: An Empirical Assessment of 26 Years of Regional Development Planning,” Journal of the American Planning Association, (summer 1995).
Jack Faucett Associates, “The Highway Economic Requirements System (HERS Manual),” Federal Highway Administration, U.S. DOT (September 1995). (HERS)
Kansas DOT, “System Enhancement Program,” (www.ksdot.org).
Keeler, T., and J. Ying, “Measuring the Benefit of a Large Public Investment – The Case of the U.S. Federal-Aid Highway System,” Journal of Public Economics, Volume 36, (1988), pp. 69-85.
Khanam, B., “Macroeconomic Performance and Public Highway Infrastructure,” Transport Canada – Economic Analysis (June 1996).
King, B., and L. Gramkow, “The 100 Most Logistics Friendly Cities,” Expansion Management (September 2001).
Kotval, Z. et al., “Business Attraction and Retention: Local Economic Development Efforts,” ICMA – International City/County Management Association, Washington, D.C. (1996).

Montana Highway Reconfiguration Study Final Report
Cambridge Systematics, Inc. A7-6
Kruesi, F., “Departmental Guidance for the Valuation of Travel Time in Economic Analysis,” Office of the Secretary, U.S. DOT, available at http://ostpxweb.dot/gov/policy/Data/VOT97guic.pdf (1997).
Krugman, P., “Development, Geography, and Economic Theory,” The MIT Press (1995).
Lahr, M., Rutgers University, Center for Urban Policy Research, Personal Communication. (PC I/O, REMI, RIMS II)
Lewis, D., “Research Strategies for Improving Highway User Cost-Estimating Methodologies,” NCHRP Report 2-18, Transportation Research Board, National Research Council, Washington, D.C. (April 1994).
Levinson, D., and B. Smalkoski, “Value of Time for Commercial Vehicle Operators in Minnesota,” University of Minnesota, TRB International Symposium on Road Pricing, 2003.
Lindall, S., and D. C. Olson, “The IMPLAN Input-Output System,” The Minnesota IMPLAN Group, Inc. (MIG). (IMPLAN)
Lyons, S., and R. Hamlin, “Creating an Economic Development Action Plan: A Guide for Development Professionals,” Praeger Publishers, New York (1991).
Mackie, P. J., et al., “Value of Travel Time Savings in the UK – Summary Report,” Institute for Transport Studies, University of Leeds, for the UK Department of Transport, available at http://www.dft.gov.uk/stellent/groups/dft_transstrat/documents/pdf/dft_transstrat_pdf_022708_pdf (2003).
McCann, P., “Rethinking the Theory of Industrial Location: The Logistics-Costs Argument,” 5th World Congress of the Regional Science Association International, Tokyo, Japan (1996).
McTrans Center for Microcomputers in Transportation, “Catalog,” (1998). (Full Simulation, Travel Demand)
MDT Transportation Planning Division, “Economic Development Performance Measures for Transportation Programming in Montana,” White Paper prepared by Cambridge Systematics (February 2001).
Mid-Ohio Regional Planning Commission, “MORPC Inland Port III Summary Report,” Cambridge Systematics, Inc. (March 1999).
Minnesota DOT, “Interregional Corridor Study,” (1999).
Minnesota IMPLAN Group, Inc. (MIG), “Elements of the Social Accounting Matrix,” Technical Report TR-98002. (IMPLAN)
Minnesota IMPLAN Group, Inc. (MIG), http:www.IMPLAN.com (IMPLAN, RIMS II)
Montana Highway Reconfiguration Study Final Report
Cambridge Systematics, Inc. A7-7
Mohring, H., and H. Williamson, Jr., “Scale Economies of Transport Improvements”, Journal of Transport Economics and Policy (September 1969), Vol. 3, No 3.
Mokhtarian, P., and I. Salomon, “How Derived is the Demand for Travel? Some Conceptual and Measurement Considerations,” Transportation Research A, Vol. 35, No. 8 (September 2001), pp. 695-719.
Munnell, A. H., "Why Has Productivity Growth Declined? Productivity and Public Investment," New England Economic Review, (1990).
Nadiri, I., and T. P. Mamuneas, “Contributions of Highway Capital to Industry and National Productivity Growth,” Federal Highway Administration, Office of Policy Development, Washington, D.C. (September 1996).
New York State Department of Transportation, “Handbook of Economic Development,” Calspan-UB Research Center, Inc., University at Buffalo, the State University of New York, and Cambridge Systematics, Inc. (2001).
NJIT, Rutgers and NJTPA, “The Transportation, Economic, and Land-Use System: A State-of-the-Art Transportation Information System for the 21st Century,” (April 1998). (PC I/O, RIMS II, IMPLAN)
Ostria, S., “FHWA Economic Development Corridors Project – U.S. Highway 93 – Flathead Indian Reservation,” Federal Highway Administration, Prepared by ICF Consulting (July 2001).
Ostria, S., “FHWA Economic Development Corridors Project – U.S. Route 2 – Roosevelt County/Fort Peck Indian Reservation,” Federal Highway Administration, Prepared by ICF Consulting (July 2001).
Perrera, M. H., “Framework for Classifying and Evaluating Economic Impacts Caused by a Transportation Improvement,” Transportation Research Record 1274: Transportation and Economic Development 1990, Transportation Research Board, National Research Council, Washington D.C. (1990).
PHH Fantus Consulting and Council for Urban Economic Development, “Benchmarking Practices to Achieve Customer Driven Economic Development,” CUED – National Council for Urban Economic Development, Washington, D.C. (1996).
Regional Economic Models, Inc. (REMI), http://www.remi.com. (REMI)
Rephann, T. J., and A. M. Isserman, “New Highways as Economic Development Tools: An Evaluation Using Quasi-Experimental Matching Methods,” Regional Science and Urban Economics, Vol. 24, No. 6 (1994).
RESI Research and Consulting, “The Economic Impact of Maryland Highway Investment,” Towson, Maryland (1998).

Montana Highway Reconfiguration Study Final Report
Cambridge Systematics, Inc. A7-8
Ripple, D.., Bernardin, Lochmueller & Associates, Inc., Personal Communication (NET BC)
Rogers, R. T., “Structural Change in U.S. Food Manufacturing, 1958 to 1997,” Department of Resource Economics, University of Massachusetts-Amherst.
Schrank, D., and T. Lomax, “The 2001 Urban Mobility Report,” Texas Transportation Institute, College Station, Texas (2001).
Seskin, S. J., “Comprehensive Framework for Highway Economic Impact Assessment: Methods and Results,” Transportation Research Record 1274, Transportation and Economic Development 1990, Transportation Research Board, National Research Council, Washington, D.C. (1990).
Small, K A., “Urban Transportation Economics,” Hardwood Academic Publishers, Chur, Switzerland (1992).
Small, K. A., R. Noland, X. Chu, and D. Lewis, “Valuation of Travel-Time Savings and Predictability in Congested Conditions for Highway User-Cost Estimation,” NCHRP Report 431, Transportation Research Board, Washington, D.C. (1999).
Smith, M., and S. Nance-Nash, “The Best Places to Live Now,” Money (September 1993), pp. 124-129.
Smith, S., Systems Planning Coordinator, Indiana Department of Transportation, Personal Communication. (MCIBAS, REMI, NET BC)
Spectrum Engineering, http://www.spectrum-engineering.com/ (MINUTP)
Standard & Poor’s, “Data and Information Management Services: For Competitive Advantage,” DRI/McGraw-Hill Booklet.
Standard & Poor’s, “Painting a Complete Picture of a Complex Landscape,” DRI/McGraw-Hill Pamphlet. (DRI)
Standard & Poor’s, “Reality-Based Forecasting for Real-World Decisions: U.S. Regional Economic Service,” DRI/McGraw-Hill Pamphlet. (DRI)
Standard & Poor’s, “Standard & Poor’s DRI: An Overview,” DRI/McGraw-Hill PowerPoint Presentation (1997). (DRI)
Texas Transportation Institute, “Introduction to StratBENCOST: Strategic Decision Support Tool for Highway Planning and Budgeting,” Version 1.0. (StratBENCOST)
Texas Transportation Institute, “MicroBENCOST User’s Manual,” Prepared for NCHRP 7-12, (October 1993). (MicroBENCOST)
Texas Transportation Institute, http://www.tti.tamu.edu/publications/ror/microb.stm (MicroBENCOST)
Montana Highway Reconfiguration Study Final Report
Cambridge Systematics, Inc. A7-9
“The Economic Impact of Maryland Highway Investment,” Towson, Maryland, RESI Research and Consulting (1998).
The Florida Transportation Commission and Floridians for Better Transportation, “Transportation: An Investment in Florida’s Future,” Joint report of the Florida Transportation Commission and Floridians for Better Transportation (June 1996).
“The Global Cement Report,” summary available on www.cemnet.co.uk.
Tran Plan 21 2002 Update, Montana Department of Transportation in conjunction with Dye Management Group, Inc. (http://www.mdt.state.mt.us/tranplan21/).
“USDA Agricultural Baseline Projections to 2011,” U.S. Department of Agriculture (February 2002).
U.S. Department of Commerce, Bureau of Economic Analysis, “Regional Multipliers: A User Handbook for the Regional Input-Output Modeling System, RIMS II Handbook, 3rd edition (March 1997). (RIMS II)
U.S. Department of Labor, Bureau of Labor Statistics, Current Employment Statistics, Average Annual Averages for 2000, http://www.bls.gov/sahome.html.
UK Department of Transport, “Transport Economics Note,” available at http://www.dft.gov.uk/stellent/groups/dft_roads/documents/page/dft_roads_504932.pdf (2001).
University of Birmingham, “International Study of Highway Development and Management Tools,” ISOHDM Newsletter, Edgbaston, Birmingham, United Kingdom (September 1997). (HDM 4)
University of Birmingham, “New Tools for Highway Development and Management,” HDM-4 Newsletter, Edgbaston, Birmingham, United Kingdom (January 1998). (HDM 4)
University of Birmingham’s International Study of Highway Development and Management, http://www.bham.ac.uk/publications/civeng/hdm-4. (HDM 4)
University of Kentucky Center for Business and Economic Research, “Economic Justification Spreadsheets User’s Manual,” Lexington, Kentucky (August 1997).
Urban Land Institute, “Industrial and Office Park Council: Business and Industrial Development Handbook,” ULI – The Urban Land Institute, Washington, D.C. (1988).
Vary, D., G. Weisbrod, and G. Treyz, “Economic Implications of Congestion,” NCHRP Report 2-21, Transportation Research Board, National Research Council, Washington, D.C. (March 2001).
Venable, T., “Recreation, Transportation Top Quality of Life Improvements,” Site Selection (August 1990).

Montana Highway Reconfiguration Study Final Report
Cambridge Systematics, Inc. A7-10
Venable, T., “The New Business Location Process, Who’s Driving and Who’s Steering,” Site Selection (April 1996).
Waters, W., “The Value of Commercial Vehicle Time Savings for the Evaluation of Highway Investments: A Resource Saving Approach,” Journal of the Transportation Research Forum, Vol. 35, No. 1 (1995).
Waters, W., “The Value of Time Savings for the Economic Evaluation of Highway Investments in British Columbia,” BC Ministry of Transportation and Highways (1992).
Weisbrod, G., “Assessing the Economic Impact of Transportation Projects: How to Match the Appropriate Technique to Your Project,” Transportation Research Circular #477, Transportation Research Board, National Research Council, Washington D.C. (1997).
Weisbrod, G., “Current Practices for Assessing Economic Development Impacts from Transportation Investments,” NCHRP Synthesis 290, Transportation Research Board (2000).
Weisbrod, G., “Guidance on Using Existing Economic Analysis Tools for Evaluating Transportation Investments (Final Report),” NCHRP Report 2-19(2), Transportation Research Board, National Research Council, Hagler Bailly Services, Inc. (October 1999).
Weisbrod, G., “Issues in Assigning an Appropriate Value of Time,” Working Paper 03–04, Economic Development Research Group, Inc. (September 2003).
Wilbur Smith Associates, “Appalachian Development Highways Economic Impact Study,” Columbia, South Carolina (1998).
Wisconsin DOT, “Translinks 21,” (1994).
Xin, Y., “Study of Regional Economic Benefit Model of Transportation System Projects,” International Journal of Transport Economics (1996), pp. 89-105.
2.0 Software1
DRI
Standard & Poor’s, “Data & Information Management Services: For Competitive Advantage,” DRI/McGraw-Hill Booklet. (DRI)
1 This list taken from NCHRP 2-19(2), Guidance on Using Existing Economic Analysis Tools for
Evaluating Transportation Investments, Final Report, Prepared for National Cooperative Highway Research Program, Transportation Research Board, National Research Council. Glen Weisbrod and Hagler Bailly Services, Inc. October 1999

Montana Highway Reconfiguration Study Final Report
Cambridge Systematics, Inc. A7-11
Standard & Poor’s, “Painting a Complete Picture of a Complex Landscape,” DRI/McGraw-Hill pamphlet. (DRI)
Standard & Poor’s, “Reality-Based Forecasting for Real-World Decisions: U.S. Regional Economic Service,” DRI/McGraw-Hill pamphlet. (DRI)
Standard & Poor’s, “Standard & Poor’s DRI: An Overview,” DRI/McGraw-Hill PowerPoint Presentation (1997). (DRI)
DiNitto, D., Regional Account Manager, Personal Communication, Standard & Poor’s.
HERS
Jack Faucett Associates, “The Highway Economic Requirements System (HERS Manual),” FHWA, U.S. DOT (September 1995). (HERS)
HDM 4
University of Birmingham, “New Tools for Highway Development and Management,” HDM-4 Newsletter, Edgbaston, Birmingham, UK (January 1998). (HDM 4)
University of Birmingham, “International Study of Highway Development and Management Tools,” ISOHDM Newsletter, Edgbaston, Birmingham, UK (September 1997). (HDM 4)
University of Birmingham, “International Study of Highway Development and Management Tools,” ISOHDM Newsletter, Edgbaston, Birmingham, UK (December 1996). (HDM 4)
University of Birmingham’s International Study of Highway Development and Management, http://www.bham.ac.uk/publications/civeng/hdm-4 (HDM 4)
McTrans Center for Microcomputers in Transportation, “Catalog” (19980. (Full Simulation, Travel Demand)
IMPLAN
Alward, G. S., and S. Lindall, “Deriving SAM Multiplier Models Using IMPLAN,” National IMPLAN Users Conference (August 1996). (IMPLAN)
Lindall, S., and D. C. Olson, “The IMPLAN Input-Output System,” The Minnesota IMPLAN Group, Inc. (MIG). (IMPLAN)
Minnesota IMPLAN Group, Inc. (MIG), “Elements of the Social Accounting Matrix,” Technical Report TR-98002. (IMPLAN)
Minnesota IMPLAN Group, Inc. (MIG), http://www.IMPLAN.com (IMPLAN)
Montana Highway Reconfiguration Study Final Report
Cambridge Systematics, Inc. A7-12
NJIT, Rutgers and NJTPA, “The Transportation, Economic, and Land-Use System: A State-of-the-Art Transportation Information System for the 21st Century” (April 1998). (PC I/O, RIMS II, IMPLAN)
MCIBAS
Smith, S., Systems Planning Coordinator, Personal Communication, Indiana Department of Transportation, Personal Communication.
MicroBENCOST
Texas Transportation Institute, “MicroBENCOST User’s Manual,” Prepared for NCHRP 7-12, (October 1993). (MicroBENCOST)
Texas Transportation Institute, http://www.tti.tamu.edu/publications/ror/microb.stm (MicroBENCOST)
McTrans Center for Microcomputers in Transportation, “Catalog” (1998). (Full Simulation, Travel Demand).
NET BC
Bernardin, Lochmueller & Associates, “Indiana Reference Modeling System” (1995). (NET BC)
Grovak, M., Bernardin, Lochmueller & Associates, Inc., Personal Communication. (NET BC)
Ripple, D., Bernardin, Lochmueller & Associates, Inc., Personal Communication. (NET BC)
Smith, S., Systems Planning Coordinator, Indiana Department of Transportation, Personal Communication. (MCIBAS, REMI, NET BC)
PC I/O
Burchell, R., Rutgers University, Center for Urban Policy Research, Personal Communication. (PC I/O, REMI, RIMS II)
Lahr, M., Rutgers University, Center for Urban Policy Research, Personal Communication. (PC I/O, REMI, RIMS II)
NJIT, Rutgers and NJTPA, “The Transportation, Economic, and Land-Use System: A State-of-the-Art Transportation Information System for the 21st Century” (April 1998). (PC I/O, RIMS II, IMPLAN)

Montana Highway Reconfiguration Study Final Report
Cambridge Systematics, Inc. A7-13
REMI
Burchell, R., Rutgers University, Center for Urban Policy Research, Personal Communication. (PC I/O, REMI, RIMS II)
Lahr, M., Rutgers University, Center for Urban Policy Research, Personal Communication. (PC I/O, REMI, RIMS II)
Regional Economic Models, Inc. (REMI), http://www.remi.com (REMI)
RIMS II
Burchell, R., Rutgers University, Center for Urban Policy Research, Personal Communication. (PC I/O, REMI, RIMS II)
Lahr, M., Rutgers University, Center for Urban Policy Research, Personal Communication. (PC I/O, REMI, RIMS II)
NJIT, Rutgers and NJTPA, “The Transportation, Economic, and Land-Use System: A State-of-the-Art Transportation Information System for the 21st Century” (April 1998). (PC I/O, RIMS II, IMPLAN)
U.S. Department of Commerce, Bureau of Economic Analysis, “Regional Multipliers: A User Handbook for the Regional Input-Output Modeling System,” RIMS II Handbook, 3rd edition (March 1997). (RIMS II)
STEAM
Federal Highway Administration and Cambridge Systematics, Inc., “STEAM User’s Manual” (1997). (STEAM)
StratBENCOST
Texas Transportation Institute, “Introduction to StratBENCOST: Strategic Decision Support Tool for Highway Planning and Budgeting,” Version 1.0. (StratBENCOST)

150 copies of this public document were produced at an
estimated cost of 4.04 each, for a total cost of $605.78. This includes $140.00 for postage and $465.78 for printing