Embed Size (px)
Citation preview

HSE Health & Safety
Executive
YO-YO diving and the risk of decompression illness
Prepared by Unimed Scientific Ltd for the Health and Safety Executive 2004
RESEARCH REPORT 214

HSE Health & Safety
Executive
YO-YO diving and the risk of decompression illness
Valerie Flook PhD, CPhys, MInstP UNIMED SCIENTIFIC LIMITED
123 Ashgrove Road West Aberdeen AB16 5FA
United Kingdom
USL has carried out a study of yo-yo diving at the request of UK Health and Safety Executive. Yo-yo diving is defined as a series of dives which have short periods of time spent at depth alternating with similar periods of time on the surface. In general the total duration of the series is within the time constraints for a single dive to the same depth for the maximum time allowed without incurring decompression stops.
The main conclusion is that for the depths at which yo-yo diving normally applies the decompression bubble formation is less when the total time is broken into a series of short dives than when the allowed maximum time is taken up by a single dive. For the depths and times covered by the study the extent of bubble formation, following a series of dives to a single depth, relates in a linear fashion to the actual time spent at depth.
The use of repet dive procedures, fewer longer dives with longer surface intervals, using repet dive tables for guidance, give a higher level of decompression bubble formation than the simple yo-yo dive patterns.
This report and the work it describes were funded by the Health and Safety Executive (HSE). Its contents, including any opinions and/or conclusions expressed, are those of the authors alone and do not necessarily reflect HSE policy.
HSE BOOKS

© Crown copyright 2004
First published 2004
ISBN 0 7176 2835 3
All rights reserved. No part of this publication may bereproduced, stored in a retrieval system, or transmitted inany form or by any means (electronic, mechanical,photocopying, recording or otherwise) without the priorwritten permission of the copyright owner.
Applications for reproduction should be made in writing to: Licensing Division, Her Majesty's Stationery Office, St Clements House, 2-16 Colegate, Norwich NR3 1BQ or by e-mail to [email protected]
ii

CONTENTS
1.0 INTRODUCTION 1
1.1 Procedures 2
1.2 The predictions in perspective 3
2.0 FISH FARM DIVING 5
2.1 UK fish farm profiles 8
2.2 Profiles from an Australian fish farm 10
3.0 DIVING WITHIN THE ENVELOPE 15
3.1 Royal Navy diving 15
3.2 Diving instructors 16
4.0 REDUCING THE RISK ON YO-YO DIVING 20
4.1 The effect of bubbles on gas uptake during subsequent dive 20
4.2 Relationship between bottom time and surface interval 22
5.0 CONCLUSIONS 25
REFERENCES 26
APPENDIX The mathematical model 27
iii

iv

EXECUTIVE SUMMARY
Unimed Scientific Limited has made a study of the pattern of diving which has been called yo-yo diving, repeated dives to depth interspersed with short periods of time at the surface. Each single dive is carried out without a decompression stop on return to the surface, though sometimes a safety stop will be made at 3 msw. This type of diving is carried out in many types of work in water; fish farm diving to remove dead fish from the cages, media diving for underwater filming, diving instructors teaching beginners, military divers and, inadvertently perhaps, by others occupied in shallow water diving who pop to the surface to make a verbal report, pick up tools or ask for further instructions. The study has been extended to include repet diving, repeated dives which are longer than yo-yo dives with much longer surface intervals, for which repet diving tables have been used.
There is a widespread belief that, provided the overall duration of the dive series fits within the time envelope of an allowed dive (with or without decompression stops on the final move to the surface), it is safe to break up the total time into a number of dives. The undesirability and difficulty of making in-water decompression stops in the cold waters of the UK means that most yo-yo diving works within no-decompression limits, exposures allowed by No-D tables, requiring no decompression stops.
The study has been carried out using a mathematical model of decompression bubble formation which has been validated and evaluated for a wide range of hyperbaric exposures. The mathematical model simulates inert gas uptake and bubble formation in the various tissues of the body using text book values for the size of organs and the blood flow through them. The standard laws of physics apply to bubble growth and decay.
The diving considered in this report is all to relatively shallow depths and it may be incorrect to extrapolate these conclusions for diving at greater depths. The quantitative results change as depth increases so too may the qualitative conclusions. For example the temporal pattern of bubble formation in the brain changes as depth increases. For even deeper diving, deeper than 30 msw, it may be that the surface interval has so little effect on total gas load that yo-yo diving is no different from diving the envelope, that is a single dive to the total duration of the series.
One conclusion that can be drawn for all depths is that No-D diving puts the brain at particular risk. The rates of ascent, though generally slow enough to protect the faster tissues, are not slow enough to protect the brain. In general the accepted No-D tables do not protect the brain.
A second conclusion that can be drawn for all depths is that tables drawn up for repet diving to not take into account the way in which the presence of bubbles slows down the removal of gas from the body.
These two conclusions lead the author to believe that dive computers currently in use may not be suitable as a means of determining safe yo-yo diving procedures.
The main conclusions from this work are that yo-yo diving of the type traditionally practised
v

in fish farm diving can be very safe and that dividing the total bottom time into several shorter dives alternating with a surface interval is less of a risk than diving the envelope.
Though, as far as we have the requisite knowledge, it seems that for the depths covered in this report bubble formation in the brain does not reach levels which can be said to be dangerous, once bubbles form there is a random element to the risk. For some individuals, on some occasions, one bubble in the wrong place can lead to severe consequences. This is what makes bubble formation in the brain a particular concern. This reasoning would strengthen the conclusion that several shorter dives, with less time for gas uptake in the brain, could be a much better approach than a single long dive. If the pattern of diving can be such that the brain clears its gas before the end of the subsequent dive then the risk of a single bubble growing large enough to cause trouble is greatly reduced.
vi

1.0 INTRODUCTION
Unimed Scientific Limited has been asked to make a study of the pattern of diving which has been called yo-yo diving, repeated dives to depth interspersed with short periods of time at the surface. Each single dive is carried out without a decompression stop on return to the surface, though sometimes a safety stop will be made at 3 msw. This type of diving is carried out in many types of work in water; fish farm diving to remove dead fish from the cages, media diving for underwater filming, diving instructors teaching beginners, military divers and, inadvertently perhaps, by others occupied in shallow water diving who pop to the surface to make a verbal report, pick up tools or ask for further instructions. It is difficult to make a definitive definition of yo-yo diving to differentiate it from repet diving, the one merging into the other as the duration of bottom time and surface interval time extends.
There is a belief, widespread amongst those who use yo-yo diving, that, provided the overall duration of the dive series fits within the time envelope of an allowed dive (with or without decompression stops on the final move to the surface), it is safe to break up the total time into a number of dives. The undesirability and difficulty of making in-water decompression stops in the cold waters of the UK means that most yo-yo diving works within no-decompression limits, exposures allowed by No-D tables, requiring no decompression stops. Most of the diving presented in this report has been done within No-D limits. USL is aware that there are many individuals diving in UK, in the course of what they regard as their occupation, who follow no guidelines. This report does not include any activities carried out by these divers though the results given here are relevant to their activities in that their diving procedures could be compared with those studied to gain an indication of the level of risk to which they expose themselves.
In the early 1990's HSE responded to what seemed to be an unacceptable level of decompression illness (DCI) which apparently resulted from yo-yo diving. In addition to publishing guidelines about this type of diving they commissioned a study from The Robert Gordon University in Aberdeen which was reported in 1993 by Shields et al. That study in effect focused on the two words in italics in the opening sentence of this paragraph pointing out first, that the level of DCI can be properly evaluated only if the number of cases is considered in relation to the total number of dives carried out and second, that the complete recent diving history of the victim has to be considered rather than simply the dive on which the incident happened. Dealing with the first point they concluded that, having surveyed the industry and estimated the number of dives being carried out, the true incidence of DCI from yo-yo diving lay between 1 in 8,000 and 1 in 250,00 dives; levels which so far as we can tell, compare favourably both with leisure diving and with commercial North Sea diving. Dealing with the second point, Shields et al considered the case against yo-yo diving at best unproven. A decade further on and yo-yo diving is still considered high risk by all except those who carry it out carefully, taking such guidance as they can from other procedures.
Since the Shields report another element has come into the picture in the shape of dive computers. Many feel that to follow the guidance of the dive computer absolutely ensures
1

their safety without questioning in any way the assumptions and, in some cases incorrect facts, which may have been built into the computer. Most centres involved in treating DCI see cases following dives in which the computer was relied on absolutely and even pushed to or slightly beyond its limits. These are mainly leisure divers and divers working at their occupation but ignoring all guidelines. Treatment centres see few cases from those engaged in yo-yo diving carried out according to proven guidelines using the dive computer only to record the dive parameters rather than allowing it to drive the dive.
Against this background USL has undertaken to study the pattern of diving called yo-yo diving and examine the risk using a mathematical model of decompression bubble formation which has been validated and evaluated for a wide range of hyperbaric exposures. Profiles have been obtained from several sources.
1.1 PROCEDURES
The mathematical model simulates inert gas uptake and bubble formation in the various tissues of the body using text book values for the size of organs and the blood flow through them. The standard laws of physics apply to bubble growth and decay. Appendix 1 gives more detailed information about the model.
In this work the output from the model has been quoted as the volume of gas which is predicted to be in the form of bubbles, expressed as µl of gas per ml of tissue or blood, for the brain and the central venous, pulmonary artery (PA), blood. The extent of bubble formation in the brain has been quoted because of all the tissues in the body that which is both critical to life and at greatest risk of bubble formation on decompressions which do not have a decompression stop, is the brain. No-D decompressions are high risk decompressions for the brain.
The predicted bubble formation in central venous blood is quoted because the blood flowing through the pulmonary artery on the way to the lungs is the body tissue in which bubbles can be detected and quantified by ultrasonic techniques. The most commonly used technique for detection is Doppler, scored to the Kisman-Masurel scale (Nishi 2003). For present purposes it is perhaps enough to know that Grade 1 and Grade 2 Doppler scores are not uncommon following decompression and are linked to very low incidence of DCI, Grade 3 bubbles carry a significant risk of DCI and Grade 4 bubbles could only be regarded as a serious level of decompression stress, anything higher is probably going to be fatal.
The model has now been used to simulate thousands of hyperbaric exposures of all kinds. It runs for any inert gas and there is a two gas version which has been used to simulate short heliox dives. It has been possible to compare the model predictions with quantification of decompression bubbles using ultrasound, mainly the Doppler technique though ultrasonic scanning has been used in some trials alongside Doppler. The following list gives the types of hyperbaric exposure for which the model has been used, the items marked * denote those for with comparisons have been made with Doppler scores.
Recreational dives including trimix and repet diving
2

* Repeat diving for fish farm work
Saturation diving and excursions
* Mine-countermeasures closed circuit heliox diving
* Free ascent submarine escape procedures
* Hyperbaric oxygen treatment chamber attendants
Accelerated decompression from saturation
Treatment tables for DCI
* Compressed air exposures in the construction industry.
Because the model uses the blood flow through the tissue to remove inert gas from the tissue, in direct imitation of what happens in the body, it is necessary to take account of the increased blood flow which occurs in muscle during physical activity. In the work reported here it has been assumed that physical activity is carried out throughout the dives to an extent equivalent to about 10 to 20% of maximum capacity, a heart rate of about 100 beats per minute. This is a relatively low level of work which could be undertaken for several hours without the need to rest. This is probably a good average representation of the actual intermittently varying levels of activity during a series of dives.
In all the work reported here bottom time has been taken to include compression time as well as the time at depth up to the start of decompression. Surface interval time has been taken to include decompression and time on the surface up to the beginning of the next compression.
1.2 THE PREDICTIONS IN PERSPECTIVE
The predictions made by the model are quoted as numbers which are useful for comparing procedures, a higher value for the volume of gas carried in bubbles must mean a procedure having greater risk. This is useful for evaluating different procedures and for designing procedures with lower risk but does not tell the general reader much in terms of absolute level of risk. The trials and field work carried out by USL during recent years have gradually built up useful relationships between model predictions and risk to the diver.
As a result of the work with Doppler bubbles evaluation it is now possible to used the model predictions to estimate the probable Doppler score which would be seen in the majority of a number of subjects undergoing the identical exposure. Model predictions can be used to give an idea of the median Doppler score. If the highest Doppler scores for each subject, in a group of subjects undergoing the same hyperbaric procedure, are written out in order of descending, or ascending, magnitude the score which is exactly halfway down the list is the median score for that group of subjects. Where predictions are made for likely Doppler scores it is this median value which is given. Within any group of individuals there will always be a range of Doppler scores.
3

Doppler scores in an individual can be used to give an approximate estimate of the risk of DCI using the work of Nishi (2003). However, as there is considerable individual variability in the extent of formation of detectable bubbles and as there is a random element in the occurrence of symptoms of DCI, moving from model prediction to Doppler score and on to likely DCI rates brings in many uncertainties and assumptions. The best use of the model is to compare predicted levels of bubble formation for different procedures.
As already explained, the type of diving procedures covered in this report represents a special risk to the brain. Model predictions of brain gas in bubbles are not easily compared with any known measurements however some information has been gained. Neuropathologists have some experience of the extent to which the contents of the skull can increase in volume before death is the inevitable outcome. A figure of 4%, 4 ml per 100 ml, 40 µl/ml, is sometimes quoted as the limit. This compares well with a death from decompression bubbles which was not preventable by recompression treatment following an explosive decompression which the model predicted to give 35.5 µl/ml for gas in bubbles in the brain. Trials of military diving for which there is a great deal of Doppler data and information about the DCI rate, used procedures predicted by the model to give a maximum volume of gas carried as bubbles in the brain of 11.6 µl/ml so this can be taken as a level which can be survived. No CNS DCI cases were reported in those trials. These number can be used to put the results in this report into some kind of perspective.
4

2.0 FISH FARM DIVING
The traditional fish farm diving pattern is a number of relatively short dives interspersed by surface intervals of similar duration to the time spent at depth. There will normally be a small range of depths involved with no particular attention paid to the idea that the deeper dives should be done first.
Figure 1 gives an example of the pattern of pressure changes for diving within the fish cages to remove dead fish. This is drawn from Shields et al (1993) and is an idealised profile rather than a profile which has been dived. However it is a useful profile to use as an introduction to the patterns of gas uptake and bubble formation which occur during this type of diving.
Figure 1 Pressure profile of a series of fish farm dives to remove dead fish
Figure 2 shows the profile together with the pattern of gas uptake in 3 types of tissue; the major visceral organs in the body, brain and muscle. It has been assumed that the blood flow to muscle is increased throughout the whole period due to the increased physical activity. The viscera is the tissue type which follows most closely the pressure profile and
5

6
has the greatest uptake but also the greatest inert gas removal during the surface interval. Muscle on the other hand has the least uptake but it does not clear the gas between dives and, depending on the precise relationship between bottom time and surface interval, there can be a steady increase in nitrogen in the muscle as the dives proceed. Brain behaves in a way somewhere in between being slower than viscera and faster than working muscle.
Figure 2 Gas uptake in three tissue types For the pressure profile shown in figure 2 only viscera and brain form bubbles and the pattern of bubble formation and decay is shown in figure 3. Bubbles form in these tissues after each dive and are compressed by the subsequent dive. At no time does the level of inert gas in the muscle become great enough for bubbles to form in that tissue. The maximum bubbles formation in the brain amounts to 0.22 µl/ml.

7
Figure 3 Bubble formation in viscera and brain Figure 4 Bubble formation in central venous blood

Figure 4 shows the volume of gas carried as bubbles in the central venous blood. The central venous bubbles are those which can be detected by ultrasonic techniques such as Doppler. In the mathematical simulations the extent of central venous blood bubbles is calculated as a weighted mean of the volume of gas carried as bubbles in the venous streams draining all the tissues. The maximum level of central venous gas in bubbles, 0.12 µl/ml, would be undetectable by Doppler in almost all subjects.
It is apparent from these figures that this type of diving activity could be continued for more descents without any significant increase in risk. The gas load in the muscle will build up slowly at a rate dependent on the depth and duration of each dive and the duration of the surface interval, but were the number of dives shown in figure 1 doubled the muscle still would not have enough gas to form bubbles provided the pattern of the dives was similar to that shown in figure 1.
The critical tissue which has to be considered for No-D diving is the brain tissue which does form bubbles, Figure 3 shows bubbles to be present in the brain after every dive but the extent of bubbling is dependent only on that dive, there is no carry-over from one dive to the next.
The profile in figure 1 has been studied further by looking at the effect of changes such as increased duration of some dives and reduced duration of surface intervals. It has been found to be very robust in that changes of a few minutes to bottom times or surface intervals do not bring about any changes in bubble formation which would change the general statements in the previous 2 paragraphs.
The main feature of the idealised profile shown in figure 1, and in the changes to the profile described in the previous paragraph, is that the duration of the surface interval is very similar to the duration of the previous excursion to depth. This may not be true of real fish farm procedures. The availability of dive computers means that it is now possible to record real dive profiles and the next section deals with profiles recorded during fish-farm work in the UK.
2.1 UK FISH-FARM PROFILES
Figure 5 shows three profiles dived on a UK fish farm during the first week of December 2003. None conform to the idealised profile given in figure 1. Profile 2 is the only one which includes a number of surface intervals and which might come under the description of yo-yo diving. Profile 1 shows many depth changes but these are of 6 msw or less. The characteristics of the profiles are summarised in Table 1.
8

9
Figure 5 Profiles recorded during fish farm work TABLE 1 Characteristics of the profiles in Figure 5
Dive Total duration (mins)
Total time on bottom (mins)
Number of dives
Depth range (msw)
1 39 32 2 12 - 18.4
2 97 67.5 7 12 - 17.5
3 33 30 1 16.5 - 20.0
These dives have been simulated in the same way as the dive given in figure 1. It has been assumed that there was muscular activity throughout the profile and blood flow to the muscle has been increased accordingly. The duration of most dives is sufficient to cause bubbles to form in the muscle and this is the main difference between these profiles and the idealised profile. The results are presented (Table 2) in terms of the maximum volume of gas in bubbles in the
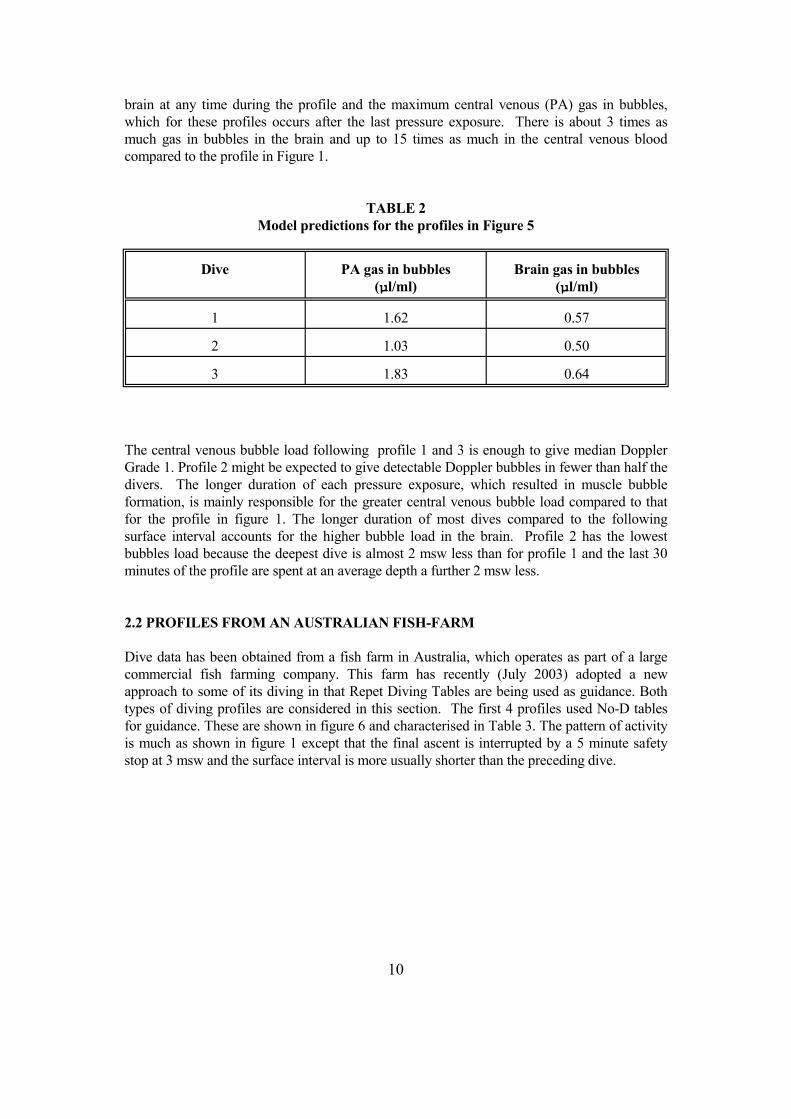
brain at any time during the profile and the maximum central venous (PA) gas in bubbles, which for these profiles occurs after the last pressure exposure. There is about 3 times as much gas in bubbles in the brain and up to 15 times as much in the central venous blood compared to the profile in Figure 1.
TABLE 2 Model predictions for the profiles in Figure 5
Dive PA gas in bubbles (µl/ml)
Brain gas in bubbles (µl/ml)
1 1.62 0.57
2 1.03 0.50
3 1.83 0.64
The central venous bubble load following profile 1 and 3 is enough to give median Doppler Grade 1. Profile 2 might be expected to give detectable Doppler bubbles in fewer than half the divers. The longer duration of each pressure exposure, which resulted in muscle bubble formation, is mainly responsible for the greater central venous bubble load compared to that for the profile in figure 1. The longer duration of most dives compared to the following surface interval accounts for the higher bubble load in the brain. Profile 2 has the lowest bubbles load because the deepest dive is almost 2 msw less than for profile 1 and the last 30 minutes of the profile are spent at an average depth a further 2 msw less.
2.2 PROFILES FROM AN AUSTRALIAN FISH-FARM
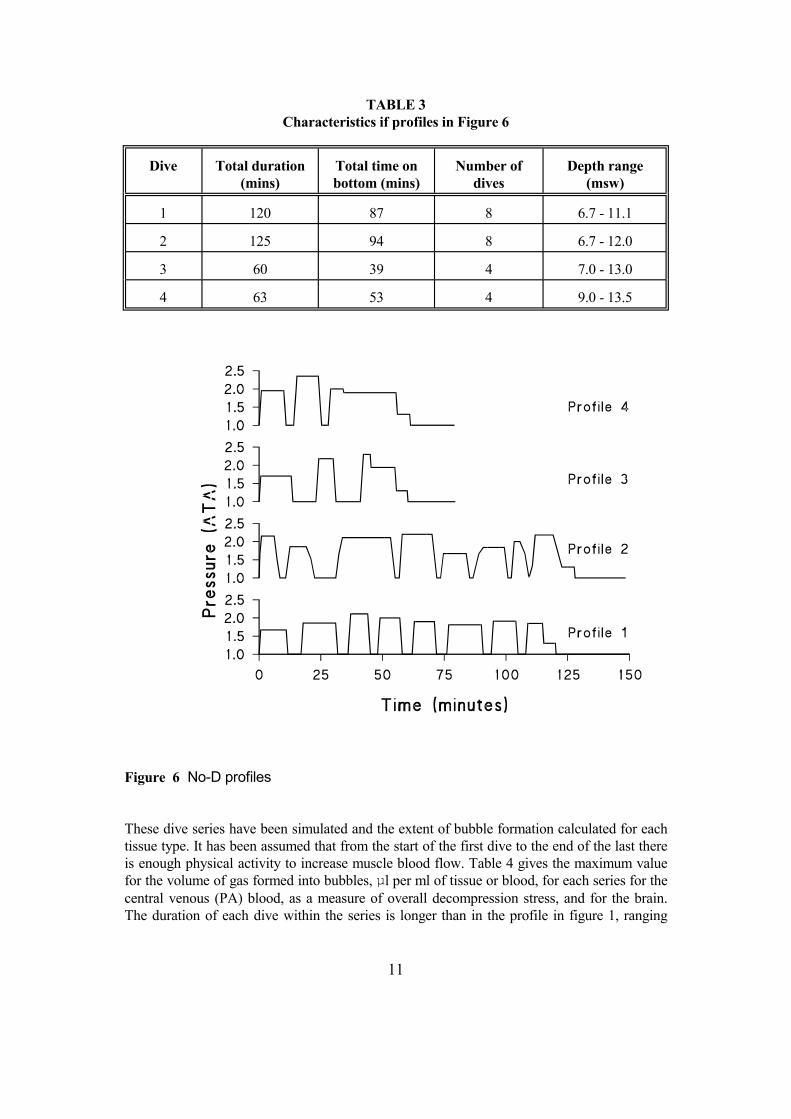
Dive data has been obtained from a fish farm in Australia, which operates as part of a large commercial fish farming company. This farm has recently (July 2003) adopted a new approach to some of its diving in that Repet Diving Tables are being used as guidance. Both types of diving profiles are considered in this section. The first 4 profiles used No-D tables for guidance. These are shown in figure 6 and characterised in Table 3. The pattern of activity is much as shown in figure 1 except that the final ascent is interrupted by a 5 minute safety stop at 3 msw and the surface interval is more usually shorter than the preceding dive.
10
11
TABLE 3 Characteristics if profiles in Figure 6
Dive Total duration (mins)
Total time on bottom (mins)
Number of dives
Depth range (msw)
1 120 87 8 6.7 - 11.1
2 125 94 8 6.7 - 12.0
3 60 39 4 7.0 - 13.0
4 63 53 4 9.0 - 13.5
Figure 6 No-D profiles These dive series have been simulated and the extent of bubble formation calculated for each tissue type. It has been assumed that from the start of the first dive to the end of the last there is enough physical activity to increase muscle blood flow. Table 4 gives the maximum value for the volume of gas formed into bubbles, µl per ml of tissue or blood, for each series for the central venous (PA) blood, as a measure of overall decompression stress, and for the brain. The duration of each dive within the series is longer than in the profile in figure 1, ranging
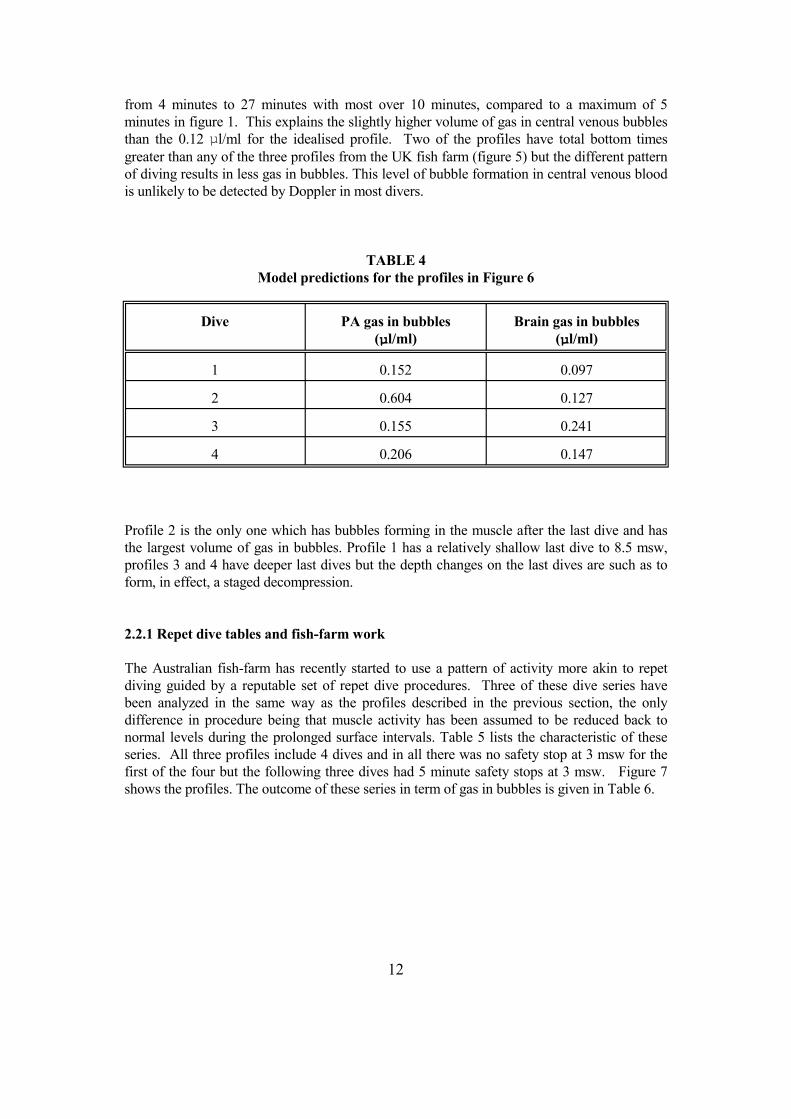
from 4 minutes to 27 minutes with most over 10 minutes, compared to a maximum of 5 minutes in figure 1. This explains the slightly higher volume of gas in central venous bubbles than the 0.12 µl/ml for the idealised profile. Two of the profiles have total bottom times greater than any of the three profiles from the UK fish farm (figure 5) but the different pattern of diving results in less gas in bubbles. This level of bubble formation in central venous blood is unlikely to be detected by Doppler in most divers.
TABLE 4 Model predictions for the profiles in Figure 6
Dive PA gas in bubbles (µl/ml)
Brain gas in bubbles (µl/ml)
1 0.152 0.097
2 0.604 0.127
3 0.155 0.241
4 0.206 0.147
Profile 2 is the only one which has bubbles forming in the muscle after the last dive and has the largest volume of gas in bubbles. Profile 1 has a relatively shallow last dive to 8.5 msw, profiles 3 and 4 have deeper last dives but the depth changes on the last dives are such as to form, in effect, a staged decompression.
2.2.1 Repet dive tables and fish-farm work
The Australian fish-farm has recently started to use a pattern of activity more akin to repet diving guided by a reputable set of repet dive procedures. Three of these dive series have been analyzed in the same way as the profiles described in the previous section, the only difference in procedure being that muscle activity has been assumed to be reduced back to normal levels during the prolonged surface intervals. Table 5 lists the characteristic of these series. All three profiles include 4 dives and in all there was no safety stop at 3 msw for the first of the four but the following three dives had 5 minute safety stops at 3 msw. Figure 7 shows the profiles. The outcome of these series in term of gas in bubbles is given in Table 6.
12

13
Figure 7 Profiles for repet diving procedures used by Australian fish farm TABLE 5 Characteristics of the profiles in Figure 7
Dive Total duration (mins)
Total time on bottom (mins)
Number of dives
Depth range (msw)
5 417 66 4 10.5 - 15.0
6 481 53 4 10.0 - 19.0
7 449 72 4 12.0 - 17.0

TABLE 6 Model predictions for the profiles in Figure 7
Dive PA gas in bubbles (µl/ml)
Brain gas in bubbles (µl/ml)
5 1.075 0.391
6 1.560 0.549
7 1.560 0.620
With this diving pattern, depth is greater and the time for most dives is greater than in the pattern previously used by the Australian fish farm. The total bottom times are less than the greatest for the profiles shown in Figure 6. The effects of the longer and deeper exposures are not offset by the big increases in SI because much of the gas formed into bubbles is in the faster tissues. Long surface intervals are of benefit only if the slower tissues are bubbling and then they need to be very much longer than used in these profiles.
In this type of diving the maximum gas carried as bubbles in the central venous blood is not necessarily after the final dive; for profile 5 the maximum PA gas is after the 3rd dive, profile 6 after the 2nd dive, profile 7 after the 4th dive. The levels are such that Doppler Grade 1 might be the median value for profiles 6 and 7. Bubbles might be detected by Doppler in fewer than half the divers for profile 5.
A direct comparison can be made between profile 4 and profile 6, both having 53 minute bottom time. Profile 6 is predicted to give much more gas in bubbles. It is deeper on some dives. In addition the final dive on profile 4 acts as a staged decompression reducing bubble formation at the end of the profile. The final dive on profile 4 does start with excess gas from the earlier dives but the staged decompression gives time for it to be removed before the final decompression. In profile 6 the final dive starts with excess gas from the earlier dive, which itself started with excess gas so this profile has allowed a steady increase of gas in the muscle. The long surface intervals are not long enough to clear the excess gas from the muscle once bubbles have formed.
14

15
3.0 DIVING WITHIN THE ENVELOPE In addition to fish farm diving there are several types of diving activity in which repeated alternations between descent to depth and ascent to surface are used, diving which follows some variation of the pattern shown in figure 1. It is common in these types of diving to follow the decompression procedure appropriate for a dive to the same depth for a time equal to that from the first descent to the end of the final ascent, the "envelope" of the overall diving pattern. Often the diving will be restricted so that the "envelope" is in fact a dive which requires no decompression stops. The work described in this chapter looks in more detail at this type of diving. The procedures used as the starting point derive from two sources, the military and from one of the diving organisation which teach leisure divers and whose instructors undertake several dives separated by short surface intervals. 3.1 ROYAL NAVY DIVING The Royal Navy has provided details of several procedures of this type, multiple dives underta ken within a total time not exceeding the no-decompression stop limits for the depth. The two profiles with the greatest number of depth changes have been studied, these are shown in figure 8. What is not recorded in the data, and therefore not taken into consideration, is the fact that the divers may have made brief returns to the surface to, for example, pick up tools. Given the outcome of the analysis of the profiles given in Figure 1 these brief returns could cause increased risk of brain bubbles but this increased risk could be delayed to the end of the series if the surface intervals are very short and bubble growth curtailed. This concept is dealt with in more detail in section 4.1. The two profiles are shown in figure 8.
Figure 8 Profiles used by the Royal navy

Both these profiles are within the envelope for No-Decompression limits of the RN tables which allow 120 minutes at 12 msw. Total time spent at depth is 58 minutes for profile 1 and 40 minutes for profile 2. Table 7 gives the volume of gas carried in bubbles in brain and in central venous blood for each dive of the 2 profiles.
The amount of gas predicted to form into bubbles in the brain during each surface interval follows the pattern of the duration of the preceding dive except for the surface interval between the 5th and 6th dive on Profile 2 when the duration of the surface interval is too short to allow the bubbles to develop. Central venous gas in bubbles also includes contributions from the slower tissue such as muscle and therefore shows the combination of 2 influences, the duration of the dive just completed plus a steady build up of gas over dives subsequent to the first, though the short surface interval between dives 3 and 4 on profile 1 and 5 and 6 on profile 2 mask this pattern. The build up of gas means that the maximum bubbles in central venous blood are at the end of the complete profile.
TABLE 7 Predictions for gas in bubbles for each surface interval in Figure 8
Dive number 1 2 3 4 5 6
Profile 1
Brain 0.40 0.35 0.27 0.21
Central venous 0.98 1.24 1.02 1.78
Profile 2
Brain 0.27 0.17 0.27 0.27 0.11 0.03
Central venous 0.11 0.08 0.44 1.11 0.77 1.74
3.2 DIVING INSTRUCTORS
The pattern of diving used in this section has been put together following a conversation with the head of one of the diver training agencies. It is based on diving to 30 msw within a No-D envelope. Descent is at 30 msw/min and ascent at 15 msw/min.
The NoD dive taken as the envelope is 24 minutes at 30 msw which for yo-yo diving has been divided into 4 equal segments of 6 minutes each. Three dive patterns have been studied: 3 minutes dive with 3 minutes surface interval, 2 minutes dive with 4 minutes surface interval and 4 minutes dive with 2 minutes surface interval. Table 8 gives details of the total bottom time with the predicted maximum volume of gas formed into bubbles in the brain and in the
16

central venous (PA) blood. The maximum value for both brain and central venous bubbles comes at the end of the profile for each pattern. The single square dive, 24 minutes at 30 msw has also been simulated. As in the rest of this work bottom time includes compression time, surface interval time includes decompression time.
TABLE 8 Predictions for different pattern within the 30 msw NoD envelope
Dive:SI Bottom time (mins) PA gas in bubbles (µl/ml)
Brain gas in bubbles (µl/ml)
4:2 8 1.52 0.68
3:3 12 2.34 1.04
2:4 16 2.78 1.40
Envelope 22 3.57 1.85
These results show that in terms of gas dynamics and bubble formation yo-yo diving within an envelope results in less decompression stress than the equivalent single square dive. The volumes of gas predicted to be in both brain and central venous bubbles is considerably greater than that seen for any other dives considered so far. This is a result of the much greater depth.
The profile with the 8 minutes total bottom time would give Doppler detectable bubbles with a median value of borderline Grade 1; the 12 and 16 minutes bottom times would give bubbles with a median value Doppler grade 1 and the 22 minutes bottom time might be expected to give median Doppler score closer to Grade 2.
The data in Table 8 have been analyzed to determine the relationship between the total duration of the bottom time and both central venous blood bubbles and brain bubbles. The extent of bubble formation relates linearly to total bottom time.
Figure 9 shows the pattern of bubble formation in the central venous blood. A very similar picture is obtained for brain bubbles. The extent of bubble formation increases slightly with each succeeding dive but the major bubbles formation is at the end of the fourth dive. Bubble formation from the "envelope" dive occurs only at the end.
17

18
Figure 9 Central venous bubble formation for the different dive patterns Bubble formation between dives is limited by the duration of the surface interval as the bubbles take a finite time to reach maximum size. So though the dive:SI ratio of 4:2 has the longest dives, and therefore the greatest gas loading, the bubbles in the first 3 surface intervals are the smallest, 2 minutes not being long enough for the bubbles to grow. The bubbles in brain show the same pattern, most gas in bubbles after the final dive even when the ratio of dive to surface interval is 2:4, a surface interval twice as long as the dive. This is different from the pattern of brain bubbles for the dive shown in figure 1. What is happening is that the greater depth means that the bubble formation in the brain after each dive is so great that neither the duration of the surface interval nor the next dive can get rid of the brain bubbles. This effect is shown in figure 10. The lower part of the figure shows the same dive as in figure 1 together with the volume of gas as bubbles in brain tissue (dashed lines). The bubbles from each dive are cleared by the subsequent dive and the amount of bubble formation in the brain is related only to the preceding dive. The upper part of the figure shows the same pattern of diving but to the greater depth of 30 msw. Here the bubbles in the brain are not cleared between dives, nor does the subsequent dive remove them and there is a steady build up of gas in bubbles leading to the maximum value for brain bubbles at the end of the profile.

19
Figure 10 Brain bubbles for profile as in figure 1 (lower) and to 30 msw (upper)

4.0 REDUCING THE RISK ON YO-YO DIVING
It is obvious from the work presented in the two preceding chapters that there cannot be a single simple rule to follow to reduce the risk of yo-yo diving. Carried out following the pattern given in Figure 1 the risk is extremely low and could be reduced further by designing profiles taking account only of the bubble formation in brain. The pattern of diving shown in Figure 5 would require a different approach because much of the gas in the central venous blood comes from muscle, a relatively slow tissue. Reducing bubble formation in muscle must not be done at the expense of the brain.
This chapter looks; first at the effect of bubbles on uptake of inert gas during a subsequent dive to determine if there is advantage to be gained from keeping surface intervals very short to prevent bubble growth; second at the relative importance of bottom time and surface time for the volume of gas which will form into bubbles.
4.1 THE EFFECT OF BUBBLES ON GAS UPTAKE DURING SUBSEQUENT DIVE
As already mentioned the extent to which bubbles grow during the surface interval is limited if the surface interval is short. Figure 11 shows the growth of bubbles in brain tissue following a 5 minutes bottom time at 30 msw. The arrows mark the extent to which the bubbles would grow for a surface interval of 2, 4 6 and 8 minutes (surface interval includes decompression time). The extent to which bubbles grow determines how long into the subsequent dive the bubbles last but this has no effect on the total amount of excess gas present at the start of this second dive. That is always the volume in bubbles plus the volume dissolved in the tissue. However, the form in which the excess gas is carried, in bubbles or in solution, could affect the uptake during the second dive because the presence of bubbles has a strong influence on the inert gas partial pressure gradient, the gradient which drives the gas uptake during the second dive.
A second dive which starts with bubbles present in the tissue will start with an inert gas pressure slightly higher than that at the beginning of the first dive but lower than if all the gas were in solution with none in bubbles. As soon as the pressure increases and the bubbles begin to reduce in size, pushing the gas back into solution in the tissue, then inert gas pressure in the tissue will be increased. The arterial to venous inert gas partial pressure gradient will be lower so that uptake on the second dive will be slower.
20

21
Figure 11 Bubble growth in brain during time spent on the surface Calculations show that in fact the gas which is in the tissues as bubbles at the start of the second dive is simply added to the normal uptake during the second dive and the uptake proceeds at a rate appropriate to that point on the uptake curve. The effect of bubbles on the rate of inert gas uptake is irrelevant. At the end of the second dive the total volume of inert gas in the tissue is equal to what would have been taken up by a dive of that duration plus whatever was left over, in bubbles or in solution, from the first dive. This is true for all subsequent dives up to the point at which the tissue becomes saturated. If the surface interval lasts long enough for the bubbles to begin to shrink before the second dive than the amount of excess gas at the start of the second dive is less. Thus a second dive which starts whilst bubbles are still growing will end with the same amount of inert gas no matter how long the surface interval. Once the bubbles have started to shrink and lose gas during the surface interval the volume of gas at the end of the second dive will be reduced by the volume lost during the surface interval. The rate at which bubbles grow and clear is different for each tissue type and therefore there is unlikely to be one simple rule, relating dive time to surface interval time, to give equal levels of risk to all tissues. Figure 11 showing bubble growth during the surface interval, is drawn for brain tissue. Obviously the line for a faster tissue rises more quickly and that for slower tissues would rise more slowly. This shows that designing safer yo-yo procedures for the
whole body is probably not possible. The way ahead must be to design for the tissue most at risk.
4.2 RELATIONSHIP BETWEEN BOTTOM TIME AND SURFACE INTERVAL
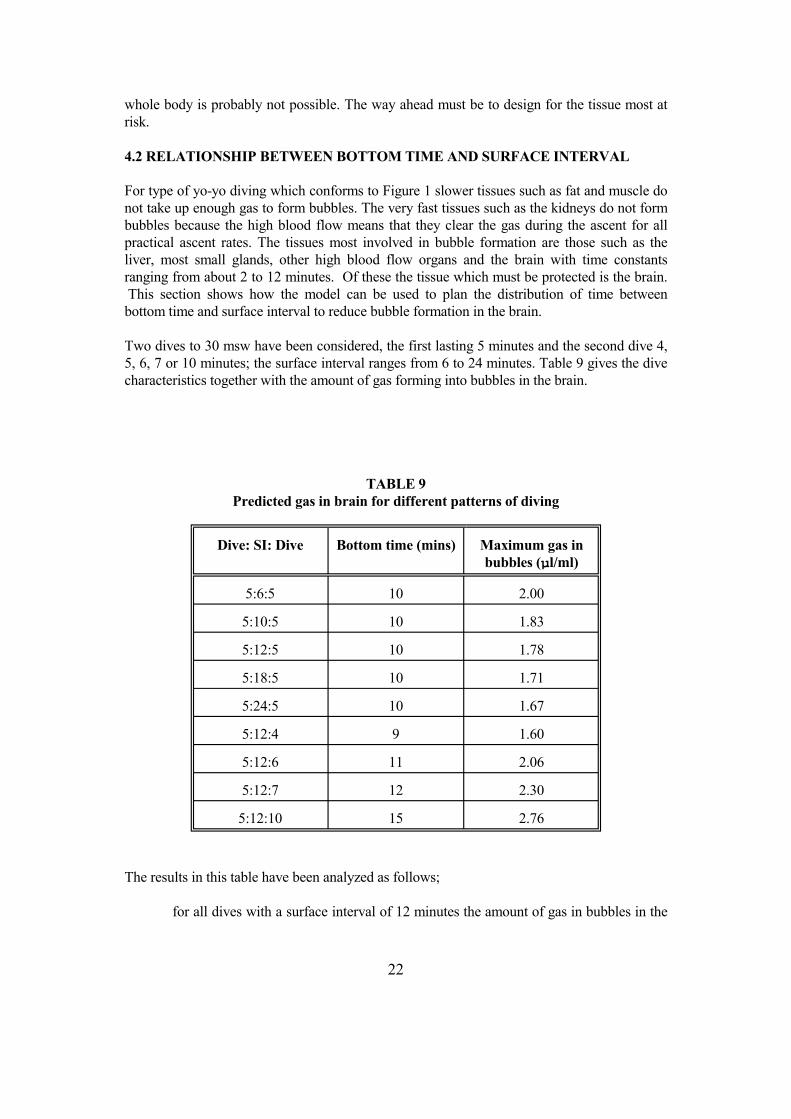
For type of yo-yo diving which conforms to Figure 1 slower tissues such as fat and muscle do not take up enough gas to form bubbles. The very fast tissues such as the kidneys do not form bubbles because the high blood flow means that they clear the gas during the ascent for all practical ascent rates. The tissues most involved in bubble formation are those such as the liver, most small glands, other high blood flow organs and the brain with time constants ranging from about 2 to 12 minutes. Of these the tissue which must be protected is the brain. This section shows how the model can be used to plan the distribution of time between bottom time and surface interval to reduce bubble formation in the brain.
Two dives to 30 msw have been considered, the first lasting 5 minutes and the second dive 4, 5, 6, 7 or 10 minutes; the surface interval ranges from 6 to 24 minutes. Table 9 gives the dive characteristics together with the amount of gas forming into bubbles in the brain.
TABLE 9 Predicted gas in brain for different patterns of diving
Dive: SI: Dive Bottom time (mins) Maximum gas in bubbles (µl/ml)
5:6:5 10 2.00
5:10:5 10 1.83
5:12:5 10 1.78
5:18:5 10 1.71
5:24:5 10 1.67
5:12:4 9 1.60
5:12:6 11 2.06
5:12:7 12 2.30
5:12:10 15 2.76
The results in this table have been analyzed as follows;
for all dives with a surface interval of 12 minutes the amount of gas in bubbles in the
22

brain has been regressed against total bottom time;
for a total bottom time of 10 minutes the gas in bubbles has been regressed against surface interval.
Both relationships are well described by linear regression, correlation coefficients 0.99 and 0.92 respectively. The regressions show that gas carried as bubbles in the brain at the end of the second dive increases by 0.196 µl/ml for each extra minutes of bottom time and decreases by 0.0165 µl/ml for each extra minute of surface interval.
This means that for every extra minute added to total bottom time the surface interval between the two dives must be increased by 11.9 minutes.
This relationship depends on depth. Table 10 gives the results for the same pattern of dives but to 15 msw rather than 30 msw.
TABLE 10 Predicted gas in brain for different patterns of diving
Dive: SI: Dive Bottom time (mins) Maximum gas in bubbles (µl/ml)
5:6:5 10 0.517
5:10:5 10 0.447
5:12:5 10 0.428
5:18:5 10 0.389
5:24:5 10 0.386
5:12:4 9 0.370
5:12:6 11 0.543
5:12:7 12 0.654
5:12:10 15 0.794
Again linear regressions apply, correlation coefficient 0.98 and 0.90. The extra gas carried as bubbles at the end of the second dive increases by 0.073 µl/ml for each extra minute of bottom time and is reduced by 0.0068 µl/ml for each extra minute of surface interval. At this depth every extra minute of bottom time requires 10.7 extra minutes of surface time to clear the extra gas.
Totally different relationships may apply for other tissues.
23

For other patterns of diving, for example as bottom time increases so that there is bubble formation in muscle, it would be necessary to make similar calculations for both the brain and the central venous blood. This would allow patterns of diving to be designed which gave overall protection from the risk of DCI without increasing the risk to the brain.
24

5.0 CONCLUSIONS
The diving considered in this report is all to relatively shallow depths and it may be incorrect to extrapolate these conclusions for diving at greater depths. Examination of Figure 10 shows that not only do the quantitative results changing as depth increases so too may the qualitative conclusions. Figure 10 shows how the temporal pattern of bubble formation in the brain changes as depth increases. For even deeper diving, deeper than 30 msw, it may be that the surface interval has so little effect on total gas load that yo-yo diving is no different from diving the envelope. That being said it may be that deep yo-yo diving is never an attractive option as the allowed bottom time become shorter and the distance to be travelled increases.
One conclusion that can be drawn for all depths is that No-D diving puts the brain at particular risk. The rates of ascent though generally slow enough to protect the faster tissues are not slow enough to protect the brain. In general the accepted No-D tables do not protect the brain.
A second conclusion that can be drawn for all depths is that tables drawn up for repet diving to not take into account the way in which the presence of bubbles slows down the removal of gas from the body. Though not a major part of this report this aspect of decompression is touched on in discussion of the profiles shown in Figure 7.
These two conclusions lead the author to believe that dive computers currently in use may not be suitable as a means of determining safe yo-yo diving procedures.
The main conclusions from this work are that yo-yo diving of the type traditionally practised in fish farm diving can be very safe and that dividing the total bottom time into several shorter dives alternating with a surface interval is less of a risk than diving the envelope.
Though, as far as we have the requisite knowledge, it seems that for the depths covered in this report bubble formation in the brain does not reach levels which can be said to be dangerous, once bubbles form there is a random element to the risk. For some individuals, on some occasions, one bubble in the wrong place can lead to severe consequences. This is what makes bubble formation in the brain a particular concern. This reasoning would strengthen the conclusion that several shorter dives, with less time for gas uptake in the brain, could be a much better approach than a single long dive. If the pattern of diving can be such that the brain clears its gas before the end of the subsequent dive then the risk of a single bubble growing large enough to cause trouble is greatly reduced.
25
REFERENCES
Evans A, Walder DN. Natural uranium and decompression sickness. In: Underwater Physiology VI. Eds Schilling CW, Beckett MW. FASEB Bethesda pp 469-474 1978
Flook V Decompression Trials, National Hyperbaric Centre 1999. Offshore Technology Report OTO 1999 053. Published by UK Health and Safety Executive.
Flook V Trials of a Blackpool Table decompression with oxygen as the breathing gas. CRR 369/2001 Published by UK Health and Safety Executive.
Flook V Decompression bubbles in miners following a 6 hour exposure to 1.1 bar gauge USL 23-002 2002
Flook V, Brubakk AO. Validation of a mathematical model of decompression gas phase. SINTEF Unimed UK. STF78 F96104 1996.
Fox JA, Hugh AE. An analytical investigation into the possibility of gas cavitation in the circulation. Phys Med Biol 9: 359-370, 1964.
Mapleson, WW. An electrical analogue for uptake and exchange of inert gases and other agents. J. Appl. Physiol. 18:197-204, 1963.
Nishi, RY. Brubakk AO, Eftedal OS. Bubble detection. In: Bennett and Elliott's Physiology and Medicine of Diving. Eds Brubakk AO, Neuman TS W.B. Saunders Ltd. 5th edition 2003.
Shields TG, Cattanach S, Duff P, Evans SA, Wilcock SE. Decompression sickness arising from diving at fish farms. Robert Gordon University 1993.
Van Liew, HD, Burkard ME. Density of decompression bubbles and competition for gas among bubbles, tissue, and blood. J. Appl. Phyiol. 75: 2292-2301, 1993.
Vann, RD. Exercise and circulation in the formation and growth of bubbles. In Supersaturation and bubble formation in fluids and organisms. Eds Brubakk AO, Hemmingsen BB and Sundnes G. Royal Norwegian Society of Sciences and Letters The Foundation. Trondheim 1989.
Yount, DE, Strauss RH. Bubble formation in gelatin: A model for decompression sickness. J Appl Phys 47: 5081-5089, 1976.
26

APPENDIX
A1.2 THE MATHEMATICAL MODEL
The mathematical model is based on that of Mapleson (1963) which treats the body as eight parallel compartments having the physiological and anatomical characteristics of identifiable tissues. This model allows quantification of inert gas uptake and distribution. Bubble growth during and following decompression is simulated using the physical relationships given in Van Liew and Burkard (1993). In the gas dynamics section all tissues are handled concurrently. In the bubble growth section each tissue is handled independently for the duration of the bubbles. This allows quantification of the volume of gas which is carried in bubbles in each tissue. It is also possible to determine the volume of gas carried in bubbles in the pulmonary artery, central venous blood, by calculating a weighted mean of gas in bubbles in the venous drainage from each tissue.
A1.2.1 Gas dynamics
The uptake of inert gas during the time spent at depth is calculated in the gas dynamics section of the model. The eight compartments are defined so that each contains all the tissues which have the same time constant. As described in Mapleson, the time constant for each tissue is the total capacity for the inert gas in the tissue divided by the rate of supply/removal of gas in the blood. This is expressed as:
( vt x l t )+( q x lb )t
( &q x lb )t
vt, qt and t are the volume of tissue, the volume of blood contained within the tissue and the blood flow through the tissue respectively. λt and λb are the partition coefficients for tissue:gas and blood:gas.
Blood flow to each tissue can be changed to simulate different physiological conditions.
27

Tissue volumes can be changed to allow simulations of different body shapes. Tissue groupings are listed in Table A1 together with the time constant for each compartment for nitrogen, for a standard 70 kg man at rest. The model can also be used with more compartments. For example a 9th compartment can be used to represent the proportion of the muscle which is involved in physical activity, or the skin to simulate conditions of thermal regulation of skin blood flow.
The values used for the partition coefficients are "best values" for the Ostwald solubility coefficient taken from the literature, notably from two reviews, Steward et al (1973) and Weathersby et al (1980). These are for nitrogen in blood and all tissues except fat 0.0148 (units are ml/ml equilibration at 101 kPa volume measured at standard pressure and 37oC) and for fat 0.066.
TABLE A1 Characteristics of each compartment. Time constant in minutes.
Compartment Tissues Time constant
1 Adrenals, kidneys, thyroid 0.86
2 Heart, brain grey matter 1.87
3 Liver plus portal system, other small glands and organs 3.07
4 Brain white matter 5.31
5 Red marrow 12.25
6 Muscle and skin 50.62
7 Nonfat subcutaneous 69.14
8 Fatty marrow and fat 211.3
Uptake and washout of inert gas in each compartment is calculated using an exponential relationship. The calculation is reiterated at small time intervals.
This section of the model requires, as input, the pressure profile and the breathing gas mixture. At each time increment the model calculates:
the arterial oxygen and arterial inert gas partial pressure;
the venous oxygen partial pressure from a standard oxyhaemoglobin
28

dissociation curve;
venous inert gas partial pressures.
Arterial and venous carbon dioxide pressures for the body at rest are assumed to be the textbook standards of 5.5 and 6.1 kPa. In the standard format each tissue is assumed to be in equilibrium with the venous blood draining it and inert gas exchange at the lungs is assumed to be complete in a single passage of blood through the lungs.
Mixed venous inert gas partial pressures are calculated as weighted means of the 8 contributory venous streams. The weighting factor for each is the ratio of blood flow to the compartment divided by the total cardiac output. Table A2 lists the values for the weighting factors for a body at rest.
TABLE A2 Weighting factors used to calculate mixed venous values
from 8 separate venous values
Compartment Tissues Weighting factor
1 Adrenals, kidneys, thyroid 0.28
2 Heart, brain grey matter 0.17
3 Liver plus portal system, other small glands and organs 0.33
4 Brain white matter 0.03
5 Red marrow 0.02
6 Muscle and skin 0.13
7 Nonfat subcutaneous 0.01
8 Fatty marrow and fat 0.02
These values change when conditions change. For example increased physical activity results in an increase in muscle blood flow which, in addition to causing a reduction in muscle time constant, results in an increase in the proportion of pulmonary artery blood which derives from muscle.
Total venous dissolved gas partial pressure for each compartment is determined as the sum of the inert gas + oxygen + carbon dioxide + water vapour. A separated gas phase (bubbles) is assumed to occur whenever the total dissolved gas pressure exceeds environmental pressure and this ratio, total dissolved gas pressure:environmental
29

pressure, is calculated for each compartment and for the mixed venous blood at each time increment throughout the whole period of time which is being simulated. Simple inspection of this section of the model shows when the bubbles will start to grow in each tissue, i.e. when the ratio of dissolved gas pressure to environmental pressure exceeds 1. Thus the assumption is made that sufficient nuclei exist to enable bubble growth to go ahead without the requirement for any additional source of energy.
A1.2.2 Bubble dynamics
The bubble dynamics section of the model is exactly as described by Van Liew and Burkard (1993) for multiple bubbles in tissue. An independent calculation of bubble dynamics is made for each compartment. For an 8 compartment simulation there are 8 parallel repeats of the Van Liew-Burkard model.
The equations in the Van Liew-Burkard model account for the physics of bubble growth and thereby take account of:
the effect of bubble density
gas diffusion between tissue and blood
the rate of removal of inert gas by blood
the effect of surface tension on internal pressure of the bubbles
In this study the initial conditions have been taken as the conditions at the beginning of the first compression. Thus the values for blood flow and time constant of the compartment, environmental pressure, arterial inert gas pressure, inert gas pressure for tissue and venous blood and venous oxygen pressure are provided from the gas dynamics section of the model. In this way mass balance is ensured. The calculations are reiterated for each time interval throughout the whole profile and 60 minutes after the end of the last decompression. In this way the "fate" of the inert gas which is in the tissue at the end of the time at depth is followed as it moves between blood, tissue and bubble during bubble growth and decay.
The starting volume of the nuclei on which the bubbles form is assumed to be 2 microns and this value is held constant until growth begins.
The diffusion coefficients used in this work for nitrogen are for aqueous tissue 0.001302 cm2/min, for fat 0.001038 cm2/min.
Time increments are chosen so that changes in them do not cause changes in the result. In this section of the model the exponential gas uptake and washout is approximated to a large number of linear sections and therefore the time increments must be small enough for the linear approximation to agree closely with the exponential.
30
If the time increments are too big, so that the total volume of gas moving between bubble and tissue within the time interval is large, the change in bubble radius (and in all other calculated values) overshoots and oscillations are initiated. This is positive feedback and the calculation breaks down. Large movements of gas result from very large pressure changes, large numbers of bubbles changing size and slow removal of dissolved gas by the blood flow. Thus a large pressure drop in a tissue with a long time constant and high bubble density is more likely to result in oscillations and a failure to complete the simulation. The time increments must be reduced to a level at which no oscillations occur. Invariably the time increments required by this section of the model are much smaller than those required by the gas dynamics section.
Obviously such instability in the calculations can lead to gross error in the results. For example it is possible for the bubble radius to drop to zero during a period of oscillation whereas when corrected so that oscillations do not occur the bubble will last for a longer time. If the results are not studied carefully it would be possible to record a false early resolution of bubbles. Oscillations are manifest as sudden changes in inert gas partial pressures and in bubble radius; inert gas pressures may become negative. After every calculation inert gas pressures and bubble radius are displayed graphically and carefully inspected to look for such sudden changes. Time increments are adjusted until inert gas partial pressures change in a smooth continuous way consistent with what is happening to the environmental pressure and bubble. When this situation is reached the outcome must then be shown to be independent of time increment as long as oscillations do not recur. Only when these conditions have been fulfilled is the result accepted. This is time-consuming but becomes less so with experience. All the results presented here have been subjected to this type of quality control.
Where pulmonary artery gas is to be calculated the 8 bubble dynamics sections are combined by calculating for each time interval the weighted mean values for:-
bubble radius
tissue and venous blood inert gas partial pressure
blood total inert gas concentration (the sum of dissolved gas and gas in bubbles)
gas volume carried in bubbles in the blood (assuming that bubbles have formed to the same extent in the blood and in the tissue)
total gas concentration (in bubbles and dissolved) in the tissue.
The weightings are as given in Table A2. Thus all parts of the model are linked and because of this there is a "seamless" join whenever there is a switch from one part to the other. In other words mass balance is automatically maintained.
31

A1.2.3 Bubble density
The number of bubbles which can form in any tissue is unknown. The energy required to generate a de novo bubble is very high and it seems unlikely that this is the normal mode of bubble initiation on decompression. A bubble can grow more easily if there is a nucleus of some kind available; nuclei can be gaseous or solid. It is not appropriate to make a detailed examination of the factors which determine the incidence of suitable nuclei here, the readers is referred to Vann (1989) for more information, a brief summary only is included here.
It is possible to argue that bubble density is very high throughout the body. Van Liew and Burkard (1993) suggested that the number of bubbles formed depends on the magnitude of the decompression move. It has also been argued that the number of bubbles formed depends on the level of supersaturation at the start of decompression. This corresponds to the findings of Yount and Strauss (1976) in their studies of bubble formation in gelatin. In the original validation of the model high bubble density was one of the conditions studied.
The argument that bubble density relates to the magnitude of the decompression move or to supersaturation has a weakness in that the experimental evidence for high density depends on the methods used to visualise and count the bubbles. It may simply be that more bubbles grow large enough to be detected following a bigger decompression step. It is possible to argue the case that the number of bubbles formed is determined by the availability of nuclei.
Candidates for solid nuclei might be some of the larger molecules which are in the body, some protein molecules could be candidates. Gas nuclei can be formed in the body and there may be continuous formation on the arterial side of the circulation for example by the action of the heart valves (Fox and Hugh 1964); throughout the body by the action of ionising radiation (Evans and Walder 1978); by activity in skeletal muscle (Vann 1989). The simplest pattern of bubble density which follows from this reasoning is that all parts of the body have similar bubble density levels except skeletal muscle, in which tribonucleation may be caused by the muscle movement, fat (because of the large lipid molecules) and the arterial side of the circulation because of the action of the heart which may result in tribonucleation.
This simplistic approach was been used to determine an alternative low range of bubble density values. For the body at rest all compartments are assumed to have a bubble density of 100/ml except for muscle and fat. Muscle has been assumed to form 500 bubbles/ml to allow for the fact that the respiratory muscles and postural muscles are continuously active. Fat has been assumed to form 8,000 bubbles/ml, this density is in the region where precise bubble number has little effect on the outcome. This option is referred to as the "low" bubble density in the following section. These values were used throughout the work dealt with in this report and the justification for this choice is discussed in the next section.
32

A1.2.4 Original validation of the model
The model used in this work was originally validated as part of a study undertaken for OMEGA, a consortium of Norwegian oil companies and the Norwegian Petroleum Directorate, and reported in Flook and Brubakk (1996). Several forms of predictions from the model were compared with the peak bubble counts as recorded by transoesophageal ultrasonic scanning in anaesthetized pigs. Fourteen different decompression types were involved and 106 animals contributed results.
Of various output values available from the model the peak predicted gas volume carried as bubbles in the pulmonary artery was the one which correlated best with measured peak bubble counts. The best correlation was for the "low" bubble density option; correlation coefficient r = 0.91, P<0.001. This very high, statistically significant correlation coefficient indicates that if appropriate physiological and anatomical values are used in the model it is a very reliable way to evaluate decompression stress.
The low bubble density case is now routinely used; that is with bubble density 100/ml in all tissues except muscle which has density 500/ml, and fat 8,000/ml.
A1.2.5 Validation by comparison with human trials
In recent years it has been possible to compare the predictions of central venous gas in bubbles with Doppler scores recorded during trials in which human volunteers were used (Flook 1999, Flook 2001, Flook 2002). The Doppler scores have been evaluated by the Doppler technicians of DRDC-Toronto, the world leading experts on the field. For these comparisons the maximum recorded precordial Doppler score for each subject was ben used to determine a median value and this is compared to the predicted gas volume. Table A3 shows the results for hyperbaric exposures in which nitrogen is the only inert gas.
Table A3
Precordial Doppler score Predicted central venous gas (µl/ml)
1 1.8
2 4.0
3 5.0
It should be realised that the Doppler scores are only the median value whereas in any group of subjects there is a range of scores.
This relationship has been used to predicted correctly the outcome of hyperbaric exposures in trials carried out independently of Unimed Scientific Limited.
33

Printed and published by the Health and Safety ExecutiveC30 1/98
Printed and published by the Health and Safety Executive C0.06 04/04

ISBN 0-7176-2835-3
RR 214
78071 7 62835 3£10.00 9