Embed Size (px)
Citation preview

Integrated transport and land use: Sylvia Park as a case study
April 2011
Stuart Donovan Jenson Varghese Bonnie Parfitt Mark Huggins Neil Mumby McCormick Rankin Cagney, Level 1 Princes Court, 2 Princes St, Auckland
NZ Transport Agency research report 444

ISBN 978-0-478-37194-9 (print)
ISBN 978-0-478-37193-2 (electronic)
ISSN 1173-3756 (print)
ISSN 173-3764 (electronic)
NZ Transport Agency
Private Bag 6995, Wellington 6141, New Zealand
Telephone 64 4 894 5400; facsimile 64 4 894 6100
www.nzta.govt.nz
Donovan, S, J Varghese, B Parfitt, M Huggins and N Mumby (2011) Integrated transport and land use:
Sylvia Park as a case study. NZ Transport Agency research report 444. 80pp.
This publication is copyright NZ Transport Agency 2011. Material in it may be reproduced for personal
or in-house use without formal permission or charge, provided suitable acknowledgement is made to this
publication and the NZ Transport Agency as the source. Requests and enquiries about the reproduction of
material in this publication for any other purpose should be made to the Research Programme Manager,
Programmes, Funding and Assessment, National Office, NZ Transport Agency, Private Bag 6995,
Wellington 6141.
Keywords: Auckland, bus, costs, cycling, integration, land use, legislation, mode share, New Zealand,
parking, policy, public transport, transport, rail, Sylvia Park, walking.

An important note for the reader
The NZ Transport Agency is a Crown entity established under the Land Transport Management Act 2003.
The objective of the Agency is to undertake its functions in a way that contributes to an affordable,
integrated, safe, responsive and sustainable land transport system. Each year, the NZ Transport Agency
funds innovative and relevant research that contributes to this objective.
The views expressed in research reports are the outcomes of the independent research, and should not be
regarded as being the opinion or responsibility of the NZ Transport Agency. The material contained in the
reports should not be construed in any way as policy adopted by the NZ Transport Agency or indeed any
agency of the NZ Government. The reports may, however, be used by NZ Government agencies as a
reference in the development of policy
While research reports are believed to be correct at the time of their preparation, the NZ Transport Agency
and agents involved in their preparation and publication cannot accept any liability for use of the research.
People using the research, whether directly or indirectly, should apply and rely on their own skill and
judgement. They should not rely on the contents of the research reports in isolation from other sources of
advice and information. If necessary, they should seek appropriate legal or other expert advice.

Acknowledgements
The authors acknowledge the assistance of Kiwi Income Property Trust and their representatives,
especially Andrew Buckingham, Bruce Morrish and Jonathan Douglas. Feedback was gratefully received
from: Don Houghton (Auckland Regional Council), Penny Pirrit (Auckland City Council) and Megan Kennedy
(NZ Transport Agency). We also thank our diligent peer reviewers, Ian Wallis and Todd Litman, and our
colleagues Julie-Anne Genter and Xavier Goldie.
Abbreviations and acronyms
ARC: Auckland Regional Council
ARTA: Auckland Regional Transport Authority
CBD: central business district
DCF: discounted cash flow
GFA: gross floor area
GPS: Government Policy Statement
HUE: household unit equivalent
ITA: integrated transport assessment
KIPT: Kiwi Income Property Trust
LTMA: Land Transport Management Act
NIMT: North Island Main Trunk (rail line)
NZTA: NZ Transport Agency
RCR: revenue to cost ratio
RGS: Regional Growth Strategy
RPS: Regional policy statement
SEART: Southeastern arterial
SH: State Highway
TIA: traffic impact assessment
TDM: travel demand management

5
Contents
Executive summary ......................................................................................................................................................................................... 7
Abstract ............................................................................................................................................................................................................. 10
1. Introduction ....................................................................................................................................................................................... 11
1.1 Outline of this report ........................................................................................................................ 11
1.2 Background to Sylvia Park ................................................................................................................. 12
2. The planning and policy framework ...................................................................................................................................... 16
2.1 Introductory note .............................................................................................................................. 16
2.2 Why integrated transport and land use? ............................................................................................ 16
2.3 Planning and policy framework ......................................................................................................... 17
2.3.1 Central government ............................................................................................................... 17
2.3.2 Regional government ............................................................................................................. 18
2.3.3 Local government .................................................................................................................. 19
2.3.4 Integrated transport assessments .......................................................................................... 22
2.4 Distilling some key objectives ........................................................................................................... 23
3. Travel demand and expenditure surveys ............................................................................................................................ 25
3.1 Aim of the survey .............................................................................................................................. 25
3.2 Travel demands at Sylvia Park ........................................................................................................... 25
3.2.1 Design of the travel demand surveys ..................................................................................... 25
3.2.2 Results of the travel demand surveys ..................................................................................... 26
3.2.3 Generating annual travel demand data ................................................................................... 27
3.2.4 Forecasting future travel demands ......................................................................................... 29
3.3 Expenditure interviews ...................................................................................................................... 29
3.3.1 Overview ................................................................................................................................ 29
3.3.2 Design of the expenditure interviews ..................................................................................... 29
3.3.3 Results of the expenditure interviews .................................................................................... 30
3.3.4 Net revenue derived from transport users .............................................................................. 31
3.4 How does Sylvia Park compare? ......................................................................................................... 32

6
4. The profitability of different transport modes .................................................................................................................. 35
4.1 Limitations ....................................................................................................................................... 35
4.2 The costs to KIPT of different transport modes ................................................................................. 35
4.2.1 Total transport costs ............................................................................................................. 35
4.2.2 Calculating average transport costs ....................................................................................... 37
4.3 Net revenue from different transport modes ..................................................................................... 38
4.4 How should KIPT manage future travel demands? ............................................................................. 39
5. Implications for public policy .................................................................................................................................................... 42
5.1 Preliminary notes .............................................................................................................................. 42
5.2 Is Sylvia Park an integrated development? ......................................................................................... 42
5.2.1 Key objectives of integration ................................................................................................. 42
5.2.2 Overall assessment ................................................................................................................ 43
5.3 Recommended priorities for regulatory reform ................................................................................. 45
5.3.1 Setting the scene ................................................................................................................... 45
5.3.2 Manage the location and configuration of major developments ............................................. 47
5.3.3 Eliminate minimum parking requirements ............................................................................. 49
5.3.4 Levy development contributions using shadow tolls .............................................................. 51
5.3.5 Replace transport rates with an annual parking levy .............................................................. 53
5.4 KIPT’s response to the recommendations ......................................................................................... 54
5.5 Areas for further research ................................................................................................................. 56
6. Summary and conclusions .......................................................................................................................................................... 57
6.1 Summary .......................................................................................................................................... 57
6.1.1 Structure ............................................................................................................................... 57
6.1.2 Travel mode and retail expenditure ....................................................................................... 57
6.1.3 Characteristics of similar retail developments ........................................................................ 58
6.1.4 Capital and operating costs, and average transport cost per user .......................................... 58
6.1.5 Profitability across time ......................................................................................................... 58
6.1.6 Implications for transport and land use policy ....................................................................... 60
6.2 Conclusion ....................................................................................................................................... 61
7. References .......................................................................................................................................................................................... 63
Appendices ....................................................................................................................................................................................................... 65

7
Executive summary
Strategic policy documents discuss the need for integrated transport and land use planning as a means to
achieving more sustainable and efficient developments. The aim of this research, undertaken in 2009–
2011, is to assess Sylvia Park as a case study of integrated transport and land use policies.
Sylvia Park was developed by Kiwi Income Property Trust (KIPT) and opened in 2006. It is one of
New Zealand’s largest retail centres with a combined gross floor area (GFA) of 72,525m2. Resource
consent has been given to develop a further 18,500m2 of commercial office space, while pending changes
to the district plan could allow for a wider range of more intensive activities at the site. Sylvia Park is in
Mt Wellington, ~11km from Auckland’s city centre, adjacent to State Highway 1 and the North Island Main
Trunk (NIMT) rail line. Sylvia Park was selected for this case study because it is a recent development that
provides access for a range of transport modes, including train and bus.
The following questions have guided this research:
• How do people travel to Sylvia Park? How is retail expenditure related to transport mode and other
socio-economic factors?
• What are the transport and land use characteristics of similar retail developments in cities comparable
to Auckland?
• What are the capital and operating costs incurred by KIPT to accommodate different transport modes?
What is the average transport cost per user by mode?
• How does the profitability of different transport modes vary across time? How should KIPT manage
future travel demands?
• What are the implications for transport and land use policy? What are our recommended priorities for
regulatory reform and further research?
Table XS1 shows the travel demands and expenditure patterns. Data on travel demand was derived from
on-site surveys and used to estimate travel demands across the year. Private vehicle modes (ie driver and
passenger) account for most (~93%) trips to Sylvia Park. Walking (3.9%) and train (3.4%) are the most
popular non-car modes. Data on expenditure patterns was gathered from on-site interviews. Regression
analysis was used to identify how expenditure related to the choice of transport mode. We found that
users of non-car transport modes spent less on average than car users, even when controlling for a range
of demographic characteristics.
Table XS1 Summary of travel demands and expenditure patterns by mode in 2009
Transport mode Travel demands Expenditure patterns
Trips Mode share Expenditure Net revenue
Driver 7,197,656 64.4% $52.99 $3.38
Passenger 2,988,892 26.8% $43.12 $2.75
Train 381,452 3.4% $42.28 $2.70
Bus 146,050 1.3% $34.26 $2.18
Walk 436,014 3.9% $4.77 $0.30
Cycle 23,589 0.2%
Total 11,173,654 100% N/A N/A
Key land use and transport characteristics for Sylvia Park in comparison to other similar retail centres in
Brisbane are summarised in table XS2. The other centres have much higher bus mode shares, probably

Integrated transport and land use: Sylvia Park as a case study
8
reflecting the quality of the infrastructure and the number of bus routes they support. Retail centres in
Brisbane seem to act as sub-regional hubs for bus networks.
Table XS2 Summary of land use and transport characteristics for comparable retail centres
Statistic Sylvia Park Chermside Garden City Carindale Indooroopilly
Distance to central business district 11km 10km 12km 10km 7km
Bus routes 4 20 27 16 21
GFA (m2)a 72,525 122,380 101,046 114,930 84,516
Carparks 4002 6200 4675 5400 3900
GFA/carpark ratio 18.12b 19.73 21.61 21.28 21.67
Mode
shar
e Driver 64% 49% 45% 43% 69%
Passenger 27% 27% 24% 28%
Train 3.4% 0% 0% 0% 7%
Bus 1.3% 19% 24% 23% 19%
Walk/cycle 4.1% 5% 8% 6% 5%
a Sylvia Park is currently the smallest shopping centre, but this will change once consented commercial buildings have
been constructed.
b Once several developments have been constructed, the GFA/carpark ratio will become 27.8m2 per carpark.
Table XS3 summarises the capital and operating costs for each mode, as well as average transport costs
per user. Most transport costs incurred by developers are in the form of upfront capital costs. Average
transport costs are relatively large in relation to net revenue, representing a major element of investment
decisions. Ongoing costs to service private vehicles are significantly higher compared to other modes.
Table XS3 Summary of capital, operating and average transport costs per user over time
Mode Capital costs Operating costs (per
year)
Average transport costs ($/user)
Year 1 Year 10 Year 20 Year 30
Cara $136,428,000 $787,061 $18.90 $1.85 $0.89 $0.57
Train $6,540,625 $10,575 $17.20 $1.19 $0.47 $0.28
Walk/cycle $382,375 $21,537 $0.92 $0.09 $0.04 $0.02
Bus $304,750 $42,301 $2.63 $0.31 $0.14 $0.09
Totals $143,655,750 $861,474 N/A N/A N/A N/A
a ‘Car’ combines average expenditure for drivers and the average number of passengers per vehicle.
We introduce the ‘revenue to cost ratio’ (RCR) in this report. The RCR measures the relative net revenues
divided by the total costs incurred over time, discounted by 15% per annum. Our results suggest that KIPT
has received a relatively high return on investment from bus users and, to a lesser degree, pedestrians
and cyclists. After 15 years, KIPT’s investment in rail has delivered comparable returns to the investment
in private vehicles. In the long run, all modes deliver reasonable financial returns.
To discover how KIPT should manage future travel demands to maximise profit, we assume that all
operating expenses are recoverable, while capital expenditure is not. We estimated marginal transport
costs for each mode. The high marginal cost of car users reflects the high value of recoverable investment
tied up in carparking. Alternative modes impose negligible marginal costs on the development. The low
average RCR for train users is attributable to large unrecoverable capital expenditure costs associated with
Sylvia Park. Nonetheless KIPT should now seek to make the most of this asset.
Our estimates of marginal costs assume that land used for carparking is recoverable. Minimum parking
requirements invalidate this assumption, because they prevent developers from recovering the value of
land used for carparks, irrespective of whether the spaces are used. If minimum parking requirements are
binding, the value of land used for carparking can no longer be recovered and the marginal transport cost

9
for car users falls from $1.07 to $0.03 per user. Minimum parking requirements remove the incentive for
the private sector to encourage alternative transport modes.
In light of these results, we recommend the following priorities for regulatory reform:
• Government authorities need to manage the location of major retail developments within district
plans. We suggest a four-layer hierarchy of integration, ie urban form and land use, general site
access, internal site configuration, and travel demand management.
• Local authorities should eliminate minimum parking requirements from district plans. This would
ensure that the value of land used for parking acts as an incentive for developers to manage the
demand for vehicle travel. Minimum parking requirements result in very low-density development and
excessive vehicle use. The private sector is best placed to determine the level of carparking needed to
support their development.
• Regional and local authorities should levy development contributions using shadow tolls that charge
developments a fee based on the actual travel demands generated. Shadow tolls benefit the private
sector by reducing upfront capital costs and contributing to a lower risk profile. Where shadow tolls
create a price differential in favour of alternative modes, they may motivate the private sector to
manage vehicle travel by encouraging efficient use of other modes.
• Regional and local authorities should replace transport rates with an annual parking levy. Rates based
on general property values penalise high-value centrally located properties that are more accessible by
alternative modes. The number of carparks is likely to be a more direct indicator of a development’s
actual traffic-generating potential.
We suggest that the first two recommendations should be implemented immediately, whereas the latter
may warrant further investigation, along with other areas discussed in this report.
Conclusion
Left to their own devices, the private sector appears unlikely to deliver land use and transport outcomes
that are aligned with the interests of wider society. However, many public policies unintentionally prevent
or discourage the private sector from delivering more integrated land use and transport outcomes. It is
apparent that current policies are failing to deliver the integrated outcomes envisaged by government
strategies. We have therefore identified four key recommendations for regional and local government
agencies. The most urgent are changes to policies, such as minimum parking requirements, development
contributions, and rating policies, which send the wrong signals to the private sector. Further work is
required to incorporate integrated transport and land use policies within district plans. These
recommendations should ensure that the objectives of the private sector are more aligned with the
integrated land use and transport outcomes sought by government agencies.

Integrated transport and land use: Sylvia Park as a case study
10
Abstract
Strategic government documents emphasise the need for more integrated land use and transport
planning. This study, undertaken in 2009–2011, considers the Sylvia Park retail centre in Auckland,
New Zealand, as a case study of more integrated land use and transport policies. Our analysis of the costs
and revenues associated with different transport modes suggests that Sylvia Park is likely to benefit from
better integration of walking and cycling facilities, and improved bus services. This analysis indicates that
improving alternative modes and more efficient parking management may deliver financial benefits to the
retail centre, as well as economic benefits to wider society. To support more integrated outcomes, four
key recommended priorities for regulatory reform are identified:
• Manage the location of major developments.
• Remove minimum parking requirements.
• Levy development contributions using shadow tolls.
• Replace transport rates with an annual parking levy.
The thrust of these recommendations is to reduce upfront capital costs and risks for the private sector
while providing ongoing incentives for managing travel demands. Together, these recommendations are
expected to improve the alignment between private and public sector interests greatly, thereby
contributing to more integrated transport and land use outcomes.

1 Introduction
11
1 Introduction
1.1 Outline of this report
Strategic government documents (at national, regional and local levels) articulate a need for integrated
transport and land use outcomes. Often, policies are developed as a response to continued growth in
traffic, especially in larger urban areas. The aim of this research project, undertaken in 2009–2011, is to
investigate the effectiveness of current policy settings using Sylvia Park in Auckland, New Zealand, as a
case study. Sylvia Park was selected as a case study because it is a relatively recent major development
that provides access for a variety of different transport modes, including train and bus. Sylvia Park
provides a useful lens through which we can examine current policy settings and identify ways in which
they can be improved, especially the alignment between public and private sector interests.
The primary benefit of examining integrated transport and land use outcomes using a case study is that it
provides a more detailed insight into the factors that influence private sector decision-making. The
policies that relate to the way that transport costs are internalised within the private sector are of
particular interest. In our experience, improving the alignment between public and private sector
objectives is necessary, if not sufficient, for achieving integrated transport and land use outcomes.
The following questions have guided this research:
• How do people travel to Sylvia Park? How does retail expenditure vary by access mode and other socio-
economic factors?
• What are the transport and land use characteristics of similar retail developments in cities comparable
to Auckland?
• What are the capital and operating costs incurred by KIPT to accommodate different transport modes?
What is the average transport cost per user by mode?
• How does the profitability of different transport modes vary across time? How should KIPT manage
future travel demands?
• What are the implications for transport and land use policy? What are our recommended priorities for
regulatory reform and further research?
Throughout the report, we highlight how specific results may lend themselves to more general
interpretations, which are ultimately consolidated into our recommendations. The following section
provides general background information on the Sylvia Park development, with a focus on general
transport and land use characteristics.
The report is structured as follows:
• Chapter 2 outlines the broader planning and policy framework.
• Chapter 3 presents detailed information on travel demands and expenditure patterns at Sylvia Park.
• Chapter 4 considers the financial costs and revenue associated with different transport modes from
KIPT’s perspective.
• Chapter 5 considers the implications of this research for transport and land use policy, and identifies
four recommended policies for regulatory reform.
• Chapter 6 summarises the research and puts forward some recommendations.
Integrated transport and land use: Sylvia Park as a case study
12
1.2 Background to Sylvia Park
Sylvia Park was developed by Kiwi Income Property Trust (KIPT) and opened in 2006; KIPT continues to
own and manage Sylvia Park through a subsidiary company. Sylvia Park provides for 200 stores with a
combined gross floor area (GFA) of 72,525m2. The development is situated on a 200,000m2 site in the
suburb of Mt Wellington, adjacent to State Highway 1 (SH1) and the North Island Main Trunk (NIMT) rail
line. The site is located approximately 11km from downtown Auckland, as illustrated in figure 1.1.
Figure 1.1 Sylvia Park, Mt Wellington, Auckland
Sylvia Park is surrounded by mixed commercial and industrial activities to the south and east, with
residential development to the west and north. Although a large park exists to the southwest (Hamlin’s
Hill), pedestrian access to this park is generally compromised by the surrounding road infrastructure,
namely SH1 and the Mt Wellington Highway.
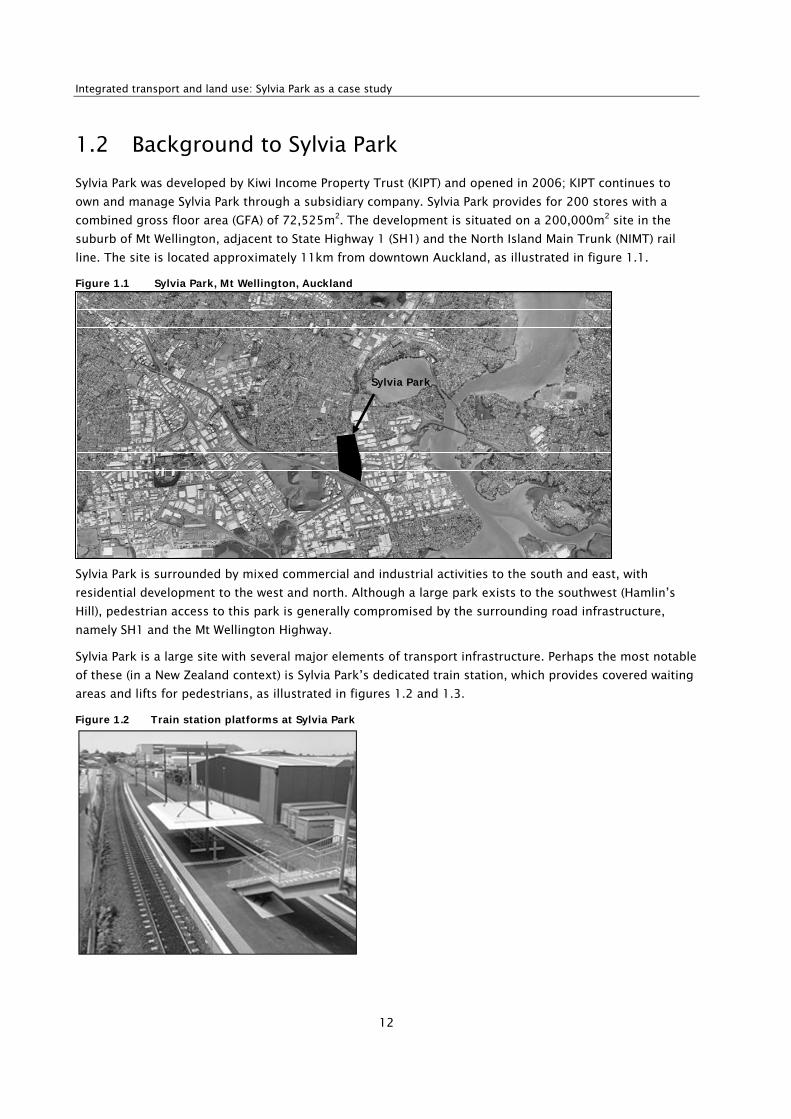
Sylvia Park is a large site with several major elements of transport infrastructure. Perhaps the most notable
of these (in a New Zealand context) is Sylvia Park’s dedicated train station, which provides covered waiting
areas and lifts for pedestrians, as illustrated in figures 1.2 and 1.3.
Figure 1.2 Train station platforms at Sylvia Park
Sylvia Park

1 Introduction
13
Figure 1.3 Pedestrian facilities (ramps and lifts) linking the train station to the main Sylvia Park complex
The Sylvia Park train station is on the eastern line, which operates with 15–60-minute headways.
Northbound rail services travel on to Panmure (eventually terminating downtown at the Britomart hub),
while southbound rail services travel on to the suburb of Westfield (eventually terminating at Papakura).
Upcoming train departures north and south are displayed on real-time information signs located within the
centre.
The train station is located approximately 150m from the eastern entrance to the retail complex, as
illustrated in figure 1.4. Vehicle access to Sylvia Park is gained from Mt Wellington Highway (to the west),
Carbine Road (to the east) or Musket Place (to the north). These roads also connect to SH1 and the
Southeastern Arterial (SEART), as illustrated in figure 1.4.
Bus stops are located approximately 150m from the western entrance to the retail complex, as illustrated
in figure 1.4. Although the bus and rail stations are not co-located (ie located adjacent to each other), the
walking distance between them is less than 300m, which is sufficiently close for public transport users to
connect between modes. Bus services access Sylvia Park from Mt Wellington Highway, with services
operating at 10–60-minute headways. Bus services generally connect west to Panmure (where a direct rail
connection is possible), east to Ellerslie and south to the Otahuhu Bus Station, as illustrated in figure 1.5.

Integrated transport and land use: Sylvia Park as a case study
14
Figure 1.4 Sylvia Park – location of key transport infrastructurea
a White arrows indicate vehicle access to Sylvia Park.
Figure 1.5 Bus and train services around Sylvia Park (ARTA 2011)
Train
Bus

1 Introduction
15
Walking and cycling access around Sylvia Park is relatively poor. The connectivity and amenity of the
surrounding environment is reduced by road and rail infrastructure, such as SH1 and the NIMT rail line.
The poor connectivity of the street network to the north and east increases the distances that people must
travel to reach Sylvia Park. Pedestrian and cycle access from the north and east is also limited by natural
features, such as the Panmure Basin and Tamaki Estuary.
Activities at Sylvia Park employ approximately 2500 workers. Current retail activities are summarised in
table 1.1. While a variety of activities are supported, the dominant land use is retail.
Table 1.1 Current retail activities in Sylvia Park
Activity GFA (m2)
Supermarket 14,789
Retail (other) 43,368
Hoyts Cinema 9614
Office 3729
Storage 755
Total 72,525
KIPT has also received resource consent to develop an additional 18,500m2 of high-grade commercial
office space on land located adjacent to Mt Wellington Highway, which is currently used for surface
carparking. KIPT also recently announced a plan change that would allow development on the site by
approximately 100,000m2, approximately 50% of which is proposed to be residential. Deliberations
associated with this plan change were being concluded while this report was being written. Irrespective of
the outcome of this plan change, it seems clear that Sylvia Park has become a major destination within
Auckland City and looks set to stay that way for the foreseeable future.

Integrated transport and land use: Sylvia Park as a case study
16
2 The planning and policy framework
2.1 Introductory note
Before tackling the questions that will guide later chapters of this report, we will first spend some time
motivating the need for integrated transport and land use policies, and examining the existing planning
and policy framework at the central, regional and local government levels. Numerous definitions of
integrated land use and transport exist. The NZ Transport Agency (NZTA) website has a section titled ‘Why
integrated planning?’ (NZTA 2009) that discusses the need for integrated land use and transport in the
following terms:
Decisions about transport systems, the form of urban development and how land is used all
impact each other. Integrated transport planning – planning that takes account of and
connects all these considerations – helps ensure that development of the transportation
network and land use is coordinated. In this way, it ensures the most efficient use of public
funds and avoids creating unintended impacts.
This chapter attempts to put some more flesh around the bare structure of integrated transport and land
use policies. More specifically, the following sub-sections will:
• reflect on differences in public and private sector objectives, and thereby motivate the need for
integrated transport and land use policies
• introduce the planning and policy framework governing integrated transport and land use policies at
the central, regional and local government level
• use the current planning and policy framework to distil some key objectives to guide subsequent
analysis and recommendations.
One caveat is required: this chapter does not aim to provide a comprehensive and/or detailed review of all
documents that consider the topic of integrated land use and transport in New Zealand. Instead, it simply
tries to clarify why integrated land use and transport policies may be desirable and how current
government authorities, especially in Auckland, have responded to these issues. In doing so, we lay some
foundations for the findings and recommendations that are made in subsequent sections.
2.2 Why integrated transport and land use?
Travel demands (that is, the amount and mix of travel) generated by a major development such as Sylvia
Park have the potential to affect the performance of the transport network directly in two key ways:
• Safety: vehicle movements at access points to the development may cause safety issues for other
users. For example, the location and nature of vehicle access points to Sylvia Park can greatly affect
the safety of the road network.
• Efficiency: travel demands generated by the development may incur delays for other road users.
Where vehicle traffic is added to already congested routes, these delays may be significant.
What these two issues have in common is that the effects are, by and large, not borne by the developer or
even the people who are accessing the development. Instead, other road users may be affected by, for
example, reduced safety and increased congestion. Public interest is also motivated by the desire for
equitable outcomes. More specifically, existing transport networks were funded by historical investments

2 The planning and policy framework
17
paid for by previous taxpayers, so it seems only fair that new developments manage their effects on the
existing transport networks and, if necessary, contribute towards future transport costs, especially when
specific effects are generated by their development.1 Government involvement in transport and land use
outcomes tends to be because of these external effects and the need to ensure equitable outcomes.2
In response, public authorities have implemented policies that require developers to identify and mitigate
the negative external effects of their development. Effects must be assessed before development proceeds
as part of the resource consent application. Mitigation measures typically involve funding the provision of
new transport infrastructure in the vicinity of the proposed development. In the case of Sylvia Park, KIPT
was required to fund not only the construction of the train station but also wider improvements to the
road network. Funds were provided for targeted projects, such as the widening of highway off-ramps, as
well as general improvements.
While integrated transport and land use policies are, in principle, justified on the grounds of economic
efficiency and equity, it is important to recognise that they come at a direct financial cost to the developer;
these costs are ultimately borne by wider society (for example, in the form of higher costs for goods and
services). In the case of Sylvia Park, costs incurred in development will ultimately be factored into the costs
of leasing floor space at the development, which, in turn, will be factored into the prices paid by
consumers. Thus, both the public and private sector have an interest in developing efficient transport and
land use policies.
We do not believe that current policies are particularly efficient, for reasons that are discussed in more
detail in the chapters that follow. We also note that a key objective of this report is therefore to collect,
present and interpret data on the land use and transport outcomes at Sylvia Park, and thus support
improved policies.
2.3 Planning and policy framework
2.3.1 Central government
The need for integrated land use and transport planning is explicitly acknowledged within the (revised)
Government Policy Statement (GPS) on Land Transport 2009/10 – 2018/19 (New Zealand Government
2009), which notes that:
58. Integrated planning is important to ensure that decisions made in relation to land use,
transport and urban design collectively contribute to the efficient use of public funds and
achieve the government’s objectives for transport and New Zealand. To achieve integration,
transport strategies and packages of activities should be developed alongside, and be clearly
connected to, land use strategies and implementation plans.
1 Inequitable outcomes can also arise in situations where certain transport modes are subsidised by users of other
modes. While cross-subsidies between transport users are, to a large extent, unavoidable, we suggest that one of the
aims of integrated land use and transport policies should be to minimise these cross-subsidies as much as possible.
2 We note that in the case of congestion, public and private interests could be aligned through time-of-use road pricing
that internalises the costs of congestion to users. In this context, regulations (such as integrated transport and land use
policies) should be designed as a ‘second-best’ response to the external costs of congestion. While a detailed
examination of the merits of time-of-use pricing lies outside the scope of this report, we note that it would effectively
address many issues that government authorities are currently attempting to manage (generally ineffectively) via
regulation.

Integrated transport and land use: Sylvia Park as a case study
18
59. The government is particularly concerned to see that better integration of land use,
transport planning and urban design activity contribute to national economic growth and
productivity. In particular, land use and transport planning processes should ensure that: the
transport needs of future growth are considered in planning and developing the transport
system; future transport corridors are safeguarded from other development; the long term
sustainability of land transport funding is secured through ensuring that urban growth meets
the costs of the infrastructural impact that such growth generates for the wider transport
network; and opportunities are created for better integration within and between transport
modes.
The GPS states that integrated land use and transport policies are important, especially insofar as they
contribute to economic growth and productivity, efficient use of public funds, and managing future
development. Central government agencies organisations, such as KiwiRail and NZTA provide input into
major development applications. They may identify site-specific issues, such as the location and/or
configuration of access points, or wider network effects, such as issues caused by queued vehicles. In
Sylvia Park’s case, Transit NZ (which was combined with Land Transport New Zealand to form the NZTA)
identified mitigation measures that were deemed to be necessary to manage the effects on the state
highway network, such as improvements to the SH1 southbound off-ramp onto the Mt Wellington
Highway.
2.3.2 Regional government
Until recently, regional input into transport and land use policies in Auckland was provided by two
organisations, namely the Auckland Regional Council (ARC) and the Auckland Regional Transport
Authority (ARTA). Transport functions from both organisations have subsequently been folded in the new
organisation known as ‘Auckland Transport’. Previously, the ARC set strategic priorities (and determined
overall funding), which ARTA was then tasked with achieving. Here, we focus on the ARC, although ARTA’s
contribution to integrated transport and land use outcomes is discussed in more detail later.
The need for integrated land use and transport planning is reflected in regional planning and policy
documents. The Auckland Regional Policy Statement 1999 (ARC 1999), for example, establishes the policy
direction for promoting sustainable management of natural and physical resources in the Auckland region,
including setting the direction for regional transport policy. This regional policy statement (RPS) states
that the region’s transport system must be managed in a way that avoids, remedies and mitigates adverse
effects on the environment:
Land use and transport planning should be integrated by:
(i) District plan provisions which address the interaction between land use and the
transport system and, in particular, should contain provisions concerning:
(a) Control of new land use so as to enable new developments to be serviced efficiently by
public transport;
(b) Ensuring that planning controls do not unnecessarily restrict working from home or
telecommuting;
(c) Encouragement of land use changes so that persons can work and obtain goods and
services within local areas, so as to avoid the need to travel by motor vehicle.
(section 4.4.2.1)

2 The planning and policy framework
19
The recently released Auckland Regional Land Transport Strategy 2010–2040 also acknowledges the
‘challenge’ of integrating transport and land use (ARC 2010). This regional land transport strategy (which
must not be inconsistent with the RPS or the GPS) states:
Transport and land use planning determine the efficiency, effectiveness, resilience,
affordability and environmental sustainability of a transport system. By shaping the pattern
of development and influencing the location, scale, density, urban design and mix of land
uses, planning can help to facilitate an efficient transport and land use system.
Integrating transport and land use planning lies at the heart of the Auckland Regional
Growth Strategy (RGS) and Auckland Regional Policy Statement (RPS). Their spatial vision
focuses on accommodating growth primarily in a network of highly accessible centres, from
the neighbourhood level up to the regional CBD. Concentrating growth, and high trip
generating activities in particular, in centres and corridors, linked by high frequency public
transport corridors and good walking and cycling connections where appropriate, allows
people to access opportunities with less need for travel, and improves the feasibility of public
transport.
Where we travel from and where we travel to in the region is largely determined by land use
planning. Historical land use planning in the region has tended to reinforce patterns of
transport demand that are heavily reliant on private vehicles. Decisions on proposed land use
directly impacts on transport and vice versa.
ARC policies acknowledge that integrated land use and transport policies are required to ensure that the
right activities are located in the right place. They do not, however, provide specific guidance on how this
can be achieved. Finally, we note that the ARC can submit on development proposals as part of the normal
consent process.
2.3.3 Local government
2.3.3.1 Relevance
Local government policies have the most direct relevance to the private sector. It is at the local level that
the mechanisms exist to prescribe specific policies that give effect to the more strategic objectives
articulated at the national and regional levels. Local government policies on integrated transport and land
use planning operate through two key channels: local district plans and development contributions
policies, both of which are reviewed in the following sub-sections.
2.2.3.2 Local district plans
In our experience, local district plans do not support the lofty objectives espoused by central and regional
government documents. For example, the ‘Transportation’ section (part 12) of Auckland City’s district
plan (Isthmus section) (Auckland City Council 2011) mentions the word ‘integrated’ only eight times,
mostly in relation to public transport ticketing. We find no reference to integrated transport and land use
outcomes as were described within central and regional government documents.
The possible exception is the plan’s commitment to adopt a ‘holistic approach in the assessment of
transport impacts including requiring an integrated transport assessment for structure plans and major
trip generating activities.’ However, we could not find a formal definition in the district plan of what
elements contribute to either a ‘holistic approach’ or an ‘integrated transport assessment.’ While this
statement appears to support more integrated land use and transport outcomes, very little guidance has
been provided on how this commitment might feasibly be put into operation by developers. We note that

Integrated transport and land use: Sylvia Park as a case study
20
work on integrated transport assessments has been undertaken at the national and regional levels (which
are reviewed in a later section), but the district plan provides no reference to these documents.
The ‘Transportation’ section prescribes specific polices for individual components of the development
(access, parking etc), rather than how the development’s location and configuration may support
integrated transport and land use outcomes. Perhaps the most discouraging element of the district plan is
the ‘Roading Classification’ section (section 12.6.2.2), which discusses the function and form of roads in
Auckland City. No mention is made of how these roads interact with surrounding land uses, aside from the
nature of site access to the adjoining road. It is not acknowledged that roads affect ease of mobility and
accessibility by different modes. For example, no mention is made that wider roads and increased vehicle
traffic can create a barrier to pedestrian travel, or that parking pricing and management have a major
effect on trip generation and mode split. Roads are simply lines on a map that facilitate the efficient
movement of immutable vehicle demands; they do not consider land use activities and/or transport
policies that generate the demand for vehicle travel, or the land use activities that are affected by the use
of road corridors.
We consider that the road hierarchy described in Auckland City’s district plan is fundamentally at odds
with integrated land use and transport outcomes. For example, many arterial roads in Auckland City
traverse regionally significant growth centres, such as Newmarket. In these situations, we would expect
land use and urban design issues to play a much larger role in shaping the function and form of the road.
These types of issues have motivated us to develop this report. Indeed, we note that Auckland City’s
district plan is not unusual and our criticisms apply equally to most district plans in New Zealand.
2.2.3.3 Development contributions policies
Development contributions are enabled under the Local Government Act 2002 (New Zealand Government
2002) (LGA), and help councils to fund and provide infrastructure that is essential to the community.
Under the LGA, councils are required to:
… identify the share of [growth] expenditure attributable to each unit of demand, using the
units of demand for the community facility or for separate activities or groups of activities,
as the case may be, by which the impact of growth has been assessed. (schedule 13, clause
(1)(b))
The purpose of development contributions is to help fund new or expanded infrastructure resulting from
growth within a territorial authority’s boundary. The intention is that the developers should bear some of
the costs of additional infrastructure because of the demands generated by their development.
Development contributions are used to fund a wide range of infrastructure including storm water,
community amenities, public space and transport infrastructure. Funds raised from development
contributions must be allocated to activities set out in the council’s 10-year plan.
Development contributions are a suitable mechanism with which to fund council activities for three main
reasons:3
• Fairness: the cost of extra infrastructure demand is borne by developers and new occupants with the
aim of reducing the burden on existing residents or businesses that are not responsible for (and will
not benefit greatly from) the extra demand that is being generated. New residents and occupants will
benefit most from new infrastructure and therefore should contribute a higher proportion of the costs.
3 See section 5 of the 2010 Auckland City Council’s Development Contribution Policy (Auckland City Council 2010) for
further information on policy principles.
2 The planning and policy framework
21
This means the costs of growth can be allocated fairly over time, with developers paying only for the
capacity they use.
• Accountability: contributions provide accountability, transparency and certainty around the costs of
development for both the private and public sector. The policy is designed to signal the true costs of
growth and the effects it has on the wider community. Development contributions generate funding
that is distinct from other more general mechanisms (such as rates), which are able to be more
directly accounted to particular projects and funding activities. Councils benefit from access to a
separate, dedicated funding source.
• Sufficiency: other funding sources which are available to local government, such as rates and user
charges, are not sufficient to cover all the costs of providing the community facilities and
infrastructure needed to meet the demands of a growing population. If these costs had to be covered
only by rates, for example, rates would have to increase significantly to cover the costs of growth.
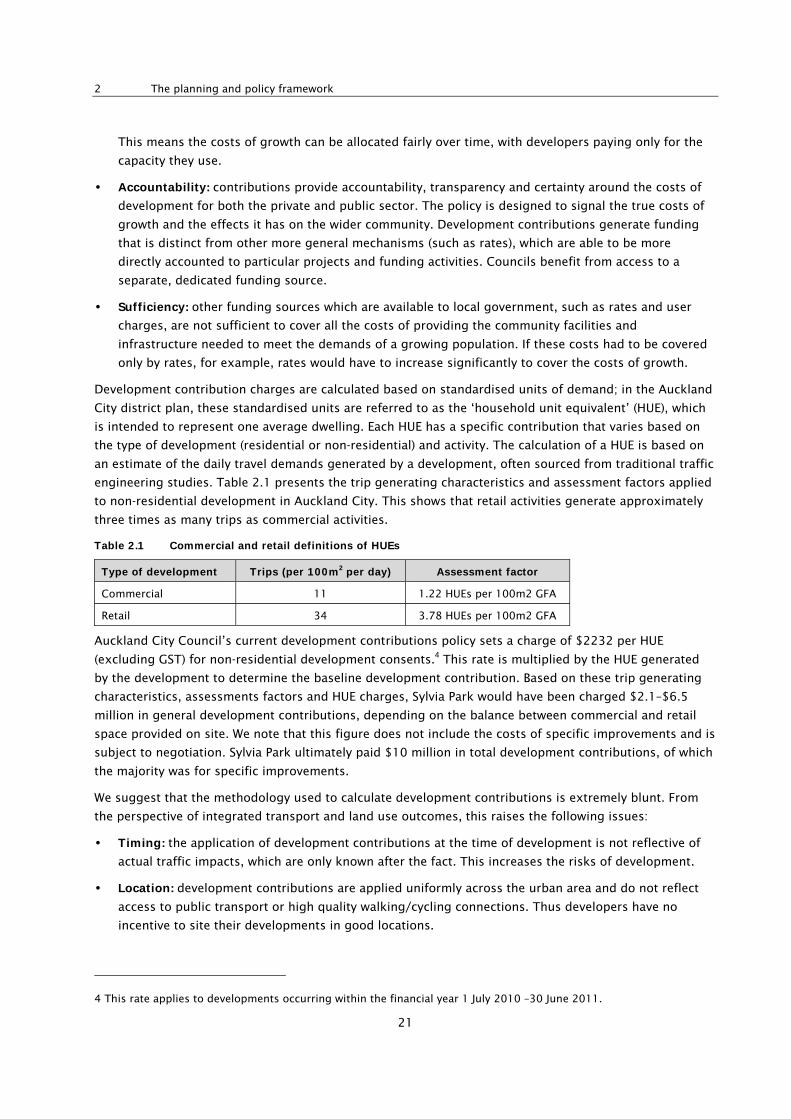
Development contribution charges are calculated based on standardised units of demand; in the Auckland
City district plan, these standardised units are referred to as the ‘household unit equivalent’ (HUE), which
is intended to represent one average dwelling. Each HUE has a specific contribution that varies based on
the type of development (residential or non-residential) and activity. The calculation of a HUE is based on
an estimate of the daily travel demands generated by a development, often sourced from traditional traffic
engineering studies. Table 2.1 presents the trip generating characteristics and assessment factors applied
to non-residential development in Auckland City. This shows that retail activities generate approximately
three times as many trips as commercial activities.
Table 2.1 Commercial and retail definitions of HUEs
Type of development Trips (per 100m2 per day) Assessment factor
Commercial 11 1.22 HUEs per 100m2 GFA
Retail 34 3.78 HUEs per 100m2 GFA
Auckland City Council’s current development contributions policy sets a charge of $2232 per HUE
(excluding GST) for non-residential development consents.4 This rate is multiplied by the HUE generated
by the development to determine the baseline development contribution. Based on these trip generating
characteristics, assessments factors and HUE charges, Sylvia Park would have been charged $2.1–$6.5
million in general development contributions, depending on the balance between commercial and retail
space provided on site. We note that this figure does not include the costs of specific improvements and is
subject to negotiation. Sylvia Park ultimately paid $10 million in total development contributions, of which
the majority was for specific improvements.
We suggest that the methodology used to calculate development contributions is extremely blunt. From
the perspective of integrated transport and land use outcomes, this raises the following issues:
• Timing: the application of development contributions at the time of development is not reflective of
actual traffic impacts, which are only known after the fact. This increases the risks of development.
• Location: development contributions are applied uniformly across the urban area and do not reflect
access to public transport or high quality walking/cycling connections. Thus developers have no
incentive to site their developments in good locations.
4 This rate applies to developments occurring within the financial year 1 July 2010 –30 June 2011.
Integrated transport and land use: Sylvia Park as a case study
22
• Management: because development contributions levy a one-off upfront capital contribution, the
private sector has no ongoing incentive to mitigate the effects of their development through travel
demand management (TDM) measures.
We are not the only ones to identify weaknesses in our current approach to development contributions. A
joint report by the Local Government Forum and Property Council New Zealand (2010) has identified some
significant problems with applying development contributions, including the high costs being passed on
to consumers and the lack of transparency surrounding the calculations. This report recommended the
use of direct user charges as an alternative.
2.3.4 Integrated transport assessments
Until recently, ARTA were the only government authority to have written a comprehensive guide to
‘integrated transport assessments’ (ITAs). This guide, however, had no statutory significance because
ARTA was not a ‘road controlling authority’. As a result, their guide was often given only cursory attention
by the private sector.
According to ARTA, the goal of an ITA is to ensure that developments consider transport impacts in a
manner that emphasises an integrated approach, with a focus on accessibility by all modes, not just
private vehicles. Developments are assessed in terms of how they interact with existing transport
networks, and an ITA identifies where measures will be needed to mitigate network effects. In this way,
ARTA’s ITA guidelines focus on the ‘integration’ of individual developments with the surrounding
transport networks, rather than the integration within the wider urban form (which will be discussed in
more detail in subsequent sections).
NZTA has recently funded new research on ITA with the aim of developing national guidelines to improve
practices in New Zealand (Abley et al 2010). The guidelines draw heavily from the ARTA terminology and
methodology as a source of best practice in ITA. Abley et al note that despite the objectives of local
authorities often stating a desire for ‘sustainable transport outcomes’ or a ‘holistic approach’ to
addressing transport impacts, past transport assessment methodologies (notably traffic impact
assessments (TIAs)) often fail to give due consideration to integrated outcomes.
TIAs are primarily undertaken to assess how additional vehicle travel generated by the development
affects the existing road network. ARTA suggests that a TIA is only one of several components in an ITA.
TIAs, which have been used for many years, are now widely regarded as unsuitable for assessing impacts
on the transport network in urban areas. Travel patterns and demands in a TIA are often based on those
currently observed – or those observed in the past – which do not reflect changes in strategic directions,
such as a regional focus on travel demand management, or emerging socio-economic trends such as an
aging population and sustained high fuel prices. The use of simple trip generation and parking rates is
likely to lead to consistent overestimates of traffic demand and subsequent under-resourcing for
alternative transport infrastructure and/or travel demand management initiatives.
ITAs are, in short, an improved method for assessing the transport impacts of a development. ITA
guidelines emphasise the need to consider more than private vehicles and are thus an improvement on
past practices, which have continuously underestimated the relevance of alternative modes. While ITAs
represent an improvement over past practices, their content is by no means settled. We are particularly
concerned by the tendency for ITA guidelines to define ‘integration’ in a relatively narrow sense. The
current focus is on measures to improve integration between transport modes and thereby affect modal
choice. While modal choice is important, integration had broader dimensions, namely how developments
integrate with the existing urban form. Further work is needed to introduce more strategic outcomes (such

2 The planning and policy framework
23
as the location of major developments with respect to the public transport network) into the ITA
framework to supplement the current emphasis on micro-integration (such as where footpaths and bicycle
parking should be located).
The next section attempts to distil some of the key objectives of integrated transport and land use policies
into a more tractable and applicable qualitative framework.
2.4 Distilling some key objectives
The previous sections have introduced the planning and policy framework governing integrated land use
and transport outcomes. Several major issues were identified, especially insofar as the aspirations of
central and regional government have not been translated to the local level. Current local district plans
and development contributions policies do not provide adequate support for integrated outcomes.
Given the near absence of effective policies at the local level, this section will attempt to distil some key
objectives to guide our evaluation of Sylvia Park. These objectives enable us to move away from high-level
planning and policy documents, and to focus instead on tangible (albeit qualitative) outcomes that
individual developments should deliver.
We suggest integrated transport and land use objectives should seek to achieve the following outcomes:
• Achieve an efficient urban form. Land use activities and transport infrastructure need to be
configured in such a way that the resulting travel demands contribute to an efficient urban form, given
the capacity of the available infrastructure, and existing travel and land use patterns.
• Accommodate future growth. The transport needs of future development needs to be considered
when evaluating the performance of the transport system, and safeguarding future transport corridors
and networks from development or from inappropriate or unsafe development. All sites should
identify a long-term plan for how they propose to accommodate growth.
• Provide integrated infrastructure. Create opportunities for better integration within and among
transport modes. Better use should be made of existing infrastructure, and the benefits and costs of
transport packages should be assessed as a whole, taking strategic and tactical factors into account.
• Develop effective solutions. Develop a range of alternatives and options that address both the
supply side (reducing the need for additional transport system capacity) and the demand side
(reducing the need to travel altogether). Select options that contribute effectively to the economic,
social and environmental objectives.
• Respond to community needs. Solutions should respond appropriately to the aspirations of the
community and those affected by development.5 The effects on the wider transport network should be
mitigated in a way that delivers value for money and reduces the risks for the private sector.
5 Care is needed here to ensure that ‘community needs’ are defined broadly enough. A narrow definition would
consider the interests of existing residents only, rather than including the future residents who stand to benefit from
the development. In many situations, existing residents oppose development because of an obvious pecuniary interest
(eg perceived effects of the development on their own property values). While their opposition is understandable, it is
important that it does not over-ride the interests of all the future residents who stand to benefit from the provision of
housing. Interested readers are referred, for example, to the planned development around the Orakei train station in
Auckland, which aroused considerable community opposition, much of which was unwarranted. We suggest that many

Integrated transport and land use: Sylvia Park as a case study
24
• Manage adverse environmental effects. In larger urban areas, it is essential to offer alternatives to
vehicle-based travel, such as telecommuting and public transport, so as to reduce congestion,
emissions, pollution (air/water/soil) and other (unpriced) negative externalities. If developments are
more successful than anticipated (ie they generate more travel demands than originally anticipated),
they should be required to implement additional ‘demand management’ strategies.
We suggest that this framework (for which many alternatives and variations exist) provides a useful (albeit
qualitative) starting point. It strikes us that the public sector needs to make a greater effort in ensuring
that integrated objectives can be effectively put into operation by the private sector. In later chapters, we
will ‘test-drive’ this framework by evaluating how Sylvia Park contributes (or otherwise) to integrated
outcomes. Before moving to this strategic level, the next section will present more detailed information on
travel demands and expenditure patterns at Sylvia Park.
land use regulations, such as building height limits and minimum parking requirements, stem from narrow definitions
of community interests that are really premised in residents’ desires to protect their pecuniary interests.

3 Travel demand and expenditure surveys
25
3 Travel demand and expenditure surveys
3.1 Aim of the survey
This chapter presents the results of our travel and expenditure surveys that were undertaken at Sylvia Park
during seven consecutive days in November–December 2009. Two types of primary data were collected
during these surveys: travel demands and expenditure patterns. Travel demands were simply observed (ie
counted), while expenditure data was reported by way of direct interviews.
The travel demand and expenditure data helps us answer the following two questions (which were
introduced in section 1.1):
• How do people travel to Sylvia Park? How does retail expenditure vary by access mode and other socio-
economic factors?
• What are the transport and land use characteristics of similar retail developments in cities comparable
to Auckland?
Sections 3.2 and 3.3 consider the first question, while the second is discussed in section 3.4.
It should be noted that all parking at Sylvia Park is provided free of charge, and most carparks have no
time limit on how long vehicles may be parked.
3.2 Travel demands at Sylvia Park
3.2.1 Design of the travel demand surveys
On-site surveys at Sylvia Park were undertaken from Monday 30 November to Sunday 6 December 2009.
The seven survey locations are illustrated in figure 3.1.
Figure 3.1 Survey points at Sylvia Park (black =- vehicle; grey = train; white = bus)
Surveys ran from 8:00am–6:00pm on Saturday to Wednesday, and 8:00am–9:00pm on Thursday and
Friday. The 8:00am start ensured employee travel movements were captured up to one hour before
Sylvia Park opened at 9:00am (specific information on employee travel behaviour is presented in appendix
A). Similarly, the late finish on Thursday and Friday allows us to monitor the potential effects of late-night

Integrated transport and land use: Sylvia Park as a case study
26
shopping. Surveyors counted all vehicles entering and exiting the site, as well as the number of vehicle
occupants, and pedestrians and cyclists. Bus and train passengers (both those alighting and boarding)
were counted separately. All data was collected at 15-minute intervals.
3.2.2 Results of the travel demand surveys
The results of the travel demand survey are summarised in table 3.1 below. The majority of visitors used
car-based transport modes and Saturday was the busiest day overall.
Table 3.1 Trips to Sylvia Park by mode and day of the week
Mode Mon Tue Wed Thu Fri Sat Sun Total
Drivers 12,183 11,911 12,825 14,508 14,980 16,167 13,849 96,423
Passengers 4968 4891 5241 5997 6570 12,156 11,187 51,011
Train 548 659 642 751 603 680 385 4268
Bus 150 260 352 280 196 192 142 1572
Walk 609 952 522 873 523 814 714 5008
Cycle 40 61 33 36 17 43 38 268
Total 18,498 18,733 19,615 22,445 22,890 30,053 26,241 158,550
Overall mode share is also illustrated in percentage terms in figure 3.2.
Figure 3.2 Results of the travel demand survey: mode share
The survey results indicate that people who travelled by private vehicle, who include drivers and
passengers, make up 93% of all trips to Sylvia Park.
The hourly trip generation for Sylvia Park is illustrated in figure 3.3 below. This shows the peak trip
generation (approximately 5.5 trips/hour/100m2 GFA) occurs at midday on Saturday. During the week,
Driver 60.7%
Passenger 32.3%
Train 2.7%
Bus 1.0%
Walk 3.2%
Cycle 0.2%

3 Travel demand and expenditure surveys
27
Friday is the busiest day. During the weekday evening peak period (ie 4:00–6:00pm), traffic generation
fluctuates between 3.75 and 4.90 trips per hour per 100m2 GFA, or approximately 10% less than the peak
trip rate observed on the weekends. We have truncated results after 6:00pm, after which time trip
generation rates dropped steadily.
Figure 3.3 Surveyed hourly trip generation (vehicles/hour/100m2 GFA)
We note that these results are consistent with earlier surveys completed as part of the traffic monitoring
programme required by the conditions attached to Sylvia Park’s resource consent.
3.2.3 Generating annual travel demand data
We next sought to expand our travel demand data from one week to the entire year. This was achieved by
identifying annual demand proxies for each transport mode. The sources of these demand proxies, as well
as the strength of their relationship to the survey data (as measured by the R2), are summarised in
table 3.2. While the low R2 for pedestrians and cyclists is certainly undesirable, it is not entirely
unexpected, as users of these modes are likely to be affected by external conditions that we have not
controlled for, such as the weather. The weak relationship for pedestrians and cyclists should not greatly
affect our overall travel demand forecasts (because of the relatively low mode share for active modes
travelling to Sylvia Park) even if it does increase the uncertainty associated with walk/cycle calculations.
6.0
5.5
5.0
4.5
4.0
3.5
3.0
2.5
2.0
1.5
1.0
0.5
0.0
Tri
p g
enera
tion r
ate
(vehic
les/
hou
r/m
2 GFA
)
Time of day
Mon
Tues
Wed
Thurs
Fri
Sat
Sun
8:0
0am
8:1
5am
8:3
0am
8:4
5am
9:0
0am
9:1
5am
9:3
0am
9:4
5am
1
0:0
0am
1
0:1
5am
1
0:3
0am
1
0:4
5am
1
1:0
0am
1
1:1
5am
1
1:3
0am
1
1:4
5am
12:0
0p
m
12:1
5p
m
12:3
0p
m
12:4
5p
m
1:0
0pm
1
:15
pm
1
:30
pm
1
:45
pm
2
:00
pm
2
:15
pm
2
:30
pm
2
:45
pm
3
:00
pm
3
:15
pm
3
:30
pm
3
:45
pm
4
:00
pm
4
:15
pm
4
:30
pm
4
:45
pm
5
:00
pm

Integrated transport and land use: Sylvia Park as a case study
28
Table 3.2 Assumptions for expanding travel demand data at Sylvia Park to a yearly proxy
Mode Data type Source R2
Drive SCATSa data TMUb
94%
Passenger 75%
Train Electronic door
counts KIPT
68%
Bus 86%
Walk/cycle 34%
a Sydney co-ordinated adaptive traffic system
b Traffic management unit
We applied the demand proxies to expand our trip forecasts across the entire year. Table 3.3 compares
the surveyed results and our annual forecast (forecasts were cross-checked with KIPT’s independent
estimate of annual visitor numbers). Forecasts also exhibited the following expected patterns:
• a weekly cycle, where trips build during the week and peak on weekends
• a seasonal cycle, where trips increase in winter months (during the middle of the year) and drop off in
summer months
• sharp peaks in the second week of April, corresponding with Easter weekend in 2009, and around the
Christmas period.
Trip numbers build through December. All of these patterns correspond with expected trends.
Table 3.3 A comparison of the surveyed and forecast travel demands at Sylvia Park by transport mode (2009
calendar year)
Mode Travel demands Mode share
Survey week Annual
forecast
Surveyed
demand
Annual
forecast
Change
Drive 96,423 7,197,656 60.8% 64.4% +3.6%
Passenger 51,011 2,988,892 32.2% 26.8% -5.4%
Train 4268 381,452 2.69% 3.41% +0.7%
Bus 1572 146,050 0.99% 1.31% +0.3%
Walk 5008 436,014 3.16% 3.90% +0.7%
Cycle 268 23,589 0.17% 0.21% +0.0%
Total 158,550 11,173,654 100% 100% –
The largest change in mode share was for car passengers, for which our surveyed demands were
overestimated by 5.4%. This change is likely to be partly explained by the timing of our surveys: higher
vehicle occupancies might be expected in the lead-up to Christmas, when more people are free from work
and study commitments, and households are more likely to coordinate their shopping trips. The next sub-
section will consider how these travel demands might change in the future.

3 Travel demand and expenditure surveys
29
3.2.4 Forecasting future travel demands
Next, we forecast travel demands by mode over a 30-year period. Forecasting travel demand growth can
be a complex task, but we chose to apply simple linear growth rates based on our knowledge of recent
transport trends in Auckland. The following annual growth rates were applied to our estimate of total
annual visitor numbers by mode:
• Drivers are predicted to have a linear growth rate of 1%, recognising that growth is partly constrained
by road network congestion and the availability of parking.
• Passengers are likely to experience no growth, reflecting the likely impacts of continuing trends
towards higher vehicle ownership and smaller households. Regional/local priority TDM measures (eg
high occupancy vehicle lanes) may offset these trends.
• Train is predicted to see 10% linear growth for years 1–10, 5% for years 11–15 and 3% in each
subsequent year. This reflects considerable investment in Auckland’s rail network, including
electrification, increased frequencies and integrated ticketing.
• Bus is likely to have 5% linear growth for years 1–10, 4% for years 11–15 and 3% for each subsequent
year. This reflects ongoing targeted improvements to bus services, especially in areas where they can
connect with passenger rail, such as Sylvia Park.
• Walk and cycle are likely to show 5% linear growth each year, reflecting strong population growth in
residential areas around Sylvia Park, particularly with the expected residential intensification within the
centre itself and surrounding areas.
Total visitor numbers to Sylvia Park increased by approximately 1% per year, although the rate of change
obviously differed between modes depending on the growth rates discussed above. The net effect of these
assumptions is that total mode share by private vehicle (drivers and passengers) is expected to reduce
over time from 91.2% to 83.4% in 30 years’ time. By contrast, use of non-car transport modes (ie walking,
cycling and public transport) is expected to double from 8.8% to 16.4% over 30 years.
3.3 Expenditure interviews
3.3.1 Overview
The previous sections established visitor numbers to Sylvia Park by transport mode, both now and in the
future. This section will now complement this information with data on the spending power of users of
different transport modes. This data was gathered using expenditure interviews that were undertaken at
the same time as the travel demand surveys. This section is structured as follows: sections 3.3.2 and 3.3.3
discuss the design and results of the expenditure interviews, respectively, before section 3.3.4 estimates
the profitability of different transport modes. Finally, we discuss some limitations and comparability issues
associated with this expenditure data.
3.3.2 Design of the expenditure interviews
Interviews were undertaken to identify consumer expenditure patterns for different transport modes.
Interview participants were asked:
• their mode of travel to and from Sylvia Park
• the suburb they travelled from and the suburb they were travelling to
Integrated transport and land use: Sylvia Park as a case study
30
• whether they were an employee at Sylvia Park
• the amount of time they spent at Sylvia Park
• their estimated expenditure while at Sylvia Park.
Demographic information on age, income and gender was also collected. The interview was designed to
be as minimally intrusive as possible (both in the nature of the questions and the length of time required
to complete it), while still collecting essential information. The interview form is illustrated in appendix B.
Respondents were interviewed within the shopping centre, or while they were waiting to leave at either the
bus or the train stations. All respondents were rewarded with a voucher for a free drink at a café located
within the Sylvia Park shopping centre. The use of a reward was considered necessary to increase
participation, although it increases the risk of self-selection and sample bias. We suggest that most of the
effects of sample bias may be controlled for by demographic variables (especially age and income).
A total of 1663 interviews were successfully completed. The percentage of people that declined interviews
when approached to complete the interview was not recorded, but feedback from surveyors suggested
that it was not significant. Summary statistics on the expenditure interviews are provided in appendix B.
3.3.3 Results of the expenditure interviews
We used a regression model to analyse the data; the results are summarised in table 3.4. The dependent
variable in our model was ‘expenditure,’ which was modelled as a function of other variables, such as
transport mode, age group and income band. All of these variables are categorical, which required the use
of dummy variables (ie 0 or 1). Thus the coefficients for each variable presented in table 3.4 represent the
average effects of a particular ‘category’ on the ‘base’ expenditure (ie the constant of regression). For
example, the coefficient for the ‘Late night’ variable is $21.55, which suggests that people who travel to
Sylvia Park on days when the centre is open later (ie Thursdays and Fridays) spend, on average, $21.55
more than people who shop on standard weekdays (ie Monday, Tuesday or Wednesday). Similarly, people
who shop on the weekend spend, on average, $11.80 more than people who shop on standard weekdays.
All coefficients included in the model had the expected sign, even if the strength of the statistical evidence
is weak in some cases (eg the ‘Age 64+’ variable). The statistical evidence for the ‘Passenger’ and ‘Train’
variables is also weak, suggesting that we do not have strong evidence to suggest that people who travel
to Sylvia Park as car passengers or by train spend less on average than those who drive.
We do, however, have strong evidence that people who travel to Sylvia Park by bus, walking or cycling
spend less, on average, than those people who drive – even when partly controlling for their demographic
and socio-economic characteristics. It is important to note that expenditure does not directly measure of
revenue, which is considered in more detail in the following section.

3 Travel demand and expenditure surveys
31
Table 3.4 Analysis of expenditure surveys at Sylvia Park: regression results
Variablea Coefficient ($) t-ratiob P-value (%)
Base (constant) 52.99 7.18 <0.001
Late night 21.55 3.35 0.083
Weekend 11.80 2.21 2.740
Passenger -9.87 -1.24 21.645
Train -10.71 -1.45 14.614
Bus -18.73 -2.31 2.090
Walk/cycle -48.22 -6.74 <0.001
Age 25–44 12.46 1.89 5.911
Age 45–64 20.15 2.22 2.657
Age 64+ 6.67 0.84 40.101
Income 30–59k 8.15 1.26 20.943
Income 60–89k 47.54 2.88 0.404
Income 90+k 52.08 2.74 0.615
Female 7.73 1.67 9.518
Employee -31.81 -5.91 <0.001
a The dependent variable is ‘Expenditure’; heteroskedasticity-corrected model; n = 1663
b The t-ratio and P-value columns indicate the strength of the statistical relationship. Lower P-values indicate that we
have stronger statistical evidence that the variable affects expenditure. For example, the P-value for the ‘Age 64+’
variable is 40.1, which suggests a 40.1% chance that the coefficient for this variable is not statistically different from
zero. In comparison, the P-value for the ‘Late night’ variable is less than 0.083, which suggests a very high likelihood
that this variable is statistically significant.
3.3.4 Net revenue derived from transport users
The net revenue derived from visitors to Sylvia Park is not equivalent to their expenditure. Instead, we
must factor down total expenditures (ie turnover) based on the expected profit margins, which typically
range from 3% to 10% retail turnover. Retailers that move high volumes of low-value homogenous
products (such as supermarkets) typically have low profit margins, while high margins are usually
associated with retailers that move low volumes of high-value differentiated products (such as designer
clothes). Because margins vary so much between retailers, we have no simple way to convert from
expenditure to net revenue, at least without much more detailed (and hence confidential) information on
the financial performance of individual retailers. Instead, we estimate net revenue based on assumed
profit margins. Table 3.5 summarises the average expenditure depending on transport mode, as
presented previously. Note that we keep all other socio-economic and demographic characteristics
constant. Stated differently, we now consider only the effects of mode choice on net revenue.

Integrated transport and land use: Sylvia Park as a case study
32
Table 3.5 Linking expenditure to profit by transport mode user
Mode Expenditure
($)
Margins and revenue Average net
revenue 3.0% 5.0% 7.5% 10.0%
Driver $52.99 $1.59 $2.65 $3.97 $5.30 $3.38
Passenger $43.12 $1.29 $2.16 $3.23 $4.31 $2.75
Train $42.28 $1.27 $2.11 $3.17 $4.23 $2.70
Bus $34.26 $1.03 $1.71 $2.57 $3.43 $2.18
Walk/cycle $4.77 $0.14 $0.24 $0.36 $0.48 $0.30
This analysis provides some insight into the magnitude of the financial benefits to retailers at Sylvia Park
that are associated with different transport modes. While our results are subject to simplifying
assumptions (for example, they assume that expenditure by user is independent of profit margins), it
provides a reasonable indication of the ‘value’ of visitors to Sylvia Park, as determined by their
contributions to net revenue. Immediately, we can see that drivers are relatively ‘big spenders,’ especially
when one considers the additional revenue earned by their passengers.6
We should note that in the previous section on travel demand data, we applied proxies and growth rates
to expand our survey data, first across the year and, secondly, 30 years into the future. In this way, we
were able to relate surveyed mode shares to annual and future trends. In the case of expenditure patterns,
however, we were unable to identify suitable proxies or even develop reasonable assumptions on how
expenditure patterns might vary. So future sections will assume that the expenditure patterns presented
here are constant across the year and into the future, which may or not hold, depending on the
characteristics of the new users attracted to each mode.
3.4 How does Sylvia Park compare?
We now move onto the second question that was posed in the introduction: what transport and land use
outcomes have been achieved by developments that are similar to Sylvia Park in cities that are comparable
to Auckland? Answering this question requires that we first define ‘similar developments’ and ‘comparable
cities.’ To find cities that are of a comparable size to Auckland, we must look outside of New Zealand.
Thus we look to Australian cities, particularly Brisbane, where four comparable developments were
identified. Brisbane is, in many respects, an appropriate peer city for Auckland because of its scale,
regional position, geography, and transport and land use characteristics. Brisbane’s urban area is home to
over 1 million inhabitants, within a much larger metropolitan area that includes the Gold Coast and
Sunshine Coast to the south and north, respectively. Brisbane’s suburbs are predominantly low-density
and vehicle-dependent, gravitating towards key retail destinations. In addition to an extensive urban
motorway network (especially around the central city area), Brisbane has urban rail, bus and ferry services.
Public transport use is generally higher in Brisbane than in Auckland, while walking and cycling rates are
6 Two more related comments are warranted. First, we cannot consider the revenue earned from car drivers and
passengers independently; they must be combined into a representative transport unit, ie revenue per car. This issue is
discussed in more detail in chapter 4. Second, when calculating the revenue of a car, we assume one driver and a
certain number of passengers, which are derived from the travel demand surveys. However, this assumes that the
characteristics of passengers that took part in our expenditure interviews are the same as those recorded in our
surveys. We suspect that that our expenditure interviews overestimate passenger expenditure, because young children
(who are most likely to travel as passengers) are likely to be under-represented in our expenditure interviews.

3 Travel demand and expenditure surveys
33
similar. We identified comparable developments within Brisbane by focusing on large (GFA in excess of
75,000m2) mixed-retail developments located in suburban localities that are not too remote from the
central city, preferably sites that have been developed and are now operated by a single commercial
operator each. We identified five suitable case studies (others no doubt exist, but we limited ourselves to
those for which comparable data is publicly available).
Table 3.6 compares the transport and land use characteristics of these developments to Sylvia Park.
Further details on each of these locations are provided in appendix C.
Table 3.6 Summary of land use and transport characteristics for retail centres comparable to Sylvia Park
Statistic Sylvia Park Chermside Garden City Carindale Indooroopilly
Distance to CBD 11km 10km 12km 10km 7km
Bus routes 4 20 27 16 21
GFAa 72,525 122,380 101,046 114,930 84,516
Carparks 4002b 6200 4675 5400 3900
GFA/carpark ratio 18.12 19.73 21.61 21.28 21.67
Mode
shar
e
Driver 64% 49% 45% 43% 69%
Passenger 27% 27% 24% 28%
Train 3.4% 0% 0% 0% 7%
Bus 1.3% 19% 24% 23% 19%
Walk/cycle 4.1% 5% 8% 6% 5%
a While Sylvia Park is currently the smallest shopping centre, this will change once consented commercial buildings
have been constructed. Pending the outcome of the current plan change, Sylvia Park may become the largest centre by
GFA.
b We note that while Sylvia Park currently has 4002 car spaces on site, a number of these spaces will be lost once two
additional office building are built. Approximately 276 spaces will be lost directly (the parking that the buildings will
actually be built on) and then a further 380 spaces are required to service these offices. The net result is a reduction to
3346 spaces, of which 72 spaces are located on leased railway land (and thus not strictly included in calculations of on-
site parking). The net retail carparking is in the order of 3274 spaces, which is broadly in line with the consented
number of 3198 spaces. The difference of 76 is a result of an extension to the carparking building above what was
required by the resource consent. Once the consented development is constructed, the GFA/carpark ratio becomes
(72,525+18,500)/3274 = 27.8m2 per carpark.
Table 3.6 suggests that in comparison to these similar centres in Brisbane, Sylvia Park is located a roughly
equal distance from the CBD as the other shopping centres. Most notably, Sylvia Park supports the lowest
number of bus services and infrastructure compared to the other major centres. Even Carindale (which has
the lowest number of bus routes of all the Brisbane centres) supports four times as many bus services as
Sylvia Park. Sylvia Park also provides a similar level of carparking to the other case studies, especially once
the planned developments proceed (refer to note b in table 3.6).
In terms of mode share, car use in Sylvia Park is approximately 20 percentage points higher than similar
centres in Brisbane, most of which is attributable to the latter’s higher bus mode share. The high bus
mode share is likely to reflect the quality of the stations and their function as hubs within the city’s bus
network from which people can easily travel to other locations. Walk/cycle mode share at Sylvia Park is the
lowest of all the centres considered, which may reflect the land use activities around Sylvia Park or,
alternatively, the disconnected local street environment. Car passenger mode share is fairly constant
across all the centres considered. In total, non-car mode share at Sylvia Park is approximately 3–4 times
lower than any of the other retail centres.

Integrated transport and land use: Sylvia Park as a case study
34
In summary, comparable developments in Brisbane enjoy a significantly higher bus mode share than what
we found at Sylvia Park. Train mode share (for the one development that is accessible by train) is also
twice as high as at Sylvia Park. Finally, walk/cycle mode share at Sylvia Park appears to be slightly lower
than similar developments in Brisbane. While this difference is, to some degree, explained by Brisbane’s
generally higher levels of public transport use, we also note that the quality of bus infrastructure provided
in Brisbane is far superior to that provided at Sylvia Park. Overall, this suggests that the transport and land
use outcomes achieved at Sylvia Park are less integrated than those achieved by comparable developments
in Brisbane. The financial implications of this outcome are discussed in the following section.

4 T he costs and benefits of different transport modes
35
4 The profitability of different transport modes
4.1 Limitations of this analysis
We now consider the costs and revenue of different transport modes from KIPT’s perspective. In doing so,
we attempt to answer the following questions:
• What are the capital and operating costs incurred by KIPT to accommodate different transport modes?
What is the average transport cost per user by mode?
• How does the profitability of different transport modes vary across time? How should KIPT manage
future travel demands?
Before proceeding, we note some broad limitations of our analysis. Our data on transport costs and
revenues is not complete, and a number of simplifying assumptions were made. Further research into
these assumptions and the techniques we have used is recommended. Notwithstanding these limitations,
we suggest that the results provide some useful insight (that has hitherto been lacking) into the financial
factors that may influence private sector decisions in New Zealand.
4.2 The costs to KIPT of different transport modes
4.2.1 Total transport costs
We first consider the total costs incurred by KIPT when developing transport infrastructure at Sylvia Park.
We present capital costs (associated with one-off costs) and operating costs (associated with ongoing
costs) separately because differences in the timing of these costs have significant implications for the
analysis that follows.7 The capital and operating costs for each mode, which were calculated based on
information supplied by KIPT, are summarised in table 4.1.
Table 4.1 Summary of KIPT capital and operating costs by mode
Mode Capital costs Operating costs (per year)
Cara $136,428,000 $787,061
Train $6,540,625 $10,575
Walk/cycle $382,375 $21,537
Bus $304,750 $42,301
Totals $143,655,750 $861, 474
a Car includes drivers and passengers, because the costs of providing infrastructure for vehicles enables both drivers
and their passengers to access the site.
We can immediately see that capital costs account for the vast majority of transport costs (99%) incurred
by KIPT when developing Sylvia Park. Intuitively, this suggests that KIPT has little ongoing incentive to
manage travel demands to Sylvia Park. More detailed cost information is illustrated in table 4.2. Where
7 Operating costs exclude the cost of rates, which are unable to be influenced by developers. While rates are used to
subsidise public transport, these costs do not fall directly on the developer but are instead paid through regional and
local rates. For this reason, the developer will incur these costs irrespective of their actions and these costs should not
affect their investment decisions.

Integrated transport and land use: Sylvia Park as a case study
36
cost items were associated with multiple transport modes (eg security), we estimated the proportions to
allocate to different modes based on where the benefits of that expenditure were expected to fall.
Table 4.2 Detailed capital and operating of Sylvia Park: cost breakdown
Expenditure item Proportion allocated Total
Car Walk/cycle Bus Train
Capital costs
Railway station – – – 100% $6.440m
Road signage 100% – – – $0.115m
Bus shelters – – 100% – $34,500
Bus parking bays – – 100% – $86,250
Works to SH1 off-ramp 100% – – – $1.84m
Eastern approach 100% – – – $9.775m
Northern access 97.5% 2.5% – – $7.475m
Mt Wellington Highway 95.0% 2.5% 2.5% – $3.335m
Cycle racks – 100% – – $11,500
Stage 2 toilets 25% 25% 25% 25% $0.402m
Land for carparking 100% – – – $94.141m
Stage 1 carparking 100% – – – $5.5m
13. Stage 2 carparkinga 100% – – – $14.5m
Total capital costs $1.36m $0.382m $0.304m $6.540m $143.66m
Operating costs (per annum)
Maintenance/gardens 95% 2.5% 2.0% 0.5% $0.548m
Security 85% 2.5% 10% 2.5% $0.313m
Total operating costs (per
annum) $0.787m $0.021m $0.042m $0.011m $0.861
a Costs for stage 2 carparking were incurred the year after other capital costs.
Some generalised observations can be made on the basis of this data. The infrastructure required to
provide for private vehicles has significantly higher capital costs, primarily because of the land and
construction costs involved in developing parking. This suggests that per-user transport costs for private
vehicles are likely to start off relatively high but will reduce at a fast rate because of the large numbers of
users. Similar observations hold for investment in rail: significant capital costs were incurred by KIPT when
constructing the train station, although its operating costs are almost negligible. Bus and especially
walking/cycling have relatively lower up-front costs but incur relatively higher operating costs than train
users (mainly because of their larger physical footprint).8 The following section incorporates this cost data
within a discounted cash flow (DCF) model to calculate the average transport costs per user, from which
more precise observations can be drawn.
8 Note that we have not allocated the costs of land used for modes other than private vehicles, because, in most cases,
the amount of land was negligible. Moreover, land used for ancillary purposes (such as footpaths) is shared by all users,
irrespective of the mode they use. As such, the cost of this land will affect all modes equally, with a negligible net
influence on the relative performance of each transport mode. We also note that the footprint of the train station was
developed on land within the existing NIMT rail corridor and therefore did not need to be purchased by KIPT.

4 T he costs and benefits of different transport modes
37
4.2.2 Calculating average transport costs
We now introduce the concept of ‘average transport costs,’ which are the average costs to KIPT of
providing access to Sylvia Park by different transport modes. Average transport costs were calculated
using a DCF model. Time is an important dimension, because different costs are incurred at different
times and as the mix of transport users changes over time. Figure 4.1 illustrates the average transport
costs per user for each mode across time. The sensitivity of these results to changes in the key
assumptions is discussed in more detail in appendix E.
These figures are total discounted costs for years 1...N divided by the number of people accessing Sylvia
Park by each mode over that period. To reconcile (ie combine) variations in the timing of expenditure, we
must discount future costs based on an assumed cost of capital, which KIPT indicated was approximately
15%. The most striking trend in figure 4.1 is the swift reduction in average transport costs over time for all
modes, which reflects how costs are progressively split over increasing numbers of users. We also see how
the general observations discussed in the previous section are borne out: modes that incur high capital
costs (car and train) initially have higher average transport costs, while modes that initially incur lower
capital costs (bus, walking and cycling) have relatively low average transport costs. In the long run,
average transport costs for all modes converge to relatively low levels. The average transport costs for 10-
year segments are summarised in table 4.3. The results in table 4.3 confirm that walking and cycling have
the lowest average costs per person for access to Sylvia Park, by virtue of their relatively low capital and
operating costs. After 30 years, walking and cycling costs are only $0.02 per user; by contrast, the next
most cost-effective mode (bus) has an average cost per user that is more than four times higher.
Figure 4.1 Average transport cost per user by mode
$20
$19
$18
$17
$16
$15
$14
$13
$12
$11
$10
$9
$8
$7
$6
$5
$4
$3
$2
$1
$0
Avera
ge t
ransp
ort
cost
s ($
/use
r)
1 2 3 4 5 6 7 8 9 10 11 12 13 14 15 16 17 18 19 20 21 22 23 24 25 26 27 28 29 30 Year
Train
Car
Bus
Walk/cycle

Integrated transport and land use: Sylvia Park as a case study
38
Table 4.3 Average transport costs in 10-year increments by mode
Mode Year
1 10 20 30
Car $18.90 $1.85 $0.89 $0.57
Train $17.20 $1.19 $0.47 $0.28
Walk/cycle $0.92 $0.09 $0.04 $0.02
Bus $2.63 $0.31 $0.14 $0.09
4.3 Net revenue from different transport modes
The previous section determined the average transport costs associated with different modes, from KIPT’s
perspective. This section links the average transport costs to the revenue earned from each transport
mode. Developers are likely to consider transport costs in isolation; they are also concerned with the
contribution of various visitors to retail revenues. To understand how different transport modes contribute
to profitability, we now introduce the concept of the ‘revenue to cost ratio’ (RCR). The RCR is similar to the
benefit–cost ratio used in standard welfare economics, except that the RCR considers financial costs and
revenues, rather than economic costs and benefits. The RCR is simply the private sector equivalent of the
benefit–cost ratio.
The RCR was calculated for each transport mode (m) in each year (t) as follows: total discounted ‘revenue’
r, for ‘mode’ m in ‘year’ t (defined by expenditures and profit margins, see the ‘Average’ column in table
3.4) was divided by the total ‘costs’ c, incurred in providing for the transport mode m in year t, including
all revenue and costs incurred in previous years. Again, future benefits and costs were discounted at 15%
per annum, in accordance with KIPT’s expected rate of return. The RCR equation used is:
tm
t
t
tm
t
t
tm
cD
rD
RCR
30
1
30
1 [Equation 4.1]
where t
tD151
1
.
The RCR is useful because it presents a normalised rate of return to the developer from investing in
different transport modes. It also allows us to track the profitability of different transport modes over
time.
Figure 4.2 illustrates the RCRs calculated for each of the transport modes present at Sylvia Park over
30 years. The results make for interesting reading. The most profitable mode, by far, is bus, which
achieves an RCR of approximately 2.6. The next best performing mode is walking/cycling, which achieves
an RCR of around 1.4. Rounding out the results, after 30 years, car and train users achieve similar RCRs of
approximately 1.0.9 Our results suggest that KIPT has received a relatively high financial return on
9 Note that this analysis implicitly assumes that marginal and average revenue are equivalent. This analysis may be
invalid in a situation where the new users of particular modes vary from existing users. The validity of this assumption
should be investigated in more detail.

4 T he costs and benefits of different transport modes
39
investment from bus users and, to a lesser degree, pedestrians and cyclists. Moreover, KIPT’s investment
in train has delivered comparable financial returns to their investment in private vehicles, especially over
longer timeframes. In the long run, all modes deliver what could be considered ‘reasonable’ financial
returns, ie they achieve a RCR of approximately 1.0, which represents a 15% annual return on investment.
Figure 4.2 RCRs by transport mode over the lifetime of the development
We caution that these results are based on a number of assumptions about the costs and revenues
associated with visitors to Sylvia Park. Perhaps the greatest uncertainty is associated with expenditure
patterns, which we have assumed remain constant over the lifetime of the development. Future users of
each transport mode may not spend the same as existing users, especially in the case of fast-growing
modes such as rail. In the case of rail, new users that are attracted by service quality improvements may
have greater spending power than existing users, because the latter are more likely to be captive. In
appendix E, we discuss the sensitivity of these results to changes in our key assumptions, although we
also suggest that the relative spending power of different transport modes is an area for further research.
4.4 How should KIPT manage future travel demands?
The analysis presented in previous sections considered the average performance of different transport
modes at Sylvia Park, based on the financial costs and revenues to KIPT over the lifetime of the
development. But perhaps the more relevant issue is how KIPT should manage future travel demands to
Sylvia Park to maximise profitability, given the investments they have already made. This is a question
about the marginal, rather than average, profitability.
To answer this question, we need to split the costs for each mode between those that are recoverable (ie
can be avoided) and non-recoverable (ie cannot be avoided). The former are retained in the cost model,
whereas the latter are removed; KIPT cannot choose to recover those costs (unless they elect to sell their
3.00
2.50
2.00
1.50
1.00
0.50
0
Dis
counte
d R
CR
Bus
Walk/cycle
Car
Train
0 5 10 15 20 25 30 Year

Integrated transport and land use: Sylvia Park as a case study
40
asset, at which point the residual value of the capital investment may come into play). We assume that all
operating expenses are recoverable;10 hence the only decision pertains to what types of capital
expenditure are recoverable or non-recoverable. Capital expenditure is generally non-recoverable because
it has been incurred in the past, with the notable exception being land used to provide surface carparking.
The value of this land can easily be recovered simply by selling or leasing the unimproved land. Thus all
capital costs were deemed to be non-recoverable and removed from the cost model, except the cost of
land used for carparking. In this way, we were able to use our DCF model to calculate the marginal
transport costs for each mode accessing Sylvia Park, as shown in figure 4.3.
Figure 4.3 Marginal KIPT transport user costs by mode (costs measured $/user and calculated five years
after construction, assuming a 30-year lifetime for the assets)
Figure 4.3 is revealing. The high marginal cost of car users is understandable, given the relatively high
value of recoverable investment tied up in carparking. In contrast, marginal costs for the other transport
modes are almost negligible. We find that train users impose the lowest marginal costs on the
development. The phrase ‘Don’t cry over spilt milk,’ describes how KIPT should approach the management
of the Sylvia Park train station, given that the capital costs are sunk, increasing use of the train station is
likely to increase the profitability of the overall development. Similarly, low marginal costs were found for
pedestrians and cyclists and, to a lesser extent, bus users.11 Looking forward, we suggest that additional
10 In reality, operating expenditure is likely to include a fixed and a variable component. The fixed component is
typically incurred irrespective of the number of users and hence is not recoverable. The variable component is linked to
factors such as operating hours and visitor numbers, and, as such, is more reasonably incorporated with calculations of
marginal costs. Even here, however, the calculations are problematic because of the existence of ‘threshold effects’. To
use an example, KIPT is unlikely to modify security arrangements unless visitor numbers change by a considerable
amount. Hence, assuming that a change in users causes a change in expenditure is only an approximation.
11 Note that these analyses relates only to marginal costs to KIPT and say nothing about the marginal costs to society
as a whole from use of the different modes to access Sylvia Park.
$1.10
$1.00
$0.90
$0.80
$0.70
$0.60
$0.50
$0.40
$0.30
$0.20
$0.10
$0
Marg
inal tr
ansp
ort
cost
s p
er
use
r (i
n 2
00
1)
Car Walk/cycle Bus Train

4 T he costs and benefits of different transport modes
41
train and bus users, and pedestrians and cyclists are likely to be extremely profitable to Sylvia Park,
primarily because they do not create additional demand for carparking and hence enable KIPT to (at least
partially) realise the value of land used for parking.
These results are, however, premised on one important assumption, ie that the land used for carparking is
‘recoverable’ – which simply means that KIPT can realise the value of the carparks as and when they see
fit. The presence of minimum parking requirement invalidates this assumption. Minimum parking
requirements prevent developers from reusing carparks, irrespective of whether carparking is the highest
and best use of that land. If we assume that minimum parking requirements are binding (ie they prevent
the redevelopment of carparks), then the value of land used for carparking can no longer be recovered and
the marginal transport cost for car users falls from $1.07 to just $0.03 per user. At this level, the marginal
costs of car users are very similar to results for the other transport modes.
The importance of this finding cannot be overstated. Where minimum parking requirements act as a
binding regulatory barrier to the redevelopment of land used for carparking, we find little reason why a
developer would encourage use of alternative transport modes. If, however, minimum parking
requirements are eliminated, this creates an incentive for developers to manage low-value vehicle travel
because (according to our analysis) private vehicles impose higher marginal costs than other transport
modes.
This finding provides a suitable backdrop to the next chapter, which considers the general implications of
our research findings for transport and land use policy in New Zealand.
Integrated transport and land use: Sylvia Park as a case study
42
5 Implications for public policy
5.1 Preliminary notes
We now consider the implications of our analysis at a more strategic level. In this chapter, we will aim to
answer the following questions: What are the implications for transport and land use policy? What are our
recommended priorities for regulatory reform and opportunities for further research?
This section is structured as follows:
• Section 5.2 asks whether Sylvia Park is an integrated development, evaluated against the key
objectives identified in section 2.4.
• Section 5.3 identifies our recommended priorities for regulatory reform, building on results
established in the previous chapters.
• Section 5.4 presents KIPT’s response to our recommendations and provides some general insights
into private sector perspectives.
• Section 5.5 summarises areas for further research.
We are aware that some of our recommendations are relatively contentious. Such recommendations are
not, however, made lightly. Not only are they supported by the findings of this report but also, in many
instances, a range of independent external studies. While some of these recommendations are not new,
they appear particularly reasonable, given the findings of this report, which provides a somewhat unique
perspective on potential barriers to integrated transport and land use outcomes.
5.2 Is Sylvia Park an integrated development?
5.2.1 Key objectives of integration
We now attempt to answer the question of whether Sylvia Park is an integrated development. To do so, we
draw on the key objectives that we distilled from the planning and policy framework that was discussed in
section 2.4:
• Achieve an efficient urban form. Land use activities and transport infrastructure are configured in
such a way that the resulting travel demands can be managed efficiently, given the limitations of the
available infrastructure.
• Accommodate future growth. Consider the transport needs of future development when planning
and developing the performance of the transport system. Safeguard future transport corridors and
networks from development or from inappropriate or unsafe development.
• Provide integrated infrastructure. Create opportunities for better integration within and among
transport modes. Better use should be made of existing infrastructure, and the benefits and costs of
transport packages should be assessed as a whole, taking strategic and tactical factors into account.
• Develop effective solutions. Develop a range of alternatives and options that address both the
supply side (the need for additional transport system capacity) and the demand side (reducing
pressure on available capacity). Select the options that contribute most effectively to the economic,
social and environmental objectives.

5 Implications for public policy
43
• Respond to community needs. Solutions should respond appropriately to the aspirations of the
community and those affected by the development. Developments should meet the costs of their
impact on the wider transport network and work with the public sector to deliver solutions that
represent value for money.
• Manage adverse environmental effects. In larger urban areas, it is essential to offer alternatives to
vehicle-based travel, such as telecommuting and public transport use, so as to reduce congestion,
emissions, pollution (air/water/soil) and other (unpriced) negative externalities.
We assessed the performance of Sylvia Park in terms of these objectives. While this assessment is
somewhat subjective, we consider it useful because it attempts to link site-specific information with
strategic outcomes.
5.2.2 Overall assessment
5.2.2.1 General notes
Based on our assessment, Sylvia Park scores 34 out of a possible of 60 marks, or approximately 57%. We
suggest that the ‘bones’ of an integrated development are in place, insofar as Sylvia Park is reasonably
well-located and is able to provide multi-modal transport access. On the other hand, Sylvia Park has an
extremely high vehicle mode share, which suggests that the integration of transport modes within the
development could be improved. Previous chapters have already highlighted, by way of comparisons to
similar developments in Brisbane, that Sylvia Park has a relatively low bus mode share. Measures to
address this poor performance could consider higher quality infrastructure on site or a revised network
structure that uses Sylvia Park as sub-regional hub for local bus services.
Previous chapters have also noted the potential for further land use changes to deliver more integrated
land use and transport outcomes at Sylvia Park. Comparable developments in Brisbane were located within
primarily residential suburbs, which is likely to explain their higher walking and cycling mode share. We
suggest that changes in land use activities could allow for more intensive residential and commercial
development, possibly at the expense of existing light industrial activities. This should improve the degree
to which Sylvia Park integrates with surrounding land uses.
Finally, we note the almost complete absence of travel demand management measures, such as home
delivery and validated parking. While this is not unusual for retail centres like Sylvia Park, it hints at the
lack of ongoing incentive for KIPT to manage travel demands to Sylvia Park, especially for employees.
Addressing issues with the lack of incentives is discussed in more detail in section 5.3.
5.2.2.2 Achieve an integrated urban form
• Score: 6/10
On the positive side, Sylvia Park involved the redevelopment of existing low-density industrial activities.
The development was located within Auckland City’s existing urban area and represents something of a
brownfield12 development. The site sits close to strategic transport links, such as SH1, SEART and
Mt Wellington Highway, as well as the southeastern rail line. We note that in the future, Sylvia Park will
accommodate approximately 50,000m2 of residential development. The greater mix of land use activities
is considered desirable from many perspectives because it improves accessibility for non-drivers and
reduces the need for motorised travel.
12 In the UK, Australia and New Zealand, ‘brownfield’ land is land that has previously been used for another purpose
(other than agriculture or park land).

Integrated transport and land use: Sylvia Park as a case study
44
We note that Mt Wellington Highway does not support high levels of bus service. Providing high-quality
access will require existing networks to be restructured, which should have been done from the outset.
Moreover, core activities are set well back from Mt Wellington Highway, increasing the distances people
must walk/cycle in order to access the development, or the distances that bus services must divert to do
so. Development patterns on the eastern side of the NIMT are completely divorced from Sylvia Park’s train
station.
A suggested way to improve this aspect of Sylvia Park’s integration is to improve connections to activities
on the eastern side of the NIMT.
5.2.2.3 Accommodate future growth
• Score: 8/10
Sylvia Park seems more or less well positioned to accommodate future growth, as shown by KIPT’s
subsequent success at gaining additional resource consent for the construction of two more commercial
buildings. Moreover, the proposed plan change will greatly increase the density and diversity of land use
activities accommodated on the site. Several features of Sylvia Park’s development are likely to support
future growth – most notably the additional road connections to the north and east, and the Sylvia Park
train station.
While growing congestion on SH1, SEART and Mt Wellington Highway may be problematic, potential
remedies are available – such as time-of-use road pricing – even if these are politically controversial.
Our suggestion for improving this aspect of Sylvia Park’s integration is to plan for much higher quality bus
infrastructure and services in the future.
5.2.2.4 Provide integrated infrastructure
• Score: 7/10
Vehicle access to Sylvia Park is well integrated with the external road network. The configuration of the
internal road network is reasonably legible and well-connected. Pedestrian-only areas are integrated into
the development. The train station is located relatively close to the entrance of the retail complex. Taxi
stands and vehicle loading facilities are clearly defined.
On the negative side, the train station connects to Sylvia Park only and not the eastern side of the NIMT.
Future plans could seek to remedy this issue by providing vehicle/pedestrian access, although this will
require land to be purchased and will need to be coordinated with Auckland City. Bus stops are not well
connected to the development or to the train station.
A suggested improvement is to strengthen the pedestrian connections between modes.
5.2.2.5 Develop effective solutions
• Score: 3/10
The Sylvia Park website provides clear and useful information on how to access the site using alternative
transport modes. When the retail complex first opened, KIPT subsidised the use of public transport for
new employees for one month. Public transport’s mode share appears to be growing rapidly, albeit from a
low base.
Although momentum developed with early TDM initiatives, the success of the train station has not been
carried forward. We see additional opportunities for KIPT to coordinate or at least support home delivery,
which avoids the need to travel to Sylvia Park altogether. In response to peak demand, especially at
Christmas, KIPT has secured overflow parking, thereby increasing the already substantial indirect subsidy

5 Implications for public policy
45
for car users who receive ‘free’ parking. We would like to see more thought given to targeted subsidies for
public transport users, so as to mitigate peak travel demands.
A possible way to improve this aspect of Sylvia Park’s integration is to investigate TDM options as a way to
reduce vehicle travel demands.
5.2.2.6 Respond to community needs
• Score: 5/10
On the positive side, land values around Sylvia Park have increased faster than the Auckland average since
the retail centre was developed, which suggests that the centre has benefitted the community. In addition
to targeted transport improvements, KIPT paid $1.5 million in development contributions. The provision of
a new high-quality train station may also have provided external community benefits.
On the negative side, walking and cycling connections to surrounding residential and commercial areas
are relatively poor and most employees are not, at this stage, drawn from surrounding suburbs, but travel
from further afield. More equitable approaches to transport pricing may encourage more employees to live
locally or travel by non-car modes.
A suggested measure to improve this aspect of Sylvia Park’s integration is to implement a workplace travel
plan that rewards those employees who choose to live locally and/or travel by non-car modes. One of the
objectives of a workplace travel plan should be to reduce subsidies for car-based transport modes, or at
least offer similar levels of subsidies to non-car users.
5.2.2.7 Manage adverse environmental effects
• Score: 5/10
The full range of transport modes is supported at Sylvia Park, even if initial uptake has been relatively low.
However, much work remains to be done to lift mode share for alternative transport modes. Comparative
developments in Australia have approximately five times as many people using public transport, mainly
because of a higher bus mode share. We also note that it is not unusual to charge for parking at major
retail destinations in Australia and Europe. Validated parking can also help manage low occupancy vehicle
trips.
We suggest that the management of environmental effects is not the mandate of the private sector but
instead requires stronger and more effective public policies (as will be discussed later).
5.3 Recommended priorities for regulatory reform
5.3.1 Setting the scene
We now broaden the scope of our discussion to present our recommended priorities for regulatory reform.
The material in this section is more at the strategic level than other parts of this report. While our
recommended priorities for regulatory reform have been shaped by our analysis of travel and expenditure
patterns at Sylvia Park, they also draw on a wider body of literature relating to integrated transport and
land use outcomes.
To set the scene, it is worth reconsidering the misalignment of interests between the public and private
sector that was touched on in earlier sections of this report. We suggested (in section 2.2) that public
sector policies should focus on maximising the contribution of the transport system to socio-economic

Integrated transport and land use: Sylvia Park as a case study
46
welfare, specifically in terms of the safety and efficiency of the transport network, while also supporting
equitable outcomes.13 Government agencies should therefore focus on minimising transport costs for
consumers. Integrated transport and land use policies are simply mechanisms through which the public
sector can support outcomes that benefit society at large in the form of lower overall transport costs
(where costs are measured in economic, not financial terms). To some degree, in a relatively mature and
competitive retail environment (such as Auckland), where consumers spend their money is (effectively) a
‘zero-sum game’ from the public sector’s perspective: expenditure at any particular location primarily
represents a transfer in economic activity from somewhere else. Thus, rather subsidising growth, the
public sector should be concerned with minimising overall costs of travel, such as congestion and traffic
casualties, which will, in turn, improve economic welfare.
The private sector, in contrast, is interested in maximising profitability. As we have seen, this equation
includes not only transport costs but also consumer expenditure. Private developers will understandably
provide for whatever outcome maximises their profitability. We have seen that cars (and their passengers)
are relatively ‘big spenders’ even if their mode of travel incurs higher financial costs to the developer and
external costs for wider society that are not considered by the developer.14 External economic costs, such
as congestion, do not influence the decisions of the private sector. Instead, the private sector’s priority is
to attract large numbers of high-value consumers. This raises the risk that developers will (in pursuing
their own financial interests) lock society into a relatively high-cost transport system, An element of the
‘prisoner’s dilemma’15 arises into the situation: while society at large may benefit from transport solutions
that deliver lower transport costs (because consumers might then ‘reinvest’ some of their transport cost
savings into other preferred forms of consumption), no single developer wants to be the first one to
embrace a low-cost transport paradigm, because in doing so, they might cede ‘big spending’ visitors to
their competitors. This is not to say that development has no wider economic benefits; they may, of
course, increase competition and thereby lower the costs of goods and services. However, we doubt that
these competitive effects are significant in larger urban areas, especially relative to the costs of
congestion. Further research is, however, warranted on many of these questions.
Our recommendations are thus intended to support public sector outcomes, while recognising and
responding to the financial reality faced by the private sector. We suggest that if the public sector wants to
achieve integrated transport and land use outcomes, then policies must provide the right incentives to the
private sector by reducing the costs and/or risks associated with supporting non-car transport modes. The
current planning and policy framework (reviewed in chapter 2) provides sufficiently articulate descriptions
of why we need integrated transport and land use; it fails, however, to provide guidance and incentives on
how such outcomes can be achieved. In general, the evidence presented in this report suggests that
developers respond predictably to incentives or price signals. Our analysis suggests that KIPT’s investment
in transport modes is delivering reasonable levels of profitability. Based on these results, as well as our
professional experience, we are confident that, given sufficient time, the private sector will respond
appropriately to clear price signals.
13 We have not evaluated whether the outcomes achieved were indeed equitable with respect to the contributions made
by KIPT towards the ongoing development of the road network. Further research into the setting of development
contributions is required.
14 Appendix D discusses how our estimates of average and marginal transport costs could be extended to include
economic externalities.
15 The ‘prisoner’s dilemma’ is an economic concept within the study of game theory. It refers to a situation where two
parties might not co-operate, although it is in their interests to do so in order to minimise potential negative outcomes.

5 Implications for public policy
47
Having set the scene, the following sections will now present our four recommended policy reforms,
namely:
• managing the location and configuration of major developments
• eliminating minimum parking requirements
• levying development contributions using shadow tolls
• replacing transport rates with an annual parking levy.
The first two recommendations could be implemented relatively quickly; we suggest they are afforded a
higher priority than the other recommendations, which are more novel and more complex, and therefore
may require warrant further research.
5.3.2 Manage the location and configuration of major developments
If public agencies are serious about achieving integrated transport and land use outcomes then they will
need to actively manage the location of major developments.16 We suggest that a ‘hierarchy’ of integration
is developed around the following layers:
1 urban form and land use
2 general accessibility
3 internal site configuration
4 TDM initiatives.
The first two layers are the focus of our discussion. Focusing first on the urban form and land use level of
our hierarchy, we suggest that major developments must be located in positions where they contribute to
an effective urban form. This means that major developments should be located where they have access to
high-quality transport infrastructure. High-quality public transport access is especially important (and
often forgotten), because it provides a ‘safety catch’ through which unforeseen negative effects, such as
congestion, might be managed.17 Thus major developments must be located where high-quality public
transport already exists or where access can reasonably be provided. The first level of our hierarchy also
requires major developments to be compatible with existing land uses. We envisage that district plan
maps will clearly identify those areas that are considered suitable for accommodation major
developments. Obviously, however, when major developments are proposed for a particular location, it
may be necessary to revise surrounding land use activities to ensure they contribute to integrated
outcomes as effectively as possible. For example, it may be possible to accommodate more intensive
residential and commercial activities in areas close to Sylvia Park.
The second layer of our proposed hierarchy is concerned with general multi-modal accessibility. This
relates to the ease with which users of different transport modes can physically access the site. Good
access for pedestrians, cyclists and bus users requires major developments to be located close to major
16 By ‘major developments’, we typically refer to those with a GFA in excess of about 25,000m2, although some
measure of employment and/or activity level (eg trip generation) may also be useful. Measures of scale could also be
related to the overall size of the urban area so as to provide both absolute and relative measures of scale. The intent is
to manage those developments that are destinations in of themselves, which are likely to vary depending on the urban
context.
17 When we say ‘high-quality access’ we mean all-day service headways of 15 minutes or less (note that the emphasis is
on the quality of service rather than infrastructure).

Integrated transport and land use: Sylvia Park as a case study
48
streets.18 Auckland provides many examples of major developments that are not ‘on the way’, ie they are
set back from the road, which precludes efficient access by non-car modes. Figure 5.1 below shows
Massey University Albany campus, where bus services are required to make a long and inefficient detour
into the campus, or to stop on the street and force passengers to walk.
Figure 5.1 Example of a poorly located major development: Massey University, Albany Campus
Note: approximate walking distances to bus corridors are shown in black. Circles indicate bus stops
Alternatively, visitors must walk much further to the development. The costs of poor access (such as
increased bus operating costs) are large when considered over the lifetime of the development. Access for
vehicles is less problematic, and more focused on ensuring safe and efficient connections to the
surrounding road network, which are managed by existing regulations.
Internal site configuration is the third layer in our hierarchy and describes the way in which travel modes
are integrated within the development. Indeed, this is the level that receives the most attention in existing
ITA guidelines developed by ARTA and NZTA, so we do not discuss these in any detail. In general, the
emphasis is on a hierarchy of modes, where pedestrian connections into the development and between
modes are the most important. The fourth and final layer aims to achieve integrated land use and
transport outcomes through the use of TDM initiatives. We suggest that major developments should be
required to monitor travel demands generated by their site, particularly in the initial stages, and confirm
that the effects are within particular guidelines. If not, then TDM initiatives should be implemented, such
as validated/priced parking, home delivery, workplace travel plans and peak demand management plans.
TDM initiatives could be incorporated within resource consent guidelines if a development’s travel
demands are higher than originally anticipated.
We suggest that a hierarchy of integration outcomes, such as the four layers identified above, should be
incorporated within local district plans. These policies should seek to provide greater certainty to the
18 Set-backs are particularly problematic for bus access, because they force the service to make a choice between (1)
deviating to service the development or (2) stopping on streets where passengers must walk further from to reach the
development. Both outcomes are undesirable. A deviated service creates additional delays for anyone travelling
through, while non-deviated services result in people having to walk further to the destination.
360m 380m
730m 570m

5 Implications for public policy
49
private sector. We emphasise that managing the location and configuration of major developments does
not require complex and/or onerous controls, but it does require that public agencies clearly
communicate their expectations for where and how major developments should proceed.
If major developments are proposed in unsuitable areas (for example, if land use activities are not
compatible or if public transport access does not exist), they should not be rejected immediately. The
development may be large enough to act as a destination in itself and can be accommodated by
reconfiguring the surrounding network structure. But redesigning public transport networks to
accommodate major developments should be the exception, not the rule, and should occur only where
doing so contributes to demonstrable improvements in land use and transport outcomes. For example, we
note the light industrial activities that were previously present on the Sylvia Park site were not particularly
compatible with the surrounding residential uses. As such, Sylvia Park provided the opportunity for a
brownfield development with considerable external benefits (as evidenced by the increase in residential
land values that has followed the development of the retail centre).
5.3.3 Eliminate minimum parking requirements
This recommendation is rather simple. Local authorities should eliminate minimum parking requirements
from district plans and instead allow developers to determine the level of parking supply to provide on-
site. No evidence is apparent of market failure (ie externalities) that would otherwise justify regulatory
intervention in the provision of carparking. Indeed, the reverse seems to be the case, with the oversupply
of underpriced parking (partially attributable to minimum parking requirements) stimulating vehicle use
and, in turn, generating negative externalities such as congestion.
It is sometimes argued that without minimum parking requirements, parking demands will spill over onto
public parking. Such inconveniences are, however, temporary and – perhaps more importantly – their costs
pale in comparison to those associated with minimum parking requirements. Spillover issues can also be
managed using standard parking management measures, such as time limits and pricing, which resolve
supply/demand imbalances much more cost-effectively than minimum parking requirements.
The argument for eliminating minimum parking requirements rests on strong technical and strategic
grounds. Technical issues with minimum parking requirements reflect the problematic assumptions on
which they are based. For example, minimum parking requirements try to predict parking demands as a
function of the type of activity and size (commonly measured in terms of GFA). In doing so, they omit
other (arguably more important) factors that also affect parking demands. The resulting statistical
relationships that link the type and size of a proposed activity to parking demands often explain only 30%
of the variation in observed demand. By extension, this suggests that 70% (ie the majority) of the actual
variation in parking demands is associated with other factors. Such factors could include, for example, the
site’s relationship to the broader urban form, surrounding land use activities or multi-modal accessibility –
all of which are important to integrated transport and land use outcomes.
By way of example, the minimum parking requirements in Auckland City’s district plan required a total of
4066 carparks to be provided at Sylvia Park. KIPT was granted consent to provide 3274 carparks – 800
fewer than were required in the district plan (despite this shortfall, the area of land used for carparking
still occupies about 50% of the site). But even though Sylvia Park supposedly has a ‘parking shortfall’ and
experiences a 93% vehicle mode share, the current on-site parking supply has proven to be adequate, even
with no parking management or TDM measures being implemented. We suggest that minimum parking
requirements, rather than being a minimum, are actually far in excess of what should be considered
‘reasonable.’ We should also note that minimum parking requirements are based on surveys results of
free, unrestricted parking. Obviously, these demands will be far higher than the ‘true’ demand. Finally, the

Integrated transport and land use: Sylvia Park as a case study
50
minimum parking requirements imposed by local authorities do not consider the potential for developers
to manage parking at times of high demand. This is inherently problematic in urban areas that are trying
to encourage TDM measures.
The statistical models on which minimum parking requirements are based also ignore the fact that the
provision of carparking will (somewhat obviously) generate additional demand for parking – that is,
demand is sensitive to the availability of parking; increased supply increases demand. Technical
deficiencies with minimum parking requirements have been discussed at length in a number of texts (see,
for example, Shoup (2005) and Litman (2006)). The point of this discussion is to demonstrate that
minimum parking requirements are not technically robust and fail to provide reliable estimates of parking
demands.
Notwithstanding the technical deficiencies, the strategic issues with minimum parking requirements are
even more profound. The application of minimum parking requirements lowers land use densities and
creates an oversupply of underpriced parking Earlier, this report found that minimum parking
requirements neutralise financial incentives for the private sector to manage parking demands. Section 4.3
considered how Sylvia Park should manage future travel demands, first by calculating the marginal costs
to KIPT associated with providing for different transport modes. This analysis suggested that private
vehicles had a very high marginal cost (and hence lower profitability) because of the high value of land
used for parking (see figure 4.3). In a situation where the private sector was free to manage parking, ie
without minimum parking requirements, then land could be used for its highest and best use. In contrast,
minimum parking requirements prevent the developer from recovering the value of land used for parking
and thus the marginal benefits of alternative transport modes are eroded. To recap from section 4.3,
where minimum parking requirements act as a binding regulatory barrier to the redevelopment of land
used for carparking, we find no reason why a developer would encourage use of alternative transport
modes. If, however, minimum parking requirements are removed, then developers have an incentive to
reduce vehicle travel, because (according to our analysis) it imposes much higher marginal costs than
other transport modes.
We are not the first to recommend the elimination of minimum parking requirements and nor is this the
first time we have made this recommendation (Donovan and Genter 2008). Eliminating minimum parking
requirements may sound extreme, but their damaging effects are well documented – and discussion has
intensified of late with the publication of several high-profile texts (Cervero 1985; Shoup 1999; Hess
2001; Kuzmyak and Vaca 2005; Shoup 2005; Litman 2006; Marsden 2006; Genter et al 2008; Seibert
2008; Donovan 2009).19 In light of this evidence, we find it intensely frustrating that minimum parking
requirements remain a major component of almost all district plans, with the notable exception of central
areas in Auckland and Wellington.20 Central, regional and local government authorities in New Zealand
urgently need to work together to remove minimum parking requirements from district plans. It simply
does not make sense for government authorities to advocate for integrated land use and transport
outcomes at the strategic level, while at the same time applying minimum parking requirements that
create low-density, vehicle-dependent development patterns.
19 While many of these previous studies have discussed the potential for minimum parking requirements to affect
developers decisions, this is the first study (that we are aware of) that has sought to quantify the marginal costs of
different transport modes from the developer’s perspective. The removal of minimum parking requirements may be the
catalyst by which the private sector can be encouraged to engage with TDM measures.
20 Auckland and Wellington have both introduced parking maximums in their central city areas, although minimums
apply immediately outside this central area.

5 Implications for public policy
51
The private sector has a wide range of tools at its disposal to manage on-site carparking. Demand
management measures, such as validated parking (where customers who spend more than a certain
amount, say $5, are entitled to free parking), can be selectively used when and where demands are high.
Litman (2008) provides additional information on various parking management strategies. Despite these
opportunities, many people cling (we suggest forlornly) onto the notion that minimum parking
requirements are somehow ‘worthwhile.’ In appendix E, we examine and critique some of the reasons
most commonly advanced in favour of retaining minimum parking requirements.
5.3.4 Levy development contributions using shadow tolls
Development contributions are used by councils to fund the development of new infrastructure. For
example, KIPT was levied a general development contribution of $1.5 million, in addition to specific works
of approximately $8.28 million (works for the Sylvia Park train station and the SH1 off-ramp cost $6.44
million and $1.84 million, respectively). While calculating development contributions is complex, the
underlying premises are rather intuitive: a proportion of the costs of future infrastructure should be met
by new developments that generate growth and create the demand for that infrastructure. The current
legislative context for development contributions was discussed in more detail in section 2.3.3.
We suggest it would be beneficial if development contributions stimulated more integrated transport and
land use outcomes. The current practice of levying development contributions as one lump sum is
problematic for several reasons. The first issue is that the long-term risks fall on the private developer,
rather than the council – even though the latter may be better placed to manage these risks. For example,
requiring KIPT to pay for the construction of a new train station (which was then transferred to public
agencies) created major risks for the developer. For example, KIPT had little influence over subsequent rail
services (which may not have even stopped at the station). The second major issue is that one-off
development contributions do not provide an ongoing incentive for the private sector to manage travel
demands generated by their businesses. Lump sum development contributions are also problematic for
the public sector, because that sector has little recourse to additional funds in the event that a particular
development generates more traffic (and subsequently requires more transport infrastructure or services)
than was originally anticipated.
Instead of the current practice of levying one-off development contributions, we recommend that
government authorities apply development contributions using shadow tolls. These tolls would effectively
charge developments a fee based on the number of people accessing the development by a particular
mode. For example, shadow tolls could have been used to finance the construction of the Sylvia Park train
station, whereby KIPT could be charged a toll for every train passenger delivered to Sylvia Park’s door. A
shadow toll would also ensure that public agencies have an ongoing interest in providing a high-quality
rail service to Sylvia Park, thereby aligning public and private interests. The primary benefit to the private
sector is not higher returns but reduced risks; shadow tolls spread the cost of development contributions
over the lifetime of the development and link it directly to the travel demands generated by the site.
Shadow tolls have an advantage in situations where they can be used to create a price differential between
transport modes. This advantage is best illustrated by way of example. Consider figure 5.2, in which the
dashed line indicates the $9.78 million in one-off development contributions paid by KIPT. Consider now
an alternative situation where KIPT instead pays shadow tolls for the number of people that arrive at
Sylvia Park in peak hours; let us assume that KIPT pays $1.05 and $0.80 for car and rail users,
respectively. The discounted costs to KIPT associated with these shadow tolls are illustrated by the black
line in figure 5.2.

Integrated transport and land use: Sylvia Park as a case study
52
Obviously, however, the price differential between the shadow toll for road and rail users means that KIPT
can save $0.25 for every person that shifts from road to rail. Let us assume that in response to this
incentive, KIPT implements TDM measures (such as validated parking and subsidised public transport) that
encourage 15% of peak hour vehicle users to travel by rail. The subsequent impacts of this mode shift on
the total shadow tolls paid by KIPT are illustrated by the grey line in figure 5.2, which suggests that KIPT
has benefitted to the tune of $300,000.21
Figure 5.2 Comparative costs to KIPT of shadow tolls versus upfront contributions
*NPV = net present value
KIPT can, moreover, save $1.05 or $0.80 for every peak road and rail user that shifts to the off-peak
period, thereby creating a direct financial incentive for TDM measures that encourage peak spreading
(such as late-night shopping). In this way, shadow tolls provide an ongoing incentive for KIPT to manage
travel demands in a way that is likely to deliver wider economic, social and environmental benefits for
society.
We note that shadow tolls have previously been used to finance major infrastructure projects where
private sector involvement is required but user tolls are infeasible or undesirable. In these instances, the
public sector typically pays the private sector a shadow toll per user. Our recommendation simply reverses
these traditional roles. Development charges represent a transfer from the private to the public sector for
costs incurred by the latter. We know of no cases where shadow tolls have been used in the way that is
recommended in this report; this represents a key contribution of this research. More specific studies
should consider the feasibility and desirability of applying shadow tolls in this way. It may be that the
21 We have assumed that 20% and 30% of private vehicles and rail users, respectively, arrive during what can be
classified as ‘peak’ times.
Upfront contributions
Shadow tolls (base)
Shadow tolls (mode shift)
$10
$9
$8
$7
$6
$5
$4
$3
$2
$1
$0
Tota
l co
ntr
ibu
tions
(NPV
)* i
n $
million
1 2 3 4 5 6 7 8 9 10 11 12 13 14 15 16 17 18 19 20 21 22 23 24 25 26 27 28 29 30
Year

5 Implications for public policy
53
costs of monitoring (ie counting the numbers of people arriving by car and/or rail) outweigh the potential
benefits, although technological improvements may also reduce these costs. It is reasonable that shadow
tolls could be offered as an option in addition to standard, one-off development contributions.
Notwithstanding the need for further investigation, we suggest that shadow tolls may be a useful policy
initiative that better aligns the interests of the public and private sector.
5.3.5 Replace transport rates with an annual parking levy
Our fourth and final recommendation concerns how local government authorities fund the provision of
public transport infrastructure and services.
Typically, regional and local authorities use property rates to fund the development of transportation
improvements. ARC, for example, levies a targeted public transport rate, which is broadly defined by the
accessibility of an area to public transport services. Auckland City Council, in contrast, relies on general
rates to fund transport activities, which account for approximately 22% of total council expenditure. At
Sylvia Park, the combined rates bill attributable to transport activities (ie for both ARC and Auckland City
Council) was estimated to be $641,207 per annum.
Property rates are a relatively blunt instrument with which to fund infrastructure development.22 Transport
rates based on property values effectively penalise high-value properties, which are more likely to occupy
central locations and support access by alternative modes. Property values are often an indicator of
density, which (all other factors being equal) tends to generate less vehicle travel. Instead, we suggest that
transport investment is funded not through rates based on property values but by way of an annual
parking levy instead. The number of carparks is likely to be a more accurate indication of a development’s
actual traffic-generating potential. Raising the same rates revenue from Sylvia Park’s 3274 carparks would
thus require an annual levy of approximately $200 per carpark, which seems reasonable.
We note that parking levies are currently applied in several Australian cities, specifically the central city
areas in Sydney, Melbourne and Perth. Levies per carpark vary from $200 in Perth to $2000 in central
Sydney, where they raise approximately AUD$100 million per year. Revenue from parking levies is typically
hypothesised for transport improvements. It would seem fair for the annual parking levy to be fiscally
neutral, at least in the beginning – ie revenue raised from the parking levy should be used to offset other
local government revenue, such as rates. In New Zealand, an annual parking levy could possibly be
charged as a targeted rate on space used to provide parking, although further work is required to
establish whether such a levy would be possible on the basis of existing legislation, or whether
amendments to existing legislation are required (Donovan and Genter 2008).
While the primary motivation for applying a parking levy is not to discourage the provision of off-street
carparks, it will undoubtedly have this effect – if only to a limited degree. If the total number of off-street
carparks decreases, then revenue from the levy will also decline, unless it is accompanied by a
commensurate increase in the levy. This suggests that the parking levy (per carpark) would need to
increase over time, until the parking supply reaches some form of equilibrium. The net effects of the
parking levy on public finances may relatively small if the reduction in parking supports increased use of
22 Some commentators suggest that the full costs of public transport infrastructure and services should be charged to
the users. This tends to ignore the presence of fixed costs (leading to scale economies) and externalities. Congestion is
an externality arising from vehicle use (although this would ideally be charged to users through time-of-use pricing),
and public transport networks tend to benefit from scale economies. Hence, we may have a prima facie case for
ongoing public transport subsidies, especially in large cities, and an associated need for a reliable revenue stream.

Integrated transport and land use: Sylvia Park as a case study
54
public transport (ie additional fare revenues and lower operating subsidies). In this way, an annual parking
levy may contribute to the development of a more financially sustainable public transport system.
We suggest that an annual parking levy is an ideal way to reward developments that manage access to
their site in a way that does not generate excessive vehicle travel. A key advantage of this
recommendation (compared to, say, shadow tolls) is that it applies to all existing developments, rather
than just new developments. In this way, the parking levy provides a broad-based incentive for the private
sector to implement TDM initiatives.
5.4 KIPT’s response to the recommendations
We sought KIPT’s response to the recommendations discussed in the previous section, which are
summarised below, along with our clarifying comments.
• Eliminate minimum parking requirements
– KIPT’s response: ‘We have no issue with the removal of minimum parking rates. In practice,
parking has always been provided at a level that meets demand as opposed to what is required by
the district plan. This has meant that Sylvia Park has always technically operated with a parking
shortfall without any issues.’ (pers. comm., Andrew Buckingham)
– Our comment: removing the need to provide parking is obviously attractive to developers because
it allows them more freedom to manage their asset. Eliminating minimum parking requirements
would reduce compliance costs, and enable existing and new developments to operate more
intensively.
• Levy development contributions using shadow tolls
– KIPT’s response: ‘Shadow tolls have an appeal, as they allow for the payment of development
contributions over a period of time. While linking the toll to the actual number of visitors delivered
to the site makes sense, this may prove relatively expensive to administer.’ (pers. comm. Andrew
Buckingham)
– Our comment: extra collection costs may be associated with shadow tolls. This is why we suggest
that shadow tolls should be offered as an alternative to existing lump sum schemes, rather than a
replacement. Further research is warranted.
• Replace transport rates with an annual parking levy
– KIPT’s response: ‘Parking levies are potentially problematic as it does not necessarily follow that
each carpark will have the same impact (or cost) on the road network. Overall, it is unlikely to have
a significant impact on the parking provided, as we would always attempt to provide parking at a
rate that met demand.’ (pers. comm. Andrew Buckingham)
– Our comment: only an indirect connection exists between parking and travel demands. However,
this connection is considerably more accurate than that which exists between rates (ie property
values) and travel demands. While parking levies are not perfect, they are an improvement on the
status quo, which we suggest is a more reasonable point of comparison.
In addition to commenting on our recommendations, KIPT offered some more general perspectives on
their approach to transport and land use issues. We have quoted some of the most interesting comments
below, after which we offer an interpretation.
5 Implications for public policy
55
Property values have a great bearing on the whole parking equation. A high land price
generally equals paid parking as parking spaces are no longer at grade but in multi-storey
buildings. We will always provide sufficient carparking to support the turnover required by
retailers, a portion of which, in turn, converts to rent, which provides the return on our
investment and dividends to shareholders. That proposition will never change.
Back to the original question as to whether parking will be free and unrestricted: the simple
answer is that the market will determine this and by ‘market’, that includes what our
competitors are doing. New Zealand has a few examples of paid shopping centre parking, all
of which are in high land value locations or where there is paid street parking and the centre
needs to maintain an even playing field to prevent free non-shopper parking/abuse.
Ultimately, we don't know what we don't know. Validation systems can attempt to lift sales
performance by setting a high threshold; however, this is unproven. Public transport will
improve visitor numbers and, if the market is finite, these will be visitors that shift from car
to public transport; however, shopping is principally a car-based activity at present and has
been since regional shopping centres evolved from the 1960s. (pers. comm. Andrew
Buckingham)
A number of key messages can be learned from these comments. First, KIPT sees the value of land as the
primary driver of the value of parking management measures, probably because it provides the primary
incentive for more intensive development, including structured parking. This suggests that the private
sector is aware of the financial factors that (should) influence the provision of on-site parking. It is also
clear that while KIPT is looking to utilise land for its highest value and best use, they also place a high
value on providing ‘sufficient’ parking to support their retail tenants. This, in turn, suggests that the risks
of removing minimum parking requirements are relatively low, because an adequate parking supply is a
prerequisite for viable retail development.
Second, KIPT suggests that their ability to charge for parking is determined by the ‘market’ (which
includes their competitors) and is shaped by the presence of surrounding parking prices. This comment is
extremely insightful; it suggests that KIPT’s ability to manage parking depends on market conditions or,
more specifically, people’s willingness to pay for parking. This is influenced by what people experience
elsewhere. Naturally, when people receive free parking whenever and wherever they drive, then these
experiences will contribute to certain cultural norms. Put another way, it is unlikely that one developer
will, of their own accord, charge for parking because, in doing so, they butt up against ingrained cultural
expectations over which they have relatively little influence. It also suggests that the public sector needs
to lead the way in its management of public parking, which would ideally see greater use of priced parking
when and where justified by demand.
Third, KIPT appears to be relatively risk-averse when it comes to questions around managing people’s
travel patterns. They mention that parking validation systems are unproven. This may highlight the need
for the public sector to support research into the effectiveness of TDM initiatives. Also interesting is the
reference to shopping activities being primarily car-based ‘since the 1960s.’ This suggests that large
institutional investors effectively design for existing (or even historical) behavioural patterns, which is
again understandable, given that their individual development will have only marginal influence over
people’s overall cultural norms.
On balance, we find the comments from KIPT on our recommendations (and the perspective of the private
sector) to be reasonably encouraging. It is clear that the private sector is extremely reluctant to lead the
way and is highly attuned to market conditions and cultural norms. In this environment, we suggest that it

Integrated transport and land use: Sylvia Park as a case study
56
is necessary for the public sector to provide incentives and information (such as this report) that
encourage the private sector to implement the outcomes that will benefit themselves and wider society.
The most obvious way to create these incentives is to structure the cost equation so that it provides
ongoing incentives to the private sector to manage travel demands to their developments. In the case of
Sylvia Park, over 99% of the transport costs incurred are associated with upfront capital expenses. Once
these capital expenses have been paid, the private sector has little financial reason to be interested in
managing travel demands. We suggest that our recommendations to eliminate minimum parking
requirements, levy development contributions using shadow tolls and to replace transport rates with an
annual parking levy are an appropriate blend of regulatory ‘sticks’ and financial ‘carrots.’ Together, they
are likely to encourage the private sector to engage with integrated land use and transport outcomes in
creative, market-driven ways.
5.5 Areas for further research
Based on this study, we suggest that further research is warranted in the following areas:
• Forecasting annual travel demands: we used our survey data to forecast annual travel demands.
This process used several demand proxies (for which annual data was available) as the basis for these
calculations. Further research could develop improvements for forecasting annual travel demands.
• Expenditure interviews and modelling: we used interviews to gather information on the expenditure
patterns of various transport modes, controlling for a range of characteristics. Further research could
consider how to improve this model, either through collecting additional data or, alternatively, by
trying different specifications.
• Analysis of costs and revenues: we used a DCF model to calculate average and marginal transport
costs. Further research could consider whether these are the most appropriate modelling framework
and/or parameter values.
• Recommended priorities for regulatory reform: we have identified four recommended priorities for
regulatory reform. With the exception of removing minimum parking requirements (for which
implementation is trivial), further research is needed into how these recommendations could be
implemented.
• Application of TDM strategies: the public and private sectors should coordinate research into TDM
strategies, such as home delivery and validated parking. By improving the availability of information
on TDM measures, the risks associated with their implementation are reduced and their attractiveness
to the private sector is likely to increase.
Further research is also required into how individual district plans can be revised to support integrated
transport and land use outcomes. The development of road hierarchies that consider not only travel
demands but also the prevailing urban form are of prime importance.

6 Summary of findings
57
6 Summary and conclusions
6.1 Summary
6.1.1 Structure
At the beginning of this report, we posed the following questions:
• How do people travel to Sylvia Park? How does retail expenditure vary by access modes and other
socio-economic factors?
• What are the transport and land use characteristics of similar retail developments in cities comparable
to Auckland?
• What are the capital and operating costs incurred by KIPT to accommodate different transport modes?
What is the average transport cost per user by mode?
• How does the profitability of different transport modes vary across time? How should KIPT manage
future travel demands?
• What are the implications for transport and land use policy? What are our recommended priorities for
regulatory reform and further research?
This section summarises our findings in response to these questions and also provides some concluding
remarks.
6.1.2 Travel mode and retail expenditure
Travel demands and expenditure patterns are summarised in the table 6.1. Our analysis suggests that
expenditure patterns are affected by transport mode, demographic characteristics (such as gender, age
and income), temporal factors (such as weekends and late-night shopping) and visitor status (ie shopper
or employee).
Table 6.1 Summary of travel demands and expenditure patterns by mode in 2009
Mode Travel demands Expenditure patterns
Trips Mode share Expenditure Net revenue
Drive 7,197,656 64.4% $52.99 $3.38
Passenger 2,988,892 26.8% $43.12 $2.75
Train 381,452 3.41% $42.28 $2.70
Bus 146,050 1.31% $34.26 $2.18
Walk 436,014 3.90% $4.77 $0.30
Cycle 23,589 0.21%
Total 11,173,654 100% N/A N/A

Integrated transport and land use: Sylvia Park as a case study
58
6.1.3 Characteristics of similar retail developments
Key land use and transport characteristics for Sylvia Park in comparison to other retail centres in Brisbane
are summarised in table 6.2. In comparison to Sylvia Park, the latter have much higher bus mode shares.
This is likely to reflect how large retail centres in Brisbane are developed as sub-regional public transport
hubs.
Table 6.2 Summary of land use and transport characteristics for comparable retail centres
Statistic Sylvia Park Chermside Garden City Carindale Indooroopilly
Distance to CBD 11km 10km 12km 10km 7km
Bus routes 4 20 27 16 21
GFA (m2) 72,525 122,380 101,046 114,930 84,516
Carparks 4002 6200 4675 5400 3900
GFA/carpark 18.12 19.73 21.61 21.28 21.67
Mode
shar
e
Driver 64% 49% 45% 43% 69%
Passenger 27% 27% 24% 28%
Train 3.4% 0% 0% 0% 7%
Bus 1.3% 19% 24% 23% 19%
Walk/cycle 4.1% 5% 8% 6% 5%
6.1.4 Capital and operating costs, and average transport cost per user
Table 6.3 summarises the capital and operating costs for each mode, as well as average transport costs
per user over time.
Table 6.3 Capital, operating, and average transport costs by mode
Mode Capital costs Operating costs
(per year)
Average transport costs ($/user)
Year 1 Year 10 Year 20 Year 30
Car a $136,428,000 $787,061 $18.90 $1.85 $0.89 $0.57
Train $6,540,625 $10,575 $17.20 $1.19 $0.47 $0.28
Walk/cycle $382,375 $21,537 $0.92 $0.09 $0.04 $0.02
Bus $304,750 $42,301 $2.63 $0.31 $0.14 $0.09
Total $143,655,750 $861,474 N/A N/A N/A N/A
a Car includes drivers and passengers, because the costs of providing infrastructure for vehicles enables both drivers
and their passengers to access the site.
This shows that the majority of transport costs incurred by developers are in the form of upfront capital
costs. Average transport costs decline steadily over time and, ultimately, are relatively small in comparison
to net revenues, especially for non-car modes.
6.1.5 Profitability across time
To understand how different transport modes contribute to the profitability of Sylvia Park, we introduced
the concept of the revenue–cost ratio or RCR. Figure 6.1 illustrates the RCRs calculated for each of the
transport modes present at Sylvia Park over 30 years.

6 Summary of findings
59
Figure 6.1 RCRs by transport mode over time
Our results suggest that bus users and, to a lesser degree, pedestrians and cyclists have generated
relatively high rates of return at Sylvia Park. Moreover, after 15 years, KIPT’s investment in rail has
delivered comparable returns to the investment in private vehicles. In the long run, all modes deliver what
could be considered reasonable financial returns (ie have RCRS in excess of 1.0). This suggests that
similar developments may well benefit from more adequate provision of bus infrastructure and services.
We also considered how KIPT should manage future travel demands to Sylvia Park to maximise
profitability, given the investments they have already made. We assume that all operating expenses are
recoverable, while capital expenditure is generally non-recoverable, with the notable exception being land
used to provide surface carparking. We estimated marginal transport costs for each mode accessing Sylvia
Park, as shown in figure 6.2. The high marginal cost of car users reflects the relatively high value of land
used for in carparking. In contrast, other modes impose almost negligible marginal costs. Thus, the low
average RCR for train users (shown in figure 6.1) is entirely attributable to costs that are unable to be
recovered. The phrase ‘Don’t cry over spilt milk,’ aptly describes how KIPT should now view its current
situation. We would advise KIPT to make the most of its investment in the Sylvia Park train station.
These results are, however, based on the assumption that land used for carparking is recoverable. The
presence of minimum parking requirement invalidates this assumption, because they prevent developers
from reusing carparks, irrespective of whether the spaces are effectively used or not. If we assume that
minimum parking requirements are binding (ie they prevent the redevelopment of carparks), then the
value of land used for carparking is no longer able to be recovered and the marginal transport cost for car
users falls from $1.07 to just $0.03 per user, ie similar to that of other modes.

Integrated transport and land use: Sylvia Park as a case study
60
Figure 6.2 Marginal KIPT transport user costsa by mode
a Costs are calculated five years after construction, assuming a 30-year lifetime for the assets
6.1.6 Implications for transport and land use policy
We recommend the following priorities for regulatory reform:
• Manage the location and configuration of major developments. If public agencies are serious
about integrated transport and land use outcomes, and about increasing uptake of shared and active
modes, then they will need to manage the location of major developments in some way. Too many
factors (such as externalities and scale economies) will distort perfectly competitive markets away
from integrated land use and transport outcomes. In this report, we have presented a hierarchy of
integration based around the following four layers of integration:
– urban form and land use
– general site access
– internal site configuration
– TDM initiatives.
We suggest that suitable locations for major developments should be clearly identified in district plan
maps. Proximity to a high-quality public transport corridor is a necessary but insufficient condition for
suitability; other important factors include the nature of the prevailing land use activities.
• Eliminate minimum parking requirements. This recommendation is rather simple. Local authorities
should eliminate minimum parking requirements from district plans. The rationale for eliminating
minimum parking requirements is based on strong technical and strategic arguments. It simply does
not make sense for government authorities to advocate for integrated land use and transport
outcomes, while applying minimum parking requirements that create extremely low-density
$1.10
$1.00
$0.90
$0.80
$0.70
$0.60
$0.50
$0.40
$0.30
$0.20
$0.10
$0
Marg
inal tr
ansp
ort
cost
s p
er
use
r ($
/year
in 2
01
1)
Car Walk/cycle Bus Train

6 Summary of findings
61
developments and excessive rates of vehicle use. The negative effects of minimum parking
requirements are documented not only in this report but in a range of other studies. The private
sector is well placed to manage carparking in a way that leads to more integrated transport and land
use outcomes.
• Levy development contributions using shadow tolls. We recommend that regional and local
government authorities levy development contributions for major developments using shadow tolls. In
this way, developments would be charged a fee based on the actual travel demands that they
generate. Shadow tolls benefit the private sector by reducing capital costs (and hence lowering the
risk profile) of development activities, especially if the development is not successful. Shadow tolls
could also be used to create price differentials that provide an ongoing incentive for the private sector
to manage travel demands.
• Replace transport rates with an annual parking levy. We suggest that an annual parking levy
should be used to raise revenue for transport improvements. Raising the equivalent transport rates
revenue from Sylvia Park’s 3274 carparks would require a levy of approximately $200 per carpark per
year. Rates based on general property values penalise high-value centrally located properties that are
more likely to be accessible by alternative modes. In contrast, the number of carparks is a more
accurate reflection of a development’s actual traffic-generating potential.
The first two recommendations are reasonably straightforward, whereas the latter two may warrant more
detailed research.
6.2 Conclusion
This report has considered the vexed issue of integrated transport and land use from a unique
perspective. By gathering detailed data for a single development, we have been able to gain an insight into
factors that may influence the decisions of the private sector. The results are rather revealing. Current
policies provide no ongoing incentive for developments to manage travel demands to their site.
In response to these findings, we have identified four recommended priorities for regulatory reform. Our
first recommendation is that government authorities should actively manage the location of major
developments. Left to their own devices, the private sector is unlikely to deliver land use and transport
outcomes that are aligned with the interests of wider society. This requires that more specific guidance on
land use and transport integration should be included in local district plans.
Aside from managing the location of major developments, we suggest that the public sector should focus
on policies that encourage the private sector to deliver the integrated outcomes. The most important of
these is the elimination of policies that create bad incentives, such as minimum parking requirements. We
suggest it will not be possible to achieve integrated outcomes in the presence of minimum parking
requirements, because of the development patterns that they inevitably cause.
Our recommendations to levy development contributions using shadow tolls and to replace transport rates
with an annual parking levy create positive price signals. These incentives encourage the private sector to
manage vehicle travel demands efficiently by replacing ineffective mechanisms (namely development
contributions and local government transport rates) with more nuanced price signals. In general, these
recommendations are intended to be broadly fiscally neutral in the short term.
While each recommendation stands on its own individual merits, we note that a number of linkages exist
between these recommendations that may amplify their individual effects:

Integrated transport and land use: Sylvia Park as a case study
62
• Contributing to more efficient transport systems: by providing clear guidance on the location and
configuration of major developments, the private sector benefits from greater certainty, while the
public sector is able to develop more efficient transport networks. This recommendation should result
in more concentrated service patterns and, ultimately, higher uptake of public transport. In this way,
we can simultaneously reduce the operating costs of public transport, while also increasing its
operating revenues.
• Enabling higher density and less car-dependent development patterns: the elimination of
minimum parking requirements will enable higher density developments and increase the relative
attractiveness of non-car transport modes. In the long run (as the current oversupply of carparking is
built out), we would expect the scarcity and price of parking to increase, which will, in turn, stimulate
additional changes in travel patterns.
• Creating direct incentives for developments to manage their demand for vehicle travel: the
implementation of the annual parking levy, in conjunction with the use of shadow tolls (where the levy
creates a price differential between different transport modes), creates a direct incentive to manage
the demand for vehicle travel. This may ultimately be expected to encourage the private sector to
manage demand for carparking by encouraging the uptake of other modes.
We suggest that a coordinated but diverse mix of regulatory reforms is more likely to achieve the desired
outcomes than one single measure. We also note that the elimination of minimum parking requirements
and introducing the annual parking levy have an added advantage in that they affect existing
developments, whereas changes to the district plan and development contributions apply only to new
developments.
We are confident that, over time, implementing these recommendations will enable more rapid progress
towards integrated land use and transport outcomes. Most attractively, they do so with a combination of
regulatory ‘sticks’ and financial ‘carrots’ that improve the alignment between public and private sector
interests.

7 References
63
7 References
Abley, S, P Durdin and M Douglass (2010) Integrated assessment guidelines. NZ Transport Agency research
report 422. Wellington: NZ Transport Agency.
Auckland City Council (2010) Auckland City Council’s development contribution policy 2010/2011. Accessed
15 March 2011. http://www.aucklandcity.govt.nz/council/services/devcons/docs/policy10.pdf.
Auckland City Council (2011) Auckland City district plan. Auckland: Auckland City Council.
Auckland Regional Council (ARC) (2010) Auckland regional land transport strategy 2010–2040. Auckland,
ARC.
ARC (1999) Auckland regional policy statement. Auckland: ARC.
Auckland Regional Transport Authority (2011) Eastern guide. Accessed 15 March 2011.
http://auth.maxx.co.nz/media/4651/eg_eastern%20guide_oct%202010%20web.pdf.
Cervero, R (1985) Deregulating urban transportation. Cato Journal 5 (1): 219–237.
Donovan, S (2009) How free is your parking? FCPP Backgrounder 77. Winnipeg: Frontier Centre for Public
Policy.
Donovan, S and J Genter (2008) Managing transport challenges when oil prices rise. NZ Transport Agency
research report 357. Wellington: NZ Transport Agency.
Genter, J, L Schmitt and S Donovan (2008) The missing link: parking as the integration of transportation and
land use. New Plymouth: IPENZ Transportation Group.
Hess, DB (2001) The effects of free parking on commuter mode choice: evidence from travel diary data. Los
Angeles: The Ralph and Goldy Lewis Centre for Regional Policy Studies, University of California.
Kuzmyak, R and E Vaca (2005) Parking pricing and fees. Transit Cooperative Research Program report 95.
Washington DC: Transportation Research Board.
Litman, T (2006) Parking management best practices. Chicago, IL: American Planning Association.
Litman T (2008) Parking management: strategies, evaluation and planning. Accessed 14 March 2011.
www.vtpi.org/park_man.pdf.
Local Government Forum and Property Council New Zealand (2010) Taxing growth and development: a critical
review of the role of development and financial contributions, 2010. Christchurch and Auckland: Local
Government Forum and Property Council New Zealand.
Marsden, G (2006) The evidence base for parking policies – a review. Journal of Transport Policy 13: 447–457.
Ministry of Transport (2005) Surface transport costs and charges study. Wellington: Ministry of Transport.
New Zealand Government (2009) Government policy statement on land transport funding 2009/10–2018/19.
Wellington, Ministry of Transport.
New Zealand Government (2002) Local Government Act 2002. Wellington: New Zealand Government.

Integrated transport and land use: Sylvia Park as a case study
64
NZ Transport Agency (NZTA) (2009) Why integrated planning? Accessed 6 June 2010.
www.nzta.govt.nz/planning/process/integrated/index.html#land.
NZTA (2010) Economic evaluation manual, volume 2. Wellington: NZTA.
Seibert, C (2008) There is no such thing as a free parking space. Policy 24: 7–13.
Shoup, DC (1999) The trouble with minimum parking requirements. Transportation Research Part A: Policy
and Practice 33(7–8): 549–574.
Shoup, DC (2005) The high cost of free parking. Chicago, IL: Planners Press, American Planning Association.

Appendices
65
Appendix A Employee travel patterns
Our analysis of travel demands presented in chapter 3 considered overall travel demands for all visitors to
Sylvia Park. In this appendix, we focus specifically on employee travel patterns. Because we could not
determine who was an employee as people entered the Sylvia Park site (for safety and privacy reasons), we
were limited in the degree to which we could analyse employee travel patterns.
Our main source of information is gathered from the expenditure interviews, which is a relatively small and
biased sample. The expenditure interviews are biased because we deliberately stationed interviewers close to
train and bus users, which meant that the use of these modes is likely to be over-reported.23 As figure A1
shows, the proportion of interviews respondents using train and bus was found to be significantly higher than
the levels reported in our earlier analysis.
Figure A1 Mode shares derived from expenditure interviews
23 Note that this not an issue for earlier analysis because the expenditure interviews were not used to determine travel
patterns, which instead were collected from the travel demand surveys.
23%
30%
26%
6%
15%
30%
41%
13%
6%
11%
0%
5%
10%
15%
20%
25%
30%
35%
40%
45%
Train Drive Car Passenger Walk/Cycle Bus
Perc
enta
ge m
ode s
hare
Non-Employee Employee

Integrated transport and land use: Sylvia Park as a case study
66
Thus, we are limited in the degree to which we can draw conclusions about absolute employee mode share.
We can, however, make inferences about the relative likelihood that employees will use particular types of
transport mode.
Figure A2 below consolidates the mode shares illustrated previously into three broad categories, namely
private vehicle, public transport and walking/cycling. This suggests that employees are, in general, less likely
to use private vehicles and more likely to use public transport.
Figure A2 Mode share between employees and non-employees of Sylvia Park
* Pax = passenger
These results are encouraging to a degree, in that employees are less likely to use alternative modes to access
Sylvia Park. However, the difference is not as large as we would expect, given that many more employees will
be travelling at peak times.
We suggest that further employee mode shift is possible. The first step would be to eliminate free parking for
employees, which also seems warranted on the grounds that employees spend considerably less than other
visitors.
Train 23%
Pax* 26%
Drive 30%
Pax 13%
Drive 41%
Bus 10%
Train 30%
Bus 15%

Appendices
67
Appendix B Expenditure interviews
B1 Expenditure interview form
Figure B1 shows a copy of the form used for the expenditure interviews.
Figure B1 Expenditure interview form

Integrated transport and land use: Sylvia Park as a case study
68
B2 Summary of expenditure interviews
Table B1 summarises the sample size for key categories collected during the expenditure interviews.
Table B1 Samples sizes for key categories in the interviews
Variable Category Proportion and sample size
Day of week
Monday/Tuesday/Wednesday 31% (n = 485)
Thursday/Friday (late night) 35% (n = 557)
Weekend 34% (n = 528)
Mode
Drive 31% (n = 520)
Passenger 24% (n = 403)
Train 24% (n = 392)
Bus 15% (n = 251)
Walk or cycle 6% (n = 103)
Age
Under 24 46% (n = 760)
24–44 31% (n = 503)
45–64 15% (n = 254)
64+ 8% (n = 129)
Annual income
Under $29k 58% (n = 863)
$30–$59k 23% (n = 336)
$60–$89k 12% (n = 182)
$90+k 7% (n = 111)
Gender Male 40% (n = 672)
Female 60% (n = 991)
Status Employee 10% (n = 166)
Visitor 90% (n = 1497)

Appendices
69
Appendix C Analysis of comparable developments
C1 Chermside, Brisbane
Chermside is the largest shopping centre in Queensland, with a total retail floor area of 122,380m2.
Chermside is located in Brisbane’s inner northern suburbs, at the corner of Gympie Road and Hamilton Road.
Chermside provides 6200 carparks in addition to a bus station, which is illustrated in figures C1–C4 below.
The bus station caters for 20 bus routes and provides park-and-ride, public telephones, public toilets
(figure C5) and wheelchair access. Much of the carparking provided at Chermside is provided by way of
structured parking rather than surface parking. Land uses activities around Chermside are dominated by low-
density detached residential dwellings with some peripheral commercial activities on the major roads.
Figure C1 Aerial photo of Chermside retail centre (bus station is circled)
Figure C2 Enlarged aerial photo Chermside retail centre, showing more of the bus station layout (circled)

Integrated transport and land use: Sylvia Park as a case study
70
Figure C3 The bus station at Chermside retail centre
Figure C4 Alternative view of the bus station at Chermside Retail Centre, showing the pedestrian crossing
between the station and the shopping complex
Figure C5 Drinking fountain and toilets provided at the Chermside Retail Centre
One of the advantages of providing the bus station in this location is that it avoids the need for buses to travel
along the adjacent roads to make large deviations in order to access the station. This reduces bus travel times
(and hence operating costs) for all passengers, especially those who are travelling through, rather than to,

Appendices
71
Chermside. The bus station also has real-time information signs, as well as parking for shopping trolleys and
bicycles (figure C6).
Figure C6 Bicycle racks and trolley parking adjacent to the bus station at Chermside Retail Centre
C2 Garden City, Brisbane
Garden City is a major shopping centre in Brisbane located 12km from the CBD in Upper Mt Gravatt. Garden
City is positioned adjacent to the Pacific Motorway on the intersection of Logan Road, Kessels Road and Mount
Gravatt–Capalaba Road, as illustrated in figure C7, and has a total retail floor area of 101,046m2. The centre
provides around 4675 carparks, of which a relatively large proportion is provided at grade.
Garden City incorporates the Upper Mount Gravatt Busway Station (figure C8), which is a major stop on the
South-East Busway, which is a grade-separated bus-only corridor with direct access to central Brisbane. It is a
major public transport interchange that is serviced by a total of 27 bus routes. Peak hour services have a
frequency of every two minutes, with express routes on the busway providing access to the city centre in
18 minutes. Additional facilities include park-and-ride, public phones, toilets and wheelchair access.

Integrated transport and land use: Sylvia Park as a case study
72
Figure C7 Aerial view of Garden City, illustrating the location and layout of the adjacent bus station on the
Southeast Busway
Figure C8 Ground view of the Upper Mount Gravatt busway station at the Garden City shopping complex
The incorporation of the bus interchange and associated facilities ensures that people travelling to Garden
City have a very fast, direct public transport option. The shopping centre provides customers with information
about all bus routes that service the shopping centre on its website. Areas to the north and east of the
shopping centre are predominantly low-density detached residential dwellings, although some light
commercial activities have developed in areas surrounding the shopping centre. This suggests that centres
such as these may act as attractors for other developments. Pedestrian access to the south and west is cut off
by the presence of the Pacific Motorway.
South East Busway

Appendices
73
C3 Carindale shopping centre
Carindale shopping centre (figure C9) is located in the inner southeast suburb of Carindale, which is 10km
east of Brisbane’s CBD. The shopping centre is located 3kms from the Gateway Motorway on Old Cleveland
Road close to the intersection of Old Cleveland Road and Creek Road. Carindale has a total retail space of
114,930m2 and 5400 carparks. The majority of carparks provided at Carindale are incorporated within the
structure of the development, in a similar fashion to Chermside.
As well as providing for car access, the Carindale shopping centre has incorporated a bus interchange within
the eastern side of the shopping centre, which is served by approximately 16 bus routes. Facilities that are
available at the station include some limited park-and-ride, public phones, toilets and wheelchair access.
Land use around Carindale is characterised by low-density residential development, as well as some large
areas of open space. Pedestrian access to Chermside is relatively poor from the west and south because of the
presence of major roads.
Figure C9 An aerial view of Carindale shopping centre; the bus interchange is circled
C4 Indooroopilly Shopping Centre
Indooroopilly Shopping Centre is located in the western suburb of Indooroopilly, 7km west of Brisbane’s CBD.
The shopping centre enjoys good vehicle access from Moggill Road, the main thoroughfare of Indooroopilly.
The shopping centre provides 84,516m2 of retail floor area and 3900 carparking spaces, most of which are
incorporated within the development rather than being provided at grade.
Pedestrian access from surrounding areas is relatively good, at least in comparison to the shopping centres
that have been discussed previously, primarily because the local road network is relatively well connected.
Moreover, even the major roads around the Indooroopilly Shopping Centre appear to create only modest
barriers to pedestrian movement, in comparison to the effects of SH1 and Mt Wellington Highway in Auckland.

Integrated transport and land use: Sylvia Park as a case study
74
Indooroopilly Shopping Centre has easy access to both bus and rail services (as illustrated in figure C10). The
bus station is located on the western side of the centre on the corner of Musgrave Road and Station Road, and
has a range of facilities including, park-and-ride, public phones, toilets and wheelchair access. The bus station
caters for 21 bus routes, as it is a major interchange for the western suburbs. The Indooroopilly train station
is located five minutes’ walking distance from the shopping centre and bus interchange. This station sits on
the Ipswich line running to and from the CBD, with a service frequency of around 15–20 minutes at most
times of the day. Given the distance to the train station and the modest frequencies that it supports, the rail
mode share for visitors travelling to Indooroopilly is surprisingly high (mode shares are compared in more
detail in section 3.4).
Figure C10 Aerial view of Indooroopilly Shopping Centre showing the bus interchange and train station
In terms of surrounding land uses, Indooroopilly is somewhat distinct from the other three case studies we
have considered in that it is the only shopping centre that is located within easy walking distance of a town
centre. Aside from the town centre, surrounding land uses are again characterised by low-density residential
suburbs.
Bus interchange
Train station

Appendices
75
Appendix D Calculating economic costs
This appendix considers how our estimates of financial costs might be modified to provide an insight into
economic costs. We note that while this report has focused on financial costs, government authorities are
primarily interested in economic costs. We also note that the settings for shadow tolls and other financial
mechanisms identified in this report would ideally be formed by an understanding of the economic costs of a
development.
Transport activities tend to generate external economic costs that are not borne by users. The following are
the most significant economic costs:
• Congestion: adding vehicle traffic to congested roads increases delays for all other road users. Walking,
cycling and rail transport do not typically incur external costs of congestion, although buses may in
congested road conditions.
• Environmental effects, including emissions to air (such as pollution and noise), water and soil:
environmental externalities are mainly generated by motorised modes, such as private vehicles, buses and
trains.
We developed a basic economic cost model to consider the effects of these externalities on the average
transport costs developed in the previous section. The NZTA’s Economic evaluation manual (NZTA 2010)
suggests an average external cost of $0.72 per vehicle-kilometre (time, vehicle operating costs and
greenhouse gas emissions) incurred to other road users (once induced traffic effects are accounted for).
Similarly, vehicle traffic incurs an external environmental cost of $0.05 per vehicle-kilometre. Thus the
external costs of additional vehicle traffic equate to approximately $0.77 per vehicle-kilometre generated by
Sylvia Park. We then estimated the distance travelled by each car user to visit Sylvia Park.
This cost data was incorporated within the DCF model used to estimate the average financial costs. The initial
results suggest that the average economic costs of car trips to Sylvia Park were slightly more than twice the
average financial costs discussed in this report. This would suggest that the financial transport costs borne by
KIPT cover only about 29% of the actual economic costs of that travel.
This level of subsidy is comparable to the findings of other studies (see, for example, Ministry of Transport
(2005)), even though it has been estimated using a completely different methodology, which considers costs
from the perspective of an individual development rather than the wider transport network.
Further research is required to refine this method of quantifying the economic costs of travel demands.
However, the potential usefulness of these findings would appear to warrant such an effort.

Integrated transport and land use: Sylvia Park as a case study
76

Appendices
77
Appendix E Sensitivity testing of key assumptions
The analysis presented in this report rests on a number of key assumptions, as shown in table E1. We also
comment on potential issues with these assumptions before identifying an alternative assumption that can be
used in subsequent sensitivity testing.
Table E1 Summary of key assumptions suggested and sensitivity test
Topic Key assumption Sensitivity test
Growth rates Existing visitor numbers will
grow by around 1% per annum,
although the rate of growth
varies considerably across
different transport modes.
The growth assumptions are
fairly modest and robust.
However, it would be appropriate
to test an alternative of ‘no
growth’ where annual visitor
numbers do not change.
Car expenditure All car passengers spend as per
the results of our expenditure
surveys. This is likely to overstate
expenditure, because many
passengers are young children,
who are extremely likely to be
under-represented in our
expenditure interviews.
We estimate that at most 75% of
all passengers were children too
young to be recorded in our
expenditure interviews. For this
reason, we have adjusted
passenger expenditure down by
75%, which implicitly assumes
that young children have zero
expenditure.
Discount rate An annual discount rate of 15%
was applied to all costs and
revenues. This rate is relatively
high by public sector standards,
where discount rates tend to vary
between 5% and 10% depending
on the context.
Setting the discount rate to 7.5%
would provide an appropriate
sensitivity test. This is similar to
the rate used to evaluate public
investment in transport projects.
We tested the sensitivity of the RCR ratio to changes in these assumptions. Our benchmark was the original
RCR presented in figure 4.2, reported after 15 years, as summarised in table E2. Our results suggest that
while the changes in key parameters do affect the results, the relative ranking of each mode remains relatively
unaffected.
Table E2 Results of the sensitivity testing – effects on the RCR after 15 years
Mode Base Test 1 Test 2 Test 3 All tests
Car 1.42 1.36 1.15 2.12 1.88
Train 1.31 0.91 1.31 2.11 1.37
Walk/cycle 1.89 1.54 1.89 2.67 2.08
Bus 3.85 3.14 3.85 5.00 3.91

Integrated transport and land use: Sylvia Park as a case study
78

Appendices
79
Appendix F Issues with minimum parking requirements
Since the 1950s, most local authorities have used minimum parking requirements to specify the minimum
amount of off-street parking that is required as part of their development (Shoup 2005; Litman 2006).
Minimum parking requirements were initially applied in Los Angeles in the 1950s as a response to rapid
growth in vehicle ownership, which resulted in considerable congestion, especially in older urban areas that
had nothing but limited off-street parking. At busy times, drivers would be forced to circulate slowly through
local streets looking for carparks, creating additional congestion and delays for other road users. At the time,
minimum parking requirements seemed like the perfect solution, especially since the effectiveness of demand
management measures, such as priced parking, was inhibited by a lack of convenient electronic payment and
enforcement technologies. Public officials thought that requiring new developments to provide generous
amounts of off-street parking was a long-term solution to their congestion issues.
However, minimum parking requirements provided short-term relief at the expense of longer-term
efficiencies. Minimum parking requirements were an obvious way to shift the costs of parking provision from
the public to the private sector. To that end, they are highly effective. In doing so, however, they create a large
number of other inefficient outcomes:
• By requiring each individual site to provide for its individual parking demands, considerably more parking
is provided than would be needed in a situation where multiple developments are able to ‘pool’ their
parking resources, either through negotiated agreements or through normal market price signals.
• Minimum parking requirements are extremely land intensive. With population growth and increasing
urbanisation, land is becoming more and more valuable. Given its high value, many communities are now
seeking to use land as efficiently as possible to facilitate economic, social and environmental objectives.
• Minimums are calculated based on the assumption that off-street parking should be free and/or
unmanaged. This requires significantly more land to be set aside than what would be needed in a
situation where developments managed the demand for parking. Possible measures might include
validated parking, time limits or even charges for some visitors.
• Parking is never free; the costs are simply subsumed, indirectly and inefficiently, elsewhere. Requiring
vast areas of land to be reserved for parking directly reduces the land available for other uses, which, in
turn, reduces the affordability of property – and all goods and services that are sold from the affected
premises.
Also, minimum parking requirements have been designed to manage growth in outlying and suburban areas
where rates of vehicle use were far higher than in more established suburbs (Shoup 2005; Litman 2006). Most
regulations are, therefore, oriented to low-cost suburban surface parking solutions, as Litman (2006) explains:
They are derived from parking demand studies that were mostly performed in automobile-
dependent locations. They are generally based on 85th percentile demand curves (which means
that 85 out of 100 sites will have unoccupied parking spaces even during peak periods), an 85th
occupancy rate (a parking facility is considered full if 85% of spaces are occupied) and a 10th
design hour (parking facilities are sized to fill only ten hours per year). Applying these standards

Integrated transport and land use: Sylvia Park as a case study
80
results in far more private off-street parking supply than is needed at most destinations,
particularly where land use is mixed, there are good travel options, parking is managed for
efficiency or priced.
During the last 25 years, a large body of literature has developed around the issues with minimum parking
requirements (Cervero 1985; Shoup 1999; Hess 2001; Kuzmyak and Vaca 2005; Shoup 2005; Litman 2006;
Marsden 2006; Genter et al 2008; Seibert 2008; Donovan 2009). Interested readers are referred to these
focused texts for further details on the range of issues associated with minimum parking requirements.
Despite the comprehensive evidence of the negative effects of minimum parking requirements, only slow
progress has been made towards removing them in New Zealand (with the notable exception of central city
areas in Auckland and Wellington). This lack of progress usually reflects the hesitation of publicly elected
officials to acknowledge that the wholesale provision of free off-street parking is not desirable and that other
solutions exist. It also reflects the unwillingness of many in the transport engineering and planning
professions to acknowledge that a relatively standard practice, such as minimum parking requirements, could
be so fundamentally ‘wrong’. Notwithstanding their good intentions, we are in no doubt that the negative
consequences of minimum parking requirements far outweigh their small benefits.
Political and professional self-interest in preserving minimum parking requirements is typically cloaked behind
a number of objections. First, as minimum parking requirements were introduced as a means of shifting the
cost of providing parking from the public to the private sector, it is sometimes assumed that removing
minimums will result in the costs being shifted back to city councils. The fear is that developers will ‘build
out’ their sites and subsequently exploit public parking in the surrounding area – so-called ‘free riding.’ In
reality, the question of whether the costs of parking provision should shift to the public sector depends on
how the public sector responds to increased parking demands. Councils have a range of techniques to
manage the demand for public parking, such as prices and time. Preventing developers from free riding may
simply mean that councils need to charge for parking, which KIPT indicated was a key influence on whether
they would charge for their own parking. Once public parking is priced, fewer developers are less likely try to
free ride.
Second, some objectors to the elimination of minimum parking requirements question how peak parking
demands will be managed if the provision of on-site parking is reduced. They envisage long queues of
vehicles snaking around parking lots, causing frustration not only to drivers looking to park but also possibly
backing up onto the local road network. The most direct response to this is that such situations are clearly not
in the interests of the affected business, and that competitive pressures will demand that they seek to either
manage demands (by, for example, subsidising public transport) and/or increasing the supply of parking. if
public officials require further guarantees, we suggest that they make it a condition of resource consent that
developments manage situations of excessive parking demands, possibly through pre-specified measures.
The key point is that more efficient responses than using minimum parking requirements are available to
manage peak parking demands to make sure that enough parking is available. In short, it is time for
government authorities in New Zealand to recognise the folly of minimum parking requirements and remove
them from district plans.