Embed Size (px)
Citation preview

Performance of open graded porous asphalt in New Zealand
October 2011
NZ Transport Agency
research report 455


Performance of open graded porous asphalt in New Zealand
October 2011
E Fletcher and AJ Theron
MWH New Zealand Ltd, Hamilton
NZ Transport Agency research report 455

ISBN 978-0-478-38053-8 (print)
ISBN 978-0-478-38052-1 (electronic)
ISSN 1173-3756 (print)
ISSN 1173-3764 (electronic)
NZ Transport Agency
Private Bag 6995, Wellington 6141, New Zealand
Telephone 64 4 894 5400; facsimile 64 4 894 6100
www.nzta.govt.nz
Fletcher, E and AJ Theron (2011) Performance of open graded porous asphalt in New Zealand. NZ
Transport Agency research report 455. 66pp.
This publication is copyright © NZ Transport Agency 2011. Material in it may be reproduced for personal
or in-house use without formal permission or charge, provided suitable acknowledgement is made to this
publication and the NZ Transport Agency as the source. Requests and enquiries about the reproduction of
material in this publication for any other purpose should be made to the Research Programme Manager,
Programmes, Funding and Assessment, National Office, NZ Transport Agency, Private Bag 6995,
Wellington 6141.
Keywords: asphalt, bitumen binder, indirect tensile strength, modulus, open graded porous asphalt,
pavement, stiffness, texture

An important note for the reader
The NZ Transport Agency is a Crown entity established under the Land Transport Management Act 2003.
The objective of the Agency is to undertake its functions in a way that contributes to an affordable,
integrated, safe, responsive and sustainable land transport system. Each year, the NZ Transport Agency
funds innovative and relevant research that contributes to this objective.
The views expressed in research reports are the outcomes of the independent research, and should not be
regarded as being the opinion or responsibility of the NZ Transport Agency. The material contained in the
reports should not be construed in any way as policy adopted by the NZ Transport Agency or indeed any
agency of the NZ Government. The reports may, however, be used by NZ Government agencies as a
reference in the development of policy.
While research reports are believed to be correct at the time of their preparation, the NZ Transport Agency
and agents involved in their preparation and publication do not accept any liability for use of the research.
People using the research, whether directly or indirectly, should apply and rely on their own skill and
judgement. They should not rely on the contents of the research reports in isolation from other sources of
advice and information. If necessary, they should seek appropriate legal or other expert advice.

Acknowledgements
The authors acknowledge the support and guidance of the following organisations and people: the NZ
Transport Agency (NZTA, previously known as Transit NZ); Terry Boyle (NZTA); Dr Ross Peploe (Bartley
Consultants Ltd); MWH New Zealand Ltd; Theuns Henning (University of Auckland); and Peter Kadar (MWH
Australia Ltd)
Abbreviations and acronyms
Austroads Australian Road Research Board
dTIMS Deighton’s Total Infrastructure Management System
EU European Union
FWD falling weight deflectometer
ITS indirect tensile strength
ITT indirect tensile test
LTNZ Land Transport New Zealand
MPD mean profile depth
NAASRA National Association of Australian State Road Authorities
OGPA open graded porous asphalt
Pen binder penetration (bituminous binder @ 25ºC)
PI penetration index of bituminous binder
PSV polished stone value
RAMM Road Assessment and Maintenance Management
RIMS Road Information Management Systems
SAMI strain-alleviating membrane interlayer
SASW spectral analysis of surface waves
SMA stone mastic asphalt
SNP modified structural number
TNZ Transit New Zealand Ltd
TRL Transport Research Laboratory
TR&B ring-and-ball softening point in °C (bituminous binder)

5
Contents
Executive summary ........................................................................................................................................................................ 7
Abstract .............................................................................................................................................................................. 10
1 Introduction ....................................................................................................................................................................... 11
1.1 Background .........................................................................................................................11
1.2 Problem statement .............................................................................................................11
1.3 Study objective and methodology .....................................................................................12
2 Understanding open graded porous asphalt ................................................................................................ 13
2.1 Volumetric properties of OGPA mixes ..............................................................................13
2.2 Literature study ..................................................................................................................14
2.2.1 Netherlands experience ........................................................................................15
2.2.2 Danish experience ................................................................................................15
2.2.3 South African experience .....................................................................................15
2.2.4 South Australian experience ................................................................................16
2.2.5 Tasmania ...............................................................................................................17
2.2.6 US Federal Highway Administration .....................................................................17
2.2.7 New Zealand experience ......................................................................................20
3 Statistical analysis of the Auckland South State Highway Network ............................................... 23
3.1 Surface age .........................................................................................................................23
3.2 Structural strength and crack initiation ............................................................................24
3.3 Comparison of OGPA and dense graded mixes ................................................................26
4 Current New Zealand practice ................................................................................................................................ 27
4.1 Maintenance practice .........................................................................................................27
4.2 OGPA retexturing ...............................................................................................................28
4.2.1 Cleaning and retexturing trials ............................................................................29
4.2.2 Surface texture ......................................................................................................29
4.3 OGPA production ................................................................................................................32
4.4 Summary of OGPA specification and approval process ....................................................33
4.5 Improvement in riding quality ...........................................................................................34
4.6 Additional testing ...............................................................................................................34
4.6.1 Resilient modulus testing .....................................................................................34
4.6.2 Fatigue testing ......................................................................................................34
4.6.3 Wheeltrack rutting ................................................................................................35
4.6.4 Torque bond test ..................................................................................................35
4.7 Failure mechanisms observed in OGPA layers ..................................................................35
4.8 Mechanistic analysis of multiple OGPA layers ..................................................................37
5 Network maintenance management ................................................................................................................... 40
5.1 NZTA pavement management system...............................................................................40

6
5.2 Finalising the works programme ...................................................................................... 41
5.3 Proposed improvement to optimisation process ............................................................. 42
6 Methods of measuring OGPA stiffness ............................................................................................................ 44
6.1 Non-destructive methods .................................................................................................. 44
6.1.1 Falling weight deflectometer (FWD) method ....................................................... 44
6.1.2 Spectral analysis of surface waves (SASW) .......................................................... 44
6.2 Destructive methods ......................................................................................................... 45
6.2.1 Measurement of binder stiffness......................................................................... 45
6.2.2 Bending beam test ............................................................................................... 45
6.2.3 Measurement of modulus by means of indirect tensile measurement (ITS) ..... 45
6.2.4 Other performance tests ...................................................................................... 45
6.3 Discussion .......................................................................................................................... 46
7 Relating field performance to resilient modulus (stiffness) ............................................................... 47
7.1 Background ........................................................................................................................ 47
7.1.1 Investigation of multiple OGPA layers ................................................................. 47
7.1.2 Pilot study ............................................................................................................. 48
7.2 Failure of OGPA mixes due to binder stiffening .............................................................. 50
7.3 Predicting OGPA failure from binder stiffness ................................................................. 50
7.4 Application of method ....................................................................................................... 51
8 Conclusions ....................................................................................................................................................................... 54
9 Recommendations ......................................................................................................................................................... 55
10 References .......................................................................................................................................................................... 56
Appendix A SH16 investigation ................................................................................................................................... 58
Appendix B Clarification of terms .............................................................................................................................. 61
Appendix C Literature study on terminal stiffness of bitumen binder .............................................. 62

7
Executive summary
Research background and objectives
Open graded porous asphalt (OGPA) pavement surfacing is widely used on New Zealand motorways
because of the benefit it provides in terms of low noise pollution and its ability to drain water from the
road surface during rainstorms. The current maintenance strategy that is applied to these surfacings
involves the overlaying of the existing OGPA surface, or the milling off and replacement of the surfacing.
One of the factors affecting the service life of an OGPA surfacing layer is the hardening of the bituminous
binder in the mixture. The predominant failure mechanism in these layers occurs when the binder is no
longer able to sustain the level of strain induced by the repetitive wheel loads or thermal stress build-up
within the OGPA layer. Increasing levels of ravelling and texture depth are generally indicative of OGPA
failure. A measure of the binder stiffness within the surfacing mixture would provide valuable information
about the point at which the OGPA layer is likely to fail.
The objectives of this research, which was carried about between 2006 and 2007, were to:
• propose methods for disseminating and incorporating local as well as international knowledge of
OGPA performance into the current asset management systems
• determine the terminal condition of an OGPA mix
• determine the rate of stiffening of OGPA surfacings on the South Auckland State Highway Network.
The study included a literature review on maintenance practices in Europe, the UK, Australia and New
Zealand; a statistical analysis of the current data set of the Auckland South State Highway Network; and
laboratory testing of samples retrieved from selected sites on the network and production mixes used on
the 2006/07 maintenance contract.
Literature study
During 2004, the US Federal Highway Administration (FHWA) undertook a study tour of five European
Union (EU) member countries in order to study their practices regarding pavement systems. The study
concluded that these countries had moved away from using surfaces with predominantly noise-reduction
properties, in favour of more optimised mixes in terms of both functional and structural properties. EU-
funded projects were underway to classify noise-reduction surfaces with improved structural and
functional durability, with the objective of providing decision makers with a rational planning document.
In Southern Australia, OGPA was only being used on high-speed freeway-type roads, for its ability to
reduce splash and spray. However, stone mastic asphalt (SMA) mix was more popular because of its longer
life and acceptable functional properties.
New Zealand experience
In New Zealand, the maintenance approach has been to overlay the existing OGPA surface with a
membrane seal prior to the application of the subsequent overlay. This methodology has resulted in the
upper pavement structure comprising multiple (up to four) OGPA layers, which has been performing well.
The focus of this approach did not originally consider any increase in the structural capacity of the
pavement due to the increase in total pavement depth, but was on restoring the functional properties of
the surfacing layer.

Performance of open graded porous asphalt in New Zealand
8
The experience was that the stress ratio in the base course decreased with each consecutive OGPA overlay,
accompanied by a decreased rate of rut progression. In 1995, pavement rehabilitation was halted in favour
of multiple OGPA layering. This practice, based on observed good performance, prompted research to
understand the increase in apparent pavement strength. This practice, which appears to be unique to New
Zealand, carries the potential risk of various mechanisms of failure occurring over the lifetime of this
composite structure, and up until the time of this study, these had not been researched.
Success of the New Zealand approach
The success of the multiple-OGPA surfacings on the South Auckland State Highway Network could be
partly because a large proportion of the pavements on the network have relatively low deflection and
curvature values (70% of the network has a deflection value less than 600µm and curvature values of less
than 200µm). Also, the steps taken to minimise water ingress and to ensure that water cannot pond within
the OGPA layers would be beneficial.
Maintenance planning
Current maintenance planning utilises an optimisation process to produce an annual works programme
that is field-verified prior to implementation. The analysis is based on a life cycle cost approach and
consists of strategy generation, optimisation and programme development. This research proposes a
maintenance decision-making tree that considers the structural soundness of a pavement with cognisance
of site constraints and functional requirements. The use of this decision-making structure aims to
formalise the decision-making process and contribute towards the improvement of the network condition
in the long term, thus meeting the objectives of this research.
Statistical analysis of the South Auckland State Highway Network
The time till initial crack development in an OGPA surfacing layer was found to be 7.5 years (50% of the
data was distributed over 5 to 11 years). In addition, the analysis showed that the time to crack initiation
was not dependent on the structural strength of the pavement. Binder stiffening seemed to occur on all
pavements, irrespective of the structural strength of the pavement. In addition to the ageing of OGPA
layers, the data also indicated that the mean texture depth on the OGPA network increased over time. At
the time of writing, overseas development was underway to use changes in surface texture to predict
ravelling.
Stiffening of OGPA mixes due to binder ageing
One of the modes of failure reported on OGPA mixes is the stiffening of the binder. A study conducted by
Transport Road Research (TRL) in the UK proposes that the ultimate failure of an OGPA mix is likely to
occur rapidly after the binder penetration has fallen below 15Pen, or its stiffness has increased to a value
in excess of 100MPa. These ultimate values are reported for all binder types, regardless of whether they
are modified or not.
Measurement of OGPA stiffness
Bitumen stiffness can be measured by the penetration on recovered binder; however this measurement
involves a complicated process. This study attempted to measure the stiffness of OGPA mixes by means of
the repeated-load ‘indirect tensile strength’ (ITS) test. This was done on cores extracted from the road
network as well as on cores prepared from production mixes used during the 2006/07 maintenance
contract.
Executive summary
9
In an attempt to relate measured stiffness of the OGPA mixes to the ultimate binder stiffness, established
rheological models and the Shell nomograph were used. Stiffness values were derived from chipseal
failures in New Zealand, OGPA failures in the UK, and asphalt failures reported in the US. Stiffness values
measured on core samples extracted from the road were compared to the above terminal stiffness values.
A pilot study was conducted using the ITS test on laboratory-prepared OGPA specimens. These specimens
were prepared from a plant-produced mix and the measured stiffness values were compared against the
terminal OGPA stiffness values.
Relating field performance to resilient modulus
The proposed method for determining OGPA failure was used to evaluate the stiffness of OGPA mixes
from cores extracted from the existing pavement on the Auckland South State Highway Network. The
visual condition of the sites varied from good to poor. The ITS results showed some correlation between
the visual pavement condition and OGPA stiffness.
The method can be used to track the stiffening of an asphalt layer over time by extracting core samples
from the layer at various age intervals and predicting the time at which the layer will reach a terminal
stiffness. Research in the UK suggests a decrease in binder penetration of approximately 20% per year.
Stiffness values measured on core samples extracted form the Auckland South Network indicated an
increase in OGPA stiffness of 16% per year. This approach can be used to enhance decision-making in a
network pavement management system.
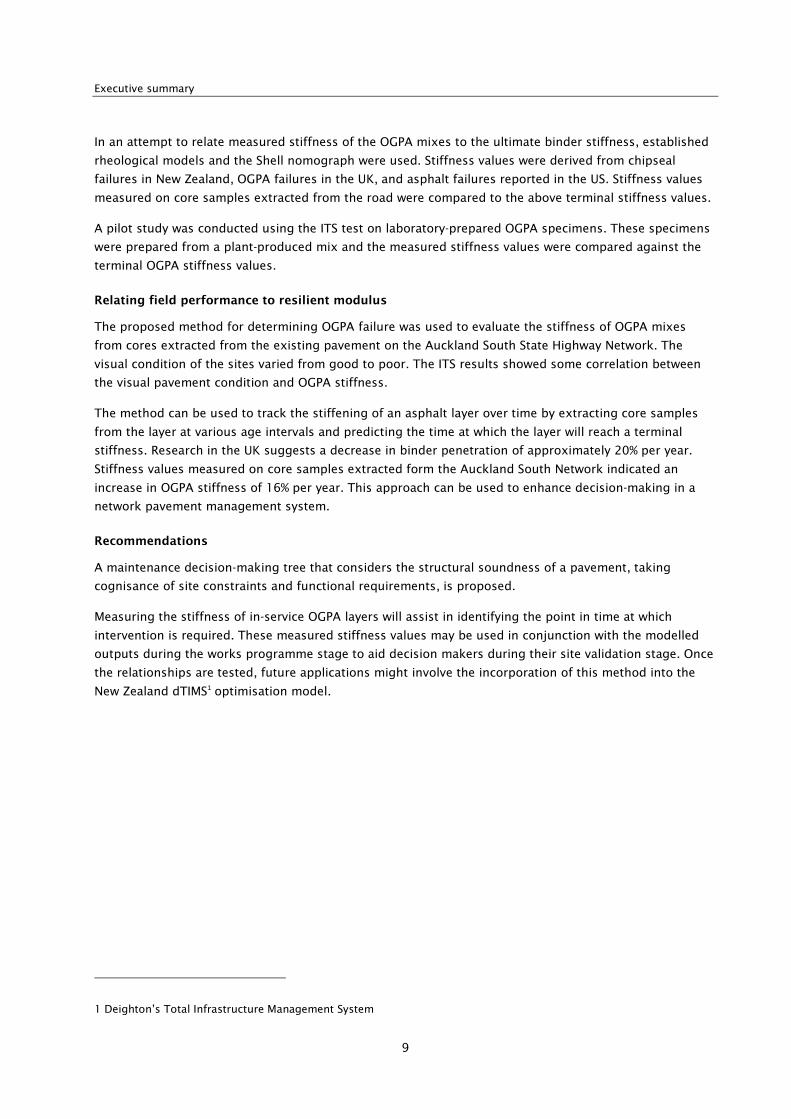
Recommendations
A maintenance decision-making tree that considers the structural soundness of a pavement, taking
cognisance of site constraints and functional requirements, is proposed.
Measuring the stiffness of in-service OGPA layers will assist in identifying the point in time at which
intervention is required. These measured stiffness values may be used in conjunction with the modelled
outputs during the works programme stage to aid decision makers during their site validation stage. Once
the relationships are tested, future applications might involve the incorporation of this method into the
New Zealand dTIMS1 optimisation model.
1 Deighton’s Total Infrastructure Management System

Performance of open graded porous asphalt in New Zealand
10
Abstract
The objective of this research, which was carried out between 2006 and 2007, was to propose methods to
disseminate and incorporate local as well as international knowledge of OGPA performance into the
current New Zealand asset management systems.
Compared with asphalt overlay practices in Europe and the UK, the current New Zealand maintenance
practice of multiple OGPA overlays is not considered to be optimal from a structural point of view. This
study undertook a literature and database review, and determined the terminal stiffness of OGPA mixes.
An analysis of the South Auckland State Highway dataset showed that the life of multiple OGPA overlays
shortens with successive overlays. Statistical evidence suggested that binder ageing was the limiting factor
in this phenomenon, and a correlation was found between pavement surface condition and mix stiffness.
Repeated-load indirect tensile strength (ITS) tests were undertaken on cores retrieved from network
pavements and on production mixes from the 2006/07 resurfacing contract. Terminal OGPA mix stiffness
was found to be in the order of 2300MPa at 25°C, with corresponding binder penetration of 11Pen as
determined from back-calculation through the use of the Shell nomograph.
This research recommends a gradual move away from the current multiple-overlay approach, and the
utilisation of OGPA for its functional rather than structural integrity.

1 Introduction
11
1 Introduction
1.1 Background
The aim of this research was to develop methods to assist with maintenance planning for pavements
surfaced with open graded porous asphalt (OGPA), based on the analysis of data contained in the Road
Asset Maintenance Management (RAMM) data base of the South Auckland State Highway Network. In order
to try to relate OGPA layer stiffness to field performance, the research reviewed the findings and test sites
of a previous study of the performance of multiple OGPA layers that was undertaken for the NZ Transport
Agency (NZTA, previously known as Transit NZ) during 2005/06. This new study also contains a brief
discussion on overseas experiences of using OGPA mixes.
A supplementary study on the stiffness of plant-produced OGPA used during the 2006/07 maintenance
works on the Auckland South Motorway Network was also undertaken. The research puts forward a
method of predicting OGPA stiffness from its volumetric properties, and comparing it to a terminal
stiffness for OGPA mixes, by using the Shell (Shell 1978) and Van der Poel (Van der Poel 1954)
nomographs and other models.
Stiffness moduli of several OGPA core samples were measured by means of the indirect tensile strength
(ITS) method at various temperatures. These stiffness values are presented in a diagram that compares
ITS-measured stiffness values with stiffness values predicted by the above-mentioned nomographs. A
terminal stiffness limit is also indicated on the same diagram and is based on previously published failure
stiffness values for bitumen binders. This approach enables a designer to predict the road temperature at
which an OGPA mix will fail, depending on the stiffness and volumetric properties of the mix.
Although the proposed method has not been tested to its full extent, it is based on sound bitumen
rheological principles and will assist the designer in understanding asphalt behaviour.
Various other failure modes exist within an OGPA layer – for example, contamination (which causes
blockage of the voids), chemical spillage and mechanical damage. This report focuses on binder ageing
and layer stiffening as primary causes of failure of OGPA layers.
1.2 Problem statement
With much of the New Zealand road network now well developed, the emphasis has shifted from the
construction of new roads to the maintenance and improvement of existing road networks. Effective
maintenance strategies for road pavements require a sound understanding of the behaviour and
performance under loading of the materials within the pavement structure and surfacing. Regardless of
the maintenance strategy used, it should be based on sound principles that are related to the performance
of the pavement structures and surfacings on the road network.
The useful life of a pavement under increasing traffic loadings is dependent on the performance of each
component within the pavement structure and the interaction of these components with each other. For
instance, the life of an asphalt surfacing layer is affected not only by the climatic conditions/environment
under which it operates, but also by the level of structural support provided to it by the underlying
pavement.

Performance of open graded porous asphalt in New Zealand
12
The life of an OGPA surfacing layer is dependent on the hardening of the bituminous binder within the
mixture. Failure of the layer occurs when the binder is no longer able to sustain the level of strain induced
by the repetitive wheel loads on it. Increasing levels of ravelling, fretting and texture depth are generally
indicative of OGPA failure, as the stiffness of the mix increases with age as a result of the hardening of the
binder. The ageing period of in-service OGPA layers varies significantly – data from the South Auckland
State Highway Network indicates an average life of eight years, although some mixes may last longer – up
to 14 years.
The prediction of remaining life of OGPA layers would greatly enhance the optimisation process in
formulating network maintenance strategies for these surfacing layers.
1.3 Study objective and methodology
The main objective of this study was to relate the in-field stiffness of an OGPA layer to its performance on
the road, in order to optimise the way that current maintenance strategies for OGPA layers are formalised
and managed. The research focused on defining the useful life of asphalt surfacing layers (particularly
OGPA), and predicting the remaining life of these layers.
The specific objectives were to:
• propose methods for disseminating and incorporating local as well as international knowledge of
OGPA performance into the current asset management systems
• determine the terminal condition of an OGPA mix
• determine the rate of stiffening of OGPA surfacings on the South Auckland State Highway Network.
The methodology involved the evaluation of previously published failure stiffness values of bitumen
binders and their relation to a terminal stiffness value for OGPA layers, using the Shell nomographs and
other published binder stiffness prediction models.
The stiffness of the plant-produced OGPA mix that was used in the 2006/07 maintenance works on the
Auckland South State Highway Network was also evaluated.

2 Understanding open graded porous asphalt
13
2 Understanding open graded porous asphalt
2.1 Volumetric properties of OGPA mixes
Porous asphalt is an open graded mixture of coarse and fine aggregates, mineral filler and bituminous-
based binder, produced hot in a mixing plant. From a road user’s point of view, the main advantage of
OGPA surfacing lies in its excellent functional properties, including the reduction of noise, wet-weather
spray and glare, and skid resistance. In some countries, OGPA is valued purely for its functional properties
rather than its structural properties.
The quality of these functional properties can be ascribed to the large void ratio in the mix. The other
variables that can be selected to change the functional properties of the mix are the stone size used in the
mix, and the layer thickness. The optimal OGPA layer thickness for tyre-noise reduction is in the order of
40mm; beyond this thickness, there is very little improvement in noise reduction. OGPA surfacing layers
do not reduce engine noise.
A twin-layer OGPA system has been developed in the Netherlands and Denmark. It aims to improve surface
drainage and reduce wet-weather spray, and consists of a bottom layer that uses stones of a large size,
and a top layer constructed with smaller stone. These mixes have the best of both worlds as far as
drainage and noise reduction are concerned.
Skid resistance on an OGPA surface is also an important property, and goes hand-in-hand with drainage of
the layer. Because of the high void ratio of the mixes, aquaplaning is very unlikely to occur on OGPA
surfaces – the voids in the mix are interconnected and hydraulic pressures cannot develop between the
vehicle tyre and the OGPA surface.
The volumetric properties of a typical OGPA mix, compared to those of a typical continuously graded
asphalt mix, are summarised in table 2.1.
Table 2.1 Volumetric properties of typical OGPA and AC mixes
Volumetric properties OGPA Continuously graded AC
Void ratio 20–23% 4–6%
Binder content (m/m) ±5.5% ±5.5%
Voids in mineral aggregate 30–33% 14–17%
Voids filled with binder 30–35% 70–75%
Binder film thickness 10µm 7µm
While the most outstanding property of an OGPA mix is its void ratio, the percentage of voids filled with
binder is critical, as this property is an indication of the bond between the aggregate particles. This bond
can be described as chip glued together with bituminous cement (binder).
The grading of an OGPA mix is more ‘open’ than that of a dense, continuously graded mix, as illustrated
in figure 2.1 following. Because of its open nature, binder in OGPA is more prone to oxidation or ageing
than binder in a continuously graded asphalt mix. Another disadvantage of OGPA as a surfacing layer is
the reduction in its functional aspects over time as the surface voids become choked with debris or road
dust.

Performance of open graded porous asphalt in New Zealand
14
Figure 2.1 Particle size distributions of OGPA and dense graded asphalt
In order to understand the volumetric properties of an OGPA mix, the mechanism through which the
grading influences the mix properties needs to be understood.
With reference to the particle size distribution of a standard OGPA mix, approximately 85% of the material
is retained on a 2.0mm sieve. The voids in the mix are thus created by a stone skeleton, while the sand,
filler and bitumen fractions fill the voids to the desired level. For an OGPA mix, the fraction of aggregate
passing a 2.0mm sieve is approximately 15% less than for a continuously graded asphalt mix. This
structure accounts for the slightly greater film thickness of the OGPA mix when compared with other
mixes with similar binder contents.
The ability of an OGPA mix to retain binder during the mixing and placing process is therefore less than
for other asphalt mixes, which increases the importance of having sufficient volume of binder in the mix
to ensure durability for in-service conditions. On the other hand, the binder should not be allowed to drain
down as a result of low binder-holding ability of the sand and filler fractions in the mix. The drain-down
test is included in the design process of an OGPA mix, with the aim of optimising the volume of bitumen
being added to a mix.
The general design method for OGPA layers optimises binder content within the specified limits for drain-
down and the Cantabro durability limits.
2.2 Literature study
None of the international experience documents multiple OGPA layering; thus, the New Zealand approach
is unique. The information that follows relates to single OGPA layers.
0
10
20
30
40
50
60
70
80
90
100
0.01 0.1 1 10 100Sieve Size (mm)
% P
assi
ng
AC Mix 15
OGPA 14

2 Understanding open graded porous asphalt
15
2.2.1 Netherlands experience
The Netherlands’ literature described OGPA as a highly open graded asphaltic concrete (ZOAB)
(Rijkwaterstaat 2006). It was further described as small-sized stones glued together with a bituminous
binder, and it was only used for its functional properties. In a country like the Netherlands – where all road
aggregate is imported from other countries – ZOAB had found a place in the market only because of its
functional properties, and no structural value was attributed to the material.
At the end of its life, ZOAB was being recycled for use in other asphalt mixes. Modified binders were not
permitted in these mixes because of problems associated with the reheating of recycled mixes that
contained modified binders. Special attention was paid to the detailing of the drainage of ZOAB layers;
provision was made for special edge drains to ensure effective drainage of the layered system.
At the time of this research, development work in the Netherlands was focusing on laser-enhanced
technology in order to detect ravelling in an OGPA surface – the early detection of ravelling would assist in
the maintenance management of its network.
2.2.2 Danish experience
At the time of this research, the Danish Road Institute (DRI) was participating in the European Union-
funded (EU) research project SILVIA, with the aim of developing noise-reducing pavements (Danish Road
Institute 2006). The purpose of their study was to provide decision makers with a tool that would allow
them to plan traffic noise-control measures rationally, improve the functional and structural durability of
low-noise surfacing mixes, and develop maintenance techniques and a full life cycle cost–benefit analysis
procedure for this type of pavement. The final product was published in 2006 as European guidance
manual on the utilisation of low-noise road surfacings.
2.2.3 South African experience2
The first open graded porous surfacing, ‘whisper asphalt’, was introduced into South Africa during 1993
under the authority of the Gautrans Department of Public Works (previously called Transvaal Roads
Department). This project entailed the construction of a total of approximately 1,000,000m2 of OGPA
surfacing on a carriageway carrying 25,000 vehicles per lane per day.
During the design phase it had been decided to use a highly modified binder because of its good track
record in asphalt mixes, and a bitumen rubber binder was selected. The objective of the design was to
optimise the mix’s binder content versus air voids, abrasion loss and binder drain-down. This design
produced mixes with typical void ratios of 20–23%, with 5.8% binder content.
The functional properties of the mix had to be maintained by monthly cleaning of the surface by water
jetting and vacuuming, in order to prevent the surface from silting up in the dry, dusty environment.
Under high-rainfall conditions, OGPA layers were expected to be self-cleaning because of the suction
forces of fast-moving wheel tyres over the surface.
The surfacing performed well for six to seven years before the first surface ravelling became visible. The
ravelling developed in the slow lane – the lane with the highest traffic loading. As soon as signs of
2 Project experience of Enrico Fletcher, one of the authors of this research paper.

Performance of open graded porous asphalt in New Zealand
16
ravelling emerged on the surface, cores were taken for laboratory testing. Binder extracted from these
cores showed considerable stiffening, and the surface ravelling was ascribed to binder ageing in the mix.
Because of budget constraints, the OGPA surface was not milled off and replaced, but after experiments
with various emulsion blends, was resurfaced with a specialised bituminous mixture. This surface
treatment penetrated the existing open grade porous layer and rendered it a pseudo stone mastic asphalt
(SMA).
The life of the surfacing layer was extended through this treatment, and at the time of writing, the
surfacing was still performing well, 14 years after its introduction. However, the level of water spray and
noise reduction was similar to that of an SMA surfacing. Skid resistance was measured immediately
following the treatment, and again after six months. The average grip number after treatment was 0.44,
but after the film coating on the exposed chip had worn off after six months of service, the grip number
improved to 0.48.
2.2.4 South Australian experience
The following is an extract from correspondence with Hugo van Loon, the senior asphalt engineer of South
Australia, with regards to the use of open graded asphalt in that country.
In the past in South Australia a lot of OG was placed on important roads to reduce splash and
spray etc. These surfacings had a life of approx. 10 years and when a polymer-modified
binder was used, the life extended to say 15 years, although some have been down 20 years
and still performing.
However today, OG14 is only used for high-speed freeway type roads, principally for its
splash- and spray-reduction characteristics. All our OGs have a SAMI3 seal under them acting
as a water barrier for the water to flow along and out at the ends. The SAMI needs to be level
with the gutter and thus our OGs are above the kerbline, which creates a ridge which the
cyclists don’t like. For this reason and the relatively short life, it is more popular for SMA
(stone mastic asphalt) to be placed instead of OG, as this also has a high negative texture but
an expected 30-year life. Some noise reducing is attributed to SMA, but OG still provides the
best noise reduction.
The gradings are as required in AS2150, and our main mix is OG14, but some OG10 has
been used as a thin surfacing. Our design is to APRG18, and our spec. requires Type II, to
‘medium-duty design’ (ie 80 gyratory cycles – Gyropac). The design in APRG18 is based on the
‘particle loss test’ to provide a minimum binder content, voids at 20% providing the
maximum binder content, and the mean adjusted up by the ‘binder drain-down test’ to give
the nominated design binder content. Our ‘production air voids’ tolerance is 18 to 23%, and
voids are measured by mensuration. The in-situ air voids are to be between 18 and 25%.
We do not allow OG to be placed over winter (April to Oct), as during these colder months the
PMB binder on top of the stone takes too long to wear off and very slippery conditions occur.
The same applies to SMA; however we can grit SMA to wear the bitumen off the stone for
good initial skid resistance. We cannot grit OG as it would then fill up the 20% approx. air
voids. Our dominant PMB is 35P for dense mix, and I think it has been used successfully for
3 Strain-alleviating membrane interlayer

2 Understanding open graded porous asphalt
17
OG as well. Recently we had a situation where the placement temperature was too high
(about 165°C) and binder drain-down occurred, and cooling somewhat did not change the
problem, so the binder was changed to 15E, and this worked well.
I am not sure of standard thickness, but I think 35–40mm is used for OG14, and 25mm for
OG10.
One of my main issues with OG and SMA is the polishing of the aggregates. Our current
requirement for PAFV (vertical wheel) is 48, but I want to raise this to 55 for OG and SMA
mixes. We are currently in the process of trialling high-pressure water blasting, rotating steel
discs and captive shot-blasting to reinstate the microtexture of the aggregate to improve
marginal skid resistance. The only one trialled to date is water blasting, and this only had a
three-month benefit.
As for maintenance, we have in the past on a double carriageway repaired large patches with
dense mix on the kerbside lane, and then the median lane does weep through the OG onto the
dense mix (and possibly down into the pavement at the joint) even though the old OG is
‘completely blocked’. We always remove both the OG and SAMI before reinstating, and this is
another reason for it falling out of favour (Van Loon, pers comm, 2007).
2.2.5 Tasmania
The following is an extract from correspondence from Barry Walker, the manager of asset management at
the Department of Infrastructure, Energy and Resources of Tasmania.
Open graded asphalt (OGA) mixes have had only the occasional application in Tasmania,
mainly to counter traffic noise and problems associated with excess surface water. We tend to
follow National Asphalt Specifications for this product.
Our mix requirements are generally: aggregate size 10mm, depth laid, nominal 40mm.
Normal maintenance practice is to repair failed areas using ‘dense graded asphalt’, and
whilst this is possibly not the best option, it is the most practical given the difficulties in
sourcing small quantities of OGA mix from suppliers.
Cleaning of OGA surfaces is recommended; however this has not been undertaken on any
sites, with no obvious detrimental effect on the surfacing performance.
Prior to resurfacing over existing OGA, removal of the OGA is recommended (Walker, pers
comm, 2007).
2.2.6 US Federal Highway Administration
During 2004, the US Federal Highway Administration (FHWA 2006) undertook a tour of five EU member
countries, with the aim of studying current practices in the design, construction, maintenance and
monitoring of quiet-pavement systems. Details of this investigation were published on the FHWA website
www.international.fhwa.dot.gov.
The visiting team focused on the following areas relating to the above:
• policy

Performance of open graded porous asphalt in New Zealand
18
• design
• noise analysis
• construction
• maintenance
• research.
The panel started each visit with a general discussion of current noise policy and applicable noise-
measuring and noise-monitoring systems. The following sections summarise the team’s findings.
2.2.6.1 Belgium
Road authorities in Belgium favoured ultra-thin and SMA surfaces because of the high traffic loading on
their road networks. These surface types were optimised for noise reduction and were preferred above
open graded asphalt mixes. The authorities were confident that these mixes provided a better
combination of durability and noise reduction than open graded asphalt mixes.
2.2.6.2 Denmark
The use of low-noise surfaces on road networks in Denmark was limited. Single and twin-layer porous
asphalt mixes were also in use. However thin open graded mixes – which were more durable – were
favoured above open graded asphalt.
Pilot studies were carried out and extensive ongoing monitoring was underway to formulate the
effectiveness of quiet-pavement systems.
2.2.6.3 France
France had a quiet-pavement policy in place. However, the implementation of quiet-pavement systems was
not likely for cities like Paris, which have historic cobblestone roads. Structural and functional
characteristics of porous asphalt were separated and no structural value was assigned to a porous asphalt
layer in a pavement system. Finer graded mixes (6mm and 10mm) were preferred over the 14mm mixes
because of their better skid- and noise-reduction properties.
New pavements were generally constructed with a structural asphalt base layer, and an ultra-thin
functional layer as a wearing surface.
2.2.6.4 The Netherlands
During the late 1970s, initial research was undertaken on porous asphalt to reduce ‘splash and spray’ on
road surfaces. Noise legislation required the placement of porous asphalt on all roads carrying in excess
of 25,000 vehicles per day. At the time of the research, up to 60% of the strategic road network in the
Netherlands was surfaced with porous asphalt.
A classification system, which favoured porous asphalt on national highways and ultra-thin layers on inner
city roads, was used. This system was based on the extent of vehicle braking, acceleration and turning
movements on a particular road section.

2 Understanding open graded porous asphalt
19
2.2.6.5 Italy
Italy had advanced legislation in terms of the reduction of road noise. The first use of porous asphalt was
intended to increase skid resistance and reduce wet-weather spray. When it was observed that these
pavements also resulted in reduced pavement noise, an effort was mounted to optimise the noise-
reduction effect without loss of safety or surface durability.
2.2.6.6 United Kingdom
In the past, the focus in the UK has been on providing excellent skid-resistant road surfaces. Recently,
efforts have been made to find a balance between safety and noise reduction. At the time of the research,
the overall goal was to resurface 60% of the strategic road network in the UK with quieter overlays within
10 years. Thin-layer quiet-surfacing types had overtaken the use of older, open graded asphalt technology,
because of its higher cost effectiveness. These surfacing types were even being used to overlay concrete
pavements.
More than 32 approved proprietary surfacing systems that met safety and noise requirements were
available on the UK market. In general, these systems were similar to SMA, but were proprietary
formulations using modified binders and closely controlled aggregate mixes. These mixes had reported
lives of 12 years, compared with the eight years of the open graded mixes.
Porous asphalt mixes were assigned 50% structural credit at the standard thickness of 50mm. The
proprietary surfacing systems at 20–35mm were considered to have the same structural capacity as the
50mm OGPA.
The noise-control policy in the UK was scheduled for a review in 2008, and would include the findings of
the EU-funded research projects. These projects are summarised in table 2.2 below.
Table 2.2 Current EU projects
Project Objectives Principal research authority
SILVIA • Classification and conformity of noise-
reducing surfaces
• Improving structural and functional durability
• Life cycle cost–benefit
Belgium Road Research Centre
SIRUUS • Low-noise multi-layer system
• Optimising texture, roughness, hydraulic
conductivity and sound absorption for
different structural functions
Autostrade Italy
2.2.6.7 Summary
In general, ultra-thin functional mixes were gaining popularity over porous mixes. The noise-reduction
capability of ultra-thin mixes was not as significant as in open graded mixes, but concern about the
durability and the high cost of maintenance of the open graded mixes were some of the main reasons why
these mixes were losing favour with road authorities.
The wet-weather performance of open porous asphalt surfacings was the main reason for the selection of
these types of mix. Twin-layer mixes – with a coarser mix at the bottom and a finer mix on the surface –
appeared to be the most effective in terms of noise reduction and water-spray abatement.

Performance of open graded porous asphalt in New Zealand
20
The selection of these mixes in terms of life cycle or cost–benefit ratios was thus quite complex, and
striking a balance between functionality and durability criteria was even more complex.
2.2.7 New Zealand experience
The NZ Transport Agency is the Crown entity responsible for state highways in New Zealand. The national
road network includes approximately 5.5 million square metres of OGPA surfacing.
The first OGPA surfacing layers were introduced into New Zealand during the early 1970s, and have since
been used successfully. At the time of writing, the oldest section of OGPA still in service on the Auckland
South State Highway Network was 11 years old.
Until now, the preferred maintenance approach on these layers has been to overlay the existing OGPA
surfacing without removing the underlying layers, undertaking relatively little pavement rehabilitation in
the process, even on pavements where the maintenance measures included structural asphalt overlays.
The maintenance of OGPA-surfaced pavements has mainly involved sealing the existing OGPA surface with
a waterproofing membrane, followed by a 25–35mm OGPA overlay. The membrane seal consists of a
single-coat grade 5 chipseal (6mm nominal size aggregate) on 1.0L/m2 bitumen.
This methodology has resulted in pavement structures that consist of multiple OGPA layers. Despite a
substantial increase in traffic volume, these structures have performed well and there are suggestions that
this multiple-layered approach contributes to the structural capacity of the pavement.
This multiple-layered approach is unique to New Zealand – in other countries, OGPA surfacing layers are
milled off and replaced.
The New Zealand approach takes cognisance of the condition of the surface that needs to be overlaid, and
the consecutive overlay is mainly done to restore functional aspects as well as rutting and riding quality.
Structural improvement on sites treated in this manner has been proven by falling weight deflectometer
(FWD) testing. This practice has been extended from granular flexible structures to deep-lift asphalt
structures and cement-stabilised pavement structures.
The following is a typical chronology of the multiple-OGPA approach:
• Chipseal grade 3/5 (also known as a 13mm/6.7mm double seal) is usually placed as a first surfacing.
• After the first year, a levelling or rut-filling layer is placed if required (TNZ M/10 Mix 10, also known as
nominal 6mm continuous graded asphalt).
• The first OGPA layer is placed on a grade 5 membrane seal. Typically, after 5–7 years the OGPA will
have clogged and signs of loss of functionality will be in evidence.
• A second OGPA layer will be placed on a levelling course if required, along with another grade 5
membrane seal.
• This process is repeated until practical constraints, such as bridge clearance and safety limits on New
Jersey Safety Barriers, are reached.
• To prevent water ingress, the lower OGPA layer is sealed off with a dense graded asphalt mix on each
side. Also, any area that could pond water is pre-levelled prior to the application of the membrane seal
– unless there is the slightest possibility of sealing in moisture, in which case this practice should not
be used.

2 Understanding open graded porous asphalt
21
While this unorthodox practice is estimated to have resulted in considerable whole-of-life savings for the
network, there is the possibility that multiple OGPA layering may lead to pavement failure in the future.
Figure 2.2 shows a core extracted from a multiple-OGPA structure that has a seal and asphalt levelling
layer between consecutive OGPA layers (a two-layered system).
FIgure 2.2 Two-layered system
Figure 2.3 shows a core extracted from a multiple-OGPA structure with seal and asphalt levelling layer
between consecutive OGPA layers (three-layered system).
Figure 2.3 Three-layered system
OGPA layers in New Zealand are currently designed in accordance with TNZ P/11 or P/23 specifications.
The TNZ P11: 2003 specification (TNZ 2003) optimises binder content versus air voids, abrasion loss and

Performance of open graded porous asphalt in New Zealand
22
binder drain-down, while the TNZ P23: 2005 specification (TNZ 2005) lays down design values for layer
thickness, binder type, aggregate polished stone value (PSV), texture depth, mix designation and other
properties. Performance requirements for texture depth, surface shape and ravelling are also included in
this specification.
The current OGPA draft specifications allow the use of OGPA on new projects, with the requirement that
OGPA is placed on a grade 3/5 seal and has a six-month running-in phase. A second coat of grade 5 seal
is required prior to the construction of the OGPA layer. The aim of this approach is to achieve a watertight
membrane seal below the OGPA that has a residual binder content of more than 3L/m2.
This procedure has become standard practice on the South Auckland State Highway Network, and no
significant failures have been attributed to following this methodology, except for areas where the
shoulder was over-filled with dense graded asphalt (for safety reasons) and free drainage was impaired by
the edge constraint.
Over the years, as many as six OGPA overlays have been placed on some sections of the South Auckland
State Highway Network. Statistical evidence suggests that the time until initial crack development of the
top surfacing layer reduces with each consecutive overlay, as illustrated in figure 2.4.
Figure 2.4 Crack initiation with age (OGPA layers)
1 2 3 4 5 6
05
1015
20
No of Surface Layers
Age
to c
rack
initi
atio
n (y
ears
)

3 Statistical analysis of the Auckland South State Highway Network
23
3 Statistical analysis of the Auckland South State Highway Network
The South Auckland State Highway Network consists of approximately 3.34 million square metres of OGPA
surfaced pavements. A statistical analysis of these pavements has been undertaken, in an effort to provide
greater insight into the behaviour of OGPA surfacings at network level. This analysis is based on data from
the 2006 RAMM database of this network, and excludes road sections on ramps and roundabouts.
3.1 Surface age
The age distribution of the South Auckland State Highway Network OGPA surfacings is illustrated in figure
3.1. In 2006, approximately 42% of the network’s OGPA surfacings were more than 8 years old and
approximately 20% were aged 4–8 years. The remaining 38% were less than 4 years old.
Figure 3.1 Surfacing age
The average life of an OGPA surfacing layer is generally expected to be around 8 years, so this information
indicates that a large percentage (42%) of the network surfacing will probably require increased
maintenance in the short term. The portion that is aged 4–8 years will require a higher level of monitoring
than the remaining 38% that is less than 4 years old.
However, age may not be the only factor that determines the service life of an OGPA layer. Other factors
(eg binder ageing) can also influence the service life of OGPA surfacing, and are investigated in this report.
Age (Years)
Fra
ctio
n of
Net
wor
k Le
ngth
0 5 10 15
0.00
0.02
0.04
0.06
0.08
0.10
0.12

Performance of open graded porous asphalt in New Zealand
24
3.2 Structural strength and crack initiation
The structural strength of a pavement on the road networks is obtained from its relationship with
pavement deflection. The adjusted structural number (SNP) derived from this relationship is used to define
the structural capacity of pavement sections on a network level.
The distribution of the structural strength across the South Auckland State Highway Network is illustrated
in figure 3.2.
Figure 3.2 Network structural strength
Considering the relationship of time to crack initiation versus SNP, as shown in figure 3.3, the time to
crack initiation is not influenced by the structural strength of the pavement as measured by the SNP.
SNP (N=4447)
Fra
ctio
n of
Net
wor
k Le
ngth
1 2 3 4 5 6 7 8
0.0
0.1
0.2
0.3
0.4
0.5

3 Statistical analysis of the Auckland South State Highway Network
25
Figure 3.3 Time to crack initiation versus SNP
A distribution of the time to crack initiation of OGPA layers on the network is illustrated in figure 3.4. The
median value for time to crack initiation on the first OGPA overlays is 7.5 years, while the time to crack
initiation for 50% of the layers lies between 5 and 11 years. The skew distribution in this chart might be as
a result of the range in structural integrity of the pavements and improved performance of some of the
bitumen binders used in these overlays.
Figure 3.4 Time to crack initiation distribution
0 2 4 6 8
05
1015
SNP (N=5457)
Tim
e to
cra
ck in
itiat
ion
(yea
rs)
05
10
152
0
First Generation seal (OGPA) (N=168)
Tim
e to
cra
ck in
itiat
ion
(yea
rs)

Performance of open graded porous asphalt in New Zealand
26
The poor relationship between OGPA performance, pavement strength and surface age might be
confirmation that this layer should be regarded as a non-structural layer. It would appear that factors
other than surface age and pavement strength affect the performance of OGPA surface layers.
3.3 Comparison of OGPA and dense graded mixes
Valuable information regarding crack initiation of OGPA and dense graded asphaltic concrete (DGAC)
mixes was extracted from the network RAMM database, and is presented in figure 3.5.
Figure 3.5 Comparison of time to crack initiation for OGPA and DGAC
The first dataset in both graphs represents the distribution of the data for the first overlay, and the second
set represents the data from the second overlay. The median values of time to crack initiation for the first
set are 7.5 and 7 years for OGPA and DGAC layers respectively, and 6 and 4 years respectively for the
second set.
The life of the first overlay might be ascribed to the binder ageing process, while the decrease in time to
crack initiation on the second overlay might be as a result of reflective cracking from the underlying
surfacing layer, due to stress concentration at the crack.
The difference in time to crack initiation between the OGPA and DGAC layers might be due to the fact that
it is more difficult to detect cracks on an OGPA layer because of its coarse surface texture. Another reason
for the slower rate of crack development might be the flexible nature of an OGPA mix, which could inhibit
crack initiation.
First Second
05
1015
2025
30
Generation seal (OGPA)
Tim
e to
cra
ck in
itiat
ion
(yea
rs)
First Second
05
1015
2025
30
Generation seal (AC)
Tim
e to
cra
ck in
itiat
ion
(yea
rs)
First Second
05
1015
2025
30
Generation seal (OGPA)
Tim
e to
cra
ck in
itiat
ion
(yea
rs)
First Second
05
1015
2025
30
Generation seal (AC)
Tim
e to
cra
ck in
itiat
ion
(yea
rs)

4 Current New Zealand practice
27
4 Current New Zealand practice
4.1 Maintenance practice
Since its introduction in New Zealand, OGPA surfacing has been maintained by the reinstatement of the
functional properties of the surfacing layer by overlaying the existing layer. An OGPA layer is selected for
treatment as a result of its condition, which is generally described by the degree of ravelling and cracking
visible on the surface. This approach results in multiple-OGPA structures of up to three or more
consecutive layers.
This resurfacing approach does not consider any increase in the structural capacity of the pavement that is
due to the increase in total pavement depth, but focuses on restoring the functional properties of the
surfacing layer.
The maintenance regime comprises the sealing of the existing surface by the application of 1.0L/m2
bitumen followed by a layer of grade 5 (6mm nominal size) chip. The purpose of this layer is to seal off
the voids in the existing surface prior to overlaying it with a 25mm nominal-thickness porous asphalt
layer. This membrane seal is applied immediately prior to the OGPA overlay.
In some instances, rut filling is undertaken as a pre-seal treatment and to ensure there are no areas that
will pond water. This involves the application of a layer of dense graded asphalt mix prior to the OGPA
overlay.
Because of the high traffic volumes on the Auckland motorway (up to 25,000 vehicles/lane/day),
maintenance works are carried out during the night. It is a requirement that all maintenance activities are
completed on the same night.
Constraining factors such as concrete kerb levels, barrier heights and vertical bridge openings influence
the selection of the appropriate maintenance treatment. In cases where these factors limit the overlaying
of the existing road, the existing surface is milled off prior to the application of the membrane seal and
OGPA layer.
In areas where the structural capacity of the pavement is suspect, alternative treatment options are
considered – these may include rehabilitation or reconstruction of the pavement.
This multiple-layer approach in maintaining the network has contributed a certain amount of structural
strength to these composite structures. Beams extracted from a two-layer OGPA pavement on the South
Auckland State Highway Network were subjected to fatigue testing using the third-point loading beam
fatigue test in the laboratory (MWH 2006). The fatigue mechanism observed during these tests can be
described as two-fold:
1 Inspection of the test specimen revealed that the bottom half of the beam (the bottom layer of the
two-layered structure) failed in tension, which was clear from the cracks that appeared directly under
the load points. These cracks propagated upwards through the lower layer to the interface between
the two layers (membrane seal), at which point the crack progression ceased.
2 Although the beam stiffness declined with an increase in load repetitions, the beam remained intact
and could be tested well beyond 1 million load repetitions under a strain level of 200µm.

Performance of open graded porous asphalt in New Zealand
28
The above observation may hold the key to a better understanding of the behaviour of multiple-OGPA
structures in a road pavement. Consider the following scenario – the underlying OGPA layer may provide
minimal structural contribution once it is cracked, yet the membrane seal between the OGPA layers may
act as a stress-absorbing membrane interlayer (SAMI) that prevents the cracks from migrating upwards
into the overlaying layer. At this stage, the overlaying OGPA layer may start to contribute towards the
structural integrity of the system in bearing capacity, rather than in flexural strength. This structure may
effectively protect the underlying layers from the pressure from tyres, acting as an equivalent granular
layer.
This rationale is supported by research undertaken by the Transport Road Research Laboratory in the UK
(TRRL), which showed that 50mm of porous asphalt has load-spreading abilities equivalent to that of a
20mm layer of rolled asphalt (Potter and Halliday 1981).
There is a view that this maintenance approach helps to slow down the bitumen-hardening process in the
lower layers of the multiple structure – they are shielded from the degrading effects of ultraviolet
radiation, which may either slow down or stop the ageing process of the binder.
However, the potential risk of this approach is that the following mechanisms of failure can occur over the
lifetime of this composite structure:
• The binder in the lower layers can age, resulting in the loss of cohesive strength in the layer, with
consequent rutting or potholing on the surface.
• A binder-stripping mechanism with the same consequences can also occur.
• The membrane seal can lose its integrity, allowing water to penetrate into the lower layers and cause
structural failure of the granular base layer.
• The voids in the mixture can silt up, leading to a loss in functional properties such as the ability to
dampen noise and to drain freely.
These mechanisms are worldwide phenomena and have been recorded on pavements with ordinary
asphalt-layered systems. However, none of these failure mechanisms have been observed or documented
on the OGPA-surfaced networks in New Zealand.
According to the South Auckland State Highway Network manager, the multiple OGPA layers have
performed well in the past. This success may be due to the relatively thin nature of the OGPA surfacings
on the network – they are traditionally constructed to a depth of 25–35mm, while the void ratio of the mix
is based on a 65mm thick block. It has been shown that when mix is placed at 25mm thick, the void ratio
increases and the mix become more open on the road.
The concept of a traditional OGPA layer – which is selected solely for its functional properties – is also
changed with the addition of polymer modifiers to the bitumen binders in the mix.
4.2 OGPA retexturing
In recent years, several attempts have been made to restore road surfaces to improve their skid resistance.
However, at the time of this research, none of these had been successful in restoring the microtexture (ie
aggregate polishing) of OGPA.

4 Current New Zealand practice
29
In general OGPA surfaces need very little maintenance. The rate of clogging of OGPA surfaces depends
largely on the physical environment. In dry, dusty environments, OGPA requires more maintenance than in
a high-rainfall environment. In New Zealand, OGPA shows signs of clogging within two years of
construction, and signs of polishing towards the end of its functional life.
4.2.1 Cleaning and retexturing trials
Captive water blasting and removal of water and dirt through a mechanical vacuum system were trialled
on a section of the Auckland network during April 2005. The water pressures tested during the trial
ranged from 7–35MPa. Water pressure of 35MPa was found to be excessive; pressure of 20MPa was found
to be more satisfactory. It was also found that five repeated runs over the same area at a pressure of
7–20MPa did not cause damage to the surface.
Some of the results, especially on the older OGPA surfaces, showed a 50% improvement in permeability
after cleaning. Two-year-old sites also showed an increase in permeability after cleaning, and the trials
indicated that cleaning had a generally positive effect on OGPA permeability. The trial also indicated that
course OGPA (large-stone OGPA 20) showed little sign of clogging and had the ability to self-cleanse.
Retexturing of OGPA surfaces that had low skid resistance (ie lacked in SCRIM requirements) was
attempted. These trials were conducted with the use of specially designed equipment that was designed to
mechanically abrade the surface, thereby restoring the surface texture. On OGPA mixes, the retexturing
damaged the older surfaces – the process was found to be more suited to SMA mixes.
Figure 4.1 Retextured OGPA surface (note the newly formed faces)
4.2.2 Surface texture
Surface texture is measured as the difference between the profile (also the average peak level) and a
horizontal line through the top of the highest particle within a certain profile length/width. On a network
basis, surface texture is measured by using high-speed devices that are equipped with laser profilometers.
The texture depth measured with these devices is reported in terms of the mean profile depth (MPD).

Performance of open graded porous asphalt in New Zealand
30
The cumulative distribution of MPD on the network is illustrated in figure 4.1, which presents distribution
plots from several consecutive years. Data used in this assessment was obtained from the high-speed data
surveys that are undertaken annually on this network.
It was expected that the texture depth of an OGPA layer would increase over time, due to an increased
level of ravelling and cracking on the surface because of binder hardening. This is confirmed in the trends
presented in figure 4.2.
Figure 4.2 Surface texture (MPD)
The average MPD increased from 1.27mm in 2001 to 1.41mm in 2005, suggesting that the mean texture
depth on the OGPA network was increasing with time. Although the reliability of the MPD measuring
system is unknown, it shows some potential in measuring the condition of OGPA, which can be useful as a
decision-making tool in the management of the OGPA road network.
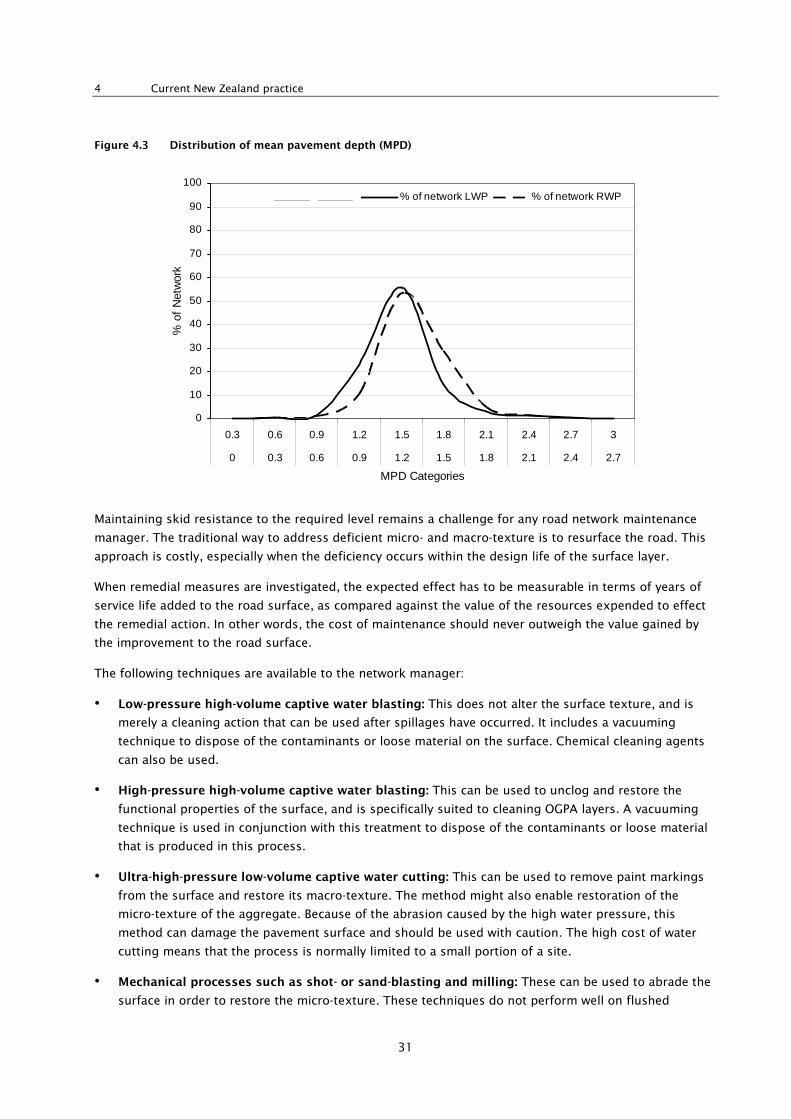
Figure 4.3 shows a marked difference in the texture of the wheelpaths – the right wheelpath seems to be
coarser than the left wheelpath. Closer inspection of the surface revealed that the left wheelpath was more
silted up than the right wheelpath, which contributed to its lower texture depth.
0%
10%
20%
30%
40%
50%
60%
70%
80%
90%
100%
0.2 0.4 0.6 0.8 1.0 1.2 1.4 1.6 1.8 2.0 2.2 2.4 2.6
Mean Pavement Depth (mm)
% o
f Mea
sure
men
ts
INCREASING TEXTURE
2001
2002
2005
4 Current New Zealand practice
31
Figure 4.3 Distribution of mean pavement depth (MPD)
Maintaining skid resistance to the required level remains a challenge for any road network maintenance
manager. The traditional way to address deficient micro- and macro-texture is to resurface the road. This
approach is costly, especially when the deficiency occurs within the design life of the surface layer.
When remedial measures are investigated, the expected effect has to be measurable in terms of years of
service life added to the road surface, as compared against the value of the resources expended to effect
the remedial action. In other words, the cost of maintenance should never outweigh the value gained by
the improvement to the road surface.
The following techniques are available to the network manager:
• Low-pressure high-volume captive water blasting: This does not alter the surface texture, and is
merely a cleaning action that can be used after spillages have occurred. It includes a vacuuming
technique to dispose of the contaminants or loose material on the surface. Chemical cleaning agents
can also be used.
• High-pressure high-volume captive water blasting: This can be used to unclog and restore the
functional properties of the surface, and is specifically suited to cleaning OGPA layers. A vacuuming
technique is used in conjunction with this treatment to dispose of the contaminants or loose material
that is produced in this process.
• Ultra-high-pressure low-volume captive water cutting: This can be used to remove paint markings
from the surface and restore its macro-texture. The method might also enable restoration of the
micro-texture of the aggregate. Because of the abrasion caused by the high water pressure, this
method can damage the pavement surface and should be used with caution. The high cost of water
cutting means that the process is normally limited to a small portion of a site.
• Mechanical processes such as shot- or sand-blasting and milling: These can be used to abrade the
surface in order to restore the micro-texture. These techniques do not perform well on flushed
0
10
20
30
40
50
60
70
80
90
100
0.3 0.6 0.9 1.2 1.5 1.8 2.1 2.4 2.7 3
0 0.3 0.6 0.9 1.2 1.5 1.8 2.1 2.4 2.7
MPD Categories
% o
f N
etw
ork
% of network LWP % of network RWP

Performance of open graded porous asphalt in New Zealand
32
surfaces, and flushing needs to be removed in order to expose the aggregate before the abrasive
action can be applied. High-pressure shot- or sand-blasting can also be used to remove paint markings
from road surfaces. Fine milling of the surface can be used to improve the macro/micro-texture of an
asphalt surface, but should be used with caution as it might cause damage to brittle surfaces and
OGPA layers. These techniques have not generally been found to be effective on OGPA.
These methods were all tested on the South Auckland Motorway Network. However, the results of these
trials were not conclusive, and further trials are required.
The challenge is to find a restoration method that is economical, efficient (ie optimum utilisation of limited
resources) and effective, and that has sustainable results. At the same time, the methodology should only
require brief and simple road closures (for minimal impact on road users) and should produce little
wastage.
4.3 OGPA production
In New Zealand, OGPA is produced and constructed under two specifications:
• TNZ P/11, which is a conventional-method specification
• TNZ P/23, which is a performance-based specification.
OGPA is produced from high-quality stone, and both modified and unmodified binders are used in its
production. Crushed steel slag has been utilised in OGPA production, mainly because of the high PSV that
it can produce. Table 4.1 summarises the properties of typical New Zealand aggregate, the required binder
properties, and the typical mix properties required under the TNZ P23 specification.
Table 4.1 Typical OGPA mix properties
Item description TNZ P/23 requirement Typical value
Course aggregate
Crushing resistance (kN) ≥230(kN) to produce ≥230
Weathering resistance AA AA
Polished stone value TNZ T/10 specification (project-specific) 55–61
Los Angeles Abrasion Loss (%) Report value 7–30
Wet/dry strength variation (%) Report value 8–53
Water absorption Report value 0.8–1.8
Fine aggregate
Crushing resistance (kN) 200 min. parent rock ≥200
Sand equivalent 35 min. 64
Clay index 3 max. 1.3
Water absorption (%) Report (NAS specification 2 max.) 1.1
Degradation factor Report (NAS specification 60 min.) 93
Binder properties
Penetration grade bitumen Compliance with TNZ M/1 B50 43–48
Modified binder – softening point (°C) Report value contract specification 62 min. AB4 70–85
Modified binder – torsional recovery (%) Report value contract specification 12 min. 31–46
Modified binder viscosity (Pa.S) Report value contract specification 1 max. @ 165°C 0.4–0.5

4 Current New Zealand practice
33
Item description TNZ P/23 requirement Typical value
Mix design properties
Drain-down (%) 0.3 max. @ 8°C more than mix temperature 0.2–0.3
Asphalt particle loss (%) 15 max. 2–9
Retained tensile strength (%) 80 min. 78–94
VMA (%) Not specified 28–33%
Refusal air voids (%) 2 min. AC 18–23
Binder film thickness (µm) 7.5 min. AC 7–9
Field permeability (litre/min) 12 max. 8–9
MPD (mm) Contract specification 1.2–1.4
Wheel tracking (mm) Report value 2–5
Binder content (%) Report value 4.5–5.5
Voids (%) Report value 18–23
4.4 Summary of OGPA specification and approval process
Prior to construction, the mix for the OGPA to be used at that site is calculated based on a lay-down trial.
The mix is accepted according to its volumetric, textural and permeability properties. During the
production of the OGPA, the contractor is required to provide data on the mix variations in agreement with
the contract quality plan. Parameters such as improvements in riding quality and rutting, and other site
information, is treated as report-only information. Properties such as MPD and PSV are contract-specific,
and SCRIM requirements are covered in the TNZ T/10 specification.
Figure 4.4 Free-draining OGPA on the South Auckland Motorway

Performance of open graded porous asphalt in New Zealand
34
4.5 Improvement in riding quality
The post-surfacing improvement in riding quality is usually specified to be less than a NAASRA4 count of
50. Because of the nature of an OGPA overlay and its relative thinness, the post-surfacing results were
found to be dependent on the roughness of the underlying surface – improvements of 15–30% in NAASRA
roughness were reported on pre-surfacing values of 100 and 80 respectively.
4.6 Additional testing
The following additional asphalt tests were conducted on OGPA samples from the network:
• resilient modulus testing
• fatigue testing
• wheeltrack rutting
• torque bond test.
4.6.1 Resilient modulus testing
The testing was carried out at two locations on the network – the Southern Motorway at East Tamaki and
the Northwestern Motorway at Henderson. The considerations for selecting these sites were as follows:
• Southern Motorway at East Tamaki: This section of motorway was constructed and opened in 1955.
The SNP of the site was 6.8 and the base was cement-stabilised. The test cores showed significant pre-
levelling with what appears to be Mix 10 asphalt. The base consisted of three consecutive OGPA
layers, with the most recent surface being five years old at the time of coring.
Six cores were taken and the resilient modulus averaged 2050MPa, with a range of 1616–2439MPa.
• Northwestern Motorway: Because of the 1970s oil shock, sections of the Northwestern Motorway did
not receive a structural asphaltic concrete overlay. It was considered to be a test of what contribution
multiple OGPA layers could provide on a pavement, conceivably outside its design life. The SNPs were
between 3.5 and 4.5.
Twelve samples were tested for this resilient modulus, with an average of 1900MPa and a range of
1600–2600Mpa. This implies the core had the same strength as normal dense-mix asphaltic concrete.
4.6.2 Fatigue testing
This process tests the pavement’s flexure strength and involves multiple deflection loadings. The results
were inconclusive, as although 4 of the 11 beams performed well, 7 failed relatively early; ie after a
relatively low number of repeated load cycles. It is thought that beams cut from an OGPA slab may not be
appropriate for testing, given the potential for damage from either pre-existing defects or during the
beam’s extraction.
4 Measure of road roughness in terms of NAASRA counts/km (National Association of Australian State Road Authorities)

4 Current New Zealand practice
35
4.6.3 Wheeltrack rutting
This testing simulates deformation of the asphaltic mix from wheel loadings and is carried out at elevated
temperature (60°C). The 12 samples had an average of 2.8mm of deformation and a range of 1.9–4.4mm –
the Austroads guide Selection & design of asphalt mixes (1998) ranks deformation depths of less than
3.5mm as superior.
4.6.4 Torque bond test
This test was one of the most intriguing, not only in terms of the results, but in the way the samples
failed. The intention of the test was to get an indication of the bonding strength between the layers. Of the
13 samples tested, 10 exhibited good torsional strength over 3 layers. Torsional strengths on 10 of the
samples ranged from 350kPA to 520kPA; the other 3 were between 140kPa and 170kPa. Most of the
samples failed through the OGPA layer (as opposed to the chipseal layer), indicating that the chipseal layer
provided a bonding action, allowing the transfer of the wheel load into the lower OGPA layers, which is the
probable key to the strength of this composite structure.
4.7 Failure mechanisms observed in OGPA layers
Typical failure mechanisms observed on the South Auckland State Highway Network were as follows:
• loss of functionality – loss of skid resistance and water transitivity
• ravelling of the surface – stone loss due to brittle binder and mechanical damage
• pavement rutting – OGPA have excellent rut resistant properties, but the granular bases seem to be
the weak link
• surface cracking and pumping – usually related to the pavement structure rather than the OGPA
surfacing.
The above failure mechanisms are depicted in the photos below.
Figure 4.5 Ravelling due to ageing of the bituminous binder

Performance of open graded porous asphalt in New Zealand
36
Figure 4.6 Cracking and pumping of the pavement surface due to pavement rutting and moisture retention in
the OGPA surface
Figure 4.7 Pavement rutting and subsequent failure of the OGPA surfacing

4 Current New Zealand practice
37
Figure 4.8 Multiple OGPA exposed to constant wet conditions in the bottom layer because of impeded side
drainage (stripping of binder has occurred)
4.8 Mechanistic analysis of multiple OGPA layers
In order to quantify the contribution of consecutive OGPA overlays to a pavement’s structure, a
mechanistic analysis focusing on the basecourse stress ratio was performed. Actual data obtained on State
Highway 16 (section RP 7/8.58 to 7/8.92) was selected as the analysis section, owing to the availability of
long-term traffic, overlay and rut information. The first step was to model the pavement and each of its
OGPA overlay phases with CIRCLY design software, focusing on the triaxle stress induced in the
basecourse under a standard 80KN axle load. The pavement was modelled as follows:
1 as a sealed pavement
2 as a pavement with a single OGPA overlay
3 as a two-layer system with stiffening of the initial OGPA overlay
4 by overlaying it with a third overlay and progressively stiffening the initial and second overlays.
The stress ratio was defined as the triaxial stress under the design load divided by the triaxial stress at
failure. Assuming an internal angle of friction between 44 and 46 degrees, and a nominal cohesion of
50kPa for the basecourse material, the stress ratio could be calculated.
The pavement composition and historic traffic loading are illustrated in figures 4.9 and 4.10 respectively.
Table 4.2 summarises the CIRCLY inputs (layer properties) and date of overlay. The results of the analysis
indicated that with each consecutive overlay, the rut capacity of the base increased as the stress ratio in
the middle of the basecourse decreased.
It was concluded that as the number of OGPA layers increased, the structural capacity of the composite
structure increased and the rate of rut progression of the basecourse decreased significantly, as illustrated
in figure 4.11.

Performance of open graded porous asphalt in New Zealand
38
Figure 4.9 Traffic loading
Figure 4.10 Pavement composition
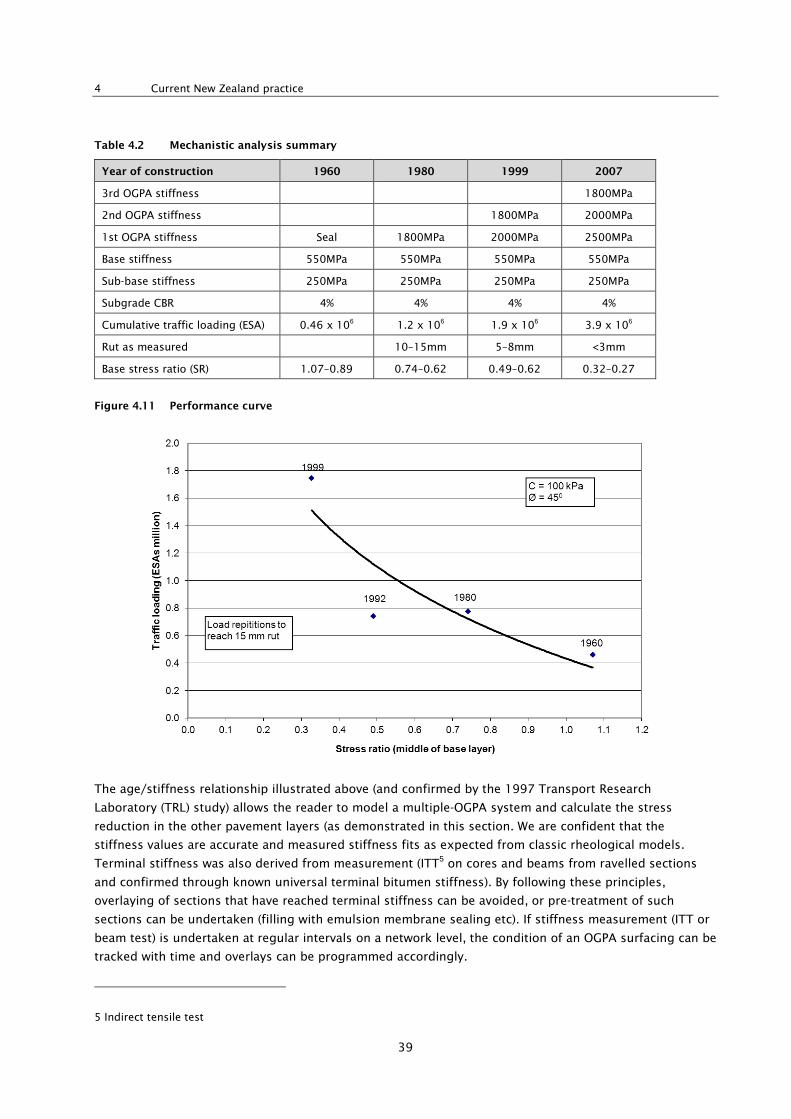
4 Current New Zealand practice
39
Table 4.2 Mechanistic analysis summary
Year of construction 1960 1980 1999 2007
3rd OGPA stiffness 1800MPa
2nd OGPA stiffness 1800MPa 2000MPa
1st OGPA stiffness Seal 1800MPa 2000MPa 2500MPa
Base stiffness 550MPa 550MPa 550MPa 550MPa
Sub-base stiffness 250MPa 250MPa 250MPa 250MPa
Subgrade CBR 4% 4% 4% 4%
Cumulative traffic loading (ESA) 0.46 x 10⁶ 1.2 x 10⁶ 1.9 x 10⁶ 3.9 x 10⁶
Rut as measured 10–15mm 5–8mm <3mm
Base stress ratio (SR) 1.07–0.89 0.74–0.62 0.49–0.62 0.32–0.27
Figure 4.11 Performance curve
The age/stiffness relationship illustrated above (and confirmed by the 1997 Transport Research
Laboratory (TRL) study) allows the reader to model a multiple-OGPA system and calculate the stress
reduction in the other pavement layers (as demonstrated in this section. We are confident that the
stiffness values are accurate and measured stiffness fits as expected from classic rheological models.
Terminal stiffness was also derived from measurement (ITT5 on cores and beams from ravelled sections
and confirmed through known universal terminal bitumen stiffness). By following these principles,
overlaying of sections that have reached terminal stiffness can be avoided, or pre-treatment of such
sections can be undertaken (filling with emulsion membrane sealing etc). If stiffness measurement (ITT or
beam test) is undertaken at regular intervals on a network level, the condition of an OGPA surfacing can be
tracked with time and overlays can be programmed accordingly.
5 Indirect tensile test

Performance of open graded porous asphalt in New Zealand
40
5 Network maintenance management
5.1 NZTA pavement management system
The ‘pavement management system’ through which the NZTA manages the New Zealand state highway
network incorporates a long-term pavement performance modelling process that uses the dTIMS6 CT
computer software as framework to find the optimal set of maintenance strategies. This system
determines the optimal overall levels of service based on a target benefit–cost ratio, and ensures that the
maximum return is derived from investment in the road infrastructure. Data is obtained from the RAMM
database, which is the depository of all asset information such as inventory, performance and
maintenance data.
The Road Information Management Systems (RIMS) Group is responsible for providing leadership and
strategic advice to the New Zealand road management industry on best practice and asset management
information systems for roads. In this role, the RIMS Group is responsible for the customisation of the
dTIMS CT application software to reflect the conditions and pavement performance in New Zealand.
The analysis within dTIMS CT uses the ‘life cycle cost analysis’ approach to compare different strategies
for maintaining or improving road elements – ie it estimates the future costs that would result from
various strategies. The three basic functions within the dTIMS CT analysis are strategy generation,
optimisation and programme development.
Maintenance strategies that employ a range of treatments are generated for each road segment. The
system predicts how each strategy would affect the condition of the road section over the analysis period
(20 years). To find the best treatments for any given year, the system uses triggers that describe the
feasible range of treatments that represent every reasonable course of action that could be performed on
each road element during the analysis period.
The cost stream generated by each given strategy is automatically calculated by dTIMS CT and
summarised for different types of treatments occurring over the analysis period. dTIMS CT uses the area
under the curve (condition over time) to calculate the benefit for each strategy.
To find the optimal maintenance regime under a given funding scenario, dTIMS CT evaluates the life cycle
cost of the range of maintenance strategies and uses an optimisation process, considering the objectives
and constraints, to determine the strategy for each road section that will minimise the total transport
costs for a given budget scenario. The selected strategies then form the construction programme or works
programme.
The network-level pavement management process is illustrated in figure 5.1.
6 Deighton’s Total Infrastructure Management System

5 Network maintenance management
41
Figure 5.1 Network-level pavement management
5.2 Finalising the works programme
Once the strategies are generated for each treatment length, a 10-year condition forecast and forwards
works programme are produced, followed by a field validation exercise of the works programme. The
validation is undertaken by the network manager and a panel of experienced evaluators, with a focus on
the outputs of the first three years of the programme.
During the network-level assessment, a panel of evaluators considers several factors to decide on the final
treatment. All the relevant link information, such as traffic loading, surface attributes, several condition
parameters, and maintenance costs, is available to the panel during this evaluation exercise. In
formulating its final decision, the panel also considers site constraints such as the available kerb and
barrier lip heights, guardrail heights, and the structural number of a treatment length. For instance, in
cases where overlaying of the existing road surface will result in the barrier lip height not conforming to
the applicable safety standard, milling off the existing surface is selected prior to resurfacing with an
OGPA overlay.
A detailed structural analysis of pavements is generally not undertaken at network level. Road sections
that are earmarked for resurfacing are also checked for structural capacity, so that only sections with a
SNP ≥2 are considered for overlay. Sections with SNP <2 are expected to pose a risk of early OGPA failure
due to expected high pavement deflections and curvature, and are considered for structural strengthening
prior to resurfacing. The structural numbers used in the analysis are derived from network pavement
deflection surveys measured by an FWD apparatus.
The process for finalising the works programme is illustrated in figure 5.2
INPUTS
Roughness
Texture
Rutting
Deflection
Visual Condition
Surface age
Binder Condition �
OUTPUT
Works Programme
dTIMS Modelling
� Not included in modelling process
INPUTS
Roughness
Texture
Rutting
Deflection
Visual Condition
Surface age
Binder Condition �
OUTPUT
Works Programme
dTIMS Modelling
� Not included in modelling process

Performance of open graded porous asphalt in New Zealand
42
Figure 5.2 Finalising works programme
The finalised works programme then serves as input into dTIMS CT for a specified analysis run. The
outputs of this analysis are used to confirm the budgetary spending, and to compare the predicted
network condition against other budget scenarios.
5.3 Proposed improvement to optimisation process
From the above, it is clear that the dTIMS CT system is a comprehensive and complex model. Although the
model does not use binder condition or binder ageing as a direct input, it utilises other parameters, such
as surface condition, surface age and maintenance costs, as an indirect measure of binder condition.
A maintenance decision-making tree that considers the structural soundness of a pavement with
cognisance of site constraints and functional requirements is proposed in figure 5.3. The use of this
decision-making structure would formalise the decision-making process, and would contribute towards the
improvement of the network condition in the long term.
OGPA Resurfacing(Rutfill, Membrane Seal + OGPA)
Structural Strengthening(AC + OGPA/SMA)
Mill & Replace(OGPA/SMA)
INPUTS
Deflection Analysis
Traffic / Loading
Pavement Structure
Binder Condition �
Functional Aspects
Visual Condition
Skid Resistance
Surface Age
OUTPUTS
Bridges
Guardrails
Kerb Lines
Gantry Signs
Median Barriers
Site
Spe
cific
Str
uctu
ral
Fun
ctio
nal
Structural Assessment
Waterblasting & Re-texturising
� Not included in modelling process

5 Network maintenance management
43
Figure 5.3 Proposed network maintenance decision-making structure
Site Constraints?
FunctionalRequirements?
OGPA inlay
SMA, UTA, AC inlayYes
Yes
Yes
No
No
Treatment
Selection
Process
No
Yes
No
Yes
No
Yes
No
Yes
No
OGPA overlay
SMA, UTA, AC overlay
Strengthen structure, OGPA
inlay (non-structural)
Strengthen structure, SMA,
UTA, AC inlay. (Utilise
structural properties)
Strengthen structure, OGPA
overlay
Strengthen structure, SMA, UTA,
AC overlay (Utilise structural
properties)
Forward
Works
Programme
StructurallySound?
In the case of a sound pavement section (SNP ≥2) on which the functional properties of an OGPA surfacing
are required, and where the section has no site constraints such as kerb lines, guardrails, etc, the
decision-making structure suggests milling off the existing OGPA surfacing prior to replacing it with new
OGPA. The current maintenance practice under these conditions (no site constraints) would not
necessitate milling off the existing surfacing. The long-term implications of this approach need to be
monitored, as the potential of a water reservoir sandwiched in the multiple layers could lead to bitumen
stripping and consequent failure. However, there has not yet been any evidence of this occurring to any
significant degree.

Performance of open graded porous asphalt in New Zealand
44
6 Methods of measuring OGPA stiffness
The aim of the stiffness measurement of a multiple-OGPA structure is to determine the relationship
between mix stiffness/binder stiffness and in-service layer performance, aided by previous experience and
published terminal binder-stiffness values.
The stiffness of an existing asphalt layer can be measured through various methods – a short overview of
the available tests is necessary in order to select the best method.
6.1 Non-destructive methods
6.1.1 Falling weight deflectometer (FWD) method
This device is considered to be the most efficient method for testing the condition of a pavement
structure. The technology developed around FWD testing – such as the back-calculation of layer moduli
and pavement life prediction – is a worldwide standard.
Results from the FWD testing can be used to back-calculate the stiffness of an asphalt layer, but the
equipment is not considered sensitive enough to calculate the stiffness of the surfacing layers to the
accuracy required for this study – owing to the scale of the test and the spacing of the geophones or
accelerometers of the device, it might not be able to back-calculate the stiffness of a thin asphalt layer.
With its current set-up, the FWD provides useful information from which the pavement curvature can be
calculated. Crack activity on an existing pavement can also be determined with this device – this
parameter enables the assessment of the degree of reflective cracking in the pavement, which is linked to
the success of consecutive overlays. This device remains a valuable tool in the structural assessment of
pavements on both network and project design levels.
6.1.2 Spectral analysis of surface waves (SASW)
SASW measurement is based on the velocity of seismic waves through the pavement layers. The principle
behind this procedure is the analysis of the complex series of waves produced by a disturbance created at
the surface of the pavement. In order to measure the surface stiffness of the pavement, the baseline or
distance between the geophones needs to be short. Also, the frequency at which the geophones operate
needs to be high enough to measure the velocity of the surface waves. In Texas, this system was mounted
on a FWD device and used in combination with this technology, to supplement the FWD data.
In 2003, Land Transport NZ (now NZTA) funded a research project that investigated the application of
SASW for the measurement of layer thickness and material moduli of pavements, in order to assess
pavement strength (Furlong et al 2004). Although the equipment used during this project produced
positive results, the researchers recommended modifications to render the device more useful for the
measurement of pavement-surface stiffness. The proposed enhancements include improved measurement
resolution, simplified data interpretation, and converting the SASW equipment into a rolling measuring
device.
The technology is not yet available in this form in New Zealand, but promises to be a valuable pavement-
analysing tool that can be used effectively at network level.

6 Methods of measuring OGPA stiffness
45
6.2 Destructive methods
6.2.1 Measurement of binder stiffness
This measurement is applied to a sample of bitumen binder recovered from core samples extracted from
the pavement. A solvent is used to extract the binder from the mix; the solution of solvent and bitumen is
then put through a 150µm sieve, centrifuged for 20 minutes, and filtered under vacuum in order to purify
the solution. The volatiles in the solution are allowed to evaporate in a nitrogen atmosphere, leaving the
recovered bitumen. The modulus of the binder is determined in a parallel plate rheometer, or the binder
penetration can be determined in a penetration test apparatus.
Binder recovery on a network level is not deemed feasible because of the high cost involved, and is usually
applied to research or specific problem-solving situations.
Recovering binder from multiple-OGPA-layered samples is complicated because of the relatively thin
layers, and the presence of the inter-layered membrane seals in these samples.
6.2.2 Bending beam test
This test was developed to determine the fatigue life of asphalt samples, and can be used to establish the
stiffness of a mix. Failure of a test specimen is defined as the point at which its stiffness has reached 50%
of the initial measured stiffness value. The test can be performed at a constant strain level or a constant
stress level, the latter being the more severe situation.
The disadvantage of this test lies in the level of care and precaution required when retrieving and
preparing an undisturbed sample for testing, which makes it an expensive test. The testing of samples
retrieved from multiple-OGPA structures is problematic with regards to the interpretation of the results
because of the presence of membrane seal layers between successive OGPA layers.
6.2.3 Measurement of modulus by means of indirect tensile measurement (ITS)
The basis of the ITS test is the measurement of the tensile strain that is exerted on the asphalt sample by
the application of a compressive force on the sample. Test specimens with diameters of between 100mm
and 150mm, and specimen heights between 35mm and 70mm, can be tested. Specimens with a resilient
modulus between 600MPa and 28,500MPa can be tested.
During this study the ITS test was conducted successfully on both laboratory-prepared OGPA samples and
multiple-layered samples retrieved from the road surface.
6.2.4 Other performance tests
Cantabro durability testing of laboratory specimens has been used extensively throughout the world.
Herrington et al (2005) proposed that the Cantabro test should be specified for design purposes on
unaged and aged OGPA specimens. In this method, the newly prepared specimens are aged in a pressure-
ageing vessel at 80°C for three days under an air pressure of 2070kPa (300psi). The results published in
their report indicated a weight-loss increase by a factor of 1.5 to 2.1 after ageing. However, the

Performance of open graded porous asphalt in New Zealand
46
applicability of the Cantabro test on cores retrieved from the road is limited because of the required
sample thickness of 65mm.
6.3 Discussion
The test methods described above are summarised in table 6.1 in terms of complexity and relevance to
the measurement of OGPA stiffness. The destructive nature of the tests, and whether the test method is
available in New Zealand, are also assessed.
Table 6.1 Summary of test methods
Method Destructive Applicable to OGPA samples? Complexity Available in NZ?
Binder recovery Yes Yes Not easy to perform Yes
FWD No No Easy to perform Yes
SASW (high frequency) No Yes Easy to perform No
Bending beam Yes Yes Not easy to perform Yes
Resilient modulus (ITS) Yes Yes Easy to perform Yes
Cantabro durability Yes Yes – thick OGPA layers Easy to perform Yes
Although the FWD test method rates highly as a non-destructive and easy-to-perform test, its accuracy in
measuring the in-situ stiffness of a relatively thin OGPA surface layer is considered to be poor, owing to
the spacing of the geophones (200mm minimum). Further research on this aspect is needed. Binder
recovery and stiffness measurement is an alternative (but expensive) test, and is not considered feasible at
network level. High-frequency SASW promises to be a quick and accurate means to measure in-situ
stiffness, but the technology available in New Zealand has not yet matured and further development is
required to enable the measurement of multiple OGPA layers.
Bending beam tests have been performed on OGPA layers in New Zealand, but the sample preparation is
costly and difficult, and the results vary.
ITS testing presents a quick and reliable means of measuring OGPA layer stiffness, but samples with thin
OGPA layers pose a problem because the minimum sample thickness required by the test method is in the
order of 50mm.
Cantabro testing offers to test the durability of a mix on samples retrieved from the road surface but
again, the sample thickness is the limiting factor, as the test method requires a sample thickness of
65mm.
Testing with the aim of measuring stiffness values of OGPA samples retrieved from the road is therefore
problematic, and this necessitates the development of alternative ways to obtain in-situ stiffness values.

7 Relating field performance to resilient modulus (stiffness)
47
7 Relating field performance to resilient modulus (stiffness)
7.1 Background
7.1.1 Investigation of multiple OGPA layers
During 2005/06, MWH New Zealand Ltd investigated the performance of pavements with multiple OGPA
layers on the South Auckland State Highway network (MWH 2006). Samples extracted from four test sites
on State Highway 16 (SH16) were subjected to standard laboratory testing procedures to determine the
mix stiffness, by means of the repeated-load ITS test, as well as the bending beam (fatigue) test. A
description of the condition of the sites at the time of testing is presented in table 7.1.
Table 7.1 Multiple-OGPA study
Reference Layer description Visual condition
SH16 – site B 3 OGPA layers on bitumen-treated base layer Good
SH16 – site D 2 OGPA layers on AC Poor – cracking & ravelling
SH16 – site E 2 OGPA layers on granular base Fair – limited cracking & ravelling
SH16 – site F 2 OGPA layers on granular base Fair – limited cracking & ravelling
The apparently good visual performance of site B can be ascribed to the low deflection (0.33mm – 90th
percentile and curvature (0.06mm – 90th percentile of the pavement in relation to the other sections. The
deflection and curvature results, together with the pavement profile, are summarised for each section in
appendix A. The results of the resilient modulus testing are presented in figure 7.1.
Figure 7.1 Resilient modulus results from SH16 cores
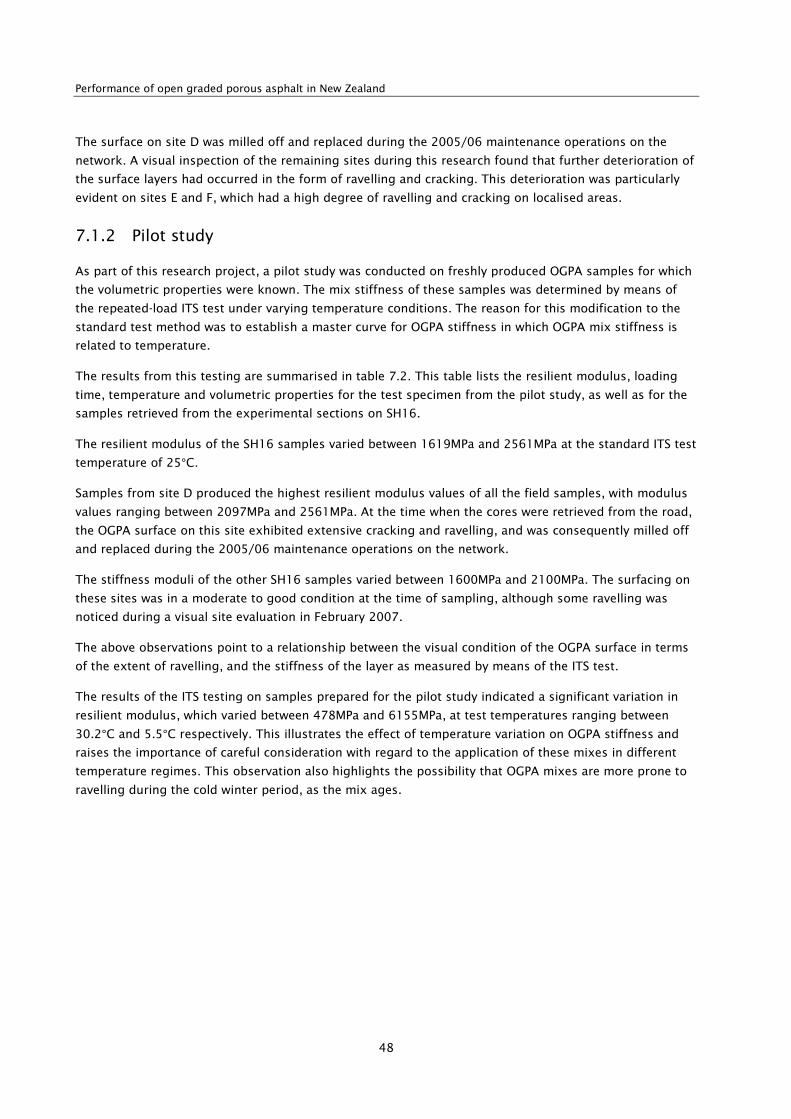
Performance of open graded porous asphalt in New Zealand
48
The surface on site D was milled off and replaced during the 2005/06 maintenance operations on the
network. A visual inspection of the remaining sites during this research found that further deterioration of
the surface layers had occurred in the form of ravelling and cracking. This deterioration was particularly
evident on sites E and F, which had a high degree of ravelling and cracking on localised areas.
7.1.2 Pilot study
As part of this research project, a pilot study was conducted on freshly produced OGPA samples for which
the volumetric properties were known. The mix stiffness of these samples was determined by means of
the repeated-load ITS test under varying temperature conditions. The reason for this modification to the
standard test method was to establish a master curve for OGPA stiffness in which OGPA mix stiffness is
related to temperature.
The results from this testing are summarised in table 7.2. This table lists the resilient modulus, loading
time, temperature and volumetric properties for the test specimen from the pilot study, as well as for the
samples retrieved from the experimental sections on SH16.
The resilient modulus of the SH16 samples varied between 1619MPa and 2561MPa at the standard ITS test
temperature of 25°C.
Samples from site D produced the highest resilient modulus values of all the field samples, with modulus
values ranging between 2097MPa and 2561MPa. At the time when the cores were retrieved from the road,
the OGPA surface on this site exhibited extensive cracking and ravelling, and was consequently milled off
and replaced during the 2005/06 maintenance operations on the network.
The stiffness moduli of the other SH16 samples varied between 1600MPa and 2100MPa. The surfacing on
these sites was in a moderate to good condition at the time of sampling, although some ravelling was
noticed during a visual site evaluation in February 2007.
The above observations point to a relationship between the visual condition of the OGPA surface in terms
of the extent of ravelling, and the stiffness of the layer as measured by means of the ITS test.
The results of the ITS testing on samples prepared for the pilot study indicated a significant variation in
resilient modulus, which varied between 478MPa and 6155MPa, at test temperatures ranging between
30.2°C and 5.5°C respectively. This illustrates the effect of temperature variation on OGPA stiffness and
raises the importance of careful consideration with regard to the application of these mixes in different
temperature regimes. This observation also highlights the possibility that OGPA mixes are more prone to
ravelling during the cold winter period, as the mix ages.

7 Relating field performance to resilient modulus (stiffness)
49
Table 7.2 Resilient modulus at varying temperatures (ITS test results)
Sample
no. Site ref.
Temp
(ºC)
Loading
time (sec)
Resilient
modulus (MPa)
Air voids
(%) Notes
1323 SH16-E1 25.4 0.100 1914 - Site E1 Fair condition, some
ravelling, Feb 2007 1325 SH16-E2 25.3 0.100 1619 - Site E2
1327 SH16-F4 25.3 0.100 1957 - Site F4
Fair condition, some
ravelling, Feb 2007 1328 SH16-F5 25.3 0.100 1846 - Site F5
1329 SH16-F6 25.4 0.100 1848 - Site F6
1209 SH16-D3 25.0 0.100 2561 - Site D2 Poor condition ravelled &
cracked. Milled & replaced
Feb 2006 1210 SH16-D1 24.8 0.100 2097 - Site D1
1212 SH16-B4 24.9 0.100 2096 - Site B4
Good condition, some
ravelling, Feb 2007
1213 SH16-B1 25.1 0.100 2012 - Site B1
1214 SH16-B2 25.3 0.100 1940 - Site B2
1215 SH16-B3 25.4 0.100 2196 - Site B3
3 Lab 5.2 0.097 5336 20.3
Pilot study – production mix,
Nov 2006
1 Lab 5.5 0.102 6155 20.2
21 Lab 6.8 0.097 5645 19.7
23 Lab 6.8 0.099 5376 20.7
24 Lab 12.7 0.098 3042 21.4
29 Lab 13.2 0.100 2871 20.7
12 Lab 19.5 0.100 1404 20.4
10 Lab 19.6 0.100 1608 20.4
11 Lab 19.6 0.100 1329 20.4
17a Lab 24.8 0.100 949 -
17 Lab 24.9 0.100 908 -21.5
18 Lab 24.9 0.100 771 21.3
16a Lab 24.9 0.100 880 -
18a Lab 24.9 0.100 725 -
8 Lab 25.1 0.100 888 20.4
16 Lab 25.2 0.100 995 21.4
9 Lab 25.2 0.100 962 21.0
7 Lab 25.2 0.100 815 19.1
14 Lab 29.8 0.100 543 21.6
13 Lab 30.2 0.100 478 19.9
15 Lab 30.3 0.100 540 21.1
The samples tested from the pilot study stiffened up more than expected at a temperature of 5°C, which
indicated that the binder used in this mix might have been sensitive to low temperatures. This emphasises
the value of resilient modulus testing at various temperatures on proposed asphalt mixes. Temperature
sensitivity may be identified through this approach.

Performance of open graded porous asphalt in New Zealand
50
7.2 Failure of OGPA mixes due to binder stiffening
Based on the above observations, it is suggested that the failure mechanism for an OGPA surfacing layer is
that the mix stiffens with time because of ageing of the binder, to the point where cracking and ravelling
occurs on the surface.
Exploring the wide range in time to crack initiation, several other failure mechanisms might be at work.
This section is focused on the binder stiffness, with the aim of being able to predict the point at which
brittle failure of the binder in the mix occurs.
7.3 Predicting OGPA failure from binder stiffness
From the reported binder failure properties as shown in appendix C, the terminal binder stiffness can be
calculated for a range of temperatures, using the same loading time as for the repeated-load ITS and the
proposed equations noted in appendix C.
Using the above-mentioned relationships, figure 7.2 was prepared to estimate the mix stiffness at failure
for temperatures ranging from 0–30°C. The stiffness values obtained from laboratory ITS tests on the pilot
study samples were then superimposed onto this chart, to determine the critical temperature at which the
various samples would ‘fail’ or reach terminal stiffness.
Figure 7.2 OGPA resilient modulus versus temperature
0
1000
2000
3000
4000
5000
6000
7000
8000
9000
10000
0 5 10 15 20 25 30 35
Temperature (degree Celsius)
Res
ilien
t Mod
ulus
(M
Pa)
Pen11
Pilot study Pen15
The relationships in figure 7.2 were prepared by using a load frequency of 0.1sec corresponding to the
loading time of the ITS test. Varying the temperature from 0–30°C, the resilient modulus of an OGPA mix
with volumetric properties, as mentioned in section 2.1 of this report, was calculated by using the
proposed equations and Shell nomograph, and a failure criteria of Pen = 15, PI = 0.4 and TR&B = 70°C to

7 Relating field performance to resilient modulus (stiffness)
51
calculate the first failure envelope (Pen15). These values were based on the binder properties of failed
sections of OGPA that were published in TRL report 264 (Nicholls 1997), and summarised in appendix C.
The corresponding OGPA stiffness of 1500MPa at 25°C was calculated at the same loading time as for the
repeated-load ITS by using the proposed equations and Shell nomograph.
Similarly, a second envelope (Pen11) was calculated using Pen = 11, PI = 0.5 and TR&B = 75°C. This was
based on an observed failed section of asphalt as reported in appendix C (Bahia and Nam 2004). The
corresponding OGPA stiffness of 2300MPa at 25°C was calculated at the same loading time as for the
repeated-load ITS by using the proposed equations and Shell nomograph.
Ravelling was observed on the test sections of back-calculated bitumen penetration values ranging
between Pen15 and Pen11. These values correspond to an OGPA stiffness of 1500MPa and 2300MPa.
Based on a terminal binder stiffness of Pen11, a terminal OGPA stiffness of 2300MPa is proposed.
The resilient modulus results obtained from the pilot study were then superimposed onto this chart. The
stiffness moduli of the samples tested during the pilot study showed a strong correlation with the
predicted stiffness values for a 40/50 Pen binder and volumetric properties of a typical OGPA mix.
This method has not been proven, and no claim can be made that the predicted failure stiffnesses are
absolute values. The method does, however, show potential in predicting OGPA stiffness based on the
binder properties within the mix. This principle was explored by Van de Ven (2004) as presented at the
8th Conference on Asphalt Pavements for Southern Africa (CAPSA) in 2004.
The purpose of this form of data presentation is to provide more insight into the temperature sensitivity
of the asphalt mix, and allows ITS test results to be evaluated in case they were performed at
temperatures other than the standard test temperature of 25°C. Owing to the nature of the ITS test (tensile
strain caused by a compressive force), some researchers promulgate testing temperatures below 20°C, in
order to eliminate permanent deformation of the sample during loading.
7.4 Application of method
The proposed method was used to evaluate the stiffness of laboratory-prepared samples from the pilot
study, as well as of OGPA cores extracted from an existing pavement.
The resilient modulus of an OGPA mix at varying temperatures within the test specification is illustrated in
figure 7.3, and indicates the failure zone above the upper contour. The chart allows for values to be
plotted against various temperatures in order to be more accurate when evaluating a specific test result.
Stiffness moduli from the pilot study are presented on this chart, as well as moduli obtained from core
samples on the network. These cores were taken from sections that were showing various levels of
distress at the time of sampling, as described in section 7.1.1.

Performance of open graded porous asphalt in New Zealand
52
Figure 7.3 OGPA modulus versus temperature
It can thus be concluded that the ITS test gives a very good indication of the condition of an OGPA mix.
This method can also be used to track the stiffening of an asphalt layer over time, by testing core samples
from the pavement at various age intervals over the lifespan of the layer, and predicting the time at which
the layer will reach a terminal stiffness. This approach has the potential to enhance the decision making in
a pavement management system.
The stiffness moduli of samples retrieved from the South Auckland State Highway Network are plotted
against age in figure 7.4.
0
500
1000
1500
2000
2500
3000
3500
4000
24 24.2 24.4 24.6 24.8 25 25.2 25.4 25.6 25.8 26
Temperature (degree Celsius)
Res
ilien
t Mod
ulus
(M
Pa)
Pen11
Pen15
Pilot Study
Site B-Good (Some ravelling)
Site D-Poor (Ravelled and cracked)
Site E-Fair (Some ravelling)
Site F-Fair (Some ravelling)
Failed section
ITS test - Lower limit
ITS test - Upper limit

7 Relating field performance to resilient modulus (stiffness)
53
Figure 7.4 OGPA modulus versus surface age
Research undertaken in the UK recommended a decrease in binder penetration at approximately 20% per
year (Nicholls 1997). The increase in OGPA stiffness described in figure 7.4 is in the order of 16% per year,
which is comparable to the rate of stiffening suggested in the above-mentioned TRL research report.
The remaining life of an OGPA layer can thus be predicted based on the rate of stiffening, as per the above
model. The terminal OGPA stiffness was found to be 2300MPa at 25°C, as measured with the ITS test. The
corresponding binder stiffness is in the order of 220MPa or Pen 11.
0
500
1000
1500
2000
2500
3000
3500
4000
0 1 2 3 4 5 6 7 8
Time (Years)
OG
PA
Mod
ulus
(M
Pa)
Site B Site D
Site E Site F
Stiffness increase on Auckland network Terminal stiffness
Modulus of lab-prepared samples (Pilot study)

Performance of open graded porous asphalt in New Zealand
54
8 Conclusions
The principal conclusions that can be drawn from this study, which was based on the data obtained from
the South Auckland State Highway Network, are as follows:
• The OGPA surfacing on the South Auckland State Highway Network has an average life of eight years
to first crack initiation, which is a slightly longer life than that of the dense graded asphalt surfacings.
• The performance of OGPA appears to be related to the structural integrity of pavement structures with
high SNP values. Factors other than the surface age and pavement strength affect its performance, and
are probably related to binder ageing and environmental influences.
• The mean texture depth on the OGPA network increased over time – the average MPD increased from
1.27mm (in 2001) to 1.31mm (in 2002) and 1.41mm (in 2005). This may be indicative of increased
levels of ravelling of the surface.
• Network maintenance management is undertaken by means of the dTIMS CT optimisation software
and a maintenance decision tree – this caters for structural soundness of the pavement and also
considers the site constraints and functional requirements of the new maintenance intervention.
• The current asphalt design methods in New Zealand (TNZ P11 & TNZ P23) optimise binder content
within the specified limits for drain-down and Cantabro durability limits. The upper limit for stone loss
in the Cantabro test is 20% and no lower limit is specified at this stage. The ITS test could be useful
for determining the low-temperature performance of an OGPA mix that is not captured in this
Cantabro test. This suggestion is based on the observation of early cracking on some of the OGPA
surfaces on the South Auckland State Highway Network.
• The ultimate life of the porous asphalt is limited by binder hardening, with failure likely to occur when
stiffness of the binder at 25°C reaches a value of between 100 and 200MPa, with an equivalent
penetration value of between 15 and 11. The corresponding OGPA mix stiffnesses are in the order of
1500MPa and 2300MPa.
• Measurement of OGPA stiffness by means of ITS testing on samples cored from the road surface was
found to be the most reliable method of determining the resilient modulus of the OGPA layer. Some
idea of the remaining life of the surfacing could be estimated by using a 20% pa increase in stiffness.
The ultimate stiffness at 25°C of between 1500MPa and 2300MPa was measured by means of ITS
testing on OGPA layers that had failed by visual standards.
• A relationship between the visual condition of the OGPA surfaces and their stiffness measurements (by
means of the ITS test) was found on the test sections on SH16. The results from the pilot study
indicated a significant variation in resilient modulus between 478MPa and 6155MPa at temperatures
ranging between 30.2°C and 5.5°C. This illustrated the effect of temperature variation on OGPA
stiffness, and highlighted the importance of care with regards to the application of these layers in
different temperature regimes. This also highlighted the fact that as the mix ages, it becomes more
prone to ravelling during cold winter periods.
• Tracking the stiffening of asphalt over time shows potential in measuring the condition of OGPA,
which could be useful in the early detection of ravelling to assist in the maintenance management of a
road network.
9 Recommendations
55
9 Recommendations
This research has resulted in the following recommendations:
• The effects of the multiple-OGPA approach in road network maintenance could be monitored by
utilising the decision-making structure proposed in figure 5.3, with the view of gradually moving away
from the multiple-OGPA approach and utilising OGPA surfacing for its functional, rather than
structural, properties.
• The downside of the inclusion of the Cantabro durability test in the design procedure is that mixes
can be designed to comply with durability requirements, but fail at low temperatures because of
excessive built-in stiffness. The ITS test could be utilised during the design process to develop a
master curve for OGPA mixes, in order to find the cold-temperature susceptibility of these mixes, and
the curve derived from the ITS testing could be used to define the lower limit of stone loss in the
Cantabro test.
• Since there is a correlation between the visual condition and the remaining life of the OGPA, a visual
survey of the pavement surface could be utilised as a management tool and for the development of a
network-wide index of visual condition.
• Further research should be undertaken to develop a condition index, based on MPD measurements of
the OGPA, which can be useful in the early detection of ravelling to assist in the maintenance
management of the network.

Performance of open graded porous asphalt in New Zealand
56
10 References
Austroads (1998) Selection & design of asphalt mixes: Australian provisional guide (APRG report no.18).
Victoria: Austroads.
Bahia, HU and K Nam (2004) Investigation into the cause of cracking of a pavement section in South Africa
(Gautrans internal report). Pretoria: Gautrans Department of Public Works.
Ball, GFA (2005) Effect of binder hardness on rate of texture change in chipseals. Land Transport NZ
research report 284. 48pp.
Danish Road Institute, Road Directorate, Ministry of Transport and Energy. Traffic management and noise
reducing pavements. Accessed 4 May 2007. www.vejdirektoratet.dk
Federal Highway Administration (2006) Quiet pavement systems in Europe. Accessed 14 May 2007.
www.international.fhwa.dot.gov
Furlong, W, TFP Henning, H White and W de Beer (2004) SASW – a method to determine pavement
composition and strength. Transfund NZ research report 254. 81pp.
Herrington, P, G Ball and S Cook (2006) Bitumen durability. Land Transport NZ research report 291. 42pp.
Herrington, P, S Reilly and S Cook (2005) Porous asphalt durability test. Transfund NZ research report
265. 32pp.
MWH New Zealand Ltd (2006) Multiple OGPA layer investigation – Phase 1. Hamilton: Transit NZ. 46pp.
Nicholls, JC (1997) Review of UK porous asphalt trials. TRL report 264. 37pp.
Oliver, JWH (2004) Prediction of the life of sprayed seals and the effect of climate, durability and seal size.
6th International Conference on Managing Pavements, October 2004, Brisbane, Australia.
Potter, JF and AR Halliday (1981) Contribution of pervious macadam surfacing to structural performance of
roads. TRRL report LR1022.
Rijkwaterstaat Ministerie van Verkeer en Waterstaat. Zoab. Accessed 13 September 2006. Rijkwaterstaat
Ministerie van Verkeer en Waterstaat, Nederland. www.rijkswaterstaat.nl
Sabha, H, J Groenendijk and AAA Molenaar (1995) Estimation for crack growth parameters and fatigue
characteristics of asphalt mixes using simple tests. Road and Railroad Research Laboratory report
7-95-209-35M.
Shahin, MY and BF McCullough (1972) Prediction of low-temperature and thermal-fatigue cracking in
flexible pavements. Center for Highway Research research report 123-14. 225pp.
Shell International Petroleum (1978) Shell pavement design manual: asphalt pavements and overlays for
road traffic. London: Shell International Petroleum.
Transit NZ (2003) TNZ/P11: 2003 Specification for open graded porous asphalt. Wellington: Transit NZ
Ltd.
Transit NZ (2005) TNZ/P23: 2005 Performance based specification for hotmix asphalt wearing course
surfacing. Wellington: Transit NZ Ltd.

10 References
57
Van der Poel, C (1954) A general system describing the visco-elastic properties of bitumens and its
relation to routine test data. Journal of Applied Chemistry 4: 221–236.
Van de Ven, MFC, KJ Jenkins and HU Bahia (2004) Concepts used for the development of bitumen
specifications. Proceedings of the 8th Conference on Asphalt Pavements for Southern Africa
(CAPSA’04), 2004.

Performance of open graded porous asphalt in New Zealand
58
Appendix A SH16 investigation
During 2005/06, MWH New Zealand Ltd undertook an investigation for the NZTA (previously known as
Transit NZ) into the performance of multiple OGPA layers on the South Auckland State Highway Network
(MWH 2006).
The 90th percentile central deflection (D0) for all test sites ranged from 0.33mm to 0.74mm. The deviation
from the mean was considered to be low, which pointed to good uniformity along the various test sites –
refer to appendix C for a visual illustration of the deflection results. The pavement deflection measured at
site B (which was on a stronger subgrade) was the lowest, with a 90th percentile deflection of 0.33mm.
Site E (which was overlaying the weakest subgrade) yielded the highest deflection of 0.74mm (90th
percentile).
The curvature function values that were derived from the deflection bowl parameters are shown below.
The low curvature values are indicative of a stiff upper pavement.
Table A.1 Summary of pavement curvature
Curvature function (mm)
Test site Min. Avg. Max. St.dev. 90th percentile
B 0.03 0.05 0.07 0.01 0.06
D 0.04 0.09 0.14 0.02 0.11
E 0.10 0.14 0.19 0.02 0.16
F 0.09 0.11 0.14 0.01 0.13
Table A.2 Summary of central deflection
Central deflection (mm)
Test site Min. Avg. Max. St.dev. 90th
percentile
Inferred
subgrade CBR
B 0.20 0.29 0.36 0.04 0.33 8
D 0.27 0.51 0.67 0.09 0.58 6
E 0.46 0.64 0.90 0.09 0.74 4
F 0.46 0.59 0.72 0.07 0.70 5
The deflection analysis is summarised in table A3 in context with the visual condition, stiffness and rut
results.

Appendix A SH16 investigation
59
Table A.3 Summary of visual condition and FWD testing
Section B D E F
Visual
assessment
Visual condition Good Poor, cracking
& ravelling
Fair, limited
cracking & ravelling
Fair, limited
cracking & ravelling
Number of OGPA layers 3 2 2 2
FWD
testing
Central deflection (90th%)(mm):
Low: D0 < 0.3
Medium: 0.3 < D0 < 0.7
High: D0 ≥ 0.7
0.33mm
Low
0.58mm
Medium
0.74mm
Medium–high
0.70mm
Medium
FWD
testing
Curvature (90th%)(mm):
Low: CF < 0.4
Medium: 0.4 < CF < 0.7
High: CF ≥ 0.7
0.06mm
Low
0.11mm
Low
0.16mm
Low
0.13mm
Low
Resilient
modulus MR 2061MPa 2329MPa 1767MPa 1884MPa
Rut
resistance Wheeltracking 2.5mm 4.0mm 2.7mm 2.3mm
The next table summarises the pavement composition on the various sites.

Performance of open graded porous asphalt in New Zealand
60
Table A.4 Summary of pavement composition at the various sites
Site B Site D Site E Site F
Description Layer depths (mm) Description Layer depths (mm) Description Layer depths (mm) Description Layer depths (mm)
OGPA (6yrs) 30 30 25 25 OGPA (8yrs) 25 25 OGPA (7yrs) 25 25 25 OGPA (7yrs) 30 25 20
Membrane Chip 10 10 10 10 Membrane Chip 10 10 Membrane Chip 10 10 10 Membrane Chip 10 10 10
OGPA (14 yrs) 30 35 27 30 OGPA (14yrs) 25 25 OGPA (14yrs) 23 25 25 OGPA (14yrs) 30 20 20
Membrane Chip 10 10 10 10 Membrane Chip 0 10 Membrane Chip 10 10 10 Membrane Chip 0 10 10
OGPA (26 yrs) 20 15 25 25 AC 30 15 Rut Fill 12 0 10 Rut Fill 10 10 10
Membrane Chip - - - - Chip 20 10 Chip 10 15 10 Chip 10 10 8
OGPA - - - - Rut fill 0 20 Rut Fill 0 0 15 Rut Fill 0 10 8
BTB 120 85 80 95 AC 20 20 Chip 15 20 15 Chip 10 15 12
AC - 25 25 - Chip 0 10 Stab 105 105 105 Chip 0 7 7
Chip - 10 7 - AC 0 30 BTB 50 30 50
Stabilised - 15 65 -
0
50
100
150
200
250
300
0
50
100
150
200
250
300
0
50
100
150
200
250
300
SITE B SITE D SITE E
OGPA
Chip
RutFill
BTB
AC
STAB
LEGENDSITE F0
50
100
150
200
250
300
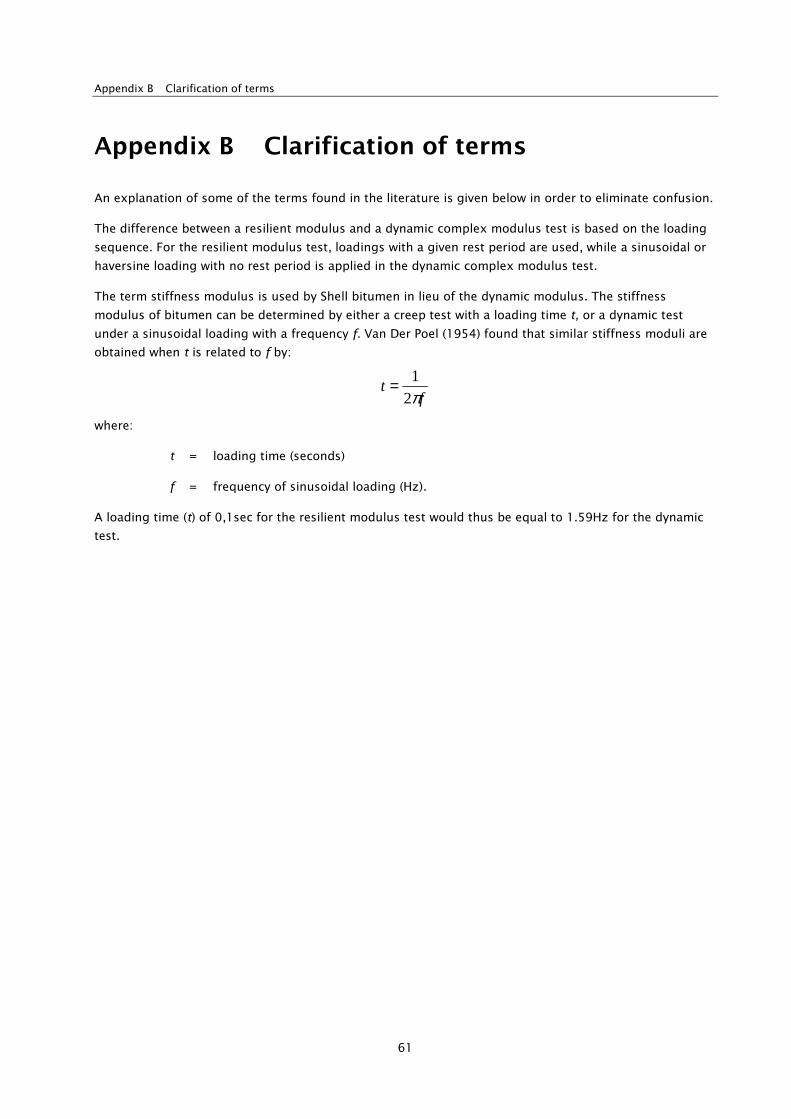
Appendix B Clarification of terms
61
Appendix B Clarification of terms
An explanation of some of the terms found in the literature is given below in order to eliminate confusion.
The difference between a resilient modulus and a dynamic complex modulus test is based on the loading
sequence. For the resilient modulus test, loadings with a given rest period are used, while a sinusoidal or
haversine loading with no rest period is applied in the dynamic complex modulus test.
The term stiffness modulus is used by Shell bitumen in lieu of the dynamic modulus. The stiffness
modulus of bitumen can be determined by either a creep test with a loading time t, or a dynamic test
under a sinusoidal loading with a frequency f. Van Der Poel (1954) found that similar stiffness moduli are
obtained when t is related to f by:
ft
π2
1=
where:
t = loading time (seconds)
f = frequency of sinusoidal loading (Hz).
A loading time (t) of 0,1sec for the resilient modulus test would thus be equal to 1.59Hz for the dynamic
test.

Performance of open graded porous asphalt in New Zealand
62
Appendix C Literature study on terminal stiffness of bitumen binder
The stiffening of the bitumen binder in asphaltic mixes has been the focus of several worldwide studies.
Terminal stiffness values at which failure generally occurs are available from the following publications:
• Bitumen durability – LTNZ research report 291 (Herrington et al 2006)
This study reported bitumen failure moduli ranging between 50 and 150MPa, with an average of
100MPa for New Zealand bitumen (Safaniya bitumen).
• Review of UK porous asphalt trials – TRL report 264 (Nicholls 1997)
This report refers to a terminal penetration value (on recovered binder) of 15Pen for bitumen binders
in OGPA layers. It is interesting to note that a binder penetration of 15Pen at 25°C is equivalent to a
binder stiffness of 100MPa. The study also found that the critical binder penetration remains at 15Pen,
irrespective of the presence or type of modifier.
• Effect of binder hardness on rate of texture change in chipseals – LTNZ research report 284 (Ball
2005)
The focus of this study was to determine the binder stiffness on old seals at the point at which failure
occurred. The project was based on binder stiffness measurements by means of a Dynamic Shear
Rheometer (DSR) on binder recovered from the seal chip. Sample preparation for this test is very
complex. The results confirmed a terminal binder stiffness value of 100MPa.
Oliver (2004) also investigated binder stiffness in chipseals in Australia and found no significant
difference in the viscosity of the bitumen after eight years in the field.
• Investigation into the cause of cracking of a pavement section in South Africa – Gautrans
internal report (Bahia and Nam 2004)
A study that was undertaken in the US on continuously graded asphalt that failed prematurely on a
high-profile project in South Africa yielded the following results using the DSR on the recovered
binder.
Table C.1 Results of DSR test
Sample
reference
Temp
(°°°°C)
Frequency
(Hz)
Phase angle
(degrees)
Complex modulus
(MPa) Notes
Ch150 25 9.65 10.0 217 Failed section
Ch150M 25 9.65 11.7 162
ND32 25 9.65 45.0 12
ND38 25 9.65 47.5 10
SB 25 9.65 39.3 22
SBM 25 9.65 42.5 17
NB 25 9.65 21.6 74
The results show that the stiffness of the binder retrieved from the failed section (Ch150 and Ch150M)
was much higher than that of the other sections. This result was confirmed by the low phase angle
values of the stiffer binder.

Appendix C Literature study on terminal stiffness of bitumen binder
63
This study concluded that a high level of thermal stress build-up could be expected within the
bitumen because of these high stiffness values, and that stress relaxation would not be possible,
owing to the low phase angles measured on the samples. These properties could also result in fatigue
damage to the mix.
C1 Discussion
In simple terms, it can be concluded that the bitumen samples that were tested had stiffened to a point
where brittle failure would occur.
Stiffness varies with the grade of binder and (if modified) the degree of modification. Other factors – such
as the source of the binder and whether the bitumen was overheated during processing in the
manufacture of the asphalt mix – also contribute to the ageing/stiffening process.
The penetration/stiffness can be determined by extracting binder from core samples taken from the road
surface. The penetration/stiffness of the binder in future years can then be estimated by assuming a
cumulative increase of 20% per year (Nicholls 1997). Ultimate failure is likely to occur rapidly after the
binder penetration has fallen below 15Pen, or the stiffness has increased to a value in excess of 100MPa.
Considering the amount of research that has been undertaken, as described in the above publications, an
attempt was made to obtain a common denominator from the conclusions reached by all these studies.
Since the publication of the Shell nomographs (Shell 1954) (which are used to derive the stiffness modulus
of an asphalt mix), many research projects have been undertaken to develop tools that can be used to
estimate the complex or stiffness modulus of bitumen in relation to bitumen type. The type of bitumen is
described in terms of its ‘penetration index’ (PI), ‘pen’ and ‘ring-and-ball softening point’ (TR&B).
Since the Van der Poel nomograph (Van der Poel 1954) cannot be used to accurately define the binder
stiffness, several researchers have developed equations that allow a more accurate estimate of stiffness.
Some of these equations have been developed by Shahin (1972) and validated at the Delft University
(Sabha et al 1995). They are:
If:
MPaSbit 301010 8 −≤<−
TPItTTtTSbit *00661.0log00138.000038.0log90251.006743.035927.1log 102
1010 +−+−−−=
(Equation C1)
where
Sbit = bitumen stiffness (in 0.1MPa)
T = test temperature minus TR&B (°C)
T = loading time (sec), t >0.2
PI = penetration index.
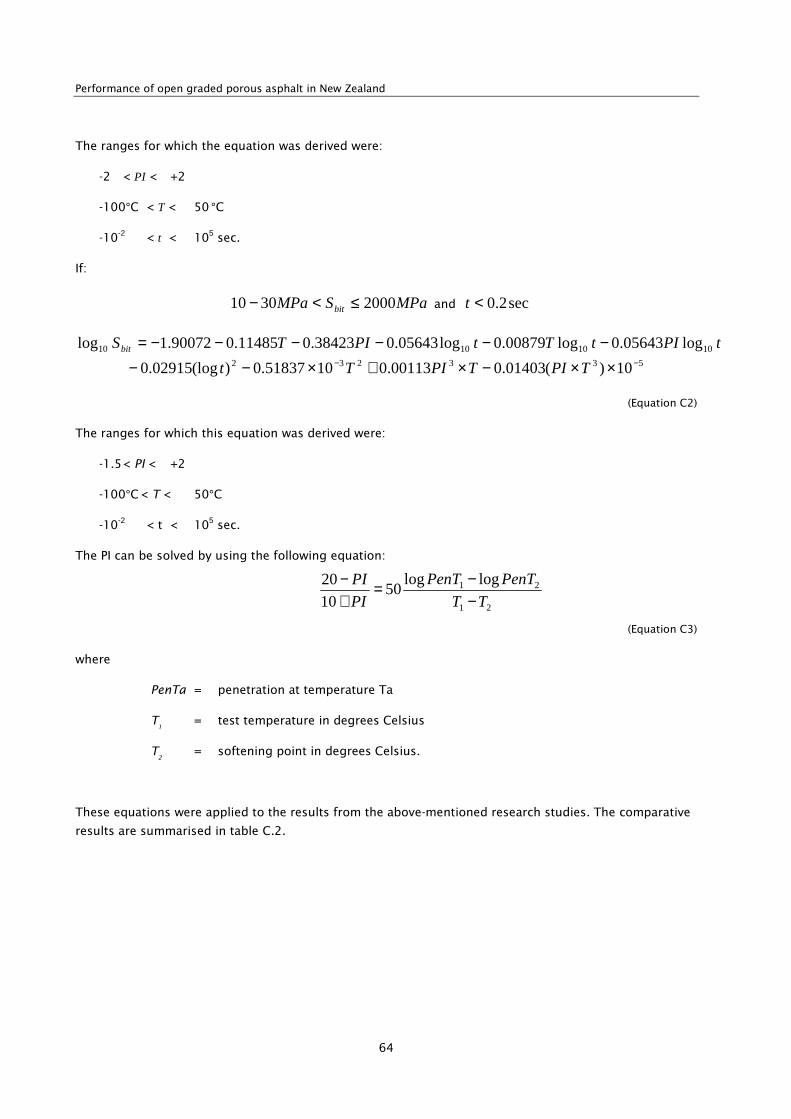
Performance of open graded porous asphalt in New Zealand
64
The ranges for which the equation was derived were:
-2 < PI < +2
-100°C < T < 50 °C
-10-2
< t < 105 sec.
If:
MPaSMPa bit 20003010 ≤<− and sec2.0<t
tPItTtPITSbit 10101010 log05643.0log00879.0log05643.038423.011485.090072.1log −−−−−−=533232 10)(01403.000113.01051837.0)(log02915.0 −− ××−×+×−− TPITPITt
(Equation C2)
The ranges for which this equation was derived were:
-1.5 < PI < +2
-100°C < T < 50°C
-10-2
< t < 105 sec.
The PI can be solved by using the following equation:
21
21 loglog50
10
20
TT
PenTPenT
PI
PI
−−=
+−
(Equation C3)
where
PenTa = penetration at temperature Ta
T1 = test temperature in degrees Celsius
T2 = softening point in degrees Celsius.
These equations were applied to the results from the above-mentioned research studies. The comparative
results are summarised in table C.2.

Appendix C Literature study on terminal stiffness of bitumen binder
65
Table C.2 Comparative results
Sample
reference
Temp
(°°°°C)
Freq
(Hz)
Phase
angle
Complex
modulus
(MPa)
Material
type
Road
condition PI TR&B Pen SBit
Ch150 25 9.65 10.0 217 Recovered
binder Failed 0.05 75 11 217
Ch150M 25 9.65 11.7 162 Recovered
binder Failed 0.5 75 11 162
ND32 25 9.65 45.0 12 Bitumen Sound -0.6 48 80 11
ND38 25 9.65 47.5 10 Bitumen Sound -0.5 48 80 10
SB 25 9.65 39.3 22 Bitumen Sound 0.1 53 60 22
SBM 25 9.65 42.5 17 Bitumen Sound 0.7 53 73 17
NB 25 9.65 21.6 74 Recovered
binder Moderate 0.8 70 19 72
TRL264 25 10 NA 100 Recovered
binder Failed 0.4 70 15 99
LTNZ291 - - NA 50–150 Recovered
binder Failed - - - -
Safaniya
180/200 Pen 0 9 NA 38 Bitumen - 1.5 43 200 37
The above table represents measured stiffness values (complex modulus) of recovered binders and
retained bitumen samples, and represents bitumen used in South Africa (reference Ch150, Ch150M,
ND32, ND38, SB, SBM, and NB), bitumen used in Britain (TRL264), bitumen used in New Zealand (LTNZ
291), and Safaniya 180/200 bitumen.
The equations that were used to calculate the binder stiffness present a good fit to the stiffness values
published in the various studies, and are therefore proposed instead of the Van der Poel nomographs to
predict the terminal stiffness for non-modified bituminous binders in OGPA mixes.
Since the stiffness of the bitumen binder can now be calculated, a relationship between this stiffness value
and that of an asphalt mix is required. For this purpose, it is proposed that the Shell nomographs be used
in order to arrive at the ultimate stiffness, or stiffness at failure, for an OGPA mix. Inputs required for this
nomograph include binder stiffness and the volumetric properties of the mix.
The binder properties of the samples retrieved from the failed sections in the above table (Ch150 and
CH150M) were used to predict the ultimate stiffness at which the OGPA mix would show signs of cracking
and ravelling. In order to compare the measured stiffness of the OGPA samples extracted from the road
against the laboratory-prepared samples, the predicted failure stiffness at similar loading times were used
as for the ITS test.
The equation proposed by Sabha (1995) for the calculation of bitumen stiffness allows for the variation of
the temperature at which the binder stiffness is required (or the test temperature). This allows the
calculation of the mix stiffness for specific binder properties, allowing for the loading time and variation in
test temperature.

Performance of open graded porous asphalt in New Zealand
66