Embed Size (px)
Citation preview

CFA Research Challenge 2015
Page | 1
Price: $13.09 Target Price: $15.20
Analyst Rating: BUY Outperform
Market Cap: $248.3M Date: 03/06/2015
Summary:
We recommend a buy rating for BREW for a number of reasons, key among them is our
valuation of the brand. With very low debt and a continuing focus on expanding the brand
without over-leveraging their assets, BREW is positioning themselves to capture a large
part of the growing craft beer market. Another key aspect of our valuation of BREW is a
32% stake held by BUD in the company, which may point to an eventual acquisition of
BREW by BUD; thereby increasing shareholder value. The following sections will solidify
and elaborate upon our viewpoints.
Overview:
Craft Brew Alliance, Inc. (BREW), formerly known as the Craft Brewers Alliance
(HOOK), is an independent craft brewing company that was formed through the merger of
Pacific Northwest craft brewers – Widmer Brothers Brewing and Redhook Ale Brewery –
in 2008. Today, BREW is comprised of five unique craft beer and cider brands:
Redhook Ale Brewery founded by Gordon Bowker and Paul Shipman in 1981 in
Seattle, Washington;
Widmer Brothers Brewing founded by brothers Kurt and Rob Widmer in 1984 in
Portland, Oregon;
Kona Brewing Co. founded by father and son team Cameron Healy and Spoon
Khalsa in 1994 in Kona, Hawaii;
Omission Beer, internally developed by Craft Brew as the first beer brand
specially crafted to remove gluten; and
Square Mile Cider Company, the first non-beer brand family created by Craft
Brew Alliance, and launched in 2013.
Market Profile
As of 3/05/2015
Price Per Share 13.09
52 - Week Price Range $10.07 - 17.89
Average Daily Volume 50,588.00
% of Float 11.09%
Market Cap 248.3 Mil
Enterprise Value 268.4 Mil
Shares Outstanding 19.1 Mil
Beta 1.21
P/E 83.38
P/E – Forward 25.10
EPS – Basic 0.16
P/S 1.28
P/B 2.10
Gross Profit Margin (2014) 29.35%
Operating Margin (2014) 2.85%
ROA (2014) 1.72%
ROE (2014) 2.67%
EV/EBITDA (2014) 18.69
One Year Price Index
BREW Results Year Ended December 31, 2013
Beer
Related Pubs
and Other
Total
Net sales $ 154,830 $24,350 $179,180 Gross margin 30.4% 13.2% 28.1%
PRICE TARGET ANALYSIS
LTM NTM
Current 12.51
8
10
12
14
16
18
20
1Y Rel. Performance: -33.9% BREW Bmrk
Mar Apr May Jun Jul Aug Sep Oct Nov Dec Jan Feb0
0.5

CFA Research Challenge 2015
Page | 2
Today, as an independent craft brewer, BREW possesses several distinct advantages, unique in the craft beer category. These
advantages derive from the combination of: a portfolio of distinct craft beer and cider brands; an evolving national footprint with
national sales and marketing reach; expertise in developing partnerships and growth strategies; a leadership team with significant beer
and growth-company expertise; proven ability to manage brand lifecycle; and a successful track record managing mergers and
acquisitions. The company’s sales generally reflect a degree of seasonality, with the first and fourth quarters historically exhibiting
low sales levels compared to the second and third quarters mainly due to the fact that people tend to drink more beer in the spring and
summer months.
BREW employs approximately 745 people, including 355 employees in the pubs and retail stores, 210 employees in production, 115
employees in sales and marketing, and 65 employees in corporate and administration.
Contract Brewing Operations
Memphis City Brewery
Memphis, Tennessee, 2014-Present
BREW contracted with this new location in July 2014 to perform contract brewing operations within the central part of the United
States. This new partnership will help to improve gross margin by bringing brewing capability closer to growing markets, while
alleviating emerging capacity constraints within the Portsmouth, New Hampshire brewery driven by growth in the east region and
internationally. BREW has big plans for the future with this contract brewing location to include the use of the facility to brew and
ship to the southern and
southeastern region of the United
States. BREW believes that by
contracting with the brewery rather
than buying the facilities, they
have a distinct advantage over
competitors who are choosing to
buy new facilities that cost a lot of
money and don’t meet the
expected return of investors.
Appalachian Mountain Brewery (TKR: HOPS)
Boone, North Carolina, January, 2015-Present
This strategic partnership was formed when HOPS was competing in a craft brewing competition in New England that BREW was
sponsoring. BREW and HOPS worked together to create a craft beer for the competition and realized that they worked well together
and they shared a similar culture. This led to the eventual announcement of the strategic partnership between BREW and HOPS. This
has raised some questions as to why BREW chose to partner with HOPS. North Carolina is ranked 22nd among all states in craft beer
sales according to the Brewer’s Association. However according to BREW, North Carolina is among their top ten states in craft beer
sales within their distribution network. We feel the partnership will add value through reduced shipping costs and the added ability to
put BREW beer in cans by utilizing the new canning line owned by HOPS.
Brewpub Locations
Woodinville, Washington
Seats: 430, 10,000 Sq. Ft.
Serving 540,000/Yr.
The Redhook Brewpub is a brewery hosting tours & activities, plus a pub serving casual eats
in a warehouse-like space. According to the Brewer’s Association, Oregon and Washington
are the top two craft beer sales states in the country. So when tourists come to Seattle, they can
visit the brewery to take a tour and eat at the brewpub that is attached to the brewery. On tap at
Redhook Brewpub are a variety of the different beers that Redhook offers as well as any new
Year Ended
December 31, 2014 Shipments 2013 Shipments
Increase
(Decrease)
%
Change
Change in
Depletions(1)
A-B and A-B related 766,600 708,100 58,500 8.3% 7%
Contract brewing and beer
related(2) 52,700 37,100 15,600 42.0%
Pubs 10,900 11,400 (500) (4.4)%
Total 830,200 756,600 73,600 9.7%
Source: BREW 10K 2014
Current Annual Maximum Annual Percent of Percent of
Production Breweries Square Footage Capacity Capacity
Max Capacity Total Capacity
Oregon Brewery 185,000 630,000 650,000 96.92% 47.73%
Washington Brewery 128,000 220,000 280,000 78.57% 16.67%
New Hampshire Brewery 125,000 215,000 280,000 76.79% 16.29%
Hawaiian Brewery 11,000 10,000 10,000 100% 0.76%
Memphis Brewery 100,000 100,000 100% 7.58%
1,175,000 1,320,000

CFA Research Challenge 2015
Page | 3
beers that are being offered to patrons as demos. Redhook Brewpub accounts for 35% of the pub related revenue which is equal to
$9.282 million.
Portland, Oregon
Seats: 165, 5,000 Sq. Ft., Serving 207,000/Yr.
Widmer Brothers Pub is located in downtown Portland and is where the Widmer Brothers,
Rob and Kurt, began their legacy. When people visit the pub they are able to try a variety of
different flavors from the Widmer Brothers. On some occasions, guests can even receive a tour
from Rob or Kurt Widmer themselves. Widmer Brothers Brewery is well known for their
Hefeweizen beer, the leader in production and distribution among all of BREW’s portfolio of
brands. Widmer Brothers Pub accounts for 13.5% of pub related revenue which is equal to
$3.558 million.
Kona, Hawaii
Seats: 215, 7,500 Sq. Ft., Serving 314,000/Yr.
Kailua-Kona on Hawaii’s Big Island is the site of Kona Brewing Company’s brewery and first
restaurant. The brewpub opened in November 1998. The 2,000-square foot outdoor lanai,
surrounded by lush tropical vegetation and tiki torches, offers seating for 175 patrons.
Customers also can enjoy a cool meal or beverage inside the air-conditioned bar area at one of
several surrounding tables or at the koa U-shaped bar itself. Inside the bar area is the retail store,
stocked with colorful T-shirts, hats, towels, coasters, mugs and other products. The Kailua-Kona
accounts for 20.5% of pub related revenue which is equal to $5.397 million.
Hawaii Kai, Hawaii
Seats: 275, 7,000 Sq. Ft., Serving 211,000/Yr.
In December 2003, Kona Brewing Company opened its second restaurant location at Koko
Marina Center in Hawaii Kai on Oahu. The approximately 7,000-square-foot restaurant is set
on the docks of Koko Marina, offers seating for 275 patrons and features a state-of-the-art beer
delivery system with 24 taps. Ample outdoor seating with unparalleled views of Koko Marina
and the lush green mountains that form Hawaii Kai’s backdrop are also available. Koko Marina
accounts for 13.77% of the pub related revenues which is equal to $3.267 million.
Portsmouth, New Hampshire
Seats: 270, 10,250 Sq. Ft., Serving 260,000/Yr.
Built in 1996, Redhook’s brewery in Portsmouth, NH was established to provide East Coasters
the same quality and fresh Redhook that loyal drinkers on the West Coast were accustomed to
for years. Located in the Pease Tradeport in Portsmouth, the brewery boasts the same
architectural style as its Woodinville, WA brother, which was influenced by the brew houses of
Bavaria. The expansive grounds are home to many events and festivities during the summer
months, including the popular Redhookfest, usually held in August, which has hosted musicians
such as Donovan Frankenreiter and Blues Traveler. The Portsmouth location accounts for
16.97% of pub related revenue which is equal to $4.469 million.
Ownership Structure
Anhueser-Busch International Beverage Co. (Ticker: BUD)-32%
BUD was distributing beer for both Redhook and Widmer Brothers Breweries prior to the
companies becoming publicly traded. Due to the structure of the merger of Redhook and Widmer
Brothers, BUD took a majority stake in BREW when the company went public on July 1, 2008.
The Exchange Agreement was entered into as part of a recapitalization in which BREW
redeemed preferred shares of stock held by BUD from Redhook and Widmer Brothers in
exchange for cash and common stock in the newly formed Craft Brew Alliance, Inc. As a result,
BUD holds 32.0% of BREW’s outstanding shares of common stock as of December 31, 2013.
The BUD Distributor Agreement provides for the distribution of Kona, Widmer Brothers, Redhook, Omission and Square Mile in all
states, territories and possessions of the United States. BREW is responsible for marketing its products to BUD’s wholesalers, as well
as to retailers and consumers. The BUD Distributor Agreement has a term that expires on December 31, 2018.
Source: Company

CFA Research Challenge 2015
Page | 4
The Exchange Agreement entitles BUD to designate two of six board members on BREW’s Board of Directors. BUD also generally
has the right to have a designee on each committee of the board of directors. The Exchange Agreement contains limitations on
BREW’s ability to take certain actions without BUD’s prior consent, including, but not limited to, its ability to issue equity securities
or acquire or sell assets or stock, enter into certain transactions with affiliates, distribute its products in the United States other than
through BUD, or voluntarily terminate BREW’s listing on the Nasdaq Stock Market.
Widmer Brothers- 12%
The Widmer Brothers were the original founders and current owners of Widmer Brothers Brewery.
Due to the terms of the merger, Rob and Kurt Widmer have a 12% equity stake in BREW following
the acquisition of Kona Brewing Company in 2010. Rob and Kurt remain a vital component of the
management team due to their many years of experience.
Kona Founders- 10%
The founders of Kona Brewing Company, Cameron Healy and Spoon Khalsa, have been given a 10%
equity stake as part of an agreement to be a part of BREW. The shares were allotted by the Widmer
Brothers in order to entice the company to agree to the partnership and allow BREW to make and
distribute their beer. All rights to the Kona names and the formulas were retained through the
acquisition, allowing BREW to add more beer to an already thriving portfolio.
Management and Board Members- 3%
The Management team and the Board of Directors are among the larger shareholders. They comprise
3% of the company’s ownership. The structure of the company makes it difficult for management and
board shareholders to have a strong voice, as the majority of the stock is in the hands of the
ownership and BUD.
Public Minority- 43%
The public minority group represents the amount of stock available to the public for trading within
the NASDAQ stock market. This makes up less than half of the company’s stock which poses a
potential risk for those investors that are in the minority public. BREW public minority investors
have less than a 50% say in the decisions of the company.
Industry Background
BREW is a brewer in the craft segment of the U.S. beer brewing industry. The domestic beer market
includes ales and lagers produced by large and small domestic and international brewers. Craft
brewers are defined as beer companies that produce less than 6 million barrels of beer per year by the department of alcohol, tobacco,
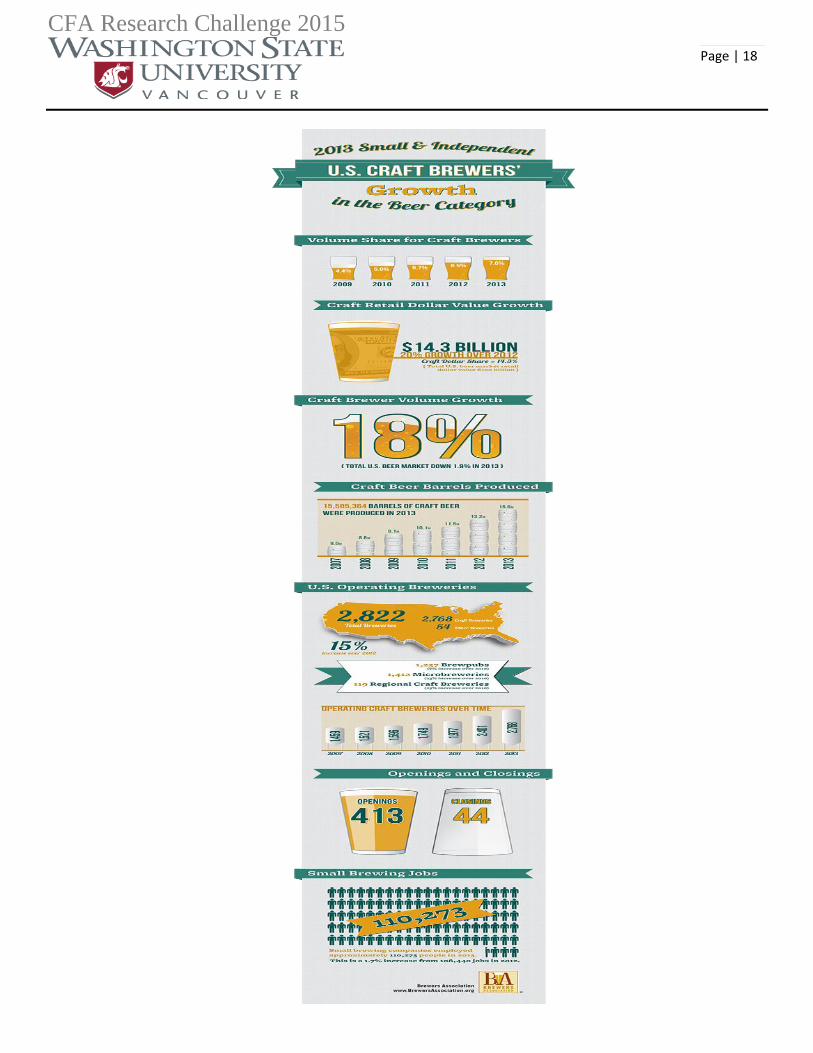
and firearms. Shipments of craft beer in the U.S. are estimated by industry sources to have increased by approximately 15.5% in 2013
over 2012 and by 15.4% in 2012 over 2011. The overall domestic market experienced a decrease of 2.0% in 2013, but the craft beer
segment continued its strong growth and has captured market share from the rest of the domestic market. This trend is forecast to
accelerate in the next 12 to 18 months.
Craft beer shipments in 2013 and 2012 were approximately 7.5% and 6.4%, respectively, of total beer shipped in the U.S.
Approximately 15.3 million barrels and 13.2 million barrels, respectively, were shipped in the U.S. by the craft beer segment during
2013 and 2012, while total beer sold in the U.S., including imported beer, was 205.2 million barrels and 207.9 million barrels,
respectively. Twenty years ago, Redhook and Widmer Brothers Breweries were two of the approximately 200 craft breweries in
operation. By the end of 2013, the number of craft breweries in operation had grown to 3,699. The recent competitive environment has
been characterized by three trends: the number and diversity of craft brewers have significantly increased, Crown (i.e. Corona) has
emerged as a significant player in imports with its brewing capacity in Mexico. In 2013, according to industry sources, BUD and
MillerCoors (TAP) accounted for more than 74% of total beer shipped in the U.S., excluding imports. In addition, BUD and TAP have
invested in existing smaller craft breweries (recent acquisition of 10-Barrell and Elysian by BUD) and created separate craft-focused
divisions in an effort to capitalize on the growing craft beer segment.
Industry Market
Capitalization
Source: Tully & Holland Report

CFA Research Challenge 2015
Page | 5
Competitive Advantages
Gluten Free Beer Market
According to BREW’s investor presentation approximately 29% of US Adults prefer gluten free
products. Consumer trends are moving toward healthier lifestyles and recent studies have shown that
there is a chemical called gluten that is in a lot of products and has proven to be unhealthy for people
who have a disease called celiac in long term medical studies. According to company sources, there
has been a 34% growth in the gluten free beer market from 2013-2014 and the market is expected to
continue to grow by double digits for the coming years through 2020.
Gross Profit of 35% by 2017
Craft Brew Alliance believes that they are positioning themselves to be ready for the saturated market
to start merging. BREW has expanded brewing operations in 2014 in order to create lower logistical
costs which is a huge cost driver for the company, shipping from Tennessee to Texas for $10 a barrel
instead of $30 a barrel from New Hampshire. BREW has also increased its product prices by 1.5% in
2013, and plans to increase the price by another 1.5% which will add to the gross margin by surpassing
inflation. BREW is expected to report a gross margin of 28.4% in 2014 according to the preliminary
results from the 8-K on February 6, 2015, which is a 1.3% increase from 2013 gross margin. We believe that BREW will see higher
growth in 2015 due to the decrease in shipping costs and expansion to the southeast and eastern coast of the United States while still
continuing to expand operations internationally.
Margins were key to BREW's fourth quarter performance. Craft beer manufacturers are able to sell their product at a much higher
price point, while only adding incremental costs of goods. The relationship ultimately drives up gross margins. However, craft brewers
still struggle to eke out any net profit margin.
Small scale breweries just do not have the scale and size necessary to own their supply chain from brewery to consumer like the
industry titans do. Rather, craft brewers buy these services from the large scale beverage distributors. Additionally, the administrative
expenditures such as marketing and sales still consume a larger percentage of their margins. BREW's key strategy initiative to unite
brands helps improve profit margin. They can scale administrative efforts, and leverage size to begin to consolidate portions of the
supply chain.
As a holding company of multiple brands, BREW can also achieve better financial results as the company grows in size. As BREW
grows, they can focus efforts on driving up EBITDA, which drives down leverage ratios, and enables them to carry more debt in the
future than a single small scale brewery ever could. The ability to invest $15.8 million in capital expenditures in 2014, compared to
$9.9 million in 2013, could result in 60% growth of EPS.
Anheuser-Busch International Distribution Network
With limited exceptions, all brewers in the United States are required to sell their beers to independent wholesalers, who then sell the
beers to retailers. BREW is the only independent craft brewer in the U.S. to have established a wholly streamlined distribution
network through its partnership with BUD. This partnership provides a national distribution presence, which results in both a highly
effective distribution presence in each market and the administrative efficiencies which result from the unencumbered approach
they’ve taken. Because of this partnership, BREW’s products are distributed in all 50 states. Management believes that their
competitors in the craft beer segment generally negotiate distribution relationships separately with wholesalers in each locality and, as
a result, typically distribute through a variety of wholesalers representing differing national beer brands with uncoordinated territorial
boundaries. In 2013 and 2012, they sold approximately 708,100 barrels and 660,000 barrels, respectively, to the wholesalers in BUD’s
distribution network through the BUD Distributor Agreement, accounting for 93.6% and 91.0%, respectively, of their shipment
volume for the corresponding periods.
Brand Awareness
BREW has some of the most well-known beer brands in the world, from Redhook’s ales to Widmer’s Hefeweizen building brand
awareness is a critical component of BREW’s strategy. Kona also tries to offer consumers a little piece of Hawaii with their
Longboard IPA. According to Hawaiian Tourism Authority statistics, nearly eight million people visit Hawaii every year. By offering
a beer that is common in Hawaii to other markets, Kona believes that this will allow consumers to revisit the relaxing experience
enjoyed by many in Hawaii. Omission beer is a popular beer among gluten free enthusiasts boasting a market share of 43.3% in the
gluten free beer industry.
Source: Company

CFA Research Challenge 2015
Page | 6
Relatively Low Debt
BREW has been diligent about making sure that they continue growth without taking on excessive debt. The debt coverage ratio of
2.88 shows that the firm has the ability to pay back debt almost three times over. According to Fact Set data BREW also has a
Debt/Capital ratio of 10.1 with an interest coverage ratio of 13.77. This shows that BREW does not have a lot of debt and that the
company has a low interest rate on the existing debt. Having low debt gives the company financial flexibility to continue to grow.
Nationwide sales activation
The management team at BREW believes that through robust partnerships with leading retailers such as Buffalo Wild Wings,
Safeway, and Costco, the company can achieve geographic expansion. BREW leverages national sales and marketing capabilities and
complementary brand families to create a unique identity in the distribution channels and with the consumer. BREW’s sales force calls
on all retail channels nationally, including grocery, drug and convenience stores, something most other craft brewers are not able to
do.
Risk Analysis
BREW has a continuing relationship with BUD and the current distribution network that would be
difficult to replace.
Substantially all of BREW’s products are sold and distributed through BUD’s distribution network. If
the BUD Distributor Agreement were terminated, BREW would be faced with a number of
operational tasks, including establishing and maintaining direct contracts with the existing wholesaler
network or negotiating agreements with replacement wholesalers on an individual basis, and
enhancing their credit evaluation, billing and accounts receivable processes. Such an undertaking
would require significant effort and substantial time to complete, during which the distribution of
their products could be impaired. This would have a significant impact on the future free cash flows
as BREW would lose revenue and incur more costs in order to obtain a new partnership.
The agreements with BUD may limit BREW’s ability to engage in certain activities and
investments.
The Exchange Agreement requires BREW to obtain BUD's consent prior to undertaking certain
activities and investments. For example, BREW must obtain BUD's consent before acquiring another brewer if the purchase price
exceeds $30 million or to purchase a non-brewing entity if the purchase price exceeds $2 million. If BUD opposes strategic or
financial investments proposed by management, BUD may decline to give its consent to activities or investments that management
believes are in the best interest of shareholders. This poses a huge risk for investors and could have a significant impact on future
trading activity. This will create disparity in future valuation of the company.
BUD has an influential voice in decisions of the board of directors and shareholders.
BUD owns 32.0% of outstanding common stock, which makes BUD majority shareholder. Under the Exchange Agreement, BUD
may designate two nominees to the board of directors as non-voting observers. This gives BUD an influential voice in board and
shareholder deliberations. Additionally, BUD has acquired craft breweries in the past and may in the future, and has also launched
similar style beers which increases the direct competition between the companies. This can have a significant impact on the future
valuation of the stock because if the company is to be bought out by BUD, it would be at a premium which would give shareholders a
significantly high return.
Sales are concentrated in the Pacific Northwest and California.
Approximately 55% of sales in 2013 were in the Pacific Northwest and California and, consequently, future sales may be adversely
affected by changes in economic and business conditions within these areas. These regions are among the most competitive craft beer
markets in the United States, both in terms of number of market participants and consumer awareness. The Pacific Northwest and
California offer significant competition to BREW’s products, not only from other craft brewers but also from wine producers and
flavored alcohol beverages. With the introduction of marijuana as a new competitor on the west coast, the future impact of the stock is
uncertain. Speculation has been made as to whether or not the beer market will be impacted by this but recent information is showing
minimal impact on sales.
Dependent on certain suppliers for key raw materials, packaging materials and production inputs.
Although BREW seeks to maintain back-up and alternative suppliers for all key raw materials and production inputs, they are reliant
on certain third parties for key raw materials, packaging materials and utilities. Any disruption in the willingness or ability of these
third parties to supply these critical components could hinder BREW’s ability to continue production of their products, which could
Dollar Share Gluten Free
Beer Market
Source: Company

CFA Research Challenge 2015
Page | 7
have a material adverse impact on their financial condition, results of operations and cash flows. This will have a strong negative
impact on the future value of the business because if the business can’t continue to operate normally, the revenues will decline and
shareholders will start selling the stock and the market value will decrease.
If BREW is unable to gauge trends and react to changing consumer preferences in a timely manner, sales and market share will
decrease.
The costs and management attention involved in maintaining an innovative brand portfolio have been, and are expected to continue to
be, significant. If BREW has not gauged consumer preferences correctly, or is unable to maintain consistently high quality beers as the
brand portfolio expands, the overall brand image may be damaged. If this were to occur, future sales, results of operations and cash
flows would be adversely affected. There is minimal chance that this will occur as BREW has a panel of taste testers that are continuously
striving to only send out the very best beer. If this were to occur, it would have a significant impact on the valuation of the company and
its future cash flows.
Increased competition could adversely affect sales and results of operations.
BREW competes in the highly competitive craft brewing market, as well as in the much larger specialty beer category, which includes
the imported beer segment and fuller-flavored beers offered by major national brewers. There is also increasing competition from
producers of wine, spirits, flavored alcohol beverages, and marijuana offered by the larger spirit producers, national brewers, and
growers. Increased competition could cause future sales and results of operations to be adversely affected which will have a strong
negative impact on the future valuation of the company.
Craft brewing business is sensitive to reductions in discretionary consumer spending.
Consumer demand for luxury or perceived luxury goods, including craft beer, can be sensitive to downturns in the economy and the
corresponding impact on discretionary spending. Changes in discretionary consumer spending or consumer preferences brought about
by factors such as perceived or actual general economic conditions, job losses and the resultant rising unemployment rate, perceived or
actual disposable consumer income and wealth, and changes in consumer confidence in the economy, could significantly reduce
customer demand for craft beer in general, and the products BREW offers specifically. Furthermore, consumers may choose to replace
craft beer products with the fuller-flavored national brands or other more affordable, although lower quality, alternatives available in
the market. Any such decline in consumption of craft beer products would likely have a significant negative impact on operating results
and the value of the firm’s operations.
Changes in consumer preferences or public attitudes about alcohol could decrease demand for craft beer.
If consumers were unwilling to accept craft beer or if general consumer trends caused a decrease in the demand for beer, including craft
beer, it would adversely impact sales and results of operations. There is no assurance that the craft brewing segment will continue to
experience growth in future periods. If the markets for wine, spirits, flavored alcohol beverages, or marijuana continue to grow, this
could draw consumers away from the beer industry in general and craft beer products specifically and have an adverse effect on sales
and results of operations. Further, the alcoholic beverage industry has become the subject of considerable societal and political attention
in recent years due to increasing public concern over alcohol-related social problems, including drunk driving, underage drinking and
health consequences from the misuse of alcohol. As an outgrowth of these concerns, the possibility exists that advertising by beer
producers could be restricted, that additional cautionary labeling or packaging requirements might be imposed or that there may be
renewed efforts to impose, at either the federal or state level, increased excise or other taxes on beer sold in the United States. If beer in
general were to fall out of favor among domestic consumers, or if the domestic beer industry were subjected to significant additional
governmental regulation, it would likely have a significant adverse impact on BREW’s financial condition, operating results and cash
flows. This would cause the company to likely sell for a discount and shareholders would lose money.
Competitive Analysis
Overview
BREW competes in the craft brewing market as well as the much larger alcoholic
beverage market. The new entrant into the competitive landscape is marijuana which
was legalized in Washington and Colorado in 2014 and is becoming legal in Oregon
and Alaska in 2015. The larger alcoholic beverage market includes domestic and
imported beers, flavored alcoholic beverages, spirits, wine and ciders. The craft beer
segment is becoming increasingly competitive due to the proliferation of small craft
brewers, including contract brewers, and the large number of products offered by such
brewers. Craft brewers have also encountered more competition as their peers expand
distribution. Competition also varies by regional market depending on the local market
preferences and distribution. BREW has encountered strong competition from
CFA Research Challenge 2015
Page | 8
microbreweries, regional specialty brewers and several national craft brewers.
Because of the large number of participants and number of different products
offered in this segment, the competition for packaged product placements and
especially for draft beer placements in bars and restaurants has intensified and will
continue to intensify going forward. Although a few of these competitors distribute
their products nationally and have greater financial resources than BREW, we
believe that the company possesses certain competitive advantages, including
BREW’s broad array of brand offerings and the scale of its production breweries.
Imported Beer
BREW also competes against imported brands, such as Heineken (HINKY),
Corona, and Guinness. These foreign brewers have significantly greater financial
resources than BREW. Although imported beers currently account for a greater share of the U.S. beer market than craft beers, we
believe that craft brewers possess certain competitive advantages over some importers, including lower transportation costs, no
importation costs, proximity to and familiarity with local consumers, and a higher degree of product freshness. In response to the
growth of the craft beer segment, most of the major domestic national brewers have introduced fuller-flavored beers. While these
product offerings are intended to compete with craft beers, we believe that distribution and consumer education and awareness of craft
beers will ultimately contribute to further growth of this industry segment.
Wine and Spirits
Competition for consumers of craft beers has also come from wine and spirits. Growth in this segment appears to be attributable to
competitive pricing, television advertising, increased merchandising and increased consumer interest in wine and spirits. Recently, the
wine industry has been aided, on a limited basis, by its ability to sell outside of the three-tier system, allowing sales to be made
directly to the consumer. While the craft beer segment competes with wine and spirits, it also benefits from many of the same
advantages enjoyed by wine and spirit producers including consumers who allow themselves affordable luxuries in the form of high
quality alcoholic beverages.
Marijuana
A significant portion of BREW’s sales continues to be in the Pacific Northwest and in California, which we believe are among the
most competitive craft beer markets in the United States, both in terms of number of participants and consumer awareness. We believe
that these areas offer significant competition for BREW’s products, not only from other craft brewers but also from the emerging
marijuana market. Marijuana distribution centers have been opening in Washington drawing consumers from the beer segment. We
believe that the same will happen in the coming years in Oregon and eventually California. BREW’s distribution advantages should
help the company expand more quickly out of this competitive regional market, but even with more diversified distribution, the
competition will never really dissipate.
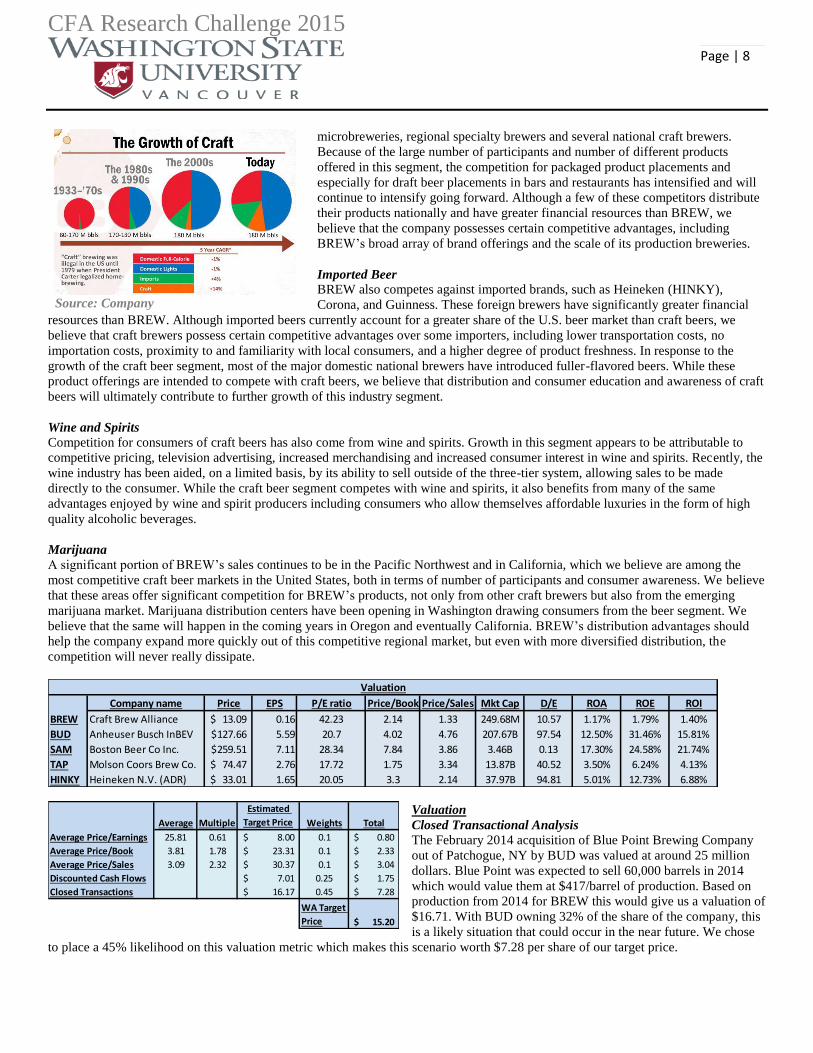
Valuation
Closed Transactional Analysis
The February 2014 acquisition of Blue Point Brewing Company
out of Patchogue, NY by BUD was valued at around 25 million
dollars. Blue Point was expected to sell 60,000 barrels in 2014
which would value them at $417/barrel of production. Based on
production from 2014 for BREW this would give us a valuation of
$16.71. With BUD owning 32% of the share of the company, this
is a likely situation that could occur in the near future. We chose
to place a 45% likelihood on this valuation metric which makes this scenario worth $7.28 per share of our target price.
Source: Company
Average Multiple
Estimated
Target Price Weights Total
Average Price/Earnings 25.81 0.61 8.00$ 0.1 0.80$
Average Price/Book 3.81 1.78 23.31$ 0.1 2.33$
Average Price/Sales 3.09 2.32 30.37$ 0.1 3.04$
Discounted Cash Flows 7.01$ 0.25 1.75$
Closed Transactions 16.17$ 0.45 7.28$
WA Target
Price 15.20$
Company name Price EPS P/E ratio Price/Book Price/Sales Mkt Cap D/E ROA ROE ROI
BREW Craft Brew Alliance 13.09$ 0.16 42.23 2.14 1.33 249.68M 10.57 1.17% 1.79% 1.40%
BUD Anheuser Busch InBEV 127.66$ 5.59 20.7 4.02 4.76 207.67B 97.54 12.50% 31.46% 15.81%
SAM Boston Beer Co Inc. 259.51$ 7.11 28.34 7.84 3.86 3.46B 0.13 17.30% 24.58% 21.74%
TAP Molson Coors Brew Co. 74.47$ 2.76 17.72 1.75 3.34 13.87B 40.52 3.50% 6.24% 4.13%
HINKY Heineken N.V. (ADR) 33.01$ 1.65 20.05 3.3 2.14 37.97B 94.81 5.01% 12.73% 6.88%
Valuation
CFA Research Challenge 2015
Page | 9
Cost of Debt
According to BREW’s annual report from 2013, the amount of long term debt outstanding in loans was around $10.8 million on a ten
year loan with a 1.17% interest rate expiring in 2023 (BREW 10K). When we analyzed the long term debt based on the loan criteria
that was stated in the 10K, we were able to determine the amount of outstanding debt at the end of 2014 of $9.776 million based on a
ten year payment schedule at 1.17% interest with a terminal year of 2023. We then plugged in the remaining balance and payments
with a future value of zero and computed the interest rate to arrive at an internal rate of return of 0.96%. By adding this to the risk free
rate of 4.4%, you can arrive at a cost of debt of 5%.
CAPM
We used the CAPM model to determine the cost of equity of 12.4% for BREW. In order to build the CAPM model we used the long
term risk free rate of 4.4% given in the article titled “The Equity Premium” by Fama and French which determined the risk free rate
from 1872-2000 based on historical rates. This article also helped us to determine the market rate based on an average rate of return of
11%. Lastly, we used a regression analysis of the historical returns of BREW and SPX to determine the beta of 1.21 for BREW
(Yahoo! Finance).
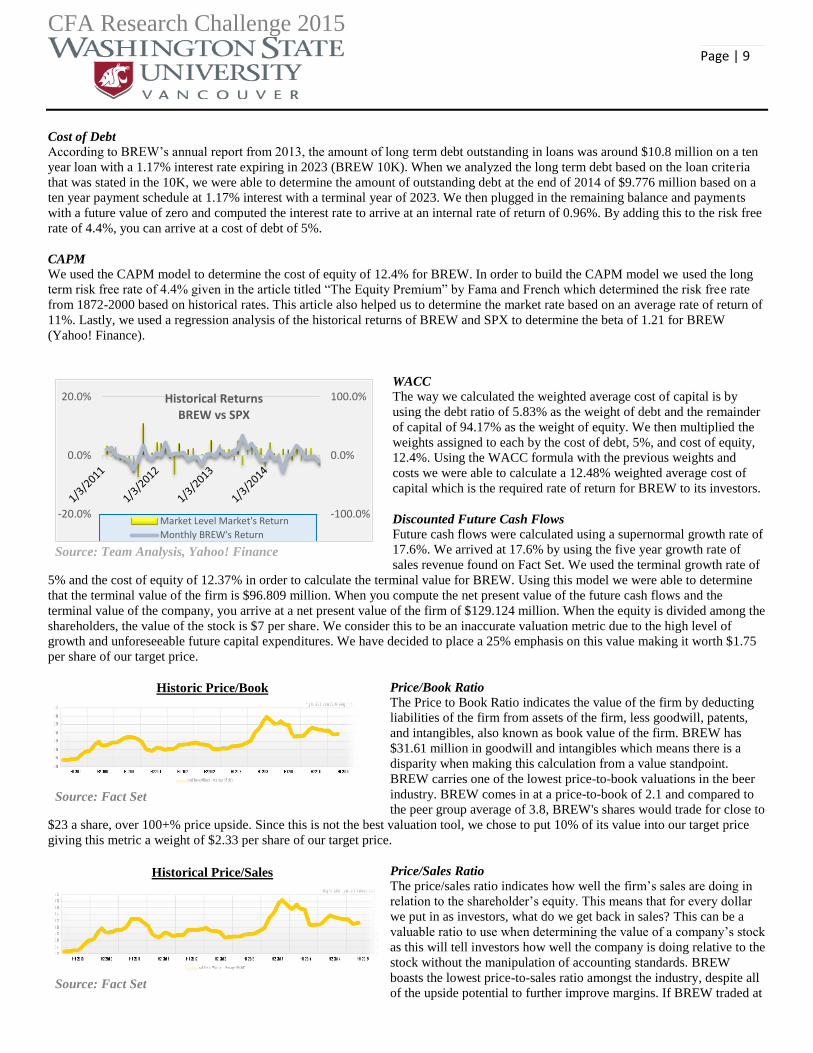
WACC
The way we calculated the weighted average cost of capital is by
using the debt ratio of 5.83% as the weight of debt and the remainder
of capital of 94.17% as the weight of equity. We then multiplied the
weights assigned to each by the cost of debt, 5%, and cost of equity,
12.4%. Using the WACC formula with the previous weights and
costs we were able to calculate a 12.48% weighted average cost of
capital which is the required rate of return for BREW to its investors.
Discounted Future Cash Flows
Future cash flows were calculated using a supernormal growth rate of
17.6%. We arrived at 17.6% by using the five year growth rate of
sales revenue found on Fact Set. We used the terminal growth rate of
5% and the cost of equity of 12.37% in order to calculate the terminal value for BREW. Using this model we were able to determine
that the terminal value of the firm is $96.809 million. When you compute the net present value of the future cash flows and the
terminal value of the company, you arrive at a net present value of the firm of $129.124 million. When the equity is divided among the
shareholders, the value of the stock is $7 per share. We consider this to be an inaccurate valuation metric due to the high level of
growth and unforeseeable future capital expenditures. We have decided to place a 25% emphasis on this value making it worth $1.75
per share of our target price.
Price/Book Ratio
The Price to Book Ratio indicates the value of the firm by deducting
liabilities of the firm from assets of the firm, less goodwill, patents,
and intangibles, also known as book value of the firm. BREW has
$31.61 million in goodwill and intangibles which means there is a
disparity when making this calculation from a value standpoint.
BREW carries one of the lowest price-to-book valuations in the beer
industry. BREW comes in at a price-to-book of 2.1 and compared to
the peer group average of 3.8, BREW's shares would trade for close to
$23 a share, over 100+% price upside. Since this is not the best valuation tool, we chose to put 10% of its value into our target price
giving this metric a weight of $2.33 per share of our target price.
Price/Sales Ratio
The price/sales ratio indicates how well the firm’s sales are doing in
relation to the shareholder’s equity. This means that for every dollar
we put in as investors, what do we get back in sales? This can be a
valuable ratio to use when determining the value of a company’s stock
as this will tell investors how well the company is doing relative to the
stock without the manipulation of accounting standards. BREW
boasts the lowest price-to-sales ratio amongst the industry, despite all
of the upside potential to further improve margins. If BREW traded at
Source: Team Analysis, Yahoo! Finance
Historic Price/Book
Source: Fact Set
Historical Price/Sales
Source: Fact Set
-100.0%
0.0%
100.0%
-20.0%
0.0%
20.0% Historical Returns BREW vs SPX
Market Level Market's Return
Monthly BREW's Return

CFA Research Challenge 2015
Page | 10
the industry average valuation of 3.09 price-to-sales, shares would be priced at over $30.37 representing 200%+ upside. This metric is
also not as useful in measuring the value of the company so we decided to allot 10% of this valuation to our target price. This adds
another $3.04 to our valuation.
Enterprise Value/EBITDA
The enterprise value to earnings before interest, tax, depreciation and
amortization (EBITDA) ratio is an indicator of how well the firm is
handling cash flows relative to the total value of the company. With
an EV/EBITDA of 17.98 compared to SAM who has an EV/EBITDA
of 18.9 shows that BREW is performing well relative to the industry.
With a company such as BREW, which is predicted to have a CAGR
of 14% according to Fact Set, the EV to EBITDA ratio shows that the
company is growing responsibly. One of the reasons for the
EV/EBITDA is that the company closed down operations at Folsom
Street Brewery in 2011, a brewery that was used for contract brewing
with Goose Island before selling to BUD, which reduced revenues.
However in July 2014, BREW acquired a new contract with Memphis
City Brewery in an attempt to reduce shipping costs and increase
revenue in the southeastern portion of the United States. Since this is just a contract, the Enterprise Value is not changed, and therefore
the EV/EBITDA decreased. We expect EV/EBITDA to decrease even more due to the fact that BREW is going to continue to improve
it’s logistics costs in order to achieve the full benefit of the new contract in 2015.
Price/Earnings Ratio
The forward price to earnings ratio is an indicator of what the market expects the P/E ratio to be in the next twelve months. BREW has
a forward P/E ratio of 42.23. Given that the industry average for forward P/E is considered to be 25.81, we find that the company is
overvalued and should be trading at around $8 per share. Since the P/E ratio for a growth company is not a strong indicator of
performance, we placed a 10% weight on the value of the P/E ratio. This results in $0.80 per share of the expected target price.
Conclusion
We believe that due to the high growth of the craft beer industry, BREW is either positioning themselves to be bought by BUD, or
they are positioning themselves to acquire new breweries and expand their operations. The assumption of being bought by BUD is due
to BUD holding a 32% share in the ownership structure. However, BREW remains diligent in reducing the top line through increased
revenues and reduction of shipping costs by expanding and contracting across the United States. In accordance with our assumptions
of the future of BREW, we have assigned a weighted average target price of $15.20 per share moving forward.
Source: Fact Set
'10 '11 '12 '13 '14
0
5
10
15
20
25
30
35
0
5
10
15
20
25
30
35
14.86
17.95
©FactSet Research Systems
High: 33.31 Low: 6.05 Avg: 14.86
Craft Brew Alliance - EV/EBITDA

CFA Research Challenge 2015
Page | 11
Appendix

CFA Research Challenge 2015
Page | 12
2014 2015 2016 2017 2018 2019
Forecasted Revenue Growth 17.60% 17.60% 17.60% 17.60% 17.60%
Sales Revenue 200,022$ 235,226$ 276,626$ 325,312$ 382,567$ 449,898$
Operating Costs Margin 97% 95% 93% 91% 90% 90%
Operating Costs (194,312)$ (224,564)$ (258,224)$ (296,777)$ (343,604)$ (404,079)$
Operating Profit (EBIT) 5,710$ 10,662$ 18,401$ 28,535$ 38,962$ 45,820$
Taxes $ (2,022) (3,959)$ (6,981)$ (10,943)$ (15,013)$ (17,655)$
NOPAT 3,688$ 6,703$ 11,421$ 17,591$ 23,949$ 28,165$
Expected Growth Rate 7.86% 7.86% 7.86% 7.86% 7.86%
Depreciation Expense 8,648$ 9,328.15$ 10,061.78$ 10,853.12$ 11,706.70$ 12,627.40$
Working Capital 8,226$ 9,043$ 10,347$ 12,263$ 14,534$ 16,466$
Change in Working Capital 4,038$ 817$ 1,304$ 1,916$ 2,271$ 1,933$
Net Investments( As a % of Revenue) 7.89% 7.86% 7.86% 7.86% 7.86% 7.86%
Net Investments 15,783.00$ 18,500.00$ 21,756.00$ 25,585.06$ 30,088.03$ 35,383.52$
Sales Revenue 200,022$ 235,226$ 276,626$ 325,312$ 382,567$ 449,898$
Operating Costs (194,312)$ (224,564)$ (258,224)$ (296,777)$ (343,604)$ (404,079)$
Taxes (2,022)$ (3,959)$ (6,981)$ (10,943)$ (15,013)$ (17,655)$
Add back depreciation 8,648$ 9,328$ 10,062$ 10,853$ 11,707$ 12,627$
Debt Changes 3,000$ 6,270$ 8,473$ 10,925$ 11,281$ 7,778$
Net Investments (15,783)$ (18,500)$ (21,756)$ (25,585)$ (30,088)$ (35,384)$
Change in Operating Capital (4,038)$ (817)$ (1,304)$ (1,916)$ (2,271)$ (1,933)$
Free Cash Flow (4,485)$ 2,984$ 6,896$ 11,868$ 14,579$ 11,254$
Craft Brew Alliance, Inc. (In thousands)

CFA Research Challenge 2015
Page | 13
CONSOLIDATED STATEMENTS OF
INCOME (USD $)
In Thousands, except Per Share
data, unless otherwise specifiedDec. 31, 2012 Dec. 31, 2013 Dec. 31, 2014 Dec. 31, 2015 Dec. 31, 2016 Dec. 31, 2017 Dec. 31, 2018 Dec. 31, 2019
CONSOLIDATED STATEMENTS OF
INCOME [Abstract]5.72% 11.52%
Sales $ 182,018.00 $ 192,433.00 $ 214,609.00 252,380.18$ 296,799.10$ 349,035.74$ 410,466.03$ 482,708.05$
Less excise taxes $ 12,731.00 $ 13,253.00 $ 14,587.00 17,154.31$ 20,173.47$ 23,724.00$ 27,899.43$ 32,809.73$
Net sales $ 169,287.00 $ 179,180.00 $ 200,022.00 235,225.87$ 276,625.63$ 325,311.74$ 382,566.60$ 449,898.32$
Cost of sales $ 119,261.00 $ 128,919.00 $ 141,312.00 162,859.25$ 185,659.55$ 211,440.82$ 243,248.87$ 286,060.68$
Gross profit $ 50,026.00 $ 50,261.00 $ 58,710.00 72,366.62$ 90,966.08$ 113,870.91$ 139,317.73$ 163,837.65$
Selling, general and administrative
expenses $ 44,890.00 $ 46,461.00 $ 53,000.00 61,704.72$ 72,564.75$ 85,336.15$ 100,355.31$ 118,017.84$
Operating income $ 5,136.00 $ 3,800.00 $ 5,710.00 10,661.90$ 18,401.33$ 28,534.77$ 38,962.42$ 45,819.80$
Interest expense $ (663.00) $ (464.00) $ (431.00) (456.17)$ (536.46)$ (630.87)$ (741.91)$ (872.48)$
Other income (expense), net $ 4.00 $ (73.00) $ (180.00) (222.26)$ (261.38)$ (307.39)$ (361.49)$ (425.11)$
Income before income taxes $ 4,477.00 $ 3,263.00 $ 5,099.00 9,983.46$ 17,603.49$ 27,596.51$ 37,859.03$ 44,522.21$
Income tax provision $ 1,951.00 $ 1,304.00 $ 2,022.00 3,958.93$ 6,980.63$ 10,943.35$ 15,012.93$ 17,655.21$
Net income $ 2,526.00 $ 1,959.00 $ 3,077.00 6,024.54$ 10,622.85$ 16,653.16$ 22,846.09$ 26,867.00$
Basic and diluted net income per
share (in dollars per share) $0.13 $0.10 $0.16 0.32$ 0.56$ 0.87$ 1.20$ 1.41$
Shares used in basic per share
calculations (in shares) 18,862 18,923 19,038 19,038 19,038 19,038 19,038 19,038
Shares used in diluted per share
calculations (in shares) 18,934 19,042 19,126 19,126 19,126 19,126 19,126 19,126
Gross Margin 29.55% 28.05% 29.35% 30.76% 32.88% 35.00% 36.42% 36.42%
Operating Margin 3.03% 2.12% 2.85% 4.53% 6.65% 8.77% 10.18% 10.18%
Net Margin 1.49% 1.09% 1.54% 2.56% 3.84% 5.12% 5.97% 5.97%
Sales Growth YoY 5.84% 11.63% 17.60% 17.60% 17.60% 17.60% 17.60%
EPS Growth YoY -23.08% 61.62% 95.79% 76.33% 56.77% 37.19% 17.60%
12 Months Ended

CFA Research Challenge 2015
Page | 14
CONSOLIDATED BALANCE SHEETS (USD $)
In Thousands, unless otherwise specified
Current assets:
Cash and cash equivalents $ 2,726.00 $ 981.00 3,965.24$ 10,860.78$ 22,728.92$ 37,307.73$ 48,561.53$
Accounts receivable, net $ 11,370.00 $ 11,741.00 12,906.99$ 14,768.20$ 17,503.09$ 20,743.88$ 23,502.53$
Inventories $ 16,639.00 $ 18,971.00 20,855.00$ 23,862.33$ 28,281.33$ 33,517.78$ 37,975.18$
Deferred income tax asset, net $ 1,345.00 $ 1,670.00 1,835.85$ 2,100.58$ 2,489.58$ 2,950.54$ 3,342.92$
Other current assets $ 3,403.00 $ 4,413.00 4,851.25$ 5,550.81$ 6,578.75$ 7,796.84$ 8,833.72$
Total current assets $ 35,483.00 $ 37,776.00 44,414.34$ 57,142.70$ 77,581.67$ 102,316.77$ 122,215.88$
Property, equipment and leasehold
improvements, net $ 104,193.00 $ 110,350.00 118,695.61$ 127,672.38$ 137,328.05$ 147,713.97$ 158,885.36$
Goodwill $ 12,917.00 $ 12,917.00 $ 12,917.00 $ 12,917.00 $ 12,917.00 $ 12,917.00 $ 12,917.00
Intangible and other assets, net $ 17,693.00 $ 17,558.00 17,424.03$ 17,291.08$ 17,159.15$ 17,028.22$ 16,898.29$
Total assets 205,769.00$ 216,377.00$ 237,865.32$ 272,165.87$ 322,567.55$ 382,292.74$ 433,132.42$
Current liabilities:
Accounts payable $ 14,742.00 $ 12,987.00 14,276.73$ 16,335.46$ 19,360.58$ 22,945.30$ 25,996.71$
Accrued salaries, wages and payroll taxes $ 4,616.00 $ 5,114.00 5,621.87$ 6,432.55$ 7,623.78$ 9,035.36$ 10,236.94$
Refundable deposits $ 8,252.00 $ 8,152.00 8,961.57$ 10,253.84$ 12,152.73$ 14,402.87$ 16,318.26$
Other accrued expenses $ 1,381.00 $ 2,316.00 2,546.00$ 2,913.14$ 3,452.61$ 4,091.89$ 4,636.05$
Current portion of long-term debt and
capital lease obligations $ 710.00 $ 1,157.00 $ 1,157.00 $ 1,157.00 $ 1,157.00 $ 1,157.00 $ 1,157.00
Total current liabilities $ 29,701.00 $ 29,726.00 32,563.18$ 37,092.00$ 43,746.70$ 51,632.43$ 58,344.96$
Long-term debt and capital lease
obligations, net of current portion $ 11,050.00 $ 13,720.00 19,990.04$ 28,463.11$ 39,387.89$ 50,669.11$ 58,447.21$
Fair value of derivative financial
instruments $ - $ 503.00 1,893.62$ 2,166.68$ 2,567.92$ 3,043.39$ 3,448.11$
Deferred income tax liability, net $ 17,719.00 $ 18,570.00 20,414.18$ 23,357.94$ 27,683.53$ 32,809.29$ 37,172.48$
Other liabilities $ 584.00 $ 665.00 731.04$ 836.46$ 991.36$ 1,174.92$ 1,331.16$
Total liabilities $ 59,054.00 $ 63,184.00 75,592.06$ 91,916.18$ 114,377.40$ 139,329.13$ 158,743.92$
Commitments and contingencies (Note 16)
Common shareholders' equity:
Common stock, $0.005 par value.
Authorized 50,000,000 shares; issued and
outstanding 19,115,396 and 18,972,247 $ 95.00 $ 96.00 97.01$ 98.03$ 99.06$ 100.11$ 101.16$
Additional paid-in capital $ 136,972.00 $ 138,391.00 139,824.70$ 141,273.25$ 142,736.81$ 144,215.54$ 145,709.58$
Accumulated other comprehensive loss $ - $ (312.00) (312.00)$ (312.00)$ (312.00)$ (312.00)$ (312.00)$
Accumulated deficit $ (25,835.00) $ (22,758.00) (22,758.00)$ (22,758.00)$ (22,758.00)$ (22,758.00)$ (22,758.00)$
Total common shareholders' equity $ 111,232.00 $ 115,417.00 116,851.71$ 118,301.29$ 119,765.88$ 121,245.64$ 122,740.74$
Total liabilities and common shareholders'
equity 205,769.00$ 216,377.00$ 237,865.32$ 272,165.87$ 322,567.55$ 382,292.74$ 433,132.42$
EBITDA 3,800.00$ 14,358.00$ 19,990.04$ 28,463.11$ 39,387.89$ 50,669.11$ 58,447.21$
Debt/EBITDA 3.09 1.04 1.06 1.04 1.03 1.02 1.02
Dec. 31, 2018 Dec. 31, 2019Dec. 31, 2014Dec. 31, 2013 Dec. 31, 2015 Dec. 31, 2016 Dec. 31, 2017

CFA Research Challenge 2015
Page | 15

CFA Research Challenge 2015
Page | 16

CFA Research Challenge 2015
Page | 17
CFA Research Challenge 2015
Page | 18

CFA Research Challenge 2015
Page | 19
10
20
30
40
50
60
70
80
90
P/E (NTM)
43.0
Avg.
43.1
5Y High
82.4
5Y Low
22.3
'10 '11 '12 '13 '141
2
3
4
5
6
Ind
2.1
Bmrk
2.4

CFA Research Challenge 2015
Page | 20
Source: Morningstar

CFA Research Challenge 2015
Page | 21
CFA Research Challenge 2015
Page | 22
CFA Research Challenge 2015
Page | 23
CFA Research Challenge 2015
Page | 24

CFA Research Challenge 2015
Page | 25
Executive Biographies Mr. Andrew J. Thomas Chief Executive Officer [email protected] Mr. Thomas became Chief Executive Officer for CBA, effective January 1, 2014, following a unanimous vote by the Company’s Board of Directors that was announced in 2013. Previously, Mr. Thomas served as President of Commercial Operations for CBA, since 2011, where he helped establish the company’s distinctive national portfolio strategy. Mr. Thomas brings more than two decades of leadership experience in consumer packaged goods and the beer and beverage industries to his role as CEO for CBA. He spent 12 years, from 1995 to 2007, at Heineken, working with brewers and beers in more than 55 countries across four continents, and served as president & CEO of Heineken USA from 2005-2007. More recently, he served as an independent consultant and senior advisor to The Monitor Group, a global management consulting firm. Mr. Thomas holds an MBA from the Simon Graduate School of Business, University of Rochester, and a Bachelor of Science, with a concentration in Marketing, from Bryant University. Mr. Kenneth C. Kunze Chief Marketing Officer [email protected] Mr. Kunze joined CBA as Chief Marketing Officer on November 4, 2013. A seasoned marketing executive with more than 25 years of leadership experience in the consumer packaged goods, beer and beverage industries, Mr. Kunze has previously served as Chief Marketing Officer for Heineken USA and Sabra Dipping Co., a PepsiCo joint venture. Mr. Kunze is responsible for the marketing and management of CBA’s dynamic portfolio of brands, including Widmer Brothers Brewing, Redhook Brewing, Kona Brewing Co., Omission and Square Mile Cider Company, as well as new brand development. Additionally, he oversees CBA’s Restaurant & Retail division, which includes five distinctive restaurant/retail locations in cities across the U.S. Mr. Kunze holds a Masters of Management from the J.L. Kellogg Graduate School of Management, Northwestern University, and a Bachelor of Science, Finance from the University of Illinois. Mr. John W. Glick Vice President, Supply Chain & Logistics [email protected] Mr. Glick has served in the role of Vice President, Supply Chain & Logistics since 2013. He oversees the entire supply chain function for CBA, managing the company’s direct wholesaler partnership with Anheuser-Busch. Mr. Glick brings more than 19 years experience working closely with beer wholesalers to optimize forecasting, inventory planning, purchasing and production. From 2012 to 2013, Mr. Glick served as VP, Business Development for CBA. Previously, he spent five years leading Operations for Anheuser-Busch (“ABI”), as VP, Business Development, where he developed ABI’s adjacent beverage strategy and led import beer planning, shipping and operations. Prior to running the BD Group for ABI, he held a number of positions in Business & Wholesaler Development, where he managed ABI’s equity investments in several wholesalers and craft brewers. Before ABI, Mr. Glick held a variety of positions with General Motors’ (“GM”) Delco Products component manufacturing division in Dayton, Ohio. Mr. Glick holds an MBA in Operations and Corporate Finance from Indiana University and a BS in Industrial Engineering from Kettering University in Flint, MI. Mr. J. Scott Mennen Vice President, Brewery Operations [email protected] Mr. Mennen has served in the role of Vice President, Brewery Operations since 2013, where he oversees the brewing innovation, packaging and warehousing operations, as well as quality management across the company’s breweries in the U.S. With 25 years of extensive experience in all facets of operations and brewery management, he previously served as VP, Operations for Pabst Brewing Company from 2012 to 2013. Prior to that, he was Global Director of Brewing and Quality for Anheuser-Busch, where he was responsible for brewing and quality operations worldwide, from 2009 to 2012. Mr. Mennen served as General Manager of Newark Brewery from 2008 to 2009, and was the Brewery’s Resident Brew master from 2001 to 2008. Mr. Mennen holds an MBA, Finance from Rutgers, The State University of New Jersey-Newark and a BS, Mechanical Engineering from the University of Tennessee.

CFA Research Challenge 2015
Page | 26
Mr. Peter W. Schauf Vice President, General Manager - East Region [email protected] Mr. Schauf has served as Vice President/General Manager – East Region for Craft Brew Alliance since 2010, where he has succeeded in building the company’s business in the East Coast and generating record growth for its brands. Prior to joining CBA, Mr. Schauf held the position of VP, Business Development for Kona Brewing Company, responsible for managing the business across the Mainland U.S. & Hawaiian islands. Previously, Mr. Schauf served as Director of Key Accounts for Gambrinus Importing, where he was responsible for the Modelo/Gambrinus portfolio, including Corona, Corona Light, Modelo Especial, Shiner, Moosehead, Pete’s Wicked, Bridgeport and Trumer Pil’s. Mr. Schauf spent 15 years with Miller Coors Brewing, serving in various management positions, including Country Manager for Ireland. Mr. Schauf holds a BA in Political Science from the University of Richmond. Mr. Dan J. Partelow Vice President, General Manager - West Region [email protected] Mr. Partelow has served in the role of Vice President/General Manager – West Region for Craft Brew Alliance since 2012, where he is responsible for managing the company’s growth in its most mature region. A long-time veteran of the beer industry, Mr. Partelow brings two decades of sales leadership to his role. Prior to joining CBA, Mr. Partelow was VP, General Manager – Wholesale Operations for Anheuser Busch (ABI) from 1994-2011. During his tenure there, Mr. Partelow managed all ABI company-owned operations in Southern California, including operations, finance, sales and marketing. Additionally, from 1988-1994, Mr. Partelow held a number of sales leadership roles within ABI, based out of Denver, Colorado. Additionally, he has served on the Board of Directors for the California Beer and Beverage Distributors. Mr. Partelow holds an MBA, with a Marketing focus from the University of California, Riverside and a BA in Business from Western Illinois University. Mr. Derek Y. Hahm Chief of Staff [email protected] Mr. Hahm was appointed Chief of Staff, a new position for CBA, in 2013. In this role, he brings more than two decades serving in key sales and operations management roles to lead the company’s shared services functions, including human resources and corporate communications. From 2012-2013, Mr. Hahm served as Vice President, National Sales Operations for CBA, where he oversaw sales operations nationally and managed the company’s national retail sales accounts. Prior to that, he held several sales and sales operations management positions from 2004 to 2012, where he was responsible for budget oversight, forecasting, and collaborating with brewing, marketing, supply chain and finance. From 2002 to 2004, he was the Northwest Key Account Manager for Redhook Ale Brewery in Washington. Mr. Hahm served in key sales positions for K&L Distributors from 1996-2002, and for City Beverage in Kent, Washington from 1994 to 1996. Mr. Hahm holds a BA in Sociology, University of Washington.

CFA Research Challenge 2015
Page | 27
Board Member’s Biographies
Mr. Kurt R. Widmer Chairman of the Board [email protected] Mr. Widmer has served as the Chairman of the Board and director since the merger with WBBC. Prior to that, Mr. Widmer served as President, Chief Executive Officer and Chairman of the Board of WBBC from 1984 until July 1, 2008. Mr. Widmer co-founded WBBC with his brother, Robert P. Widmer. He is a member of the board of directors and past president of the Oregon Brewers Guild. Mr. Timothy P. Boyle Mr. Boyle has served as a director since our merger effective July 1, 2008 with Widmer Brothers Brewing Company (“WBBC”). He had served as a director of WBBC from May 1999 until July 1, 2008. Since 1989, Mr. Boyle has served as President and Chief Executive Officer of Columbia Sportswear Company, an active outdoor apparel and footwear company headquartered in Portland, Oregon. He began working with Columbia Sportswear Company in 1970. Mr. Boyle serves as a director on the boards of Columbia Sportswear Company, Northwest Natural Gas Company and The Freshwater Trust. He is a member of the Public Affairs and Environmental Policy Committee of Northwest Natural Gas Company. Mr. Boyle is a trustee of Reed College and the Youth Outdoor Legacy Fund and a past member of the Young Presidents’ Organization and the University of Oregon Foundation. Mr. Marc J. Cramer Mr. Cramer has served as a director since December 2010. Since 2007, he has served as the Finance Director of the Bill Healy Foundation (“Foundation”), a private charitable foundation, and Cedar Holdings LLC, a private investment company. Prior to 2007, he was employed by Kettle Foods Holdings Inc., a privately held, all-natural food manufacturer, serving in the roles of Global Financial Director, Assistant Secretary and Treasurer beginning in 2004, and, from 1999 to 2004, as President, North American Operations of Kettle Foods Inc. Mr. Cramer has been a director of Sequential Pacific Biodiesel, Inc. and Scott Paul Wines since 2008, and Pioneer Newspapers, Inc. since January 2013; he previously served on the boards of Kona Brewing Co., Inc. from 2007 to October 2010 and Kettle Foods, Inc. from 2004 to 2006. Mr. Randall S. Jozwiakowski Mr. Jozwiakowski has served as a director since January 2015. Since 2010, Mr. Jozwiakowski has served as Vice President, Wholesaler Development for Anheuser Busch (“A-B”), where he leads merger & acquisition activity, and strategy development for A-B’s wholesaler system. From 2005-2010, Mr. Jozwiakowski had served as Vice President of Finance and Operations of the Wholesale Operations Division of A-B, which manages their company-owned wholesalers. Previously, Mr. Jozwiakowski worked in A-B’s Corporate Planning and Development department and the Wholesaler System Development department from 1999 to 2005. Prior to his time at A-B, Mr. Jozwiakowski worked at Boeing from 1991 to 1999 in a number of finance and planning roles. Mr. Jozwiakowski received his undergraduate degree in Economics and Business Administration from Westminster College and an MBA from St. Louis University. Mr. Kevin R. Kelly Mr. Kelly has served as a director since the merger with WBBC and also served as a director of WBBC from September 1995 until July 1, 2008. In September 2011, Mr. Kelly sold First Call Heating and Cooling, an oil sales and heating/cooling contractor, where he had been Chief Executive Officer and owner since 1994. Prior to that, he was President of U.S. Bancorp, and held various roles with U.S. Bancorp and its subsidiaries from 1977, including Chief Executive Officer and President of U.S. Bank of Oregon. Mr. Kelly serves as a director on the boards of Western Capital Corporation and the Sisters of Providence Pension Trustees. Mr. Kelly earned a Ph.D. and a Master’s Degree in Economics from the University of Oregon.

CFA Research Challenge 2015
Page | 28
Mr. Thomas D. Larson Mr. Larson has served as a director since July 2011. Since December 2008, Mr. Larson has served as Senior Associate General Counsel for A-B, where he is the supervisor for all transactional and benefits lawyers in A-B’s United States operations. He has been the lead internal counsel for all of the transactions between A-B and us since 1994. Mr. Larson joined A-B in 1993 as an Associate General Counsel. Prior to joining A-B in 1993, Mr. Larson was in private practice in Cleveland, Ohio. Mr. David R. Lord Mr. Lord has served as a director since May 2003. In January 2009, Mr. Lord retired from the position of President of Pioneer Newspapers, Inc., which he had held for 18 years. He served as Vice Chairman until December 2012 when he became a director. Pioneer Newspapers owns eight daily newspapers and nine weekly, semi-weekly and monthly publications in the western United States. Prior to joining Pioneer Newspapers, Mr. Lord practiced law, both in private practice and as a criminal deputy prosecuting attorney. Mr. Lord currently serves as Chairman of the PAGE Cooperative, a not-for-profit, member-owned cooperative buying association in the newspaper industry. He is also a past president and chairman of the Inland Press Association. Mr. John D. Rogers, Jr. Mr. Rogers has served as a director since May 2004. Beginning in December 2010, Mr. Rogers has served as Director of Business Development for a division of Lile International Corporation, agent for North American Van Lines. He also holds the position of Managing Partner of J4 Ranch LLC, an organic berry grower, a position held since 2007. Prior to joining J4 Ranch LLC, he served as President, Chief Executive Officer and director of Door to Door Storage, Inc. from June 2004 to June 2007. Mr. Rogers has also served in leadership roles at several manufacturing enterprises, including President and Chief Operating Officer at AWC, Inc., General Manager at British Steel Alloys, and President and Chief Executive Officer of Saab Systems Inc., NA. Mr. Rogers serves as a board member of the C. M. Russell Museum. Mr. Rogers was appointed a Sloan Fellow at Massachusetts Institute of Technology, and graduated with a Master’s of Science in Business Administration. He also earned a Master’s Degree in Business Administration from Southern Methodist University.