Embed Size (px)
Citation preview

P A Y F O R S U C C E S S I N I T I A T I V E
R E S E A RC H R E PO R T
Making Sound Cost Decisions in
Pay for Success Projects Estimating Costs and Determining Success Payment Rates
Harry Hatry Matthew Eldridge Arden Kreeger Reed Jordan
February 2017
Revised September 2017

A BO U T THE U RBA N IN S T ITU TE
The nonprofit Urban Institute is dedicated to elevating the debate on social and economic policy. For nearly five
decades, Urban scholars have conducted research and offered evidence-based solutions that improve lives and
strengthen communities across a rapidly urbanizing world. Their objective research helps expand opportunities for
all, reduce hardship among the most vulnerable, and strengthen the effectiveness of the public sector.
Copyright © September 2017. Urban Institute. Permission is granted for reproduction of this file, with attribution to
the Urban Institute. Cover illustration by Crystal Home/Shutterstock.

Contents Acknowledgments iv
Executive Summary v
Making Sound Cost Decisions in Pay for Success Projects 1
Overview 1
Report Organization 4
Task 1: Make Initial Cost-Related Decisions 4
Task 2: Define the Project 8
Task 3: Identify and Estimate Project Costs 10
Identifying Project Costs 10
Estimating Project Costs 11
Task 4: Determine the Success Payment Rates 14
Basic Principles for Success Payment Rates 14
Suggested Steps for Calculating Success Payment Rates 14
Success Payments Using Multiple Outcomes 18
Need for Government Cost Analysis Capability 19
Other Options for Calculating Success Payments 19
Appendix A. List of Government PFS Cost Elements 21
Initial PFS Project Development Costs 21
One-Time or Periodic Investment Costs 22
Annual Operating and Maintenance Costs 22
Notes 25
References 27
About the Authors 28
Statement of Independence 29

I V A C K N O W L E D G M E N T S
Acknowledgments This report was funded by the Laura and John Arnold Foundation. We are grateful to them and to all our
funders, who make it possible for Urban to advance its mission.
The views expressed are those of the authors and should not be attributed to the Urban Institute,
its trustees, or its funders. Funders do not determine research findings or the insights and
recommendations of Urban Institute experts. Further information on the Urban Institute’s funding
principles is available at www.urban.org/support.
The authors thank stakeholders from the following organizations for agreeing to be interviewed for
this report: Chicago Public Schools Office of Early Childhood Education, Cuyahoga County (Ohio) Job
and Family Services, IFF, Santa Clara County (California) Office of the County Counsel and Office of
Supportive Housing, and Third Sector Capital Partners. The authors thank Rayanne Hawkins, Julia
Isaacs, Justin Milner, Kelly Walsh, and Akiva Liberman of the Urban Institute; Ky Le of Santa Clara
County; and David Merriman of Cuyahoga County for commenting on an earlier version of this report.
The authors are also grateful for the illustrated graphic by Frederik Hviid.

E X E C U T I V E S U M M A R Y V
Executive Summary Pay for success (PFS) represents a significant departure from the status quo for funding
public social programs. Through PFS, the government repays the cost of service delivery
only to the extent agreed-on outcomes are achieved. This model aims for high-priority
outcomes rather than simply contracting for outputs.
Inevitably, cost implications will be a major consideration for governments considering a PFS
project. This is true whether the government is exploring PFS in pursuit of cost savings or to improve
the outcomes of government programs (i.e., for societal benefit).
Identifying the costs of achieving these outcomes can be a significant hurdle. Governments, as well
as other project partners, need to identify and estimate project costs in order to make sound decisions.
This report outlines the information and basic steps needed to estimate key costs in PFS projects. It
discusses how to use that information during planning and development, including, importantly, the
success payment rates. The recommendations in this report are based on research on existing PFS
projects (see table 1), including interviews with several stakeholders and input from discussions of costs
at a national symposium on PFS hosted by the Urban Institute.1
This report identifies four key tasks in the cost estimation process, along with specific action
recommendations:
1. The government and the project partners make a number of preliminary cost-related
decisions. First, stakeholders assess the feasibility of obtaining accurate cost information for
the issue area and target population of the proposed project. Next, stakeholders decide if cost
savings to government departments—that is, future public costs avoided or likely to be
decreased as a result of the project—will be used to help establish success payment rates to
investors. Important elements likely to affect costs include the length of the project, the
maximum total success payment the government is willing to pay, and the frequency and timing
of success payments.
2. Stakeholders thoroughly define the cost-related components of the project. The plan should
(1) make clear which project-related costs are the responsibility of the service provider and
which the responsibility of the government, (2) define as precisely as possible what outcomes
are sought and which beneficiaries will be served (basic information that helps determine

V I E X E C U T I V E S U M M A R Y
costs), and (3) identify all government programs whose costs will be significantly affected by
the intervention.
3. Project partners estimate the specific project costs. To do this, partners identify which
elements of cost will be significant based on the nature and context of the intervention. These
costs can be grouped into three broad categories: initial PFS project development, one-time or
periodic investment, and annual operation and maintenance. Once the specific cost elements
are identified, they are estimated using information provided by the government and service
provider. Typically, the intervention costs are based on the service provider’s estimates, but
costs for interventions unfamiliar to the government might also be estimated based on
evidence gleaned from other communities’ experiences implementing comparable
interventions.
4. Project partners determine the success payment rates. Success payments will face close
scrutiny by all stakeholders. These rates should be fair and clear to all parties and respect the
government’s cost ceiling. If the project is successful, payments should reimburse the costs for
the intervention, plus any negotiated profit or fee. Calculating the success payment rate
requires a number of steps and a variety of information, discussed in Task 4. The rates
described are based primarily on estimated project costs as well as bonus payments
commensurate with government estimates of the project’s societal benefits. The derivation of
the size of these added payments is not discussed in this report.
Making Sound Cost Decisions in Pay
for Success Projects
Overview
Inevitably, cost implications will be a major consideration for governments considering a PFS project.
This is true whether the government is exploring PFS in pursuit of cost savings or to improve the
outcomes of government programs (i.e., for societal benefit).
This report seeks to inform PFS stakeholders and government partners in particular about the steps
necessary both to assess relevant costs for PFS projects and to provide suggestions for determining the
success payment rates. By obtaining accurate and comprehensive cost information, project
stakeholders can make informed decisions about critical project components such as success payment
rates.
In addition to ensuring accountability throughout the life of the project, cost information is used
during project development, to determine which interventions are feasible for the
government.
during project negotiations, to provide projections of costs to the government and data on the
government’s relevant historical costs.
If PFS is replacing an existing intervention, the government can use its pre-PFS service delivery
costs as a baseline against which to compare the actual PFS costs. Historical costs can also be
used during negotiations to help determine success payment rates. (See Task 4 for more details
on determining success payment rates.)
If the PFS project is introducing a new service, the current program costs might appear to be
zero. However, most PFS projects aim to prevent problems that the government is already
spending money to alleviate in the target population. For example, the government might be
incurring costs to provide special education to low-income children who are part of the target
population in a new preschool PFS project. The government should identify those costs and
estimate cost savings from the intervention.

2 M A K I N G S O U N D C O S T D E C I S I O N S I N P A Y F O R S U C C E S S P R O J E C T S
during project implementation, to assess whether costs are under control or require service
delivery modifications.
Many PFS projects do not wait until the end of the project period to provide success payments;
instead, the government makes interim repayments. For example, the project in Santa Clara
County provides success payments beginning after the first year, based on the number of
clients who achieve three months of housing stability through the permanent supportive
housing intervention. By contrast, Cuyahoga County’s PFS contract provides for all payments
to be made in the sixth year. This allows time to complete the randomized controlled trial
evaluation, which measures the outcomes needed to determine success payments.
at the end of the PFS project, to determine whether the intervention should be continued.
A final estimate of the total costs (along with the program’s evaluation and other factors) will
very likely affect the government’s decision to maintain or expand the program beyond the PFS
project’s time frame. This information enables the government to weigh the costs before and
after the PFS project against the program’s benefits to answer the following question: Are the
benefits of continuing the intervention worth the added cost?
This report focuses primarily on how governments can identify and estimate the cost information
needed during the project development and negotiation stages. These efforts lay the groundwork for
cost information collection in later stages of the project. We identify specific decisions that need to be
made and the types of costs that should be included in estimates, and we suggest specific steps for
deriving success payments that ultimately determine the final costs to government and investors. These
suggestions are based on our examination of documents from existing PFS projects (e.g., contracts and
cost-benefit analyses) and interviews Urban conducted with government officials, intermediaries, and
other individuals who have developed or used cost estimates in active PFS projects.
At time of writing, 11 pay for success projects focusing on social programs have launched in the
United States (see table 1). This report uses examples from some of them, drawn from desk reviews and,
where useful, interviews with project stakeholders.

M A K I N G S O U N D C O S T D E C I S I O N S I N P A Y F O R S U C C E S S P R O J E C T S 3
TABLE 1
Pay for Success Projects
Project Launch
year Issue area Initial investment
($ millions)
Maximum potential repayment amount
($ millions)
New York City, NY NYC ABLE Project for Incarcerated Youth 2012 Recidivism 9.6 11.7
Salt Lake County, UT Utah High Quality Preschool Program 2013
Early childhood education 7.0 N/A
New York State Recidivism and Workforce Development Project 2013 Recidivism 13.5 21.6
Massachusetts Juvenile Justice Pay for Success Initiative 2014 Recidivism 21.8 27.0
Chicago, IL Child-Parent Center Pay for Success Initiative 2014
Early childhood education 16.9 34.0
Cuyahoga County, OH Partnering for Family Success Program 2014 Child welfare 4.0 5.0
Massachusetts Chronic Homelessness Pay for Success Initiative 2014 Homelessness 3.5 6.0
Santa Clara County, CA Project Welcome Home 2015 Homelessness 6.9 12.0
Denver, CO Social Impact Bond Program 2016 Homelessness 8.6 11.4
Connecticut Family Stability Project 2016 Child welfare 11.2 14.8
South Carolina Nurse-Family Partnership Project 2016
Maternal and child health 17.0 7.5
Sources: Urban Institute Pay for Success Initiative (http://pfs.urban.org/); and Nonprofit Finance Fund
(http://www.payforsuccess.org/projects/).
Note: The South Carolina project’s listed investment does not include a $13 million 1915(b) Medicaid waiver awarded by the
federal Centers for Medicare and Medicaid Services.
This report has several limitations. First, we focus on actual monetary costs instead of outlining a
formal cost-benefit analysis, which would require monetizing the value of nonmonetary outcomes.
Second, because the field is new, we only have a few PFS examples on which to base our
recommendations—although many good practices in other areas of public management still apply.
Third, every project has its own unique characteristics, so our suggestions are necessarily more general
than we would like. Finally, although this report outlines the types of information projects are likely to
require, the availability and quality of such data depend in part on the strength and reliability of the
government’s cost accounting system.

4 M A K I N G S O U N D C O S T D E C I S I O N S I N P A Y F O R S U C C E S S P R O J E C T S
Report Organization
The following sections are organized around four tasks that governments, in coordination with other
project partners, will need to undertake to make costing decisions in a PFS project:
Task 1: Make Initial Cost-Related Decisions
Task 2: Define the Project
Task 3: Identify and Estimate Project Costs
Task 4: Determine the Success Payment Rates
Task 1: Make Initial Cost-Related Decisions
Early in the project’s development, the government and its partners must take the following steps to
guide cost analysis efforts:
1. Assess the feasibility of obtaining accurate cost information on the issue area and target
population. During the project development phase, stakeholders should choose an
intervention for which reasonably reliable cost information is available or can readily be made
available. Cost information should cover all the government’s programs and agencies whose
costs are expected to be significantly affected by the intervention. These estimates serve both
as a baseline and as a basis for projecting the future costs to the government if the project is not
implemented. These costs can later be compared to the actual project costs to assess the
project’s overall cost impact. If the availability of cost information is questionable, the
government should consider selecting a different intervention.
» Project Welcome Home (Santa Clara County, CA): This permanent supportive housing PFS
project began with a thorough analysis of the current costs of providing services to the
target population (individuals experiencing chronic homelessness). This information
provided a benchmark for comparing the budget proposed by the housing provider to
the status quo.2
Government cost accounting systems are an important source of cost information but
may not provide the level of accuracy needed for PFS projects. If the government does
not already have a robust cost accounting system, outside expertise may be needed,
often at an additional cost.

M A K I N G S O U N D C O S T D E C I S I O N S I N P A Y F O R S U C C E S S P R O J E C T S 5
2. Decide whether and how cost savings will be included in the criteria used to establish success
payments. Improving the lives of those served is likely the primary motivation for PFS projects.
However, reducing costs is almost always a consideration in state and local governments’
decision to enter into PFS agreements.
If a government wants to consider cost savings as a basis for making repayments to
investors, it can do this directly, such as by determining the savings sharing percentage
(i.e., the investors receive X percent of the validated cost savings produced by the
project). Most PFS projects to date have included cost savings indirectly, with benefits
validated by an independent program evaluation or audit. Some examples of indirect
cost savings programs are listed below.
» Partnering for Family Success Program (Cuyahoga County, OH): This PFS initiative focuses
on reducing the time children in chronically homeless families spend in foster care. The
project used “out-of-home placement days avoided” as its success payment criterion.
This outcome reflects cashable cost savings because foster care is a significant expense
for government and taxpayers. The reduction of time in foster care is expected to
lower costs and improve the welfare of participating families.3
» Utah High Quality Preschool Program (Salt Lake County, UT): This project provides success
payments of $2,607 for each child served who was initially designated at high risk for
later needing special education but was not found to need it after attending the
preschool program.4
» Child-Parent Center Pay for Success Initiative (Chicago, IL): Chicago’s early childhood
education PFS project also determines success payments based on an expected
reduction in the need for special education among students who attend preschool.5
Both this project and the Utah preschool program measure special education
avoidance and make outcome payments based on the expected cost savings to
government and taxpayers from decreased use of services.
Some outcomes are not only beneficial to participants but also highly likely to reduce
costs directly as well. If a project includes cost savings directly as one of the success
payments, the contract will need to specify how cost savings will be split among the
government and the other project partners.
» Project Welcome Home: The Santa Clara County project includes a direct cost savings
structure. It relates the year’s actual PFS project costs to the amounts budgeted by the

6 M A K I N G S O U N D C O S T D E C I S I O N S I N P A Y F O R S U C C E S S P R O J E C T S
service provider. If actual costs are within 90 percent of the budgeted amount, the
provider receives those savings (i.e., is paid the year’s budgeted amount). If actual costs
are less than 90 percent of the budgeted amount, the savings become “shared savings”
costs and are distributed between the provider and the county. If actual costs exceed
the amount budgeted for the PFS project, the provider must absorb the overage. The
parties to the agreement select an independent third-party auditor to review the
provider’s financial records and determine the actual project costs annually.6
Direct cost savings criteria can provide incentives for a service provider to keep costs down. On
the other hand, if providers receive a bonus for delivering the intervention under budget, they
may be inclined to reduce services that are beneficial to participants but don’t impact the
project’s outcome measures.
PFS agreements might also contain provisions for payments based directly on the amount of
cost savings, perhaps determined only at the end of the project.
3. Determine the length of the project. This will have a major effect on the total cost of the
project. Total project length consists of the service delivery period and the time required to
complete the project evaluation and make final success payments. PFS projects can last many
years, especially if any of the outcomes that factor into government payments are not expected
to occur for years after the service period has ended. Service delivery periods have typically
lasted between four and six years (Archer-Rosenthal 2016, table 8.1). This is the period during
which most project costs are incurred. Some outcomes might be expected to occur within a
year or so of service provision, while others might not be expected for several years. For
example, Chicago’s school readiness project measures the reduction in special education slots
for four cohorts of students, with payments made through high school graduation.7
4. Determine the maximum total success payment. Governments should establish a maximum
amount for their payments. Such caps were included in all the PFS projects we studied. The
maximum total success payment will be based to a large extent on the government’s projected
cost for the project. It will also be affected by the amount of available investor funding and the
government’s own financial situation. If success payments are based on more than one outcome
measure, consider providing maximum success payments for each measure.
5. Determine the frequency and timing of success payments. For PFS projects expecting
outcomes in the near future (e.g., within one year of service delivery), early success payments
(e.g., annual) may be in order. Some projects make payments only after the service provider’s

M A K I N G S O U N D C O S T D E C I S I O N S I N P A Y F O R S U C C E S S P R O J E C T S 7
project work has ended and the evaluation has specified the amount of outcome produced. A
recent report by the Nonprofit Finance Fund found that the first nine PFS projects in the
United States varied in their payment timing structures (Archer-Rosenthal 2016, table 8.2).
» Project Welcome Home: Santa Clara County makes success payments based on the
number of months that a participating family remains in stable housing. After the first
12 months of continuous tenancy, project outcomes are achieved on a monthly basis,
but payments are only made annually. The PFS contract ends such payments at the end
of the project period.8
» Partnering for Family Success Program: The Cuyahoga County project offers success
payments based on outcomes over a five-year period. All success payments are made in
the first quarter of the sixth year.9 All enrollments take place during the first three
years. For the last two cohorts, the evaluator is responsible for projecting outcomes for
the remainder of the five-year evaluation period based on the outcomes for the first
cohort.
» Child-Parent Center Pay for Success Initiative: The Chicago Child-Parent Center project
also provides payments beyond the four-year service delivery period. The government
repays investors for successful outcomes achieved at the end of year one and over the
following 16 years. This model assumes that special education savings (and benefits to
the children) measured in sixth grade will continue until the final project cohort
graduates from high school.

8 M A K I N G S O U N D C O S T D E C I S I O N S I N P A Y F O R S U C C E S S P R O J E C T S
Task 2: Define the Project
Once an intervention is selected for PFS implementation, the government and its partners must
thoroughly define the terms of the project to allow for accurate cost analysis. The following are action
items to consider.
1. Make clear in the contract for which costs the service provider is responsible (and should be
covered by the provider’s budget) and those for which the government is
responsible. Although most costs of service delivery are covered by the investors in PFS, there
may be costs for which it is unclear who should be responsible. This will especially be the case if
the government will be providing other customers with a similar service as will be delivered by
the service provider (e.g., if the PFS project expands an existing intervention to serve an
enlarged target population). Another example: If both the government and the service provider
use the same facilities for service delivery, who is responsible for making repairs to those
facilities? The PFS contract should specify who is responsible for which costs, to the extent that
they can be anticipated.
2. Define, as thoroughly and precisely as possible, the specific outcomes sought and the
number and categories of clients to be served by the intervention. The service provider‘s
budget should be based on specific needs to achieve the desired outcomes. These are generally
expressed in the form of “payment per unit of validated outcome.”
» Juvenile Justice Pay for Success Initiative (MA): This project provides success payments of
$750 per participant in each quarter that a program participant is employed as
compared with similar young men who are not in the program.10
Client categories should account for the expected numbers of clients with different levels of
need. The number and percentage of clients expected at each level of need can have major
effects on the costs of the intervention. For example, a PFS contract providing supportive
housing services to homeless individuals might consider the relative costs of serving recently
homeless individuals versus chronically homeless individuals.
3. Identify other programs, including programs in other parts of the government, whose costs
are likely to be significantly affected by the intervention. Costs for these other programs may
be reduced or increased by the intervention. For example, an intervention aimed at reducing
homelessness may increase costs by increasing need for supportive services. Cost and cost
savings estimates will need to be obtained from these other programs.

M A K I N G S O U N D C O S T D E C I S I O N S I N P A Y F O R S U C C E S S P R O J E C T S 9
» Social Impact Bond Program (Denver, CO): The research plan for the Denver PFS project
identified the following highly cost-affected services: jails, courts, detox efforts,
homeless shelters, and hospitals. The project asked the question: Does the supportive
housing intervention affect the use of these services and thus the costs to the
government (Cunningham et al. 2016, 22)?
Project partners may consider providing higher success payments for serving clients that are
typically more difficult and costly to help. Even in projects targeted at the neediest populations,
service intensity and mode of delivery are likely to vary considerably across intended
beneficiaries. This can have a considerable impact on cost of service delivery. The difficulty
categories would likely be based on each incoming client’s characteristics, such as the client’s
baseline condition and demographic characteristics relevant to that particular program (e.g.,
English speaking skills, years of education, and criminal history).
4. Describe the type and level (or at least the minimum level) of service to be provided. The
provider should be given considerable flexibility to make continuous service improvements.11
For example, the government agency might specify in the contract the minimum number of
person-to-person contacts the service provider should have with clients. However, that
number should provide sufficient flexibility to enable the provider to try various service
delivery modifications.12
5. Provide for contingencies by identifying how adjustments will be made if such contingencies
occur. Throughout the project, significant service adjustments may be needed because of
unexpected developments. For example, the use of comparison groups to estimate whether the
intervention caused the outcomes will affect the total number of clients whose outcomes need
to be measured. If the agreement specifies the number of people the provider must serve and
that number cannot be attained (and therefore the number of successful outcomes cannot be
achieved), it may become impossible for the project to recoup its cost. Such contingencies are
hard to anticipate, but the contract should provide a mechanism by which the parties can jointly
work out changes to the agreement.
» Partnering for Family Success Program: The Cuyahoga County contract included a
number of contingency clauses. For example, if the number of eligible enrollments did
not reach a specified level by a specified deadline, the contract would be terminated. If
labor costs increased to make timely success payments impossible, the project’s
governance committee would review the contract.13

1 0 M A K I N G S O U N D C O S T D E C I S I O N S I N P A Y F O R S U C C E S S P R O J E C T S
Task 3: Identify and Estimate Project Costs
Identifying Project Costs
Cost elements are categories of cost that a PFS project needs to consider. Collectively, these should
cover all the programs and services whose costs are likely to be significantly affected by the
intervention. Cost elements will vary across PFS projects. Appendix A presents a starter set of cost
elements that governments can use to guide the cost identification process. These elements should be
tailored to the specific intervention.
Below are actions governments should take to identify the relevant cost elements for a PFS project.
Clarify which costs will be borne by the service provider and which costs will be borne by the
government. The provider’s budget should identify all costs for which the provider is
responsible. The government should confirm that cost elements not identified in the provider’s
budget will be the government’s responsibility (e.g., housing vouchers). The PFS contract should
specify who is responsible for which costs, to the extent that they can be anticipated.
Consider and plan for intervention costs that may be incurred before the formal start of PFS
project implementation. This so-called “ramp-up” period can occur before formal project
launch to allow project partners to operationalize and refine systems. Typically, ramp-up
periods are funded separately (perhaps by a philanthropy) and are not repaid by the
government as part of the success payments. Partners must determine whether ramp-up costs
will be paid by the government or by a project investor, perhaps to be factored into success
payments later.
» Project Welcome Home: Santa Clara County’s initiative explicitly included a ramp-up
period of three months “in preparation for the start of the full six-year project.”14 These
costs were paid by the county using a fee-for-service contract and were thus excluded
from success payments.15
» Partnering for Family Success Program: In Cuyahoga County, the service provider used a
ramp-up period to “hire and train staff and develop other operations before the project
officially launched.” This gave government and case workers time to become familiar
with the PFS project and with each other, and to share clients among them (Third
Sector Capital Partners 2016, 12). The six-month ramp-up period was funded
separately by a philanthropic grant.16

M A K I N G S O U N D C O S T D E C I S I O N S I N P A Y F O R S U C C E S S P R O J E C T S 1 1
Ramp-up costs probably should be distinguished from normal project operating costs and
reported separately. The government incurs ramp-up costs only once for an intervention, but it
and its partners need to decide who pays for these costs.
Distinguish between cost elements that vary with the number of participants and cost
elements that do not. The latter are often referred to as fixed costs associated with a program.
(For example, facility leasing costs are not likely to change until the number of additional
customers exceeds a certain amount.) By contrast, actual services provided will fluctuate with
the number of people served. Such costs are known as variable costs.
Estimating Project Costs
At the end of the PFS project, to help determine whether the PFS practices should be continued, the
government will want to know the actual cost of the PFS intervention and compare it with the
estimated cost if the project had not been implemented. These actual costs should not include costs
unique to the PFS model, such as the cost of the intermediary and the in-depth evaluation, which
presumably will no longer be needed. The difference in cost is among the major criteria (along with
changes in the outcomes achieved) that the government uses at the end of the PFS project to help it
decide whether to continue, modify, or end the intervention.
Appendix A lists costs that should be included in cost estimates. The service provider’s budget will
be a major source of information for the PFS cost estimates. The government’s cost accounting system
can provide data for estimates of added costs for supporting the new intervention as well as for the
costs expected to occur without the PFS intervention.
The government will likely rely on its own cost accounting system to estimate its cost of serving the
targeted number of enrollees. If the government has no prior experience with the services proposed by
the PFS project, it may need to consult outside experts or seek cost information from other
governments that have implemented similar programs.
The following are suggestions for comparing PFS project costs to the estimated costs if the
intervention had not occurred.:
Identify costs that are probably too small to affect decisions. Exclude these costs from further
consideration.

1 2 M A K I N G S O U N D C O S T D E C I S I O N S I N P A Y F O R S U C C E S S P R O J E C T S
Estimate impact on the costs of other government programs that will be significantly
affected by the project. Costs to multiple government agencies may be increased or decreased
by the intervention. For example, interventions aimed at reducing recidivism could lower law
enforcement, court, and prison detention costs. On the other hand, the costs of providing
support services to those released could increase. These spillover effects on other government
costs can contribute substantially to the total cost of a PFS project.
» Partnering for Family Success Program: The Cuyahoga County project primarily affects
three systems: child welfare (e.g., foster care), housing, and jails. The county obtained
cost per customer data for each system and then combined these costs to estimate the
total cost of service for each client. An advantage of this approach is that unit costs can
be used to estimate costs for various numbers of people who may be served by the
intervention.
Consider the difficulty of helping the proposed mix of service recipients. The number and
percentage of total clients who are difficult to serve can be important cost factors. If the actual
mix of clients is substantially different from the mix on which cost payments were based, the
project may require more or less time and expense to achieve the desired outcomes.
One way to plan for this problem is to develop different success payment rates based on each
client’s level of difficulty. The project could define a small number of difficulty levels into which
each participant can be categorized. The government, probably in conjunction with the service
provider, will determine the success payment rate for each difficulty category. If the proportion
of participants in each category is found to be significantly different from that which the service
provider used to generate its cost estimates, contingency actions such as renegotiations may be
needed.
Obtain comparable cost information from other governments that have implemented the
intervention. Such information offers a useful comparison to the costs estimated by the
government and the service provider for the proposed application of the intervention.
Knowledge intermediaries such as the Urban Institute can help make these connections.
Estimate cost changes expected during the life of the agreement. These include annual
adjustments to employee salaries, wages, and fringe benefits, as well as increases for supplies
and equipment. For projects that last many years, such adjustments can become substantial by
the end of the project.

M A K I N G S O U N D C O S T D E C I S I O N S I N P A Y F O R S U C C E S S P R O J E C T S 1 3
Identify changes in fixed costs caused by the intervention during the life of the project.
Determine how these costs will be handled in cost comparisons. Fixed costs may increase or
decrease because of investments in the intervention such as new or modified facilities or
capital equipment. The service provider’s budget should clarify whether the provider is
expected to pay for these added costs. If the government would have incurred these same costs
without PFS, they should not be considered part of PFS project costs.
If programs outside the intervention will use new fixed capital, project partners will need to
estimate the percentage of these costs for which the PFS project is responsible.
Review the accuracy of cost and outcome data throughout the project. For example, Santa
Clara County used an independent auditor to review actual project costs. Such reviews will add
to the total cost of the intervention.
The estimated total cost of the project to the government is the sum of the expected success payments
and the estimated additional cost items (e.g., government project support for contract oversight and
special performance monitoring costs; see appendix A).
The government will likely ask for an estimate of the total cost to the government to serve the
clients specified in the contract if the intervention is not implemented. This estimate, when compared to
the government’s estimated total project cost, provides an estimate of the costs saved, or the additional
costs incurred, by the project. These estimates will be derived from the government’s cost records. The
list of cost elements in appendix A can help the government include all significant costs. In place of
“Success Payments” (cost element 6 in appendix A), the government can use its own service delivery
costs, such as labor, supplies, and equipment. These costs should include those of all government
agencies expected to be significantly affected by the intervention.
The estimate of the total cost to the government if the project is not implemented can help the
government establish its financial obligations ceiling. At the end of the project, the government will
want to compare the final costs of the project to the total cost to the government of serving the clients
specified in the contract if the intervention is not implemented, in order to discern how much more or
less expensive the project was compared with business as usual. With this information, the government
can assess whether the new intervention provides good value. Note that if the number of clients served
by the PFS project represents an expansion of the government’s current services, cost estimates both
with and without the added number of clients if the project is not implemented may be useful to the
government.

1 4 M A K I N G S O U N D C O S T D E C I S I O N S I N P A Y F O R S U C C E S S P R O J E C T S
Task 4: Determine the Success Payment Rates
Success payment rates (i.e., payment amounts per unit of outcome achieved) play a major role in
determining how much the government pays out and how much project investors recoup. The contract
should thoroughly define each outcome to be used as the basis for success payments.17 Project partners
need to develop payment rates that specify the success payment for each expected unit of successful
outcome. The sum of the outcome units achieved multiplied by their respective success payment rates
determines the amount the government is obligated to pay the investors for that amount of outcome.
This sum of the success payments for each targeted outcome over the contract period will be the
primary dollar amount of the government’s maximum contractual obligation.
Basic Principles for Success Payment Rates
Success payment rates should be fair to all parties. They should be neither so low that they
dissuade investors nor so high that they represent a bad deal for the public.
If the project successfully achieves the outcome levels targeted by the project, the success
payments should fully reimburse investors for the project costs identified in the contract and
include any fee or profit agreed to in the negotiation process.
The expected sum of the success payments should not exceed the maximum level specified in
the agreement.
Given the scrutiny that success payments are likely to face, it is important that parties are
transparent about the rates and their derivation in the contract. To avoid any potential
confusion or disagreement, success payment rates should be predictable: it should be clear
when, under what circumstances, and in what amount each payment will be made.
Suggested Steps for Calculating Success Payment Rates
PFS projects come in many forms. Each intervention requires its own unique calculations because
project specifics vary considerably. This section outlines a basic approach for developing success
payment rates. The order of these steps can vary. The procedure described below assumes that success

M A K I N G S O U N D C O S T D E C I S I O N S I N P A Y F O R S U C C E S S P R O J E C T S 1 5
payment rates are primarily used to reimburse the investors’ payments for funding the service
provider’s costs (see figure 1).
1. Identify both the amount of funding available from outside investors and the maximum
amount the government is willing to reimburse.18 These funding ceilings help determine the
length, structure, and reach of the project (e.g., how many clients can be served). State and local
governments will likely need to consider not only the aggregate amount over the course of the
project but also the estimated annual budget costs. Once the amount of funding seems
reasonably firm, proceed with the following steps.
2. Identify the number of clients expected to be served by the intervention during the life of the
project. This number will likely originate with the government and/or the service provider,
based on past workloads and the amount of funding available for the project. The number of
expected clients will directly drive the cost and structure of the project and must be large
enough to provide valid outcome information.
Although projects should strongly consider a randomized controlled trial—the most rigorous
evaluation design option—planners can be overly optimistic about the number of clients who
will be eligible for the intervention. Incorporating a comparison group can double the number
of clients for whom information will be needed. Project planners should ask: Will there be
enough eligible clients coming in for the provider to meet the proposed targets?
3. Estimate the number and percentage of clients served by the intervention who are expected
to achieve each outcome tied to success payments. The service provider should develop an
estimate based on its past client success rates, impact evaluations of similar interventions
elsewhere, and/or its projection of what it can accomplish with the funds available. If the
service provider has implemented the intervention and, especially if a rigorous evaluation has
been completed in the past, the success rates found would likely provide the best estimates for
the new project.
If the government has been using other service delivery practices to achieve the outcomes, its
own past success rates for each outcome can be compared to the estimated success rates
proposed by the service provider. If the government’s past success rate is higher than the rate
provided by the service partner, the project will need to justify the project based on potential
cost savings. The government and the service provider should examine evaluations of similar
programs to help estimate success payment rates. However, past evaluations of the

1 6 M A K I N G S O U N D C O S T D E C I S I O N S I N P A Y F O R S U C C E S S P R O J E C T S
intervention may not apply if the new intervention is scaled in a different location or serves a
different target population.
The expected number of successes is the client success rate multiplied by the number of clients
estimated to be served by the project. For example, if 150 clients are estimated to be served and
the estimated success rate is 30 percent, then 45 clients are expected to be successfully served
by the project. This product will be related to the total expected project cost to provide the
success payment rate.
4. Obtain the service provider’s estimated total cost. Obtain from the service provider its
estimated total and annual costs over the project period to serve the target number of clients at
the specified service level. This estimate will likely be based on the government’s estimates of
the expected number of clients each year of the target population and/or the provider’s past
costs from similar interventions. The service provider’s cost estimates should allow for
contingencies and normal cost increases over the project period.
5. Calculate the service provider’s estimated cost per client successfully served. This is the
success payment rate if the government will not also repay special PFS costs such as fees or
profits, project management, evaluation, and ramp-up. This rate can be calculated by dividing
the service provider’s total project estimated cost (obtained from step 4) by the estimated
number of customers for whom successful outcomes are achieved (obtained from step 3).
For example, assume the total estimated cost for the project is $1,000,000 and the additional
number of clients for whom successful outcomes are expected is 120 (based on 200 clients
expected to be served and a 60 percent success rate). Then, the estimated cost per client for
whom successful outcomes are expected is $8,333 ($1,000,000 divided by 120). This is the
success payment rate if the items discussed in steps 6 and 7 are not paid for through success
payment rates.
6. Add the expected fee or profit percentage to the amounts obtained in step 4 (which become
part of the government’s cost). The totals then are the success payment rates. These success
payment rates do not include the costs that the government incurs for such PFS activities as
ramp up costs, the cost of the intermediary, the cost of the evaluation, and any internal
government project management costs. The government may or may not incur these costs.
Typically, these costs have been funded separately.

M A K I N G S O U N D C O S T D E C I S I O N S I N P A Y F O R S U C C E S S P R O J E C T S 1 7
Typically, PFS projects are able to start measuring outcomes annually within a year or two of
service provision. These outcomes are followed by success payment determinations (also
yearly). An alternative is to pay the fee and profit margin at the end of the project and not
include fees or profit margins in the success payment rates.
Consider increasing the success payment rate if the societal benefit for success is large enough
to warrant the added expenditure and funding is expected to be available. Such payments might
be made at the end of the project if some minimum amount of added success occurred. Such
added payments for achieving high levels of success might also serve as an incentive to the
service provider if the funders agreed to share these added amounts with them.
FIGURE 1
Calculating Success Payment Rates

1 8 M A K I N G S O U N D C O S T D E C I S I O N S I N P A Y F O R S U C C E S S P R O J E C T S
Success Payments Using Multiple Outcomes
If only one outcome is tied to success payments, the unit cost factor can be readily calculated as
described above. However, PFS agreements have usually called for success payments based on multiple
outcomes. With more than one outcome, each with its own success payment rate, complications arise
and it becomes necessary to allocate the total costs of the project among the multiple outcomes. The
project partners need to determine how much of the total project costs should be allocated to each
outcome.
If the costs associated with each success payment are fully distinct from each other, this issue can
be handled easily.
Consider a $4 million homelessness reduction project that has two outcome measures: number of
bed-days avoided and number of clients placed into permanent housing. Assume the service provider
and the government agree that $3,000,000 is needed to provide temporary sleeping arrangements and
$1,000,000 is needed to place clients in permanent housing. The service provider estimates that its
program will avoid 1,000 bed-days and house 200 individuals in permanent supportive housing. The
bed-day cost factor would be $3,000,000 divided by 1,000, yielding a success payment of $3,000 per
bed day avoided. Similarly, the second success payment would be $1,000,000 divided by 200, yielding a
success payment of $5,000 per individual who achieves housing stability.
However, if some of the costs simultaneously affect more than one outcome, another basis for
allocating the project cost among outcomes will be needed, especially if different government
organizational units are involved.
These decisions may simply be left to their mutual discretion. Judgments might be based not only
on recent government costs, but also based on the extent to which each outcome is expected to (a)
achieve cost savings; (b) be important to clients and the community; or (c) be some combination of
incurring cost, savings costs, and importance of each outcome.
» Child-Parent Center Pay for Success Initiative: Chicago’s project uses three outcome
metrics: kindergarten readiness, avoidance of special education placement, and third-
grade literacy. Many of the project’s activities and costs affect multiple outcomes.
Allocating portions of the cost of these activities among the three outcomes relied on
judgments of the importance of each outcome and the potential for future cost savings
(e.g., from avoiding special education).19

M A K I N G S O U N D C O S T D E C I S I O N S I N P A Y F O R S U C C E S S P R O J E C T S 1 9
Need for Government Cost Analysis Capability
Obtaining cost information can be difficult, especially if the government does not have experienced cost
analysts or a reliable cost accounting system.
Specialized cost analysis personnel may be needed. For example, costing special education avoided
is not as easy as it may appear. What programs and cost elements are involved? Savings from reductions
in the need for special education may include not only the time of special education teachers but also
special support services from other agencies.
As a backup approach, the government might use outside expertise to help make the various
estimates. Most PFS projects have used outside help to develop at least some of the cost estimates
described above. For example, the Harvard Kennedy School Government Performance Lab has
provided technical assistance to a number of sites exploring pay for success. This support has included
estimation of cost-benefit analysis for potential outcomes.20
Other Options for Calculating Success Payments
EXTERNAL STANDARD PRICES PER UNIT OF OUTCOME
A public or private independent organization could derive a set of success payment values that any
government agency could later adapt without further analysis. To our knowledge, this approach has
only been used in the United Kingdom, the first country to implement PFS, or “social impact bonds.”
The UK Department of Work and Pensions developed a “rate card” for projects linked to improved
employability. Its 2015 rate card for social impact bonds included nine payments for each individual
outcome (e.g., £1,400 per student for improved attendance, £3,300 for achieving competence at level 2
on national occupational standards, £3,500 on entrance into employment, £2,000 for sustained
employment). The rate card also established a maximum amount payable per individual (£11,700).
This approach is attractive because it avoids the need for each project to undertake the cost
analysis described above. However, it is not likely to be adopted in the United States, at least in the near
future, if for no other reason than that each American PFS project has its own unique features.
Additionally, this approach has some limitations related to evaluation including the inability to estimate
whether the intervention itself caused the outcomes.21 Nevertheless, as more PFS projects are

2 0 M A K I N G S O U N D C O S T D E C I S I O N S I N P A Y F O R S U C C E S S P R O J E C T S
implemented, individual governments will want to review and compare their success payment rates
with those of projects tackling similar societal problems.
SOCIETAL VALUE OF ACHIEVED OUTCOMES
The government, other project partners, and the public are likely to consider the larger societal value of
expected outcomes, beyond reducing future government costs. producing some outcomes that cannot
be readily expressed in quantitative terms. The quantitative outcomes used in PFS projects can fall
quite short of covering all the qualitative benefits of the intervention.
As noted, this disparity could lead the government to increase the success payment rates or provide
extra bonuses for meeting or exceeding outcome targets if funding is available (Rohacek and Isaacs
2016, 14–15). These additional payments can provide an incentive for the service provider to improve
its success rates if the investors share those added payments, in part or in full, with the service provider.
If the project undertakes a cost-benefit analysis including broader societal costs and benefits, it
could provide an estimate of the monetized value of those outcomes. This estimate could add to or
substitute for the cost-based success payment rates described in Task 4. Cost-benefit analysis can be
complex and costly but appropriate if major societal benefits are sought and constitute the main
motivation for the intervention.

A P P E N D I X 2 1
Appendix A. List of Government PFS
Cost Elements This section lists typical cost elements to consider when estimating a project’s total cost to the
government. The specific terms of a PFS agreement will determine which of these cost elements are
relevant and whether other cost elements also need to be considered.
In the process of developing the PFS agreement, the government will want estimates of (1) the
costs of each relevant element if the PFS project is not implemented and (2) the expected costs if the
project is implemented. These estimates will enable the government to calculate total cost savings (or
increases) expected from the PFS project.
The agreement must also specify which costs will be borne by which partner. Moreover, if the
proposed project increases the number of clients to be served, the government should include any
spending needed to accommodate this increase in its estimate of costs if the project is not implemented.
APPENDIX TABLE A.1
Basic List of Cost Elements
The government and its PFS partners may refer to this list of cost elements to check that their contract clarifies
each party’s cost responsibility. The government only needs to consider those cost elements for which it is
responsible.
Initial PFS project development costs
One-time or periodic investment costs
Annual operating and maintenance costs
1. Negotiation, intermediary, and evaluation
2. Ramp-up 3. Special consultants and/or
contractors
4. Leasing new facilities or modifying existing facilities
5. New or modified equipment
6. Success payments 7. Government project support 8. Data quality cost controls 9. Transportation 10. External project management 11. Overhead 12. Inflation 13. Contingency costs 14. Added premiums 15. Other costs
Initial PFS Project Development Costs
1. Negotiation costs. PFS projects require substantial time and effort to set up. This cost element
includes specialized legal, financial, and procurement costs that the government incurs. PFS

2 2 A P P E N D I X
projects typically also engage an intermediary organization and an external evaluation
organization, both of which are contracted at the outset to provide services throughout the life
of the project. The agreement should specify who is responsible for these costs. Typically, the
government and the investors pay for their own costs separately. The costs of the intermediary
and the evaluator are not usually covered directly by the government. If these costs will be
borne by the investors and not by the government, they will not be relevant to estimates of the
government’s PFS project costs.
2. Ramp-up costs. Some projects include a pre-launch ramp-up or pilot test period to allow
project partners to operationalize and refine systems. The service provider may need to work
with a small number of clients before launch in order to become familiar with the government’s
operating procedures and information systems and to establish working relations with
government employees. For some projects, this process could take one year or more. Ramp-up
or pilot periods have often been funded by philanthropies with no added impact on government
costs.
3. Special PFS-related consultant and contractor costs, such as those incurred to help the
government determine project feasibility and success payment rates. These costs are typically
paid separately by the government.
One-Time or Periodic Investment Costs
These costs can be amortized over the period of the agreement in order to provide estimates of annual
costs (Ammons 2002, chap. 11). If any investments will be used jointly by other government programs,
the PFS project’s share of the costs will need to be determined.
4. Investments in, or leasing of, new or modified facilities.
5. New or modified equipment (e.g., computer or communications-related equipment).
Annual Operating and Maintenance Costs
6. Success payments. The major potential cost to the government will be success payments to
investors, to the extent that successes are realized. The government will want to know its total
obligation if the program meets its success targets. PFS contracts can provide success
payments throughout the life of the project, with the government repaying investors for early

A P P E N D I X 2 3
outcomes. If the project achieves the planned outcomes, investors will collect both the up-front
costs paid for service delivery as well as a fee from the government. Fee or profit percentages
might be included as part of early success payments. Alternatively, the government may
withhold payment of any such fees or profits until the project is completed and has achieved
the promised outcomes. At the end of the project, these investor fees and profits would not
need to be considered when the government estimates the cost to continue the intervention.
The budget provided by the service provider, after negotiation with the government and
investors, will likely be the primary basis for developing the success payment rates (as
described in Task 4). If the service provider subsequently finds its cost to be much higher, or
much lower, than its agreed-on budget, contingency clauses in the agreement might kick in.
7. Government project support. This includes staffing costs (salary, wages, and fringe benefits)
for government staff that (a) work with the service provider, (b) provide project oversight, and
(c) track the outcomes detailed in the project agreement but not currently collected by the
government (e.g., special IT costs needed for collecting, processing, and analyzing new
performance data, to the extent that these costs are the government’s responsibility). This cost
element also covers additional supplies and equipment (e.g., computers, phones, and furniture)
that will need to be procured for use by the service provider and any additional utilities (e.g.,
janitorial services, heating, electricity, air conditioning) that are the responsibility of the
government and not the service provider.
8. Additional data quality control costs, such as those for special audits required by the
government.
9. Added transportation costs, such as those needed to reach customers living in rural areas.
10. External project management costs. PFS projects typically require an external intermediary
organization to manage activities such as determining and processing the success payments
(based on feedback from the project evaluator) and handling communications among the
investors and other stakeholders. In the PFS projects we studied, the costs of these
intermediaries were not borne by the government.
11. The project’s share of government overhead costs (e.g., contract and grant administration,
finance, personnel office, housekeeping). Such costs apply to multiple programs simultaneously.
For cost accounting purposes, they can be spread over those programs according to
characteristics such as program staff size.22
12. Inflation costs. These have been small in recent years but could grow, particularly with long-
term agreements.23
13. Contingency costs. The agreement should build in a cushion for unanticipated expenses.
2 4 A P P E N D I X
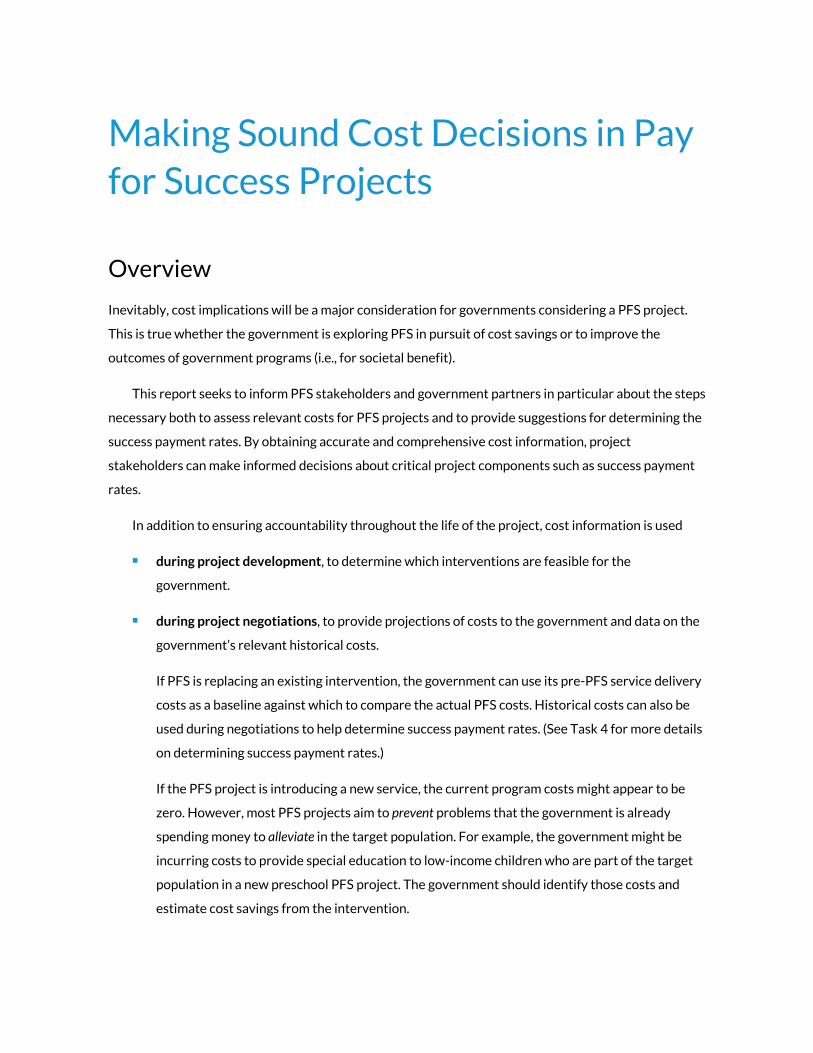
14. Any added premiums above the amounts specified in the contract, provided to the investors
and/or the service provider. These include premiums for risks taken or special incentives for
the service provider. For example, the Santa Clara County project “provides a small premium
commensurate with the risk they are taking, referring to the risk taken by both the investors
and the service provider.”24
15. Other costs applicable to the project. This category includes the intervention’s cost effects
(potential increases or decreases) on programs in other government agencies.
If the service provider relies substantially on volunteer work, the government may need to convert
volunteer time into paid employee time after the project ends. The cost of those paid employees would
need to be included in cost estimates used to determine whether to continue the intervention. If the use
of volunteers is an inherent part of the delivery process and the government continues to use
volunteers, we do not recommend that imputed costs of the volunteers be included in calculations of the
intervention cost. These imputed costs would not appear in the government’s budget. However, any
cost to the government of overseeing the volunteers would need to be included in the estimate.

N O T E S 2 5
Notes 1. The Urban Institute hosted the 2017 National Pay for Success Symposium on June 22–23, 2017, in
Washington, DC. For more details, see http://pfs.urban.org/pay-success/events/2017-national-pay-success-
symposium.
2. Based on telephone interview with Santa Clara County officials.
3. County of Cuyahoga, “Pay for Success Contract among Cuyahoga County, Ohio, Mental Health Services for
Homeless Persons, Inc. d.b.a. FrontLine Service and Cuyahoga PFS, LLC,” executed October 28, 2014,
http://www.payforsuccess.org/sites/default/files/resource-files/cuyahoga-county-pfs-contract_0.pdf.
4. United Way of Salt Lake, “Social Impact Bond for Early Childhood Education Shows Success,” news release,
October 7, 2015, http://www.uw.org/news-events/news-releases/2015-news-releases/10-07-2015-20sib-
20news-20release-20final-2.pdf.
5. City of Chicago, “Loan Agreement and Pay for Success Contract between City of Chicago and IFF Pay for
Success I, LLC,” issued October 8, 2014, http://www.payforsuccess.org/sites/default/files/resource-
files/o2014-8677_0.pdf.
6. County of Santa Clara, “Pay for Success Agreement by and between the County of Santa Clara and Abode
Services,” executed June 23, 2015, http://www.payforsuccess.org/sites/default/files/resource-
files/Attachment-139169.pdf, 13–15.
7. Chicago, “Contract.”
8. Santa Clara, “Agreement,” 4.05(b)(ii).
9. “Fact Sheet: The Cuyahoga Partnering for Family Success Program,” Urban Institute Pay for Success Initiative,
http://www.thirdsectorcap.org/wp-content/uploads/2014/12/141204_Cuyahoga_PFS_Fact-Sheet.pdf, 4.
10. “Fact Sheet: The Massachusetts Juvenile Justice Pay for Success Initiative,” Urban Institute Pay for Success
Initiative, http://www.goldmansachs.com/our-thinking/trends-in-our-business/massachusetts-social-impact-
bond/MA-juvenile-justice-pay-for-success-initiative.pdf.
11. Such modifications could complicate the interpretation of evaluation results to determine the program’s
impact. For example, if an evaluation purports to study the effectiveness of program A but, because of
implementation changes, studies program B, the evaluation may be misleading. To mitigate this effect, when
the service provider makes substantial changes to its procedures, the government and the provider should
examine the potential impact on costs and outcomes to determine whether any contract modifications are
needed.
12. The service provider for Cuyahoga County’s Partnering for Family Success Program identified flexible funds in
its budget for handling client needs (Third Sector Capital Partners 2016, 13).
13. Cuyahoga, “Contract,” 35.
14. County of Santa Clara, “Agreement/Amendment 77051: Pay for Success Project regarding Chronic
Homelessness: Project Welcome Home,” approved June 23, 2015,
http://sccgov.iqm2.com/Citizens/FileOpen.aspx?Type=30&ID=68998&MeetingID=6059, 2.
15. Interview with Santa Clara County public official, May 1, 2016.
16. Interview with Cuyahoga County public official, April 14, 2016.
17. The identification of the specific outcomes to be used is beyond the scope of this report. However, outcomes
should be estimates that represent as closely as feasible the number of additional successes that occurred

2 6 N O T E S
compared with what would have occurred if the intervention had not been implemented. The determination of
the amount of successful outcomes is the role of the PFS independent evaluation.
18. This maximum funding available ceiling can be reached in a number of ways. See, for instance, Rohacek and
Isaacs 2016.
19. Chicago, “Contract,” exhibit 1.
20. For more information, see “Harvard Kennedy School Government Performance Lab: Grantee Information,”
Corporation for National and Community Service, https://www.nationalservice.gov/programs/social-
innovation-fund/pay-success/harvard-kennedy-school-social-impact-bond-lab.
21. Matthew Eldridge, “How the UK Pays for Success,” PFS Perspectives (blog), Urban Institute, May 23, 2016,
http://pfs.urban.org/pay-success/pfs-perspectives/how-uk-pays-success.
22. For further details and options, see Ammons 2002, chap. 12.
23. For further details and options, see Ammons 2002, chap. 16.
24. Santa Clara, “77051,” 5.

R E F E R E N C E S 2 7
References Ammons, David N. 2002. Tools for Decision Making: A Practical Guide for Local Government. Washington, DC: CQ
Press.
Archer-Rosenthal, Dana. 2016. Pay for Success: The First Generation. New York: Nonprofit Finance Fund.
Cunningham, Mary, Mike Pergamit, Sarah Gillespie, Devlin Hanson, and Shiva Kooragayala. 2016. Denver Supportive
Housing Social Impact Bond Initiative. Washington, DC: Urban Institute.
Rohacek, Monica, and Julia Isaacs. 2016. Outcome Measurement and Pricing: Pay for Success Early Childhood Education
Toolkit Report #3. Washington, DC: Urban Institute.
Third Sector Capital Partners. 2016. Developing the Cuyahoga Partnering for Family Success Program: Partner
Perspectives and Lessons Learned. Boston, MA: Third Sector Capital Partners.

2 8 R E F E R E N C E S
About the Authors Harry Hatry is a distinguished fellow in the Metropolitan Housing and Communities Policy Center at
the Urban Institute, where he has been a leader in developing performance management/measurement
and evaluation procedures for public agencies since the 1970s. He has worked with a wide range of
local, state, and federal agencies—internationally and nationally—to develop outcome measurement
procedures for such services as public safety, health, transportation, education, parks and recreation,
social services, environmental protection, and economic development.
Matthew Eldridge is research manager of the Urban Institute’s Pay for Success Initiative. His interests
include impact investing and broader political economy issues. Before joining Urban, he worked at a
private consultancy on financial services regulatory issues and, prior to that, at the World Bank on
operations policy and as part of the Central Asia portfolio team. He earned his BA from Virginia Tech
and his MSc from the London School of Economics—both in international development.
Arden Kreeger is a former project associate in the Policy Advisory Group at the Urban Institute, where
her research focused on pay for success and early childhood education. She is currently with the Social
Sector Practice at McKinsey & Company, where she serves clients in philanthropy, global health, and
education.
Reed Jordan is a former research associate with the Policy Advisory Group at the Urban Institute. He
managed the Housing Assistance Matters Initiative, provided technical assistance to grantees of the US
Department of Education’s Promise Neighborhood program, and evaluated the early implementation of
the US Department of Housing and Urban Development's Choice Neighborhoods initiative. He earned
his BA from Carleton College and is currently pursuing his master’s in City Planning at MIT.
S T A T E M E N T O F I N D E P E N D E N C E
The Urban Institute strives to meet the highest standards of integrity and quality in its research and analyses and in
the evidence-based policy recommendations offered by its researchers and experts. We believe that operating
consistent with the values of independence, rigor, and transparency is essential to maintaining those standards. As
an organization, the Urban Institute does not take positions on issues, but it does empower and support its experts
in sharing their own evidence-based views and policy recommendations that have been shaped by scholarship.
Funders do not determine our research findings or the insights and recommendations of our experts. Urban
scholars and experts are expected to be objective and follow the evidence wherever it may lead.

2100 M Street NW
Washington, DC 20037
www.urban.org


![Teachers’ Pay Policyd6vsczyu1rky0.cloudfront.net/30666_b/wp-content/... · NAHT NASUWT NEU UCAC . MODEL TEACHERS’ PAY POLICY 2018/19 [4] ... will be prepared to explain decisions](https://img.pdfslide.net/doc/110x75/5f8d05dfb138de184f7e979c/teachersa-pay-naht-nasuwt-neu-ucac-model-teachersa-pay-policy-201819-4.jpg)