Embed Size (px)
Citation preview
Research Report of Department of Civil and Environmental Engineering, Saitama Univ., Vol.39, 2013
21
THERMAL PROPERTIES FOR PEATY SOIL UNDER VARIABLE SATURATION AND THEIR
CORRELATION TO MASS TRANSPORT PARAMETERS IN GASEOUS AND AQUEOUS PHASES
Shiromi Himalika DISSANAYAKA 1)
, Shoichiro HAMAMOTO 1)
, Toshiko KOMATSU 1)
,
and Ken KAWAMOTO 1)
1)
Soil Mechanics Lab., Department of Civil and Environmental Engineering, Saitama University
ABSTRACT
A thorough understanding of the various heat and mass transport processes inside peaty soils is vital for
assessing and simulating the green house gas emissions, especially methane from the wetlands. This doctoral
work is presented in three main studies that include new laboratory measurements on the key soil heat and mass
transport properties (for heat, gas, and water movement) on different peats from Japan and Sri Lanka (under
moisture conditions ranging from wet to dry), the development of new descriptive and predictive parameters
models including a unified model approach for heat, and gas, and water transport properties built on the classical
Archie (1942) model, testing and validation of the predictive models on both dependent and independent data
sets, and introducing the concept of “most likely windows” for heat and mass transport parameters in variably
saturated peat soils; the latter for examples highly useful for predicting the most likely effects of peat and
wetland areas (including the effects of planned changes in area use and land management) in local-, continental-,
and global-scale climate simulation models.
KEYWORDS: Peaty soil, Heat and Mass Transport, Soil Physical Properties
1. INTRODUCTION
Wetlands are recognized as a significant element in
the natural environment. The wetland is also
known as a source of atmospheric methane,
typically produced by microbiological and
chemical processes under anaerobic conditions.
Physical, chemical and biological processes inside
the wetland are depending on the heat and mass
transfer processes in the soil. Thus the knowledge
of mass and heat transport characteristics is
important for accurate assessments of the
environmental functions of the wetland and
developments, hereunder understanding and
simulating the emissions of the greenhouse gases
from the wetlands.
Peaty soil can be found in many types of
wetlands. Peat is one of several biolites and its
properties can be varying even for samples from
adjacent part of a wetland (Tuncer et al., 1986).
Peat contains high organic matter content, resulting
in high water holding capacity (Hobbs, 1986) and
high total porosity around 90%. Volume shrinkage
during drying processes is also an important
characteristic found in peaty soils (Oleszczuk and
Brandyk, 2008).
1.1 Heat and Mass Transport in Peaty Soils
Heat transport in the soil is mainly
governed by soil thermal properties such as thermal
conductivity (λ) and the volumetric heat capacity
(C). Soil thermal conductivity refers to the ability
of soil to conduct heat. Thermal conductivity of a
soil depends on volumetric properties of the soil
components ( i. e. organic matter, minerals, water
and air content) and interfacial contacts between
the liquid and solid phase (i.e. structural
arrangement of the soil). Heat capacity is the
quantity of heat required to raise the temperature of
a unit volume of the substance, by one degree. This
is governed by the relative proportions of soil
constituents (e.g., air, water, mineral material and
organic material) and the heat capacities of these
constituents. Although, many studies have been
conducted on thermal properties of mineral soils,
there are only a limited number of studies done on
thermal properties of peat soils which measured λ values for highly organic soils and forest litters
including peaty soils (e.g., Konovalov and Roman,
1973; Sharratt, 1997; Lauren, 1997).
Gas transport in the soil is basically
controlled by diffusive and advective gas transport
processes. The gas diffusion coefficient, Dp (cm2
s-
1) governs diffusive gas transport by soil-gas
concentration gradient while soil air permeability,
ka (µm2) governs the advective gas transport
induced by a soil-air pressure gradient. Many
researchers have conducted studies on normal
mineral soils and developed several empirical and
theoretical predictive models on gas transport
parameters. However, the studies reported on peaty

Research Report of Department of Civil and Environmental Engineering, Saitama Univ., Vol.39, 2013
22
soils are very limited.
1.2 Objectives of this Study
To measure and characterize mass and heat
transport parameters in peaty soils
To develop predictive models for transport
parameters of peaty soils
2. MATERIALS AND METHODS
2.1 Study Site and Soils
Undisturbed peaty soil sample cores were
collected from three different peaty soil profiles at
Bibai marsh, Hokkaido in Japan for λ, Dp, ka and kw
measurements. Dp, ka and kw data sets from
previous studies on the same study site were also
used in the analysis (Iiduka et al., 2008; Kawamoto
et al., 2009; Dissanayaka et al., 2012).
The basic physical and chemical soil properties
of the peaty soil samples are shown in Table 1.
Fiber content (H) of the soil samples was measured
by HCl washing method. The disturbed peaty soil
samples were ignited in a muffle furnace at 700 oC
for 4 hours to determine the loss on ignition (LOI).
The carbon to nitrogen ratio (C/N ratio) and
soil organic carbon (SOC) were determined using
an automatic C-N analyzer (CHN corder MT-5,
Yanaco, Kyoto). The pH for the extracted soil
solution was weakly acidic for each sample.
All soil samples were highly porous, showing
total porosities at water saturation (Sat.) of more
than 0.86 m3 m
-3.
The intact sample cores were initially water-
saturated and subsequently drained to the desired
pF [= log (-ψ), (where, ψ is soil-water potential in
cm H2O)] using either a hanging water column
Table 1. Physical and chemical properties for soil
samples
column (pF = 0 - 1.9) or a pressure chamber (pF =
2 - 4.1). Air dry condition was achieved by drying
the soil samples in an oven at 300
C for three days
and kept in a climate controlled room at 250 C and a
relative humidity of 60 % for three days
(Dissanayaka et al., 2012). After achieving
equilibrium at each pF condition, height, cross
sectional area and weight of each sample were
measured to determine volume shrinkage and
volumetric water content (θ , m3 m
-3).
Gas diffusivity (Dp), air permeability (ka),
Thermal conductivity (λ), and water permeability
(kw) were measured on the undisturbed core
samples after drainage into desired soil moisture
suction level (pF level). We used the Dp data for
Peat 1 and 3 soils from literature as follows: Peat 1
from Hamamoto et al. (2012) and Peat 3 from
Iiduka et al. (2008).
All Dp data from the literature were measured
using a diffusion chamber method (Currie, 1960;
Rolston and Moldrup, 2002). The ka for Peat 1 soil
samples were measured by flowing air through soil
core at three different flow rates (0.2-2.3, 1.7-10.3,
and 5.7-60 dm3 min
-1) and the parameter was
calculated based on Darcy’s equation. (Iversen et
al., 2001). The λ was measured by using a portable
thermal properties analyzer with a dual needle
probe (KD2-Pro and SH-1, Decagon Devices Inc.,
WA) (Dissanayaka et al., 2012). The hydraulic
conductivity (kw) of peaty soil samples were
measured during the main drying experiment by the
steady-state method (Dirksen, 1999; Kawamoto et
al., 2004).
Depth
Layer Water
content
Particle
density
Dry bulk
density
Saturated
hydraulic
conductivity
Total
Porosity
cm wf
% ρs
g cm-3
ρb
g cm-3
Ks†
cm s-1 φ
cm3 cm-3
LOI
%
SOC
%
C/N pH‡
Sat. A.D. Sat. A.D.
Peat 1 10 H2 1211 1.42 0.10 0.12 3.68E-03 0.93 0.91 89.3 60.6 28.0 3.1
20 H3 573 1.49 0.21 0.41 3.96E-03 0.86 0.72 36.2 33.3 19.0 5.1
30 H3 592 1.37 0.16 0.44 3.69E-03 0.89 0.68 47.5 36.5 26.0 4.8
Peat 2 10 AH 283 2.63 0.32 0.89 5.75E-03 0.88 0.66 46.5 89.7 41.7 4.5
20 H1 697 1.86 0.11 0.29 3.94E-04 0.94 0.85 95.2 72.9 54.5 4.6
40 H2 922 1.44 0.13 0.30 2.15E-03 0.91 0.79 94.4 86.6 81.3 4.6
50 H2 955 1.80 0.11 0.34 1.72E-03 0.94 0.81 94.6 72.8 85.0 4.3
Peat 3 30 H2 720 1.54 0.11 0.19 4.61E-04 0.93 0.87 91.2 64.8 28.8 4.6
40 H2 833 1.52 0.10 0.22 2.79E-03 0.94 0.86 93.3 81.2 23.8 5.0
60 H3 953 1.48 0.08 0.19 1.64E-03 0.95 0.87 84.5 81.6 28.5 4.8
† ref
is defined as near- saturation, at or around pF 1.

Research Report of Department of Civil and Environmental Engineering, Saitama Univ., Vol.39, 2013
23
3. THERMAL PROPERTIES OF PEATY
SOILS: NEW MODELS
3.1 Model Development
Existing Models for Thermal Conductivity
The λ model proposed by de Vries (1963)
considers volumetric fractions of each phase,
weighting factors which are dependent on thermal
conductivities of each phase (i.e., solid, water, and
air), and the geometric shape of the soil particles.
The de Vries (1963) model can be written in a
general form as,
(1a)
(1a)
1
,,
113
1−
=
−+= ∑ i
w
s
cbai
s gkλλ
(1b)
1
,,
113
1−
=
−+= ∑ i
w
app
cbai
a gkλ
λ (1c)
where, λw is the thermal conductivity of water, λs is
the thermal conductivity of the solid phase (e.g.,
organic matter), and λapp is the apparent thermal
conductivity of air-filled pore space. The λapp (W
m-1
K-1
) is made up partly of normal heat
conduction (λa) and partly of vapor movement (λv).
The θ, σ, and ε (m3 m
-3) variables are the
volumetric fractions of water, solids, and air,
respectively. The ks and ka variables are the
weighting factors for solid and air phases
determined by λ for each phase and geometric
shape of the soil particles (g), ga, gb, and gc
represent the depolarization factor of the ellipsoid
in the direction of the a-, b-, c-axis, respectively,
satisfying ga + gb + gc = 1. For highly porous
materials such as peaty soils, de Vries (1963)
assumed the existence of continuous air-filled pore-
networks at ε > 0.5 and considered the soil system
as volume of air with long circular cylinders of wet
peat included. At ε > 0.5, the following equations
for a predictive λ model were suggested,
++
λ++λ=λ
)(
)(
θσε
θσε
sw
swswapp
k
k (2a)
++
=σθσλθλ
λs
sswsw
k
k (2b)
1
,,
113
1−
=
−+= ∑ i
a
sw
cbai
sw gkλλ
(2c)
where, λsw and ksw were the λ and weighting factor
for the solids and water mixture, respectively. de
Vries (1963) also suggested using λa instead of λapp
for peaty soil in dry conditions (θ < 0.1) and
estimated the λ for Fairbanks peat (a fibrous brown
peat) using the above two-region model, showing
good agreement with the experimental data.
Campbell (1985) proposed an empirical
equation for estimating thermal conductivity of soil,
( ) ( )[ ]ECDABA θθλ −−−+= exp (3)
where, A, B, C, D, and E are parameters dependent
on soil physical properties.
Becker et al. (1992) developed empirical
correlations for predicting soil thermal conductivity
as a function of the degree of water saturation and
dry bulk density based on measured λ data for soils
with different soil textures. The proposed λ model
can be written as,
( ) ( )[ ]4321 sinhsinh kkkkS −+= λ (4)
where, S is the degree of water saturation, k1, k2, k3,
and k4 are the fitting parameters. The values of k1 to
k4 for unfrozen peat were suggested as k1 = 28, k2=
6, k3=-1.9, and k4= -1.5.
3.2 Water Retention Characteristics and
Volume Shrinkage during Drying
Except for surface layers (i.e., to 10 cm depth) for
both Peat 1 and Peat 2, all soils exhibited high
water retention characteristics up to pF 1.8, where
around 60-70% of water saturation was still
maintained, indicating the formation of a well-
developed organic matrix with micro-pore structure
that increased with increasing degree of
decomposition. After pF 1.8, most samples showed
a decrease of Φ and increase of σ with increasing
pF due to volume shrinkage of the samples during
the drying process.
3.3 Thermal Conductivity and Heat Capacity of
Peaty Soils
Figure 1 shows the measured thermal
conductivities (λ) and heat capacities (C) for all
peaty soil samples as a function of θ. Each figure
also shows regression lines and the 95% confidence
interval curves for the estimates by the t-test.
Both thermal properties (λ and C) showed a
linear increase with increasing volumetric water
content. In general, for mineral soils such as sandy
soils, λ is known to rapidly increase with
increasing θ, especially at dry conditions since soil
water improves thermal contacts between soil
particles, which have a higher thermal conductivity
than water (0.57 Wm-1
K-1
) (Hamamoto et al.,
2010; Becker et al., 1992).
++
++=
εσθ
ελσλθλλ
as
appassw
kk
kk

Research Report of Department of Civil and Environmental Engineering, Saitama Univ., Vol.39, 2013
24
The linear increase of λ with θ for the peaty
soils suggests that water content is the most
controlling factor for the λ as supported by the fact
that the thermal conductivity of organic matter is
much lower (0.25 Wm-1
K-1
) than that of water (de
Vries, 1963). In addition, increased solids contents
(σ) due to the volume shrinkages after pF 1.8 did
not significantly affect the linear λ and C trends
with θ at dry conditions, again indicating small
contributions of organic matter to thermal
properties and less effects of volume shrinkage on
thermal properties.
The slopes in Fig. 1a and 1b (0.51 and 3.66
respectively) are slightly lesser than the expected
values which λ (λ = 0.57 (λ w) from de Vries,
1963), and C for water (C = 4.18 (Cw) from de
Vries, 1963) correspondingly. These deviations are
possibly due to the water phase tortuosity and
existence of isolated water as well as volume
shrinkage with drying since water in high organic
soils has highest λ and C of the three phases (i.e.,
organic matter, water, and air). The clear linear
trends of λ and C with θ suggest the applicability
of simple linear functions of volumetric water
content for the prediction of thermal properties.
Fig. 1. (a) Thermal conductivities (λ) and (b) heat capacities (C) as a function of volumetric water content
(θ) for Peaty soil samples. Regression lines, Eqs. (9) and (10), and 95% confidence curves are given.
Fig. 2. (a) Thermal conductivities and (b) heat capacities at dry condition, λdry and Cdry, for Peaty soil samples as
a function of volumetric solid content (σ).
Research Report of Department of Civil and Environmental Engineering, Saitama Univ., Vol.39, 2013
25
09.051.0 += θλ (5)
63.066.3 += θC (6)
Measured λ and C for sieved ground and
intact samples at dry conditions (λdry and Cdry) are
shown in Figs. 2a and 2b, respectively. Both λdry
and Cdry linearly increased with increasing σ. The
solid lines in Figs. 2a and 2b represent conditions
between the thermal properties of air (i.e., σ = 0)
and organic matter (i.e., σ = 1) where λ of 0.025
and negligible C (i.e., C = 0) values for air and λ of
0.25 and C of 2.5 values for organic matter were
used, by referring to de Vries (1963). The two lines
for λ and for C well captured the measured λdry
data for all samples and Cdry data for intact samples,
respectively, showing the reliability of literature
data for thermal properties representing typical
natural organic matter compositions.
025.0225.0 += σλdry (7)
σ5.2=dryC (8)
The simple linear functions of the volumetric solids
content seem promising for evaluating the thermal
properties of organic matter for soils at different
compaction levels.
3.4 New Model Development
Based on the findings that λ and C increased
linearly with increasing θ and the slopes were
similar to λ and C values of water, predictive
models (in literature frequently called mixing
models) based on three phase fractions (solid,
water, and air phases) were developed for
estimating the thermal properties of peat soils.
When negligible λ and C values of air were
assumed (since the λ and C values of air is
comparatively lower than that of water), the mixing
models for λ and C can be expressed as,
wdry f θλλλ λ+= (9)
wCdry CfCC θ+= (10)
where, fλ and fC are the impedance factors
representing liquid phase tortuosity factors for λ
and C, respectively (Moldrup et al., 2001; Olesen et
al., 2001). In this study, the ratio of the obtained
slope of the λ−θ relation (0.51, Fig. 1a) to λw (0.57;
de Vries, 1963) and the ratio of the obtained slope
of the C-θ relation (3.66, Fig.1b) to Cw (4.18; de
Vries, 1963) were assumed to express liquid-phase
tortuosities for λ and C, respectively, giving fλ =
0.89 and fC = 0.88. When the predictive λdry and
Cdry models as a function of σ were introduced into
Eqs. 9 and 10, the proposed λ and C models can be
written as,
θλσλ w89.0)025.0225.0( ++= (11)
wCC θσ 88.05.2 += (12)
3.5 Model Performances of the Predictive
Models for Thermal Properties
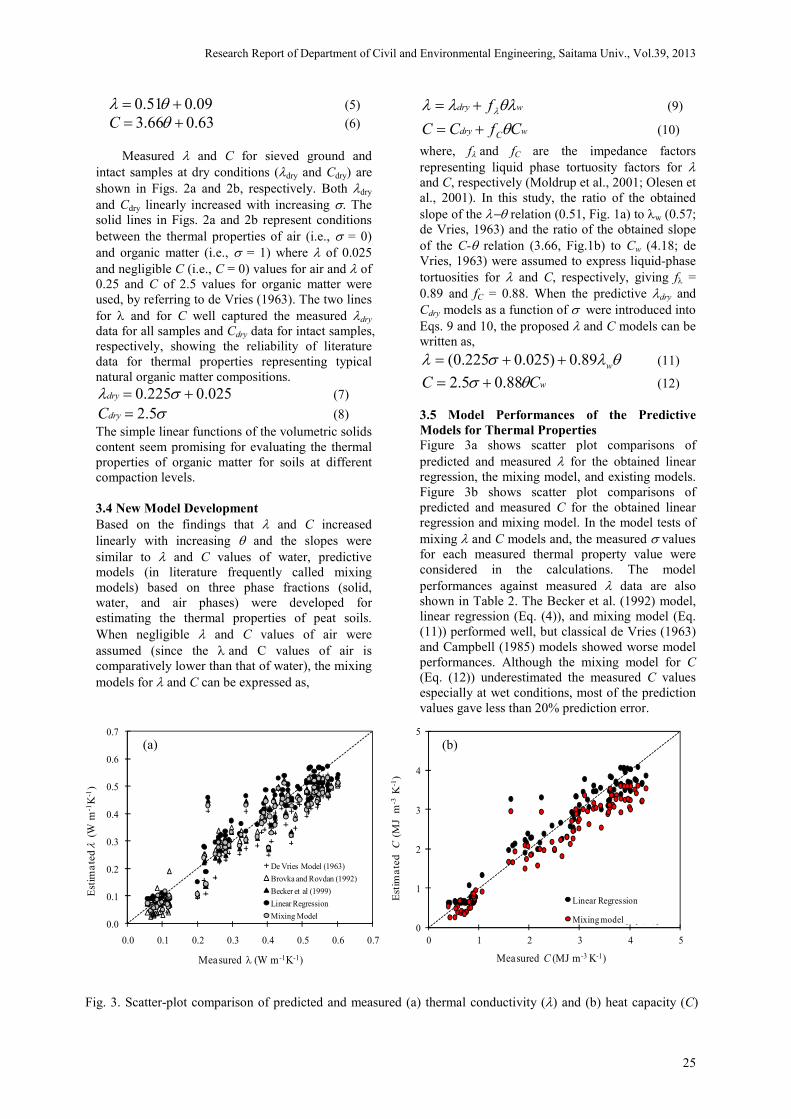
Figure 3a shows scatter plot comparisons of
predicted and measured λ for the obtained linear
regression, the mixing model, and existing models.
Figure 3b shows scatter plot comparisons of
predicted and measured C for the obtained linear
regression and mixing model. In the model tests of
mixing λ and C models and, the measured σ values
for each measured thermal property value were
considered in the calculations. The model
performances against measured λ data are also
shown in Table 2. The Becker et al. (1992) model,
linear regression (Eq. (4)), and mixing model (Eq.
(11)) performed well, but classical de Vries (1963)
and Campbell (1985) models showed worse model
performances. Although the mixing model for C
(Eq. (12)) underestimated the measured C values
especially at wet conditions, most of the prediction
values gave less than 20% prediction error.
Fig. 3. Scatter-plot comparison of predicted and measured (a) thermal conductivity (λ) and (b) heat capacity (C)
0.0
0.1
0.2
0.3
0.4
0.5
0.6
0.7
0.0 0.1 0.2 0.3 0.4 0.5 0.6 0.7
Est
ima
ted
λ(W
m-1
K-1
)
Measured λ (W m -1K-1)
De Vries Model (1963)
Brovka and Rovdan (1992)
Becker et al (1999)
Linear Regression
Mixing Model
0
1
2
3
4
5
0 1 2 3 4 5
Est
ima
ted
C
(MJ
m-3
K
-1)
Measured C (MJ m -3 K-1)
Linear Regression [Eq. (10)]
Mixing model [Eq. (16)]
(a) (b)

Research Report of Department of Civil and Environmental Engineering, Saitama Univ., Vol.39, 2013
26
Independent model tests using the proposed model
as well as existing models were performed against
the λ data for four different peaty soils from the
literature (Lauren, 1997; Sharratt, 1997). Scatter
plot comparisons of measured and predicted λ for
each predictive model, and basic soil information
of the peat soils from literature are shown in Fig. 3.
In the model tests of the proposed mixing
model (Eq. 11) against four different independent
data sets, constant σ values were used in the
calculations based on the total porosity (Φ) for each
peat soil. The model performances against the
measured λ data from each literature study (RMSE
and bias, are also presented in Table 2. The Becker
et al. (1992) model and proposed mixing model
showed the overall best model performances.
However, the model performance tests against
measured λ data at dry conditions showed that the
new mixing model performed better as compared to
the Becker et al. (1992) model, indicating that the
inclusion of the predictive λdry model improved
model predictions of λ at dry conditions.
As an example, RMSE for the predicted values
from the mixing model after pF2 is 0.055 and it is
0.059 for the Becker et al (1992) model. Since the
surface and subsurface layers of peatlands become
extremely dry due to the water table depletion as a
result of development activities and during extreme
weather conditions. Hence, predicting thermal
conductivity for dry peat is very much important to
assess the environmental impact due to residential,
agricultural and infrastructural development.
Further, the fitted f value based on measured
data also performed well against the independent
data sets, suggesting the f value is well applicable
for highly organic soils (i.e,. peaty soils). The other
two of three parameters that we are using in the
model are thermal conductivity of air and thermal
conductivity of organic matter from literature.
Therefore, the proposed mixing model with a
proposed value of the impedance factor (fλ = 0.89)
is highly promising for predicting general λ
behaviors for peat soils since it requires only
information on solid- and water contents (σ and θ).
The performance of heat capacity model was
not evaluated against independent data, due to lack
of available literature on heat capacity for peat soils.
In perfective, further model tests will be performed
on heat capacity of peat soil.
4. GAS, HEAT, AND WATER TRANSPORT
PROPERTIES IN PEATY SOIL PROFILES:
MEASUREMENTS AND ARCHIE’S LAW
MODELS
4.1 Model Development
Under fluid-unsaturated conditions, a
generalized Archie’s second law (Archie, 1942) for
transport parameters with reference point can be
written as; n
satsat F
F
P
P
= (13)
where, P is the bulk parameter under fluid-
unsaturated conditions and Psat is the bulk
parameter value at fluid saturation, F is the fluid
content (i.e., soil air content (ε) for Dp, ka and soil
water content (θ) for soil-water retention, λ, and kw) (m
3 m
−3), Fsat is the fluid saturation and n is the
saturation exponent representing fluid-pore
tortuosity–connectivity of the porous media (Table
3).
In this study, the λ−λdry, Dp, kt and kw were
considered as the bulk parameter values. λdry (W m-
1 K
-1) is the thermal conductivity at air dry
Table 2. Test of predictive thermal conductivity (λ) models against measured data and literature data.
(Number of
measurements)
van Duin (1963)
(12)
Sharratt (1997)
(20)
Lauren (1997)
(20)
Kujala et al
(2008)
(6)
Measured data
in this study
(90)
RMSE bias RMSE bias RMSE bias RMSE bias RMSE bias
de Vries model (1963)
0.035 -0.011 0.015 0.007 0.065 -0.049 0.062 -0.345 0.068 -0.043
Campbell (1985) 0.044 0.044 0.080 0.076 0.043 -0.007 0.033 -0.009 0.085 0.004
Becker et al. (1992)
0.027 0.022 0.054 0.053 0.047 -0.019 0.036 -0.009 0.055 0.033
Brovka & Rovdan (1999)
_ _ 0.069 0.060 0.052 -0.028 _ _ 0.061 -0.023
Linear Regression
(Eq. [9])
0.070 0.070 0.109 0.107 0.049 0.023 0.057 -0.019 0.054 -0.027
Mixing model in this study
(Eq.[15])
0.031 0.031 0.057 0.051 0.046 -0.017 0.058 -0.026 0.058 -0.037

Research Report of Department of Civil and Environmental Engineering, Saitama Univ., Vol.39, 2013
27
condition, representing the λ in solid phase of the
soil (Table 4.3).
Archie’s second law for water retention with
reference point can be written as, n
refref
=
θθ
ψψ
(14)
where, ψ is soil water potential. Campbell (1976)
suggested this model with ψref = air entry soil water
potential and θref = water saturation, making n equal
to the Campbell pore-size distribution index, b.
When the Archie’s second law is applied to
λ, Dp, ka and kw, the predictive models can be
written as follows,
For thermal conductivity n
drysat
dry
drysat
dry
−
−=
−
−
θθ
θθ
λλ
λλ (15)
For gas diffusivity n
satp
p
D
D
=
φε
.
(16)
For air permeability n
sata
a
k
k
=
φε
.
(17)
For water permeability n
satsatw
w
k
k
=
θθ
.
(!8)
Where, λsat and kw.sat are λ and kw under water
saturated (wet) conditions, and Dp.sat, and ka.sat are
Dp, and ka under air saturated (dry) conditions,
respectively. λ−λdry/λσat-λdry, Dp/Dp.sat, ka/ka.sat and
kw/kw.sat are λ, Dp, ka and kw values, normalized by
each parameter value under saturated conditions
respectively, and n denotes the saturation exponent.
Modified Archie’s Law with Reference Point
A two-region model based on Archie’s law was
proposed to characterize the DP and ka behavior.
The two-region models for Dp and ka can be written
as;
in
pFpFp
p
D
D
=
8.18.1. εε
(19)
in
pFpFa
a
k
k
=
8.18.1. εε
(20)
where, εpF1.8 is the air-filled porosity at pF 1.8, ni =
n1 for region 1 (pF ≤ 1.8; non-shrinkage region),
and ni = n2 for region 2 (pF > 1.8; shrinkage region)
with reference point at pF 1.8. We selected a
reference point of pF 1.8 since the volume
shrinkages for most of peaty soils start after pF 1.8
(Dissanayaka et al., 2012). Hamamoto et al.
(2011) used pF 2 as the reference point for bimodal
mineral soils including Andisols (to separate inter-
and intra-aggregate pore regions).
Reference Point Models for Gas Diffusivity at
pF 1.8
Call (1957) modified the Penman (1940)
model, which is the most widely used one
parameter model for Dp/D0 of porous media, by
including a threshold inactive air-filled porosity
(εth). The Penman-Call linear Dp/D0 model
proposed by Moldrup et al. (2005) at pF1.8 is,
)( 8.1
0
8.1
thpF
pFpP
D
Dεε −=−
(21)
where, P is a constant and Penman (1940)
suggested P = 0.66. Millington (1959) proposed a
general power-law type Dp model, based on the
classical one parameter soil air diffusivity model,
developed by Buckingham (1904). According to
the model, Dp/Do at pF 1.8 can be written as,
3/4
8.1
0
8.1.)( pF
pFp
D
Dε= (22)
The most widely used model for predicting Dp
is the Millington and Quirk (1961) model,
Parameter F
(m3 m
-3)
Fsat F/Fsat P Psat P/Psat
Soil water
Retention θ θref
† θ/θref ψ ψref ψ/ ψref
Thermal
Conductivity θ − θdry θsat − θdry (θ − θdry)/(θsat − θdry) λ−λdry λsat−λdry (λ−λdry)/(λsat−λdry)
Gas diffusion
Coefficient ε φpF4.1 ε/ φpF4.1 Dp Dp.pF4.1 Dp /Dp.pF4.1
Air permeability ε φpF4.1 ε/ φpF4.1 ka ka.pF4.1 ka / ka.pF4.1 Water
permeability θ θref θ/θref kw kw-ref kw /kw-satref
Table 3. Model parameters used in this study.

Research Report of Department of Civil and Environmental Engineering, Saitama Univ., Vol.39, 2013
28
y = 22.42×10²x + 2.13
r² = 0.93
0
5
10
15
20
0.00 0.02 0.04 0.06 0.08
b
VS
( )2
3/10
8.1
0
8.1.
φ
ε pFpFp
D
D= (23)
.Kawamoto et al (2006) proposed and equation to
predict ka at a given pF value,
0
8.1,
8.1,D
DGk
pFp
pFa = (24)
where, G is a constant depending on the soil type.
Fig. 4. Campbell b value as a function of volume
shrinkage (VS).
4.3 Soil-water Retention Characteristics of Peat
Figure 4 shows Campbell b value as a function
of volume shrinkage (VS). According to the figure,
there is a clear relationship between Campbell b
parameter and volume shrinkage of peaty soils.
Campbell b is increasing with increasing volume
shrinkage except for the 20cm layer of peat 1.
Schwarzel et al (2002) also observed a clear
relationship between volume shrinkage and water
retention characteristics of peaty soils.
4.4 Measured Soil Transport Parameters of
Peaty Soil under Variably Saturated Conditions
Figure 5 shows measured gas diffusivities (Dp/D0)
and air permeabilities (ka) as functions of soil air
content (ε) and, thermal conductivities (λ) and
water permeabilities (kw) as functions of volumetric
water content (θ) for two different peaty soil
samples, and Toyoura and Narita sand samples
respectively. All four transport properties showed
increase with increasing fluid content (i.e., soil
water content or soil air content, m3 m
−3).
Fig.5. (a) Gas diffusivities (Dp/D0), (b) air permeabilities (ka) of peaty soils as functions of soil air content (ε) and,
(c) thermal conductivities (λ) and (d) water permeabilities (kw) for peaty soils as functions of volumetric water
content (θ).
0.0
0.1
0.2
0.3
0.4
0.0 0.2 0.4 0.6 0.8 1.0
Gas
dif
fusi
vit
y ,
Dp/D
0
Soil -air content, ε (m3 m-3)
1.E+00
1.E+01
1.E+02
1.E+03
1.E+04
0.0 0.2 0.4 0.6 0.8 1.0
Air
per
mea
bil
ity,
ka(µ
m2)
Soil -air content, ε (m3 m-3)
0.0
0.5
1.0
1.5
2.0
2.5
0.0 0.2 0.4 0.6 0.8 1.0
Th
erm
al c
on
du
ctiv
ity, λ
(W m
-1K
-1)
Volumetric water content, θ (m3 m-3)
1.E-05
1.E-04
1.E-03
1.E-02
1.E-01
1.E+00
1.E+01
1.E+02
0.0 0.2 0.4 0.6 0.8 1.0
Wat
er p
erm
eab
ilit
y,
k w(µ
m2)
Volumetric watre content , θ (m3 m-3)
100
101
102
103
104
10-5
10-4
10-3
10-2
10-1
100
101
102
(a) (b)
(c)(d)
Volumetric water content, θ (m3 m-3)
Peat 1 Peat 3 Toyoura Sand Narita Sand
Peat 1 Peat 3

Research Report of Department of Civil and Environmental Engineering, Saitama Univ., Vol.39, 2013
29
Higher Dp/D0 values for Toyoura and Narita
sands were observed as compared to those for
peaty soil samples especially at dry region,
indicating enhanced gas diffusion and advection
occurred through the continuous large-pore
networks for sands. And ka values observed for
sandy soil samples were lower compared to the
values for peaty soil samples. Air permeability of a
soil material is an indicator of the possibility for
convective air exchange in the soil and it is
basically depends on the existence of larger pores.
Convective air exchange is prominent in peaty
layers due to its high macroporosity (Lauren et al.,
2000). Pore organization (PO = ka/ε) values
calculated across variable moisture conditions for
the all peat soil samples studied are generally
above 200 suggesting a highly structured behavior
of the soil.
Thermal conductivity (λ) of the mineral soils
is rapidly increasing with increasing θ especially at
dry conditions due to improved thermal contacts
between soil particles by soil water (Becker et al.,
1992; Hamamoto et al., 2010). A linear increase of
λ with increasing θ was observed in all three peat
soils. This suggests that water content and liquid-
phase tortuosity are the most controlling factors for
the λ, as supported by the fact that the thermal
conductivity of organic matter (0.25 Wm-1
K-1
) is
much lower than that of water (0.57 Wm-1
K-1
) (de
Vries, 1963; Brovka & Rovdan, 1999).
According to the figure 5d, water permeability
(kw) of peaty soil samples varied over a wide range
with changing volumetric water content. Peaty soils
are mainly consist of larger (macro pores) and
smaller (micro pores) channel systems.
Fig. 6. Normalized parameter values, P/Psat, for (a) gas diffusivity (Dp ); (b) air permeability (ka); (c) thermal
conductivity (l); and (d) water permeability (kw) as a function of normalized fluid content, F/Fsat, for peat soils,
and Narita and Toyoura sand
Peat 1 Peat 3 Toyoura Sand Narita Sand
0.0
0.2
0.4
0.6
0.8
1.0
0.0 0.2 0.4 0.6 0.8 1.0
P/P
sat
F/Fsat
(a) Dp
n = 0.5
n = 1
0.0
0.2
0.4
0.6
0.8
1.0
0.0 0.2 0.4 0.6 0.8 1.0
P/P
sat
F/Fsat
(b) ka
n = 4
n = 2
n = 1
n = 3
0.0
0.2
0.4
0.6
0.8
1.0
0.0 0.2 0.4 0.6 0.8 1.0
P/P
sat
F/F sat
(c) λ
95% Confidence curves
n = 0.5
n = 2
n = 1
1.E-04
1.E-03
1.E-02
1.E-01
1.E+00
0.0 0.2 0.4 0.6 0.8 1.0
P/ P
sat
F/ Fsat
(d) kw
n = 1
n = 3
n = 10
n = 50
n = 100
100
10-1
10-2
10-3
10-4

Research Report of Department of Civil and Environmental Engineering, Saitama Univ., Vol.39, 2013
30
At a given saturation level, water flow is mainly
occurred through larger macro pores. When the
saturation level is decreasing, water tends to drain
first from the macro pores and therefore water
permeability of a porous medium falls rapidly with
decreasing water content.
This kind of kw behavior is presented in the
study of saturated and unsaturated permeabilities of
North German peats by Loxham and Burghardt
(1986). The big jump observed in kw values
between saturation (encircled data in figure 6d)
and near-saturation together with higher PO values
(>200) suggesting that peat samples studied are
consisted of highly structured soil material.
Fig. 7. Scatter-plot comparison of predicted and measured (a) gas diffusivity (Dp/D0), (b) air permeability (ka),
(c) thermal conductivity (λ) and (d) water permeability (kw) for Peat 1, and Peat 3 samples. Calculated RMSE
using Dp/D0 , λ, kw data and log-transformed ka data are also given.
0.0
0.1
0.2
0.3
0.4
0.5
0.6
0.7
0.0 0.1 0.2 0.3 0.4 0.5 0.6 0.7
Pre
dic
ted
D
p/D
0(m
2S
-1)
Measured Dp/D0 (m2S-1)
Millington and Quirk, 1961 (RMSE=0.104)
Buckingham-Burdine-Campbell (BBC) model (Moldrup
et al, 1999) (RMSE=0.122)
New based on modified Millington, 1959 at pF1.8
(RMSE=0.034)1
10
100
1000
10000
1 10 100 1,000 10,000
Pre
dic
ted
ka
(µm
2)
Measured ka (µm2)
Moldrup et al., 1998 (RMSE=0.56)
Kawamoto, Moldrup, Campbell b based model
(Kawamoto et al., 2006) (RMSE=0.53)
New based on modified Millington, 1959 at pF1.8
(RMSE=0.37)
100
102
103
101
104
104103102101100
0.0
0.1
0.2
0.3
0.4
0.5
0.6
0.7
0.0 0.1 0.2 0.3 0.4 0.5 0.6 0.7
Est
imat
ed λ
(W m
-1K
-1)
Measured λ (W m-1 K-1)
De Vries Model (1963) (RMSE=0.080)
Mixing Model (Dissanayaka et al, 2012) (RMSE=0.045)
1.E-10
1.E-08
1.E-06
1.E-04
1.E-02
1.E+00
1.E-10 1.E-08 1.E-06 1.E-04 1.E-02 1.E+00
Pre
dic
ted
kw
(µm
2)
Measured kw (µm2)
Alexander and Skaggs, 1986 (RMSE = 0.070)
Campbell, 1974 (RMSE=0.037)
Modified Campbell (1974) Mode (RMSE = 0.017)
10-2
10-4
100
10-6
10-8
10-4
10-10
10-10 10-8 10-410-6 10-2 100
4.5. Application of Archie’s Second Law to Gas
Diffusivity, Air Permeability, Thermal
Conductivity, and Water Permeability.
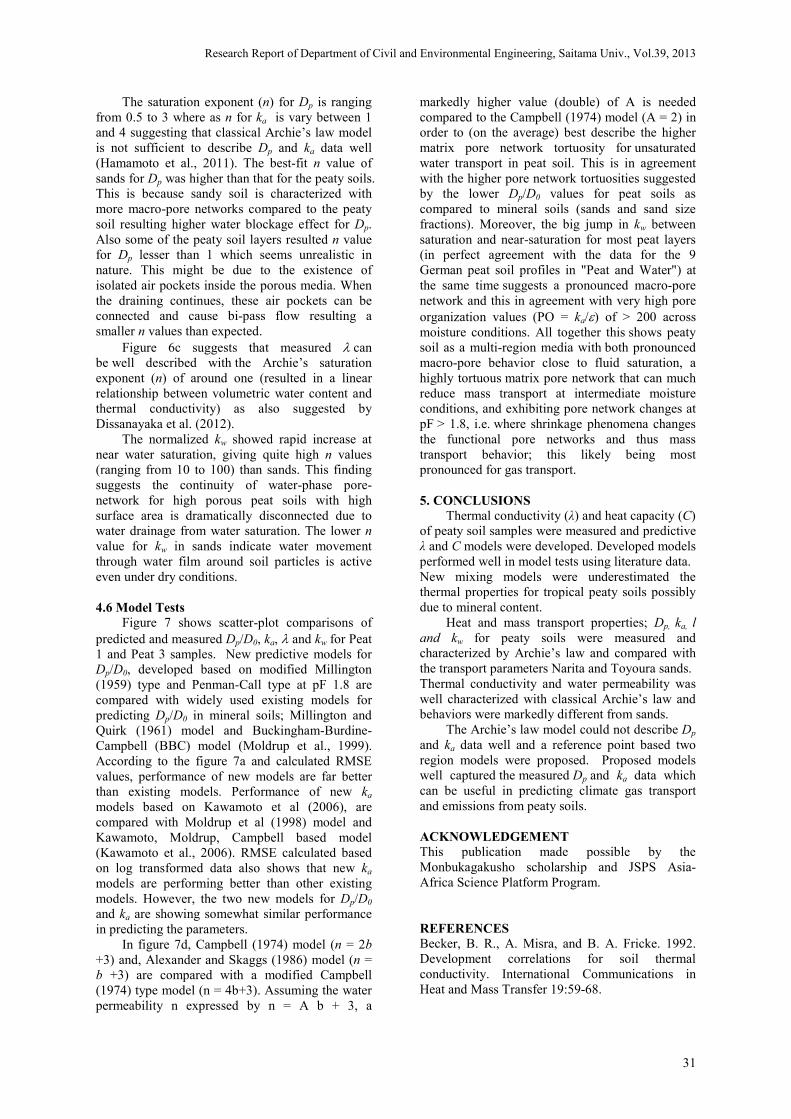
Figure 6 shows the normalized parameter
values, P/Psat for gas diffusion coefficient (Dp), air
permeability (ka), thermal conductivity (λ), and
water permeability (kw) as functions of normalized
fluid content, F/Fsat, for peaty soils, and Narita and
Toyoura sand. Figure 6a and 6b show normalized
parameter values for Dp and ka as functions of
normalized soil air content for two peaty soils,
and Narita and Toyoura sand.
(a) (b)
(c) (d)
Research Report of Department of Civil and Environmental Engineering, Saitama Univ., Vol.39, 2013
31
The saturation exponent (n) for Dp is ranging
from 0.5 to 3 where as n for ka is vary between 1
and 4 suggesting that classical Archie’s law model
is not sufficient to describe Dp and ka data well
(Hamamoto et al., 2011). The best-fit n value of
sands for Dp was higher than that for the peaty soils.
This is because sandy soil is characterized with
more macro-pore networks compared to the peaty
soil resulting higher water blockage effect for Dp.
Also some of the peaty soil layers resulted n value
for Dp lesser than 1 which seems unrealistic in
nature. This might be due to the existence of
isolated air pockets inside the porous media. When
the draining continues, these air pockets can be
connected and cause bi-pass flow resulting a
smaller n values than expected.
Figure 6c suggests that measured λ can
be well described with the Archie’s saturation
exponent (n) of around one (resulted in a linear
relationship between volumetric water content and
thermal conductivity) as also suggested by
Dissanayaka et al. (2012).
The normalized kw showed rapid increase at
near water saturation, giving quite high n values
(ranging from 10 to 100) than sands. This finding
suggests the continuity of water-phase pore-
network for high porous peat soils with high
surface area is dramatically disconnected due to
water drainage from water saturation. The lower n
value for kw in sands indicate water movement
through water film around soil particles is active
even under dry conditions.
4.6 Model Tests Figure 7 shows scatter-plot comparisons of
predicted and measured Dp/D0, ka, λ and kw for Peat
1 and Peat 3 samples. New predictive models for
Dp/D0, developed based on modified Millington
(1959) type and Penman-Call type at pF 1.8 are
compared with widely used existing models for
predicting Dp/D0 in mineral soils; Millington and
Quirk (1961) model and Buckingham-Burdine-
Campbell (BBC) model (Moldrup et al., 1999).
According to the figure 7a and calculated RMSE
values, performance of new models are far better
than existing models. Performance of new ka
models based on Kawamoto et al (2006), are
compared with Moldrup et al (1998) model and
Kawamoto, Moldrup, Campbell based model
(Kawamoto et al., 2006). RMSE calculated based
on log transformed data also shows that new ka
models are performing better than other existing
models. However, the two new models for Dp/D0
and ka are showing somewhat similar performance
in predicting the parameters.
In figure 7d, Campbell (1974) model (n = 2b
+3) and, Alexander and Skaggs (1986) model (n =
b +3) are compared with a modified Campbell
(1974) type model (n = 4b+3). Assuming the water
permeability n expressed by n = A b + 3, a
markedly higher value (double) of A is needed
compared to the Campbell (1974) model (A = 2) in
order to (on the average) best describe the higher
matrix pore network tortuosity for unsaturated
water transport in peat soil. This is in agreement
with the higher pore network tortuosities suggested
by the lower Dp/D0 values for peat soils as
compared to mineral soils (sands and sand size
fractions). Moreover, the big jump in kw between
saturation and near-saturation for most peat layers
(in perfect agreement with the data for the 9
German peat soil profiles in "Peat and Water") at
the same time suggests a pronounced macro-pore
network and this in agreement with very high pore
organization values (PO = ka/ε) of > 200 across
moisture conditions. All together this shows peaty
soil as a multi-region media with both pronounced
macro-pore behavior close to fluid saturation, a
highly tortuous matrix pore network that can much
reduce mass transport at intermediate moisture
conditions, and exhibiting pore network changes at
pF > 1.8, i.e. where shrinkage phenomena changes
the functional pore networks and thus mass
transport behavior; this likely being most
pronounced for gas transport.
5. CONCLUSIONS
Thermal conductivity (λ) and heat capacity (C)
of peaty soil samples were measured and predictive
λ and C models were developed. Developed models
performed well in model tests using literature data.
New mixing models were underestimated the
thermal properties for tropical peaty soils possibly
due to mineral content.
Heat and mass transport properties; Dp, ka, l
and kw for peaty soils were measured and
characterized by Archie’s law and compared with
the transport parameters Narita and Toyoura sands.
Thermal conductivity and water permeability was
well characterized with classical Archie’s law and
behaviors were markedly different from sands.
The Archie’s law model could not describe Dp
and ka data well and a reference point based two
region models were proposed. Proposed models
well captured the measured Dp and ka data which
can be useful in predicting climate gas transport
and emissions from peaty soils.
ACKNOWLEDGEMENT
This publication made possible by the
Monbukagakusho scholarship and JSPS Asia-
Africa Science Platform Program.
REFERENCES
Becker, B. R., A. Misra, and B. A. Fricke. 1992.
Development correlations for soil thermal
conductivity. International Communications in
Heat and Mass Transfer 19:59-68.

Research Report of Department of Civil and Environmental Engineering, Saitama Univ., Vol.39, 2013
32
Call, F. 1957. Soil fumigation: V. Diffusion of
ethylene dibromide through soils. J. Sci. Food
Agric. 8:143-150.
Campbell, G. S. 1985. Soil temperature and heat
flow. P. 26-39. In Soil physics with basic,
Transport models for soil-plant systems. Elsevier,
Amsterdam, The Netherlands.
Currie, J. A. 1960. Gaseous diffusion in porous
media: Part I. A non-steady state method.Br.J.Appl.
Phys. 11: 318-324.
de Vries, D. A. 1963. Thermal properties of soils. P.
210-235. In W. R. van Wijk (ed). Physics of plant
environment, North Holland publishing company,
Amsterdam, The Netherlands.
Dirksen, C. 1999. Soil physics measurements.
GeoEcology Paperback. Catena Verlag GMBH, pp.
114–125.
Dissanayaka, S. H., S. Hamamoto, K. Kawamoto,
T. Komatsu, and P. Moldrup. (2012). Thermal
properties for peaty soils under variable saturation:
Effects of the liquid phase impedance factor and
volume shrinkage. Vadose Zone J.
doi:10.2136/vzj2011.0092
Hamamoto, S., P. Moldrup, K. Kawamoto, and T.
Komatsu. 2012. Organic matter fraction dependent
model for predicting the gas diffusion coefficient in
variably saturated soils. Vadose Zone J.
doi:10.2136/vzj2011.0065.
Hamamoto, S., P. Moldrup, K. Kawamoto, and T.
Komatsu. 2010. Excluded-volume expansion of
Archie’s law for gas and solute diffusivities and
electrical and thermal conductivities in variably-
saturated porous media. Water Resour. Res. 46,
W06514, doi: 10.1029/2009WR008424.
Hobbs, N. B. 1986. Mire morphology and the
properties and behavior of some British and foreign
peats, Quarterly Journal of Engineering Geology,
London, 19:7-80.
Iiduka, K., Kawamoto, K., Komatsu, T. and
Hasegawa, S. 2008. Effect of shrinkage following
drainage on soilgas diffusivity and air conductivity
in peat soil. J. Jpn. Soc. Civil Engineers G 64(3):
242–249 (In Japanese with English summary).
Kawamoto, K., S. Mashino, O. masanobu, and T.
Miyazaki. 2004. Moisture structures of laterally
expanding fingering flows in sandy soils.
Geoderma 119:197-217.
Kawamoto, K., P. Moldrup, P. Schjonning, B. V.
Iversen, T. Komatsu, and D. Rolston. 2006. Gas
transport parameters in the vadose zone:
development and test of power-law models for air
permeability. Unsat. Soils – Buzzi, Fityus & Sheng
691-701.
Kawamoto, K., M. Unno, K. Iiduka, P. Moldrup,
and T. Komatsu. 2009. Gas coefficient in variably
saturated peat soil: Measurements and test of
prediction models. Unsat. Soils – Buzzi, Fityus &
Sheng 691-701.
Konovalov, A. A., and L. T. Roman. 1973. The
thermophysical properties of peat soils.
Krasnoyarskii Promstroiniiproekt, Krasnoyarsk.
Translated from Osnovaniya, Fundamenty in
Mekhanika Grunfov 3: 21-22.
Lauren, A., H. Mannerkoski and T. Orjasniemi.
2000. Thermal and aeration properties of mor layer
in FInland. Scand. J. For. Res. 15:433-444.
Millington, R. J., and J. M. Quirk. 1961.
Permeability of porous solids. Trans. Faraday Soc.
57:1200-1207.
Moldrup, P., T.G. Poulsen, P. Schjønning, T.
Olesen, and T. Yamaguchi. 1998. Gas
permeability in undisturbed soils: Measurements
predictive models. Soil Sci. 163:180–189.
Moldrup, P., T. Olesen, T. Yamaguchi, P.
Schjønning, and D.E. Rols-. ton. 1999. Modeling
diffusion and reaction in soils: VIII. Gas diffusion
predicted from single-potential diffusivity or
permeability measurements. Soil Sci. 164:75–81.
Moldrup, P., T. Olesen, S. Yoshikawa, T. Komatsu,
and D. E. Rolston. 2005. Predictive-descriptive
models for gas and solute diffusion coefficients in
variably saturated porous media coupled to pore-
size distribution: III. Inactive pore space
interpretations of gas diffusivity. Soil Science
170:867-880.
Oleszczuk, R., and T. Brandyk. 2008. The analysis
of shrinkage-swelling behavior of peat-moorsh soil
aggregates during drying-wetting cycles.
Agronomy Research 6:131-140.
Rolston, D. E., and P. Moldrup. 2002. Chapter 4.3.
Gas diffusivity. In: Methods of Soil Analysis, Part
4, SSSA Book Ser. 5. J. H. Dane and G. C.
Topp (eds.). ASA and SSSA, Madison, WI,
pp.1113-1139.
Tuncer, B. E., P. J. Bosscher, and C. B. DeWitt.
(1986). Compression and gravity drainage as
means of dewatering peat. In Fuchsman, C. H. (ed.),
Peat and Water, Elsevier Applied Science
Publishers Ltd, 1986. 21-36.
Sharratt, B.S. 1997. Thermal conductivity and
water retention of a black spruce forest floor. Soil
Sci. 162:576-582.