Embed Size (px)
Citation preview

Report issued: July 26, 2017 Disclaimer: This report is released to inform interested parties of research and to encourage discussion of work in progress. Any views expressed on the methodological issues are those of the authors and not necessarily those of the U.S. Census Bureau.
RESEARCH REPORT SERIES (Survey Methodology #2017-06)
Results of Usability Testing of the 2015 American Community Survey on Smartphones and Tablets Phase II: Mobile-Friendly Design
Erica L. Olmsted-Hawala Elizabeth M. Nichols
Temika Holland
Human Factors and Usability Research Group Center for Survey Measurement
Research and Methodology Directorate U.S. Census Bureau
Washington, D.C. 20233

Abstract The mandatory American Community Survey (ACS) takes 40 minutes to complete on average and is often answered using a mail-out/mail-back form or the ACS online instrument on a desktop or laptop. However, recent analysis has indicated that there is a small but growing segment of respondents who answer the ACS using their mobile devices (Horwitz, 2015). In Phase I of this research, the Center for Survey Measurement (CSM) conducted a usability test of the ACS on smartphones and tablets, prior to the screens being formatted in a mobile-friendly design. Users experienced many usability challenges that could lead to increased errors and frustrations (see Olmsted-Hawala et al., 2016). Consequently, the ACS team decided to update the online screens to allow for a mobile-friendly design. In Phase II, members of CSM and the Decennial Statistical Studies Division (DSSD) collaborated to investigate how respondents interact with the ACS online instrument with a smartphone or tablet when the screens had been designed for a mobile-friendly experience. The goal of the evaluation was to identify how the online ACS performed for respondents who answered while using their own mobile device (e.g., smartphone or tablet) on the newly updated screens as well as to compare user performance from Phase I with Phase II. Finally, the study aimed to identify screens which continued to be more challenging for respondents to work on with a mobile device. Usability findings indicate that, in general, users are more satisfied with the mobile-friendly design than they were with the mobile un-optimized design. However, while the instrument is now in a mobile-friendly design, there are a few areas where modifications to the design could be made to improve the user experience. These design modifications are detailed in the results section. Keywords: Mobile optimized, usability, American Community Survey, user experience, mobile survey, mobile-friendly design Suggested Citation: Erica L. Olmsted-Hawala, Elizabeth M. Nichols, Temika Holland (2017). Results of Usability Testing of the 2015 American Community Survey on Smartphones and Tablets Phase II: Mobile-Friendly Design. Research and Methodology Directorate, Center for Survey Measurement Study Series (Survey Methodology #2017-06). U.S. Census Bureau. Available online at <http://www.census.gov/srd/papers/pdf/rsm2017-06.pdf>.

Final Report ACS Phase 2
1. Introduction The American Community Survey (ACS) is a continuous monthly survey conducted by the U.S. Census Bureau to collect demographic, housing, social, and economic data from the American public through an annual nationwide sample of approximately 3.5 million addresses. The ACS employs a multi-mode sequential data collection operation for each monthly panel: self response (Internet and mail), telephone interviews with non-respondents, and in-person interviews with a sample of the remaining non-respondents. During the self-response phase of data collection the first two mail invitations encourage respondents to go online to complete the survey; a paper questionnaire is mailed later with continued opportunity to respond online (American Community Survey, 2014). Mail and internet responses are also received and accepted during the telephone and personal interview phase of data collection. Although the American Community Survey (ACS) can be completed on a smartphone or tablet, it was not initially designed for such devices. In Phase I, prior to the ACS screens being optimized for mobile screen sizes, there was a usability evaluation that identified issues that users face when completing the survey on a small screen (see Olmsted-Hawala et al., 2016). For Phase II, the Decennial Statistical Studies Division (DSSD) in collaboration with Application Services Division (ASD) updated the visual appearance of the mobile screens following the design guidelines developed by an intra-Census team (Nichols et al., 2016) for the 2015 National Content Test as well as the usability recommendations that came out of the Phase I report. The guide suggested the following changes be made in order for the ACS Internet instrument to be more optimally viewed on smaller screen sizes: Fill the screen with the question and the response options (e.g., reduce the use of white
space, increase font size) Allow more space between response options Reduce the amount of text on the screen Minimize the size of the banner
Not in the guide (because the decennial Census does not have a navigation menu to the left or the right-hand side of the screen), it was recommended to remove the right-hand navigation menu. (For an example of a right-hand navigation menu, see Figure 1.) In addition, usability results from Phase I identified specific screens that were problematic for users on a small screen.

Final Report ACS Phase 2
Figure 1. Screenshot of an example survey with a right-hand navigation menu
After the screens were updated, DSSD asked that Phase II include a follow-up usability test on the newly designed visual appearance of the screens. The objectives of the usability test were threefold:
1. Identify any usability issues with the ACS when answered while using smaller touch screens (e.g., smartphones or tablets).
2. Identify screens which proved challenging to work on with a mobile device. 3. Compare results from Phase I (un-optimized screens) with results from Phase II (optimized
screens) to identify if user performance improved with the optimized screens. In order to compare the results from Phase I to Phase II, the study methods were primarily a repetition of what had been done in Phase I (Olmsted-Hawala et al., 2016). 2. Methods 2.1 Questionnaire Content The American Community Survey is divided into three main sections. In the first part, a respondent answers the “Basic Info” section that gathers the basic demographic information of everyone who lives or stays in the household, such as age, race, sex, etc. Then there is a section of “Housing Questions” with questions about the housing structure that includes such information as whether someone in the household rents or owns the property, cost of the rent or mortgage, when the housing structure was built, etc. Finally, there is a section labeled “Person Info” that gets into the details of each household member, including whether the household member works, where they work, what their annual salary is, etc. Under normal data collection procedures, the household respondent would answer this “Person Info” module for each household member. For our usability studies, due to time constraints, the test participant was asked to answer the “Person Info” module for themselves alone.

Final Report ACS Phase 2
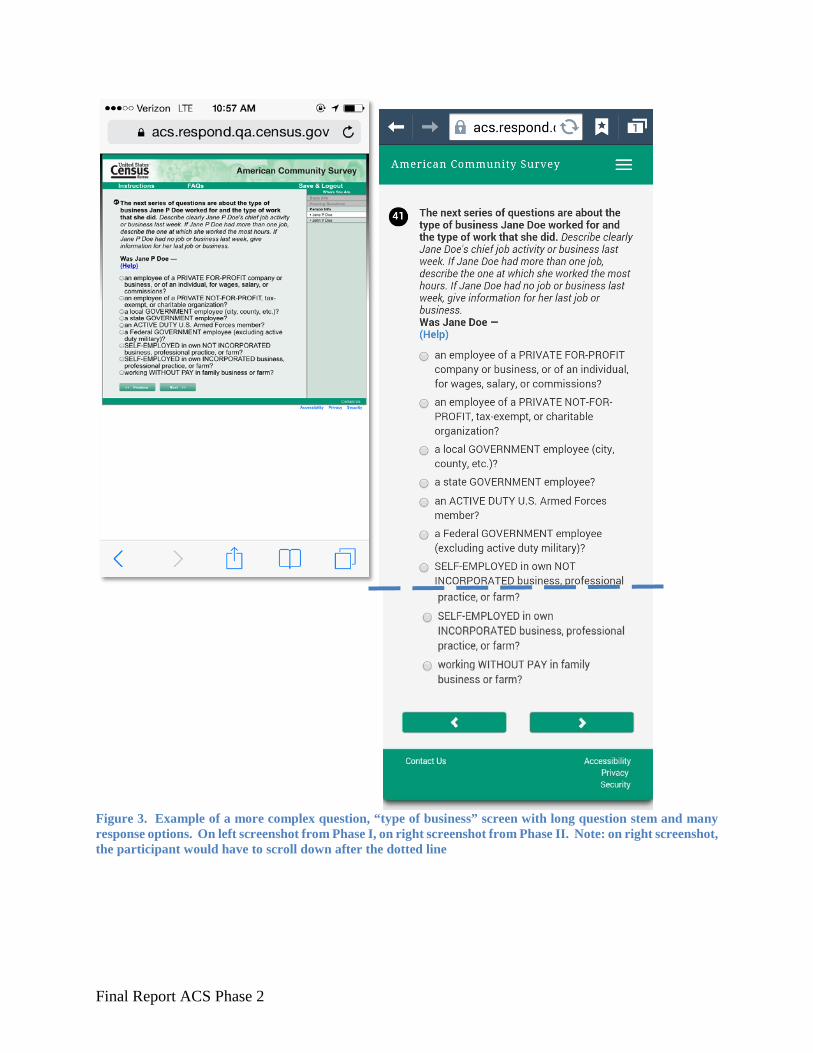
The display of the questions on smaller devices included the following features: (1) the question and response options now fill the screen (in Phase I they took only half the screen); (2) the grid questions fill the screen and use shading for aiding responses (in Phase I they took half the screen and required screen manipulation to see all parts of the grid); and (3) there is more space between response options to reduce the amount of extra screen manipulation needed to answer the question (in Phase I many participants had to manipulate the screen in order to be able to touch the target they desired). See Figure 2-4 for examples of how the screens looked in Phase I and in Phase II.
Figure 2. Example of a typical “Yes” or “No” question. On left screenshot from Phase I, on right screenshot from Phase II.
Final Report ACS Phase 2
Figure 3. Example of a more complex question, “type of business” screen with long question stem and many response options. On left screenshot from Phase I, on right screenshot from Phase II. Note: on right screenshot, the participant would have to scroll down after the dotted line

Final Report ACS Phase 2
Figure 4. Example of a typical grid format; on left screenshot from Phase I, on right screenshot from Phase II. 2.1 Participants Between June 1 and June 26, 2015 21 participants took part in the Phase II online ACS usability evaluation of the mobile-friendly design using their own mobile devices. Participants were recruited from Craigslist ads, neighborhood listservs, a paper flier posted at the Wheaton Library in Silver Spring, Maryland, and from the usability lab recruitment database containing people recruited from the metropolitan DC area. Participants in the database are only allowed to participate in three usability studies a year, and very often participate in fewer than three. See Table 1 for details about the participant demographic characteristics.

Final Report ACS Phase 2
Table 1. Participant characteristics Participants n=21 Gender
Female Male
7 14
Average Age 32 Education
< Some college Technical school Bachelor’s degree Post Bachelor’s degree
14 1 4 2
Race White Black Asian Middle Eastern American Indian Nonresponse
5 10 3 1 1 1
Hispanic origin Yes No Household size 1 2 3+
1 20 2 8 11
Source: U.S. Census Bureau, Results of Usability Testing of the 2015 American Community Survey on Smartphones and Tablets Phase II: Mobile-Friendly Design
See Table 2 for details about device usage and types of devices used by the participants. Seven participants completed the survey using a tablet and 14 used smartphones.

Final Report ACS Phase 2
Table 2. Details on devices & usage Devices & Ownership n=21 Smartphone
iPhone 5 iPhone 6 iPhone 6+ Android (included Moto G, Cricket, Galaxy S4,Galaxy LTE, Kyocera, LG, (all aprox 4-6 inches)
5 1 1 7
Tablet iPad mini Android Tablet – Asus Transformer Kindle fire Samsung Galaxy Tab 3 Samsung Galaxy LTE (8.5 inch) Android LG (8.5 inch)
1 1 1 2 1 1
Mobile ownership Smartphone Tablet* Years owned smartphone or tablet (Mean (Std.Dev.)) Number of hours per week using the Internet on mobile device, range (and Mean)
21 7 3.6 (1.9) 4-60 (22)
*All tablet participants also reported owning smartphones. Source: U.S. Census Bureau, Results of Usability Testing of the 2015 American Community Survey on Smartphones and Tablets Phase II: Mobile-Friendly Design To test the usability of the new mobile-friendly design, participants were observed while answering the survey on their own mobile devices. The usability session consisted of the participant being observed while completing the “Basic Info” questions for all household members, then answering all “Housing Questions” and finally answering the “Person info” questions only about him/herself. Sessions were one-on-one; that is, one test administrator (TA) working with one participant. When schedules permitted, there was also one note-taker from Census in attendance and occasionally an observer from the study sponsor area. The note-taker and the observer did not interact with the test participant. Sessions lasted approximately 90 minutes and were conducted in the usability lab at Census Bureau headquarters or at the Wheaton Public Library in Wheaton, MD. All tablet sessions were conducted at the library with the participant’s own tablet, using the library’s Wi-Fi. At the Census Bureau external participants are not allowed to use the Census Wi-Fi and most people do not have data plans on their tablets. Sessions using smart phones were conducted at the Census Bureau usability lab and at the Wheaton library, typically with participants using their own data plans. Each participant was instructed to answer the survey questions using his or her real-life information, with the exception of the mock address information that was used within the online system since the survey was being conducted in a test environment. Participants were instructed to pretend that the mock address that appeared on the survey screen was their address. Attempts to capture eye-tracking data were largely unsuccessful on the mobile devices due to the inability to precisely calibrate the participant’s eyes on the small

Final Report ACS Phase 2
visual field of a mobile device. In addition, the participant’s movement out of the range of the eye-tracking device as it sat on the mobile eye-tracking stand caused calibration failures. All recordings were reviewed and coded based on the number of single-finger and multi-finger gestures on the screen in excess of the optimal number of gestures that should be made to enter a correct response. For example, touching the “yes” radio button multiple times before it engaged the button, or touching the “no” button but then re-touching the screen and changing the answer because the user had intended to touch the “yes” button. More details on the coding procedures are provided in the analysis section below. For coding results, see Appendix A.
Upon arriving at the testing room, the participant was asked to complete a number of tasks before the test with the ACS instrument began. First they signed a consent form that referenced the U.S. Office of Management and Budget (OMB) approval for this study, the confidentiality of the session, the voluntary nature of the study and information about what would be recorded during the session. Once the consent form was signed, the audio/video recorder was started. Next, the TA read the testing protocol to the participant and asked the participant to complete the questionnaire on their demographics (gender, age, etc.) and computer and Internet experience. Upon completion, the TA asked the respondent to take out their mobile device and the TA calibrated the participant’s eyes (for the eye tracking component of the study) with respect to where their eyes and their devices (phone or tablet) were located. To begin the study, all participants were provided with a user ID and the URL (https://acs.respond.qa.census.gov/acs/login) in the form of an ACS reminder letter (what a respondent would receive in the mail if they had failed to respond to the initial invitation letter sent to their address asking them to participate in the survey). In Phase I, participants had received the URL as either a text message or hand written on a piece of paper. Phase II used a slightly modified version of the reminder letter which contained the URL so the test would more closely mimic what happens in production. Once participants were successfully logged in to the survey, they were asked to answer the questions and “think aloud” during the session in order to capture spontaneous comments and any cognitive difficulty with the interface, question wording, or question sequence. At a pre-selected point, roughly halfway through the survey, participants were asked what they would do if they had to leave the survey temporarily. This was done in order to evaluate the logging out/in functionality of the survey using a mobile device. After logging back in, participants finished filling out the online ACS. After the survey portion was complete, participants answered a satisfaction questionnaire about their experience completing the ACS, which was loosely based on the Questionnaire for User Interaction Satisfaction (Chin et al., 1988). In the debriefing portion of the session, participants were shown printed screenshots of some of the more complicated screens on the ACS (e.g., screens that had a lot of text, long examples or explanatory text), and were asked for feedback on them. Participants were then asked to choose up to five screens they felt were the most difficult to complete on their mobile device. Finally, participants were asked for any final comments, given their cash honorarium and the session concluded.

Final Report ACS Phase 2
After each session was completed, the video was reviewed and coded in order to produce a count of the number of single-finger and multi-finger gestures that users made on the screen1 including: Extra screen taps made for response selection or to navigate among and between screens. Excessive pinch-to-zooms2 (excessive included any pinch to zoom action after an initial
pinch-to-zoom). Unintentionally tapping incorrect answers. Failing to scroll horizontally (when it was necessary to view initially hidden text).
The video was reviewed along with the verbal comments to determine correct responses, incorrect responses that were self-corrected, and incorrect responses that were not self-corrected. We used verbal comments, observational data, and the coded counts in our analysis. 3. Results and Recommendations This section focuses on the results that are directly related to the use of a mobile device to answer the online ACS. As is often the case during usability testing, issues arise that are unrelated to usability per se and have more to do with content, for example interpreting the roster question as only asking about adults in the household, not children. We document these issues in Appendix B for future work on content, and report the usability-specific findings below. 3.1 Positive Findings We did not observe intentional pinch-to-zoom in smartphone sessions as we had seen in
Phase I. This is likely because the font was larger and filled the screen in the redesigned view. (Note: There was pinch-to-zoom in tablet sessions.)
Users appeared to be tapping less o For smartphones, “Yes” and “No” options were not mis-tapped. This is in contrast
to Phase I where mis-tapping occurred frequently on the “Yes” and “No” answer choices.
3.2 Usability Issues: While the instrument is now in a mobile-friendly design, there are a few areas where modifications to the design could be made to improve the user experience. The following usability issues are those that are specifically associated with the survey being answered on mobile devices. 1. Number entry field – When entering the amount of property taxes, one participant entered 25000 instead of 2500. Because of the small screen size, it was difficult to see the number of zeros that he had entered. Also, another user spent extra time before entering his information because he said he was looking for a way to add the “.00.” The numeric keypad did not allow a decimal and the user did not realize that the .00 was already on the screen. The researchers hypothesize that he missed the “.00” because it was both grayed out and it was also out of his range of view from where he was looking on the screen. See Figure 5 for an example of how the “.00” and numbers appear.
1 The numbers presented on extra taps are the sum of extra taps for all participants and reflect the pure number of extra taps that occurred on each screen across all participants, including the “Next” button. 2 This includes all pinch gestures both zooming in and zooming back out.

Final Report ACS Phase 2
Figure 5. Screenshot of field that asks for an amount in dollars. Recommendation: Right justify the amount fields. Reduce the size of the input field. Add commas automatically when large numbers are entered so that respondents can more easily see the number. 2. When selecting the type of house, apartment or mobile home, one participant initially selected a detached single house. However, when he scrolled down to get to the next button, he inadvertently selected an apartment because his finger while scrolling down the page, actually touched a different response option. Unfortunately he did not notice that he had now selected a different response option. All future questions then asked about his apartment. The inadvertent selecting of a radio button when swiping down/up with the finger may cause data entry errors on mobile devices more than on desktops or laptops. See Figure 6.

Final Report ACS Phase 2
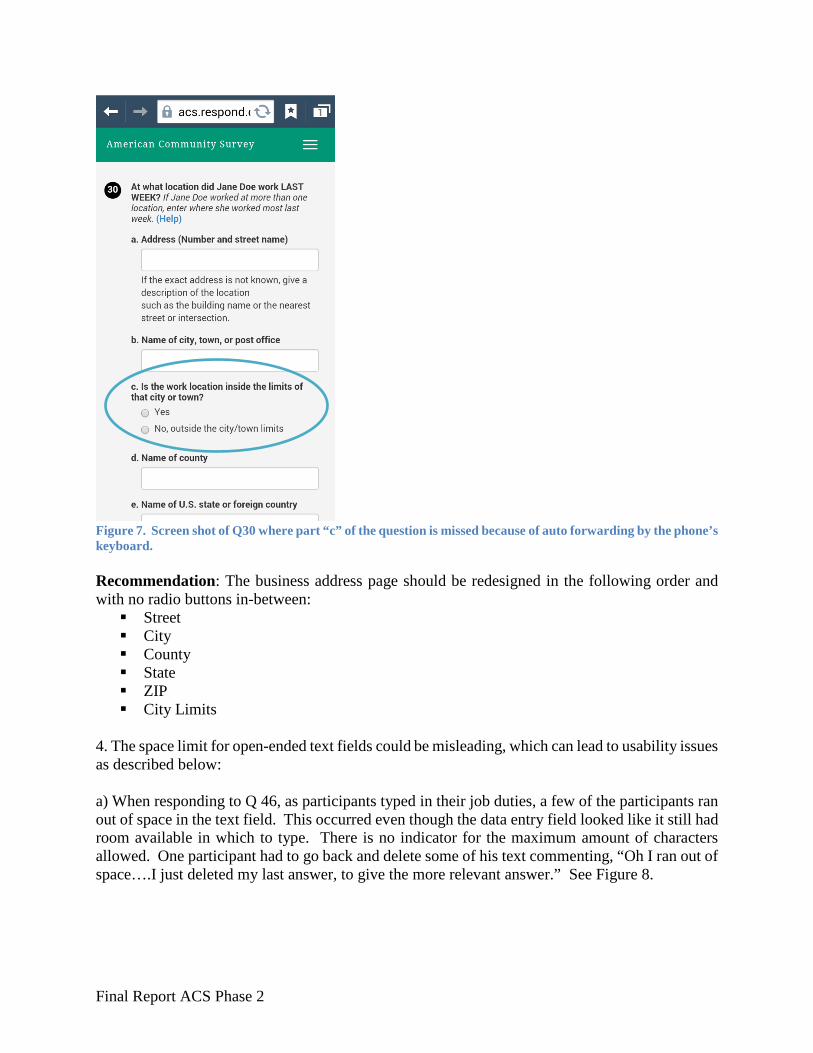
Figure 6. Screen shot of long list of answer choices Recommendation: Allow enough room for a respondent to be able to swipe down and not activate a radio button in that action. For the future, consider removing radio buttons and turning answer options into the buttons themselves that activate when tapped. 3. The layout of the address screen pictured in Figure 7 is not optimal for mobile screens. The two radio buttons that are in the middle of the screen (section c) are problematic. When respondents type in the answers to “a” and “b” and then use the phone’s keyboard to tap “Done,” the phone skips the curser to section “d” rather than to “c”, causing an unintended skip pattern. If a respondent realizes that he/she missed section “c”, they must go back and tap into the radio button section. Not all respondents will realize this and a few participants in the usability testing left section “c” blank.
Final Report ACS Phase 2
Figure 7. Screen shot of Q30 where part “c” of the question is missed because of auto forwarding by the phone’s keyboard. Recommendation: The business address page should be redesigned in the following order and with no radio buttons in-between: Street City County State ZIP City Limits
4. The space limit for open-ended text fields could be misleading, which can lead to usability issues as described below: a) When responding to Q 46, as participants typed in their job duties, a few of the participants ran out of space in the text field. This occurred even though the data entry field looked like it still had room available in which to type. There is no indicator for the maximum amount of characters allowed. One participant had to go back and delete some of his text commenting, “Oh I ran out of space….I just deleted my last answer, to give the more relevant answer.” See Figure 8.

Final Report ACS Phase 2
Figure 8. Screenshot of Q46 data entry field Recommendation: Indicate how much space remains for entering characters. Make the data entry field reflect the amount of characters allowed. b) The size of response fields often cue respondents on how to respond or the type of information requested. Too large of an entry field can be misleading to respondents. When building the roster, the response field for the middle initial (MI) of the respondent’s name is too large. At least one participant attempted to type in the entire middle name of a household member. Also, the response field for Q32 is too large for the type of data requested. See Figure 9.

Final Report ACS Phase 2
Figure 9. On left, MI data entry field is too large. On right, Q32 response field is larger than necessary. Recommendation: Shorten the response fields to match the data being requested. c) Question layout or length may cause respondents to miss important words/information while viewing the survey on a smaller screen. While responding to the income question (47a) one participant said, “I wish,” and selected no. She did this even though she had previously mentioned that she was employed. Upon probing, the participant commented that she read the words “commissions, bonuses, or tips” and had actually missed the word “wages” in the text. See Figure 10. Perhaps the amount of text for this item on such a small screen may cause users to scan and miss vital content. It is also possible that the ‘recency’ effect is at play here, where participants focus on the most recent stimuli if the question and the response options are long. Note: This also occurred in the ACS usability study Phase I where one participant also answered, “no they did not receive bonuses” when viewing this question on the un-optimized for mobile interface.

Final Report ACS Phase 2
Figure 10. Screenshot of Q47 income question. d) Similar to issue c, participants may be more prone to skim on the phone than on the desktop or paper. For instance, when entering in the time he left for work, one participant thought it was asking what time he got off of work. It is possible this was due to the question being on a small screen. During debriefing he said he may not have read all the question, just skimmed it. Recommendation: Continue to observe users interacting with the ACS on smaller devices. It is unclear if the question could be shortened to increase understanding and decrease error. Consider removing all the detail of the question to simplify it, such as “Did Jane Doe make income / money in her job during the past 12 months?” The examples of different types of income to include could be either located under a help link or on a separate line. (e.g., Remember to include any commission, bonus, tips, salary and all other wages.) 5. While reviewing the ACS instrument prior to testing, we noted that the Hispanic Origin question (Q5) inappropriately accepts a “yes” and “no” response (see Figure 11).

Final Report ACS Phase 2
Figure 11. Screen shot of Q5 Hispanic Origin question Recommendation: Ensure that the “bug” has been fixed. 6. When working on the grids, one participant with an older and smaller smartphone (e.g., approximately 3.5 inches) mentioned that after scrolling down she could no longer see which column was “yes” and which was “no.” She said it was a little tricky as she had to scroll back up to make sure she was answering in the correct column. While the participant was still able to answer the question, she mentioned again during debriefing that it was tricky. Recommendation: Consider adapting longer grids to single questions. 7. One participant mentioned that the initial login page appeared busy with all the script and information on the page. It could distract from the main message which is to login with the ACS User ID. In addition, the center justification of the introductory text can be more difficult to read than left justified text. See Figure 12.

Final Report ACS Phase 2
Figure 12. On the left, the ACS login screen; on the right, the 2015 NCT login screen. Recommendation: Consider removing some of the content on the initial login page - a respondent could find the additional content under a button that expands or contracts. Left justify the text. See the reduced text used in the 2015 National Content Test (NCT) as an example of reduced content on the login screen. 8. One participant said that he did not know what the “three little lines” meant (also known as the hamburger menu where the save and logout are currently located). See Figure 13 for an example of the hamburger menu. He said he assumed the three lines were part of the title and logo of the survey. When asked what he would do to log out, he said he would have just left the page, stepped away with it open, and then returned when he had the time. Note: It is not clear if a respondent misunderstanding the three lines (the hamburger menu) will be an issue as, after 15 minutes the survey will automatically log out participants. However it is important to note that the symbol (three vertical lines) is not *yet* universal / ubiquitous for mobile phone users.

Final Report ACS Phase 2
Figure 13. Screenshot with the hamburger menu circled above. Recommendation: Continue to monitor whether mobile respondents know what the hamburger menu is used for. 9. During the dry run, a participant attempted to answer the survey using her “Dolphin3” browser. It did not work with the ACS online survey. The participant said she prefers to use her “Dolphin” browser because it does not use as much data to load the websites, and she pays attention to her data usage. Note: After the usability testing was completed, members of the usability lab heard of other people using the Dolphin browser, so it may be gaining in popularity. Recommendation: Consider adding this Internet browser as a viable option to use to answer the survey. 10. Usability issues occurred with the display when a participant used a Samsung Galaxy Tablet, with the Google Chrome Internet browser. The tablet was 7 1/4 by 4 inches in size. The survey seemed to be rendering strange on the display. On some of the screens, especially when in landscape mode, it had the right-hand navigation that is seen on a laptop/desktop. See Figure 14 and Figure 15. Note: This navigation disappeared when we had the respondent turn the tablet to portrait mode; however, a large white space appeared at the bottom of the screen, as in the look prior to the mobile-friendly design. Also, the radio buttons and the check boxes appeared grayed out. They continued to look grayed out unless the participant zoomed into the screen. After zooming in, the radio buttons and check boxes stopped being grayed out and looked normal, so the participant could click on them. This graying out of the radio buttons/checkboxes made it difficult for the user to know if, after tapping on the button, the answer was selected or not. (Note: Thus, for this tablet, there were many extra taps on these screens.) Finally, the participant started to zoom in on every screen so that he could
3 A dolphin browser is an alternative Android platform of browser that people can use to surf the Internet.

Final Report ACS Phase 2
make the buttons active for selection. See Figure 14 and Figure 15 for examples of the radio buttons and check boxes as they first appear prior to any zoom (e.g., visually grayed out.)
Figure 14. Screen shot of the layout and design of the Hispanic origin question on a small tablet. Notice the desktop view (e.g., right hand navigation) and the grayed out check boxes. Names are blocked out for confidentiality purposes.
Figure 15. Screen shot of the layout and design of the relationship question on a small tablet. Notice the desktop view (e.g., right-hand navigation) and the grayed out radio buttons. Names are blocked out for confidentiality purposes. Recommendation: Fix the display on tablets. Do not allow radio buttons and checkboxes to appear already grayed out 11. One participant noticed a question number 16 and said, “How much longer is this survey?” She said she thought it was long. Then a bit later, she noticed the question number 14 and said, "What...14...? Am I going backwards?!" The question numbers going down (without any cue like desktop respondents have with the right hand status/locator info) was confusing and potentially could be upsetting to someone who thought the survey was taking longer than it should (and going

Final Report ACS Phase 2
backwards). The person numbers start over in the housing section and the person section so the numbers are technically correct – but confusing for a respondent. Recommendation: Make mobile question numbers sequential, or use a mobile designed progress indicator. While there are a few examples of effective progress indicator designs, we have also heard that for surveys with more than ~10 questions some recommend that you not have a progress indicator at all. 12. Participants who are born outside of the United States are asked to type in their country of birth, and there were usability issues with this field. Specifically, the user is required to first tap the radio button to activate the write-in field. One user was tapping directly into the write-in field to type which country she was born in and she missed the radio button. She almost gave up and said she could not answer the question when her finger inadvertently hit the radio button which then activated the field to type in the country of birth. Note: We saw this in Phase I (and know that we tested a fix in the 2014 Round 2 Usability Study Round 2. See Olmsted-Hawala et al., forthcoming). We think this issue could be exasperated by the smaller screen size. Recommendation: Use the design that was tested in 2014 Round 2 Usability Study - that is, allow respondents to tap into the response field even if they have not yet selected the radio button. Once the respondent has happed into the response field the back-end coding automatically activates the “yes” radio button. 3.3 Satisfaction Findings During debriefing, participants frequently offered comments about the questions themselves rather than the look of the survey on the small devices. For instance, one participant commented, that the survey had “nothing to do with the letter mailed to my house.” (Recall that we had participants read the actual reminder letter that ACS sends out, see Appendix C). When the TA probed the participants for more on what he meant, the participant indicated that the first paragraph implies that it will help the community with hospitals and schools, but that he did not feel like that was what the survey was asking about. A number of participants wrote comments on the final satisfaction questionnaire about the ACS questionnaire. These included:
• “Some of the questions are too wordy. Some of the questions are intrusive!” • The survey needed to be “more specific and clear with certain questions.” • “Since I am not a native English speaker I found some words in some of the
questions are confusing for me like the word farm. I am familiar with the word farm as from animals and crops not for other meaning. If you could use common words the questions will be easier.”
• “I had no issues with usability. I was however, asked questions I did not expect to be asked and recalling certain information was difficult.”
When asked for participants’ overall reactions to the web survey where 1 was “Terrible” (darker blues) and 9 was “Wonderful,” (lighter blues) participant ratings in Phase II were more often aligned with the light blue color than they were in Phase I. Not surprisingly, participants overall rated the mobile-friendly design higher than they rated the un-optimized design. The mean score

Final Report ACS Phase 2
for the Phase II was 7.3 (with standard deviation of 1.7) whereas for Phase I, the mean score was 5.7 (with a standard deviation of 1.7) which is significantly different using a 2-tailed t test (t=2.96, p=0.01). Based on these data, participants reported being more satisfied with their overall experience when using an instrument that was optimized for the small screen than they had been when testing the survey as it appeared in an un-optimized format for mobile. In the graph below, darker colors represent a more negative impression of the survey and lighter colors represent a more positive impression. For comparison purposes, the range of possible scale colors is shown in Figure 16.
Figure 16: Range of scale colors for 7 point rating scale See Figure 17 for a visualization of the frequency distribution of satisfaction ratings for the Overall Experience Completing the Web Survey. The darker shadings represent ratings on the lower end of the scale while the lighter shadings represent ratings on the higher end of the scale. The width of the color represents the frequency of the rating.
Figure 17. Satisfaction questionnaire that compares satisfaction from Phase I (un-optimized for mobile design) with Phase II (mobile-friendly design).
0% 50% 100%
Phase I: Un-optimized Mobile
Phase II: MobileFriendly
Terrible=1 (Dark) to Wonderful=7 (light)
Overall Experience Completing Web Survey
Source: Usability Satisfaction Questionnaire for ACS on Unoptimized Mobile (2014) (n=20) and Mobile Friendly (2015) (n=20)

Final Report ACS Phase 2
Looking at the satisfaction questions that relate directly to the use of the survey on a mobile device, such as the difficulty or ease with reading the text and clicking on radio buttons/links in the survey, we see that participants in Phase I had more difficulty than participants in Phase II. These mobile-specific questions were asked using a 5-point scale. For comparison purposes, the range of possible scale colors is shown in Figure 18. The mean score for the Phase II was, for reading text on the small screen a 4.5 (standard deviation of 0.7) whereas for Phase I, the mean score was 4.0 (standard deviation of 1.3) The two scores were not statistically different. However, for clicking radio buttons, the mean score for Phase II was 4.7 (standard deviation of 0.5) which was significantly higher than the mean score in Phase I of 3.9 (standard deviation of 1.4). Thus, participants were more satisfied with selecting radio buttons when the interface was optimized than when it was not.
Figure 18 Range of scale colors for 5 point rating scale See Figure 19 for a visualization of user satisfaction with reading text as depicted in a frequency distribution and Figure 20 for a visualization of user satisfaction of clicking links and radio buttons as depicted in a frequency distribution. Again, the darker shadings represent ratings on the lower end of the scale while the lighter shadings represent ratings on the higher end of the scale.
Figure 19. Satisfaction questionnaire that compares satisfaction of reading text from Phase I (un-optimized for mobile design) with Phase II (mobile-friendly design).
0% 50% 100%
Phase I: Un-optimized Mobile
Phase II: MobileFriendly
Extremely difficult =1 (Dark) to Extremely easy=5 (light)
Reading Text
Source: Usability Satisfaction Questionnaire for ACS on Unoptimized Mobile (2014) (n=17) and Mobile Friendly (2015) (n=20)

Final Report ACS Phase 2
Figure 20. Satisfaction questionnaire that compares satisfaction of clicking links and radio buttons from Phase I (un-optimized for mobile design) with Phase II (mobile-friendly design). Conclusion In general, Phase II screens where the ACS had been designed in a more mobile-friendly way for smartphones worked much better than what was tested in Phase I when the design was not mobile-friendly. There were a few usability issues identified during testing and those were documented above. There were some user issues with skimming the screen and missing important parts of the question – this was particularly noticeable for the longer questions or questions that had additional explanatory text on the screen. Recommendations for this issue include continuing to watch how respondents do on these questions when answering on mobile phones and to consider shortening the question or moving the additional text to another screen or placing it behind a help link, etc. There were some problems with the tablet, e.g., if the tablet was on the larger side of the tablet size spectrum (e.g., regular iPad), the display rendered on the tablet was of the desktop view rather than the mobile phone view. This caused problems because the response options on the desktop view are spaced closer together than the mobile display as the functionality on desktop is to select response options via a “mouse,” and not a finger. A few of the tables also displayed some of the “Yes” or “No” response options and check boxes with a grayed out look to them. We recommend continuing to review the tablet display and update the code so that the different sized tablets/browsers display the mobile-friendly design.
0% 50% 100%
Clicking Links / Radio Buttons
Source: Usability Satisfaction Questionnaire for ACS on Phase I: Unoptimized Mobile (2014) (n=17) and Phase II: Mobile-Friendly (2015) (n=16)
Extremely difficult = 1 (Dark) to Extremely easy = 5 (light)

Final Report ACS Phase 2
References American Community Survey Design and Methodology, January 2014. Available at:
http://www2.census.gov/programs-surveys/acs/methodology/design_and_methodology/acs_design_methodology_report_2014.pdf
Chin, J. P, Diehl, V. A., Norman, K. L. (1988). Development of an instrument measuring user satisfaction of the human-computer interface. In: Proceedings of SIGCHI’88, pp. 213-218.
Childs, J., Carter III, G., Norris, D., Hanaoka, K., & Schwede, L. “Cognitive Test of the NRFU Round 3: Revised Questions.” U.S. Census Bureau. Survey Methodology #2007-9. Available at: https://www.census.gov/srd/papers/pdf/rsm2007-09.pdf
Horwitz, R., (2015). Usability of the American Community Survey Internet Instrument on Mobile Devices. U.S. Census Bureau. #ACS15-RER-04 Available at: https://www.census.gov/content/dam/Census/library/working-papers/2015/acs/2015_Horwitz_01.pdf
Nichols, E., Olmsted-Hawala, E., Horwitz, R., and Bentley, M. (2015) Optimizing the Decennial Census for Mobile, - A Case Study. Federal Committee on Statistical Methodology. Washington D.C. Available at: http://fcsm.sites.usa.gov/files/2016/03/I2_Nichols_2015FCSM.pdf
Olmsted-Hawala, E., Nichols, E., and Holland, T. (forthcoming). “A Usability Evaluation of the American Community Survey Online Instrument for the 2014 American Community Survey (ACS) Internet Test” US. Census Bureau.
Olmsted-Hawala, E., Nichols, E., Holland, T. and Gareau, M. (2016). “Results of Usability Testing of the 2014 American Community Survey on Smartphones and Tablets Phase I: Before Optimization for Mobile Devices.” US. Census Bureau. Survey Methodology # 2016-03. Available at: https://www.census.gov/srd/papers/pdf/rsm2016-03.pdf

Final Report ACS Phase 2
Appendix A: Coding Results The coding for the manipulation and touches on the mobile screens was done by individuals and not automatically collected behind the scenes by a computer program. Consequently, this was a more qualitative usability study with individuals watching the tapes to code touches on the screen. As such, for some of the sessions it was difficult to see the screen and discern what was a “touch” on the screen, particularly in Phase I when the screen was un-optimized and everything on the screen appeared smaller. For Phase I we had two coders review the tapes. There is a discrepancy among the counts of the two coders in Phase I. Particularly the two coders differed on the counts for “pinch-to-zoom” and “multiple taps.” We report both coder’s counts here, however we suspect the first of the two coders was an outlier in how she counted the extra taps. This is based on observation during usability testing where we noted many more challenges in Phase I with manipulating the screen than what was observed in Phase II. In Phase II we had only one coder. Please see Table 3 for summary coding results across all participants and screens. On a summary level, we compare the data coding from Phase I (not optimized) with Phase II (optimized) screens for each of the categories listed below:
A. Excessive tapping (and tapping over the initial tap required to answer the question) B. Excessive pinch to zoom (any pinch to zoom over one initial pinch to zoom) C. Tapping incorrect answer—was able to self-correct D. Tapping incorrect answer—did not self-correct E. Failing to scroll horizontally
Table 3. Count of Extra Touch Manipulations on the Mobile Screen, Phase I and Phase II
Source: U.S. Census Bureau, Results of Usability Testing of the 2015 American Community Survey on Smartphones and Tablets Phase II: Mobile-Friendly Design A. Excessive tapping (and tapping over the initial tap required to answer the question) Phase I Coder A counted 337 extra taps on the answer; Phase I Coder B counted 784 extra taps on the answer. Phase II counted 345 extra taps on the answer. This result is less clear-cut as there was additional tapping going on in Phase II, but if we accept that Coder B is likely more precise, there was more extra tapping occurring in Phase I than in Phase II. This aligns with the behaviors observed by the test administrator during usability testing.
B. Excessive Pinch to zoom (more than once on each screen)
Excessive pinch to zoom
Multiple taps on answer
Tap incorrect answer (self-correct)
Tap incorrect answer (not self-correct)
Failure to scroll horizontally
Phase I - Coder A 379 337 104 11 1 Phase I - Coder B 930 784 99 51 3 Phase II 0 345 48 32 0

Final Report ACS Phase 2
Phase I Coder A counted 379 extra pinch or zooms on the screen; Phase I Coder B counted 930. Phase II counted zero times of excessive pinch to zooms. Therefore the use of the full screen in Phase II seems to have greatly reduced the need for participants to pinch and zoom into the screen. C. Tapping the incorrect answer and then self-correcting – where the participant tapped the wrong answer and then made a self-correction For Phase I Coder A the count was 104 times, and for Phase I Coder B the count was 99 times. For Phase II the count of tapping the incorrect answer was 48. Again, when we look at all coders, we see improvement in a reduced amount of incorrect tapping and follow up correction behavior.
D. Tapping the incorrect answer and failing to self-correct – where the participant tapped the wrong answer and then moved on For Phase I Coder A the count was 11 times, and for Phase I Coder B the count was 51 times. For Phase II the count of tapping the incorrect answer without correcting was 32. It appears when looking at all results that again Phase I coders have a discrepancy in the count, again we suggest Coder A counts were more of an outlier. E. Failing to scroll horizontally This was not an issue across either phase of the study. In Phase I it appeared that when needed, users did scroll horizontally. The Phase II design did not require horizontal scrolling.

Final Report ACS Phase 2
Appendix B: Usability Findings not related to mobile The following usability issues were uncovered during usability testing of the ACS mobile-friendly design conducted on mobile devices. These findings are not directly related to issues of display on a smaller screen. Positive findings: Participants appeared to like the “Why We Ask” section of the help. At least one participant said, after tapping into the help for the commuting question, “Ahhh traffic patterns, I can answer that.” We have also noticed a number of participants accessing the help, more so than in earlier rounds. During the hypothetical log out scenario: While scrolling to get to the Save and Log Out link in the menu, one participant accidentally made a response selection to the survey item he was on prior to logging out. When he logged back in, the application took him to that same item, rather than progressing to the next, so that he could then give an accurate response to the question. This was handled well by the software. Finding related to our usability testing set up: One participant commented that it would be easier to respond to the mobile survey if he was able to hold the phone in his hand. Recommendation: The usability lab has purchased new hardware that we will be testing in the coming months that allows users to respond to mobile devices while they hold the phone/tablet in their hands. Technology related issues When initially entering in the User ID, one participant unintentionally added a space in the second ID field. He then did not have enough room to enter the final number and thought that his ID was wrong. Recommendation: Program the initial ID fields to ignore any spacing (thus only recognizing numbers in those fields). The Google Chrome browser says very clearly, "Your connection is not private" when users attempt to access the URL for the online ACS. Some of the other warning messages are not so blatant, but this one makes it very clear that any information they enter will not be protected which is contrary to what the Census Bureau says about all data being confidential. Recommendation: Make sure that the URL for the production site does not trigger any such message. User Feedback on Survey Questions – Content Related Inverting relationship question: At least one participant was confused by the initial relationship question, where he inverted his relationship to his mother. A young adult (age 23) was answering the survey and lives with his mother and siblings. He read the initial relationship question and interpreted the answer as mother – he looked for the word mother and settled on “father or mother.” For his siblings he read it the way the survey intended, how each sibling was related to his mother (son or daughter). This inverting of relationships issue has been observed in other cognitive testing studies as well (see for example Childs et al., 2007, p 23).

Final Report ACS Phase 2
Recommendation: We have noticed that this is less of an issue when using the wording that decennial has for relationship. Consider implementing the wording that decennial uses, e.g., “Next, we need to record each person’s relationship to John A. Doe. Jane B. Doe is John A Doe’s… (Help)”
Roster issues: There were a few instances where the participant left an individual off the roster: One participant did not add his daughter to the list. During debriefing after the test administrator asked him about his daughter and why he left her off the list, he said he thought it was only for adults. He said his daughter lives with him about 40 percent of the time. Another participant mentioned during the session that he chose his 2 bedroom apartment for his son. During debriefing when asked about it by the test administrator he said that he has a son that sometimes comes to stay with him. At other times, the son lives with the mom. Recommendation: Consider adding in some additional probes during the roster building about children, including children who may live some of the time with another parent for custody purposes. The decennial help has an instruction that says, “Do include babies and children living at (address fill).” See Figure 21.
Figure 21. On left, screenshot of the mobile decennial instruction of who to include in the household; on right, screenshot of the mobile decennial over count question that includes reference to a child staying elsewhere. Motivating statements in mailing materials has nothing to do with Survey Questions: One participant was quite adamant that the reminder letter did not map to the questions he received in the survey. He thought, based on the reminder letter, that the survey was going to be about what he thought was needed in his community, such as hospitals, schools, etc. He said he would not have continued with the survey if at home. This user went on to say that the reminder letter combined with the actual survey questions “bamboozled” him. Recommendation: No recommendation at this point. Continue to monitor how the reminder letter does with respect to respondent surprise at the content of the ACS questions. Error reading answer choices that appear too similar: One participant, when initially attempting to answer Q1 ‘typeofunit’ said that none of the options fit for his circumstances because

Final Report ACS Phase 2
he lives in a building with 250 apartments. After saying this, he then looked again and realized that the penultimate option fit (e.g., a building with 50 or more apartments). See Figure 22.
Figure 22. Screenshot of question about how to describe building where respondent lives Recommendation: The layout of this question makes it difficult for participants to distinguish the differences of the response options. Consider testing different layouts for the answer options, for example, not repeating “A building with” so many times but list it only once and then list out the differences underneath. The layout of Q11, highest degree or level of school question, could be an alternate format to test with this question. See Figure 23.

Final Report ACS Phase 2
Figure 23. Screenshot of mobile Q11 with green formatting to break answer options up into sections Confusion about current or previous job: One participant answered the survey questions related to his job about his old job, not his current job. We saw this behavior in Phase I (un-optimized study) too where a participant thought the question was asking about his former job, not his current job (see Olmsted-Hawala et al, 2016). Recommendation: It is not clear why this is happening – however since we have seen this in two different studies, it warrants more investigation. Consider cognitively testing the questions about a respondent’s job. Issues with PIN: One participant did not completely understand the purpose of the PIN, although he did decide to write it down. When asked about the purpose of the PIN the participant commented, “I’m honestly not sure…..I can’t remember all that they said [referring to the PIN screen].” The participant further mentioned that he wrote down the PIN just in case there was some reason he could not log in without it, but it appears that he was not entirely sure about whether this was true. It is possible that the block of text about the PIN is simply too much text when a respondent is attempting to get started on answering the survey. See Figure 24.

Final Report ACS Phase 2
Figure 24. Screen shot of mobile PIN screen Recommendation: No recommendation at this time. For the future, consider testing the PIN screen further, such as re-writing the block of text in a more scan-able way and see if users understand what the PIN is for. Order of response options: Response items are not ordered based on response frequency. See Figure 25 (survey item 15). The second item seems like it should be listed last since it appears to be the least frequent choice out of the three.
Figure 25. Screen shot of Q15 Recommendation: Consider reordering the last two answer choices.

Final Report ACS Phase 2
Reference person: One participant had some difficulty responding to survey item “reference person” (owns or rents-shown below). The participant did not seem to recognize that more than one household member could be selected from the list. She had trouble because her mother was the person who owned the residence but other members of the household were paying rent. Ultimately, the participant chose only her mother from the list and proceeded. See Figure 26.
Figure 26. Screenshot of tenure Recommendation. No recommendation at this point. Continue to monitor cognitive difficulties of this question. Initial warning message: One participant said that if he were filling out the Census at home he would see the warning and wonder if this was illegal. “That’s what I’d be thinking about accessing a government computer.” Recommendation: Consider rewording the warning message to indicate clearly what the Census Bureau intends with the warning. The 2016 Census Test is testing new language. During usability testing, the new wording appeared to work better for respondents. Issues with Acre: Participants did not have a good understanding of how large an acre was. A few participants answered that their house was situated on an acre of land when, it was clear during debriefing, that it was not on such a large area of land (e.g., they live in a townhouse or in downtown DC in an urban area). Two participants went into the help on the acre question. When asked about going into the help during debriefing they said it was because they were trying to see if there was any information on how large an acre is. One user said he wondered if help “could

Final Report ACS Phase 2
spark an idea of how big an acre is.” Note, at this time, there is nothing in help to understand the dimension/size of acre. Recommendation: Consider adding in context to the help on how large an acre is, for example, an acre is about the size of a football field. Confusion with the word “agricultural”: One participant, who had said he lived on more than an acre of land, (incorrectly because he didn’t know how large an acre was, see issue above) answered Q5 about agricultural sales something other than none (e.g., $1 to $999). When asked about this during debriefing he said he thought “agricultural” had to do with religious artifacts, and that he knows in his house he has religious artifacts such as a cross or a picture of Jesus, etc. Recommendation: If confusion over the size of acre is fixed, the user would not receive this question. Consider also defining the term “agricultural” or use a more familiar term such as farming, or adding it to the original term (e.g., agricultural/farming sales.) Issues with one-ton capacity: Participants were confused by Q 12 about the number of cars on the property. The word “one-ton capacity” appeared to be what confused participants. At least three participants went into help on this question. When probed on what they were looking for in help, participants said that they wanted to know how much is one-ton. One user, after reading the help marked “No” to cars for this question. However during debriefing, he said that his family has three personal vehicles, and one motorcycle. He did say he saw in the help to not include the motorcycle. He also said he wasn’t sure what to include and thought it said if the cars were more than a ton to include them which is why he marked none. Recommendation: Consider re-wording the question to remove the reference to one-ton capacity. (e.g., “How many cars, vans and trucks are kept at home and used by members of the household.”) Internet Subscription: At least one user paused on Q10 when reading the word “subscription.” He eventually did select the first option, but as he did it he commented about not understanding the word subscription. We have heard similar comments about this word in earlier usability testing on desktop (See Olmsted-Hawala et al., forthcoming). Please note: it is the researchers understanding that from the time that this usability study was conducted the wording of this question has changed and it no longer asks if users have a “subscription.” Recommendation: Reword response options such as “Yes, by paying for Internet service” “Yes, without paying for Internet service” “No Internet access at this house.” Alternately, remove the question or if you need to keep it, don’t use it to branch participants away from the next question (e.g., Q11) as participants could answer “No” to all of Q11 as a way to indicate no Internet access. Issues with Internet access: On Q11 “At this house, do you or any member of this household subscribe to the Internet using…” a participant had difficulty with understanding which answer to select. In the end she chose “dial-up” and said, “I don’t know what cable we have. Actually we have KOKU where we watch TV through the Internet.” It is likely then that the participant answered incorrectly, as “dial up” would not be quick enough to stream the TV through the Internet. Please note: it is the researchers understanding that from the time that this usability study was conducted the wording of this question has changed on the production instrument. Recommendation: Cognitively test the term “dial up” and see if participants understand what this response option is. It may be that younger adults no longer understand what dial-up is.

Final Report ACS Phase 2
Number of rooms: One participant spoke aloud for Q7 as he counted the number of rooms in the house and he included bathrooms in the count. The text on the screen says not to include bathrooms – which he either did not read or, if read, misunderstood. A different participant said the instructions of what to exclude was so long that he wondered what else could fit under the include section. One participant said that he initially assumed it was the number of bedrooms asked first, not number of rooms. He was able to self-correct. Recommendation: Consider adding at least one other example of what to include, such as “living room,” “den,” “office room” or “study room.” Consider different layout of the question as the current design seems prone to error. Nonstandard address: One participant paused on Q15b when entering the address of where she lived one year ago. She said, “I am trying to figure out where to put the apartment number.” Recommendation: Make the address fields standard. Follow the conventional format of
Street Apt# City, State ZIP
For Q30, the question of where someone worked last week, one participant initially put the address all on the first line. We have observed this tendency in other usability tests with address fields on mobile phones. Recommendation: For the mobile design, it makes sense to allow participants to put the entire address on the first line. Date of Birth (DOB) issues: One participant who did not know a household member’s birthday initially went into the help and skimmed the words to leave blank if he did not know the DOB. He did this and received an error message. The participant then went into help a second time for the same question and on the second viewing of help he read that he should put the age in. This is a question that other usability studies have identified as confusing users with the help and edit messages. Recommendation: We don’t have a definitive recommendation, aside from continuing to test alternate wording of the help/edit text for DOB. The usability lab has made different suggestions to the DOB subject matter experts and are continuing to work with them on this issue. We will update the ACS team with any additional findings we have with respect to this question. Insurance coverage: One participant commented that he did not like answering the question about health insurance coverage because he is not insured and he knows that it is against the law to be uninsured. This may be sensitive because he has to report the information to a government agency. Recommendation: No recommendation at this point. Continue to monitor this question and the public response to it. Income questions for self-employed: When the participant is self-employed, the income series of questions is confusing (this was also noted in Phase I. See Olmsted-Hawala et al., under review). The question series on income may end up yielding an incorrect amount for respondents in these work situations because they may enter the amount they earn on the initial income questions (Q47) and again under the self-employment series of questions (Q47b).

Final Report ACS Phase 2
One participant entered in the amount he made of $15,000 twice. As he added it in the second time he said, “I hope they don’t add them together.” Later when he realized that they did add them together he said, “Oh it did, it calculated it together!” He then said, “No,” and changed the amount from $30,000 to $15,000. (This behavior was also noted in Phase I). In addition, this same participant commented that the income questions were difficult for him as he does odd jobs and he plays in a band. He put his band name as his employer name and most important duties (e.g., “strumming and singing”), but he said during the debriefing that of the amount he entered ($15,000) about half of that came from odd jobs and the other half was from his band. Recommendation: Continue to monitor this question. If self-employed people always correct the amount then it is a moot point, however it may make sense to include some assistance about where self-employed people should enter their income information. Hispanic Origin: One participant, who did not identify as someone of Hispanic Origin, commented when reading that Hispanic Origin was not a race, “Why?” Recommendation: The combined (race and Hispanic Origin) question currently being fielded in decennial tests appears to address this and similar issues. Sex question: One participant commented on the Sex question of whether there should be a “trans gender” choice. Note: we are hearing this comment a bit more frequently in our usability studies. Recommendation: No recommendation at this point aside from continue to monitor this question and respondents’ reaction to it. Home owner as only respondent confusion: One participant said he thought the survey was for home owners and not for renters. He said if he was at home he would not have answered the survey as he is not the home owner. Recommendation: Continue to monitor cognitive difficulties with this question. Consider whether it would help to have some context in the FAQ, instructions or help that this survey is for everyone in household. Concern about answering private questions for unrelated individuals: At least one participant was reluctant to enter information about his unrelated housemates (e.g., date of birth). He asked whether the information entered would remain confidential. Recommendation: Consider adding in some context (possibly in the help or FAQ) to assure respondents that it is acceptable, encouraged, and required by law for them to answer for the other household members. Types of computer: One participant who was answering using his Tablet computer for question 9 tapped yes to c “Some other type of computer” but instead of writing in tablet, he wrote in the Dragon software that allows deaf people to hear what is on the screen. Another participant said “I don’t know what other type of computer there would be.” This seems to imply that he thought a and b were exhaustive. Another participant said “that’s too vague. Specify what [some other type of computer] means.” This participant then looked at the help and saw that it meant tablet he said “do you really need help when you can put tablet. If it’s a list of one….” Please note: it is the researchers understanding that since the time that this usability study was conducted, response options/question stem has changed on the production instrument.

Final Report ACS Phase 2
Recommendation: Consider adding in examples for the other type of computer such as Tablet. This could clue users to know not to include software and also to let them know where to put tablets. Sole person in household: One participant, who was the only person in the household, said that the questions that asked if ‘anyone in the household’ were an odd choice when it is only him, and the survey knows it’s only him. For example, he commented that instead of it asking for Q14 a “Does anyone in this household pay for electricity” it should be worded to say “Do you pay for electricity?” Recommendation: This is a similar issue that we have seen with the decennial usability tests as well. Consider altering fills for single person households to make it clear that we are asking about them specifically. Missing help on health question series: One participant commented that on the question series 18 – 20 (about health related topics) that he would like to have help for the questions. He went on to say that these terms have medical definitions and the help would aid someone so they would not be guessing what was being asked. Another participant who, during debriefing, said that he has a mental disability (and he works 40 hours a week not for pay) said he marked no to the question related to mental health because it did not explicitly ask about “mental disability.” Recommendation: Add help to the health related questions. Confusion on how to answer rent amount when on government assistance: One participant was answering on the amount of rent they pay and he said, “It’s a lot but we have Section 8 through the Housing Authority Program,” so he guessed the rent was $52.00 because of Section 8. Recommendation: Consider adding in help on this topic Time series: One user said that when it asked the series of utility questions with the time reference changing on the third set, “my brain kind of scrambled.” This user then clicked the back button to check if the prior two time references had actually been “within the last 12 months.” Recommendation: We have heard similar comments in earlier rounds of testing. Continue to monitor whether this series of questions can be altered to address this issue. Repetition with ancestry question: At least three participants commented when the ancestry question came up that it was repetitious as they felt they had already answered this question earlier. One user said, “They are asking the same questions over [again].” Recommendation: Continue to monitor this question. Decennial is considering combining the origin question with the race question, as well as adding write-in fields for detailed ethnicities; this may alleviate this issue. Although the decennial census does not have an “ancestry” question per se, the follow up question about detailed ethnicities is potentially getting at the same information.

Final Report ACS Phase 2
Appendix C: Reminder Letter