Embed Size (px)
Citation preview

Research Report Research Report WritingWriting

General Presentation & FormatGeneral Presentation & Format• ALL reports should be typed
• Have a neat, clean cover
• Double‑space
• Don’t Mix pen and typing
• Page numbers should be centered at the BOTTOM of each page
• Follow format and sequence
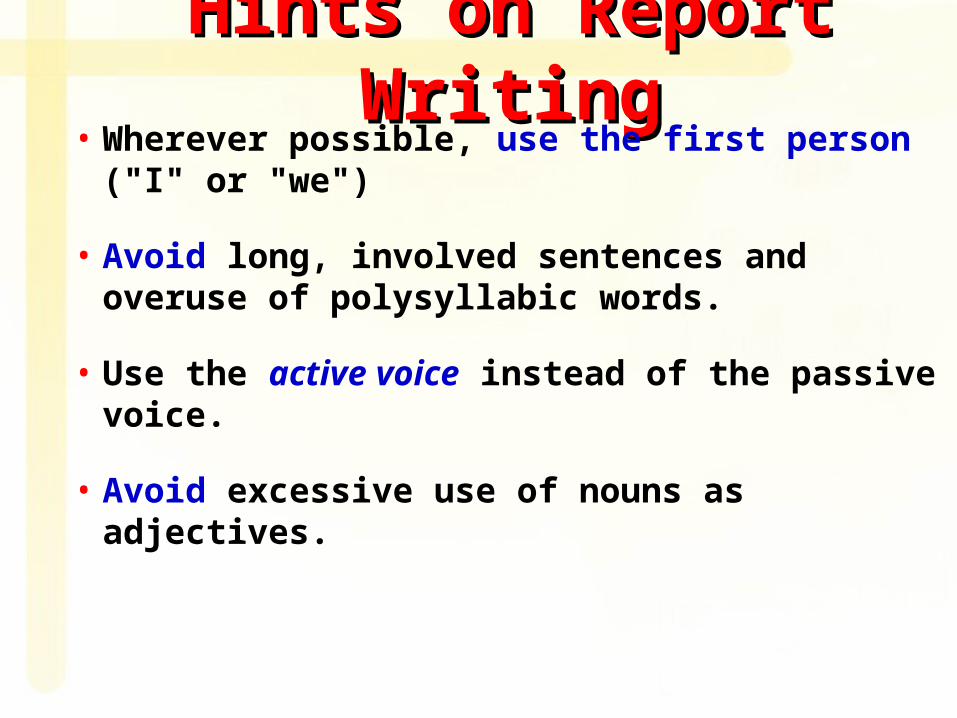
Hints on Report WritingHints on Report Writing• Wherever possible, use the first person ("I" or
"we")
• Avoid long, involved sentences and overuse of polysyllabic words.
• Use the active voice instead of the passive voice.
• Avoid excessive use of nouns as adjectives.

Hints on Report WritingHints on Report Writing• Don't hide your findings in noncommittal
statements-BE POSITIVE
• Keep specialized jargon to a minimum.
– Keep technical abbreviations and acronyms to a
minimum.
• Avoid repeating facts and thoughts.
– Be concise and succinct.

TITLE TITLE PAGEPAGE
Name of ProjectName of Project
Your NameYour Name
DateDateCourseCourse
InstructorInstructorSchoolSchool
City & StateCity & State

ABSTRACTABSTRACT• Brief, ONE PAGE MAX
–Writing a clear, concise abstract is an art!
• Summary, including the nutshell of your results and conclusions.
• Include the dates and location
• Write the abstract last - no page #
• Must match the rest of your findings

TABLE OF TABLE OF CONTENTSCONTENTS
Table of ContentsTable of ContentsPagePage
Introduction…….1Introduction…….1Materials…..……5Materials…..……5Methods…………6Methods…………6Results…………..7Results…………..7Discussion…..….12Discussion…..….12Conclusion……..20Conclusion……..20
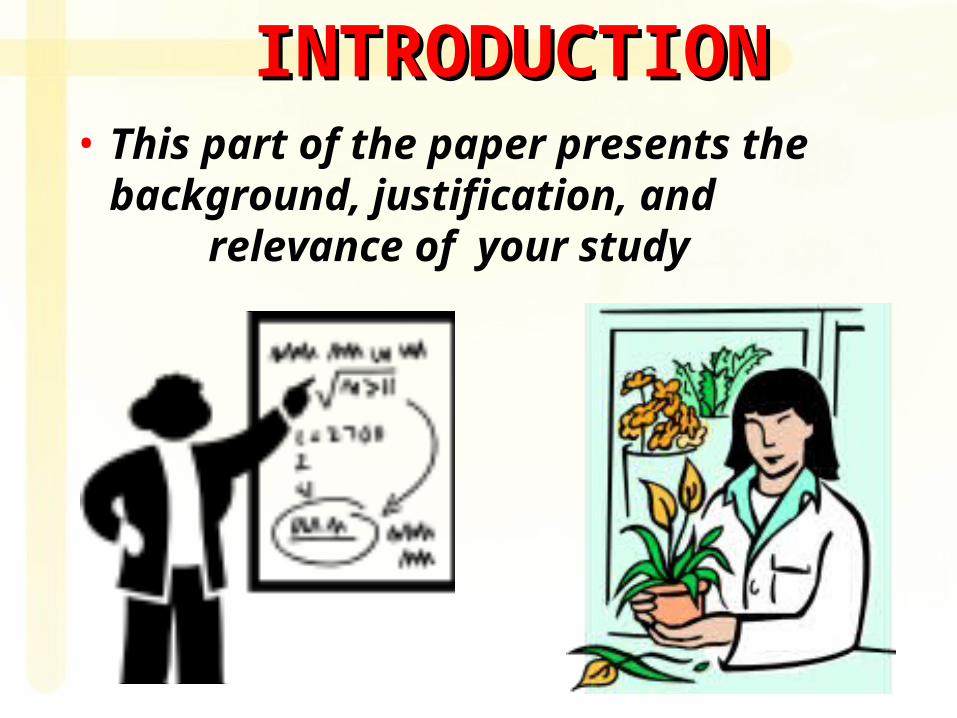
INTRODUCTIONINTRODUCTION• This part of the paper presents the
background, justification, and relevance of your study
INTRODUCTIONINTRODUCTION• State the problem and objectives
• Hypothesis (if applicable) to be tested
• Brief background, with
cited review of literature
• Relate the problem and
significance to the discipline
INTRODUCTIONINTRODUCTION• Use a wide variety of sources, from
research journals to books, to DVD’s to the Internet.
• Include at least one print source
• Condense the information you’ve found.
ParaphraseParaphrase, , notnot plagiarizeplagiarize

CitationsCitations• Information learned from outside
sources needs to be "cited" in the Introduction - like writing footnotes, only easier.

CitationsCitations• RULE 1 Cite all sources that refer to
information on your species, experiment, or study site.
• RULE 2 Cite all sources that back up your conclusions.
• RULE 3 Cite anything that brings in a fact not directly taken from your own observations.
• RULE 4 WHEN IN DOUBT, CITE!

Example of Proper CitingExample of Proper Citing
White sharks are known to be man eaters
(Halstead, 2008). They are the only shark that
regularly preys on marine mammals for food.
Some scientists believe that great whites attack
humans by mistake: the silhouette of a surfer
paddling on a surfboard may be mistaken for
a seal sunning on the surface
(Ellis, ed., 2011).

Variations In CitationsVariations In Citations• One Author: (Bronowski, 2003)
• Two Authors: (Walker and Maben, 2005)
• Three or More Authors:(Cochran, Wiles, and Manack, 2011)
• No Authors: (Insects of Guam, 2010)
• Only an Editor: (Ellis, ed., 2011)
• Citing Experts You Have Spoken To:
(Collins, pers. commun.)

Materials And MethodsMaterials And Methods• Materials (in narrative form)
– Describe EXACTLY what you used to do your research
• (Ti-83 calculator, x-rays, snap-trap)

• Methods (Procedure)
– Sampling dates
– Locations
– Methods used
Materials And MethodsMaterials And Methods
• Concise, but detailed enough that a reader could duplicate your investigation

Materials And MethodsMaterials And Methods• Standard procedure descriptions should be kept
extremely concise.
• Including properly- labeled diagrams or photographs of any setup
• In a field study, a site description is required, complete with site maps.

Materials And MethodsMaterials And Methods• Computer software should be fully cited,
including the version used.
• Statistics used to analyze your data should be included and cited.
StatisticsStatistics

RESULTSRESULTS• Contains a description and interpretation
of the data
• Include qualitative observations you made during the study.
– NOT just a data summarization
– NOT just pages of tables and figures...

RESULTSRESULTS• Tell the reader exactly what you found
– What patterns
– Trends
– Relationships observed
• Photos, graphs, or diagrams that visually describe your results.

• Label graphs & tables correctly
RESULTSRESULTS

Figure 1. Number of students attending Poly High and Lakewood High since 1950.
Line GraphLine Graph
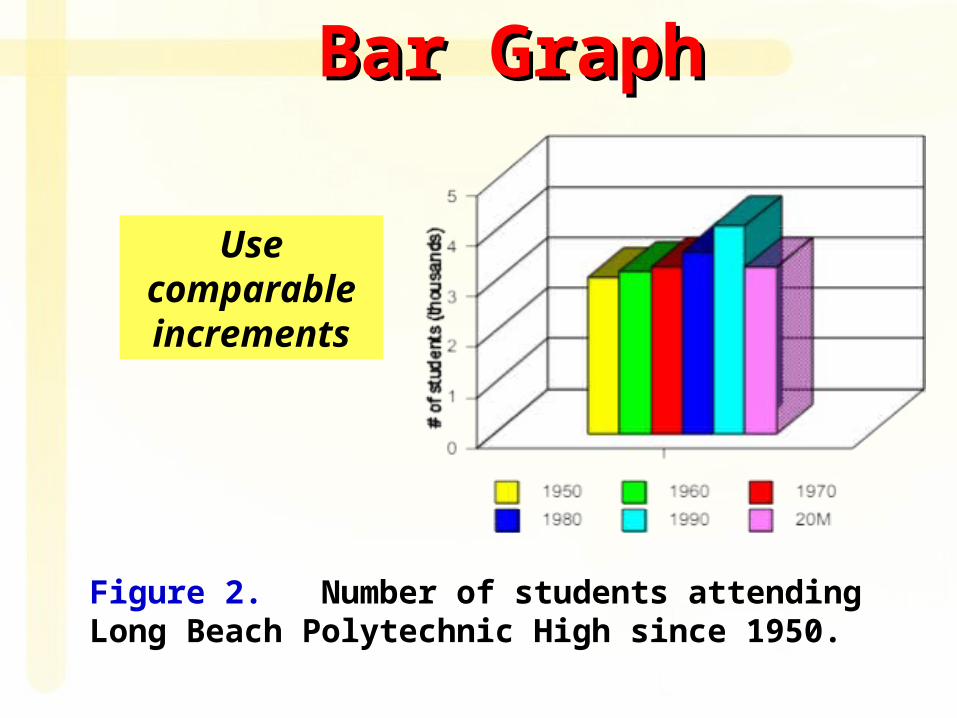
Figure 2. Number of students attending Long Beach Polytechnic High since 1950.
Bar GraphBar Graph
Use comparable increments

Figure 3. The number of brine shrimp found in sections of tubing after the shrimp were exposed to changes in light, pH, or temperature, on 10/2/2003 at Cabrillo HS.
Pie GraphPie Graph
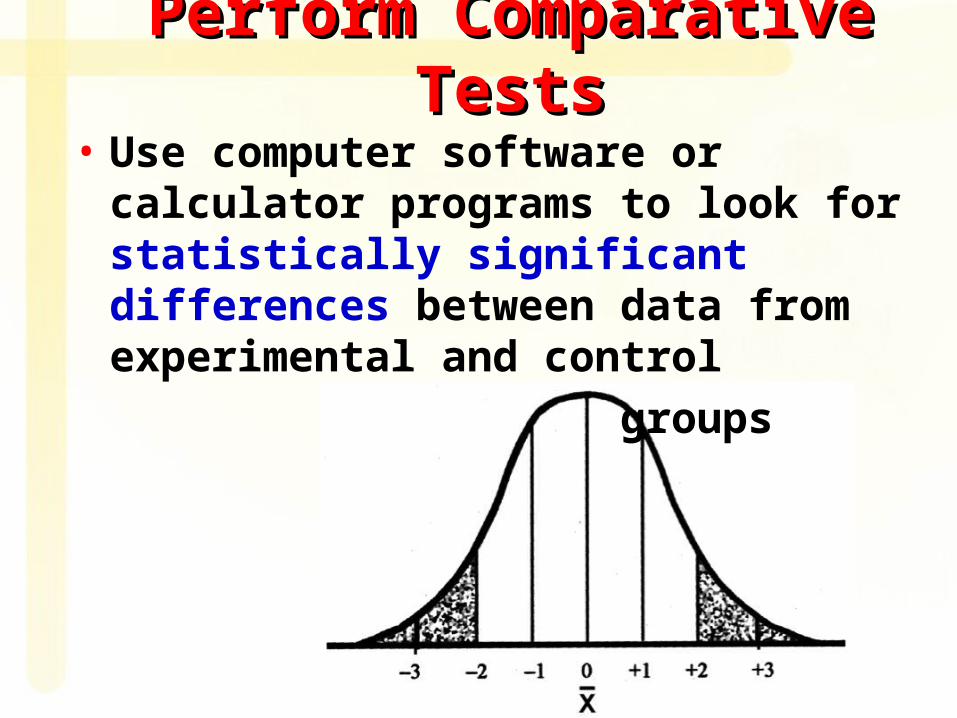
Perform Comparative TestsPerform Comparative Tests
• Use computer software or calculator programs to look for statistically significant differences between data from experimental and control
groups

Perform Comparative TestsPerform Comparative Tests• Standard Deviation
– Deviation of data from their mean.
• T-test– For data sets that follow normal distribution
• Chi Square– Comparing data in % form in 2+ categories
• Diversity Indices– Compares species diversity and dominance between different
communities
• Mann-Whitney U test– Differences in two sets of data by examining a sample of data
from each population.

• Results should be interpreted, critically evaluated, and compared to other reports.
– The results section presents the "news,”
– The discussion section contains the "editorial."
DISCUSSIONDISCUSSION

Analyze The ResultsAnalyze The Results• Interpret statistics properly– DON’T make broad statements from
small samples
– Use P <.05 that differences have occurred from chance alone

• Examine the amount and possible sources of variability in your data, including experimental error.
Analyze The ResultsAnalyze The Results

• Examine your results for bias and evaluate its effect.
Analyze The ResultsAnalyze The Results
• Look at your data from as many points of view as possible

• Do not make generalized statements that are not based on
– Your data
– Known facts
– Reason
Analyze The ResultsAnalyze The Results

• Relate your findings to other studies
– Cite those studies
• Remember that LEARNING, not the confirmation of your hypothesis, is your goal.
Analyze The ResultsAnalyze The Results

CONCLUSIONCONCLUSION* Can be included WITHIN the Discussion…
• A brief summary of your findings
– Follow with a set of clear statements you believe explain your results.
Was your hypothesis valid or invalid?
ReferencesReferences• References you used and referred to in
your paper
• Alphabetical Order by author
• Several papers by the same author:
– List most recent first
– Indent 2nd & succeeding lines
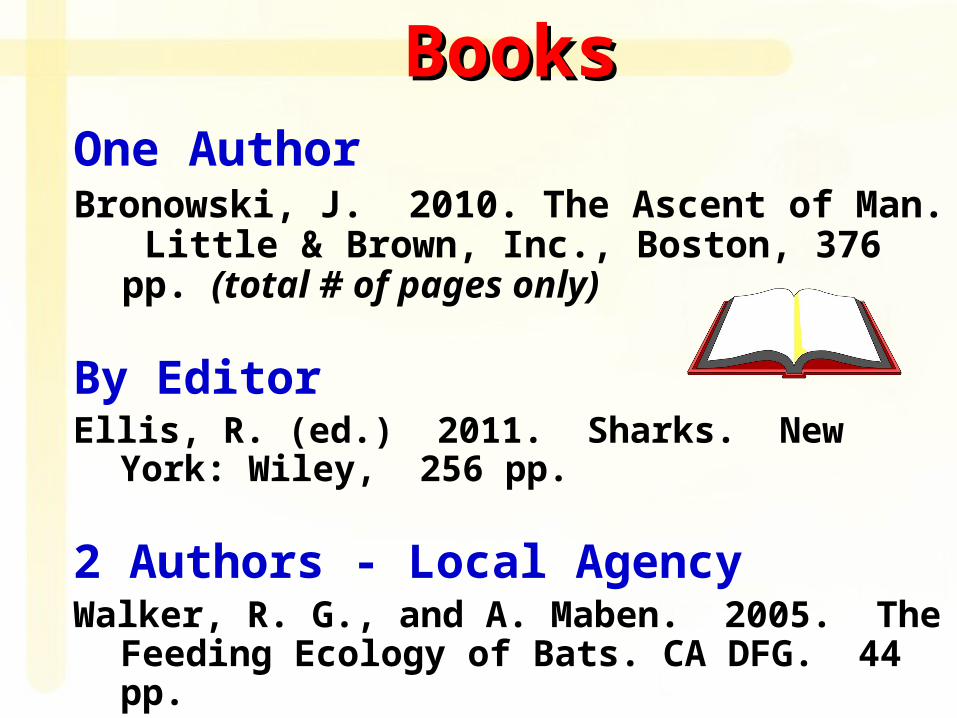
BooksBooksOne AuthorBronowski, J. 2010. The Ascent of Man. Little &
Brown, Inc., Boston, 376 pp. (total # of pages only)
By EditorEllis, R. (ed.) 2011. Sharks. New York: Wiley,
256 pp.
2 Authors - Local AgencyWalker, R. G., and A. Maben. 2005. The Feeding
Ecology of Bats. CA DFG. 44 pp.
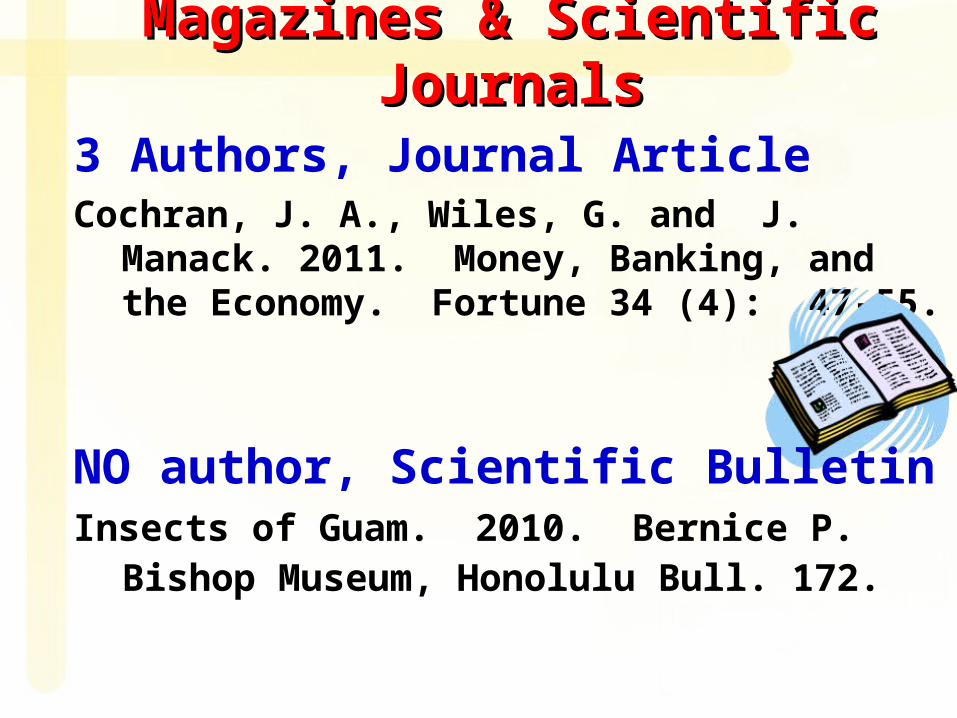
Magazines & Scientific JournalsMagazines & Scientific Journals
3 Authors, Journal ArticleCochran, J. A., Wiles, G. and J. Manack. 2011.
Money, Banking, and the Economy. Fortune 34 (4): 47‑55.
NO author, Scientific BulletinInsects of Guam. 2010. Bernice P. Bishop
Museum, Honolulu Bull. 172.

Newspaper & EncyclopediasNewspaper & Encyclopedias
NewspaperKristof, N. D. 3 Jan 2005. Oil Futures Plunge on
OPEC Doubt. New York Times, Dl‑3.
Article Within Encyclopedia
Halstead, B. 2008. Poisonous & Dangerous Marine Animals. Pp. 105‑115 in Encyclopedia Britannica Vol. 93 (C. Brown, ed.), Academic Press, New York.

Non-print SourcesNon-print Sources
FilmRedford, Robert, dir. 1980. Ordinary
People. With Mary Tyler Moore and Donald Sutherland. Paramount Studios, Hollywood.
SoftwareBill Nye: Greatest Discoveries in Biology.
2005. Discovery School.com. DVD.

InternetHow to Produce Award-winning Science
Projects. 2010. Nat. Assoc. of Biology Teachers Bulletin Board, @NABT.edu.
Non-print SourcesNon-print Sources
“Personal Communications" with an Expert– (in person, on the phone, in letters or on
the Internet)Collins, Dr. Charles 2009. Prof. of Biology, CSU Long
Beach, CA.

ACKNOWLEDGEMENTSACKNOWLEDGEMENTS• Acknowledgements for Senior Projects
cannot be on the display board!
• Identify the major people who gave you assistance
• Give them the thanks they deserve

APPENDICESAPPENDICES• Additional pictures and/or material you
wish to include
• Make sure any appendices are listed in the table of contents
• DON'T stuff this section unnecessarily ‑ it will not win you points...

Common ProblemsCommon Problems• Failure to use, evaluate, and interpret
your data is the most common problem students have in report writing.
• Ignoring results because they differ from textbook generalizations.
• Bringing too much irrelevant information into reports.
Common ProblemsCommon Problems• Making small differences seem
important.
• Discarding data because of variability and biases.
• Improperly labeled and cited figures and tables.
Common ProblemsCommon Problems• Inserting figures without identifying their
contents or purpose
• Failing to number and place each figure close to where it is referred to in the text.
• Not working over the data to seek patterns and trends before preparing figures and tables.

Common ProblemsCommon Problems• Forcing a preconceived conclusion on the
data.
• “Fudging" your data: it is dishonest and unacceptable and considered scientific misconduct.
• Padding your report with excessive though honest numbers that serve no useful function.

Common ProblemsCommon Problems• Not documenting ideas and conclusions
with data, literature, and sound reasoning.
• Not relating your results and conclusions to accepted principles and concepts.

Designed by Designed by Anne F. MabenAnne F. Maben
Science Consultant, UCLA Science ProjectScience Consultant, UCLA Science Project
for the for the Los Angeles County Science FairLos Angeles County Science Fair
© 2014© 2014 All rights reservedAll rights reserved
These images are for viewing only and may not be published in any form