Embed Size (px)
Citation preview

University of Nebraska - LincolnDigitalCommons@University of Nebraska - Lincoln
Library Philosophy and Practice (e-journal) Libraries at University of Nebraska-Lincoln
2016
Research Trends in Medical Physics: A GlobalPerspectiveRAMIAH SANTHA KUMAR MrS K R ENGINEERING COLLEGE, [email protected]
Follow this and additional works at: http://digitalcommons.unl.edu/libphilprac
Part of the Library and Information Science Commons
SANTHA KUMAR, RAMIAH Mr, "Research Trends in Medical Physics: A Global Perspective" (2016). Library Philosophy andPractice (e-journal). 1362.http://digitalcommons.unl.edu/libphilprac/1362

Research Trends in Medical Physics: A Global Perspective
Dr. R. Santha kumar
Librarian
S K R Engineering College, Poonamallee, Chennai - 600 123.
Email: [email protected]
Abstract
The paper presents an analysis of 11181 global publications in medical physics, indexed in Web
of science database during 2000-2013; the average number of publications published per year
was 798.64. Out of 11181 publications, maximum of 5014 (44.84%) publications have been contributed
by mega authors, followed by multi authors with 3588 (32.09%) publications. The value of co
authorship index for mega authored publications is the highest. The highest value of
collaboration coefficient is 0.67 in 2013. The Degree of collaboration of publications of the
medical physics is 0.96. Hendee, W R, Medical college Wisconsin, USA is the most productive
author contributing 57 publications followed by Levin, C S, Stanford university school of
medicine, USA with 52 publications and Yanagida, T, University of Tokyo, Japan with 51
publications. USA had the highest share (32.43%) of publications followed by Germany with
10.56% publications, Japan with 9.19% publications, and UK with 7.74% publications, and Italy
with 7.47% publications and China with 5.11% publications. Among the prolific institutions, Istituto
nazionale di fisica nucleare, Frascati, Italy had the highest (2.95%) publications followed by European
organization for nuclear research CERN, Switzerland with (1.93%) publications. Publications on
medical physics are spread over 24 languages. Medicine contributed the largest share (58.42%)
publications among subjects, followed by physics and astronomy (57.17%) publications,
engineering (18.26%), biochemistry, genetics and molecular biology (8.18%) and health
professions (8.10%) publications.
Keywords: Medical physics, Scientometrics, Annual growth rate, Authorship pattern, Co
authorship index and collaboration coefficient
1. Introduction
Education in the field of Medical Physics has experienced considerable growth and change from
the time when the first publication of this report in 1993. Medical physics is one of the fastest
emergent areas of research for academicians and physicists. It plays a vital role in the medical
research areas of cancer, heart disease, and mental illness by involving in the development of
new instrumentation and technology for use in diagnostic radiology. It is also concerned with the
applications of digital computers in medicine and applications of information theory to
diagnostic problems; processing, storing, and retrieving medical images; measuring the amount
of radioactivity in the human body and studying the anatomical and temporal distribution of
radioactive substances in the body.
Scientometrics is a discipline which analyses scientific publications to explore the
structure and growth of science. They develop benchmarks to evaluate the quality of information

resources and packages of information for decision making in medical physics. It provides a key
opportunity to the researcher to publish their articles with new strategies, innovations, new
methods and new ideas Scientometric analysis is the quantitative study of a subject growth by
using bibliometric indicators and statistical tools and techniques. It light a research on the pattern
of growth of individual to the respective subject literature, inter-relationship among different
branches of knowledge, productivity, authorship pattern, degree of collaboration, pattern of
collection building, and their use. Gradually the Scientometric studies are attaining the status of
inter-disciplinary in nature. The Scientometric techniques are used to understand the magnitude
of the growth of a particular discipline. Especially the trends and pattern in growth, contribution
of a particular author or institutions and the collaboration pattern, relative growth rate and so on.
They empirically describe the constantly changing relationships in medical physics. This
consequently sheds more light on our knowledge of the structure of subject of literature and
better organization of information resources which can ultimately be effectively used. Therefore,
the present study has been undertaken in order to know the growth and development of
publications in the field of medical physics research as indexed in web of science database.
2. Objectives for the Study
The objective of the study was to perform a scientometric analyze the global research output in
medical physics during 2000-2013, with a following aspect of the study:
Forms of Publications
Annual Growth Rate, Relative Growth Rate and Doubling Time of publications
Authorship Pattern of Publications
Relative citation impact of highly productive countries
Highly productive institutes
Highly preferred source titles for publication
Language-wise distribution of cosmic rays research output
3. Methodology
The Web of Science database was used for retrieving data on medical physics during 2000-2013,
using search terms namely ‘medical physics’ in ‘topic filed’. A total of 11181 publications were
downloaded, the data were transferred to spread sheet application and analyzed the data as per
objectives of the study.
4. Data analysis and interpretations
4.1 Forms of publications
Table 1 Forms of publications
S. No. Forms of publications No. of publications Percentage
1 Conference papers 6161 55.10
2 Journal articles 3275 29.29
3 Review 835 7.47
4 Editorial 321 2.87

5 Note 179 1.60
6 Short survey 142 1.27
7 Erratum 81 0.72
8 Book 70 0.63
9 Letter 70 0.63
10 Book chapters 47 0.42
Total 11181 100
Figure 1 Form of publications
The table 1 reveals that the major source of publications covered by web of science
databases on medical physics research is Conference papers with 6,161 publications (55.10%)
followed by Journal articles with 3,275 publications (29.29%). Review ranks the third position
with 835 publications (7.47%) followed by editorial with 321 publications (2.87%), note with
179 publications (1.60%), short survey with 142 publications (1.27%) and remaining forms are
less than one percentage as seen in the table. The results indicate that the research outputs on the
subject of the period covered by the study are mostly published in the form of conference papers.
4.2 Annual growth rate (AGR) of publications
Table 2 provides the AGR of the number of documents for period 2000 to 2013.
End Value - First Value
AGR = ----------------------------- x 100
First Value
Table 2 AGR and CAGR of Publications 2000 - 2013
Year
No. of
publications
Cumulative
publications
Annual growth
rate (AGR)
Compound
annual growth
rate (CAGR)
2000 233 233 - -
2001 236 469 1.29 98.73
2002 282 751 19.49 63.19
2003 275 1026 -2.48 54.42
2004 349 1375 26.90 40.89
2005 442 1817 26.65 32.67
2006 515 2332 16.52 27.33
2007 617 2949 19.81 24.48
2008 828 3777 34.20 20.89
2009 1229 5006 48.43 16.71
2010 1448 6454 17.82 16.12
2011 639 7093 -55.87 24.19
2012 2562 9655 300.94 11.20
2013 1526 11181 -40.44 14.96
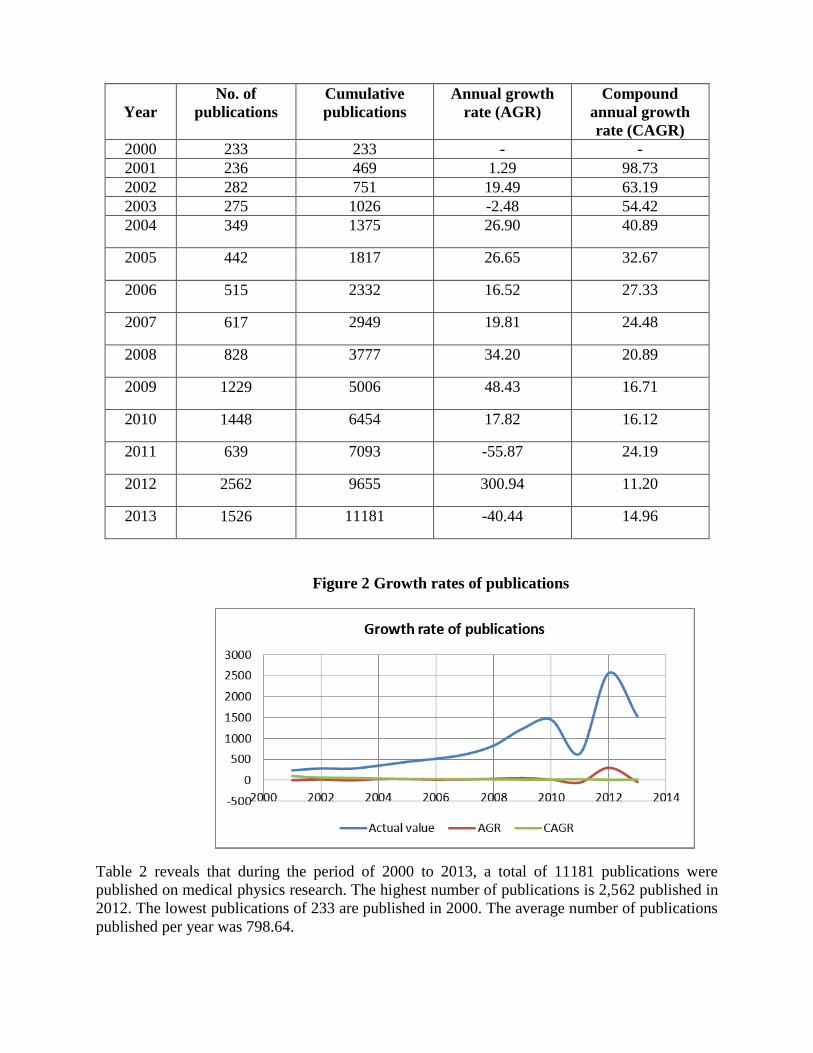
Figure 2 Growth rates of publications
Table 2 reveals that during the period of 2000 to 2013, a total of 11181 publications were
published on medical physics research. The highest number of publications is 2,562 published in
2012. The lowest publications of 233 are published in 2000. The average number of publications
published per year was 798.64.

Table 2 also shows that the Annual growth rate of the total publications calculated year wise. It is
seen in the table that there is a fluctuation trend of growth in the study period. The AGR has
decreased -2.48 in 2003 and it was increased to 300.94 in 2012. Since then, there is fluctuation in
year after year as illustrated in table 2. The reason for the fluctuation is that there is no constant
growth of publications in every year.
4.2.1 Compound annual growth rate (CAGR)
The year-over-year growth rate of investment over a specified period of time. The
compound annual growth rate is calculated by taking the nth root of the total percentage growth
rate, where n is the number of years in the period being considered. This can be written as follows:
The compound annual growth rates of the publications are gradually decreased from 98.73 in
2001 to 11.20 in 2012 as seen in the Table 2. This indicates that though the yearly output is
increasing year after year but the compound annual growth rate is in down ward trend.
4.3 Relative growth rate (RGR) and Doubling time (DT)
The Relative growth rate (RGR) is the increase in number of articles or pages per unit of
time. This definition derived from the definition of relative growth rates in the study of growth
analysis in the field of mobile technology. The mean relative growth rate (R) over the specific
period of interval can be calculated from the following equation.
Relative growth rate (RGR)
1 - 2R=Log W2 – Log W1/ T2-T1
Whereas
1-2 R- mean relative growth rate over the specific period of interval
Loge W1 - log of initial number of articles
Loge W2 - log of final number of articles after a specific period of interval
T2-T1- the unit difference between the initial time and the final time
The year can be taken here as the unit of time.
Doubling Time (DT) = 0.693/R

Table 3 Relative growth rate (RGR) and Doubling time (DT) of publications
Year
No. of
Publications
Cumulative
Total
W1
W2
RGR
DT
2000 233 - - 5.45 - -
2001 236 469 5.45 6.15 0.70 0.99
2002 282 751 6.15 6.62 0.47 1.47
2003 275 1026 6.62 6.93 0.31 2.24
2004 349 1375 6.93 7.23 0.30 2.31
2005 442 1817 7.23 7.50 0.27 2.57
2006 515 2332 7.50 7.75 0.25 2.77
2007 617 2949 7.75 7.99 0.22 3.15
2008 828 3777 7.99 8.24 0.25 2.77
2009 1229 5006 8.24 8.52 0.28 2.48
2010 1448 6454 8.52 8.77 0.25 2.77
2011 639 7093 8.77 8.87 0.10 6.93
2012 2562 9655 8.87 9.18 0.31 2.24
2013 1526 11181 9.18 9.32 0.14 4.95
The year wise RGR is found to be in the range of 0.70 to 0.14. Year wise calculation of RGR
reveals that it has decreased from 2001 to 2007 and thereafter the trend is seen fluctuating (figure
3). The highest value corresponds to 2005, whereas the lowest value for the years 2013.
Doubling time too has a trend similar to that of RGR. Its ranges is from 0.99 to 6.93 (figure 3). A
year wise increase is seen during the first seven year periods of the study, the DT has shown a
year wise increase from 0.99 to 3.15 and thereafter a fluctuating.

Figure 3 RGR and DT of research output
4.4 Trend Analysis – Method of Least Squares
This is the best method for obtaining the trend values. It provides a convenient basis for
obtaining the line of best fit in a series. Line of the best fit is a line from which the sum of the
deviations of various points on its either side is zero. Further the sum of the squares of these
deviations would be the least as compared to the sum of squares of the deviations obtained by
using other lines.
The straight line trend has an equation of the type: Y = a + bX,
Where,
Y represents the estimated values of the trend, X represents the deviations in time period;
‘a’ and ‘b’ are constants.
The values of two constants ‘a’ and ‘b’ are estimated by solving the following two
normal equations.
∑ Y = Na + b∑ X
∑ XY = a ∑ X + b∑ X2
Where N represents number of years for which data is given.
The variable X can be measured from any point of time as origin. To make calculation
simpler, it is better to take the mid-point of time as the origin because the negative values of first
half of the time series will equalize the positive values in the second half of the series which
symbolically gives ∑ X = 0.
When ∑ X = 0, the two normal equations for finding the constants ‘a’ and ‘b’ will be
∑ Y -
∑ Y = Na => a = ----- = Y
N

∑ XY
∑ XY = b ∑ X2 => b= ----------
∑ X2
This provides that the constant ‘a’ is simply equal to the mean of Y values and the
constant ‘b’ gives the rate of change. The constant ‘a’ refers to the Y intercept, i.e. the difference
between the point of origin and the point where the trend line touches the Y axis. The constant
‘b’ refers to the slope of the line which indicates the change in Y for each unit change in X.
Table 4 Computation of Straight Line Trend by the Least Squares Method
Year No. of
Publications
Actual (Y)
Deviation Deviation Multiply
(X)
XY X2 No. of
Publications
Trend
2000 233 -6 -6.5 -13 -3029 169 -51.04
2001 236 -5 -5.5 -11 -2596 121 79.68
2002 282 -4 -4.5 -9 -2538 81 210.4
2003 275 -3 -3.5 -7 -1925 49 341.12
2004 349 -2 -2.5 -5 -1745 25 471.84
2005 442 -1 -1.5 -3 -1326 9 602.56
2006 515 0 -0.5 -1 -515 1 733.28
2007 617 1 1 1 617 1 864
2008 828 2 1.5 3 2484 9 994.72
2009 1229 3 2.5 5 6145 25 1125.44
2010 1448 4 3.5 7 10136 49 1256.16
2011 639 5 4.5 9 5751 81 1386.88
2012 2562 6 5.5 11 28182 121 1517.6
2013 1526 7 6.5 13 19838 169 1648.32
2014 15 1779.04
2015 17 1909.76
2016 19 2040.48
2017 21 2171.2
2018 23 2301.92
2019 25 2432.64
2020 27 2563.36
2021 29 2694.08
2022 31 2824.80
2023 33 2955.52
2024 35 3086.24
11181 59479 910 60276.24
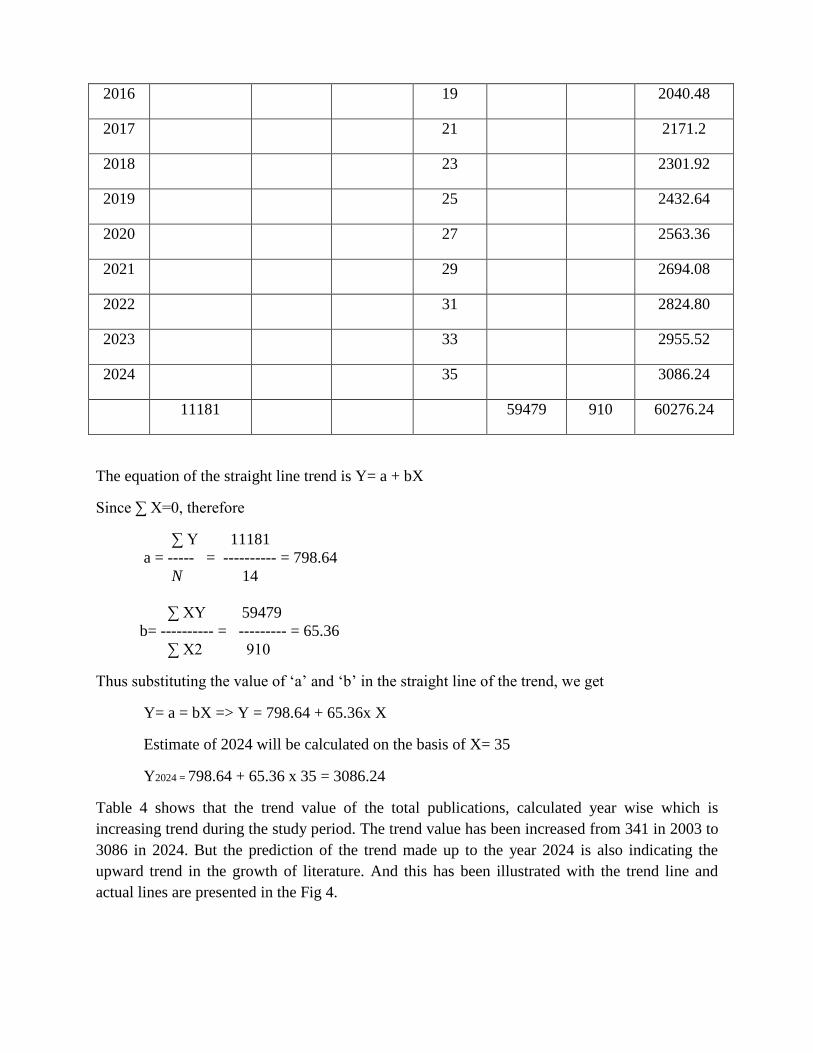
The equation of the straight line trend is Y= a + bX
Since ∑ X=0, therefore
∑ Y 11181
a = ----- = ---------- = 798.64
N 14
∑ XY 59479
b= ---------- = --------- = 65.36
∑ X2 910
Thus substituting the value of ‘a’ and ‘b’ in the straight line of the trend, we get
Y= a = bX => Y = 798.64 + 65.36x X
Estimate of 2024 will be calculated on the basis of X= 35
Y2024 = 798.64 + 65.36 x 35 = 3086.24
Table 4 shows that the trend value of the total publications, calculated year wise which is
increasing trend during the study period. The trend value has been increased from 341 in 2003 to
3086 in 2024. But the prediction of the trend made up to the year 2024 is also indicating the
upward trend in the growth of literature. And this has been illustrated with the trend line and
actual lines are presented in the Fig 4.

Figure 4 Trend of the medical physics literature
4.5 Authorship pattern of publications
Table 5 Authorship pattern of publications
Block Year Single CAI Two CAI Multi CAI Mega CAI Total CC
1
2000 12 98 33 83 76 92 112 113 233 0.65
2001 7 57 41 103 108 129 80 80 236 0.65
2002 9 61 37 78 94 94 142 118 282 0.66
2003 18 125 42 91 79 81 136 116 275 0.63
2004 26 142 61 104 117 95 145 98 349 0.63
2005 16 69 73 98 151 96 202 108 442 0.66
2006 34 126 105 121 202 111 174 80 515 0.62
Total 122 392 827 991 0.64
2007 27 120 121 100 184 96 285 102 617 0.64
2008 42 139 158 97 283 110 345 92 828 0.64
2009 69 154 274 113 359 94 527 94 1229 0.62
2010 43 81 363 127 417 92 625 95 1448 0.63

2011 21 90 89 71 245 54 284 98 639 0.66
2012 84 90 453 90 757 95 1268 109 2562 0.66
2013 37 26 284 95 516 108 689 99 1526 0.67
Total 323 1742 2761 4023 11181 0.65
CAI–Co -Authorship index, CC–Collaboration coefficient
Figure 5 Authorship pattern of publications
The authorship pattern was analyzed to determine the percentage of single and multiple
authors. From the table 5, it is observed that out of 11181 publications, maximum of 5014
(44.84%) publications have been contributed by mega authors, followed by multi authors with
3588 (32.09%) publications, two authors with 2134 (19.09%) publications. Only 445 (3.98%)
publications have been contributed by single authors. It indicates that the multi authored works
are more than that of single authored contributions in the field of medical physics.
4.5.1 Pattern of Co-Authorship Index (CAI)
For calculating the co-authorship index and collaboration coefficient for authors, countries have
been replaced by block. For this study, the authors have been classified into two blocks, vz
Single, Two, Multi and Mega authors and the results of Co-authorship index and collaboration
coefficient have been presented in the Table 4. The study reveals that the result of co-authorship
index and it is observed that the value of CAI for mega authored publications is the highest and
for single authored publications was lowest, which indicated that the collaborative research is
increasing in the field of medical physics. With regard to the multiple authored publications with
more than multi authors, the co-authorship has shown fluctuation trend. This implies that the
collaborative pattern in medical physics research is mainly characterized by co-authored papers
not by single authored papers.

4.5.2 Collaboration Coefficient (CC) The Collaboration Coefficient of authors by year-wise is shown in Table 4. The average value of collaboration coefficient for medical physics is 0.65. The highest value of collaboration coefficient is 0.67 in 2013 and lowest 0.62 in 2006 and 2009. However, the value of collaboration coefficient is showing increasing and decreasing trend in the two blocks year periods.
4.6 Authorship trend analysis
Table 6 Authorship trend analysis
Single Authors Multiple Authors Quantum
of Research
Output
Degree of
Collaboration Year Quantum
of Output
Percentage Quantum
of Output
Percentage
2000 12 0.11 221 1.98 233 0.95
2001 7 0.06 229 2.05 236 0.97
2002 9 0.08 273 2.44 282 0.97
2003 18 0.16 257 2.30 275 0.93
2004 26 0.23 323 2.89 349 0.93
2005 16 0.14 426 3.81 442 0.96
2006 34 0.30 481 4.30 515 0.93
2007 27 0.24 590 5.28 617 0.96
2008 42 0.38 786 7.03 828 0.95
2009 69 0.62 1160 10.37 1229 0.94
2010 43 0.38 1405 12.57 1448 0.97
2011 21 0.19 618 5.53 639 0.97
2012 84 0.75 2478 22.16 2562 0.97
2013 37 0.33 1489 13.32 1526 0.98
Total 445 3.97 10736 96.03 11181 0.96

Figure 6 Authorship trend analysis
Table 6 presents the single and multiple authors’ productivity pattern on yearly basis. A
careful examination of the table reveals that the productivity patterns on the medical physics are
much contributed by the multiple authors than the single author since 2000 to 2013. Thus, from
this analysis it can be interpreted that basically the medical physics research is much dominated by
multiple authors.
4.6.1 Degree of Collaboration
The Degree of collaboration of authors by year wise has been calculated for the years
2000 to 2013 is shown in table 5. The year wise Degree of collaboration falls between 0.93 and
0.98. The Degree of collaboration of publications of the medical physics is 0.96. This brings out
clearly the prevalence of team research in this field. Out of the total publications 96.03% of
contributions were collaborated with multi authorship and 3.97% of contributions were
collaboration with single authors.
4.7 Identification of Most Prolific Authors
Table 7 Identification of Most Prolific Authors
Rank Author Institutes No. of
publications
Percentage
1 Hendee, W R Medical college Wisconsin,
USA
57 0.51
2 Levin, C S Stanford university school of
medicine, USA
52 0.47
3 Yanagida, T University of Tokyo, Japan 51 0.46
4 Yamaya, T National institute of
radiological sciences, Japan
50 0.45
5 Yoshida, E National institute of advanced
industrial science and
technology, Japan
44 0.39
6 Fujimoto, Y Hiroshima University, Japan 39 0.35
7 Pia, M G Istituto Nazionale Di Fisica
Nucleare, Italy
38 0.34
8 Yoshikawa, A Kyushu University, Japan 36 0.32
9 Nishikido, F National institute of
radiological sciences, Japan
36 0.32
10 Piemonte, C Fondazione bruno kessler,
Italy
34 0.30
11 Tashima, H National institute of
radiological sciences, Japan
34 0.30
12 Llosa, G Instituto de Fisica
Corpuscular, Spain
32 0.29
13 Fiorini, C Université de versailles saint-
quentin, France
31 0.28
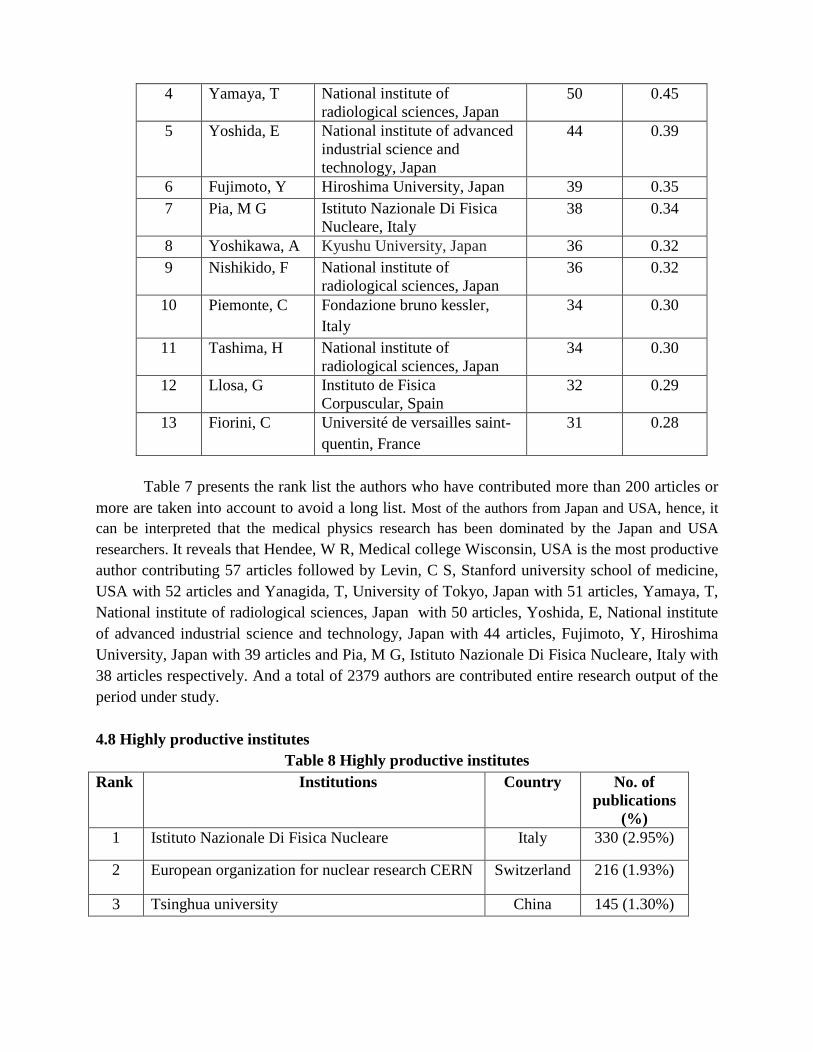
Table 7 presents the rank list the authors who have contributed more than 200 articles or
more are taken into account to avoid a long list. Most of the authors from Japan and USA, hence, it
can be interpreted that the medical physics research has been dominated by the Japan and USA
researchers. It reveals that Hendee, W R, Medical college Wisconsin, USA is the most productive
author contributing 57 articles followed by Levin, C S, Stanford university school of medicine,
USA with 52 articles and Yanagida, T, University of Tokyo, Japan with 51 articles, Yamaya, T,
National institute of radiological sciences, Japan with 50 articles, Yoshida, E, National institute
of advanced industrial science and technology, Japan with 44 articles, Fujimoto, Y, Hiroshima
University, Japan with 39 articles and Pia, M G, Istituto Nazionale Di Fisica Nucleare, Italy with
38 articles respectively. And a total of 2379 authors are contributed entire research output of the
period under study.
4.8 Highly productive institutes
Table 8 Highly productive institutes
Rank Institutions Country No. of
publications
(%)
1 Istituto Nazionale Di Fisica Nucleare Italy 330 (2.95%)
2 European organization for nuclear research CERN Switzerland 216 (1.93%)
3 Tsinghua university China 145 (1.30%)

4 National institute of radiological sciences Japan 122 (1.09%)
5 University Michigan USA 117 (1.05%)
6 University of Texas M D Anderson cancer center USA 109 (0.97%)
7 Tohoku university Japan 105 (0.94%)
8 Politecnico di Milano Italy 101 (0.90%)
Table 8 shows the institutes that have contributed 100 or more publications on medical
physics research during 2004-2013. Findings revealed that Istituto nazionale di fisica nucleare,
Frascati, Italy with 330 (2.95%) publications is the most productive institutions in the field of
medical physics research followed by European organization for nuclear research CERN,
Switzerland with 216 (1.93%) publications, Tsinghua university, China with 145 (1.30%)
publications, National institute of radiological sciences, Japan with 122 (1.09%) publications,
University of Michigan, USA with 117 (1.05%) publications, University of Texas M D Anderson
cancer center, USA with 109 (0.97%) publications, Tohoku university, Japan with 105 (0.94%)
publications and Politecnico di Milano, USA with 105 (0.90%) publications.
4.8 Highly productive countries
Table 9 Highly productive countries
Rank Country Total
publications
(%)
Rank Country Total
publications
(%)
1 USA 3626 (32.43%) 11 South Korea 265 (2.37%)
2 Germany 1181 (10.56%) 12 Australia 239 (2.14%)
3 Japan 1027 (9.19%) 13 Netherlands 225 (2.01%)
4 UK 865 (7.74%) 14 Russia 191 (1.71%)
5 Italy 835 (7.47%) 15 Brazil 169 (1.51%)
6 China 571 (5.11%) 16 Poland 169 (1.51%)
7 France 548 (4.90%) 17 India 161 (1.44%)
8 Switzerland 436 (3.90%) 18 Austria 152 (1.36%)
9 Canada 397 (3.55%) 19 Sweden 150 (1.34%)
10 Spain 327 (2.92%) 20 Taiwan 105 (0.94%)
In all, there were 108 countries involved in research in medical physics, which published at
least one publication. The USA topped the list with highest share (32.43%) of publications. Germany
ranked second with 10.56% share of publications followed by Japan with 9.19% share of
publications, UK with 7.74% share of publications, Italy with 7.47% share of publications, China
with 5.11% share of publications, France with 4.90% share of publications, Switzerland with 3.90%
Canada with 3.55% share of publications and the remaining countries are publishing less than 3% of
the research output in this study period. The publication share of highly productive countries (≥100
publications) on medical physics is given in table 9.

4.9 Language wise distributions
Publications on medical physics are spread over 24 languages. The maximum number of
publications have been published in English language with 10807 publications (96.66%),
followed by German with 97 publications (0.87%), Chinese ranks third position with 63
publications (0.56%), French with 47 publications (0.42%), Japanese with 43 publications
(0.38%) and Spanish with 41 publications (0.37%). And the remaining languages such as Polish,
Russian, Portuguese, Italian and other languages are constituted in negligible percentage. The
English language superiority was found in every year in total productivity on the subject during
the study period.
4.10 Most preferred source titles
The conference publications and scientific journals are most important medium of
communication in scientific field. To determine the most scientific journals and conference
publications in this field, preferred source are identified by the researchers for their publications.
Table 10 Source title of publications
Rank Source title Country No. of
publications
Impact
factor
1 IEEE Nuclear science symposium
Conference proceedings
USA 3755 -
2 IFMBE proceedings Germany 711 -
3 AIP conference proceedings USA 461 -
4 Physics in medicine and biology UK 424 2.761
5 Health physics USA 422 1.271
6 Medical physics USA 262 2.635
7 Radiological physics and technology Japan 178 -
8 Proceedings of SPIE the International
society for optical engineering
USA 151 0.20
9 Nuclear instruments and methods in
physics research section A accelerators
spectrometers detectors and associated
equipment
USA 138 1.216
10 Applied physics letters USA 138 3.515
The scientific literature on medical physics is spread over 1324 different source journals.
The rank list of top 10 source titles with impact factor is listed in the table 10. It reveals that
IEEE Nuclear science symposium conference proceedings, USA tops the list with the highest
number of publications 3755 (33.58%), followed by IFMBE proceedings, Germany with a share
of 1270 (6.36%) publications. AIP conference proceedings, USA occupy the third position with
461 (4.12%) publications. The fourth highest source title is Physics in medicine and biology, UK

with 424 (3.79%) publications and the impact factor is 2.761 and Health physics, USA with 422
(3.77%) and the impact factor is 1.271 and Medical physics, USA with 262 (2.34%) publications
and the impact factor is 2.635.
4.11 High productivity subject areas
Table 11 High productivity subject areas
Rank Subject No. of
articles
Percentage
1 Medicine 6532 58.42
2 Physics and astronomy 6392 57.17
3 Engineering 2042 18.26
4 Biochemistry, genetics
and molecular biology
915 8.18
5 Health professions 906 8.10
6 Chemical engineering 883 7.90
7 Computer science 560 5.01
8 Environmental Science 486 4.35
9 Materials science 370 3.31
10 Pharmacology, toxicology
and pharmaceutics
302 2.70
Figure 7 High productivity subjects
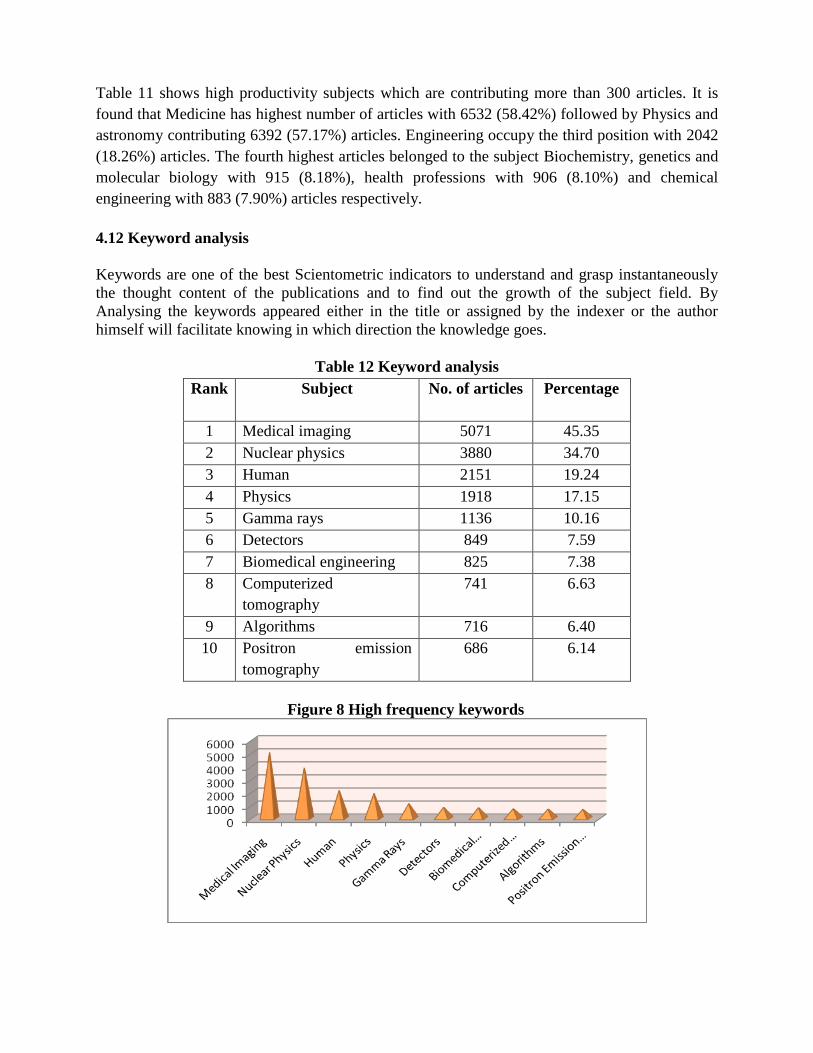
Table 11 shows high productivity subjects which are contributing more than 300 articles. It is
found that Medicine has highest number of articles with 6532 (58.42%) followed by Physics and
astronomy contributing 6392 (57.17%) articles. Engineering occupy the third position with 2042
(18.26%) articles. The fourth highest articles belonged to the subject Biochemistry, genetics and
molecular biology with 915 (8.18%), health professions with 906 (8.10%) and chemical
engineering with 883 (7.90%) articles respectively.
4.12 Keyword analysis
Keywords are one of the best Scientometric indicators to understand and grasp instantaneously
the thought content of the publications and to find out the growth of the subject field. By
Analysing the keywords appeared either in the title or assigned by the indexer or the author
himself will facilitate knowing in which direction the knowledge goes.
Table 12 Keyword analysis
Rank Subject No. of articles
Percentage
1 Medical imaging 5071 45.35
2 Nuclear physics 3880 34.70
3 Human 2151 19.24
4 Physics 1918 17.15
5 Gamma rays 1136 10.16
6 Detectors 849 7.59
7 Biomedical engineering 825 7.38
8 Computerized
tomography
741 6.63
9 Algorithms 716 6.40
10 Positron emission
tomography
686 6.14
Figure 8 High frequency keywords

The keywords appeared in the Index Keywords field in web of science database of medical
physics publications were analysed. Table 12 lists the high frequency keywords. The highly cited
keywords were: Medical imaging with 5071 (45.35%) publications, nuclear physics with 3880
(34.70%) publications, human with 2151 (19.24%) publications, physics with 1918 (17.15%)
publication and gamma rays with 1136 (10.16%) publications respectively.
.
5 Conclusions
Medical physics plays a very predominant role in healthcare specialties such as diagnostic and
intervention radiology, nuclear medicine, and radiation oncology. A lot of research is being
carried out all over the world in this field. A total of 11181 publications was
published in medical physics during 2000-2013. The single most prevalent form of publications
is the conference papers, in which 55.51% of the total literature is published. The highest number
of publications 2,562 (22.91%) were published in 2012. The average number of publications
published per year was 798.64. The year wise RGR is found to be in the range of 0.70 to 0.14.
The trend value has been increased from 341 in 2003 to 3086 in 2024. Out of 11181
publications, maximum of 5014 (44.84%) publications have been contributed by mega authors.
The value of the Co Authorship Index is increasing and decreasing trend in the two block year
periods. The highest value of Collaboration Coefficient is 0.67 in 2013 and the average value of
Collaboration Coefficient for medical physics is 0.65. The Degree of collaboration of
publications of the medical physics is 0.96. Hendee, W R, Medical college Wisconsin, USA is
the most productive author contributing 57 articles followed by Levin, C, S, Stanford university
school of medicine, USA with 52 articles. Most of the authors from USA, hence, it can be
interpreted that the medical physics research has been dominated by the USA researchers. USA
topped the list with highest share (32.43%) of publications. Germany ranked second with 10.56%
share of publications followed by Japan with 9.19% share of publications and UK with 7.74%
share of publications. Istituto nazionale DI fisica nucleare, Frascati, Italy with 330 (2.95%)
publications is the most productive institutions in the field of medical physics research followed
by the European organization for nuclear research CERN, Switzerland with 216 (1.93%)
publications. IEEE Nuclear science symposium, conference proceedings, USA tops the list with
the highest number of publications 3755 (33.58%), followed by IFMBE proceedings, Germany
with a share of 1270 (6.36%) publications. Medicine has the highest number of articles with
6532 (58.42%) followed by Physics and astronomy contributing 6392 (57.17%) articles. The
highly cited keywords were: Medical imaging with 5071 (45.35%) publications, nuclear physics
with 3880 (34.70%) publications, human with 2151 (19.24%) publications, physics with 1918
(17.15%) publications. The study revealed that the medical physics related publications seem to
be popular among the national and international research community.

References
1. Longair, Malcolm S. 1992 Particles, Photons, and Their Detection, Vol. 1 of High Energy
Astrophysics, 2nd ed., Cambridge, Cambridge University Press.
2. Gaisser. Thomas K., 1990, Cosmic Rays and Particle Physics, Cambridge, Cambridge
University Press.
3. Santha Kumar, R. & Kaliyaperumal, K. Scientometric Analysis of Global Publication
Output in Mobile Technology: A Scientometric Study, DESIDOC Journal of Library
and Information Technology, 2015, 35(4), 287-292
4. Garg, K.C. & Padhi, P. A study of collaboration in laser science and technology.
Scientometrics, 2001, 51(2), 415-27
5. Santha kumar R and Kaliyaperumal K. Mapping of Mobile Technology Publications: A
Scientometric Approach, DESIDOC Journal of Library and Information Technology,
2014, 34(4): 298-303
6. Santha kumar R and Kaliyaperumal K. A Scientometric Analysis of Mobile Technology
Publications, Scientometrics, 2015, 105 (2): 921-929
7. Ajiferuke, I.S.Y., et al. Collaborative coefficient: A single measure of the degrees of co-
authorship in research. Scientometrics, 1988, 15(5-6), 421-33.
8. Garg, K.C. & Padhi, P. Scientometrics of laser research literature as viewed through the
Journal of Current Laser Abstracts. Scientometrics, 1999, 45(2), 251-68.
9. www.wikipedia.com
Brief Biography
1. Dr. R. Santha kumar is presently working as Librarian in SKR
Engineering College, Chennai. He obtained Ph.D from M.S University, Tirunelveli,
M.Sc (Physics) from Alagappa University, Karaikudi, and MLIS, M.Phil and
PGDCA from Madurai Kamaraj University. He has published 14 articles in national
and international journals and presented 16 articles both in national and international
conferences.