Embed Size (px)
Citation preview
Hindawi Publishing CorporationISRN Civil EngineeringVolume 2013, Article ID 408961, 8 pageshttp://dx.doi.org/10.1155/2013/408961
Research ArticleLiquefaction-Induced Lateral Deformations ComputationalAssessment during Tohoku Earthquake
Davide Forcellini,1 Fabio Della Bartola,1 and Angelo Marcello Tarantino2
1 Dipartimento Economia e Tecnologia, Universita di San Marino, Via Salita alla Rocca 44, 47890 San Marino, San Marino2Dipartimento Ingegneria “Enzo Ferrari”, Universita di Modena e Reggio Emilia, Via Vignolese 905, 41125 Modena, Italy
Correspondence should be addressed to Davide Forcellini; [email protected]
Received 11 June 2013; Accepted 3 July 2013
Academic Editors: F. Hernandez-Olivares and B. Uy
Copyright © 2013 Davide Forcellini et al. This is an open access article distributed under the Creative Commons AttributionLicense, which permits unrestricted use, distribution, and reproduction in any medium, provided the original work is properlycited.
Liquefaction-induced lateral spreading during Tohoku earthquake resulted in significant damage, and disruption of functionalityfor structures and life. The paper aims at reproducing this on-site evidence presenting the state of the art about the most creditedqualitative approach and comparing these methods with numerical computation. In this regard, finite element (FE) simulations areincreasingly providing a versatile environment in order to assess economical and effective damage. In the study, several systematicthree-dimensional FE computations have been conducted to numerically evaluate the effects in terms of liquefaction-induced lateraldeformations. The analysis is performed in correspondence with Urayasu City, where the registered liquefaction consequences onresidential buildings were wide if compared with the ordinary seismic shake. This study can be used both for post-earthquakeevaluations and for pre-earthquake vulnerability predictions.
1. Introduction
The11th ofMarch 2011 (05:46:24.51UTC)TohokuEarthquakecan be considered the largest (𝑀
𝑤9.0-9.1) in the recent
history of Japan and one of the five largest earthquakes ofthe modern era (United States Geological Survey’s USGS).The earthquake excited a large tsunami that devastatedcoastal communities in Japan. The most sites affected byliquefaction-induced deformations are inside the namedKanto Plate, a very recent zone with alluvial formationson which many Japanese cities stand. The main effects ofliquefaction-induced ground failures were observed aroundthe northern and north-eastern shorelines of Tokyo Bay (e.g.,Shin Kiba, Urayasu, Inage, Kaihin Makuhari, Chiba, Isobe,and Mihama), communities along the river Tone (Choshi,Sawara, Itako, Katori, and Kamisu), and areas along the NakaRiver including Hitachinaka, Miko, and Oarai [1–6].
In particular, the main damages were observed in theKanto Plain region at many urban cities, which includes theTokyo Bay and Tone River areas. The liquefied soils were fillmaterials or young alluvium [5]. Lateral spreading consistedof the development of large horizontal ground displacements
due to earthquake-induced liquefaction. This phenomenonresulted in significant damage and considerable replacementcosts for existing buildings and civil engineering structures(quay walls, bridge piers, etc.) since it imposed notable lateralloads and may lead to widespread failures. Such adverseresponse was previously documented during several seismicevents, such as the earthquakes of Niigata, Japan (1964,[7–10]), Dagupan City, Philippines (1990, [11–14]), Chi-Chi,Kocaeli, Turkey (1999, [15]), and Taiwan (1999, [16]).
The paper compares ordinary qualitative approachesgenerally used in liquefaction vulnerability assessment witha three-dimensional, advanced, and nonlinear finite elementmodel results. The traditional methods simply consider theprobability of a soil to be subjected to liquefaction withoutany quantitative considerations, and thus they are effec-tive only in preliminary approaches. When more accuratepredictions are required, nonlinear theories for countingthe liquefaction behaviour must be adopted. In this paper,seismic effects during Tohoku earthquake are reproducedadopting a platform built up open-source computationalplatform OpenSees.

2 ISRN Civil Engineering
0.010.030.050.070.090.110.13
0.00 50.00 100.00 150.00 200.00 250.00Ac
cele
ratio
n (g
)Time (s)
−0.13−0.11−0.09−0.07−0.05−0.03−0.01
Figure 1: Recordings at Urayasu (CHB008)—EW components.
In the following sections, the state of the art about themost credited qualitative approaches, the employed com-putational formulation, and the calibration are described.The computational platform is then presented focusing onthe adopted materials, boundary conditions, and analysisassumptions. Results of the conducted analysis are finallypresented taking into account post-earthquake evaluationsand eventually pre-earthquake considerations.
2. Urayasu Site
This study considers Urayasu site as a representative ofTohoku earthquake scenarios because of several aspects. Firstof all, even if the peak ground acceleration (PGA) value isordinary, the registered liquefaction consequences (NIED [1],Towhata et al. [2], and Tokimatsu and Katsumata [6]) wereextremely wide in terms of lateral spreading and settlements.Since these damages concentrated on residential ordinarybuildings more than big cities, they were less affected bythe influence of big and heavy structures. Consequently, freefield conditions can be more representative than in urbanareas. Finally, geological and geotechnical on-line databasethat referred toUrayasu sitewere detailed andwell descripted.
Recordings and geotechnical data were deduced fromNational Research Institute for Earth Science and DisasterPrevention (NIED) [1] at Kyoshin Network K-Net. In partic-ular, Figure 1 shows Urayasu (CHB008) Station (35.6537∘N,139.9023∘E, and 379 km epicentre distance) recordings interms of the east-west (EW) component acceleration timehistories.
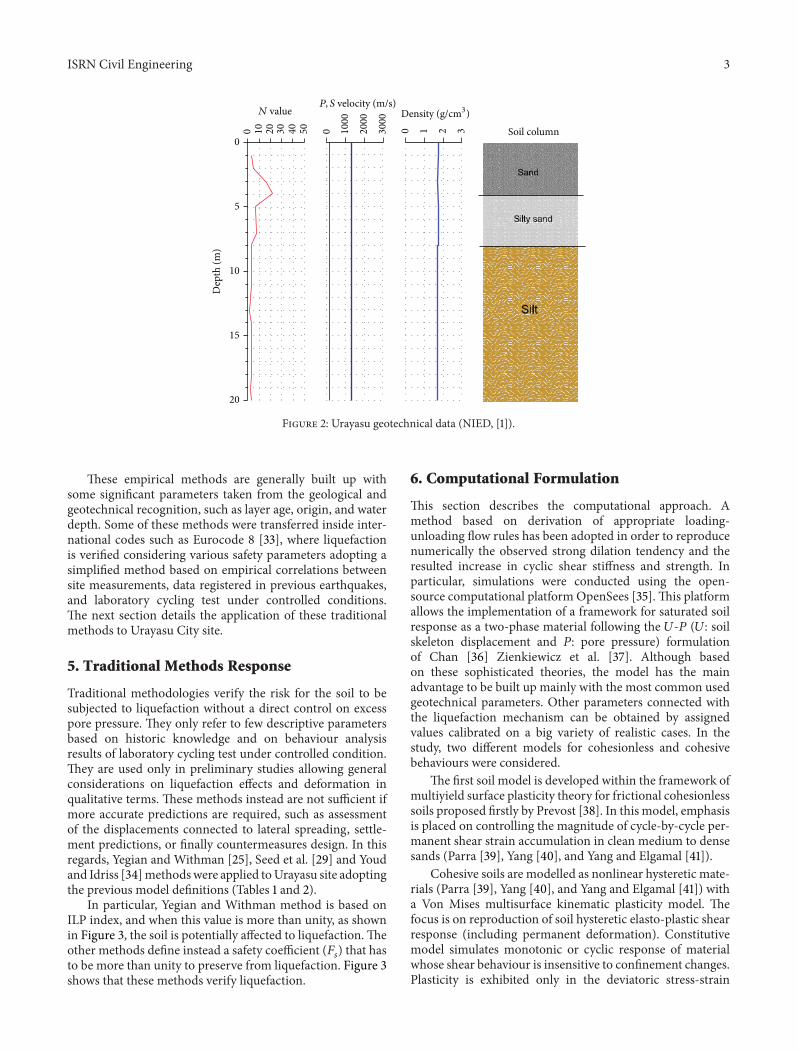
Geotechnical data taken as reference in this study suchas 𝑁SPT values, shear velocity, and density versus depthdiagrams and general characteristics layers are represented inFigure 2.Theother parameters (i.e., friction angle and relativedensity) were derived by a calibration analysis shown in thenext section.
3. Calibration Analysis
Urayasu stratification consists of two superficial sand andsand sandy layers (whose base is at about 6m depth)upon a silt Pleistocene deposit. From an online database, itwas possible to obtain the most representative geotechnicalparameters.
Table 1: Estimated characteristics for sand layers.
Unity Thickness (m) Density (ton/m3) Φ (∘) 𝑑50
Sand 3.0 1.8 23 0.40Sandy soil 3.0 1.8 33 1.50
Table 2: Estimated characteristics for silt pleistocene deposit.
Unity Density (ton/m3) C (kPa)Silt soil 1.5 37
Friction angles and relative densities were estimatedfrom NSPT and effective vertical tension values throughSchmertmann [17, 18] and Bazaraa [19] and Gibbs and Holtz[20] graphical and analytical correlations. The sand layerswere characterized by 𝑑
50= 0.4 and 𝑑
50= 1.50, taking into
consideration that for the traditional nomenclature a sandlayer contains more than 50% of sand material. Table 1 showsthe estimated parameters. The silt deposit was modelled asa cohesive stratum characterized by medium density andcohesion parameters (Table 2).
Finally, water level is a significant parameter to take intoaccount in liquefaction modelling, but it is also very difficultto determinate, because of its variable nature. In order todetermine the most conservative assessment, water level wasconsidered at the surface for all the models presented in thiswork.
Further detailed geotechnical definition will be needed toobtain more realistic quantitative response.
4. State of the Art
Traditional methods consist of defining liquefaction riskadopting very few (at least one) parameters that are ableto represent complex liquefaction phenomenon. Gener-ally, these methods follow two main directions: data fromobserved events and laboratory tests. Nowadays, a greatnumber of existing criteria can be adopted: Sherif andIshibashi [21], Youd and Perkins [22], and some others basedon cyclic resistance ratio (CRR), such as Seed and Idriss[23, 24], Yegian and Whitman [25], Tokimatsu and Yoshimi[26], Iwasaki et al. [27, 28], Seed et al. [29], and Andrus andStokoe [30]. More details are in [31, 32].
ISRN Civil Engineering 3
0 10 20 30 40 50
0
5
10
15
20
0 1000
2000
3000
0 1 2 3
P, S velocity (m/s)
Soil column
Dep
th (m
)
Density (g/cm3)N value
Figure 2: Urayasu geotechnical data (NIED, [1]).
These empirical methods are generally built up withsome significant parameters taken from the geological andgeotechnical recognition, such as layer age, origin, and waterdepth. Some of these methods were transferred inside inter-national codes such as Eurocode 8 [33], where liquefactionis verified considering various safety parameters adopting asimplified method based on empirical correlations betweensite measurements, data registered in previous earthquakes,and laboratory cycling test under controlled conditions.The next section details the application of these traditionalmethods to Urayasu City site.
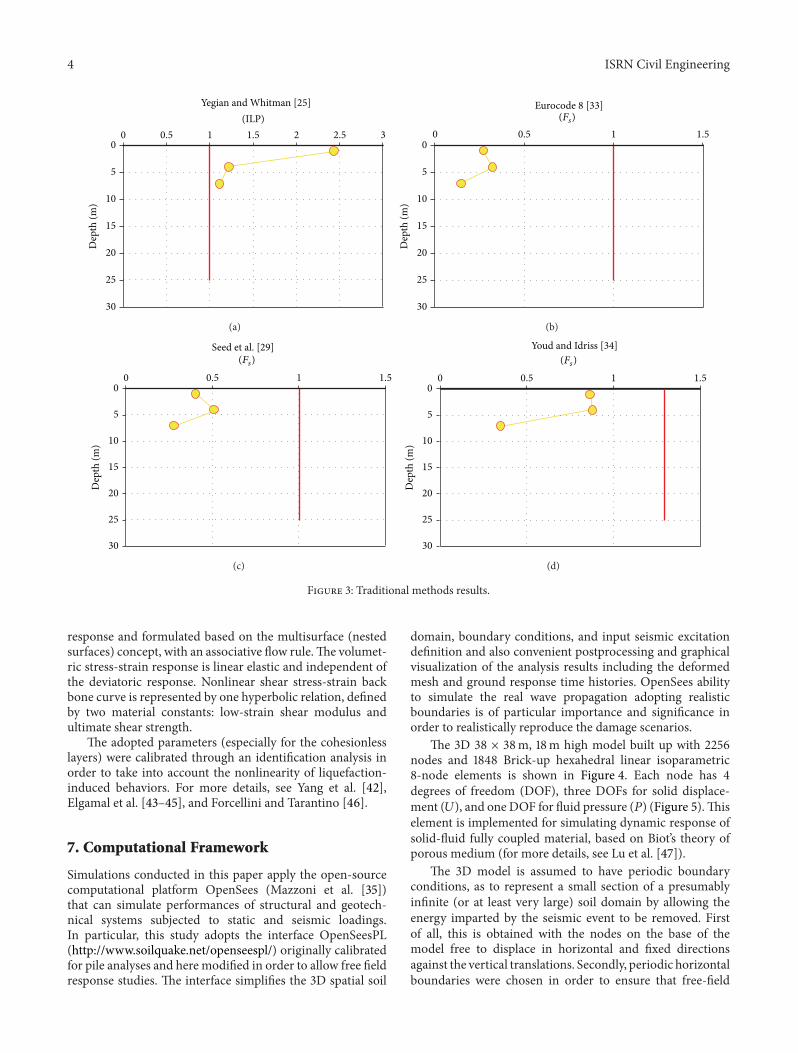
5. Traditional Methods Response
Traditional methodologies verify the risk for the soil to besubjected to liquefaction without a direct control on excesspore pressure. They only refer to few descriptive parametersbased on historic knowledge and on behaviour analysisresults of laboratory cycling test under controlled condition.They are used only in preliminary studies allowing generalconsiderations on liquefaction effects and deformation inqualitative terms. These methods instead are not sufficient ifmore accurate predictions are required, such as assessmentof the displacements connected to lateral spreading, settle-ment predictions, or finally countermeasures design. In thisregards, Yegian and Withman [25], Seed et al. [29] and Youdand Idriss [34]methodswere applied toUrayasu site adoptingthe previous model definitions (Tables 1 and 2).
In particular, Yegian and Withman method is based onILP index, and when this value is more than unity, as shownin Figure 3, the soil is potentially affected to liquefaction.Theother methods define instead a safety coefficient (𝐹
𝑠) that has
to be more than unity to preserve from liquefaction. Figure 3shows that these methods verify liquefaction.
6. Computational Formulation
This section describes the computational approach. Amethod based on derivation of appropriate loading-unloading flow rules has been adopted in order to reproducenumerically the observed strong dilation tendency and theresulted increase in cyclic shear stiffness and strength. Inparticular, simulations were conducted using the open-source computational platform OpenSees [35].This platformallows the implementation of a framework for saturated soilresponse as a two-phase material following the 𝑈-𝑃 (𝑈: soilskeleton displacement and 𝑃: pore pressure) formulationof Chan [36] Zienkiewicz et al. [37]. Although basedon these sophisticated theories, the model has the mainadvantage to be built up mainly with the most common usedgeotechnical parameters. Other parameters connected withthe liquefaction mechanism can be obtained by assignedvalues calibrated on a big variety of realistic cases. In thestudy, two different models for cohesionless and cohesivebehaviours were considered.
The first soil model is developed within the framework ofmultiyield surface plasticity theory for frictional cohesionlesssoils proposed firstly by Prevost [38]. In this model, emphasisis placed on controlling the magnitude of cycle-by-cycle per-manent shear strain accumulation in clean medium to densesands (Parra [39], Yang [40], and Yang and Elgamal [41]).
Cohesive soils are modelled as nonlinear hysteretic mate-rials (Parra [39], Yang [40], and Yang and Elgamal [41]) witha Von Mises multisurface kinematic plasticity model. Thefocus is on reproduction of soil hysteretic elasto-plastic shearresponse (including permanent deformation). Constitutivemodel simulates monotonic or cyclic response of materialwhose shear behaviour is insensitive to confinement changes.Plasticity is exhibited only in the deviatoric stress-strain
4 ISRN Civil Engineering
0 0.5 1 1.5 2 2.5 30
5
10
15
20
25
30
Dep
th (m
)
(ILP)Yegian and Whitman [25]
(a)
0 0.5 1 1.50
5
10
15
20
25
30
Dep
th (m
)
Eurocode 8 [33](Fs)
(b)
0 0.5 1 1.50
5
10
15
20
25
30
Dep
th (m
)
Seed et al. [29](Fs)
(c)
0 0.5 1 1.50
5
10
15
20
25
30
Dep
th (m
)
Youd and Idriss [34](Fs)
(d)
Figure 3: Traditional methods results.
response and formulated based on the multisurface (nestedsurfaces) concept, with an associative flow rule.The volumet-ric stress-strain response is linear elastic and independent ofthe deviatoric response. Nonlinear shear stress-strain backbone curve is represented by one hyperbolic relation, definedby two material constants: low-strain shear modulus andultimate shear strength.
The adopted parameters (especially for the cohesionlesslayers) were calibrated through an identification analysis inorder to take into account the nonlinearity of liquefaction-induced behaviors. For more details, see Yang et al. [42],Elgamal et al. [43–45], and Forcellini and Tarantino [46].
7. Computational Framework
Simulations conducted in this paper apply the open-sourcecomputational platform OpenSees (Mazzoni et al. [35])that can simulate performances of structural and geotech-nical systems subjected to static and seismic loadings.In particular, this study adopts the interface OpenSeesPL(http://www.soilquake.net/openseespl/) originally calibratedfor pile analyses and here modified in order to allow free fieldresponse studies. The interface simplifies the 3D spatial soil
domain, boundary conditions, and input seismic excitationdefinition and also convenient postprocessing and graphicalvisualization of the analysis results including the deformedmesh and ground response time histories. OpenSees abilityto simulate the real wave propagation adopting realisticboundaries is of particular importance and significance inorder to realistically reproduce the damage scenarios.
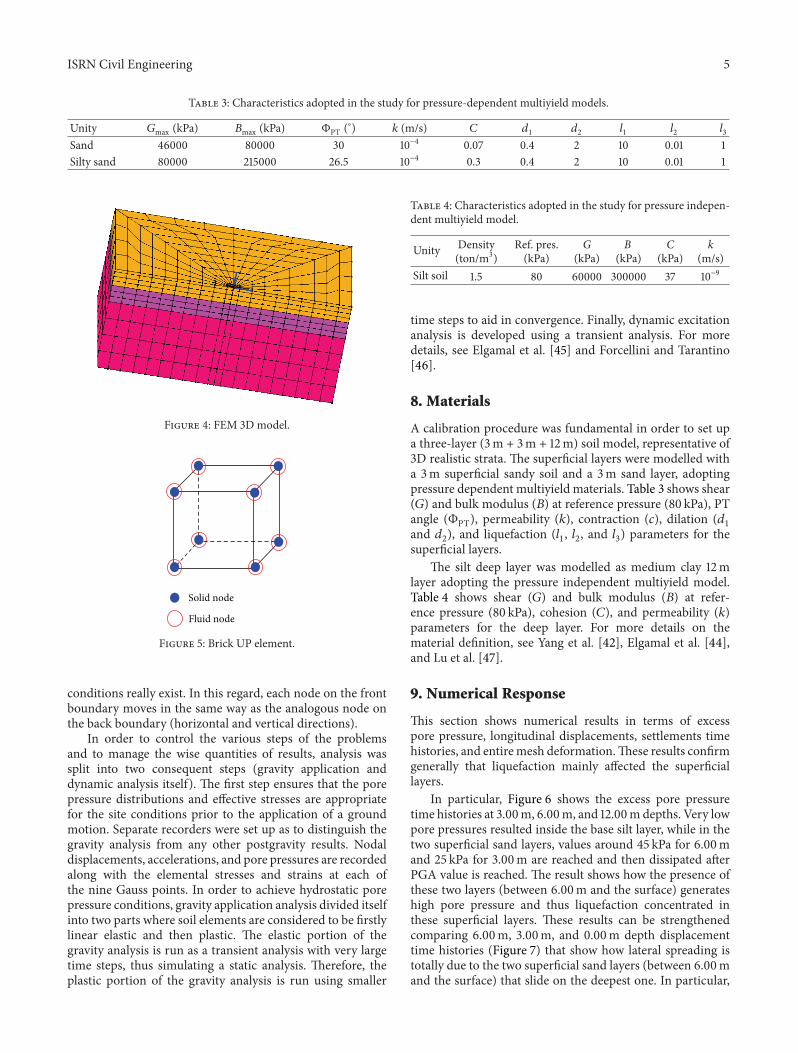
The 3D 38 × 38m, 18m high model built up with 2256nodes and 1848 Brick-up hexahedral linear isoparametric8-node elements is shown in Figure 4. Each node has 4degrees of freedom (DOF), three DOFs for solid displace-ment (𝑈), and one DOF for fluid pressure (𝑃) (Figure 5).Thiselement is implemented for simulating dynamic response ofsolid-fluid fully coupled material, based on Biot’s theory ofporous medium (for more details, see Lu et al. [47]).
The 3D model is assumed to have periodic boundaryconditions, as to represent a small section of a presumablyinfinite (or at least very large) soil domain by allowing theenergy imparted by the seismic event to be removed. Firstof all, this is obtained with the nodes on the base of themodel free to displace in horizontal and fixed directionsagainst the vertical translations. Secondly, periodic horizontalboundaries were chosen in order to ensure that free-field
ISRN Civil Engineering 5
Table 3: Characteristics adopted in the study for pressure-dependent multiyield models.
Unity 𝐺max (kPa) 𝐵max (kPa) ΦPT (∘) 𝑘 (m/s) 𝐶 𝑑1
𝑑2
𝑙1
𝑙2
𝑙3
Sand 46000 80000 30 10−4 0.07 0.4 2 10 0.01 1Silty sand 80000 215000 26.5 10−4 0.3 0.4 2 10 0.01 1
Figure 4: FEM 3D model.
Solid node
Fluid node
Figure 5: Brick UP element.
conditions really exist. In this regard, each node on the frontboundary moves in the same way as the analogous node onthe back boundary (horizontal and vertical directions).
In order to control the various steps of the problemsand to manage the wise quantities of results, analysis wassplit into two consequent steps (gravity application anddynamic analysis itself). The first step ensures that the porepressure distributions and effective stresses are appropriatefor the site conditions prior to the application of a groundmotion. Separate recorders were set up as to distinguish thegravity analysis from any other postgravity results. Nodaldisplacements, accelerations, and pore pressures are recordedalong with the elemental stresses and strains at each ofthe nine Gauss points. In order to achieve hydrostatic porepressure conditions, gravity application analysis divided itselfinto two parts where soil elements are considered to be firstlylinear elastic and then plastic. The elastic portion of thegravity analysis is run as a transient analysis with very largetime steps, thus simulating a static analysis. Therefore, theplastic portion of the gravity analysis is run using smaller
Table 4: Characteristics adopted in the study for pressure indepen-dent multiyield model.
Unity Density(ton/m3)
Ref. pres.(kPa)
G(kPa)
B(kPa)
C(kPa)
k(m/s)
Silt soil 1.5 80 60000 300000 37 10−9
time steps to aid in convergence. Finally, dynamic excitationanalysis is developed using a transient analysis. For moredetails, see Elgamal et al. [45] and Forcellini and Tarantino[46].
8. Materials
A calibration procedure was fundamental in order to set upa three-layer (3m + 3m + 12m) soil model, representative of3D realistic strata. The superficial layers were modelled witha 3m superficial sandy soil and a 3m sand layer, adoptingpressure dependent multiyield materials. Table 3 shows shear(𝐺) and bulk modulus (𝐵) at reference pressure (80 kPa), PTangle (ΦPT), permeability (𝑘), contraction (𝑐), dilation (𝑑
1
and 𝑑2), and liquefaction (𝑙
1, 𝑙2, and 𝑙
3) parameters for the
superficial layers.The silt deep layer was modelled as medium clay 12m
layer adopting the pressure independent multiyield model.Table 4 shows shear (𝐺) and bulk modulus (𝐵) at refer-ence pressure (80 kPa), cohesion (𝐶), and permeability (𝑘)parameters for the deep layer. For more details on thematerial definition, see Yang et al. [42], Elgamal et al. [44],and Lu et al. [47].
9. Numerical Response
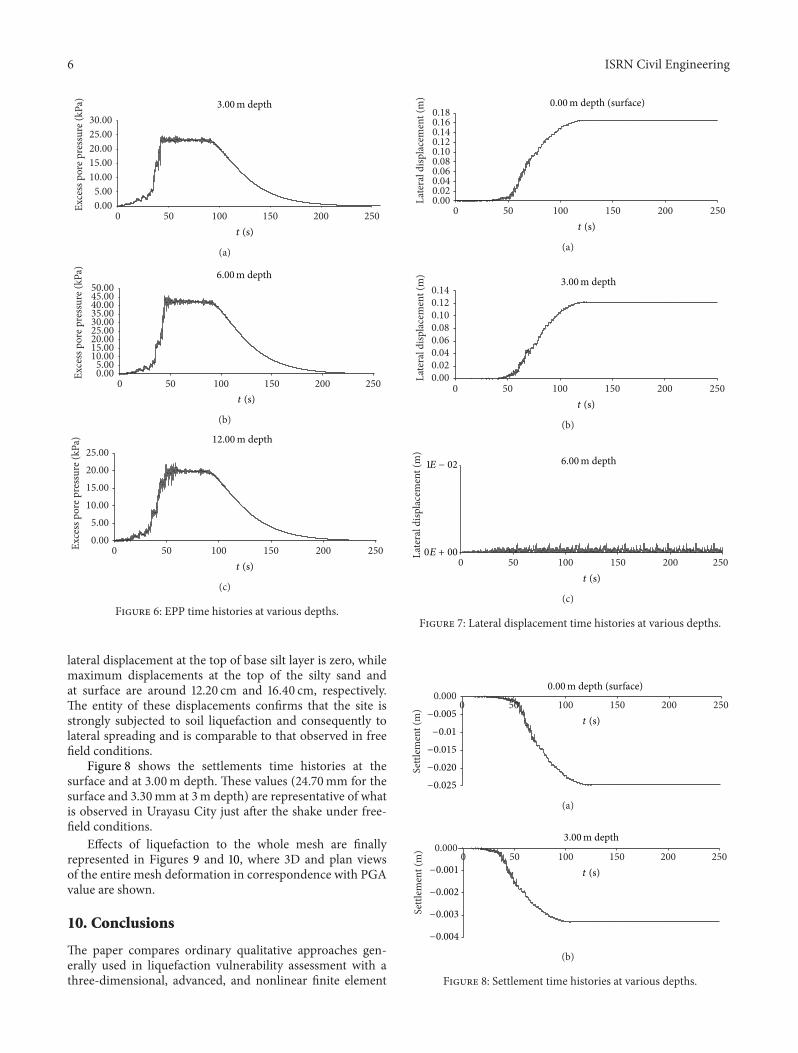
This section shows numerical results in terms of excesspore pressure, longitudinal displacements, settlements timehistories, and entiremesh deformation.These results confirmgenerally that liquefaction mainly affected the superficiallayers.
In particular, Figure 6 shows the excess pore pressuretime histories at 3.00m, 6.00m, and 12.00m depths. Very lowpore pressures resulted inside the base silt layer, while in thetwo superficial sand layers, values around 45 kPa for 6.00mand 25 kPa for 3.00m are reached and then dissipated afterPGA value is reached. The result shows how the presence ofthese two layers (between 6.00m and the surface) generateshigh pore pressure and thus liquefaction concentrated inthese superficial layers. These results can be strengthenedcomparing 6.00m, 3.00m, and 0.00m depth displacementtime histories (Figure 7) that show how lateral spreading istotally due to the two superficial sand layers (between 6.00mand the surface) that slide on the deepest one. In particular,
6 ISRN Civil Engineering
3.00m depth
0.005.00
10.0015.0020.0025.0030.00
0 50 100 150 200 250
Exce
ss p
ore p
ress
ure (
kPa)
t (s)
(a)
6.00m depth
0.005.00
10.0015.0020.0025.0030.0035.0040.0045.0050.00
0 50 100 150 200 250
Exce
ss p
ore p
ress
ure (
kPa)
t (s)
(b)
0.005.00
10.0015.0020.0025.00
0 50 100 150 200 250Exce
ss p
ore p
ress
ure (
kPa)
t (s)
12.00m depth
(c)
Figure 6: EPP time histories at various depths.
lateral displacement at the top of base silt layer is zero, whilemaximum displacements at the top of the silty sand andat surface are around 12.20 cm and 16.40 cm, respectively.The entity of these displacements confirms that the site isstrongly subjected to soil liquefaction and consequently tolateral spreading and is comparable to that observed in freefield conditions.
Figure 8 shows the settlements time histories at thesurface and at 3.00m depth. These values (24.70mm for thesurface and 3.30mm at 3m depth) are representative of whatis observed in Urayasu City just after the shake under free-field conditions.
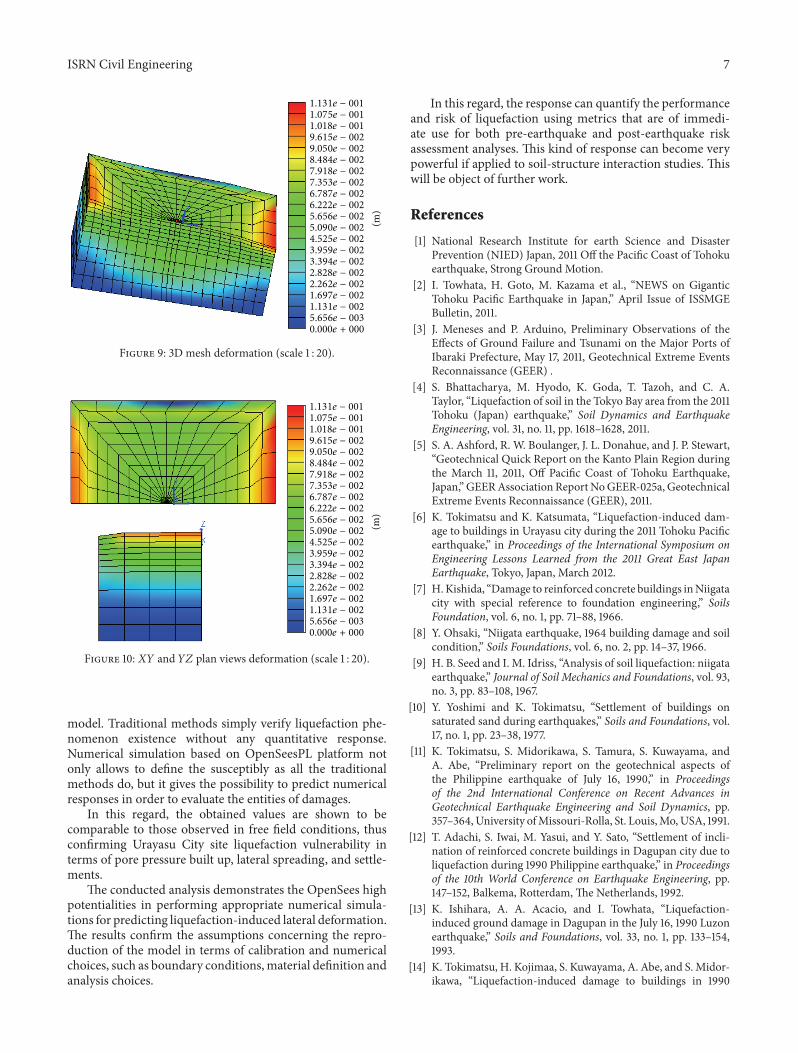
Effects of liquefaction to the whole mesh are finallyrepresented in Figures 9 and 10, where 3D and plan viewsof the entire mesh deformation in correspondence with PGAvalue are shown.
10. Conclusions
The paper compares ordinary qualitative approaches gen-erally used in liquefaction vulnerability assessment with athree-dimensional, advanced, and nonlinear finite element
0.000.020.040.060.080.100.120.140.160.18
0 50 100 150 200 250
Late
ral d
ispla
cem
ent (
m)
t (s)
0.00m depth (surface)
(a)
0.000.020.040.060.080.100.120.14
0 50 100 150 200 250
Late
ral d
ispla
cem
ent (
m)
t (s)
3.00m depth
(b)
0 50 100 150 200 250
Late
ral d
ispla
cem
ent (
m)
t (s)
1E − 02
0E + 00
6.00m depth
(c)
Figure 7: Lateral displacement time histories at various depths.
0.0000 50 100 150 200 250
Settl
emen
t (m
)
t (s)−0.005−0.01−0.015−0.020−0.025
0.00m depth (surface)
(a)
0 50 100 150 200 250
Settl
emen
t (m
)
t (s)−0.001
−0.002
−0.003
−0.004
0.0003.00m depth
(b)
Figure 8: Settlement time histories at various depths.
ISRN Civil Engineering 7
1.131e − 0011.075e − 0011.018e − 0019.615e − 0029.050e − 0028.484e − 0027.918e − 0027.353e − 0026.787e − 0026.222e − 0025.656e − 0025.090e − 0024.525e − 0023.959e − 0023.394e − 0022.828e − 0022.262e − 0021.697e − 0021.131e − 0025.656e − 0030.000e + 000
(m)
Figure 9: 3D mesh deformation (scale 1 : 20).
1.131e − 0011.075e − 0011.018e − 0019.615e − 0029.050e − 0028.484e − 0027.918e − 0027.353e − 0026.787e − 0026.222e − 0025.656e − 0025.090e − 0024.525e − 0023.959e − 0023.394e − 0022.828e − 0022.262e − 0021.697e − 0021.131e − 0025.656e − 0030.000e + 000
(m)
Figure 10:𝑋𝑌 and 𝑌𝑍 plan views deformation (scale 1 : 20).
model. Traditional methods simply verify liquefaction phe-nomenon existence without any quantitative response.Numerical simulation based on OpenSeesPL platform notonly allows to define the susceptibly as all the traditionalmethods do, but it gives the possibility to predict numericalresponses in order to evaluate the entities of damages.
In this regard, the obtained values are shown to becomparable to those observed in free field conditions, thusconfirming Urayasu City site liquefaction vulnerability interms of pore pressure built up, lateral spreading, and settle-ments.
The conducted analysis demonstrates the OpenSees highpotentialities in performing appropriate numerical simula-tions for predicting liquefaction-induced lateral deformation.The results confirm the assumptions concerning the repro-duction of the model in terms of calibration and numericalchoices, such as boundary conditions,material definition andanalysis choices.
In this regard, the response can quantify the performanceand risk of liquefaction using metrics that are of immedi-ate use for both pre-earthquake and post-earthquake riskassessment analyses. This kind of response can become verypowerful if applied to soil-structure interaction studies. Thiswill be object of further work.
References
[1] National Research Institute for earth Science and DisasterPrevention (NIED) Japan, 2011 Off the Pacific Coast of Tohokuearthquake, Strong Ground Motion.
[2] I. Towhata, H. Goto, M. Kazama et al., “NEWS on GiganticTohoku Pacific Earthquake in Japan,” April Issue of ISSMGEBulletin, 2011.
[3] J. Meneses and P. Arduino, Preliminary Observations of theEffects of Ground Failure and Tsunami on the Major Ports ofIbaraki Prefecture, May 17, 2011, Geotechnical Extreme EventsReconnaissance (GEER) .
[4] S. Bhattacharya, M. Hyodo, K. Goda, T. Tazoh, and C. A.Taylor, “Liquefaction of soil in the Tokyo Bay area from the 2011Tohoku (Japan) earthquake,” Soil Dynamics and EarthquakeEngineering, vol. 31, no. 11, pp. 1618–1628, 2011.
[5] S. A. Ashford, R. W. Boulanger, J. L. Donahue, and J. P. Stewart,“Geotechnical Quick Report on the Kanto Plain Region duringthe March 11, 2011, Off Pacific Coast of Tohoku Earthquake,Japan,” GEERAssociation Report NoGEER-025a, GeotechnicalExtreme Events Reconnaissance (GEER), 2011.
[6] K. Tokimatsu and K. Katsumata, “Liquefaction-induced dam-age to buildings in Urayasu city during the 2011 Tohoku Pacificearthquake,” in Proceedings of the International Symposium onEngineering Lessons Learned from the 2011 Great East JapanEarthquake, Tokyo, Japan, March 2012.
[7] H.Kishida, “Damage to reinforced concrete buildings inNiigatacity with special reference to foundation engineering,” SoilsFoundation, vol. 6, no. 1, pp. 71–88, 1966.
[8] Y. Ohsaki, “Niigata earthquake, 1964 building damage and soilcondition,” Soils Foundations, vol. 6, no. 2, pp. 14–37, 1966.
[9] H. B. Seed and I. M. Idriss, “Analysis of soil liquefaction: niigataearthquake,” Journal of Soil Mechanics and Foundations, vol. 93,no. 3, pp. 83–108, 1967.
[10] Y. Yoshimi and K. Tokimatsu, “Settlement of buildings onsaturated sand during earthquakes,” Soils and Foundations, vol.17, no. 1, pp. 23–38, 1977.
[11] K. Tokimatsu, S. Midorikawa, S. Tamura, S. Kuwayama, andA. Abe, “Preliminary report on the geotechnical aspects ofthe Philippine earthquake of July 16, 1990,” in Proceedingsof the 2nd International Conference on Recent Advances inGeotechnical Earthquake Engineering and Soil Dynamics, pp.357–364, University ofMissouri-Rolla, St. Louis,Mo,USA, 1991.
[12] T. Adachi, S. Iwai, M. Yasui, and Y. Sato, “Settlement of incli-nation of reinforced concrete buildings in Dagupan city due toliquefaction during 1990 Philippine earthquake,” in Proceedingsof the 10th World Conference on Earthquake Engineering, pp.147–152, Balkema, Rotterdam, The Netherlands, 1992.
[13] K. Ishihara, A. A. Acacio, and I. Towhata, “Liquefaction-induced ground damage in Dagupan in the July 16, 1990 Luzonearthquake,” Soils and Foundations, vol. 33, no. 1, pp. 133–154,1993.
[14] K. Tokimatsu, H. Kojimaa, S. Kuwayama, A. Abe, and S. Midor-ikawa, “Liquefaction-induced damage to buildings in 1990
8 ISRN Civil Engineering
Luzon Earthquake,” Journal of Geotechnical Engineering, vol.120, no. 2, pp. 290–307, 1994.
[15] Earthquake Engineering Research Institute (EERI), “Kocaeli.Turkey, earthquake of august 17, 1999 reconnaissance report,”Earthquake Spectra, 2000.
[16] Earthquake Engineering Research Institute (EERI), “Chi-chi,Taiwan, earthquake of September 21, 1999, reconnaissancereport,” Earthquake Spectra, 2001.
[17] J. H. Schmertmann, “Measurement of In-Situ strength,” inProceedings of the Conference on In-Situ Measurement of SoilProperties, pp. 55–138, American Society of Civil Engineers,1975.
[18] J. H. Schmertmann, J. P. Hartmann, and P. R. Brown, “Improvedstrain influence factor diagrams,” Journal of the GeotechnicalEngineering Division, ASCE, vol. 104, no. 8, pp. 1131–1135, 1978.
[19] A. R. S. S. Bazaraa, Use of the standard penetration test for esti-mating settlements of shallow foundations on sand [Ph.D. thesis],University of Illinois, Champaign-Urbana, Ill, USA, 1967.
[20] H. J. Gibbs and W. G. Holtz, “Research on determining thedensity of sands by spoon penetration testing,” in Proceedingsof the 4th International Conference on Soil Mechanics, vol. 1, pp.35–39, London, UK, 1957.
[21] M. A. Sherif, I. Ishibashi, and C. Tsuchiya, “Pore pressure pre-diction during Earthquake Loadings,” Soils and Foundations,vol. 18, no. 4, pp. 19–30, 1978.
[22] T. L. Youd and D. M. Perkins, “Mapping liquefaction-inducedground failure potential,” Journal of the Geotechnical Engineer-ing Division, ASCE, vol. 104, no. 4, pp. 433–446, 1978.
[23] H. B. Seed and I. M. Idriss, “Simplified procedure for evaluatingsoil liquefaction potential,” Journal of the Geotechnical Engineer-ing Division, ASCE, vol. 97, no. 9, pp. 1249–1273, 1971.
[24] H. B. Seed and I. M. Idriss, Ground Motions and Soil Lique-faction During Earthquakes, Earthquake Engineering ResearchInstitute Monograph, Oakland, Calif, USA, 1982.
[25] M. K. Yegian and R. V. Withman, “Risk analysis for groundfailure by liquefaction,” Journal of the Geotechnical EngineeringDivision, ASCE, vol. 104, no. GT7, pp. 921–938, 1978.
[26] K. Tokimatsu and Y. Yoshimi, “Empirical correlation of soilliquefaction based on SPT N-value and fines content,” Soils andFoundations, vol. 23, no. 4, pp. 56–74, 1983.
[27] T. Iwasaki, T. Arakawa, andK.-I. Tokida, “Simplified proceduresfor assessing soil liquefaction during earthquakes,” Interna-tional Journal of Soil Dynamics and Earthquake Engineering, vol.3, no. 1, pp. 49–58, 1984.
[28] T. Iwasaki, F. Tatsuoka, K. Tokida, and S. Yasuda, “A practicalmethod for assessing soil liquefaction potential based on casestudies at various sites in Japan,” in Proceedings of the 2nd Inter-national Conference on Microzonation for Safer Construction—Research and Application, pp. 885–896, San Francisco, Calif,USA, December 1978.
[29] H. B. Seed, K. Tokimatsu, L. F. Harder, and R. M. Chung, “Theinfluence of SPT procedures in soil liquefaction resistance eval-uations,” Journal of Geotechnical Engineering, vol. 111, no. 12, pp.1425–1445, 1985.
[30] R. D. Andrus and K. H. Stokoe II, “Liquefaction resistancebased on shear wave velocity,” in Proceedings of the NCEERWorkshop on Evaluation of Liquefaction Resistance of Soils,National Conference for Earthquake Engineering Research, pp.89–128, State University of New York at Buffalo, 1997.
[31] T. Crespellani, R. Nardi, and C. Simoncini, La liquefazione delterreno in condizioni sismiche, Zanichelli, 1988.
[32] S. G. Monaco, Liquefazione dei terreni in condizioni sismiche,EPC libri, 2008.
[33] Eurocode 8 (UNI EN, 1998-5:2005), part 5, appendix B.[34] T. L. Youd and I. M. Idriss, “Liquefaction resistance of soils:
summary report from the 1996 NCEER and 1998 NCEER/NSFworkshops on evaluation of liquefaction resistance of soils,”Journal of Geotechnical and Geoenvironmental Engineering, vol.127, no. 4, pp. 297–313, 2001.
[35] S. Mazzoni, F. McKenna, M. H. Scott, and G. L. Fenves,“Open System for Earthquake Engineering Simulation, UserCommand-LanguageManual,” Pacific Earthquake EngineeringResearch Center, University of California, Berkeley, OpenSeesversion 2.0, 2009, http://opensees.berkeley.edu.
[36] A. H. C. Chan, A unified finite element solution to static anddynamic problems in geomechanics [Ph.D. thesis], UniversityCollege of Swansea, Swansea, UK, 1988.
[37] O. C. Zienkiewicz, A. H. C. Chan, M. Pastor, D. K. Paul, andT. Shiomi, “Static and dynamic behaviour of soils: a rationalapproach to quantitative solutions. I. Fully saturated problems,”Proceedings of Royal Society of London A, vol. 429, no. 1877, pp.285–309, 1990.
[38] J. H. Prevost, “A simple plasticity theory for frictional cohe-sionless soils,” International Journal of Soil Dynamics andEarthquake Engineering, vol. 4, no. 1, pp. 9–17, 1985.
[39] E. Parra, Numerical modelling of liquefaction and lateral grounddeformation including cyclic mobility and dilation response insoil systems [Ph.D. thesis], Department of Civil Engineering,Renseealear Polytechnic Institute Troy, Troy, NY, USA, 1996.
[40] Z. Yang, Numerical modeling of earthquake site response includ-ing dilation and liquefaction [Ph.D. thesis], ColumbiaUniversity,New York, NY, USA, 2000.
[41] Z. Yang and A. Elgamal, “Influence of permeability on lique-faction-induced shear deformation,” Journal of EngineeringMechanics, vol. 128, no. 7, pp. 720–729, 2002.
[42] Z. Yang, A. Elgamal, and E. Parra, “Computational model forcyclic mobility and associated shear deformation,” Journal ofGeotechnical and Geoenvironmental Engineering, vol. 129, no. 12,pp. 1119–1127, 2003.
[43] A. Elgamal, E. Parra, Z. Yang, and K. Adalier, “Numerical anal-ysis of embankment foundation liquefaction countermeasures,”Journal of Earthquake Engineering, vol. 6, no. 4, pp. 447–471,2002.
[44] A. Elgamal, Z. Yang, E. Parra, and A. Ragheb, “Modeling ofcyclic mobility in saturated cohesionless soils,” InternationalJournal of Plasticity, vol. 19, no. 6, pp. 883–905, 2003.
[45] A. Elgamal, J. Lu, and D. Forcellini, “Mitigation of liquefaction-induced lateral deformation in a sloping stratum: three-dimensional numerical simulation,” Journal of Geotechnical andGeoenvironmental Engineering, vol. 135, no. 11, pp. 1672–1682,2009.
[46] D. Forcellini and A. M. Tarantino, “Countermeasures assess-ment of liquefaction-induced lateral deformation in a slopeground system,” Journal of Engineering, vol. 2013, Article ID183068, 9 pages, 2013.
[47] J. Lu, A. Elgamal, and Z. Yang, OpenSeesPL: 3D Lateral Pile-Ground Interaction, User Manual, Beta 1.0, 2011.

Submit your manuscripts athttp://www.hindawi.com
VLSI Design
Hindawi Publishing Corporationhttp://www.hindawi.com Volume 2014
International Journal of
RotatingMachinery
Hindawi Publishing Corporationhttp://www.hindawi.com Volume 2014
Hindawi Publishing Corporation http://www.hindawi.com
Journal ofEngineeringVolume 2014
Hindawi Publishing Corporationhttp://www.hindawi.com Volume 2014
Shock and Vibration
Hindawi Publishing Corporationhttp://www.hindawi.com Volume 2014
Mechanical Engineering
Advances in
Hindawi Publishing Corporationhttp://www.hindawi.com Volume 2014
Civil EngineeringAdvances in
Acoustics and VibrationAdvances in
Hindawi Publishing Corporationhttp://www.hindawi.com Volume 2014
Hindawi Publishing Corporationhttp://www.hindawi.com Volume 2014
Electrical and Computer Engineering
Journal of
Hindawi Publishing Corporationhttp://www.hindawi.com Volume 2014
Distributed Sensor Networks
International Journal of
The Scientific World JournalHindawi Publishing Corporation http://www.hindawi.com Volume 2014
SensorsJournal of
Hindawi Publishing Corporationhttp://www.hindawi.com Volume 2014
Modelling & Simulation in EngineeringHindawi Publishing Corporation http://www.hindawi.com Volume 2014
Hindawi Publishing Corporationhttp://www.hindawi.com Volume 2014
Active and Passive Electronic Components
Hindawi Publishing Corporationhttp://www.hindawi.com Volume 2014
Chemical EngineeringInternational Journal of
Control Scienceand Engineering
Journal of
Hindawi Publishing Corporationhttp://www.hindawi.com Volume 2014
Antennas andPropagation
International Journal of
Hindawi Publishing Corporationhttp://www.hindawi.com Volume 2014
Hindawi Publishing Corporationhttp://www.hindawi.com Volume 2014
Navigation and Observation
International Journal of
Advances inOptoElectronics
Hindawi Publishing Corporation http://www.hindawi.com
Volume 2014
RoboticsJournal of
Hindawi Publishing Corporationhttp://www.hindawi.com Volume 2014