Embed Size (px)
Citation preview
RESEARCH ARTICLE
Thermal Transport Characteristics of HumanSkin Measured In Vivo Using UltrathinConformal Arrays of Thermal Sensors andActuatorsR. ChadWebb1‡, Rafal M. Pielak2‡, Philippe Bastien3, Joshua Ayers1, Juha Niittynen4,Jonas Kurniawan1, Megan Manco5, Athena Lin1, Nam Heon Cho1, Viktor Malyrchuk1,Guive Balooch2,6*, John A. Rogers1*
1 Frederick Seitz Materials Research Laboratory, Department of Materials Science and Engineering,University of Illinois at Urbana-Champaign, Urbana, Illinois, United States of America, 2 L’Oréal CaliforniaResearch Center, San Francisco, California, United States of America, 3 L’Oréal Research and Innovation,Aulnay sous Bois, France, 4 Tampere University of Technology, Department of Electronics andCommunication Engineering, Korkeakoulunkatu 3, Tampere, Finland, 5 L’Oréal Early Clinical, Clark, NewJersey, United States of America, 6 L’Oréal Digital Incubator, Clark, New Jersey, United States of America
‡ These authors contributed equally to this work.* [email protected] (GB); [email protected] (JR)
AbstractMeasurements of the thermal transport properties of the skin can reveal changes in physical
and chemical states of relevance to dermatological health, skin structure and activity, ther-
moregulation and other aspects of human physiology. Existing methods for in vivo evalua-
tions demand complex systems for laser heating and infrared thermography, or they require
rigid, invasive probes; neither can apply to arbitrary regions of the body, offers modes for
rapid spatial mapping, or enables continuous monitoring outside of laboratory settings.
Here we describe human clinical studies using mechanically soft arrays of thermal actuators
and sensors that laminate onto the skin to provide rapid, quantitative in vivo determination
of both the thermal conductivity and thermal diffusivity, in a completely non-invasive man-
ner. Comprehensive analysis of measurements on six different body locations of each of
twenty-five human subjects reveal systematic variations and directional anisotropies in the
characteristics, with correlations to the thicknesses of the epidermis (EP) and stratum cor-
neum (SC) determined by optical coherence tomography, and to the water content as-
sessed by electrical impedance based measurements. Multivariate statistical analysis
establishes four distinct locations across the body that exhibit different physical properties:
heel, cheek, palm, and wrist/volar forearm/dorsal forearm. The data also demonstrate that
thermal transport correlates negatively with SC and EP thickness and positively with water
content, with a strength of correlation that varies from region to region, e.g., stronger in the
palmar than in the follicular regions.
PLOS ONE | DOI:10.1371/journal.pone.0118131 February 6, 2015 1 / 17
OPEN ACCESS
Citation:Webb RC, Pielak RM, Bastien P, Ayers J,Niittynen J, Kurniawan J, et al. (2015) ThermalTransport Characteristics of Human Skin MeasuredIn Vivo Using Ultrathin Conformal Arrays of ThermalSensors and Actuators. PLoS ONE 10(2): e0118131.doi:10.1371/journal.pone.0118131
Academic Editor: Victor M Ugaz, Texas A&MUniversity, UNITED STATES
Received: October 7, 2014
Accepted: January 5, 2015
Published: February 6, 2015
Copyright: © 2015 Webb et al. This is an openaccess article distributed under the terms of theCreative Commons Attribution License, which permitsunrestricted use, distribution, and reproduction in anymedium, provided the original author and source arecredited.
Data Availability Statement: All relevant data arewithin the paper and its Supporting Information files.
Funding: RCW acknowledges support from theNational Science Foundation under grant no. DGE-1144245 (http://www.nsf.gov/). JN acknowledgessupport from Tekes grant no: 40150/12 (http://www.tekes.fi/). The above funding sources had no role instudy design, data collection and analysis, decision topublish, or preparation of the manuscript. Materials,instrumentation and human study costs weresupported by L’Oréal Research & Innovation. RMPPB MM and GB are employed by L’Oréal and

IntroductionSkin is the largest organ of human body and it provides one of the most diverse sets of func-tions. The outermost layer, the stratum corneum (SC), serves as a protective barrier and thefirst defense against physical, chemical and biological damage. The skin also receives and pro-cesses multiple sensory stimuli, such as touch, pain and temperature and aids in the control ofbody temperature and the flow of fluids in/out of the body [1]. These processes are highly regu-lated by nervous and circulatory systems, but also depend directly and indirectly on thermalcharacteristics. The thermal transport properties of this tissue system can reflect physical/chemical states of the skin, with potentially predictive value in contexts ranging from dermatol-ogy to cosmetology. Measurement systems for ex vivo analysis [2,3] have some utility in estab-lishing a general understanding of the properties, but they are irrelevant to investigations of theskin as an integral part of a complex, living organism. Existing in vivo approaches couple theuse of laser heating or induced changes in the temperature of the ambient with infrared ther-mography [4–6], or they exploit rigid probes that press against the skin [7,8]. These and otherpreviously reported methods only apply to certain regions of the skin; they do not readily allowthermal mapping measurement or determination of anisotropic properties and they operate ef-fectively only in controlled, laboratory settings. As a result, little information exists that quanti-tatively characterizes the relationships between the in vivo thermal transport properties of skinand clinically relevant parameters such as hydration, vascularization and structure. Here, weintroduce strategies that exploit ultrathin, soft systems [9–18] of thermal actuators and sensorsfor robust, precise transport measurements, in a non-invasive manner that can rapidly captureboth orientation and position dependent characteristics. Assessments of the skin at six differentbody locations in twenty-five human subjects illuminate systematic variations in both the ther-mal conductivity and thermal diffusivity, for which measurements by optical coherence tomog-raphy (OCT), and electrical impedance yield additional insights into theunderlying physiology.
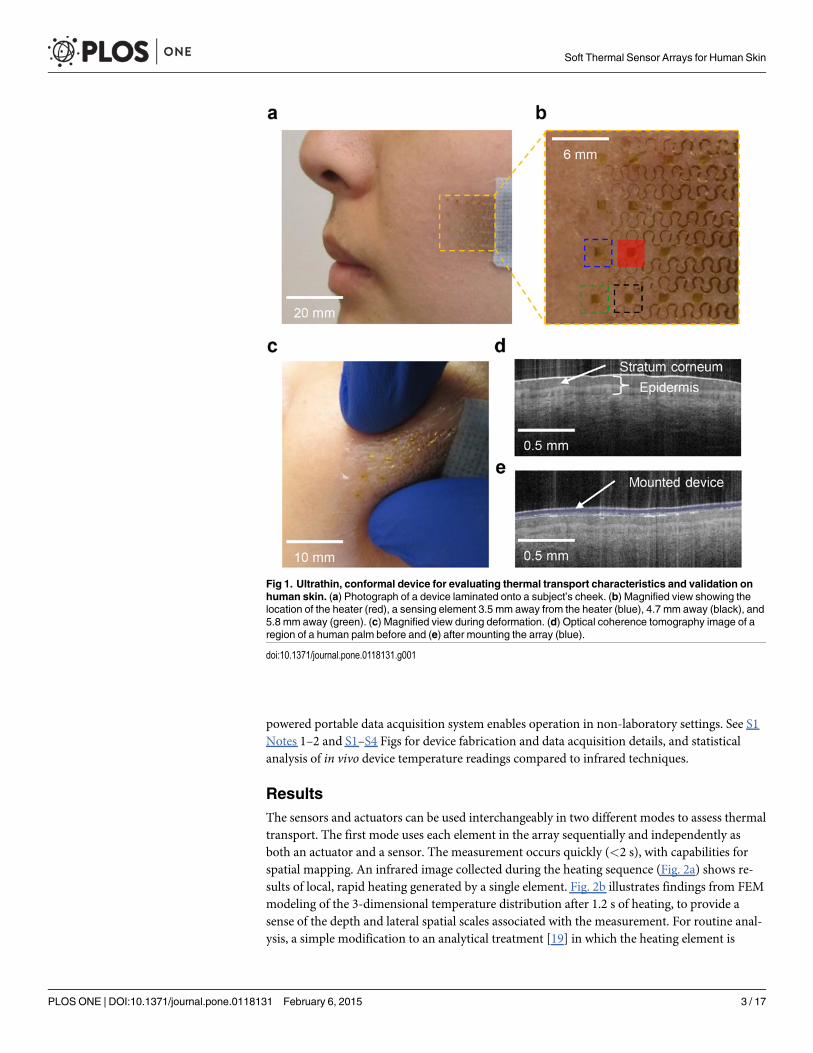
Our recent report [10] introduced a type of thermal sensor with thickness, modulus andthermal mass matched to the epidermis, for spatiotemporal mapping of temperature on thesurface of the skin with precision equal to or better than that of state-of-the-art infrared ther-mography systems. In the present work, advanced versions of this technology enable mappingof not only temperature but also thermal transport properties, including thermal conductivityand thermal diffusivity (and, therefore, the heat capacity per unit volume via the ratio of thesetwo quantities) and their in-plane directional anisotropies. A representative device, shown inFig. 1a and b mounted on the cheek, consists of a 4×4 array of interconnected filamentarymetal structures (Cr/Au; 6/75 nm thick, 10 μmwide) that simultaneously function as thermalsensors and actuators, where the temperature coefficient of resistance of the metal coupleschanges in temperature to changes in resistance. A thin (<3 μm) film of polyimide encapsu-lates these structures and their electrical interconnects (Ti/Cu/Ti/Au; 10/500/10/25 nm thick,50 μmwide) both above and below. A low modulus (35 kPa), thin coating (as small as 5 μm) ofa silicone elastomer (Ecoflex 00–30, Smooth-on, USA) provides a conformal, intimate thermalinterface directly to the SC. This soft mode of contact, together with the stretchable construc-tion of the overall system, allows for repeated cycles of application, operation and removalwithout adverse effect on the device or the skin. The maximum heating powers used in experi-ments reported here introduce readily measurable changes in the temperature at the surface ofthe skin, but at levels that lie below the human sensory threshold. Optical coherence tomo-graphic (OCT; VivoSight, Michelson Diagnostics, UK) images (Fig. 1c and d) of a region of theskin before and after mounting the device (highlighted in blue) highlight the high level of con-formal contact afforded by soft, compliant construction. A wired electrical interface to a USB-
Soft Thermal Sensor Arrays for Human Skin
PLOS ONE | DOI:10.1371/journal.pone.0118131 February 6, 2015 2 / 17
contributed to study design, data analysis and writingof the paper.
Competing Interests: The authors RMP, PB, MMand GB are employed by L’Oreal, who also providesa portion of the funding for this work. This does notalter the authors’ adherence to PLOS ONE policieson sharing data and materials.
powered portable data acquisition system enables operation in non-laboratory settings. See S1Notes 1–2 and S1–S4 Figs for device fabrication and data acquisition details, and statisticalanalysis of in vivo device temperature readings compared to infrared techniques.
ResultsThe sensors and actuators can be used interchangeably in two different modes to assess thermaltransport. The first mode uses each element in the array sequentially and independently asboth an actuator and a sensor. The measurement occurs quickly (<2 s), with capabilities forspatial mapping. An infrared image collected during the heating sequence (Fig. 2a) shows re-sults of local, rapid heating generated by a single element. Fig. 2b illustrates findings from FEMmodeling of the 3-dimensional temperature distribution after 1.2 s of heating, to provide asense of the depth and lateral spatial scales associated with the measurement. For routine anal-ysis, a simple modification to an analytical treatment [19] in which the heating element is
Fig 1. Ultrathin, conformal device for evaluating thermal transport characteristics and validation onhuman skin. (a) Photograph of a device laminated onto a subject’s cheek. (b) Magnified view showing thelocation of the heater (red), a sensing element 3.5 mm away from the heater (blue), 4.7 mm away (black), and5.8 mm away (green). (c) Magnified view during deformation. (d) Optical coherence tomography image of aregion of a human palm before and (e) after mounting the array (blue).
doi:10.1371/journal.pone.0118131.g001
Soft Thermal Sensor Arrays for Human Skin
PLOS ONE | DOI:10.1371/journal.pone.0118131 February 6, 2015 3 / 17
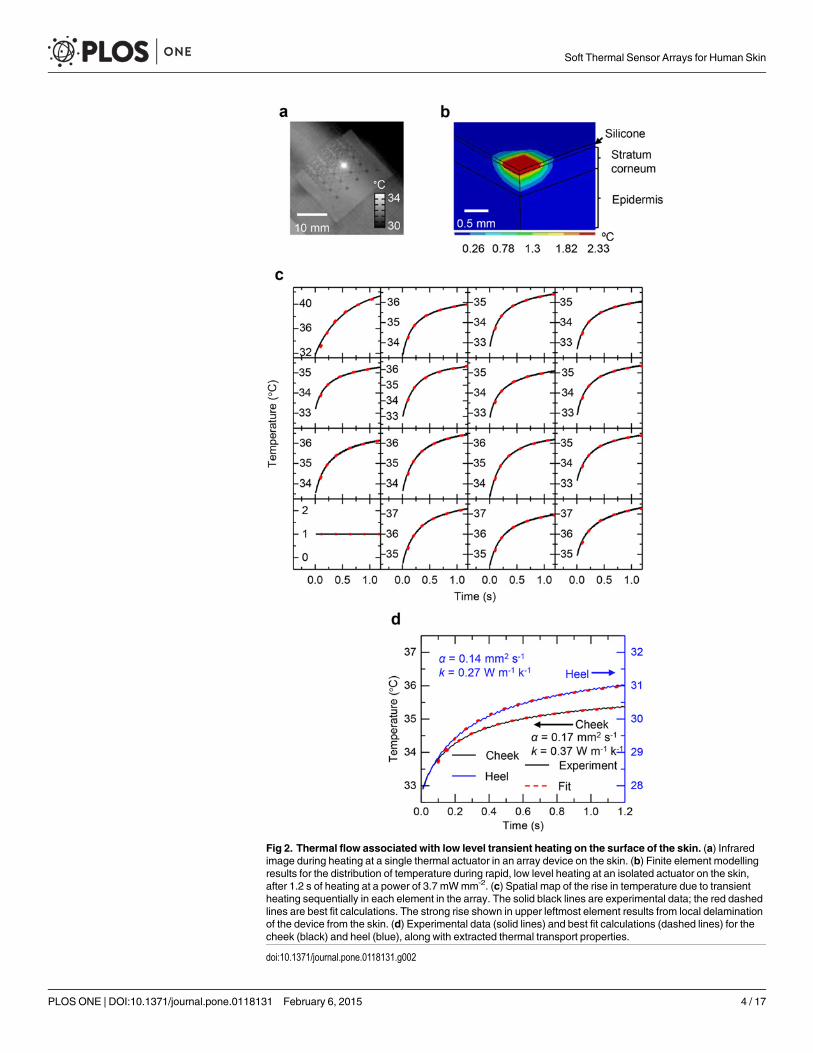
Fig 2. Thermal flow associated with low level transient heating on the surface of the skin. (a) Infraredimage during heating at a single thermal actuator in an array device on the skin. (b) Finite element modellingresults for the distribution of temperature during rapid, low level heating at an isolated actuator on the skin,after 1.2 s of heating at a power of 3.7 mWmm-2. (c) Spatial map of the rise in temperature due to transientheating sequentially in each element in the array. The solid black lines are experimental data; the red dashedlines are best fit calculations. The strong rise shown in upper leftmost element results from local delaminationof the device from the skin. (d) Experimental data (solid lines) and best fit calculations (dashed lines) for thecheek (black) and heel (blue), along with extracted thermal transport properties.
doi:10.1371/journal.pone.0118131.g002
Soft Thermal Sensor Arrays for Human Skin
PLOS ONE | DOI:10.1371/journal.pone.0118131 February 6, 2015 4 / 17
considered as a point heat source in a semi-infinite plane can be valuable. Here,
T ¼ T1 þ A1
Q2pA2kskin
erfcA2
ffiffiffiffiffiffiffiffiffiffiffiffiffiffiffiffiffirskincp;skinp ffiffiffiffiffiffiffiffiffiffiffiffi4kskint
p !
ð1Þ
where T is the temperature at an effective distance, A2, from the heater, T1 is the temperaturebefore heating, Q is the heating power, kskin is the thermal conductivity of the skin, ρskincp,skin isthe volumetric heat capacity of skin, t is time, and erfc is the complementary error function. A1
is a parameter that accounts for details associated with the multilayered geometry of the device;its value is calibrated through measurements of materials with known thermal properties simi-lar to those of the skin (water, ethylene glycol and polydimethylsiloxane). A2 accounts for thefact that the thermal actuator (serpentine wire distributed over an area of 1x1 mm2) when usedas a sensor records a temperature that corresponds to a weighted average over the area of theelement. This average temperature, in the model of equation (1), is equivalent to the value ata distance A2 away from an effective point source of heat. As a result, A2 lies between 0 and0.5 mm, depending on the geometric details and materials properties. In practice, A2 is selectedto yield quantitatively accurate results with materials of known thermal properties similar tothose of skin. Analysis of in vivo data involves an iterative fitting procedure (Matlab, Math-works, USA) to determine kskin and the thermal diffusivity (αskin = ρcp,skin / kskin) using equa-tion (1). Analyses of the sensitivity of the fitting process in the presence of experimental noiseindicate maximum uncertainties of 2% and 8% for kskin and αskin, respectively (S1 Notes 3 andS5 Fig). A similar analysis for errors in sensor calibration indicate maximum uncertainties of5% and 15%. Measurements described subsequently demonstrate in vivo repeatability of betterthan 6% and 9% for kskin and αskin respectively. Comparison of thermal properties determinedusing equation (1) to those determined using solutions that explicitly integrate numericallyover the sensor area indicate discrepancies that lie below the level of these experimental errors(S1 Notes 4).
Examples of representative data (black lines) and calculations based on equation (1) (reddashed lines) for each element across the array appear in Fig. 2c (an example of a malfunction-ing sensor that can be quickly identified by the lack of signal, and removed from analysis, isseen in the bottom-most, left-most graph). Fig. 2d presents similar results along with extractedvalues of kskin and αskin for the cheek and the heel pad. The differences between these two casesare significant, and likely result, at least in part, from the variations in the thicknesses of theSC, as described subsequently. The effective depth associated with the measurement can be ap-proximated as [20]
Dp ¼ffiffiffiffiffiffiffiffiffiffiatmax
p ð2Þ
where tmax is the characteristic measurement time. This equation gives a probing depth of~0.5 mm which agrees well with experimental analysis of measurement depth (S1 Notes 5, S6Fig) as well as the depth of heating shown by the FEM results in Fig. 2b. The depth dependentproperties of the skin over this length scale influence the measurements.
This measurement mode enabled comprehensive, systematic studies of thermal transportcharacteristics, in vivo, on twenty-five human subjects at six different body locations: cheek,dorsal forearm (d-forearm), volar forearm (v-forearm), volar wrist, palm and heel pad. Resultsfor kskin and ρskincp,skin follow from analysis using equation (1); αskin, which corresponds totheir ratio, is useful to consider also, because it determines whether kskin and ρskincp,skin vary in-dependently across body locations. Correlations between skin thermal properties to SC hydra-tion measured using a corneometer (Cutometer MPA 580, Courage + Khazaka ElectronicsGmbH), EP thickness and SC thickness measured using OCT provide further insights into the
Soft Thermal Sensor Arrays for Human Skin
PLOS ONE | DOI:10.1371/journal.pone.0118131 February 6, 2015 5 / 17
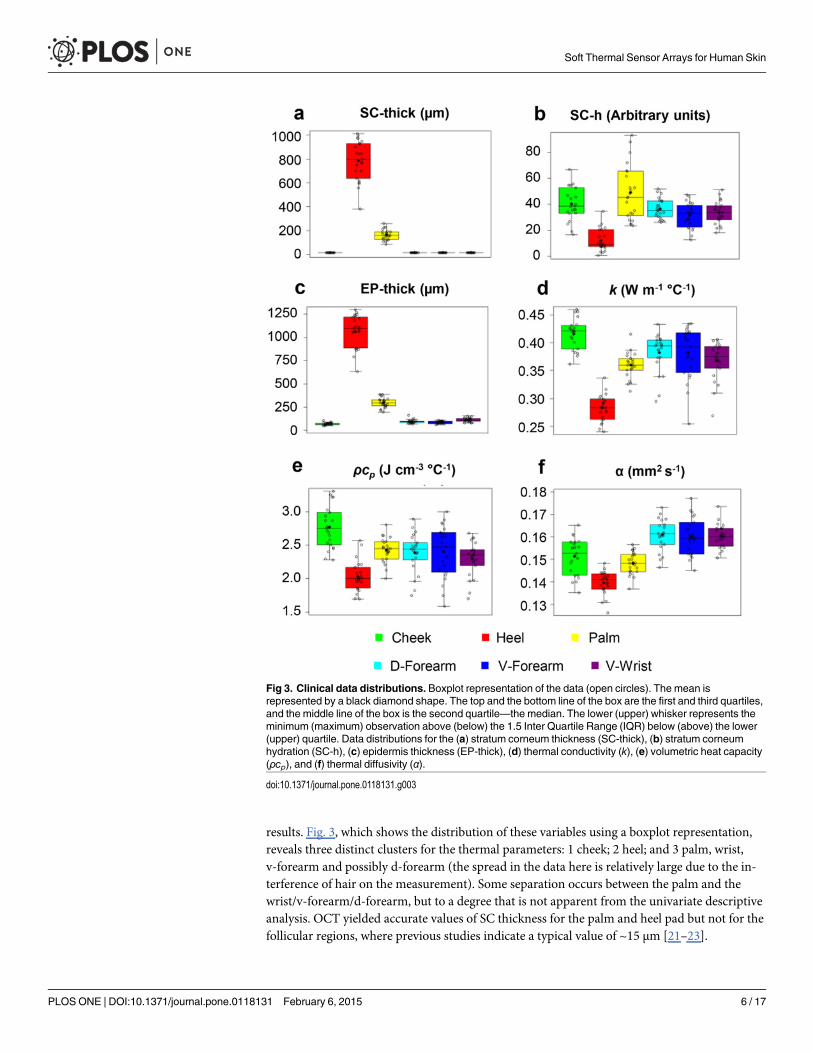
results. Fig. 3, which shows the distribution of these variables using a boxplot representation,reveals three distinct clusters for the thermal parameters: 1 cheek; 2 heel; and 3 palm, wrist,v-forearm and possibly d-forearm (the spread in the data here is relatively large due to the in-terference of hair on the measurement). Some separation occurs between the palm and thewrist/v-forearm/d-forearm, but to a degree that is not apparent from the univariate descriptiveanalysis. OCT yielded accurate values of SC thickness for the palm and heel pad but not for thefollicular regions, where previous studies indicate a typical value of ~15 μm [21–23].
Fig 3. Clinical data distributions. Boxplot representation of the data (open circles). The mean isrepresented by a black diamond shape. The top and the bottom line of the box are the first and third quartiles,and the middle line of the box is the second quartile—the median. The lower (upper) whisker represents theminimum (maximum) observation above (below) the 1.5 Inter Quartile Range (IQR) below (above) the lower(upper) quartile. Data distributions for the (a) stratum corneum thickness (SC-thick), (b) stratum corneumhydration (SC-h), (c) epidermis thickness (EP-thick), (d) thermal conductivity (k), (e) volumetric heat capacity(ρcp), and (f) thermal diffusivity (α).
doi:10.1371/journal.pone.0118131.g003
Soft Thermal Sensor Arrays for Human Skin
PLOS ONE | DOI:10.1371/journal.pone.0118131 February 6, 2015 6 / 17
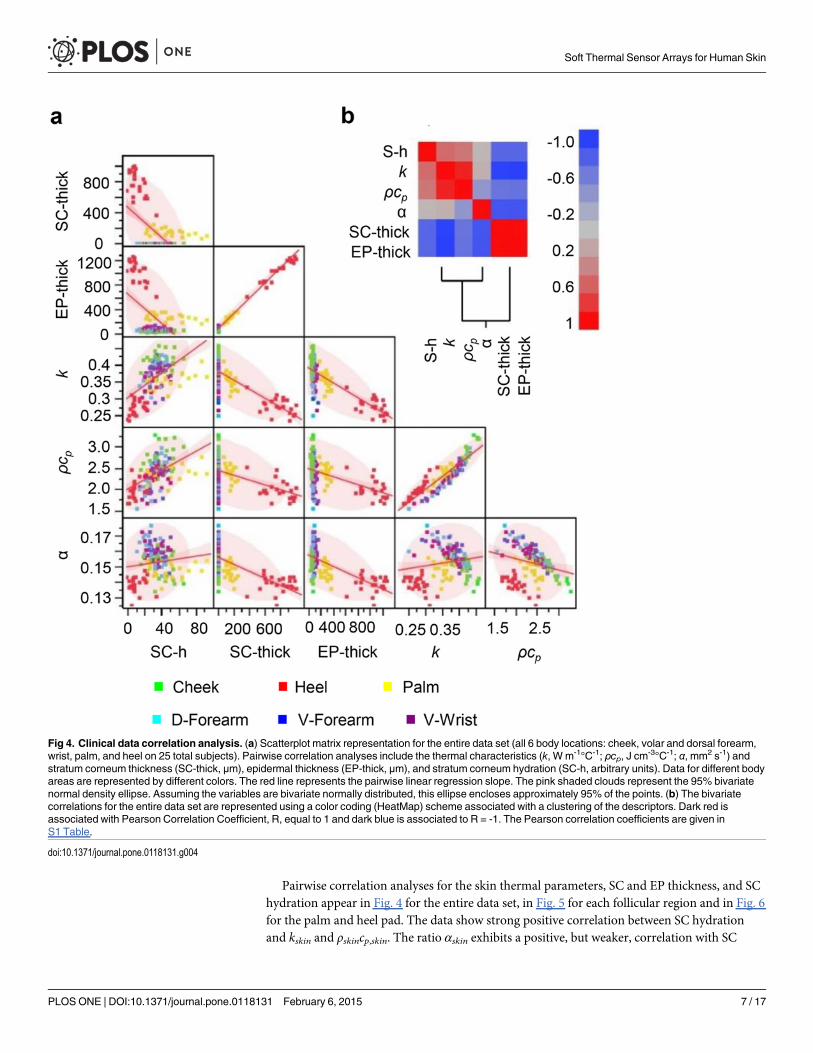
Pairwise correlation analyses for the skin thermal parameters, SC and EP thickness, and SChydration appear in Fig. 4 for the entire data set, in Fig. 5 for each follicular region and in Fig. 6for the palm and heel pad. The data show strong positive correlation between SC hydrationand kskin and ρskincp,skin. The ratio αskin exhibits a positive, but weaker, correlation with SC
Fig 4. Clinical data correlation analysis. (a) Scatterplot matrix representation for the entire data set (all 6 body locations: cheek, volar and dorsal forearm,wrist, palm, and heel on 25 total subjects). Pairwise correlation analyses include the thermal characteristics (k, W m-1°C-1; ρcp, J cm
-3°C-1; α, mm2 s-1) andstratum corneum thickness (SC-thick, μm), epidermal thickness (EP-thick, μm), and stratum corneum hydration (SC-h, arbitrary units). Data for different bodyareas are represented by different colors. The red line represents the pairwise linear regression slope. The pink shaded clouds represent the 95% bivariatenormal density ellipse. Assuming the variables are bivariate normally distributed, this ellipse encloses approximately 95% of the points. (b) The bivariatecorrelations for the entire data set are represented using a color coding (HeatMap) scheme associated with a clustering of the descriptors. Dark red isassociated with Pearson Correlation Coefficient, R, equal to 1 and dark blue is associated to R = -1. The Pearson correlation coefficients are given inS1 Table.
doi:10.1371/journal.pone.0118131.g004
Soft Thermal Sensor Arrays for Human Skin
PLOS ONE | DOI:10.1371/journal.pone.0118131 February 6, 2015 7 / 17
hydration. The data also indicate a strong negative correlation between SC/EP thickness and allthree thermal properties (kskin, ρskincp,skin and αskin). The EP thickness correlates with the SCthickness. SC is a significant fraction of the EP, especially in palmar regions, i.e. palm and heelpad. The SC thickness and SC hydration of the palmar regions show negative correlation. Thestrength of correlation depends strongly on body location (Figs. 5 and 6, and S1 Table).
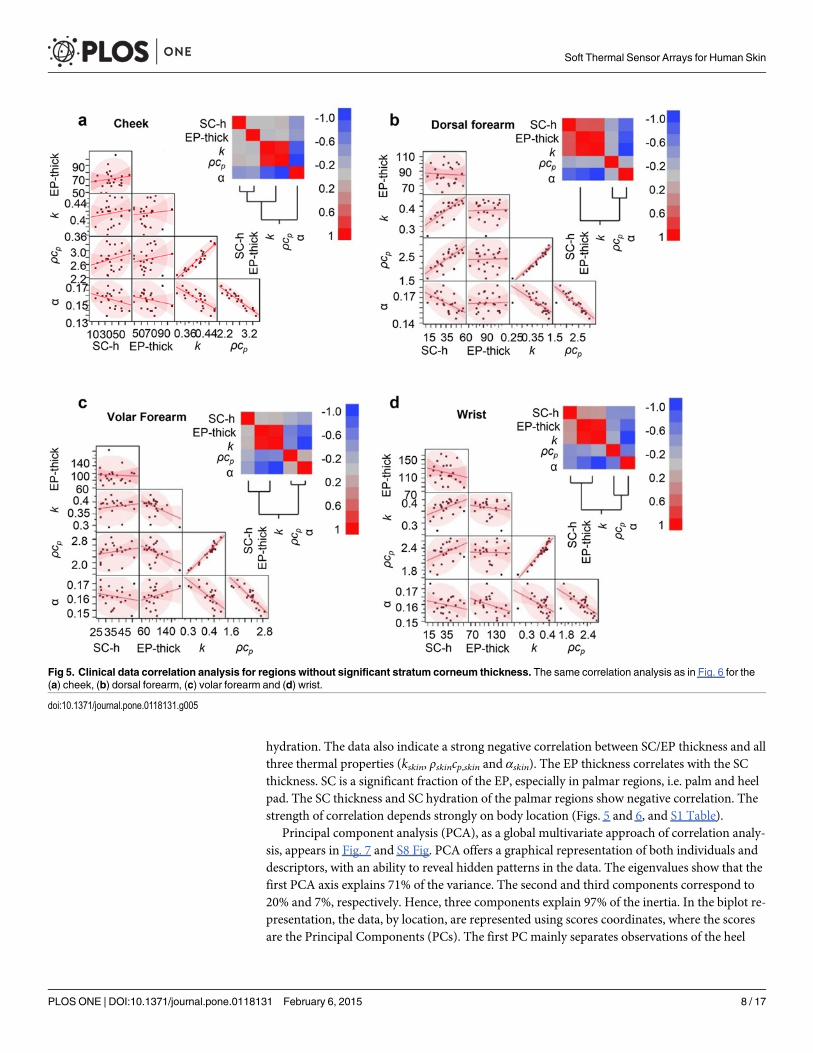
Principal component analysis (PCA), as a global multivariate approach of correlation analy-sis, appears in Fig. 7 and S8 Fig. PCA offers a graphical representation of both individuals anddescriptors, with an ability to reveal hidden patterns in the data. The eigenvalues show that thefirst PCA axis explains 71% of the variance. The second and third components correspond to20% and 7%, respectively. Hence, three components explain 97% of the inertia. In the biplot re-presentation, the data, by location, are represented using scores coordinates, where the scoresare the Principal Components (PCs). The first PC mainly separates observations of the heel
Fig 5. Clinical data correlation analysis for regions without significant stratum corneum thickness. The same correlation analysis as in Fig. 6 for the(a) cheek, (b) dorsal forearm, (c) volar forearm and (d) wrist.
doi:10.1371/journal.pone.0118131.g005
Soft Thermal Sensor Arrays for Human Skin
PLOS ONE | DOI:10.1371/journal.pone.0118131 February 6, 2015 8 / 17
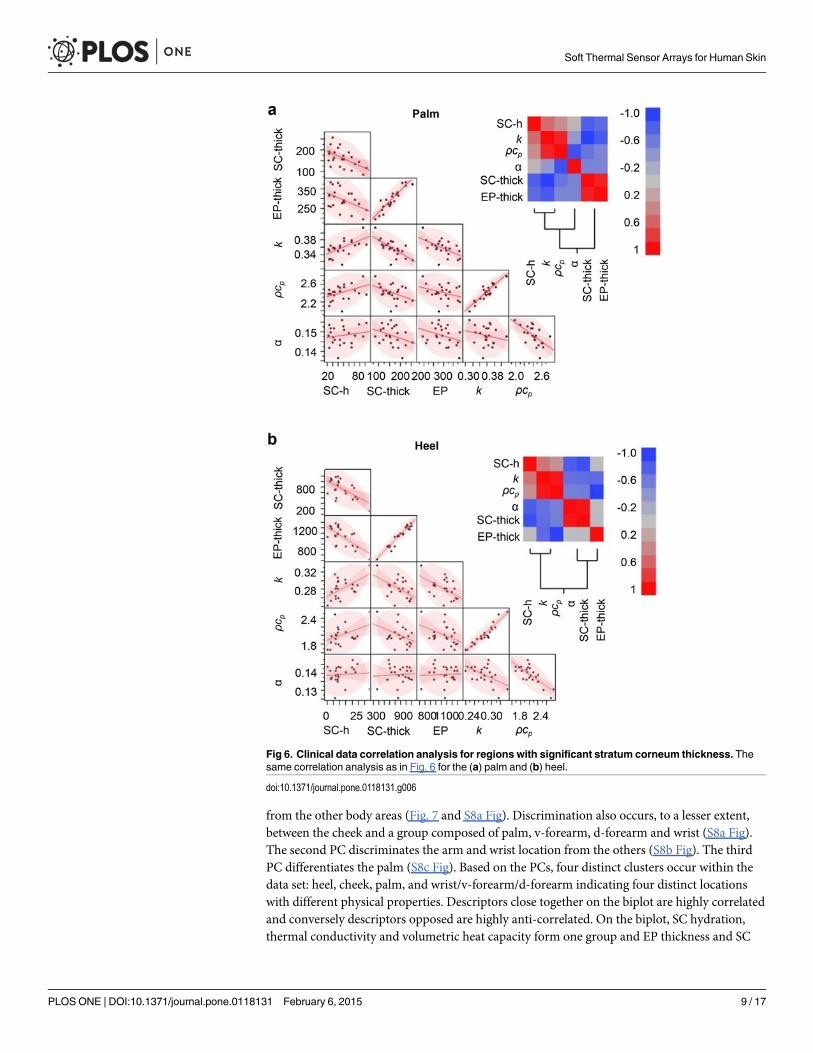
from the other body areas (Fig. 7 and S8a Fig). Discrimination also occurs, to a lesser extent,between the cheek and a group composed of palm, v-forearm, d-forearm and wrist (S8a Fig).The second PC discriminates the arm and wrist location from the others (S8b Fig). The thirdPC differentiates the palm (S8c Fig). Based on the PCs, four distinct clusters occur within thedata set: heel, cheek, palm, and wrist/v-forearm/d-forearm indicating four distinct locationswith different physical properties. Descriptors close together on the biplot are highly correlatedand conversely descriptors opposed are highly anti-correlated. On the biplot, SC hydration,thermal conductivity and volumetric heat capacity form one group and EP thickness and SC
Fig 6. Clinical data correlation analysis for regions with significant stratum corneum thickness. Thesame correlation analysis as in Fig. 6 for the (a) palm and (b) heel.
doi:10.1371/journal.pone.0118131.g006
Soft Thermal Sensor Arrays for Human Skin
PLOS ONE | DOI:10.1371/journal.pone.0118131 February 6, 2015 9 / 17
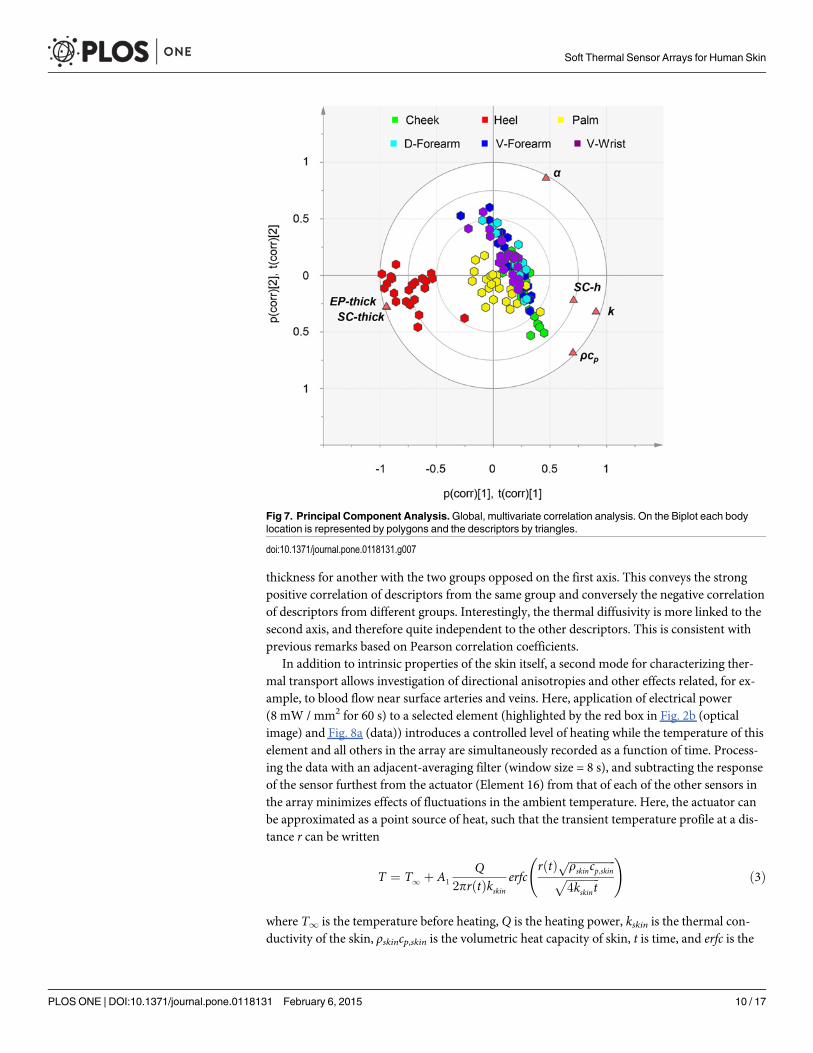
thickness for another with the two groups opposed on the first axis. This conveys the strongpositive correlation of descriptors from the same group and conversely the negative correlationof descriptors from different groups. Interestingly, the thermal diffusivity is more linked to thesecond axis, and therefore quite independent to the other descriptors. This is consistent withprevious remarks based on Pearson correlation coefficients.
In addition to intrinsic properties of the skin itself, a second mode for characterizing ther-mal transport allows investigation of directional anisotropies and other effects related, for ex-ample, to blood flow near surface arteries and veins. Here, application of electrical power(8 mW / mm2 for 60 s) to a selected element (highlighted by the red box in Fig. 2b (opticalimage) and Fig. 8a (data)) introduces a controlled level of heating while the temperature of thiselement and all others in the array are simultaneously recorded as a function of time. Process-ing the data with an adjacent-averaging filter (window size = 8 s), and subtracting the responseof the sensor furthest from the actuator (Element 16) from that of each of the other sensors inthe array minimizes effects of fluctuations in the ambient temperature. Here, the actuator canbe approximated as a point source of heat, such that the transient temperature profile at a dis-tance r can be written
T ¼ T1 þ A1
Q2prðtÞkskin
erfcrðtÞ ffiffiffiffiffiffiffiffiffiffiffiffiffiffiffiffiffirskincp;skin
pffiffiffiffiffiffiffiffiffiffiffiffi4kskint
p !
ð3Þ
where T1 is the temperature before heating, Q is the heating power, kskin is the thermal con-ductivity of the skin, ρskincp,skin is the volumetric heat capacity of skin, t is time, and erfc is the
Fig 7. Principal Component Analysis.Global, multivariate correlation analysis. On the Biplot each bodylocation is represented by polygons and the descriptors by triangles.
doi:10.1371/journal.pone.0118131.g007
Soft Thermal Sensor Arrays for Human Skin
PLOS ONE | DOI:10.1371/journal.pone.0118131 February 6, 2015 10 / 17
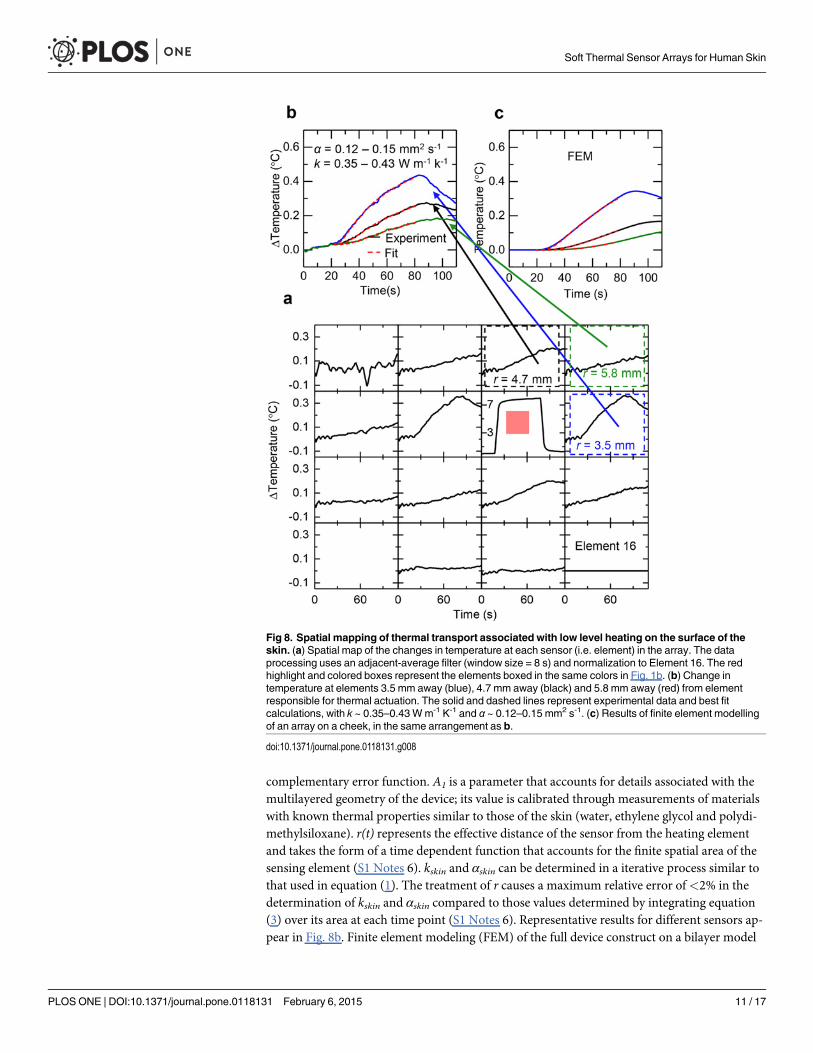
complementary error function. A1 is a parameter that accounts for details associated with themultilayered geometry of the device; its value is calibrated through measurements of materialswith known thermal properties similar to those of the skin (water, ethylene glycol and polydi-methylsiloxane). r(t) represents the effective distance of the sensor from the heating elementand takes the form of a time dependent function that accounts for the finite spatial area of thesensing element (S1 Notes 6). kskin and αskin can be determined in a iterative process similar tothat used in equation (1). The treatment of r causes a maximum relative error of<2% in thedetermination of kskin and αskin compared to those values determined by integrating equation(3) over its area at each time point (S1 Notes 6). Representative results for different sensors ap-pear in Fig. 8b. Finite element modeling (FEM) of the full device construct on a bilayer model
Fig 8. Spatial mapping of thermal transport associated with low level heating on the surface of theskin. (a) Spatial map of the changes in temperature at each sensor (i.e. element) in the array. The dataprocessing uses an adjacent-average filter (window size = 8 s) and normalization to Element 16. The redhighlight and colored boxes represent the elements boxed in the same colors in Fig. 1b. (b) Change intemperature at elements 3.5 mm away (blue), 4.7 mm away (black) and 5.8 mm away (red) from elementresponsible for thermal actuation. The solid and dashed lines represent experimental data and best fitcalculations, with k ~ 0.35–0.43Wm-1 K-1 and α ~ 0.12–0.15 mm2 s-1. (c) Results of finite element modellingof an array on a cheek, in the same arrangement as b.
doi:10.1371/journal.pone.0118131.g008
Soft Thermal Sensor Arrays for Human Skin
PLOS ONE | DOI:10.1371/journal.pone.0118131 February 6, 2015 11 / 17
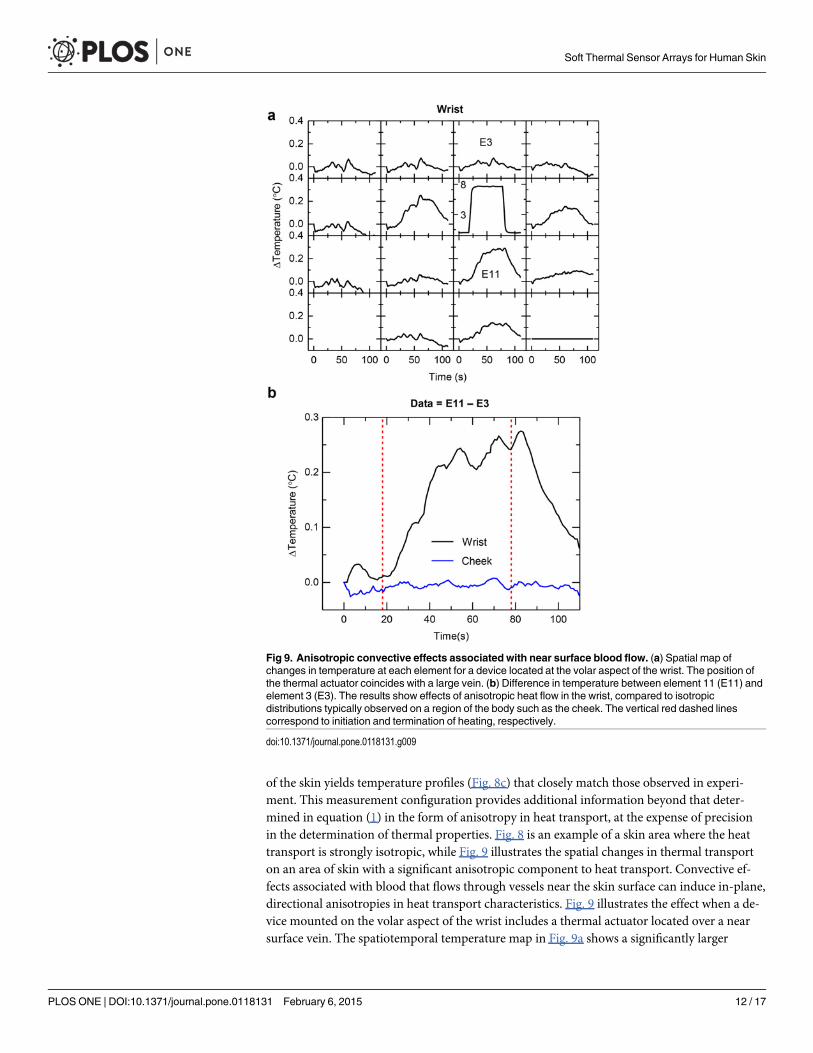
of the skin yields temperature profiles (Fig. 8c) that closely match those observed in experi-ment. This measurement configuration provides additional information beyond that deter-mined in equation (1) in the form of anisotropy in heat transport, at the expense of precisionin the determination of thermal properties. Fig. 8 is an example of a skin area where the heattransport is strongly isotropic, while Fig. 9 illustrates the spatial changes in thermal transporton an area of skin with a significant anisotropic component to heat transport. Convective ef-fects associated with blood that flows through vessels near the skin surface can induce in-plane,directional anisotropies in heat transport characteristics. Fig. 9 illustrates the effect when a de-vice mounted on the volar aspect of the wrist includes a thermal actuator located over a nearsurface vein. The spatiotemporal temperature map in Fig. 9a shows a significantly larger
Fig 9. Anisotropic convective effects associated with near surface blood flow. (a) Spatial map ofchanges in temperature at each element for a device located at the volar aspect of the wrist. The position ofthe thermal actuator coincides with a large vein. (b) Difference in temperature between element 11 (E11) andelement 3 (E3). The results show effects of anisotropic heat flow in the wrist, compared to isotropicdistributions typically observed on a region of the body such as the cheek. The vertical red dashed linescorrespond to initiation and termination of heating, respectively.
doi:10.1371/journal.pone.0118131.g009
Soft Thermal Sensor Arrays for Human Skin
PLOS ONE | DOI:10.1371/journal.pone.0118131 February 6, 2015 12 / 17
increase in temperature at the sensor located downstream (more proximal to the body, labeledE11) from the actuator, compared the one upstream (more distal to the body, labeled E3), rela-tive to the direction of blood flow. Fig. 9b highlights one method to quantitatively assess the an-isotropy in thermal flow. Here, the response of sensor E3 is subtracted from that of sensor E11(sensors E3 and E11 are equidistant from the heating element, arranged on opposing sides ofthe heater) for the case on the wrist, which shows strong anisotropy due to blood flow, and forthe case of isotropic data from a representative case on the cheek. The degree of anisotropictransport varies in strength over the twenty-five subjects due to differences in the locations andsizes of blood vessels and their associated flow properties. Such measurement capabilities haverelevance in the determination of cardiovascular health, through inferred measurements ofblood flow, both naturally and in response to stimuli such as temporary occlusion.
DiscussionIn summary, the work reported here reveals intrinsic thermal transport properties of the skin,including relationships to vascularization, blood flow, stratum corneum thickness and hydra-tion level, made possible by expanded capabilities in soft ultrathin, non-invasive measurementsystems that offer clear advantages compared to traditional approaches. As a demonstration ofthe new, in vivomeasurement capabilities enabled by the device presented here, a clear rela-tionship between skin hydration and in vivo thermal transport properties is shown across sixbody locations on twenty-five subjects. The data also reveal that the in vivo thermal transportproperties of skin are not uniquely a function of hydration, but are also influenced by the struc-tural makeup of the skin, as well as local blood flow characteristics. Obtaining similar data withalternative measurement techniques would require either expensive and complex optical ther-mography and laser heating systems, or bulky single-point probes that can have undesired ef-fects on the skin properties of interest due the pressure that must be applied to skin whenmeasured in vivo. The device and data presented here provide a foundational step for a new ap-proach to the measurement of in vivo skin thermal properties, as well as new statistical dataabout the correlations between skin thermal transport properties, and skin hydration andstructural makeup. Immediate further opportunities include use in studies of dermatologicaldiseases, such as melanoma, rosacea and hyperpigmentation and their progression over time.The same techniques also offer ability to examine the effectiveness of dermatologically activecompounds. Developments in wireless technology will provide a path to continuous monitor-ing of skin properties and function using these concepts.
Methods
Fabrication of Epidermal Thermal Sensing ArrayFabrication begins with a 3” Si wafer coated with a 200 nm layer of poly(methyl methacrylate),followed by 1 μm of polyimide. Photolithographic patterning of a bilayer of Cr (6 nm)/Au(75 nm) deposited by electron beam evaporation defines the sensing/heating elements. A sec-ond multilayer of Ti (10 nm)/Cu (500 nm)/Ti (10 nm)/Au (25 nm), lithographically patterned,forms the connections to sensing/heating elements and non-oxidizing bonding locations forexternal electrical connection. A second layer of polyimide (1 μm) places the sensing/heatingelements in the neutral mechanical plane and provides electrical insulation and mechanicalstrain isolation. Reactive ion etching of the polyimide defines the mesh layout of the array andexposes the bonding locations. A water-soluble tape (5414, 3M, USA) enables removal of themesh layout from the Si wafer, to expose its back surface for deposition of Ti (3 nm)/SiO2
(30 nm) by electron beam evaporation. Transfer to a thin silicone layer (5 μm; Ecoflex,Smooth-On, USA) spin-cast onto a glass slide, surface treated to reduce adhesion of the
Soft Thermal Sensor Arrays for Human Skin
PLOS ONE | DOI:10.1371/journal.pone.0118131 February 6, 2015 13 / 17
silicone, results in the formation of strong bonds due to condensation reactions between ex-posed hydroxyl groups on and the SiO2 and silicone. Immersion in warm water allows removalof the tape. A thin (100 μm), flexible, conductive cable (HST-9805–210; Elform, USA) bondedwith heat and pressure to contacting pads at the periphery serves as a connection to externalelectronics. A final layer of silicone (70 μm) in combination with a frame of medical tape (EaseRelease, 3M, USA) provides sufficient mechanical support to allow repeated (hundreds oftimes) use of a single device.
Data Acquisition for Epidermal Thermal Sensing ArrayThe epidermal thermal sensing array is connected to external data acquisition electronics via athin (100 μm) silver ink/polymer composite cable (HST-9805–210; Elform, USA). Resistanceand voltage values across sensor/actuator elements are recorded by a USB-powered digital mul-timeter (USB-4065; National Instruments, USA). In order to heat elements, controlled currentis supplied by a DC current source (6220 DC Current Source; Keithley, USA). The temperatureduring heating is monitored by recording the voltage across the heating element while receiv-ing constant current input. The sensors are time-multiplexed via a USB-powered multiplexingcircuit (U802; Ledgestone Technologies, USA).
Experiments on Human SubjectsThe volunteers consisted of healthy females, age between 18 and 45 years old, with healthy, in-tact skin of type II–IV according to the Fitzpatrick classification, recruited by Stephens & Asso-ciates, TX, USA. Approval by Stephens & Associates IRB: Protocol No. C14-D100 (ACR/TEMP/1416). Subjects provided written consent. The six investigational areas included thecheek, volar forearm, dorsal forearm, volar wrist, palm, and heel. Each subject acclimated toroom temperture for 15 min immediately prior to measurement. The investigational areaswere then gently cleaned with isopropyl alcohol, water, and dried with a swab to avoid skin irri-tation. Pictures were taken before and after the experimental procedures. SC hydration mea-surements used a 3 Cutometer MPA 580 (Courage + Khazaka Electronics GmbH). Skintemperature was evaluated using a handheld IR thermometer (DermaTemp, Exergen Co.,USA). Calibration of the experimental measurement system introduced here occurred at a sin-gle temperature point (room temperature). Evaluations involved lamination of the device ontothe investigational area, collection of relevant data, followed by removal. Three additional cor-neometer readings were then collected, followed by measurements by optical coherence tho-mograpy (VivoSight,Michelson Diagnostics, UK). The individual pictured in Fig. 1 has givenwritten informed consent (as outlined in the PLOS consent form) to publish these case details.
Statistical AnalysesBox plot representations (SAS statistical software release 9.3, SAS Institute Inc., Cary, NC,USA) illustrate variables and trends by body location. The pairwise Pearson correlation coeffi-cients were displayed as tables, scatterplot matrices, or heat map representations using JMP sta-tistical software release 10.0 (JMP is a trademark of SAS Institute). Principal ComponentAnalysis serve as a global multivariate approach with a biplot representation of individuals anddescriptors (SIMCA statistical software release 13.0, UMETRICS, Umeå, Sweden).
Supporting InformationS1 Notes. Supplementary Notes 1–6: Supporting text, figures and tables.(PDF)
Soft Thermal Sensor Arrays for Human Skin
PLOS ONE | DOI:10.1371/journal.pone.0118131 February 6, 2015 14 / 17

S1 Fig. Device construction and temperature comparison to IR measurements. (a) Opticalimage of 4x4 thermal sensing array, showing the bonding location of the thin, flexible cable(ACF connection). (b) Magnified image of a single sensor/actuator element, showing the10 μmwide, serpentine configuration. (c) Cross-sectional schematic showing the device layouton skin. (d) Comparison of temperature device readings on six body locations on each oftwenty-five subjects, as compared to IR measurements. Pearson correlation coefficient = 0.98.(TIF)
S2 Fig. Representative photographs of each body location before, during, and after mea-surements. Images show each body location before application of the thermal sensing array,with the device applied to skin during heating applications for thermal measurements, andthen after device removal. No irritation is observed as a result of heating, or wearing the device.Body locations are (a) cheek, (b) volar forearm, (c) dorsal forearm, (d) wrist, (e) palm, and(f) heel.(TIF)
S3 Fig. Temperature variations across body locations. (a) Variation in temperature data be-tween different subjects on different body locations for thermal sensing array (blue) and IRthermometer (red). (b) Inter- and intra-subject variance for the thermal sensing array andIR thermometer.(TIF)
S4 Fig. Temperature variations across body locations for each subject. Variation in tempera-ture data between different subjects on different body locations for thermal sensing array(blue) and IR thermometer (red).(TIF)
S5 Fig. Analysis of fitting process sensitivity with experimental error. (a) Experimental pre-cision fitting error analysis of representative in vivo data on a human heel. Experimental errorrange is given by 3x the standard deviation of temperature readings from the mean. (b) Experi-mental accuracy fitting error analysis of representative in vivo data on a human heel and (c) ahuman cheek. Experimental error range is given by the 95% confidence interval of temperaturereadings due to calibration errors.(TIF)
S6 Fig. Experimental determination of measurement probing depth.Measured thermal con-ductivities by the thermal sensing array for different thickness of a silicone with thermal prop-erties similar to skin (Sylgard 170, Dow Corning, USA; k = 0.39 Wm-1 K-1, ρ = 1370 kg m-3)on copper. The measured thermal conductivity rises rapidly when the silicone layer becomesthinner than the probing depth, which is given by Eq. 2 to be approximately 0.5 mm.(TIF)
S7 Fig. Solutions for r(t).Numerically determined solutions for r(t) over the appropriatemeasurement time, determined using k = 0.35 Wm-1 K-1 and α = 0.15 mm2 s-1, for (a)r = ~3.5 mm, (b) r = ~4.7 mm, and (c) r = ~5.8 mm. (d) Example temperature rise solutions fora sensor ~3.5 mm away using the integrated solution of Eq. S5, r(t) given in a with Eq. S6, andvarious time independent values of r with Eq. S6. r(t) gives the smallest discrepancy withEq. S5 at<1%, and time independent average values of r give discrepancies<5%.(TIF)
S8 Fig. Principle component analysis. Boxplot representation of principal components bybody location, and their corresponding relation to measured parameters. (a) Box plots and
Soft Thermal Sensor Arrays for Human Skin
PLOS ONE | DOI:10.1371/journal.pone.0118131 February 6, 2015 15 / 17

correlation weights of the first principal component, (b) the second principal component and(c) the third principal component.(TIF)
S1 Table. Supplementary Table Pearson Correlation coefficients for the correlation analy-ses (Figs. 4–6).(TIF)
AcknowledgmentsWe thank AdamMeekings and Michelson Diagnostics for discussions related to OCT imageanalysis, Dr. Giles Spenlehauer for discussions related to skin temperature studies and Dr.Thomas Stephens, Dr. Lily Jiang and Trang Nguyen for subject recruitment and assistancewith clinical study organization. Research was supported by L’Oréal Research & Innovation,the Materials Research Laboratory and Center for Microanalysis of Materials at the Universityof Illinois at Urbana-Champaign.
Author ContributionsConceived and designed the experiments: RCW RMPMMGB JAR. Performed the experi-ments: RCW RMP JA JK AL NHC VM. Analyzed the data: RCW RMP PB JN. Contributed re-agents/materials/analysis tools: RCW RMP PBMMVM. Wrote the paper: RCW RMP PB JNGB JAR.
References1. Graffe KVD (2001) Human Anatomy: McGraw Hill.
2. El-Brawany MA, Nassiri DK, Terhaar G, Shaw A, Rivens I, et al. (2009) Measurement of thermal and ul-trasonic properties of some biological tissues. Journal of Medical Engineering and Technology 33:249–256. doi: 10.1080/03091900802451265 PMID: 19340696
3. Werner U, Giese K, Sennhenn B, Plamann K, Kolmel K (1992) Measurement of the thermal diffusivityof human epidermis by studying thermal wave propagation. Phys Med Biol 37: 21–35. PMID: 1741425
4. Togawa T, Saito H (1994) Non-contact imaging of thermal properties of the skin. Physiological Mea-surement 15: 291–298. PMID: 7994207
5. DucharmeMB, Tikuisis P (1991) In vivo thermal conductivity of the human forearm tissues. Journal ofApplied Physiology 70: 2682–2690. PMID: 1885465
6. Jin C, He Z, Zhang S, Qi M, Sun Z, et al. (2012) A feasible method for measuring the blood flow velocityin superficial artery based on the laser induced dynamic thermography. Infrared Physics and Technolo-gy 55: 462–468.
7. Arnaud F, DelhommeG, Dittmar A, Girard P, Netchiporouk L, et al. (1994) A micro thermal diffusionsensor for non-invasive skin characterization. Sensors and Actuators: A Physical 41: 240–243.
8. Raamat R, Jagomägi K, Kingisepp PH (2002) Simultaneous recording of fingertip skin blood flowchanges by multiprobe laser Doppler flowmetry and frequency-corrected thermal clearance. MicrovascRes 64: 214–219. PMID: 12204645
9. Kim DH, Lu NS, Ma R, Kim YS, Kim RH, et al. (2011) Epidermal Electronics. Science 333: 838–843.doi: 10.1126/science.1206157 PMID: 21836009
10. Webb RC, Bonifas AP, Behnaz A, Zhang YH, Yu KJ, et al. (2013) Ultrathin conformal devices for pre-cise and continuous thermal characterization of human skin. Nature Materials 12: 938–944. doi: 10.1038/nmat3755 PMID: 24037122
11. Wang S, Li M, Wu J, Kim D-H, Lu N, et al. (2012) Mechanics of Epidermal Electronics. Journal of Ap-plied Mechanics 79: 031022–031022.
12. Huang X, Cheng H, Chen K, Zhang Y, Zhang Y, et al. (2013) Epidermal impedance sensing sheets forprecision hydration assessment and spatial mapping. IEEE Trans Biomed Eng 60: 2848–2857. doi: 10.1109/TBME.2013.2264879 PMID: 23739778
13. Kaltenbrunner M, Sekitani T, Reeder J, Yokota T, Kuribara K, et al. (2013) An ultra-lightweight designfor imperceptible plastic electronics. Nature 499: 458–463. doi: 10.1038/nature12314 PMID: 23887430
Soft Thermal Sensor Arrays for Human Skin
PLOS ONE | DOI:10.1371/journal.pone.0118131 February 6, 2015 16 / 17

14. Someya T, Kato Y, Sekitani T, Iba S, Noguchi Y, et al. (2005) Conformable, flexible, large-area net-works of pressure and thermal sensors with organic transistor active matrixes. Proc Natl Acad Sci U SA 102: 12321–12325. PMID: 16107541
15. Mannsfeld SC, Tee BC, Stoltenberg RM, Chen CV, Barman S, et al. (2010) Highly sensitive flexiblepressure sensors with microstructured rubber dielectric layers. Nat Mater 9: 859–864. doi: 10.1038/nmat2834 PMID: 20835231
16. Lacour SP, Jones J, Suo Z, Wagner S (2004) Design and performance of thin metal film interconnectsfor skin-like electronic circuits. Ieee Electron Device Letters 25: 179–181.
17. Sun JY, Lu NS, Yoon J, Oh KH, Suo ZG, et al. (2009) Inorganic islands on a highly stretchable polyi-mide substrate. Journal of Materials Research 24: 3338–3342.
18. Li T, Huang ZY, Suo Z, Lacour SP, Wagner S (2004) Stretchability of thin metal films on elastomer sub-strates. Applied Physics Letters 85: 3435–3437.
19. Carslaw HS, Jaeger JC (1959) Conduction of heat in solids. Oxford,: Clarendon Press. 510 p. p.
20. Gustafsson SE (1991) Transient plane source techniques for thermal conductivity and thermal diffusivi-ty measurements of solid materials. Review of Scientific Instruments 62: 797–804.
21. Robertson K, Rees JL (2010) Variation in epidermal morphology in human skin at different body sitesas measured by reflectance confocal microscopy. Acta Derm Venereol 90: 368–373. doi: 10.2340/00015555-0875 PMID: 20574601
22. EgawaM, Hirao T, Takahashi M (2007) In vivo estimation of stratum corneum thickness from waterconcentration profiles obtained with Raman spectroscopy. Acta Derm Venereol 87: 4–8. PMID:17225007
23. Bohling A, Bielfeldt S, Himmelmann A, Keskin M, Wilhelm KP (2014) Comparison of the stratum cor-neum thickness measured in vivo with confocal Raman spectroscopy and confocal reflectance micros-copy. Skin Res Technol 20: 50–57. doi: 10.1111/srt.12082 PMID: 23909688
Soft Thermal Sensor Arrays for Human Skin
PLOS ONE | DOI:10.1371/journal.pone.0118131 February 6, 2015 17 / 17
Supplementary Information for:
Thermal Transport Characteristics of Human Skin Measured In Vivo Using Ultrathin Conformal Arrays of Thermal Sensors and Actuators
R. Chad Webb1,†, Rafal M. Pielak2,†, Philippe Bastien3, Joshua Ayers1, Juha Niittynen4, Jonas Kurniawan1, Megan Manco5, Athena Lin1, Nam Heon Cho1, Viktor Malyrchuk1, Guive Balooch2,6,* and John A. Rogers1,*
1Frederick Seitz Materials Research Laboratory, Department of Materials Science and Engineering, University of Illinois at Urbana-Champaign, Urbana, IL 61801, USA
2L’Oréal California Research Center, 953 Indiana St. San Francisco, CA 94107
3L’Oréal Research and Innovation, 1 av. Eugène Schuller, 39601 Aulnay sous Bois, France
4Tampere University of Technology, Department of Electronics and Communication Engineering, Korkeakoulunkatu 3, P.O. Box 692, FI-33101 Tampere, Finland
5L’Oréal Early Clinical, 133 Terminal Ave. Clark, NJ 07066
6L’Oréal Digital Incubator, 133 Terminal Ave. Clark, NJ 07066
†These authors contributed equally to this work
*To whom correspondence should be addressed. Guive Balooch: [email protected], John A. Rogers: [email protected]

Supplementary Note 1: Fabrication procedure for ultrathin thermal sensing arrays
Prepare polymer base layers
1. Clean a 3” Si wafer (Acetone, IPA -> Dry 5 min at 110 °C).
2. Spin coat with PMMA (poly(methyl methacrylate) 495 A2 (Microchem), spun at 3,000
rpm for 30 s.
3. Anneal at 180 °C for 1 min.
4. Spin coat with polyimide (PI, poly(pyromellitic dianhydride-co-4,4′ -oxydianiline), amic
acid solution, Sigma-Aldrich, spun at 4,000 rpm for 30 s).
5. Anneal at 110 °C for 30 s.
6. Anneal at 150 °C for 5 min.
7. Anneal at 250 °C under vacuum for 1 hr.
Deposit first metallization
8. E-beam 6/75 nm Cr/Au.
9. Pattern photoresist (PR; Clariant AZ5214, 3000 rpm, 30s) with 365 nm optical
lithography through iron oxide mask (Karl Suss MJB3).
Develop in aqueous base developer (MIF 327).
10. Etch Au with TFA Au etchant (Transene).
11. Etch Cr with CR-7 Cr Mask Etchant (Cyantek).
12. Remove PR w/ Acetone, IPA rinse.
13. Dry 5 min at 150 °C.
Deposit second metallization
14. E-beam 10/500/10/25 nm Ti/Cu/Ti/Au.
15. Pattern PR AZ5214.
16. Etch Au with TFA Au etchant.
17. Etch Ti with 6:1 Buffered Oxide Etchant.
18. Etch Cu with CE-100 etchant (Transene).
19. Etch Ti with 6:1 Buffered Oxide Etchant.
20. Remove PR w/ Acetone, IPA rinse.
21. Dry 5 min at 150 °C.
Isolate entire device
22. Spin coat with PI.
23. Anneal at 110 °C for 30 s.
24. Anneal at 150 °C for 5 min.
25. Anneal at 250 °C under vacuum for 1 hr.
26. Pattern photoresist (PR; Clariant AZ4620, 3000 rpm, 30s) with 365 nm optical
lithography through iron oxide mask (Karl Suss MJB3).
Develop in aqueous base developer (AZ 400K diluted 1:3, AZ 400K:Water).
27. RIE (150 mTorr, 20 sccm O2, 200 W, 20 min).
Release and transfer
28. Release w/ boiling Acetone.
29. Transfer to water-soluble tape (Wave Solder Tape, 5414, 3M).
30. E-beam 3/30 nm Ti/SiO2.
31. Transfer to ~10 μm silicone sheet (Ecoflex, Smooth-on Co.) coated on silanized glass
slide.
32. Immerse in warm water to dissolve tape.
33. Immerse quickly in Chrome Mask Etchant to remove any remaining residue.
34. Bond thin, flexible cable (Elform, HST-9805-210) using hot iron with firm pressure.
35. Apply additional silicone (10-100 um) by doctor blade
36. Apply silicone medical tape frame (Ease Release Tape, 3M).
37. Remove device.
In order to provide a more appropriate system for repeated clinical use, we improve upon our initially demonstrated system in several ways. First, an electron beam evaporated metallic stack of Ti/Cu/Ti/Au (10/500/10/25 nm) replaces the expensive Au interconnect wiring system. This system provides the desired low resistivity interconnects while using minimal Au as a contact material. Narrow line widths (10 µm) in the sensing/heating elements provide high resistance in a small spatial area, shown in Fig. S1b, minimizing undesired heating in interconnect wires. A thin layer of Ecoflex (smooth-on, ETC) polymer between the sensor/heater elements (Fig. S1c) and the skin improves the adhesion directly between the heating element and the skin, minimizing errors in thermal transients that may be caused by air gaps. Finally, a silicone adhesive based tape (Ease Release, 3M, USA) functions as a frame for the device, providing a flexible but robust mechanical support for repeated use over >100 applications (see Fig. S2 for images before, during, and after measurement on each body location in the clinical study). Finally, the data acquisition and control system is in the form of a low cost, USB-powered portable system for practical clinical use. High temperature resolution is achieved by the 22-bit digital multimeter (USB-4065, National Instruments, USA) and time-multiplexing is achieved by the use of a USB-powered, voltage isolated switch circuit (U802, Ledgestone Technologies LLC, USA).
Supplementary Note 2: Temperature measurements across all body locations
In order to verify temperature accuracy, temperature recordings by the device array are compared to recordings by a commercial infrared thermometer (DermaTemp, Exergen Co., USA) on each body location (Fig. S1d). The temperature values correlate well (Pearson’s correlation coefficient, R, = 0.98, slope = 0.95 ± 0.02, intercept = 2.5 ± 0.5, standard errors), verifying the value of the device in the context of epidermal temperature
sensing across varied body locations, as demonstrated previously [1]. Average temperature variations between body locations are shown in Fig. S3, and temperature variations of measured on each body location on each subject are shown in Fig. S4.
Supplemental Note 3: Estimated error in fitting models for clinical study
The fitting model described by equation (1) and Fig. 2 is used to determine thermal
property data for the 150 body locations measured during the clinical study. In this fitting
procedure, two parameters, thermal conductivity and thermal diffusivity, are fit
simultaneously. We assess the potential error in this fitting procedure by fixing one of the
parameters, and allowing the other to float to determine the best fit with experimental
data. In order to determine the fixed parameter value, we initially conduct the fit with both
parameters floating to determine the best fit with experimental data (Fig. S5, red dashed
line). We then fix one parameter, with a relative error from the best fit value, and allow the
second parameter to float to determine a new best fit. We increase the error introduced
to the fixed parameter until the new best fit curve falls just outside the error range of the
experimental data (Fig. S5; best fit curves after applying error shown as blue and green
dashed line; error range of experimental data shaded in red). The error range associated
with the precision (i.e. the sensitivity of measurements using the same device one
measurement to the next) of experimental data (Fig. S4a) is given as ±0.04 °C, which is
>3σ, where σ = 0.013°C is the in vivo experimental standard deviation of error from the
mean. This error analysis conducted on several sets of in vivo data from our clinical study
results in 2-3% potential error in the value of k and 8% potential error in the value of α,
with representative analyses from the heel shown in Figs. S5a. Each in vivo measurement
involves solutions to k and α from each of fifteen sensors in the array. The average
standard deviation across all body locations, excluding the dorsal forearm which has large
deviations due to hair on some subjects, of all subjects is 6% (0.02 W m-1 K-1) and 9%
(0.013 mm2 s-1) for k and α respectively.
The error range associated with the sensor accuracy (i.e. the reliability of measurements
when using different devices on measurement to the next) of experimental data is given
by the 95% confidence interval of the sensor calibration of temperature sensitivity. This
error analysis conducted on several sets of in vivo data from our clinical study results in
4-5% potential error in the value of k and 15% potential error in the value of α, with
representative analyses from the heel and cheek shown in Figs. S5b and S5c
respectively.
Supplemental Note 4: Error analysis of equation (1) approximations
The algorithm used to calculate skin thermal transport properties from transient heating
in individual elements, shown in equation (1), is a convenient approximation to the
solution of the average temperature of a small square with finite dimensions during
transient heating. The approximation in equation (1) assumes that the average

temperature in the square can be approximated by assuming a point heat source at the
center of the square, and a temperature rise some distance A2 away from the point
source. The iteration of equation (1) is computationally inexpensive, which allows for rapid
computation of the data from each element in the array. The potential error associated
with equation (1) is investigated by comparison to the more exact, and computationally
expensive, solution given by Gustafsson [2]
∆𝑇(𝜏)̅̅ ̅̅ ̅̅ ̅̅ =
𝑃0𝐻(𝜏)
4𝜋12𝑏𝑘
(S1)
where P0 is the power output of the heater, b is the half width of the square heating
element (0.5 mm for the our device), k is the thermal conductivity,
𝜏 =𝑡𝛼
𝑏2 (S2)
where α is the thermal diffusivity, t is time and
𝐻(𝜏) = ∫ 𝑑𝜐{erf(𝜐−1) − 𝜋−1 2⁄ 𝜐[1 − 𝑒𝑥𝑝(−𝜐−2)]}2
𝜏
0
(S3)
where erf is the error function given by
erf(𝑥) = 2𝜋−1 2⁄ ∫ 𝑑𝜐 exp(−𝜐2) .𝑥
0
(S4)
equation (S1) accounts for the finite spatial extent of the heater to determine the average
measured temperature of the heater. However, iterating this solutions of equations (S1)
– (S4) over the large body of data with the high frequency measurement of data across
many elements in an array quickly becomes computationally intensive. In order to
compare the error using equation (1), we compare the thermal properties, k and α,
determined on a representative dataset using equation (1) to those determined by the
iteration procedure of equations (S1) – (S4), once calibrated with known calibration media
(water and ethylene glycol). The average discrepancy between the two procedures in the
solution for k and α is 3% and 8%, respectively, which is within the previously described
error ranges due to noise. These potential errors will manifest in the form of constant
accuracy offset that will be consistent across all devices. As a result, these potential errors
will not influence the precision between measurements, different devices or the resultant
correlation statistics that of primary interest.
Supplemental Note 5: Estimation of measurement depth
The measurement technique outlined by equation (1) results in thermal property values
that are a weighted average of the values encountered through the depth of skin that is
probed by the measurement. The measurement depth can be approximated by equation

(2), which results in a measurement depth of ~500-1000 μm in skin. We verify this result
experimentally by conducting measurements on varying thickness of a polymer, with
thermal properties similar to skin (Sylgard 170, Dow Corning, USA), on a base substrate
of copper. The copper acts a thermal ground plane that will result in rapidly increasing
measured thermal properties as the measurement depth approaches the polymer
thickness. The resultant measured thermal conductivities on various thicknesses of
polymer on copper are shown in Fig. S6, and the measured thermal conductivities begin
to rise rapidly at a polymer thickness of approximately 500 μm.
Supplemental Note 6: Error analysis of equation (3) approximations
The measurement configuration outlined by equation (3) and Fig. 8 assumes a discrete
distance, r, away from a point source heater. The sensors in the array in use here have
a finite aerial spatial extent of 1 mm x 1 mm, with <3 µm thickness. The temperature
increase recorded by a sensor corresponds to the average temperature increase over the
sensor area. Assuming isotropic radial conduction, valid for cases without anisotropic
convective transport due to blood, the average temperature across the sensor, �̅�, is
approximately equal to the average temperature rise between points r1 and r2 away from
a point source heater, given by
�̅� =
∫𝑄
2𝜋𝑟𝑘𝑠𝑘𝑖𝑛𝑒𝑟𝑓𝑐 (
𝑟√𝜌𝑠𝑘𝑖𝑛𝑐𝑝,𝑠𝑘𝑖𝑛
√4𝑘𝑠𝑘𝑖𝑛𝑡) 𝑑𝑟
𝑟2𝑟1
𝑟2 − 𝑟1
(S5)
where r1 and r2 are 1 mm apart and represent the distances of the sensor near and far
edges, respectively, from the heater. equation (S5) can be approximated by
�̅� =
𝑄
2𝜋𝑟(𝑡)𝑘𝑠𝑘𝑖𝑛𝑒𝑟𝑓𝑐 (
𝑟(𝑡)√𝜌𝑠𝑘𝑖𝑛𝑐𝑝,𝑠𝑘𝑖𝑛
√4𝑘𝑠𝑘𝑖𝑛𝑡)
(S6)
where the integral average over the sensor in equation (S5) has been replaced by r(t), a
time dependent characteristic distance. r(t) is determined numerically by setting equation
(S5) equal to equation (S6). Specifically, equation (S5) is solved for a fixed kskin and
ρskincp,skin. equation (S6) is then solved in an iterative fashion to minimize the error
between equation (S6) and equation (S5), where r(t) is allowed to vary, and kskin and
ρskincp,skin are fixed to the values used in the solution for equation (S5). kskin = 0.35 W m-1
K-1 and ρskincp,skin = 2.33 J cm-3 K-1 are the approximate midpoint values of the in vivo data,
and are used to establish r(t) for the three sensor distances of ~3.5 mm, ~4.7 mm, and
~5.8 mm. r(t) begins at a value near that of the distance between the heat source and
nearest edge of the sensor, and rapidly approaches the mean sensor distance from the
heater. r(t) is, more generally, a function of ρskincp,skint/kskin, and the solutions of r(t) for kskin
= 0.35 W m-1 K-1 and ρskincp,skin = 2.33 J cm-3 K-1 are shown in Figs. S7A-C. While r(t) is a
function of thermal properties as well as time, the r(t) values shown in Figs. S7a-c are

assumed to be reasonable approximations for all thermal properties encountered on skin
in vivo. The error associated with this approximation can be estimated by determining r(t)
for one set of thermal property values (the mid-range values of the in vivo data), and
equation (S5) is solved for a set of thermal property values different from those used to
determine r(t) (high-range values of the in vivo data). Equation (S6) is then solved, where
r(t) is fixed and kskin and ρskincp,skin are varied iteratively to minimize the error between
equation (S6) and equation (S5). A typical result from this type of analysis is shown in
Fig. S7d, along with the results determined by replacing r(t) with different time
independent values (geometric mean, harmonic mean, and r1). The discrepancy between
the results determined by equation (S5) and the approximation using r(t) with equation
(S6) are found to be <1%. The still simpler solution using a single, time-independent value
in place of r(t) are found to produce errors <5%, if chosen appropriately.
References
1. Webb RC, Bonifas AP, Behnaz A, Zhang YH, Yu KJ, et al. (2013) Ultrathin conformal devices for precise and continuous thermal characterization of human skin. Nature Materials 12: 938-944.
2. Gustafsson SE (1991) Transient plane source techniques for thermal conductivity and thermal diffusivity measurements of solid materials. Review of Scientific Instruments 62: 797-804.
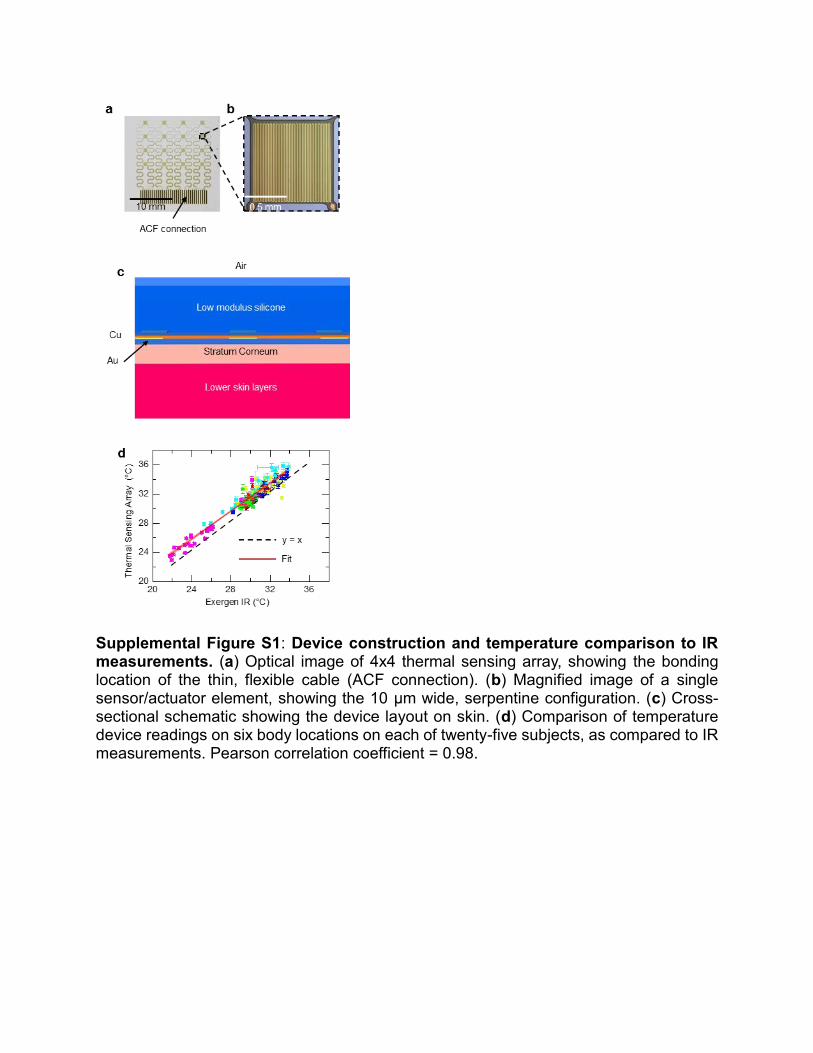
Supplemental Figure S1: Device construction and temperature comparison to IR measurements. (a) Optical image of 4x4 thermal sensing array, showing the bonding location of the thin, flexible cable (ACF connection). (b) Magnified image of a single sensor/actuator element, showing the 10 μm wide, serpentine configuration. (c) Cross-sectional schematic showing the device layout on skin. (d) Comparison of temperature device readings on six body locations on each of twenty-five subjects, as compared to IR measurements. Pearson correlation coefficient = 0.98.
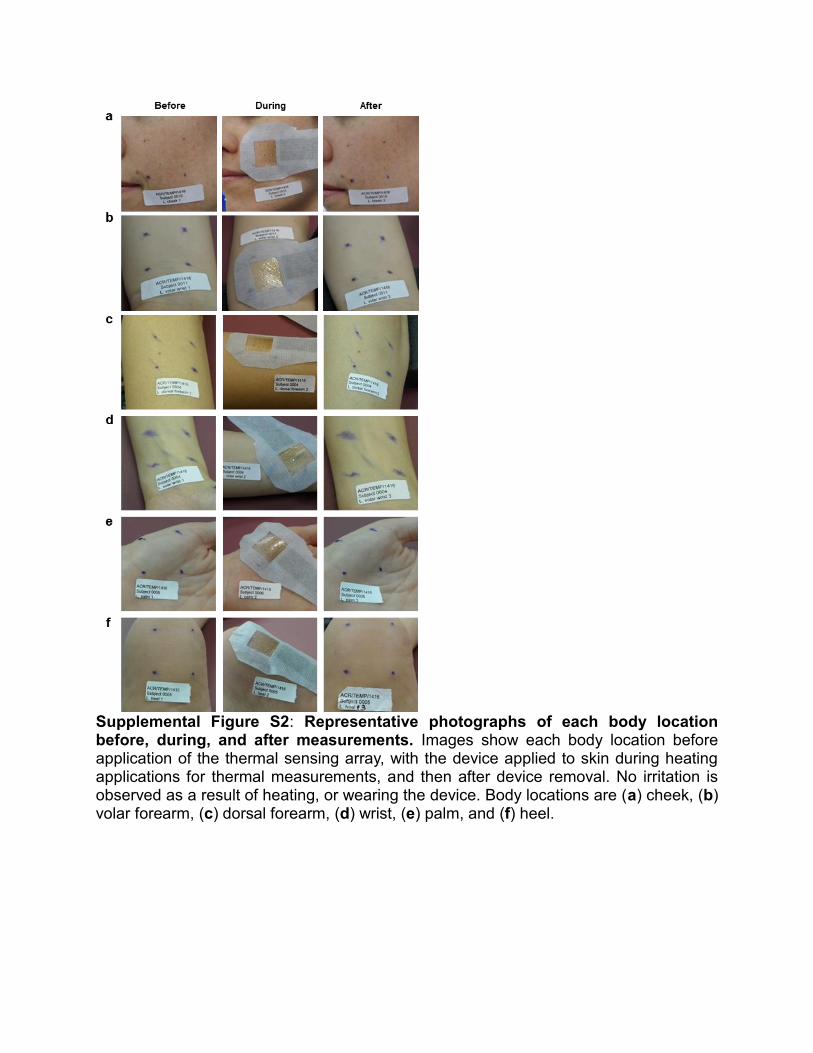
Supplemental Figure S2: Representative photographs of each body location before, during, and after measurements. Images show each body location before application of the thermal sensing array, with the device applied to skin during heating applications for thermal measurements, and then after device removal. No irritation is observed as a result of heating, or wearing the device. Body locations are (a) cheek, (b) volar forearm, (c) dorsal forearm, (d) wrist, (e) palm, and (f) heel.
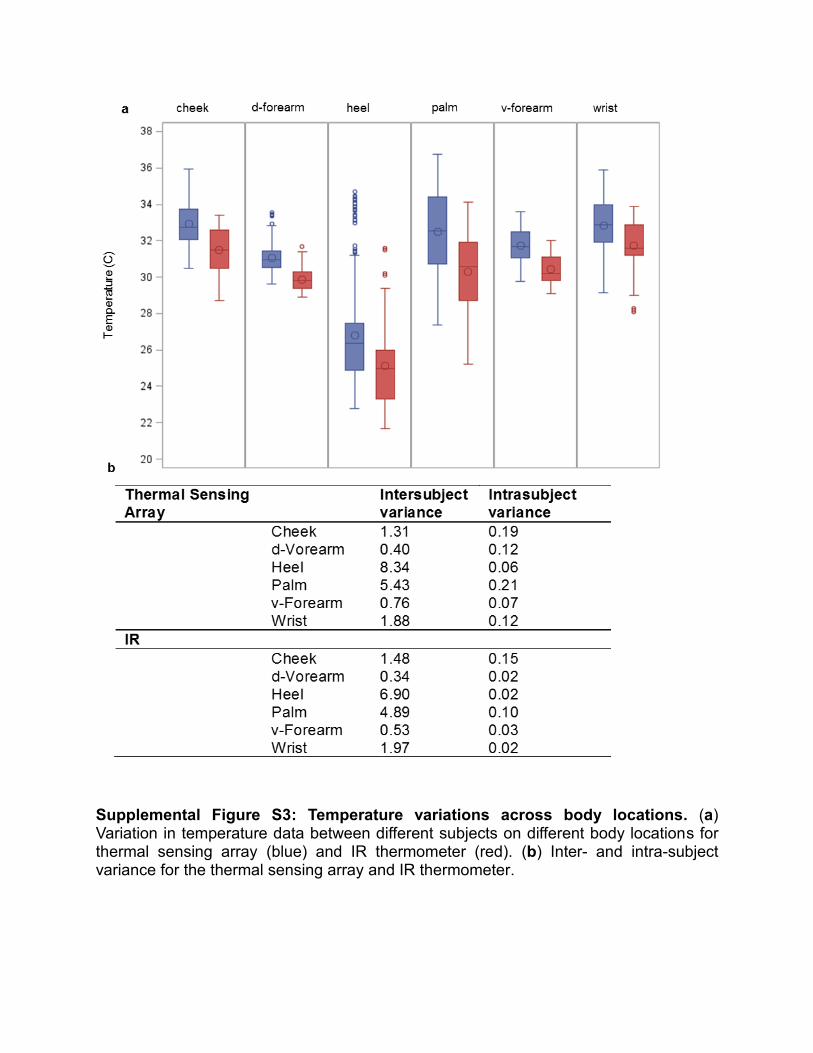
Supplemental Figure S3: Temperature variations across body locations. (a) Variation in temperature data between different subjects on different body locations for thermal sensing array (blue) and IR thermometer (red). (b) Inter- and intra-subject variance for the thermal sensing array and IR thermometer.
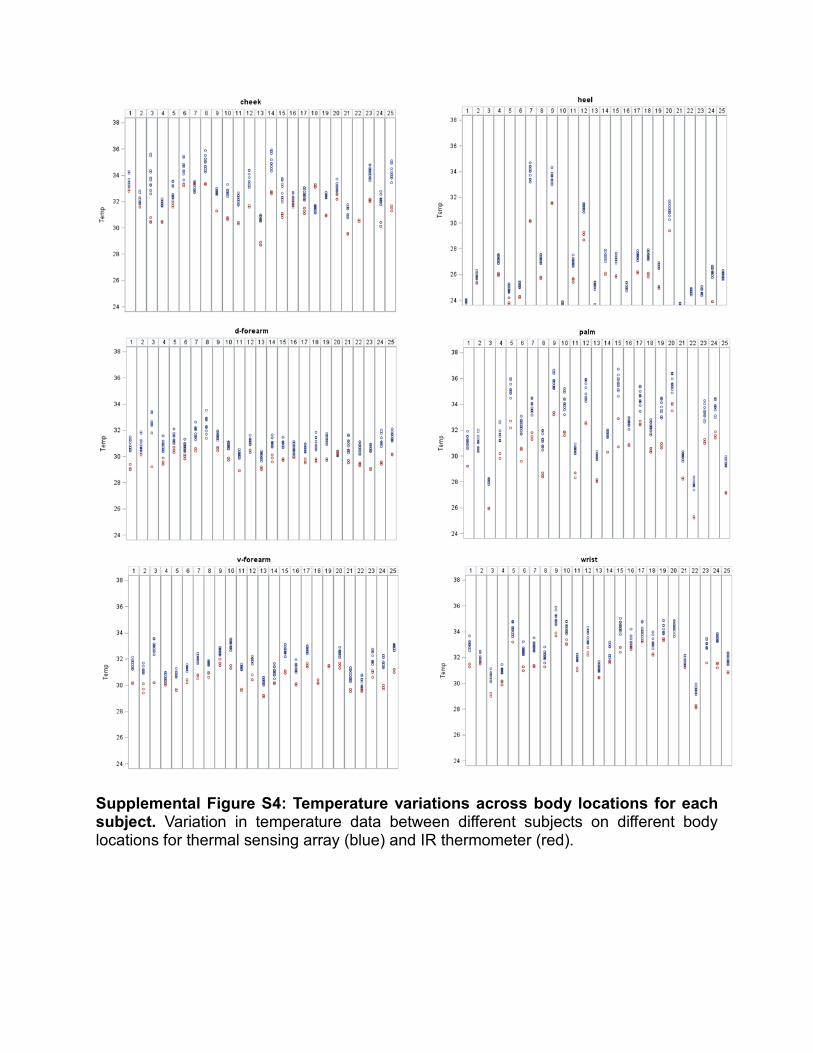
Supplemental Figure S4: Temperature variations across body locations for each subject. Variation in temperature data between different subjects on different body locations for thermal sensing array (blue) and IR thermometer (red).
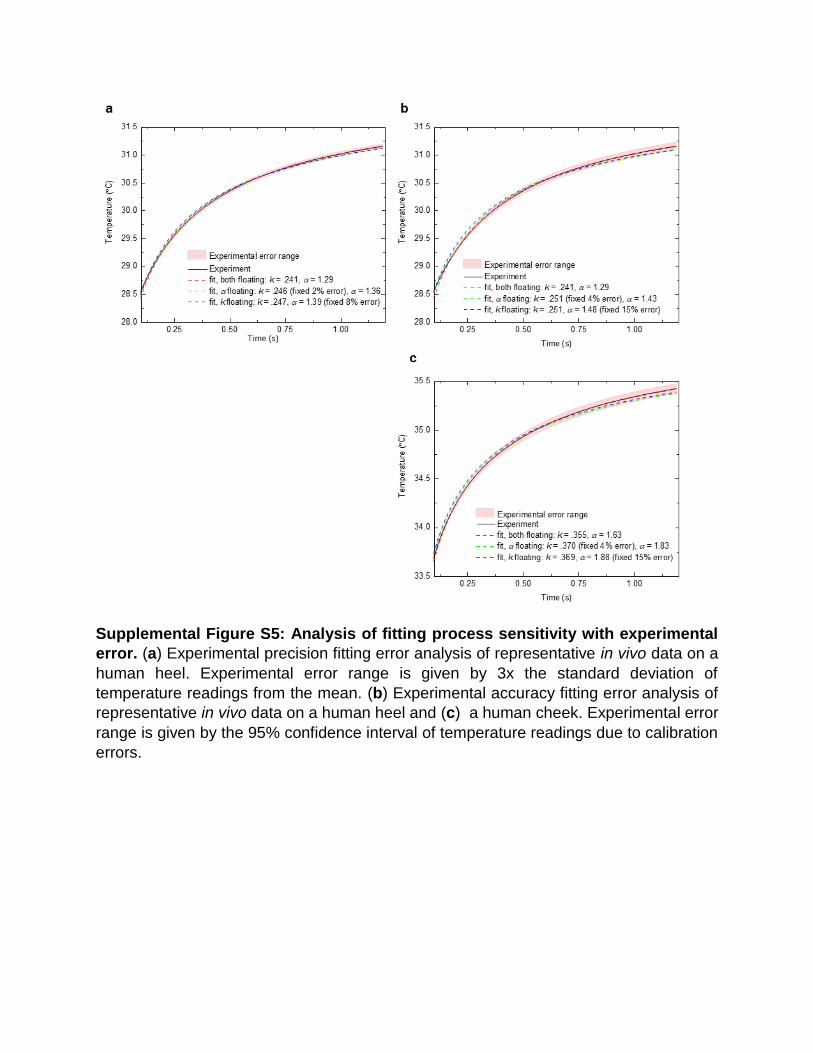
Supplemental Figure S5: Analysis of fitting process sensitivity with experimental
error. (a) Experimental precision fitting error analysis of representative in vivo data on a
human heel. Experimental error range is given by 3x the standard deviation of
temperature readings from the mean. (b) Experimental accuracy fitting error analysis of
representative in vivo data on a human heel and (c) a human cheek. Experimental error
range is given by the 95% confidence interval of temperature readings due to calibration
errors.
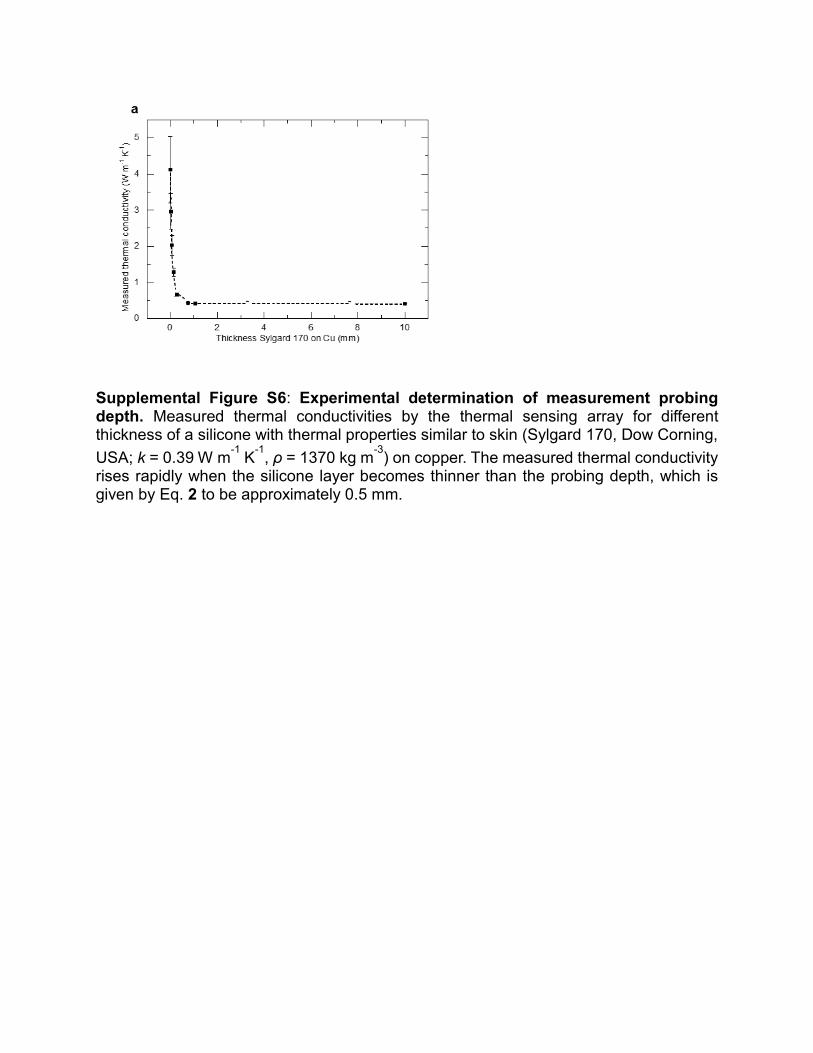
Supplemental Figure S6: Experimental determination of measurement probing depth. Measured thermal conductivities by the thermal sensing array for different thickness of a silicone with thermal properties similar to skin (Sylgard 170, Dow Corning,
USA; k = 0.39 W m-1
K-1
, ρ = 1370 kg m-3
) on copper. The measured thermal conductivity rises rapidly when the silicone layer becomes thinner than the probing depth, which is given by Eq. 2 to be approximately 0.5 mm.
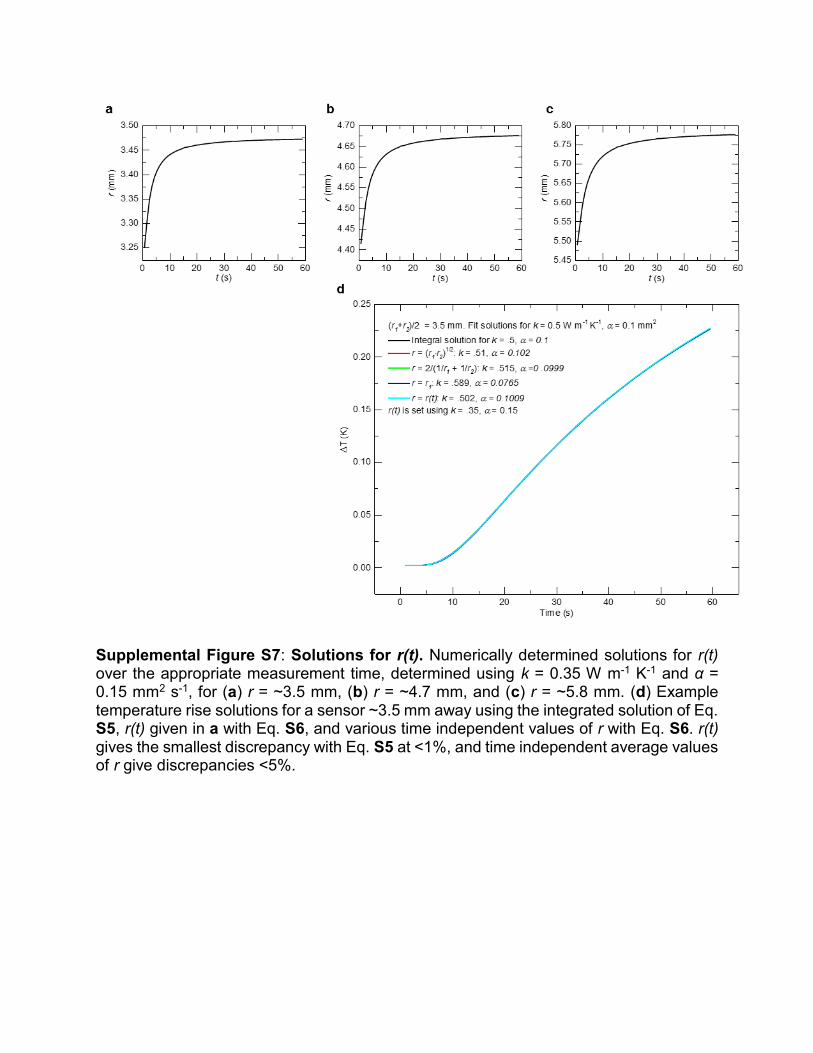
Supplemental Figure S7: Solutions for r(t). Numerically determined solutions for r(t) over the appropriate measurement time, determined using k = 0.35 W m-1 K-1 and α = 0.15 mm2 s-1, for (a) r = ~3.5 mm, (b) r = ~4.7 mm, and (c) r = ~5.8 mm. (d) Example temperature rise solutions for a sensor ~3.5 mm away using the integrated solution of Eq. S5, r(t) given in a with Eq. S6, and various time independent values of r with Eq. S6. r(t) gives the smallest discrepancy with Eq. S5 at <1%, and time independent average values of r give discrepancies <5%.
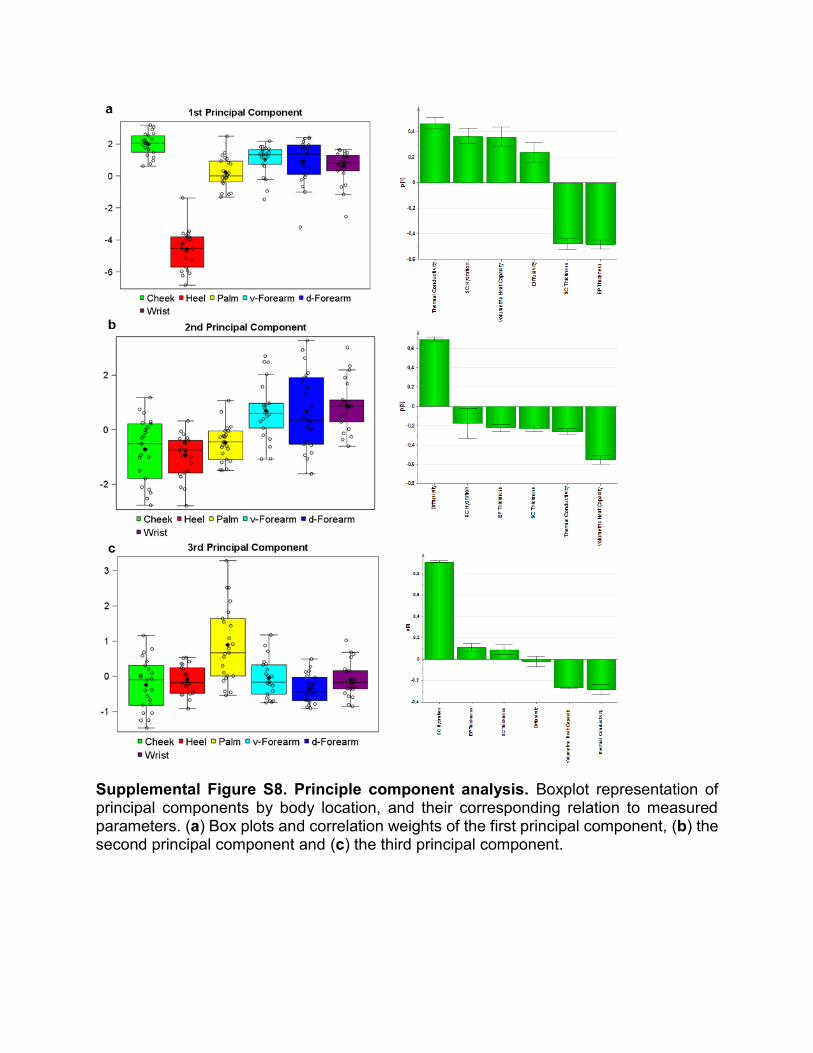
Supplemental Figure S8. Principle component analysis. Boxplot representation of principal components by body location, and their corresponding relation to measured parameters. (a) Box plots and correlation weights of the first principal component, (b) the second principal component and (c) the third principal component.
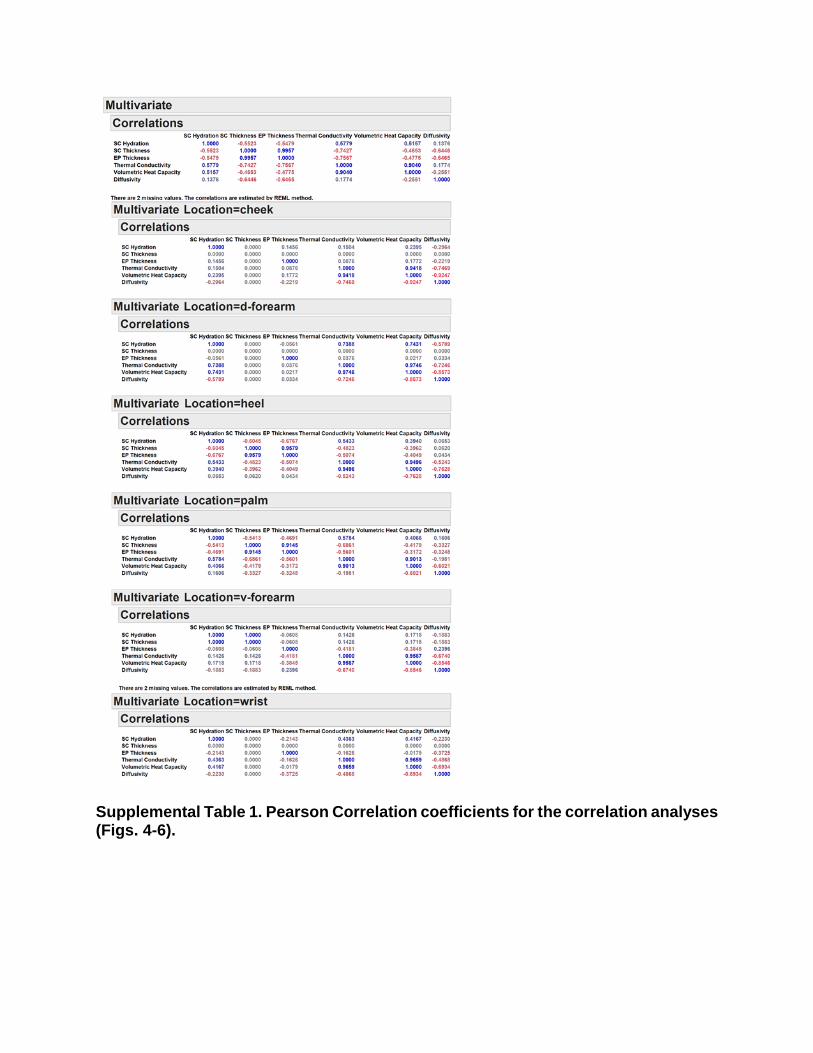
Supplemental Table 1. Pearson Correlation coefficients for the correlation analyses (Figs. 4-6).


![RESEARCHARTICLE DevelopmentofaNovelPETTracer[ NOTA ... · Conclusions [18F]AlF-NOTA-C6 waseasytosynthesizeandhassubstantialpotential asanimagingagent thattargets MMP2intumors. Introduction](https://img.pdfslide.net/doc/110x75/5e3d48e01a1f9b35007317c2/researcharticle-developmentofanovelpettracer-nota-conclusions-18falf-nota-c6.jpg)