Embed Size (px)
Citation preview
Hindawi Publishing CorporationAdvances in Mechanical EngineeringVolume 2013, Article ID 340435, 13 pageshttp://dx.doi.org/10.1155/2013/340435
Research ArticleModelling, Simulations, and Optimisation of Electric Vehiclesfor Analysis of Transmission Ratio Selection
Paul D. Walker,1 Salisa Abdul Rahman,2 Bo Zhu,1,3 and Nong Zhang1
1 School of Electrical, Mechanical, and Mechatronic Systems, Faculty of Engineering and Information Technology,University of Technology, Sydney, P.O. Box 123, Broadway, Sydney, NSW 2007, Australia
2 Department of Physical Science, Faculty of Science and Technology, Universiti Malaysia Terengganu,21030 Kuala Terengganu, Malaysia
3 BAIC Motor Electric Vehicle Co. Ltd., Chaoyang District, Beijing 100021, China
Correspondence should be addressed to Paul D. Walker; [email protected]
Received 21 August 2013; Accepted 18 October 2013
Academic Editor: Yuan Zou
Copyright © 2013 Paul D. Walker et al.This is an open access article distributed under the Creative Commons Attribution License,which permits unrestricted use, distribution, and reproduction in any medium, provided the original work is properly cited.
Pure electric vehicles (PEVs) provide a unique problem in powertrain design through the meeting of performance specificationswhilst maximising driving range.The consideration of single speed andmultispeed transmissions for electric vehicles provides twostrategies for achieving desired range and performance specifications.Through the implementation of system level vehicle models,design analysis, and optimisation, this paper analyses the application of both single speed and two-speed transmission applicationsto electric vehicles. Initially, transmission ratios are designed based on grade and top speed requirements, and impact on vehicletraction curve is evaluated. Then performance studies are conducted for different transmission ratios using both single speed andtwo-speed powertrain configurations to provide a comparative assessment of the vehicles. Finally, multivariable optimisation in theform of genetic algorithms is employed to determine an optimal gear ratio selection for single speed and two-speed PEVs. Resultsdemonstrate that the two-speed transmission is capable of achieving better results for performance requirements over a single speedtransmission, including vehicle acceleration and grade climbing. However, the lower powertrain efficiency reduces the simulatedrange results.
1. Introduction
Through the development alternative powertrain technolo-gies there has been a trend towards the development of hybridelectric and pure electric vehicles (PEVs), reducing fossil fuelconsumption through higher powertrain efficiencies. PopularPEVs, such as those presented in [1, 2], utilise either singleratio transmissions or direct drive with no gear reductionto deliver traction load to the road. Consequently, gearratio design requires achieving a balance between range,performance, and top speed. Highlighted in [2] early PEVshave a range of approximately 80 km and top speed of65 km/h, as compared to the car presented in [1], with a rangeof 160 km and top speed of 130 km/h. Such improvements invehicle performance are a result of increased energy densityin current battery technologies and motor efficiency. This
paper addresses this design issue through the application of atwo-speed transmission to PEVs.
As PEVs have a much simpler powertrain arrangementwhen compared to hybrid and conventional powertrains,with the electric machine (EM) either directly driving thewheels or using a single speed reduction ratio [1, 3–5], themotor must deliver power over a very wide speed range, thatis, high power at low speed to maximise acceleration perfor-mance and at high speed to overcome higher aerodynamicdrag losses. The use of single speed or direct drive motorsrequires a larger motor with wide torque and speed rangesto achieve both of these objectives. Much like a conventionalpowertrain, by using multiple gear ratios, it is possible toimprove the useful torque and speed range of the EMwithoutincreasing motor size. This strategy is frequently employedin HEVs and plug-in HEVs (PHEVs), such as those reported
2 Advances in Mechanical Engineering
in [6, 7], where it is quite common to make use of smallerEMs operating in conjunction with ICEs.
Design analysis of hybrid and electric vehicles is achievedthrough the development of system level models integratingpower sources (batteries and capacitors), driving compo-nents (engines, motors), and vehicle driveline (transmission,wheels) models. Structuring these models is highly depen-dent on the focus of research, be it component design [8],energy analysis [3, 6, 9], or systemoptimisation [10]. Differentmodelling scenarios and strategies are discussed in [11] fora range of novel powertrain configurations. Model develop-ment of vehicles powertrains provides a significant step inmoving from concept analysis through to prototyping anddevelopment and allows for the flexibility when conductingdetailed studies of the powertrain of interest.
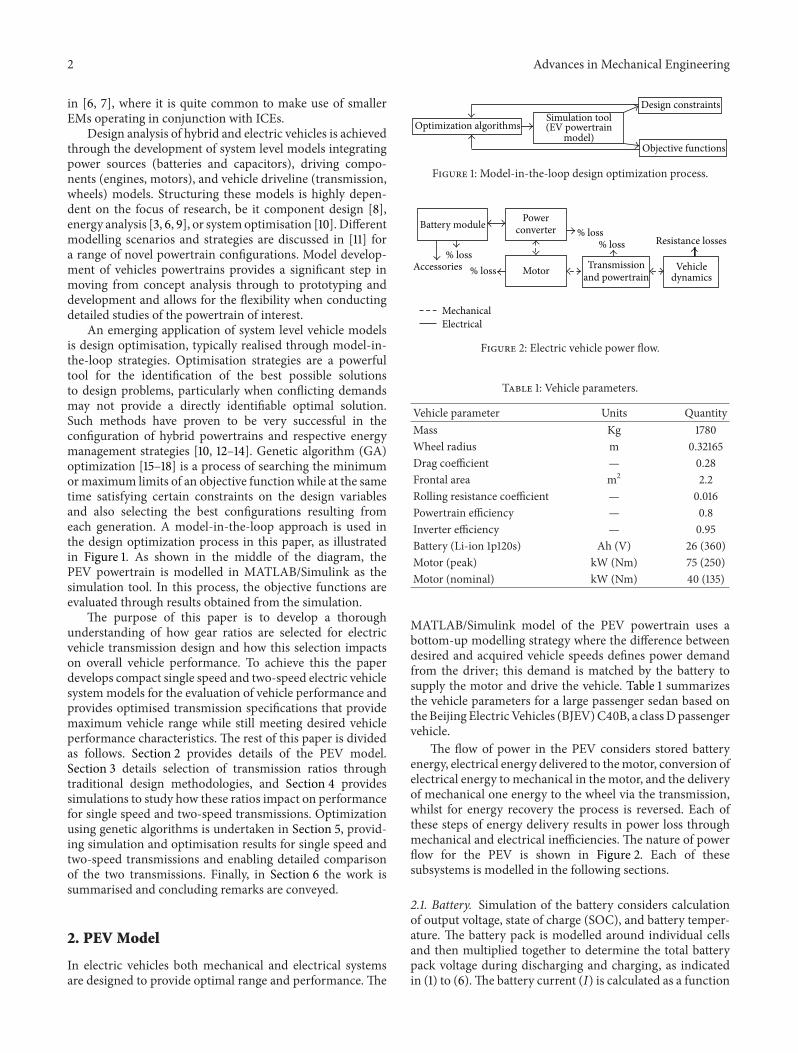
An emerging application of system level vehicle modelsis design optimisation, typically realised through model-in-the-loop strategies. Optimisation strategies are a powerfultool for the identification of the best possible solutionsto design problems, particularly when conflicting demandsmay not provide a directly identifiable optimal solution.Such methods have proven to be very successful in theconfiguration of hybrid powertrains and respective energymanagement strategies [10, 12–14]. Genetic algorithm (GA)optimization [15–18] is a process of searching the minimumormaximum limits of an objective function while at the sametime satisfying certain constraints on the design variablesand also selecting the best configurations resulting fromeach generation. A model-in-the-loop approach is used inthe design optimization process in this paper, as illustratedin Figure 1. As shown in the middle of the diagram, thePEV powertrain is modelled in MATLAB/Simulink as thesimulation tool. In this process, the objective functions areevaluated through results obtained from the simulation.
The purpose of this paper is to develop a thoroughunderstanding of how gear ratios are selected for electricvehicle transmission design and how this selection impactson overall vehicle performance. To achieve this the paperdevelops compact single speed and two-speed electric vehiclesystemmodels for the evaluation of vehicle performance andprovides optimised transmission specifications that providemaximum vehicle range while still meeting desired vehicleperformance characteristics. The rest of this paper is dividedas follows. Section 2 provides details of the PEV model.Section 3 details selection of transmission ratios throughtraditional design methodologies, and Section 4 providessimulations to study how these ratios impact on performancefor single speed and two-speed transmissions. Optimizationusing genetic algorithms is undertaken in Section 5, provid-ing simulation and optimisation results for single speed andtwo-speed transmissions and enabling detailed comparisonof the two transmissions. Finally, in Section 6 the work issummarised and concluding remarks are conveyed.
2. PEV Model
In electric vehicles both mechanical and electrical systemsare designed to provide optimal range and performance. The
Design constraints
Objective functions
Optimization algorithmsSimulation tool(EV powertrain
model)
Figure 1: Model-in-the-loop design optimization process.
MechanicalElectrical
% loss
% loss% loss
% lossAccessories
Powerconverter
Motor Transmissionand powertrain
Vehicledynamics
Battery moduleResistance losses
Figure 2: Electric vehicle power flow.
Table 1: Vehicle parameters.
Vehicle parameter Units QuantityMass Kg 1780Wheel radius m 0.32165Drag coefficient — 0.28Frontal area m2 2.2Rolling resistance coefficient — 0.016Powertrain efficiency — 0.8Inverter efficiency — 0.95Battery (Li-ion 1p120s) Ah (V) 26 (360)Motor (peak) kW (Nm) 75 (250)Motor (nominal) kW (Nm) 40 (135)
MATLAB/Simulink model of the PEV powertrain uses abottom-up modelling strategy where the difference betweendesired and acquired vehicle speeds defines power demandfrom the driver; this demand is matched by the battery tosupply the motor and drive the vehicle. Table 1 summarizesthe vehicle parameters for a large passenger sedan based ontheBeijing ElectricVehicles (BJEV)C40B, a classDpassengervehicle.
The flow of power in the PEV considers stored batteryenergy, electrical energy delivered to themotor, conversion ofelectrical energy to mechanical in the motor, and the deliveryof mechanical one energy to the wheel via the transmission,whilst for energy recovery the process is reversed. Each ofthese steps of energy delivery results in power loss throughmechanical and electrical inefficiencies. The nature of powerflow for the PEV is shown in Figure 2. Each of thesesubsystems is modelled in the following sections.
2.1. Battery. Simulation of the battery considers calculationof output voltage, state of charge (SOC), and battery temper-ature. The battery pack is modelled around individual cellsand then multiplied together to determine the total batterypack voltage during discharging and charging, as indicatedin (1) to (6).The battery current (𝐼) is calculated as a function
Advances in Mechanical Engineering 3
of demand power (𝑃𝐷) and battery output voltage (𝑉out) as
follows:
𝐼 =𝑃𝐷
𝑉OUT. (1)
Thus,𝑉OUT is considered the actual voltage across the batterymodule which is either supplying the motor or supplied tothe battery when the motor is acting as a generator. Thecell open circuit voltage (𝑉OC) and internal resistance forcharging (𝑅INT,CHARGE) and discharging (𝑅INT,DISCHARGE) aremodelled using lookup tables as a function of temperature(Temp) and state of charge (SOC)
𝑉OC = 𝑉OC,Cell (Temp, SOC) × 𝐵CELLS. (2)
The internal resistance of the batteries during charging anddischarging is
𝑅INT,CHARGE = 𝑅INT,CHARGE (Temp, SOC) × 𝐵CELLS, (3)
𝑅INT,DISCHARGE = 𝑅INT,DISCHARGE (Temp, SOC) × 𝐵CELLS.(4)
The output voltage of the battery pack during charging anddischarging is
𝑉OUT,CHARGE = 𝑉OC − 𝑅INT,CHARGE × 𝐼, (5)
𝑉OUT,DISCHARGE = 𝑉OC − 𝑅INT,DISCHARGE × 𝐼 × 𝜂𝐶. (6)
State of charge (SOC) calculation is an iterative processdependent on power demand from the motor or powersupply from regenerative braking. The rate of current supplyis taken from the initial capacity of the battery and absoluteSOC determined, based on change over time from initialSOC. State of charge range is taken from the original BJEVplatform with a minimum SOC of 10% and maximum SOCof 90%.
Maximum battery capacity (CAPMAX) is determinedfrom the battery configuration and is temperature dependentand the used capacity (CAPUSED) from supply or demand ofthe EM.The absolute SOC is defined as
SOC =(CAPMAX − CAPUSED)
CAPMAX. (7)
A simple heat transfer model is used to evaluate heatingand cooling of the batteries as required. The thermal modeluses the heat generated from internal resistance to heat thebattery and convection of an individual cells surface providescooling. Two cases of convection are employed: (1) freeconvection if the battery temperature is below the minimumrequired for cooling and (2) forced convection if activecooling is required. It is assumed that the temperature of eachcell is equal throughout the battery pack. The heat energy(𝐸CELL) created in a battery cell results from the currentsupplied to the cell multiplied by the internal voltage in thecell:
𝐸CELL =(𝑉OC − 𝑉OUT) × 𝐼
𝐵CELLS. (8)
Torq
ue (N
m)
Motor speed (rad/s)200 300 400 500 600 700 800
50
100
150
200
250
100
50100150200250
Torq
ue (N
m)
Max. motor torque
Figure 3: Maximum torque and efficiency plots of the electricmachine.
The heat lost from each cell is determined through free andforced convection (𝐸COOL) as
𝐸COOL = ℎ𝐴CELL (𝑇CELL − 𝑇AMB) . (9)
For the convection coefficient, ℎ is dependent on freeconvection or forced convection with cooling of the cells.The difference between energy generated and energy lostthrough convection results in heating of the battery cell. Thetemperature of the cell (𝑇CELL) is, with 𝑀CELL being mass ofeach cell and CPCELL being the specific heat, then
𝑇CELL = ∫𝐸CELL − 𝐸COOL𝑀CELL𝐶𝑃CELL
dt. (10)
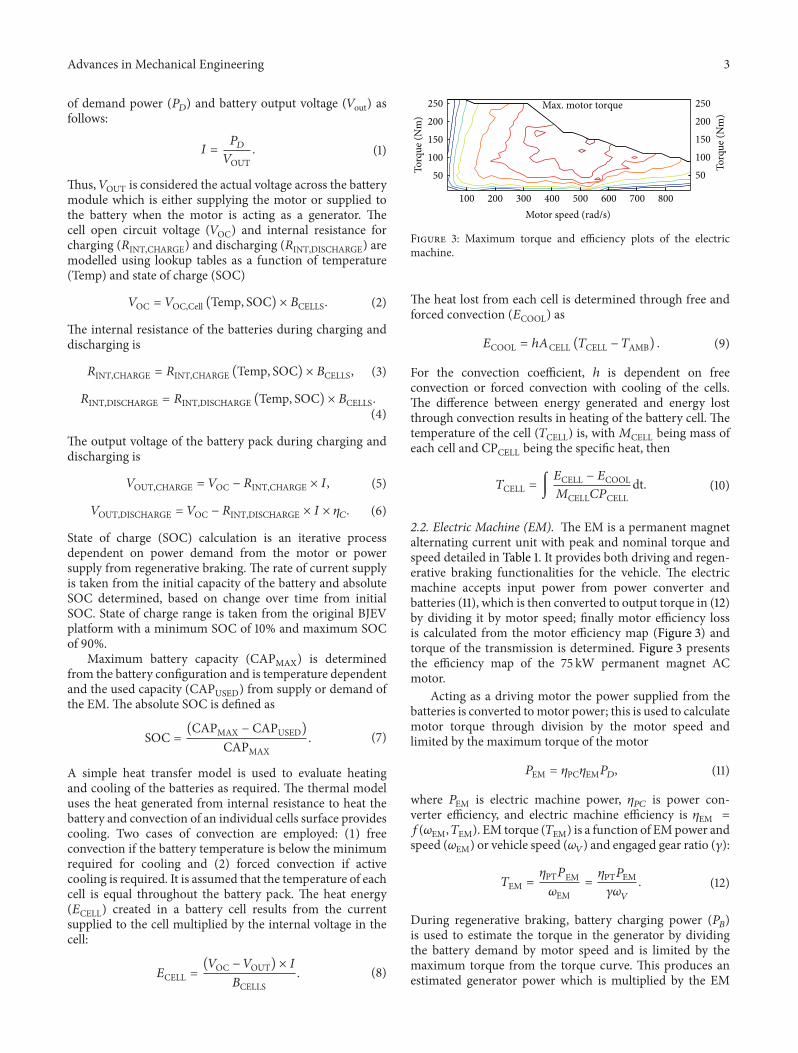
2.2. Electric Machine (EM). The EM is a permanent magnetalternating current unit with peak and nominal torque andspeed detailed in Table 1. It provides both driving and regen-erative braking functionalities for the vehicle. The electricmachine accepts input power from power converter andbatteries (11), which is then converted to output torque in (12)by dividing it by motor speed; finally motor efficiency lossis calculated from the motor efficiency map (Figure 3) andtorque of the transmission is determined. Figure 3 presentsthe efficiency map of the 75 kW permanent magnet ACmotor.
Acting as a driving motor the power supplied from thebatteries is converted tomotor power; this is used to calculatemotor torque through division by the motor speed andlimited by the maximum torque of the motor
𝑃EM = 𝜂PC𝜂EM𝑃𝐷, (11)
where 𝑃EM is electric machine power, 𝜂𝑃𝐶
is power con-verter efficiency, and electric machine efficiency is 𝜂EM =
𝑓(𝜔EM, 𝑇EM). EM torque (𝑇EM) is a function of EMpower andspeed (𝜔EM) or vehicle speed (𝜔𝑉) and engaged gear ratio (𝛾):
𝑇EM =𝜂PT𝑃EM𝜔EM
=𝜂PT𝑃EM𝛾𝜔𝑉
. (12)
During regenerative braking, battery charging power (𝑃𝐵)
is used to estimate the torque in the generator by dividingthe battery demand by motor speed and is limited by themaximum torque from the torque curve. This produces anestimated generator power which is multiplied by the EM
4 Advances in Mechanical Engineering
and power converter efficiency to determine actual powersupplied to the battery module
𝑃𝐵= 0.3𝜂PC𝜂EM𝑃EM, (13)
𝑃EM = 𝜂PT𝑇EM𝜔EM = 𝜂PT𝑇EM𝛾𝜔𝑉. (14)
2.3. Transmission. For these simulations a simple transmis-sion model is used, where, according to the defined shift mapfrom vehicle speed and motor torque, required gear, G1 orG2, is selected. Separate maps are required for up- and down-shifts. For this model only the overall gear ratio is provided;the final drive ratio must be divided into the output ratios todetermine actual gear ratio. Shift logic for the transmissionproceeds as follows.
(1) For the upshift logic the vehicle speed is used todetermine the target torque for shifting; if motortorque is less than the target torque an upshift isinitiated as the motor is in a lower efficiency region.
(2) Alternatively, for the downshift, using the downshiftmap, if motor torque exceeds the target torque,the motor is now in a low efficiency region and adownshift is initiated.
(3) For braking events, similar logic as described abovefollows, such that, once motor speed is too low, thehighest ratio is selected.
(4) If the vehicle is stopped, the shift map is overriddenand the first gear is selected.
2.4. Vehicle. The vehicle model takes all the input torques,calculates vehicle acceleration and performs numerical inte-gration to determine vehicle speed. Thus a single degree offreedom representing torsional equivalent vehicle inertia isused in place of the linear system, and conversion betweenrotational and linear systems is completed after integration.Inputs are supplied motor/generator torque, brake torque,and vehicle resistance torque, and the output is vehicle speed.Equation of motion for the vehicle is
𝑀𝑉𝑟2
𝑡𝛼 = 𝜂PT𝑇EM ⋅ 𝛾 − 𝑇
𝑉− 𝑇𝐵, (15)
where 𝑟𝑡is the tyre radius and𝑀
𝑉is vehicle mass.The vehicle
resistance torque, 𝑇𝑉, is the combination of rolling resistance
loss, incline load, and air drag loss, 𝑇𝐵is mechanical brake
torque, this is defined in the braking model section, and 𝜂PTis the powertrain efficiency. Resistance forces are convertedto a torque through multiplication by the tyre radius. Vehicleresistance torque is defined as
𝑇𝑉= (𝐶𝑅𝑀V𝑔 cos 0 + 𝑀
𝑉𝑔 sin 0 +
1
2𝐶𝐷𝜌𝐴𝑉𝑉2
𝑉) × 𝑟𝑡,
(16)
where 𝐶𝑅is rolling resistance, 𝑔 is gravity, 0 is road incline
angle,𝐶𝐷is drag coefficient,𝜌 is air density,𝐴
𝑉is frontal area,
and 𝑉𝑉is linear vehicle speed.
2.5. Mechanical Braking. The integration of mechanical andregenerative braking is strategically important to maximisethe energy recovered whilst maintaining passenger safety.To simulate this successfully the required brake torque isestimated from the driver demand model in the controllerand mechanical braking is portioned depending on brakingrequirement. Regenerative braking and mechanical brakingare proportioned as follows.
(1) If demand brake torque exceeds regenerative braketorque, apply mechanical brakes to meet difference intorque limits.
(2) If vehicle speed is less than 15 kph, apply mechanicalbraking only.
This produces a brake model that is a function of driverdemand, regenerative braking, driving conditions, and braketorque limit. Under regenerative braking conditions braketorque is calculated as
𝑇𝐵=
𝑃𝐷
𝜔𝑉
− 𝛾𝑇EM. (17)
Below the 15 kph limit, with a limiting torque, it is calculatedas
𝑇𝐵=
𝑃𝐷
𝜔𝑉
. (18)
2.6. Driver. Thedriver is modelled as a PID controller, wherethe difference between desired and actual vehicle speed isused to output the demand power. Based on these speedsand the demanded power, the vehicle state is determined aseither accelerating, braking, or stopping. This drives the EM,transmission, and battery module operation.
3. Ratio Design for Electric Vehicles
3.1. Ratio Design for Grade. The design of gear ratios forthe capability to climb inclines is considered important forentering and leaving steep driveways and parking structures.The largest overall gear ratio required for the powertrain is setbased on the ratio of rolling resistance for a specified grade of30% divided by themaximummotor torquemultiplied by theoverall powertrain efficiency; this is given in (19) [19]. For lowspeeds the aerodynamic drag is assumed to be zero. Here themaximummotor torque 𝑇EM is 260Nm. Consider
𝛾max =𝑟𝑡𝑚𝑉𝑔 (𝐶𝑅cosΦ + sinΦ)
(𝑇EM𝜂PT). (19)
This produces a minimum ratio of 8.17 for the first gear toachieve a 30% grade climb at low speed.
3.2. Ratio Design for Speed. Vehicle top speed varies signifi-cantly depending on application and is reasonably importantfor consumer acceptance. The maximum speed achieved inthe vehicle can then be used to determine the lowest possibleratio. It must consider the motor characteristics in terms of
Advances in Mechanical Engineering 5
maximum rotating speed (𝑁𝑚) and the ability of the motor
torque to reach this top speed. The minimum ratio is definedby the maximummotor speed [19], converted to kph dividedby the maximum vehicle speed
𝛾min,speed =3.6𝜋𝑁
𝑚𝑟𝑡
(30Vmax). (20)
The resulting ratio is 𝛾min,speed = 5.7.This ratio can be checkedagainst the capability of the motor to supply torque at thisspeed by dividing the rolling resistance and aerodynamicdrag by the maximummotor torque at its maximum speed:
𝛾min,torque =(𝐶𝑅𝑚V𝑔 cos 0 + (1/2) 𝐶𝐷𝜌𝐴𝑉𝑉
2
𝑉) × 𝑟𝑡
(𝜂PT𝑇EM,@maxRPM)
. (21)
The resulting ratio is 𝛾min,torque = 5.12, suggesting that themotor is capable of supplying torque at the maximum vehiclespeed for gear ratios including the design ratio of 5.7.
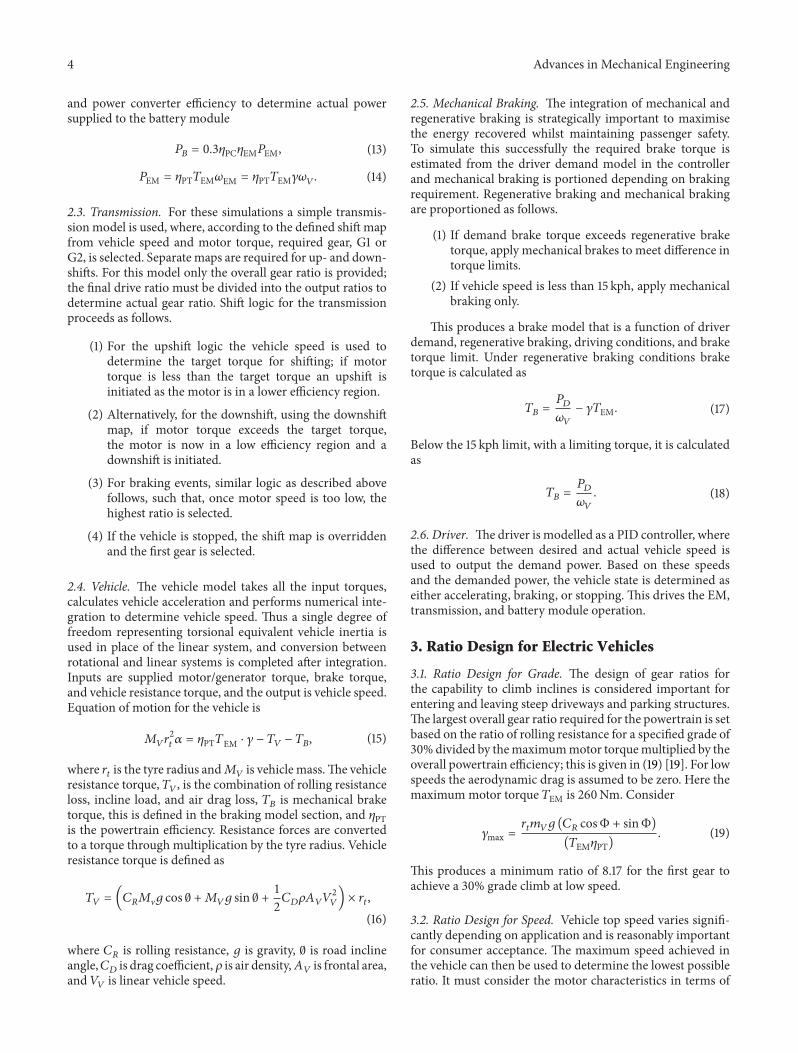
3.3. Traction Curve. Traction curves can be used to demon-strate how multiple transmission gear ratios can effectivelyincrease the operating functionality of PEV electric machinesand are frequently used to study the application of ICE loadsin conjunction with transmission ratio; see [19] for detailson traction load. This curve is defined using the maximummotor power as follows:
𝐹𝑇= 𝜂PT
𝑃max𝑉
. (22)
The adhesion limit is the force required for the wheels totransit from rolling to sliding, and for a frontwheel drive it is afunction of 𝐶
𝑊weight distribution and 𝜇
𝑆tyre static friction
coefficient
𝐹𝐴= 𝐶𝑊𝜇𝑆𝑔𝑀V. (23)
As a function of vehicle speed, tractive load is a hyperboliccurve and represents the theoretically maximum tractiveload delivered by the EM to the wheels. For conventionalvehicles the maximum load is available for only a very smallregion in each gear; thus many gear ratios are requiredto achieve the best possible use of the engine. For EMswith constant power regions the maximum tractive loadcan be delivered over a wider region, and fewer gears arerequired.The application of a two-speed transmission can beused to increase the range of applied load to maximise topspeed and increase the maximum tractive force to improveacceleration and grade climbing capabilities. In Figures 4(a)and 4(b) the tractive loads are shown for the EM drivingthe vehicle through both gears 1 and 2 for maximum powerand nominal power output, respectively. This demonstratesclearly the effects of conflicting performance requirementson ratio selection, where for higher ratios (i.e., gear 1) higherload is delivered to the road, at a cost of top speed, reachingapproximately 100 kph only. Whilst using lower ratios (i.e.,gear 2), a significantly higher speed is achieved at a cost ofroad load and vehicle acceleration.
Table 2: Vehicle performance simulation for single speed and two-speed transmission EV.
Parameter Units Two-speed One-speedGear ratio(s) 5.7/8.17 8.17 5.7Powertrain efficiency — 0.8 0.9 0.9Range HWFET km 141.5 151.2 157.3Range UDDS km 129.9 142.1 140.2Acceleration 0–100 km/h s 14.5 11.6 13.5Acceleration 0–60 km/h s 6.3 4.8 6.5Acceleration 50–80 km/h s 4.7 4.0 4.2Grade climbing % 30 34 23Top speed Km/h 180 126 180
4. Comparison of Single Speed and Two-SpeedEV Powertrain Performance
The key consideration that divides single speed and two-speed transmissions is the difference in efficiencies betweensingle speed and multispeed transmissions, for a multi-speed automatic transmission efficiencies trend in the regionbetween 85 and 95% [20]. Contributions to these lossesinclude friction and spin losses in the gear train and asso-ciated components and the need to power hydraulic controlcomponents. Through the inclusion of other losses suchas differential and additional power consumed through thecontrol system, the efficiency in Table 1 is assumed to berepresentative of overall loss in the two-speed drivetrain.As a single speed has a simple transmission design and fewcomponents, the vehicle mass is reduced to 1720 kg, andthe powertrain efficiency is increased to 90%. Simulationsare conducted using both the highway fuel economy drivingschedule (HWFET) and the urban dynamometer drivingschedule (UDDS) drive cycles. HWFET is considered to bea reasonable approximation of highway style driving, whilstUDDS is associated with city style driving.
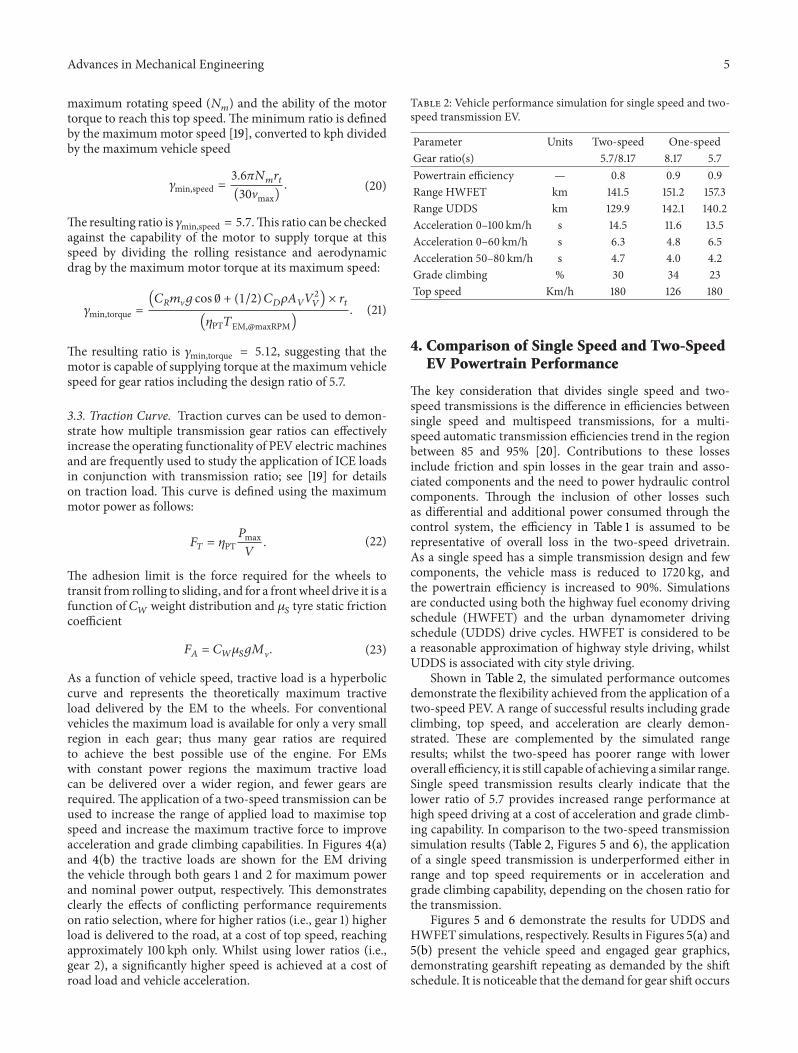
Shown in Table 2, the simulated performance outcomesdemonstrate the flexibility achieved from the application of atwo-speed PEV. A range of successful results including gradeclimbing, top speed, and acceleration are clearly demon-strated. These are complemented by the simulated rangeresults; whilst the two-speed has poorer range with loweroverall efficiency, it is still capable of achieving a similar range.Single speed transmission results clearly indicate that thelower ratio of 5.7 provides increased range performance athigh speed driving at a cost of acceleration and grade climb-ing capability. In comparison to the two-speed transmissionsimulation results (Table 2, Figures 5 and 6), the applicationof a single speed transmission is underperformed either inrange and top speed requirements or in acceleration andgrade climbing capability, depending on the chosen ratio forthe transmission.
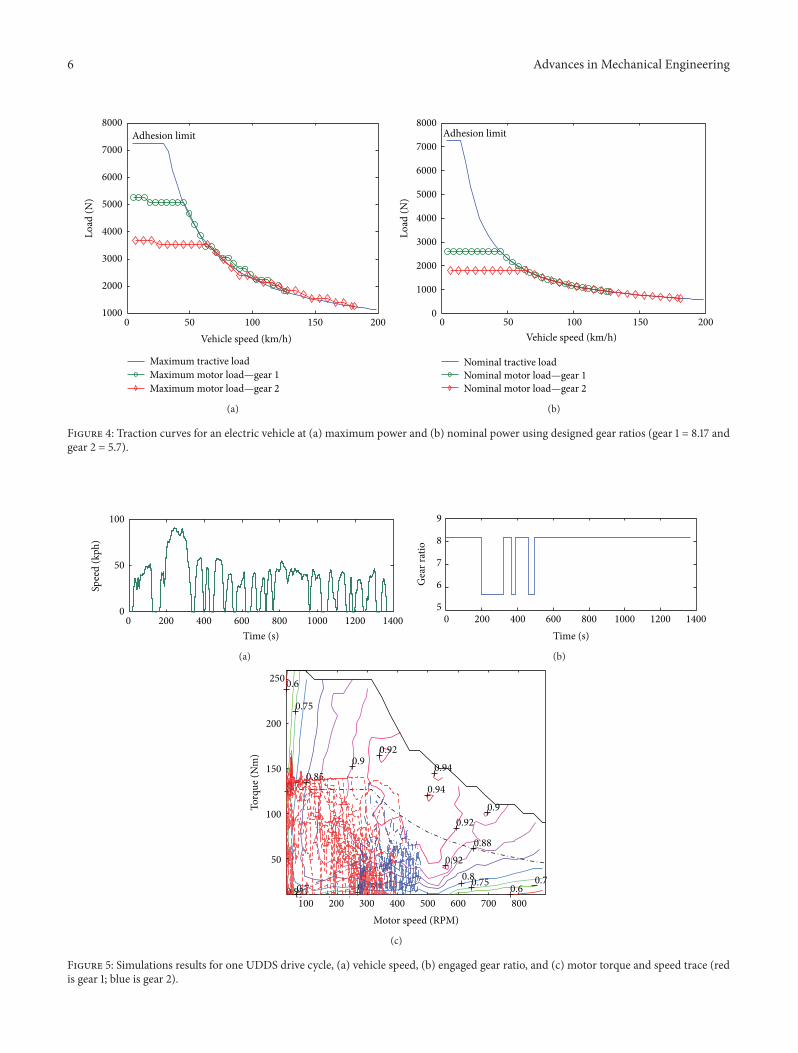
Figures 5 and 6 demonstrate the results for UDDS andHWFET simulations, respectively. Results in Figures 5(a) and5(b) present the vehicle speed and engaged gear graphics,demonstrating gearshift repeating as demanded by the shiftschedule. It is noticeable that the demand for gear shift occurs
6 Advances in Mechanical Engineering
0 50 100 150 2001000
2000
3000
4000
5000
6000
7000
8000
Vehicle speed (km/h)
Adhesion limit
Maximum tractive loadMaximum motor load—gear 1Maximum motor load—gear 2
Load
(N)
(a)
0 50 100 2001500
1000
2000
3000
4000
5000
6000
7000
8000
Vehicle speed (km/h)
Load
(N)
Adhesion limit
Nominal tractive loadNominal motor load—gear 1Nominal motor load—gear 2
(b)
Figure 4: Traction curves for an electric vehicle at (a) maximum power and (b) nominal power using designed gear ratios (gear 1 = 8.17 andgear 2 = 5.7).
0 200 400 600 800 1000 1200 14000
50
100
Time (s)
Spee
d (k
ph)
(a)
0 200 400 600 800 1000 1200 14005
6
7
8
9
Time (s)
Gea
r rat
io
(b)
0.6
0.6
0.7
0.70.7
0.75
0.75 0.750.8
0.85
0.88
0.9
0.90.92
0.92
0.92
0.92
0.94
0.94
Motor speed (RPM)
Torq
ue (N
m)
100 200 300 400 500 600 700 800
50
100
150
200
250
(c)
Figure 5: Simulations results for one UDDS drive cycle, (a) vehicle speed, (b) engaged gear ratio, and (c) motor torque and speed trace (redis gear 1; blue is gear 2).
Advances in Mechanical Engineering 7
0 200 400 600 8000
50
100
Time (s)
Spee
d (k
ph)
(a)
0 200 400 600 8005
6
7
8
9
Time (s)
Gea
r rat
io
(b)
0.92
0.6
0.6
0.7
0.7
0.75
0.75 0.750.8
0.85
0.88
0.9
0.90.92
0.92
0.92
0.940.94
Motor speed (rad/s)
Torq
ue (N
m)
100 200 300 400 500 600 700 800
50
100
150
200
250
(c)
Figure 6: Simulations results for one HWFET drive cycle, (a) vehicle speed, (b) engaged gear ratio, and (c) motor torque and speed trace(red is gear 1; blue is gear 2).
infrequently, predominantly as UDDS cycle is primarily a lowspeed drive style and the shift region for upshifting is aboveabout 55 km/h. In Figure 5(c) themotor speed trace of torqueagainst speed is shown such that the operating condition ofthe motor can be studied. It is demonstrated here that, whilethe motor is operating in a wide range of driving conditions,the operating region is not optimal. A more preferentialregion between 300 and 600 rad/s is obvious based on themotor efficiency map; see Figure 3. The gear changes intothe second gear also show that the EM operating region isreasonable, in comparison to the first gear. The motor traceresults in Figure 6(c) indicate that the operating region forthe second gear is reasonable for this drive cycle but notnecessarily optimal.
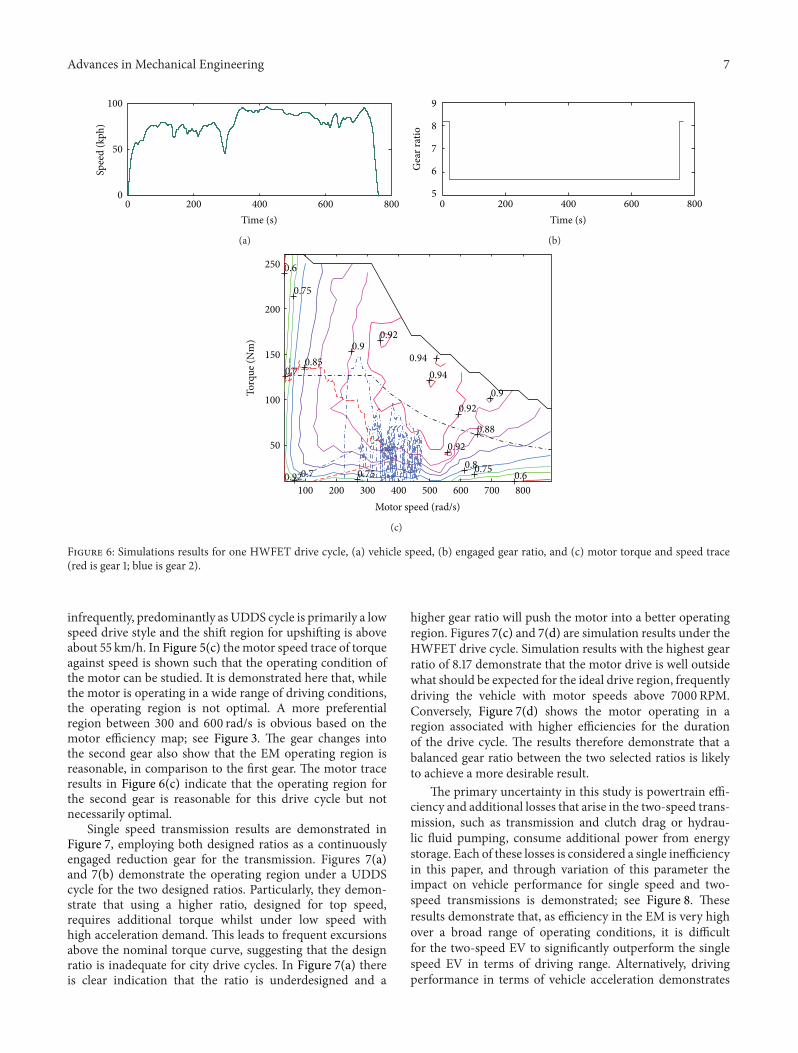
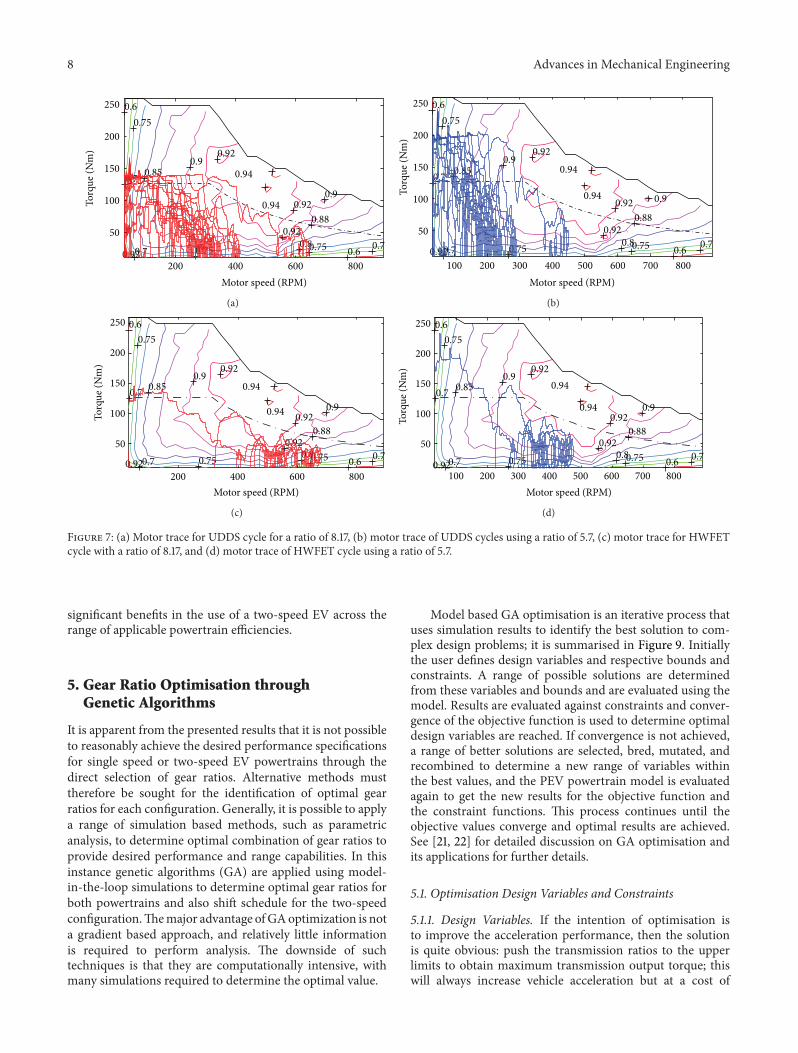
Single speed transmission results are demonstrated inFigure 7, employing both designed ratios as a continuouslyengaged reduction gear for the transmission. Figures 7(a)and 7(b) demonstrate the operating region under a UDDScycle for the two designed ratios. Particularly, they demon-strate that using a higher ratio, designed for top speed,requires additional torque whilst under low speed withhigh acceleration demand. This leads to frequent excursionsabove the nominal torque curve, suggesting that the designratio is inadequate for city drive cycles. In Figure 7(a) thereis clear indication that the ratio is underdesigned and a
higher gear ratio will push the motor into a better operatingregion. Figures 7(c) and 7(d) are simulation results under theHWFET drive cycle. Simulation results with the highest gearratio of 8.17 demonstrate that the motor drive is well outsidewhat should be expected for the ideal drive region, frequentlydriving the vehicle with motor speeds above 7000 RPM.Conversely, Figure 7(d) shows the motor operating in aregion associated with higher efficiencies for the durationof the drive cycle. The results therefore demonstrate that abalanced gear ratio between the two selected ratios is likelyto achieve a more desirable result.
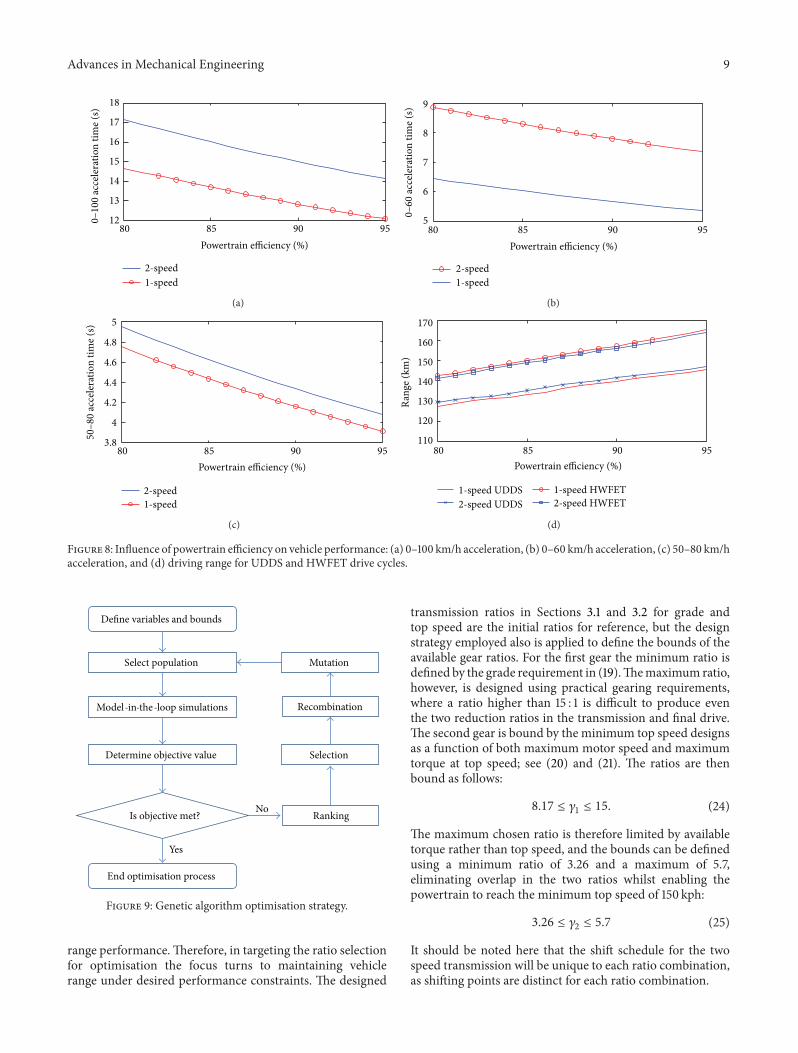
The primary uncertainty in this study is powertrain effi-ciency and additional losses that arise in the two-speed trans-mission, such as transmission and clutch drag or hydrau-lic fluid pumping, consume additional power from energystorage. Each of these losses is considered a single inefficiencyin this paper, and through variation of this parameter theimpact on vehicle performance for single speed and two-speed transmissions is demonstrated; see Figure 8. Theseresults demonstrate that, as efficiency in the EM is very highover a broad range of operating conditions, it is difficultfor the two-speed EV to significantly outperform the singlespeed EV in terms of driving range. Alternatively, drivingperformance in terms of vehicle acceleration demonstrates
8 Advances in Mechanical Engineering
0.6
0.6
0.7
0.7 0.7
0.75
0.75 0.750.8
0.85
0.88
0.9
0.9
0.92
0.92
0.92
0.92
0.94
0.94
Motor speed (RPM)
Torq
ue (N
m)
200 400 600 800
50
100
150
200
250
(a)
0.6
0.6
0.7
0.7 0.7
0.75
0.75 0.750.8
0.85
0.88
0.9
0.9
0.92
0.92
0.92
0.92
0.94
0.94
Motor speed (RPM)
Torq
ue (N
m)
100 200 300 400 500 600 700 800
50
100
150
200
250
(b)
0.6
0.6
0.7
0.7 0.7
0.75
0.75 0.750.8
0.85
0.88
0.9
0.9
0.92
0.92
0.92
0.92
0.94
0.94
Motor speed (RPM)
Torq
ue (N
m)
200 400 600 800
50
100
150
200
250
(c)
0.6
0.6
0.7
0.7 0.7
0.75
0.75 0.750.8
0.85
0.88
0.9
0.9
0.92
0.92
0.92
0.92
0.94
0.94
Motor speed (RPM)
Torq
ue (N
m)
100 200 300 400 500 600 700 800
50
100
150
200
250
(d)
Figure 7: (a) Motor trace for UDDS cycle for a ratio of 8.17, (b) motor trace of UDDS cycles using a ratio of 5.7, (c) motor trace for HWFETcycle with a ratio of 8.17, and (d) motor trace of HWFET cycle using a ratio of 5.7.
significant benefits in the use of a two-speed EV across therange of applicable powertrain efficiencies.
5. Gear Ratio Optimisation throughGenetic Algorithms
It is apparent from the presented results that it is not possibleto reasonably achieve the desired performance specificationsfor single speed or two-speed EV powertrains through thedirect selection of gear ratios. Alternative methods musttherefore be sought for the identification of optimal gearratios for each configuration. Generally, it is possible to applya range of simulation based methods, such as parametricanalysis, to determine optimal combination of gear ratios toprovide desired performance and range capabilities. In thisinstance genetic algorithms (GA) are applied using model-in-the-loop simulations to determine optimal gear ratios forboth powertrains and also shift schedule for the two-speedconfiguration.Themajor advantage ofGAoptimization is nota gradient based approach, and relatively little informationis required to perform analysis. The downside of suchtechniques is that they are computationally intensive, withmany simulations required to determine the optimal value.
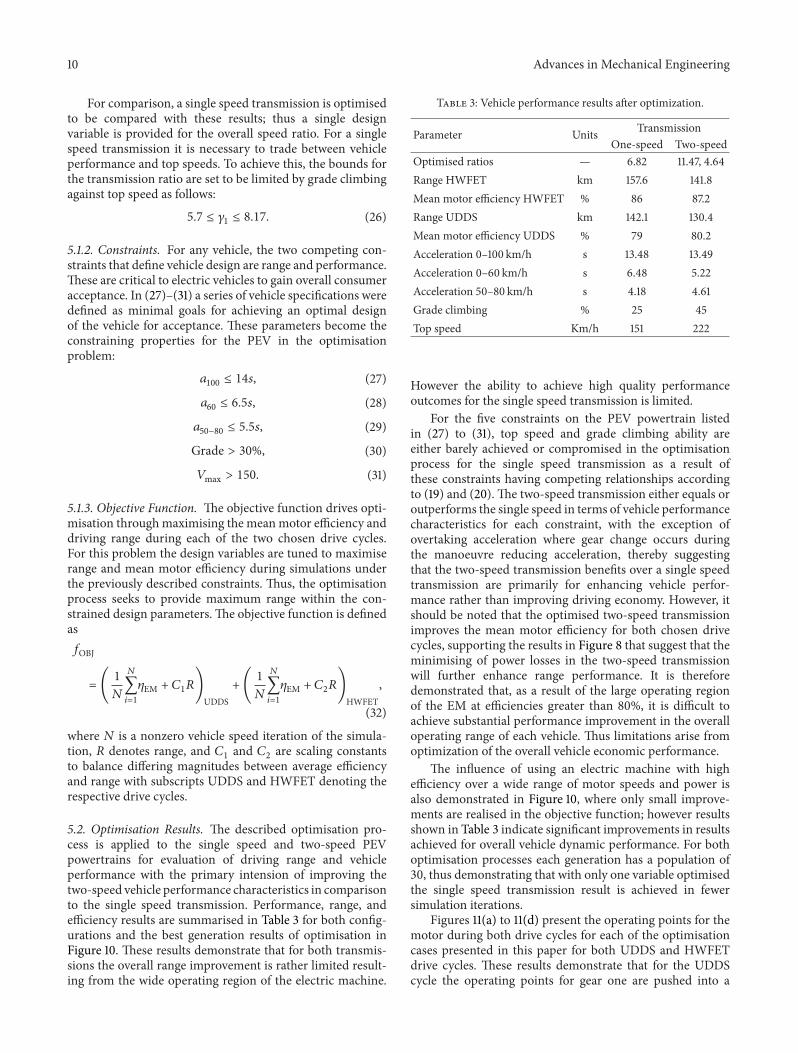
Model based GA optimisation is an iterative process thatuses simulation results to identify the best solution to com-plex design problems; it is summarised in Figure 9. Initiallythe user defines design variables and respective bounds andconstraints. A range of possible solutions are determinedfrom these variables and bounds and are evaluated using themodel. Results are evaluated against constraints and conver-gence of the objective function is used to determine optimaldesign variables are reached. If convergence is not achieved,a range of better solutions are selected, bred, mutated, andrecombined to determine a new range of variables withinthe best values, and the PEV powertrain model is evaluatedagain to get the new results for the objective function andthe constraint functions. This process continues until theobjective values converge and optimal results are achieved.See [21, 22] for detailed discussion on GA optimisation andits applications for further details.
5.1. Optimisation Design Variables and Constraints
5.1.1. Design Variables. If the intention of optimisation isto improve the acceleration performance, then the solutionis quite obvious: push the transmission ratios to the upperlimits to obtain maximum transmission output torque; thiswill always increase vehicle acceleration but at a cost of
Advances in Mechanical Engineering 9
85 9080 95Powertrain efficiency (%)
2-speed1-speed
18
17
16
15
14
13
120–10
0 ac
cele
ratio
n tim
e (s)
(a)
80 85 90 955
6
7
8
9
Powertrain efficiency (%)
0–60
acce
lera
tion
time (
s)
2-speed1-speed
(b)
8580 90 95Powertrain efficiency (%)
2-speed1-speed
50–8
0 ac
cele
ratio
n tim
e (s)
3.8
4
4.2
4.4
4.6
4.8
5
(c)
80 85 9590110
120
130
140
150
160
170
Powertrain efficiency (%)
1-speed UDDS2-speed UDDS
1-speed HWFET2-speed HWFET
Rang
e (km
)
(d)
Figure 8: Influence of powertrain efficiency on vehicle performance: (a) 0–100 km/h acceleration, (b) 0–60 km/h acceleration, (c) 50–80 km/hacceleration, and (d) driving range for UDDS and HWFET drive cycles.
Define variables and bounds
Select population
Model-in-the-loop simulations
Determine objective value
Is objective met?
End optimisation process
Ranking
Selection
Recombination
Mutation
Yes
No
Figure 9: Genetic algorithm optimisation strategy.
range performance.Therefore, in targeting the ratio selectionfor optimisation the focus turns to maintaining vehiclerange under desired performance constraints. The designed
transmission ratios in Sections 3.1 and 3.2 for grade andtop speed are the initial ratios for reference, but the designstrategy employed also is applied to define the bounds of theavailable gear ratios. For the first gear the minimum ratio isdefined by the grade requirement in (19).Themaximum ratio,however, is designed using practical gearing requirements,where a ratio higher than 15 : 1 is difficult to produce eventhe two reduction ratios in the transmission and final drive.The second gear is bound by the minimum top speed designsas a function of both maximum motor speed and maximumtorque at top speed; see (20) and (21). The ratios are thenbound as follows:
8.17 ≤ 𝛾1≤ 15. (24)
The maximum chosen ratio is therefore limited by availabletorque rather than top speed, and the bounds can be definedusing a minimum ratio of 3.26 and a maximum of 5.7,eliminating overlap in the two ratios whilst enabling thepowertrain to reach the minimum top speed of 150 kph:
3.26 ≤ 𝛾2≤ 5.7 (25)
It should be noted here that the shift schedule for the twospeed transmission will be unique to each ratio combination,as shifting points are distinct for each ratio combination.
10 Advances in Mechanical Engineering
For comparison, a single speed transmission is optimisedto be compared with these results; thus a single designvariable is provided for the overall speed ratio. For a singlespeed transmission it is necessary to trade between vehicleperformance and top speeds. To achieve this, the bounds forthe transmission ratio are set to be limited by grade climbingagainst top speed as follows:
5.7 ≤ 𝛾1≤ 8.17. (26)
5.1.2. Constraints. For any vehicle, the two competing con-straints that define vehicle design are range and performance.These are critical to electric vehicles to gain overall consumeracceptance. In (27)–(31) a series of vehicle specifications weredefined as minimal goals for achieving an optimal designof the vehicle for acceptance. These parameters become theconstraining properties for the PEV in the optimisationproblem:
𝑎100
≤ 14𝑠, (27)
𝑎60
≤ 6.5𝑠, (28)
𝑎50−80
≤ 5.5𝑠, (29)
Grade > 30%, (30)
𝑉max > 150. (31)
5.1.3. Objective Function. The objective function drives opti-misation throughmaximising the meanmotor efficiency anddriving range during each of the two chosen drive cycles.For this problem the design variables are tuned to maximiserange and mean motor efficiency during simulations underthe previously described constraints. Thus, the optimisationprocess seeks to provide maximum range within the con-strained design parameters. The objective function is definedas𝑓OBJ
= (1
𝑁
𝑁
∑
𝑖=1
𝜂EM + 𝐶1𝑅)
UDDS
+ (1
𝑁
𝑁
∑
𝑖=1
𝜂EM + 𝐶2𝑅)
HWFET
,
(32)
where 𝑁 is a nonzero vehicle speed iteration of the simula-tion, 𝑅 denotes range, and 𝐶
1and 𝐶
2are scaling constants
to balance differing magnitudes between average efficiencyand range with subscripts UDDS and HWFET denoting therespective drive cycles.
5.2. Optimisation Results. The described optimisation pro-cess is applied to the single speed and two-speed PEVpowertrains for evaluation of driving range and vehicleperformance with the primary intension of improving thetwo-speed vehicle performance characteristics in comparisonto the single speed transmission. Performance, range, andefficiency results are summarised in Table 3 for both config-urations and the best generation results of optimisation inFigure 10. These results demonstrate that for both transmis-sions the overall range improvement is rather limited result-ing from the wide operating region of the electric machine.
Table 3: Vehicle performance results after optimization.
Parameter Units TransmissionOne-speed Two-speed
Optimised ratios — 6.82 11.47, 4.64Range HWFET km 157.6 141.8Mean motor efficiency HWFET % 86 87.2Range UDDS km 142.1 130.4Mean motor efficiency UDDS % 79 80.2Acceleration 0–100 km/h s 13.48 13.49Acceleration 0–60 km/h s 6.48 5.22Acceleration 50–80 km/h s 4.18 4.61Grade climbing % 25 45Top speed Km/h 151 222
However the ability to achieve high quality performanceoutcomes for the single speed transmission is limited.
For the five constraints on the PEV powertrain listedin (27) to (31), top speed and grade climbing ability areeither barely achieved or compromised in the optimisationprocess for the single speed transmission as a result ofthese constraints having competing relationships accordingto (19) and (20). The two-speed transmission either equals oroutperforms the single speed in terms of vehicle performancecharacteristics for each constraint, with the exception ofovertaking acceleration where gear change occurs duringthe manoeuvre reducing acceleration, thereby suggestingthat the two-speed transmission benefits over a single speedtransmission are primarily for enhancing vehicle perfor-mance rather than improving driving economy. However, itshould be noted that the optimised two-speed transmissionimproves the mean motor efficiency for both chosen drivecycles, supporting the results in Figure 8 that suggest that theminimising of power losses in the two-speed transmissionwill further enhance range performance. It is thereforedemonstrated that, as a result of the large operating regionof the EM at efficiencies greater than 80%, it is difficult toachieve substantial performance improvement in the overalloperating range of each vehicle. Thus limitations arise fromoptimization of the overall vehicle economic performance.
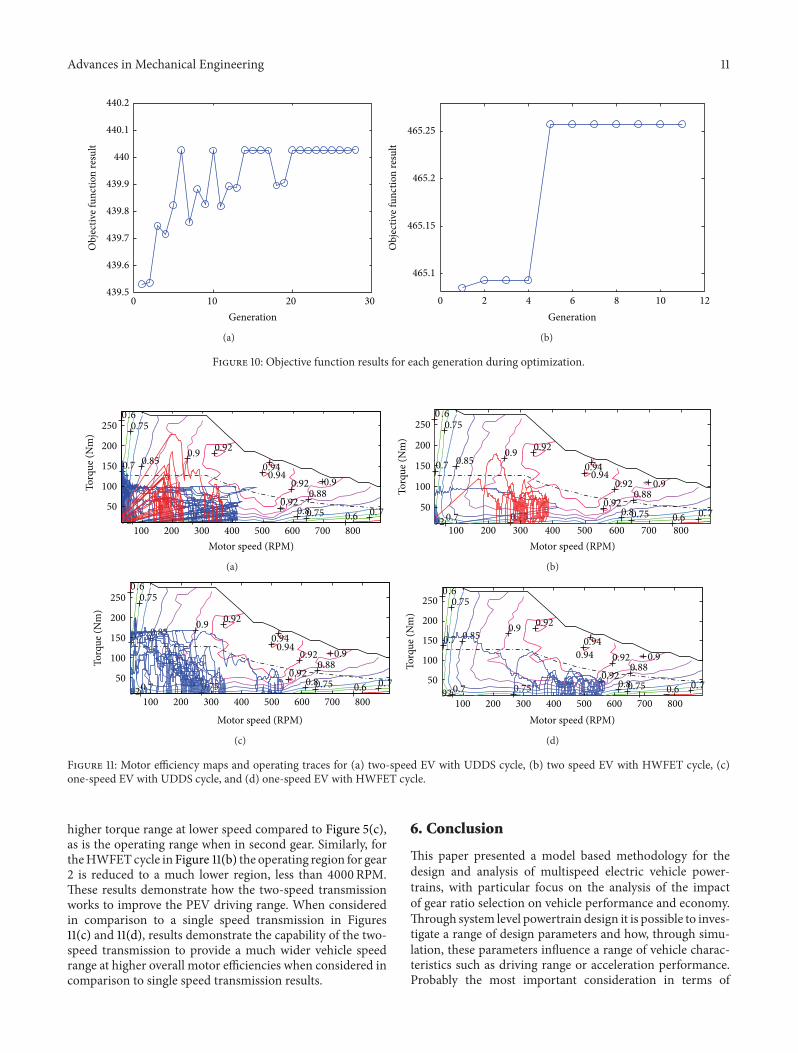
The influence of using an electric machine with highefficiency over a wide range of motor speeds and power isalso demonstrated in Figure 10, where only small improve-ments are realised in the objective function; however resultsshown in Table 3 indicate significant improvements in resultsachieved for overall vehicle dynamic performance. For bothoptimisation processes each generation has a population of30, thus demonstrating that with only one variable optimisedthe single speed transmission result is achieved in fewersimulation iterations.
Figures 11(a) to 11(d) present the operating points for themotor during both drive cycles for each of the optimisationcases presented in this paper for both UDDS and HWFETdrive cycles. These results demonstrate that for the UDDScycle the operating points for gear one are pushed into a
Advances in Mechanical Engineering 11
0 10 20 30439.5
439.6
439.7
439.8
439.9
440
440.1
440.2
Generation
Obj
ectiv
e fun
ctio
n re
sult
(a)
0 2 4 6 8 10 12
465.1
465.15
465.2
465.25
Generation
Obj
ectiv
e fun
ctio
n re
sult
(b)
Figure 10: Objective function results for each generation during optimization.
0.6
0.6
0.7
0.7 0. 7
0.75
0.75 0.750.8
0.85
0.88
0.9
0.9
92
0.92
0.92
0.92
0.940.94
0.94
Motor speed (RPM)
Torq
ue (N
m)
100 200 300 400 500 600 700 800
50
100
150
200
250
(a)
0.6
0.6
0.7
0.7 0. 7
0.75
0.75 0.750.8
0.85
0.88
0.9
0.9
92
0.92
0.92
0.92
0.940.94
0.94
Motor speed (RPM)
Torq
ue (N
m)
100 200 300 400 500 600 700 800
50
100
150
200
250
(b)
0.6
0.6
0.7
0.7 0. 7
0.75
0.75 0.750.8
0.85
0.88
0.9
0.9
92
0.92
0.92
0.92
0.940.94
0.94
Motor speed (RPM)
Torq
ue (N
m)
100 200 300 400 500 600 700 800
50
100
150
200
250
(c)
0.6
0.6
0.7
0.7 0. 7
0.75
0.75 0.750.8
0.85
0.88
0.9
0.9
92
0.92
0.92
0.92
0.940.94
0.94
Motor speed (RPM)
Torq
ue (N
m)
100 200 300 400 500 600 700 800
50
100
150
200
250
(d)
Figure 11: Motor efficiency maps and operating traces for (a) two-speed EV with UDDS cycle, (b) two speed EV with HWFET cycle, (c)one-speed EV with UDDS cycle, and (d) one-speed EV with HWFET cycle.
higher torque range at lower speed compared to Figure 5(c),as is the operating range when in second gear. Similarly, fortheHWFETcycle in Figure 11(b) the operating region for gear2 is reduced to a much lower region, less than 4000RPM.These results demonstrate how the two-speed transmissionworks to improve the PEV driving range. When consideredin comparison to a single speed transmission in Figures11(c) and 11(d), results demonstrate the capability of the two-speed transmission to provide a much wider vehicle speedrange at higher overall motor efficiencies when considered incomparison to single speed transmission results.
6. Conclusion
This paper presented a model based methodology for thedesign and analysis of multispeed electric vehicle power-trains, with particular focus on the analysis of the impactof gear ratio selection on vehicle performance and economy.Through system level powertrain design it is possible to inves-tigate a range of design parameters and how, through simu-lation, these parameters influence a range of vehicle charac-teristics such as driving range or acceleration performance.Probably the most important consideration in terms of
12 Advances in Mechanical Engineering
vehicular range and performance is powertrain efficiency; inthis paper it is identified as a significant source of uncertaintyin the analysis and is treated conservatively to illustrate thedifferences between the two transmission options. Detaileddesign study in future research for two-speed transmissionconfigurations will provide a more precise estimate of bothpowertrain efficiencies and improve results achieved herein.The design of transmission ratios for grade climbing and topspeed was considered, and the effect of applying these ratioson the vehicles applicable traction force range is demon-strated. Results of simulations demonstrate that improvedgrade climbing, acceleration, and top speed are achievedthrough the application of a multispeed transmission. Thus,vehicle performance is heavily dependent on transmissiondesign for PEVs. However the economic performance, thatis, energy consumption, is weakly influenced by transmissionratio selection. Alternatively, in a single speed transmissionthere is a difficult balance required to ensure that efficiency,acceleration, and top speed performance characteristics canbe successfully achieved.
Additionally, genetic algorithm optimisation was appliedusing model-in-the-loop techniques to determine the opti-mised gear ratio for single speed and two-speed transmis-sions in PEVs. These results demonstrated that, while itis possible to achieve an optimal single speed and two-speed transmission ratios for maximum vehicle range, thevariation in driving range is very weakly associated withgear ratios. Performance constraints placed on the vehicleduring optimisation are difficult to achieve for a single speedtransmission. Nevertheless, it is clearly demonstrated thatthe application of two-speed transmission to PEVs has theeffect of improving vehicle performance for top speed, gradeclimbing, and acceleration without substantially compromis-ing driving range in comparison to single speed PEVs.
Conflict of Interests
The authors declare that there is no conflict of interestsregarding the publication of this paper.
Acknowledgments
This project is supported by BAIC Motor Electric VehicleCo. Ltd., the Ministry of Science and Technology, China, andUniversity of Technology, Sydney.
References
[1] M. Kamachi, H. Miyamoto, and Y. Sano, “Development ofpower management system for electric vehicle ‘i-MiEV’,” inProceeding of the International Power Electronics Conference(IPEC ’10), pp. 2949–2955, Sapporo, Japan, June 2010.
[2] A. R. Salisa, N. Zhang, and J. Zhu, “Recent advancements inmanagement of hybrid vehicle powertrains,” in Proceeding of theInternational Conference of Sustainable Automotive Technologies(ICSAT ’08), pp. 1–4, Melbourne, Australia, 2008.
[3] N. Jinrui,W. Zhifu, and R. Qinglian, “Simulation and analysis ofperformance of a pure electric vehicle with a super capacitor,” in
Proceeding of the IEEE Vehicle Power and Propulsion Conference(VPPC ’06), pp. 1–6, Windsor, UK, September 2006.
[4] J. P. Trovao, P. G. Pereirinha, and F. J. T. E. Ferreira, “Compar-ative study of different electric machines in the powertrain ofa small Electric Vehicle,” in Proceeding of the 18th InternationalConference on Electrical Machines (ICEM ’08), pp. 1–6, Vilam-oura, Portugal, September 2008.
[5] M. Eberhard and M. Tarpenning, “The 21st century electriccar,” Tesla Motors White Paper, 2006, http://www.fcinfo.jp/whitepaper/687.pdf.
[6] A. R. Salisa, N. Zhang, and J. Zhu, “A comparative analysis offuel economy and emissions between a conventional HEV andtheUTSPHEV,” IEEETransactions onVehicular Technology, vol.60, no. 1, pp. 44–54, 2011.
[7] S. Zhang, G. Wu, and S. Zheng, “Study on the energy man-agement strategy of DCT-based series-parallel PHEV,” in Pro-ceeding of the 1st International Conference on Computing Controland Industrial Engineering (CCIE ’10), pp. 25–29,Wuhan,China,June 2010.
[8] A. C. Baisden and A. Emadi, “ADVISOR-based model of abattery and an ultra-capacitor energy source for hybrid electricvehicles,” IEEETransactions onVehicular Technology, vol. 53, no.1, pp. 199–205, 2004.
[9] S. Bogosyan, M. Gokasan, and D. J. Goering, “A novel modelvalidation and estimation approach for hybrid serial electricvehicles,” IEEE Transactions on Vehicular Technology, vol. 56,no. 4, pp. 1485–1497, 2007.
[10] L. Fang, S. Qin, G. Xu, T. Li, and K. Zhu, “Simultaneousoptimization for hybrid electric vehicle parameters based onmulti-objective genetic algorithms,” Energies, vol. 4, no. 3, pp.532–544, 2011.
[11] C. C. Chan, A. Bouscayrol, and K. Chen, “Electric, hybrid, andfuel-cell vehicles: architectures and modeling,” IEEE Transac-tions on Vehicular Technology, vol. 59, no. 2, pp. 589–598, 2010.
[12] A. Rousseau, S. Pagerit, and D. W. Gao, “Plug-in hybrid electricvehicle control strategy parameter optimization,” Journal ofAsian Electric Vehicles, vol. 6, no. 2, pp. 1125–1133, 2008.
[13] L. C. Fang and S. Y. Qin, “Concurrent optimization for parame-ters of powertrain and control system of hybrid electric vehiclebased on multi-objective genetic algorithms,” in Proceeding ofthe International Joint Conference (SICE-ICASE ’06), pp. 2424–2429, Busan, Republic of Korea, October 2006.
[14] B. Zhang, Z. Chen, C. Mi, and Y. L. Murphey, “Multi-objectiveparameter optimization of a series hybrid electric vehicle usingevolutionary algorithms,” in Proceeding of the IEEE VehiclePower and Propulsion Conference (VPPC ’09), pp. 921–925,Dearborn, Mich, USA, September 2009.
[15] C. N. Shiau, N. Kaushal, C. T. Hendrickson, S. B. Peterson,J. F. Whitacre, and J. J. Michalek, “Optimal plug-in hybridelectric vehicle design and allocation for minimum life cyclecost, petroleum consumption, and greenhouse gas emissions,”Journal of Mechanical Design, vol. 132, no. 9, Article ID 091013,11 pages, 2010.
[16] Y. Zhu, Y. Chen, Z. Wu, and A. Wang, “Optimisation design ofan energy management strategy for hybrid vehicles,” Interna-tional Journal of Alternative Propulsion, vol. 1, no. 1, pp. 47–62,2006.
[17] V. H. Johnson, K. B. Wipke, and D. J. Rausen, “HEV controlstrategy for real-time optimization of fuel economy and emis-sions,” SAE Technical Paper 2000-01-1543, 2000.
Advances in Mechanical Engineering 13
[18] M. Ceraolo, A. Donato, and G. Franceschi, “A general approachto energy optimization of hybrid electric vehicles,” IEEE Trans-actions on Vehicular Technology, vol. 57, no. 3, pp. 1433–1441,2008.
[19] G. Lechner and H. Naunheimer, Automotive Transmissions—Fundamentals, Selection, Design and Application , Springer,Berlin, Germany, 1999.
[20] M. A. Kluger and D. M. Long, “An overview of currentautomatic, manual and continuously variable transmissionefficiencies and their projected future improvements,” SAETechnical Paper 1999-01-1259.
[21] K. Deb, “Multi-objective optimisation using evolutionary algo-rithms: an introduction,” inMulti-Objective Evolutionary Opti-misation for Product Design andManufacturing, L.Wang and A.H. C. Ng, Eds., pp. 3–35, Springer, London, UK, 2011.
[22] X. Yu and M. Gen, Introduction to Evolutionary Algorithms,Springer, London, UK, 2010.

Submit your manuscripts athttp://www.hindawi.com
VLSI Design
Hindawi Publishing Corporationhttp://www.hindawi.com Volume 2014
International Journal of
RotatingMachinery
Hindawi Publishing Corporationhttp://www.hindawi.com Volume 2014
Hindawi Publishing Corporation http://www.hindawi.com
Journal ofEngineeringVolume 2014
Hindawi Publishing Corporationhttp://www.hindawi.com Volume 2014
Shock and Vibration
Hindawi Publishing Corporationhttp://www.hindawi.com Volume 2014
Mechanical Engineering
Advances in
Hindawi Publishing Corporationhttp://www.hindawi.com Volume 2014
Civil EngineeringAdvances in
Advances inAcoustics &Vibration
Hindawi Publishing Corporationhttp://www.hindawi.com Volume 2014
Hindawi Publishing Corporationhttp://www.hindawi.com Volume 2014
Electrical and Computer Engineering
Journal of
Hindawi Publishing Corporationhttp://www.hindawi.com Volume 2014
DistributedSensor Networks
International Journal of
The Scientific World JournalHindawi Publishing Corporation http://www.hindawi.com Volume 2014
Hindawi Publishing Corporationhttp://www.hindawi.com Volume 2014
Journal of
Sensors
Modelling & Simulation in EngineeringHindawi Publishing Corporation http://www.hindawi.com Volume 2014
Hindawi Publishing Corporationhttp://www.hindawi.com Volume 2014
Active and Passive Electronic Components
Advances inOptoElectronics
Hindawi Publishing Corporation http://www.hindawi.com
Volume 2014
RoboticsJournal of
Hindawi Publishing Corporationhttp://www.hindawi.com Volume 2014
Chemical EngineeringInternational Journal of
Hindawi Publishing Corporationhttp://www.hindawi.com Volume 2014
Control Scienceand Engineering
Journal of
Hindawi Publishing Corporationhttp://www.hindawi.com Volume 2014
International Journal of
Antennas andPropagation
Hindawi Publishing Corporation http://www.hindawi.com Volume 2014
Hindawi Publishing Corporationhttp://www.hindawi.com Volume 2014
Navigation and Observation
International Journal of