Embed Size (px)
Citation preview
Researches of atmospheric Researches of atmospheric
air quality in Uzbekistanair quality in Uzbekistan
L.YuL.Yu. . ShardakovaShardakova, , M.L. M.L. ArushanovArushanov, ,
N.R.RakhmatovaN.R.Rakhmatova
HydrometeorologicalHydrometeorological Research InstituteResearch Institute
ee--mail: mail: [email protected]@albatros.uz
Tashkent, UzbekistanTashkent, Uzbekistan

Environmental sustainabilityEnvironmental sustainability
As a signatory to the millennium declaration, Uzbekistan is fulfAs a signatory to the millennium declaration, Uzbekistan is fulfilling illing
its promises to address the challenges outlined in the Millenniuits promises to address the challenges outlined in the Millennium m
Development Goals (Development Goals (MDGMDG’’ss). The government recognizes the ). The government recognizes the
timeliness and acuteness of these challenges in the national timeliness and acuteness of these challenges in the national
development context. development context.
As a result of collaboration of the government, a civil society As a result of collaboration of the government, a civil society and and
donor community eight national donor community eight national MDGMDG’’ss have been formulated, have been formulated,
among which there is GOAL 7 among which there is GOAL 7 -- ““Ensure environmental Ensure environmental
sustainabilitysustainability””.. One of GOAL 7 targets (TARGET 9) had been One of GOAL 7 targets (TARGET 9) had been
formulated in the following way formulated in the following way -- integrate the principles of integrate the principles of
sustainable development into country policies and programs and sustainable development into country policies and programs and
reverse the loss of environmental resources by 2015. reverse the loss of environmental resources by 2015.
Environmental sustainabilityEnvironmental sustainability
As follows from National Report on As follows from National Report on MDG'sMDG's, prepared in 2006, the , prepared in 2006, the condition of ecological sustainability had been included in all condition of ecological sustainability had been included in all national national strategy and plans for development.strategy and plans for development.
Strategy of the atmospheric air protection has been developed wiStrategy of the atmospheric air protection has been developed within thin the framework of the the framework of the National Plan of Action on EnvironmentalProtection of the Republic of Uzbekistan, on the basis of which the of the Republic of Uzbekistan, on the basis of which the Government accepts the Government accepts the Actions Program on Environmental Protection in the Republic of Uzbekistan for 1999-2005. In particular, . In particular, development and perfection of monitoring system of an environmendevelopment and perfection of monitoring system of an environment, t, including atmospheric air was stipulated by this program. including atmospheric air was stipulated by this program.
Researches in the field of atmospheric air protection are carrieResearches in the field of atmospheric air protection are carried out d out according to the according to the State scientific and technical program on the basis of on the basis of grants.grants.
Geographical situationGeographical situation
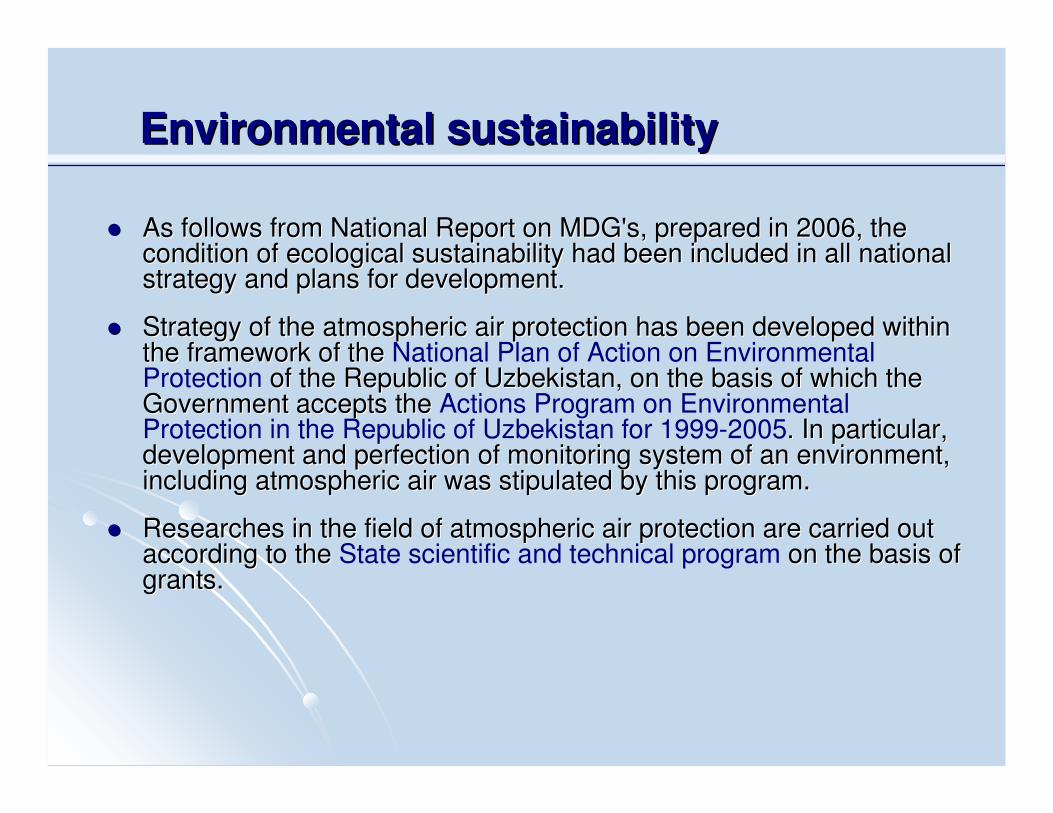
•• The Uzbekistan is The Uzbekistan is situated in the situated in the middle of Central middle of Central Asia and shares its Asia and shares its borders with borders with
–– Kazakhstan, Kazakhstan,
–– the Kyrgyz the Kyrgyz Republic,Republic,
–– TadjikistanTadjikistan, ,
–– Afghanistan,Afghanistan,
–– TurkmenistanTurkmenistan. .
•• Uzbekistan is located in the arid zone of Asia, between 37Uzbekistan is located in the arid zone of Asia, between 37°°and 45 and 45 °° North North
latitude and 56latitude and 56°° and 73and 73°° East longitude. ItEast longitude. It’’s territory is 447 400s territory is 447 400 kmkm22. .
•• The area of Uzbekistan is part of the Aral Sea Basin. This baThe area of Uzbekistan is part of the Aral Sea Basin. This basin is replenished sin is replenished
by two main rivers: the Amu Darya and the by two main rivers: the Amu Darya and the SyrSyr Darya.Darya.
ClimateClimate
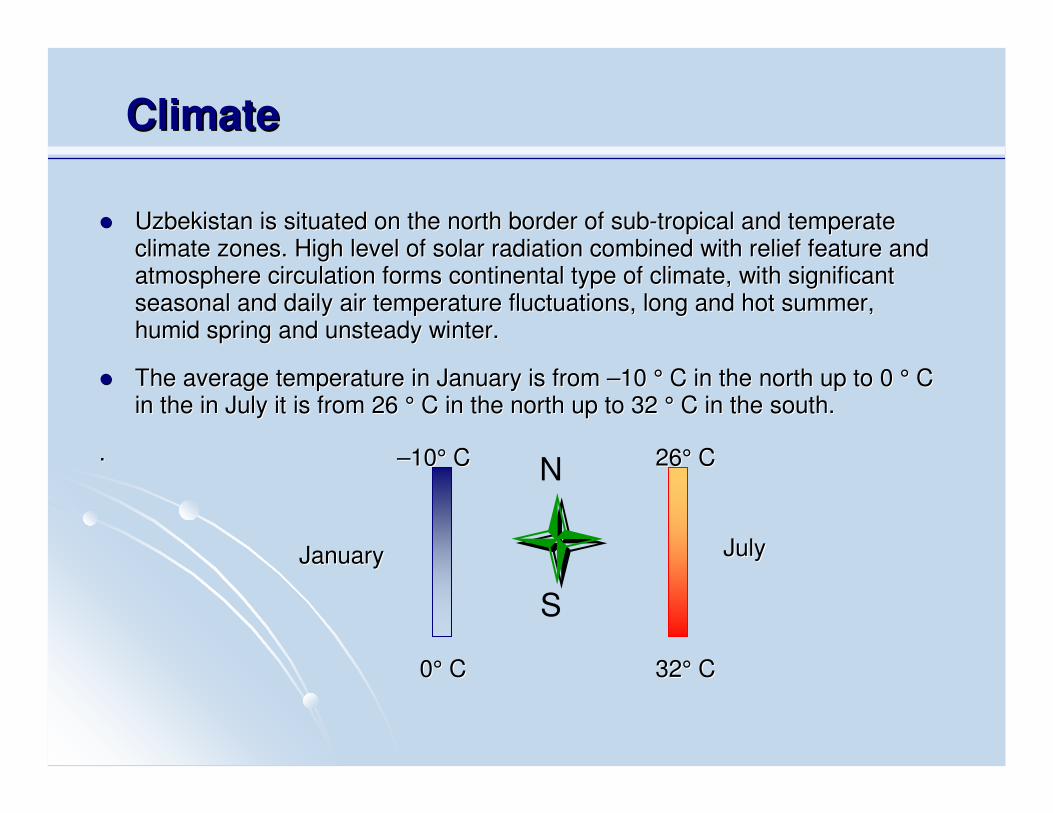
Uzbekistan is situated on the north border of subUzbekistan is situated on the north border of sub--tropical and temperate tropical and temperate climate zones. High level of solar radiation combined with relieclimate zones. High level of solar radiation combined with relief feature and f feature and atmosphere circulation forms continental type of climate, with satmosphere circulation forms continental type of climate, with significant ignificant seasonal and daily air temperature fluctuations, long and hot suseasonal and daily air temperature fluctuations, long and hot summer, mmer, humid spring and unsteady winter.humid spring and unsteady winter.
The average temperature in January is from The average temperature in January is from ––10 10 °° C in the north up to 0 C in the north up to 0 °° C C in the in July it is from 26 in the in July it is from 26 °° C in the north up to 32 C in the north up to 32 °° C in the south.C in the south.
..
JanuaryJanuary
––1010°° CC
00°° CC
S
N
JulyJuly
3232°° CC
2626°° CC
0 10 20 30 40 50
33%
67%
industrialmobile
State of atmospheric air pollutionState of atmospheric air pollution
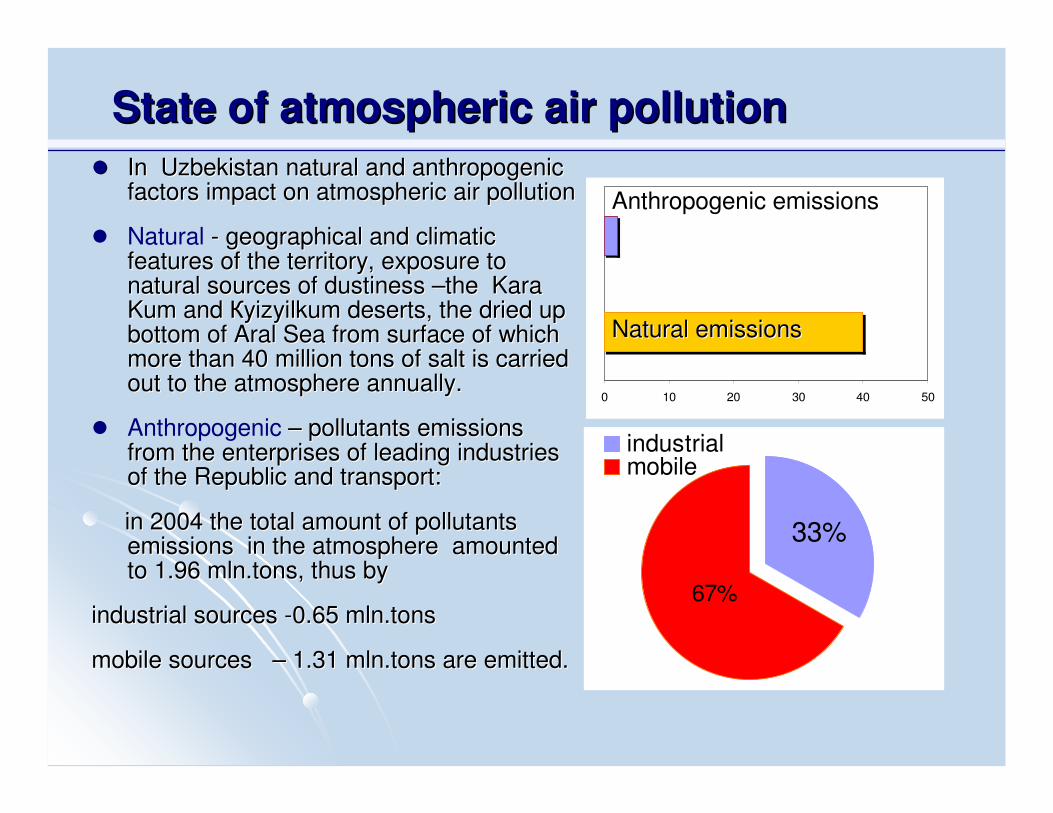
In Uzbekistan natural and anthropogenic In Uzbekistan natural and anthropogenic factors impact on atmospheric air pollution factors impact on atmospheric air pollution
Natural -- geographical and climatic geographical and climatic features of the territory, exposure to features of the territory, exposure to natural sources of dustiness natural sources of dustiness ––the Kara the Kara KumKum and and ККyizyilkumyizyilkum deserts, the dried up deserts, the dried up bottom of Aral Sea from surface of which bottom of Aral Sea from surface of which more than 40 million tons of salt is carried more than 40 million tons of salt is carried out to the atmosphere annually.out to the atmosphere annually.
Anthropogenic –– pollutants emissions pollutants emissions from the enterprises of leading industries from the enterprises of leading industries of the Republic and transport: of the Republic and transport:
in 2004 the total amount of pollutants in 2004 the total amount of pollutants emissions in the atmosphere amounted emissions in the atmosphere amounted to 1.96 to 1.96 mln.tonsmln.tons, thus by , thus by
industrial sources industrial sources --0.65 0.65 mln.tonsmln.tons
mobile sources mobile sources –– 1.31 1.31 mln.tonsmln.tons are emitted.are emitted.
Natural emissionsNatural emissions
Anthropogenic emissionsAnthropogenic emissions
Monitoring of atmospheric air quality is carried out by Monitoring of atmospheric air quality is carried out by UzHydrometUzHydromet in 33 settlements on 60 stationary points.in 33 settlements on 60 stationary points.
According to the monitoring data (2000According to the monitoring data (2000--20042004гг..гг.) excess .) excess of Maximum Admissible Concentration (1of Maximum Admissible Concentration (1--3.3 MAC.) on 3.3 MAC.) on dust, nitrogen dioxide, phenol, ozone was observed in dust, nitrogen dioxide, phenol, ozone was observed in five large cities of Uzbekistan.five large cities of Uzbekistan.
The contents of dust and ozone in air is influenced with The contents of dust and ozone in air is influenced with natural factors of regional scale, therefore pointnatural factors of regional scale, therefore point’’s s observations on the monitoring system are insufficient observations on the monitoring system are insufficient for their research and application of remote sensing for their research and application of remote sensing
methods is necessarymethods is necessary. .
State of atmospheric air pollutionState of atmospheric air pollution
The state grantsThe state grants
““To develop technologies and a substantiation of To develop technologies and a substantiation of remote sensing monitoring of atmospheric pollution remote sensing monitoring of atmospheric pollution state according to the digital satellite information state according to the digital satellite information ““
““To reveal physical and chemical mechanisms of To reveal physical and chemical mechanisms of ozone formation in the polluted atmosphere and a ozone formation in the polluted atmosphere and a role of precursors in role of precursors in tropospherictropospheric ozone formation. ozone formation. To estimate influence of stratospheric ozone on To estimate influence of stratospheric ozone on concentration of ground odd oxygen concentration of ground odd oxygen ““
““The research of current dynamics the littoral area The research of current dynamics the littoral area of the Aral Sea and ecosystems degradation in the of the Aral Sea and ecosystems degradation in the Aral Sea region on the basis of the satellite Aral Sea region on the basis of the satellite observations and GISobservations and GIS--technologiestechnologies””
Dust stormsDust storms
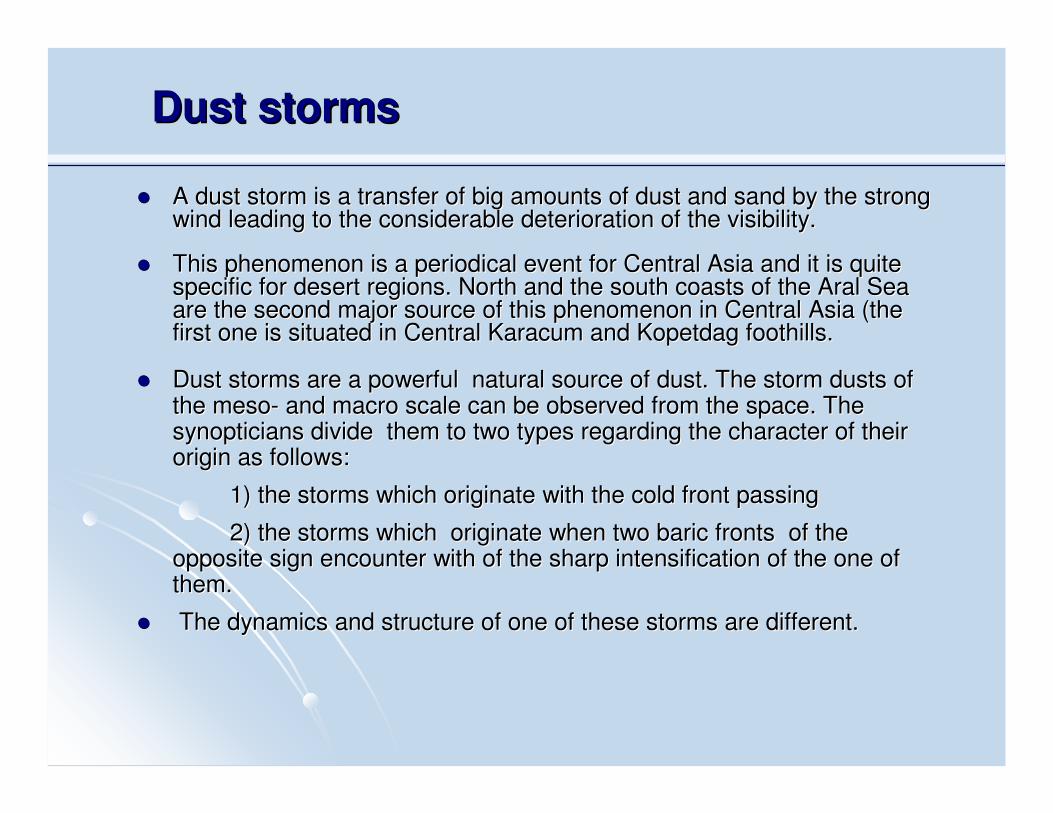
A dust storm is a transfer of big amounts of dust and sand by thA dust storm is a transfer of big amounts of dust and sand by the strong e strong wind leading to the considerable deterioration of the visibilitywind leading to the considerable deterioration of the visibility. .
This phenomenon is a periodical event for Central Asia and it isThis phenomenon is a periodical event for Central Asia and it is quite quite specific for desert regions. North and the south coasts of the Aspecific for desert regions. North and the south coasts of the Aral Sea ral Sea are the second major source of this phenomenon in Central Asia (are the second major source of this phenomenon in Central Asia (the the first one is situated in Central first one is situated in Central KaracumKaracum and and KopetdagKopetdag foothills. foothills.
Dust storms are a powerful natural source of dust. The storm duDust storms are a powerful natural source of dust. The storm dusts of sts of the the mesomeso-- and macro scale can be observed from the space. The and macro scale can be observed from the space. The synopticianssynopticians divide them to two types regarding the character of their divide them to two types regarding the character of their origin as follows: origin as follows:
1) the storms which originate with the cold front 1) the storms which originate with the cold front passing passing
2) the storms which originate when two baric fron2) the storms which originate when two baric fronts of the ts of the opposite sign encounter with of the sharp intensification of theopposite sign encounter with of the sharp intensification of the one of one of them.them.
The dynamics and structure of one of these storms are differentThe dynamics and structure of one of these storms are different. .
Dust stormsDust storms
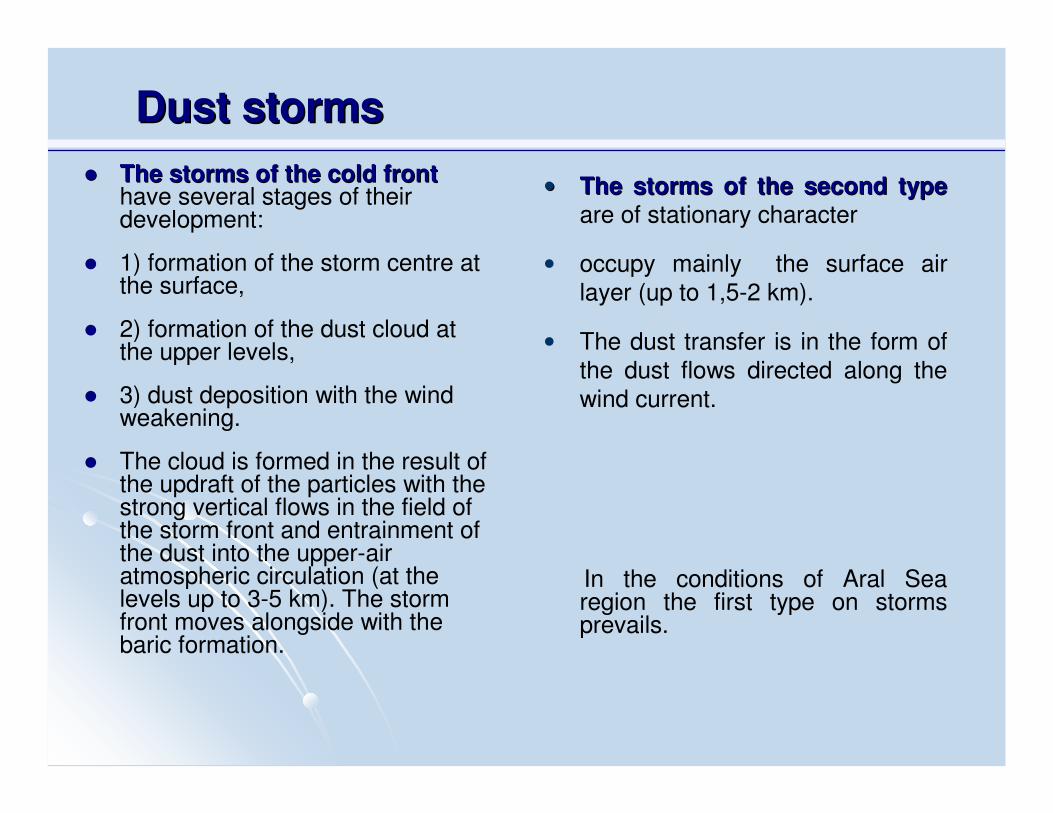
The storms of the cold frontThe storms of the cold fronthave several stages of their development:
1) formation of the storm centre at the surface,
2) formation of the dust cloud at the upper levels,
3) dust deposition with the wind weakening.
The cloud is formed in the result of the updraft of the particles with the strong vertical flows in the field of the storm front and entrainment of the dust into the upper-air atmospheric circulation (at the levels up to 3-5 km). The storm front moves alongside with the baric formation.
•• The storms of the second typeThe storms of the second typeare of stationary character
• occupy mainly the surface air
layer (up to 1,5-2 km).
• The dust transfer is in the form of
the dust flows directed along the
wind current.
In the conditions of Aral Sea region the first type on storms prevails.
Dust stormsDust storms
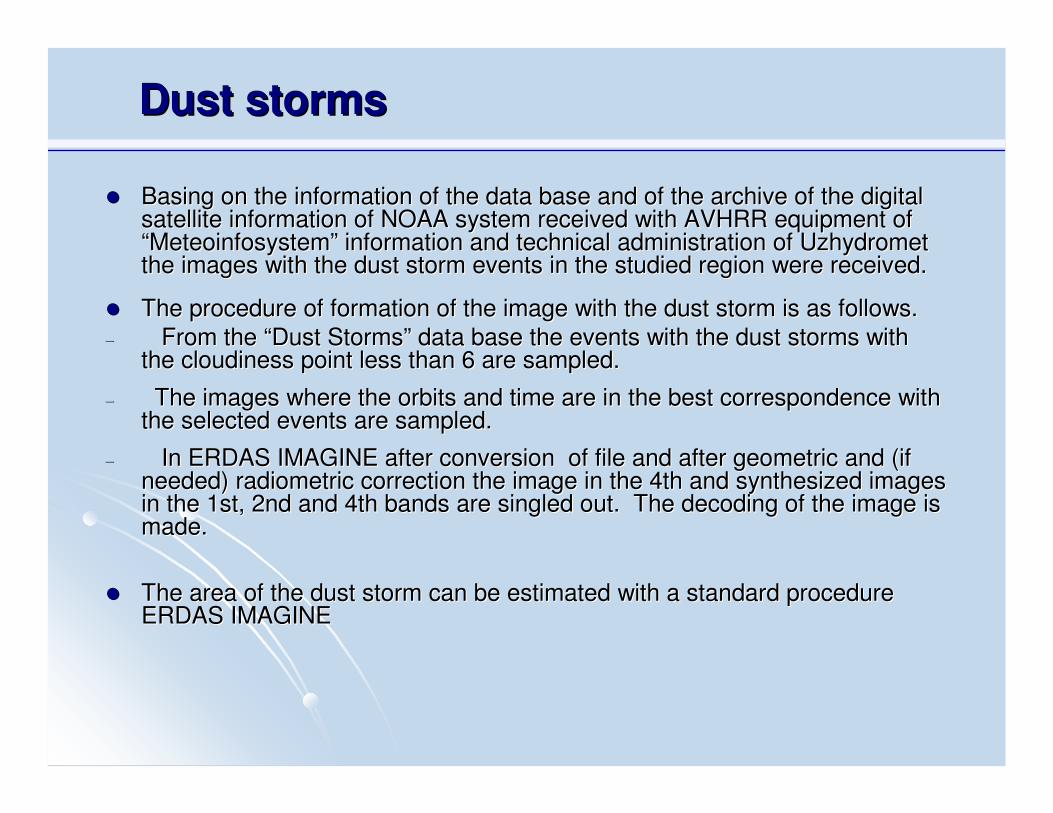
Basing on the information of the data base and of the archive ofBasing on the information of the data base and of the archive of the digital the digital satellite information of NOAA system received with AVHRR equipmesatellite information of NOAA system received with AVHRR equipment of nt of ““MeteoinfosystemMeteoinfosystem”” information and technical administration of information and technical administration of UzhydrometUzhydrometthe images with the dust storm events in the studied region werethe images with the dust storm events in the studied region were received. received.
The procedure of formation of the image with the dust storm is aThe procedure of formation of the image with the dust storm is as follows. s follows.
–– From the From the ““Dust StormsDust Storms”” data base the events with the dust storms with data base the events with the dust storms with the cloudiness point less than 6 are sampled. the cloudiness point less than 6 are sampled.
–– The images where the orbits and time are in the best corresponThe images where the orbits and time are in the best correspondence with dence with the selected events are sampled. the selected events are sampled.
–– In ERDAS IMAGINE after conversion of file and after geometriIn ERDAS IMAGINE after conversion of file and after geometric and (if c and (if needed) radiometric correction the image in the 4th and synthesineeded) radiometric correction the image in the 4th and synthesized images zed images in the 1st, 2nd and 4th bands are singled out. The decoding of in the 1st, 2nd and 4th bands are singled out. The decoding of the image is the image is made. made.
The area of the dust storm can be estimated with a standard procThe area of the dust storm can be estimated with a standard procedureedureERDAS IMAGINE ERDAS IMAGINE
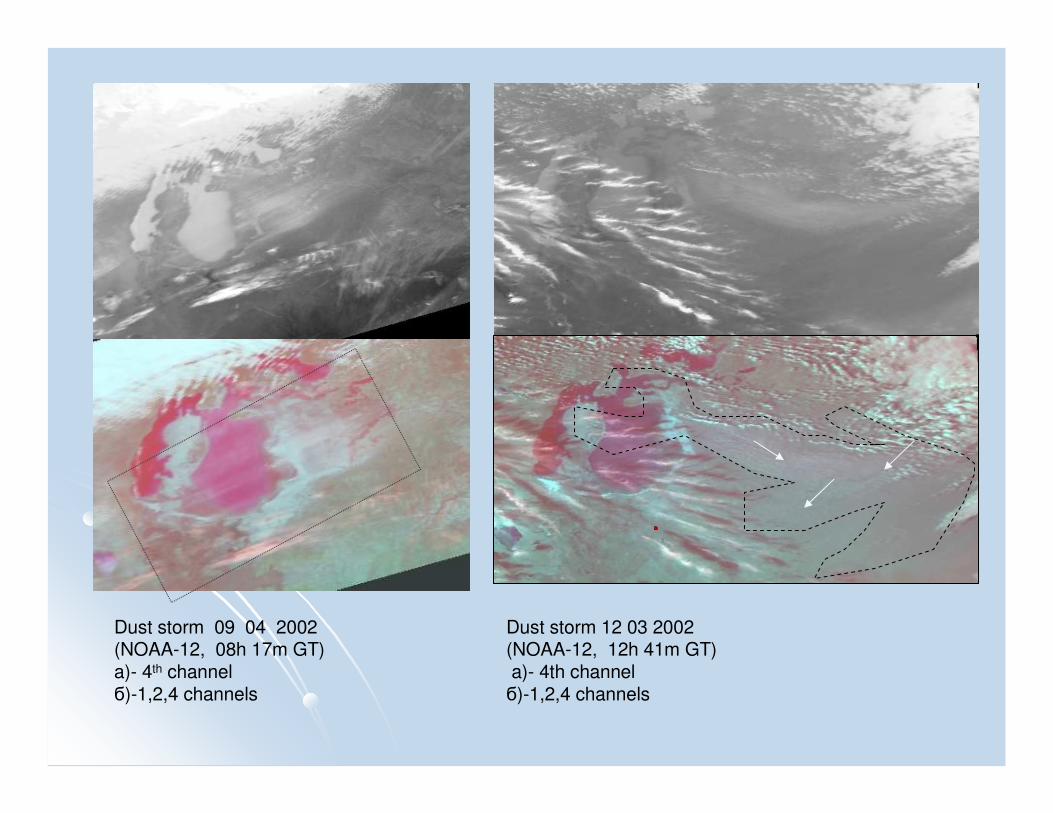
Dust storm 12 03 2002 (NOAA-12, 12h 41m GT)a)- 4th channelб)-1,2,4 channels
Dust storm 09 04 2002 (NOAA-12, 08h 17m GT)a)- 4th channelб)-1,2,4 channels
Akbaytal
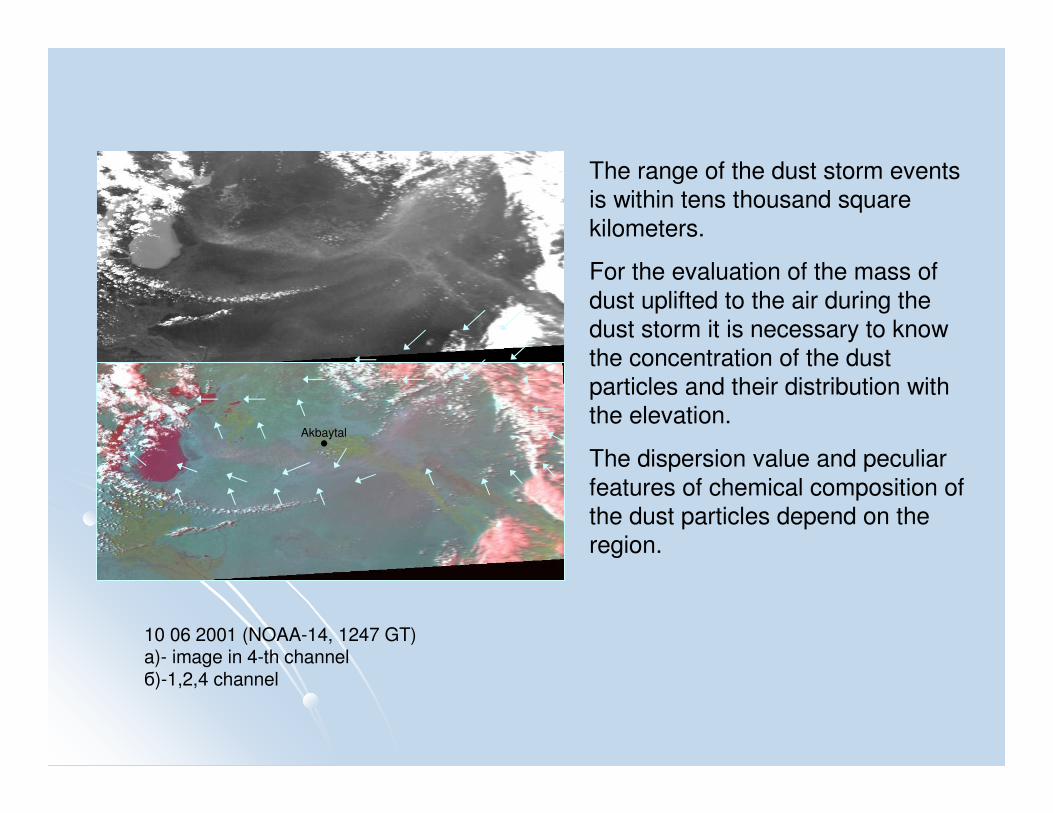
10 06 2001 (NOAA-14, 1247 GT)a)- image in 4-th channelб)-1,2,4 channel
The range of the dust storm events
is within tens thousand square
kilometers.
For the evaluation of the mass of
dust uplifted to the air during the
dust storm it is necessary to know
the concentration of the dust
particles and their distribution with
the elevation.
The dispersion value and peculiar
features of chemical composition of
the dust particles depend on the
region.
The theory of diagnosis of atmospheric The theory of diagnosis of atmospheric
aerosolaerosol
Prof. Prof. ArushanovArushanov has developed the theoretical principles of the has developed the theoretical principles of the
diagnosis of atmospheric aerosol by the brightness characteristidiagnosis of atmospheric aerosol by the brightness characteristics cs
of of ““the underlying surfacethe underlying surface--atmosphereatmosphere”” system relayed from the system relayed from the
board of the satellite.board of the satellite.
Two approaches compose the basis of the theoretic work outs:Two approaches compose the basis of the theoretic work outs:
–– semisemi--empiric technique ,empiric technique ,
–– method based on the solution of the inverse problem according tmethod based on the solution of the inverse problem according to o
A.TikhonovA.Tikhonov
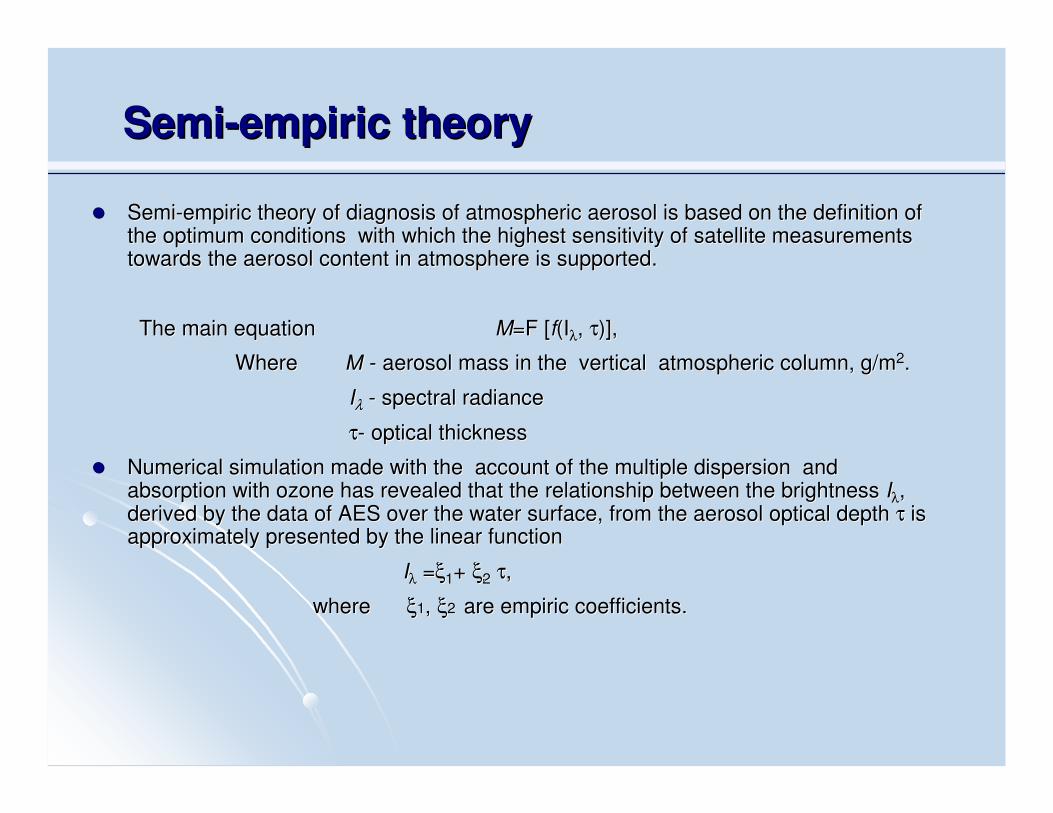
SemiSemi--empiric theoryempiric theory
SemiSemi--empiric theory of diagnosis of atmospheric aerosol is based on tempiric theory of diagnosis of atmospheric aerosol is based on the definition of he definition of the optimum conditions with which the highest sensitivity of sathe optimum conditions with which the highest sensitivity of satellite measurements tellite measurements towards the aerosol content in atmosphere is supported. towards the aerosol content in atmosphere is supported.
The main equation The main equation MM=F [=F [ff(I(Iλλ, , ττ)], )],
Where Where ММ -- aerosol mass in the aerosol mass in the verticalvertical atmospheric atmospheric columncolumn, , gg//mm22. .
IIλλ -- spectral radiancespectral radiance
ττ-- optical thicknessoptical thickness
Numerical simulation made with the account of the multiple dispNumerical simulation made with the account of the multiple dispersion and ersion and absorption with ozone has revealed that the relationship betweenabsorption with ozone has revealed that the relationship between the brightness the brightness IIλλ, , derived by the data of AES over the water surface, from the aeroderived by the data of AES over the water surface, from the aerosol optical depth sol optical depth ττ is is approximately presented by the linear function approximately presented by the linear function
IIλλ ==ξξ11+ + ξξ22 ττ,,
where where ξξ11, , ξξ2 2 are empiric coefficients. are empiric coefficients.
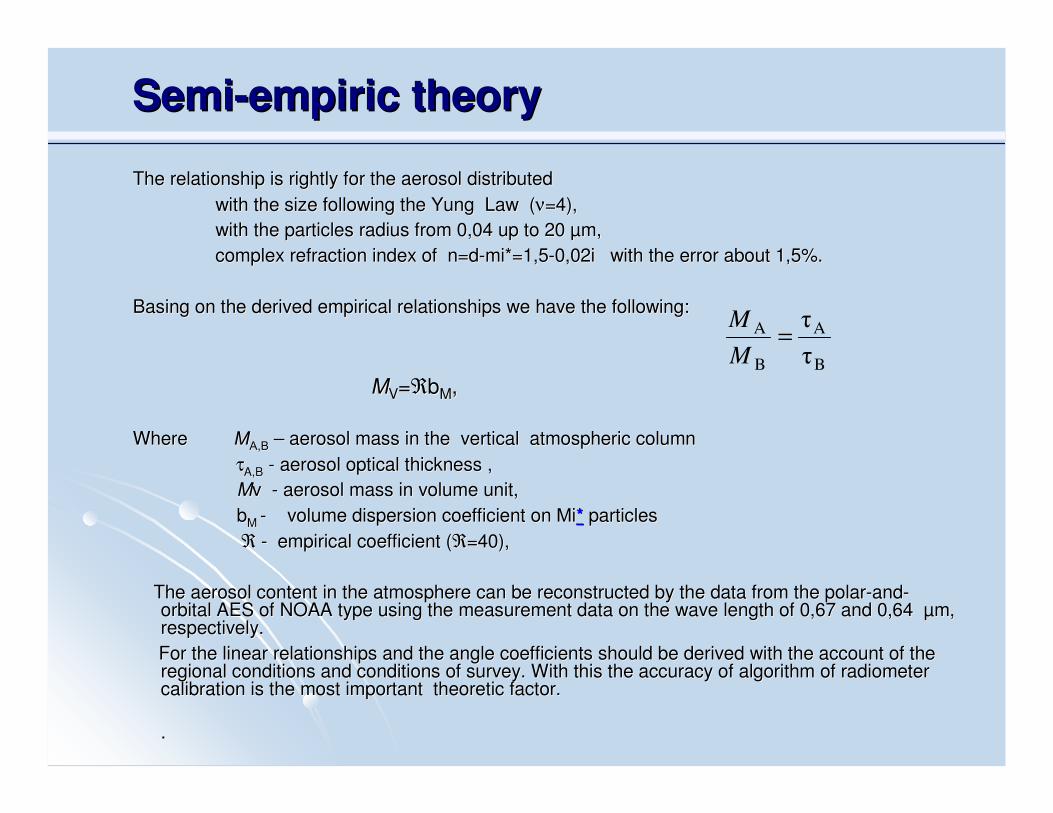
SemiSemi--empiric theoryempiric theory
The relationship is rightly for the aerosol distributedThe relationship is rightly for the aerosol distributed
with the size following the Yung Law (with the size following the Yung Law (νν=4), =4),
with the particles radius from 0,04 up to 20 with the particles radius from 0,04 up to 20 µµm, m,
complex refraction index of n=dcomplex refraction index of n=d--mimi**=1,5=1,5--0,02i with the error about 1,5%. 0,02i with the error about 1,5%.
Basing on the derived empirical relationships we have the followBasing on the derived empirical relationships we have the following:ing:
MMVV==ℜℜbbMM, ,
Where Where ММАА,,ВВ –– aerosol mass in the aerosol mass in the verticalvertical atmospheric atmospheric columncolumn
ττAA,,BB -- aerosolaerosol optical thickness optical thickness , ,
MMvv -- aerosol mass in volume unitaerosol mass in volume unit, ,
bbMM -- volume dispersion coefficient on volume dispersion coefficient on ММii** particlesparticles
ℜℜ -- empirical coefficient empirical coefficient ((ℜℜ=40), =40),
The aerosol content in the atmosphere can be reconstructed bThe aerosol content in the atmosphere can be reconstructed by the data from the polary the data from the polar--andand--orbital AES of NOAA type using the measurement data on the wave orbital AES of NOAA type using the measurement data on the wave length of 0,67 and 0,64 length of 0,67 and 0,64 µµm, m, respectively. respectively.
For the linear relationships and the angle coefficients shoFor the linear relationships and the angle coefficients should be derived with the account of the uld be derived with the account of the regional conditions and conditions of survey. With this the accuregional conditions and conditions of survey. With this the accuracy of algorithm of radiometer racy of algorithm of radiometer calibration is the most important theoretic factor. calibration is the most important theoretic factor.
. .
B
A
B
A
τ
τ=
M
M
The inverse problems solutionThe inverse problems solution
Rather precise quantitative estimations of the aerosol contentRather precise quantitative estimations of the aerosol content in the in the
atmosphere can be derived on the base of theory of radiation traatmosphere can be derived on the base of theory of radiation transfer in the nsfer in the
dispersing atmosphere on the base of the inverse problems solutidispersing atmosphere on the base of the inverse problems solution on
according to according to A.TikhonovA.Tikhonov..
In the framework of our studies In the framework of our studies profprof. . ArushanovArushanov proposed the following for proposed the following for
the solution of the main problems: the solution of the main problems:
The model of atmosphere was selected. The model of atmosphere was selected.
Methods of normalization were selected correctly. Methods of normalization were selected correctly.
The problem of the brightness profiles of the daytime and twiliThe problem of the brightness profiles of the daytime and twilight horizon ght horizon
was solved for the reconstruction of parameters of the upper atmwas solved for the reconstruction of parameters of the upper atmosphere osphere
composition (stratosphere and lower mesosphere).composition (stratosphere and lower mesosphere).
The assessment of informational content of radiometric data withThe assessment of informational content of radiometric data with the the
different survey conditions was made. different survey conditions was made.
The total column ozoneThe total column ozone
The researches of the total column ozone (TCO) over Uzbekistan fThe researches of the total column ozone (TCO) over Uzbekistan for or the last 10 years have been carried out using the TOMS data. Thethe last 10 years have been carried out using the TOMS data. Thesatellite and ground observations have been analyzed, longsatellite and ground observations have been analyzed, long--term term trends have been obtained.trends have been obtained.
The research objects were The research objects were followfollow::
Assessment of seasonal variations in the total column ozone overAssessment of seasonal variations in the total column ozone overUzbekistan. Uzbekistan.
Comparison of ground observations and Satellite data (TOMS). Comparison of ground observations and Satellite data (TOMS).
Assessment of the longAssessment of the long--term trend of total column ozone over term trend of total column ozone over Uzbekistan. Uzbekistan.
Spatial distribution of total column ozone over UzbekistanSpatial distribution of total column ozone over Uzbekistan
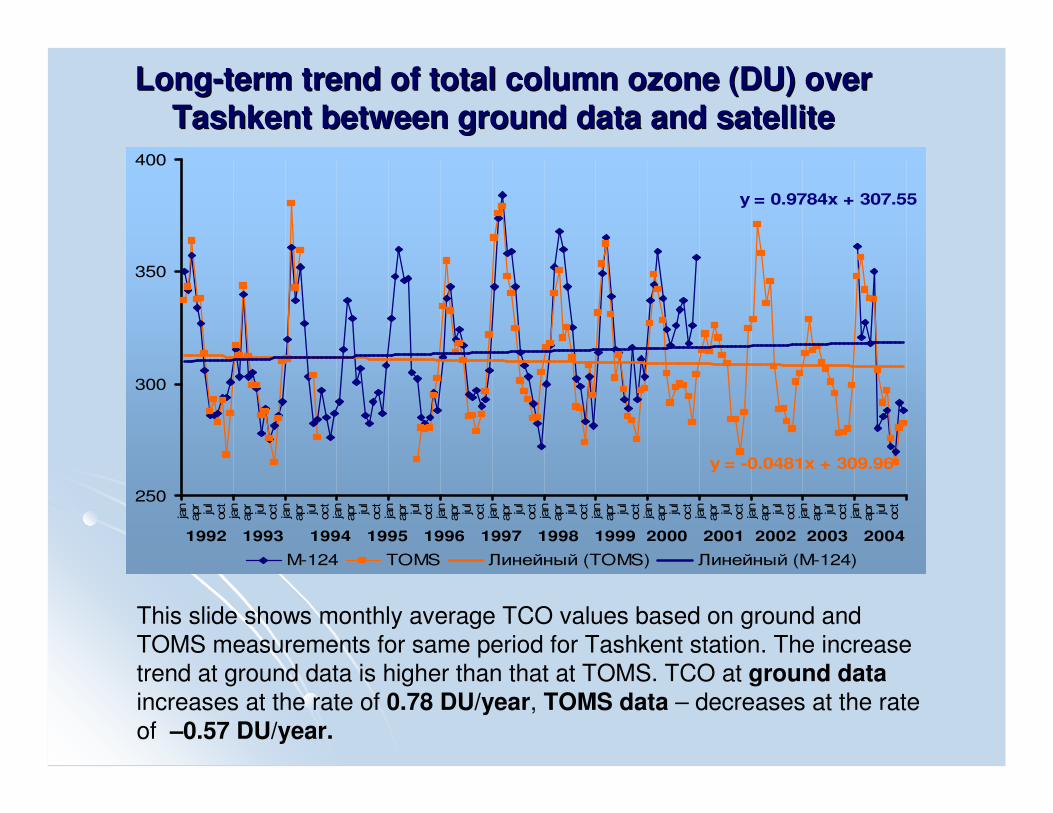
LongLong--term trend of total column ozone (DU) over term trend of total column ozone (DU) over
Tashkent between ground data and satelliteTashkent between ground data and satellite
y = -0.0481x + 309.96
y = 0.9784x + 307.55
250
300
350
400
jan
apr
jul
oct
jan
apr
jul
oct
jan
apr
jul
oct
jan
apr
jul
oct
jan
apr
jul
oct
jan
apr
jul
oct
jan
apr
jul
oct
jan
apr
jul
oct
jan
apr
jul
oct
jan
apr
jul
oct
jan
apr
jul
oct
jan
apr
jul
oct
jan
apr
jul
oct
jan
apr
jul
oct
M-124 TOMS Линейный (TOMS) Линейный (M-124)
1992 1993 1994 1995 1996 1997 1998 1999 2000 2001 2002 2003 2004
2005
This slide shows monthly average TCO values based on ground and
TOMS measurements for same period for Tashkent station. The increase
trend at ground data is higher than that at TOMS. TCO at ground data
increases at the rate of 0.78 DU/year, TOMS data – decreases at the rate
of –0.57 DU/year.
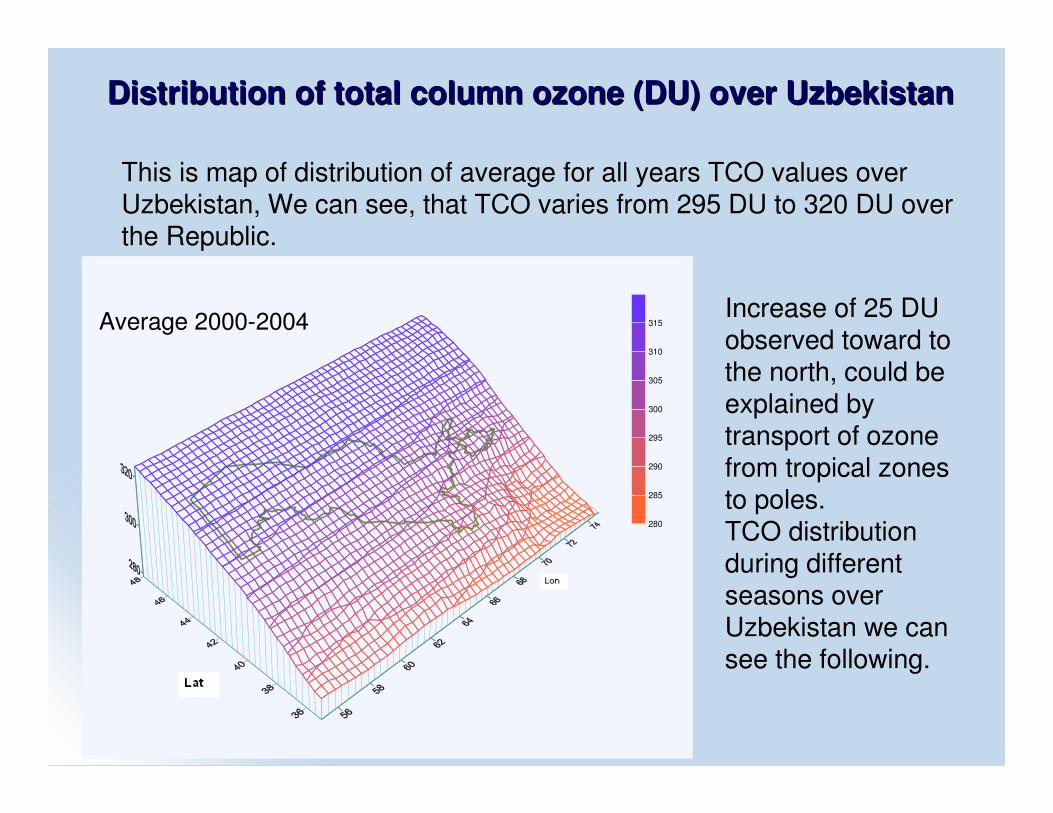
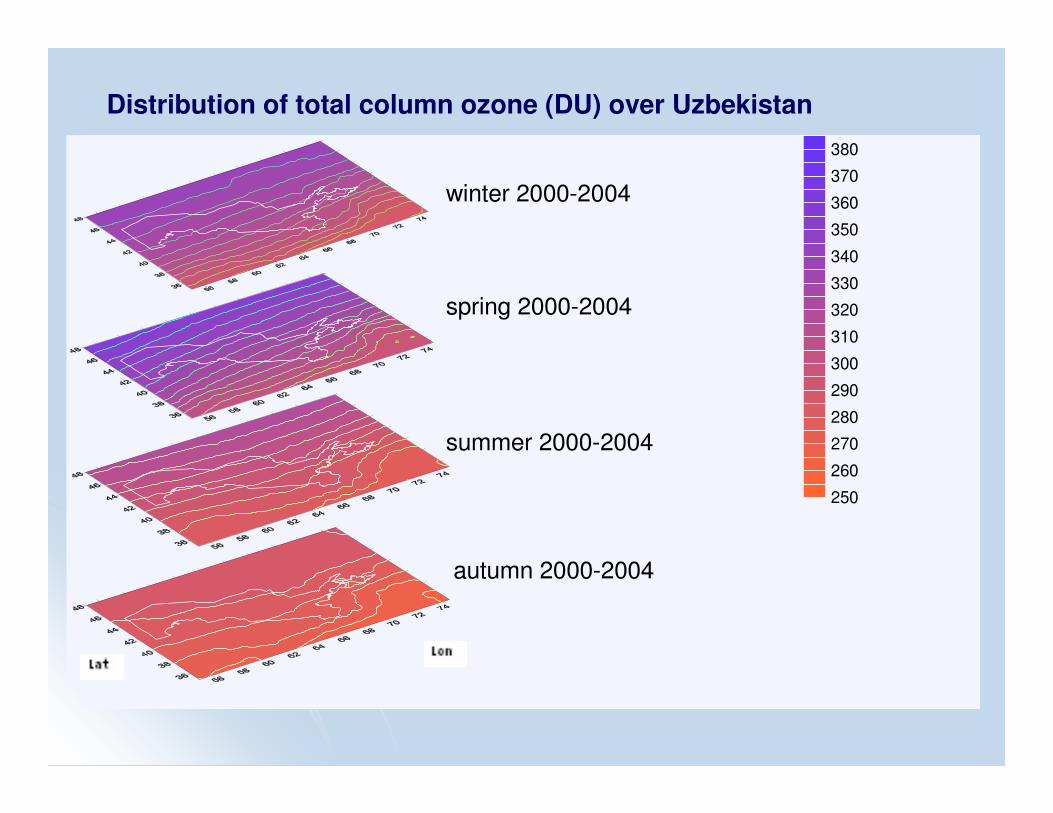
Distribution of total column ozone (DU) over UzbekistanDistribution of total column ozone (DU) over Uzbekistan
This is map of distribution of average for all years TCO values over Uzbekistan, We can see, that TCO varies from 295 DU to 320 DU over the Republic.
280
285
290
295
300
305
310
315Increase of 25 DU observed toward to the north, could be explained by transport of ozone from tropical zones to poles. TCO distribution during different seasons over Uzbekistan we can see the following.
Average 2000-2004
250
260
270
280
290
300
310
320
330
340
350
360
370
380
winter 2000-2004
spring 2000-2004
summer 2000-2004
autumn 2000-2004
Distribution of total column ozone (DU) over Uzbekistan

ThankThank you you
for attention!for attention!
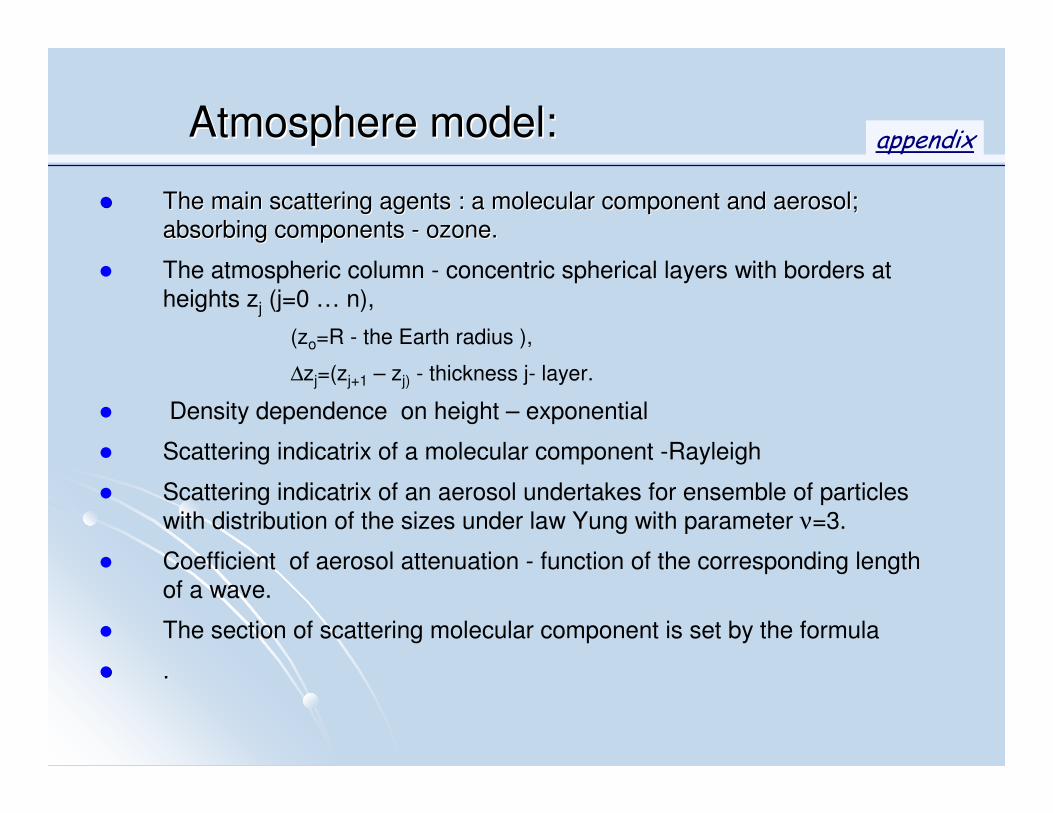
Atmosphere modelAtmosphere model::
The main scattering agents : a molecular component and aerosol; The main scattering agents : a molecular component and aerosol;
absorbing components absorbing components -- ozone.ozone.
The atmospheric column - concentric spherical layers with borders at
heights zj (j=0 … n),
(zo=R - the Earth radius ),
∆zj=(zj+1 – zj) - thickness j- layer.
Density dependence on height – exponential
Scattering indicatrix of a molecular component -Rayleigh
Scattering indicatrix of an aerosol undertakes for ensemble of particles
with distribution of the sizes under law Yung with parameter ν=3.
Coefficient of aerosol attenuation - function of the corresponding length
of a wave.
The section of scattering molecular component is set by the formula
..
appendix
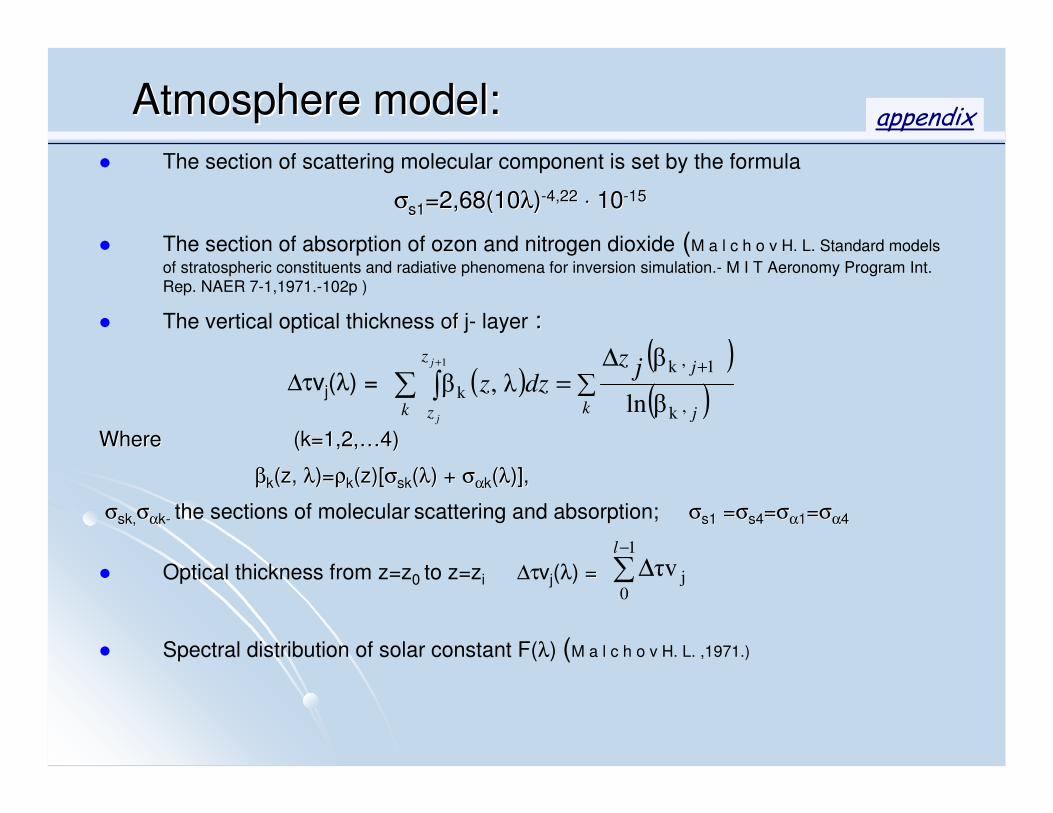
Atmosphere modelAtmosphere model::
The section of scattering molecular component is set by the formula
σσss11=2,68(10=2,68(10λλ))--4,224,22 ⋅⋅ 1010--1515
The section of absorption of ozon and nitrogen dioxide (M a l c h o v H. L. Standard models
of stratospheric constituents and radiative phenomena for inversion simulation.- M I T Aeronomy Program Int. Rep. NAER 7-1,1971.-102p )
The vertical optical thickness of of j- layer ::
Where (k=1,2,Where (k=1,2,……4) 4)
ββkk((zz, , λλ)=)=ρρkk((zz)[)[σσsksk((λλ) + ) + σσααkk((λλ)],)],
σσsk,sk,σσααkk-- the sections of molecular scattering and absorption; σσs1s1 ==σσs4s4==σσαα11==σσαα4 4
Optical thickness from z=z0 to z=zi ∆τvj(λ) ==
Spectral distribution of solar constant F(λ) (M a l c h o v H. L. ,1971.)
( )( )( )∑
∆=
+∑ ∫
+
k j
j
k
z
z
jzdzz
j
j,k
1,k
kβln
βλ,β
1
∆τvj(λ) =
∑−
∆1
0jτv
l
appendix
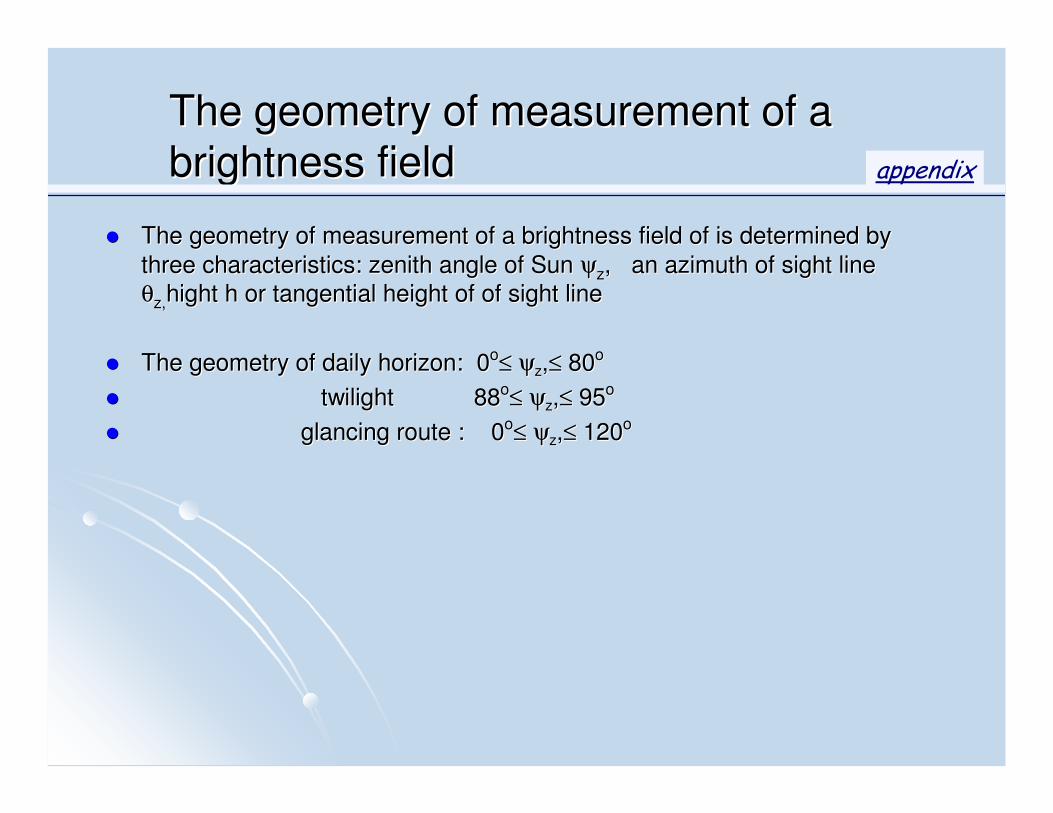
The geometry of measurement of a The geometry of measurement of a
brightness fieldbrightness field
The geometry of measurement of a brightness field of is determinThe geometry of measurement of a brightness field of is determined by ed by
three characteristics: zenith angle of Sun three characteristics: zenith angle of Sun ψψzz, an azimuth of sight line , an azimuth of sight line
θθz,z,highthight h or tangential height of h or tangential height of ofof sight line sight line
The geometry of daily horizon: 0The geometry of daily horizon: 0oo≤≤ ψψzz,,≤≤ 8080oo
twilighttwilight 8888oo≤≤ ψψzz,,≤≤ 9595oo
glancing route : 0glancing route : 0oo≤≤ ψψzz,,≤≤ 120120oo
appendix
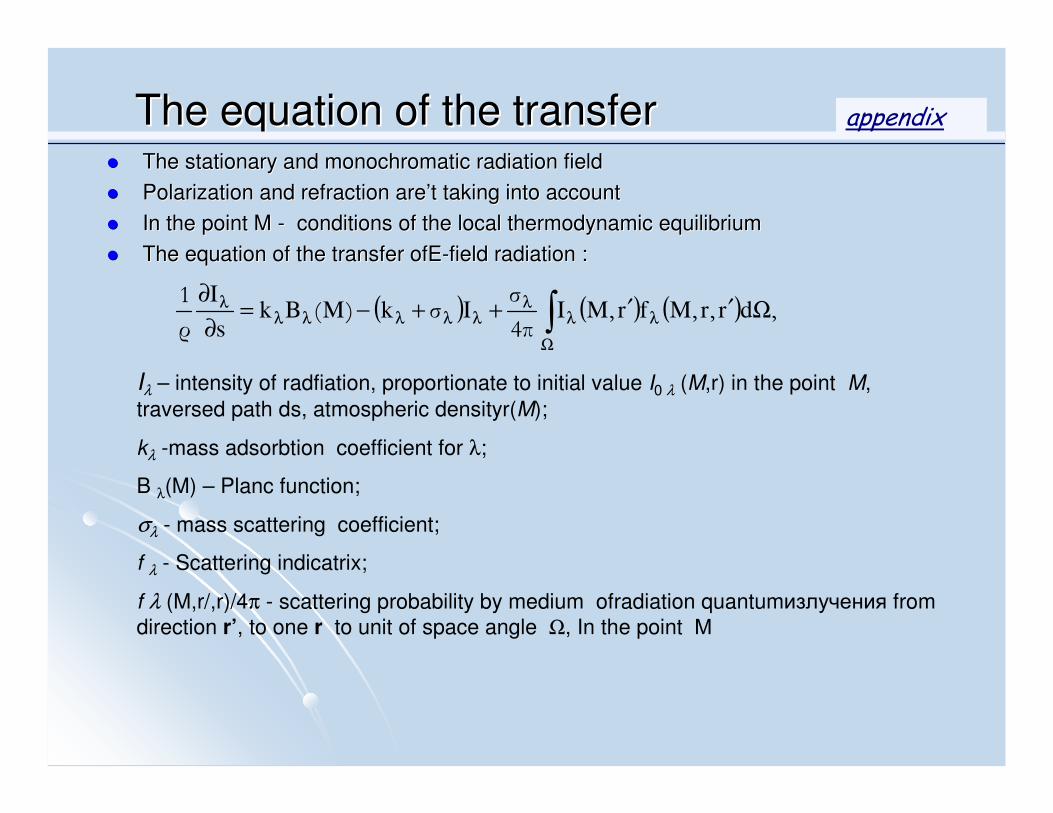
The equation of the transferThe equation of the transfer The The stationarystationary and monochromatic and monochromatic radiationradiation fieldfield
PolarizationPolarization and refraction and refraction areare’’tt taktakinging intointo accountaccount
In the point M In the point M -- conditions of the local conditions of the local thermodynamicthermodynamic equilibriumequilibrium
The equation of the transfer ofThe equation of the transfer ofEE--fieldfield radiationradiation ::
( ) ( ) ( ) ,,,,4π
σσ)(
ρ
1Ω′′++−=
∂∂
λ
Ω
λλ
λλλλλλ ∫ drrMfrMIIkMBks
I
Iλ – intensity of radfiation, proportionate to initial value I0 λ (M,r) in the point M,
traversed path ds, atmospheric densityr(M);
kλ -mass adsorbtion coefficient for λ;
B λ(M) – Planc function;
σλ - mass scattering coefficient;
f λ - Scattering indicatrix;
f λ (M,r/,r)/4π - scattering probability by medium ofradiation quantumизлучения from
direction r’, to one r to unit of space angle Ω, In the point М
appendix
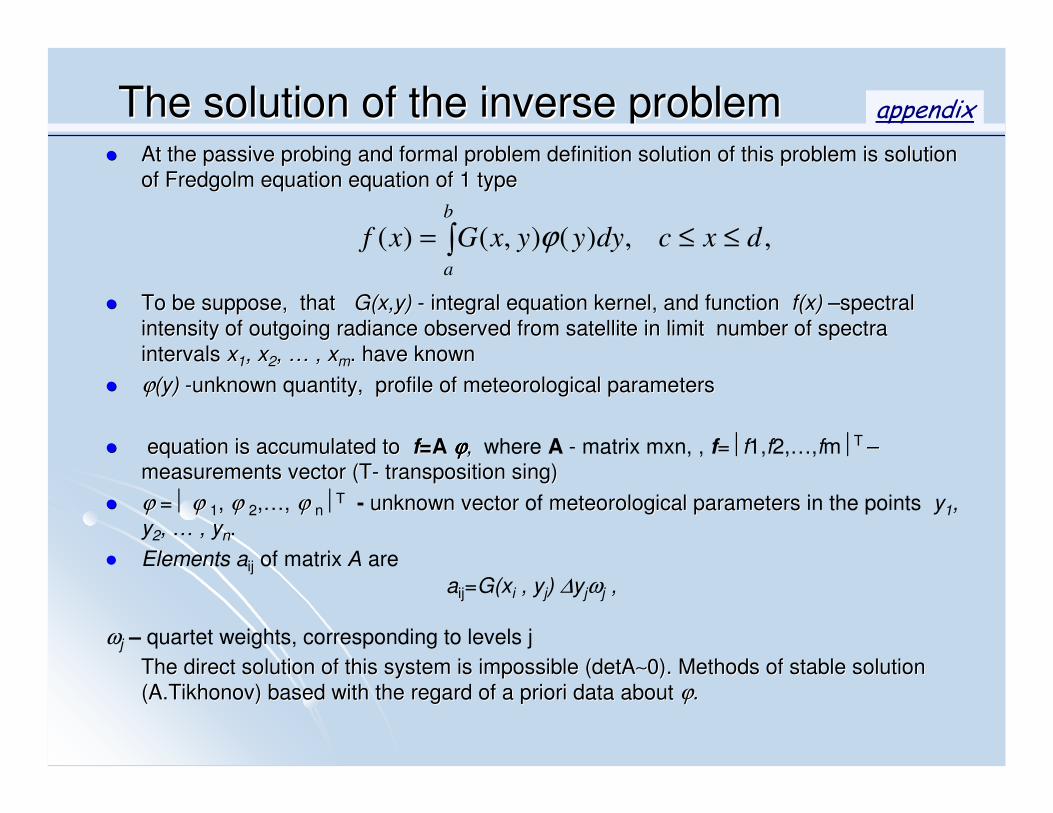
The solution of the inverse problemThe solution of the inverse problem At the At the passivepassive probingprobing and and formalformal problemproblem definitiondefinition solution of this problem is solution of this problem is solutionsolution
ofof FredgolmFredgolm equationequation equationequation of 1 of 1 typetype
To be suppose, that To be suppose, that GG((xx,,yy)) -- integralintegral equationequation kernelkernel, , and function and function ff((xx)) ––spectralspectral
intensityintensity of outgoing radiance of outgoing radiance observedobserved from satellite in limit from satellite in limit numbernumber of spectra of spectra
intervalsintervals xx11, , xx22, , …… , , xxmm. . have knownhave known
ϕϕ(y(y)) --unknown quantity, profile of meteorological parametersunknown quantity, profile of meteorological parameters
equationequation is is accumulateaccumulated to d to ff==A A ϕϕϕϕϕϕϕϕ, , where A - matrix mxn, , f=f1,f2,…,fmT ––
measurements vector (Tmeasurements vector (T-- transposition sing)transposition sing)
ϕϕ = ϕϕ 1, ϕϕ 2,…, ϕϕ nТ - unknown unknown vectorvector of meteorological parametersmeteorological parameters in the points y1, y2, … , yn.
Elements aij of matrix А are
aij=G(xi , yj) ∆yjωj ,
ωj – quartet weights, corresponding to levels j
The direct solution of this system is impossible (detAThe direct solution of this system is impossible (detA∼∼0). Methods of 0). Methods of stablestable solutionsolution
((A.TikhonovA.Tikhonov) based ) based withwith thethe regardregard of aof a prioripriori datadata about about ϕϕ..
∫ ≤≤=b
a
dxcdyyyxGxf ,,)(),()( ϕ
appendix