Embed Size (px)
Citation preview

National Institute for Environmental Studies, Japan
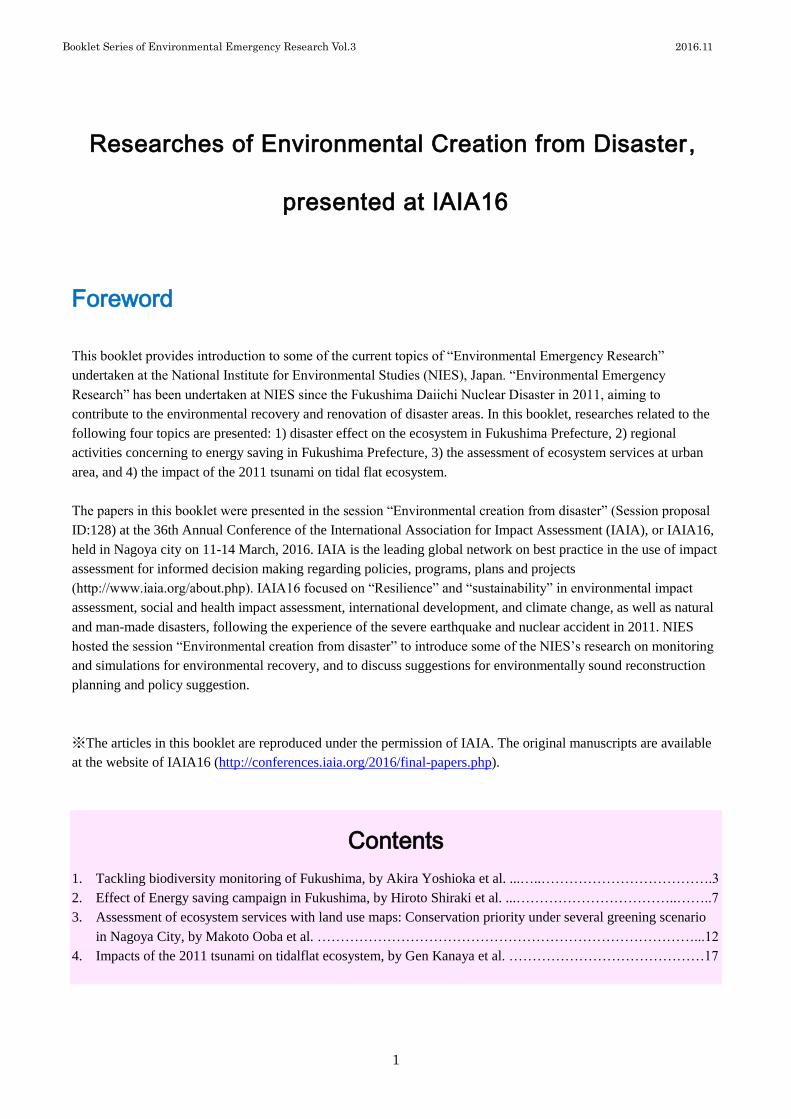
Reserarches of Environmental Creationfrom Disaster, presented at IAIA16
Booklet Series of Environmental Emergency Research Vol.3
2016 .11
ISSN 2189- 9711
Booklet Series of Environmental Emergency Research Vol.3 2016.11
1
Researches of Environmental Creation from Disaster,
presented at IAIA16
Foreword
This booklet provides introduction to some of the current topics of “Environmental Emergency Research”
undertaken at the National Institute for Environmental Studies (NIES), Japan. “Environmental Emergency
Research” has been undertaken at NIES since the Fukushima Daiichi Nuclear Disaster in 2011, aiming to
contribute to the environmental recovery and renovation of disaster areas. In this booklet, researches related to the
following four topics are presented: 1) disaster effect on the ecosystem in Fukushima Prefecture, 2) regional
activities concerning to energy saving in Fukushima Prefecture, 3) the assessment of ecosystem services at urban
area, and 4) the impact of the 2011 tsunami on tidal flat ecosystem.
The papers in this booklet were presented in the session “Environmental creation from disaster” (Session proposal
ID:128) at the 36th Annual Conference of the International Association for Impact Assessment (IAIA), or IAIA16,
held in Nagoya city on 11-14 March, 2016. IAIA is the leading global network on best practice in the use of impact
assessment for informed decision making regarding policies, programs, plans and projects
(http://www.iaia.org/about.php). IAIA16 focused on “Resilience” and “sustainability” in environmental impact
assessment, social and health impact assessment, international development, and climate change, as well as natural
and man-made disasters, following the experience of the severe earthquake and nuclear accident in 2011. NIES
hosted the session “Environmental creation from disaster” to introduce some of the NIES’s research on monitoring
and simulations for environmental recovery, and to discuss suggestions for environmentally sound reconstruction
planning and policy suggestion.
※The articles in this booklet are reproduced under the permission of IAIA. The original manuscripts are available
at the website of IAIA16 (http://conferences.iaia.org/2016/final-papers.php).
Contents
1. Tackling biodiversity monitoring of Fukushima, by Akira Yoshioka et al. ...…..……………………………….3
2. Effect of Energy saving campaign in Fukushima, by Hiroto Shiraki et al. ...……………………………..……..7
3. Assessment of ecosystem services with land use maps: Conservation priority under several greening scenario
in Nagoya City, by Makoto Ooba et al. ………………………………………………………………………...12
4. Impacts of the 2011 tsunami on tidalflat ecosystem, by Gen Kanaya et al. ……………………………………17

Booklet Series of Environmental Emergency Research Vol.3 2016.11
2
1. Tackling biodiversity monitoring of the Fukushima
evacuation zone
Akira Yoshioka 1, Yoshio Mishima 2, Nao Kumada 2, Keita Fukasawa 2
1 Fukushima Branch, National Institute for Environmental Studies 2 Center for Environmental Biology and Ecosystem Studies, National Institute for Environmental Studies
1.1 Introduction
A serious nuclear accident at the Fukushima Daiichi power plants in 2011 was followed by mass and
long-term evacuation from highly contaminated area. Although radiation levels in the most of the evacuation zone
were considered not to be acutely lethal for wildlife (Garnier-Laplace et al. 2011), it has been hypothesized that
land use change by decontamination and the cessation of usual anthropogenic activities such as farming and
gardening significantly affect the biodiversity and ecosystem services in the zones. A meta-analysis of farmland
abandonment suggests that this phenomenon has frequently had a negative effect on biodiversity in Africa, Asia,
and Europe (Queiroz et al. 2014), where the history of anthropogenic land use is relatively long.
Furthermore, the most of the evacuation zone in Fukushima is assumed to have been historically covered by
forests and farmlands, and the residents had been benefited from ecosystem services from SATOYAMA, Japanese
traditional agricultural landscapes, characterized by rich biodiversity (Kadoya and Washitani 2011). Therefore,
scientific monitoring of ecosystems and biodiversity is required to lead the return and reconstruction to success.
However, there are some difficulties for the effective biodiversity monitoring in the Fukushima. The
evacuation zone is large and environmentally heterogeneous. Furthermore, entry to the evacuation zone has been
strictly regulated. In addition, long-term monitoring including data sampling after return and reconstruction will
be need to appropriately know what the evacuation has brought, because biodiversity data before the nuclear
accident are quite limited. In order to conduct systematic and rigorous monitoring and obtain ecologically reliable
data, monitoring protocols must be considerably-designed. Furthermore, the result of monitoring should be as
transparent and open as possible to residents, because scientific conclusion based on unpublished data induce
misleading and/or less credible for residents and fail to support decision-making.
In this paper, we will report protocols and current status of terrestrial biodiversity monitoring conducted as a
part of the Environmental Emergency Research project in the National Institute for Environmental Studies, Japan
(NIES), which aims to provide scientific supports of recovery and recreation of environment in the Fukushima
disaster area.
1.2 Monitoring system
The terrestrial biodiversity monitoring by NIES has started from 2014, aiming to obtain knowledge on what
the large-scale and long-term evacuation brought on biodiversity and ecosystems in the area, which can support
return of residents once had been benefited from various ecosystem services before the accident. The monitoring
was conducted mainly by ecologists and experts on remote-sensing and geo-informatics, including authors of the
paper as core members. In order to conduct relatively long-term (at least about ten years) monitoring effectively
by limited effort, we determined to focusing on Mammals, Birds, Frogs, Insects, Vegetation and Land Cover/Land
Use Change. Not only they are quite important indicators of biodiversity and ecosystems, but also monitoring
protocols of them can be improved to be automatic, cost-effective, and standardized, using digital devices that are
remarkably developing. Digital devices can also make it easier to sharing data with local residents. We will show
Booklet Series of Environmental Emergency Research Vol.3 2016.11
3
our attempt to establish monitoring protocols and the current status below.
1.3 Monitoring protocols and current status
(1) Mammals
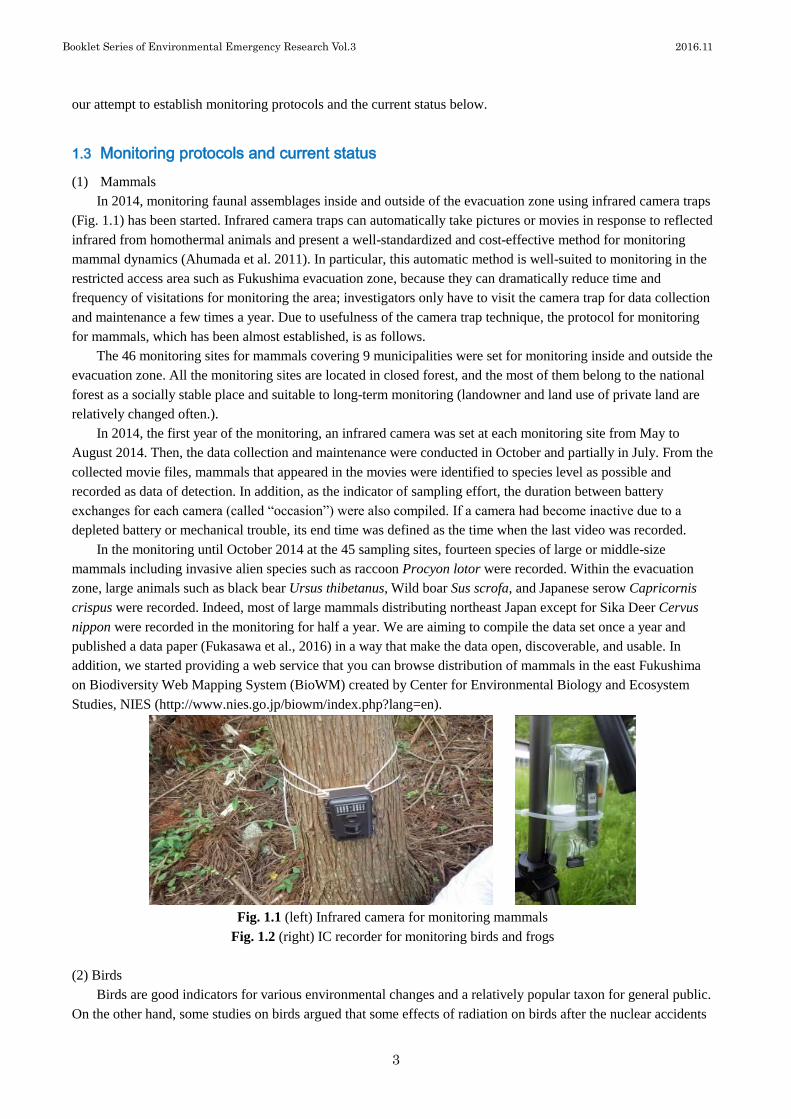
In 2014, monitoring faunal assemblages inside and outside of the evacuation zone using infrared camera traps
(Fig. 1.1) has been started. Infrared camera traps can automatically take pictures or movies in response to reflected
infrared from homothermal animals and present a well-standardized and cost-effective method for monitoring
mammal dynamics (Ahumada et al. 2011). In particular, this automatic method is well-suited to monitoring in the
restricted access area such as Fukushima evacuation zone, because they can dramatically reduce time and
frequency of visitations for monitoring the area; investigators only have to visit the camera trap for data collection
and maintenance a few times a year. Due to usefulness of the camera trap technique, the protocol for monitoring
for mammals, which has been almost established, is as follows.
The 46 monitoring sites for mammals covering 9 municipalities were set for monitoring inside and outside the
evacuation zone. All the monitoring sites are located in closed forest, and the most of them belong to the national
forest as a socially stable place and suitable to long-term monitoring (landowner and land use of private land are
relatively changed often.).
In 2014, the first year of the monitoring, an infrared camera was set at each monitoring site from May to
August 2014. Then, the data collection and maintenance were conducted in October and partially in July. From the
collected movie files, mammals that appeared in the movies were identified to species level as possible and
recorded as data of detection. In addition, as the indicator of sampling effort, the duration between battery
exchanges for each camera (called “occasion”) were also compiled. If a camera had become inactive due to a
depleted battery or mechanical trouble, its end time was defined as the time when the last video was recorded.
In the monitoring until October 2014 at the 45 sampling sites, fourteen species of large or middle-size
mammals including invasive alien species such as raccoon Procyon lotor were recorded. Within the evacuation
zone, large animals such as black bear Ursus thibetanus, Wild boar Sus scrofa, and Japanese serow Capricornis
crispus were recorded. Indeed, most of large mammals distributing northeast Japan except for Sika Deer Cervus
nippon were recorded in the monitoring for half a year. We are aiming to compile the data set once a year and
published a data paper (Fukasawa et al., 2016) in a way that make the data open, discoverable, and usable. In
addition, we started providing a web service that you can browse distribution of mammals in the east Fukushima
on Biodiversity Web Mapping System (BioWM) created by Center for Environmental Biology and Ecosystem
Studies, NIES (http://www.nies.go.jp/biowm/index.php?lang=en).
Fig. 1.1 (left) Infrared camera for monitoring mammals
Fig. 1.2 (right) IC recorder for monitoring birds and frogs
(2) Birds
Birds are good indicators for various environmental changes and a relatively popular taxon for general public.
On the other hand, some studies on birds argued that some effects of radiation on birds after the nuclear accidents

Booklet Series of Environmental Emergency Research Vol.3 2016.11
4
(Møller et al. 2015; Murase et al. 2015). Therefore, data-sharing with general public and the residents are
particularly important.
As a measure for monitoring, we adopted recording song of birds using IC recorders with timer function (Fig. 1.2).
Although this method is automatic and suitable to monitoring in the restricted access area, extracting data of
presence of bird from amount of sound files is a challenge.
From 2014, the Bird monitoring by NIES has started at 52 sites covering 9 municipalities, including the
evacuation zone. All the monitoring sites were located within schoolyards (including those that had been
converted to community centers), which are relatively socially stable and can minimize differences in the local
conditions.
The IC recorders record surrounding sound including song of birds for twenty minutes per day around sunrise
from middle May to end of June. Then, from a part of sound files, presences of each bird species were checked by
experts and documented.
Furthermore, we conducted an event called “Bird Data Challenge” collaborating with local branches of Wild
Bird Society of Japan and extract and identified a part of the sound data with bird watchers in Fukushima
prefecture. This was a new and important attempt to compile the data sampled by researchers simultaneously
sharing with citizens. In addition to a data paper, we are preparing a paper reporting details of the event.
(3) Frogs
Frogs need inland water ecosystems to complete their life-cycle. Thus, cessation of management of rice paddy
fields within the evacuation zone can be problematic.
Their croaking has been also monitored using same IC recorders for bird monitoring in the same locations.
Sound for ten minute per day around 20:00 on each day has been recorded from middle May to the end of June in
2014. As well as bird song, extraction of frog song is a challenge, though their song is relatively simple. Now, we
are extracting song as training data and trying constructing automatic song detection system based on machine
learning method.
(4) Insects
Although insects play an important role in ecosystem functions and serve as pollinators, pests, and prey for
birds and mammals, their diversity and small size make it difficult to conduct cost-effective and automatic
monitoring. At first, we focused on flying insects, including important pollinators such as Apidae, and medically
important pests, such as flies and hoverflies.
In 2014, we conducted sampling by Malaise traps (Fig. 1.3a) from the middle May to the early July in the
location where the IC recorders for bird monitoring were set in order to survey a broad range of flying insects. In
result, the abundance of carpenter bees Xylocopa appendiculata was detected to be lower within the evacuation
zone. In contrast, those of most of the collected taxa including pollinators were even higher in the evacuation area,
or not different between these areas. Please see Yoshioka et al. (2015) for further details of the data in 2014.
From the 2015, in order to make the monitoring more efficient, the flight intercept traps (Fig. 1.3b) were
introduced in the all monitoring sites. In addition, malaise traps were also set in a part of monitoring sites.
Furthermore, development of other sampling technique using digital devices was under consideration to cover
insect groups which could not be detected by these traps.
(a) (b) Fig. 1.3 (a) Malaise trap and (b) flight intercept trap for monitoring flying insects such as pollinators
Booklet Series of Environmental Emergency Research Vol.3 2016.11
5
(5) Vegetation and LCLUC
Vegetation and Land Cover/Land Use Change (LCLUC) were also a target of monitoring in our project. They
are hypothesized to be dramatically changed by decontamination and land abandonment in the evacuation zone,
and affect biodiversity and ecosystem services.
From 2014, we are compiling satellite images and ground-truth data by cameras with GPS and/or drive
recorders sampled per year, in addition to aerial photos as supplement data. Using these data, we are developing
model predicting and mapping vegetation based on machine learning method, focusing on dynamics of croplands.
Publishing compiled map in future is also under consideration.
1.4 Conclusion
Although continuous biodiversity monitoring in the Fukushima is quite a challenge and it may take a time to
obtain the outcome, our project has been developing cost-effective and automatic protocol to conquer these
problems. These protocol will be support not only effective biodiversity monitoring in the Fukushima, but also
effort-saving biodiversity monitoring at any other restricted access areas.
References
Ahumada JA, Silva CEF, Gajapersad K, Hallam C, Hurtado J, Martin E, McWilliam A, Mugerwa B, O'Brien T,
Rovero F, Sheil D, Spironello WR, Winarni N, Andelman SJ (2011) Community structure and diversity of
tropical forest mammals: data from a global camera trap network. Philos. T. Roy. Soc. B 366: 2703-2711.
Fukasawa K, Mishima Y, Yoshioka A, Kumada N, Totsu K, Osawa T (2016) Mammal assemblages recorded by
camera traps inside and outside the evacuation zone of the Fukushima Daiichi Nuclear Power Plant accident.
Ecol. Res. 31(4):493. doi: 10.1007/s11284-016-1366-7
Garnier-Laplace J, Beaugelin-Seiller K, Hinton TG (2011) Fukushima wildlife dose reconstruction signals
ecological consequences. Environ. Sci. Technol. 45: 5077-5078.
Møller AP, Nishiumi I, Mousseau TA (2015) Cumulative effects of radioactivity from Fukushima on the
abundance and biodiversity of birds. J. Ornithol. 156 (Supple 1): 297-305.
Kadoya T, Washitani I (2011) The Satoyama Index: A biodiversity indicator for agricultural landscapes. Agric.
Ecosyst. Environ. 140: 20-26.
Murase K, Murase J, Horie R, Endo K (2015) Effects of the Fukushima Daiichi nuclear accident on goshawk
reproduction. Sci. Rep. 5: 9405. doi:10.1038/srep09405
Queiroz C, Beilin R, Folke C, Lindborg R (2014) Farmland abandonment: threat or opportunity for biodiversity
conservation? A global review. Front. Ecol. Environ. 12: 288-296.
Yoshioka A, Mishima Y, Fukasawa K (2015) Pollinators and other flying insects inside and outside the
Fukushima evacuation zone. PLOS ONE 10: e0140957. doi:10.1371/journal.pone.0140957
Booklet Series of Environmental Emergency Research Vol.3 2016.11
6
2. Effect of Energy Saving Campaign in Fukushima
Hiroto Shiraki 1, Hiroki Tanaka 2, Shogo Nakamura 3
1 Center for Social and Environmental Systems Research, National Institute for Environmental Studies
(currently at University of Shiga Prefecture) 2 Fujitsu Research Institute, Japan 3 Fukushima Branch, National Institute for Environmental Studies
2.1 Introduction
Expectation of a distributed local energy system is growing to utilize local energy sources and to develop
resilient energy supply system after the Great East Japan Disaster of 2011. Especially some municipal
governments in Tohoku region promote to develop it not only for development of the resilient energy system but
also for the reconstruction from the disaster (Tohoku Regional Advancement Center, 2013). The data related to
energy demand, such as the amount of demand, price elasticity, and energy saving potential, are useful to design
adequate system for the area. These data are also expected to mitigate brown out during the peak demand period.
There are some existing empirical studies focusing on the energy demand side in Japan. Ito et al. (2015)
investigated the influence of moral suasion and economic incentives to electricity demand by using
household-level consumption data in Keihanna area of Kyoto prefecture. Mukai et al. (2015) estimated the peak
and daily demand saving effect by the four interventions; economic incentives, real time feedback, weekly advice
report, and peak alert. However, these studies are focused on the urban area. Thus it is necessary to identify the
effect of demand side management in the rural area where the development of the distributed local energy system
is expected.
In this study, we estimated the effect of energy saving campaign, which encourage reducing electricity
demand by visualizing their demand data and providing advice reports, in Shinchi Town in Fukushima prefecture,
Japan. In the Great East Japan Disaster of 2011, this town has suffered enormous human and physical loss. In
2012, it was selected as an FutureCity, and are reconstructing with harmonizing regional society, economy, and
environment. A distributed local energy system is also planned in this town. Thus, the result of this study can help
it as local energy demand data.
2.2 Methods
Effect of energy saving campaign was estimated by following three steps. First, we recruited the household
who adopt the electricity monitoring and distributed the monitoring system. Next, the energy saving campaign
was conducted to the household who confirmed their participation. Finally, effect of energy saving campaign was
estimated by statistical analysis using monitoring data.
(1) Installing the electricity monitoring system
We distributed power monitoring system and tablet computer to about 62 households lived in detached houses
in Shinchi Town in Japan from June 2014 to March 2015. Electricity consumption of household total and 6
selected lines were measured by 15 minutes’ step. Hourly electricity consumption of individual household is
visualized by the dedicated application in the tablet computer. The dedicated application has seven functions; the
electricity visualization, the regional information map, the regional bulletin board, health support advice, disaster
information, the online questionnaire, and the What’s New in the local municipality. The frequency of using each
Booklet Series of Environmental Emergency Research Vol.3 2016.11
7
function in the application is also monitored. Note that although the number of participants is relatively small for
the statistical analysis, the participants had already reached more than 2% of total households in Shinchi Town.
Thus, it is future task to recruit large scale sample not only Shinchi Town but surrounding municipality to increase
the possibility of statistical analysis.
(2) Designing the energy saving campaign
Energy saving campaigns was implemented three times in the fiscal year 2014; September 8th to 21st,
November 5th to 18th, and March 8th to 21st. We asked the households about the participation in the energy saving
campaign through the tablet for approximately one week before the campaign. 22 and 12 households of 50, and 24
households of 57 were participated to each campaign, respectively.
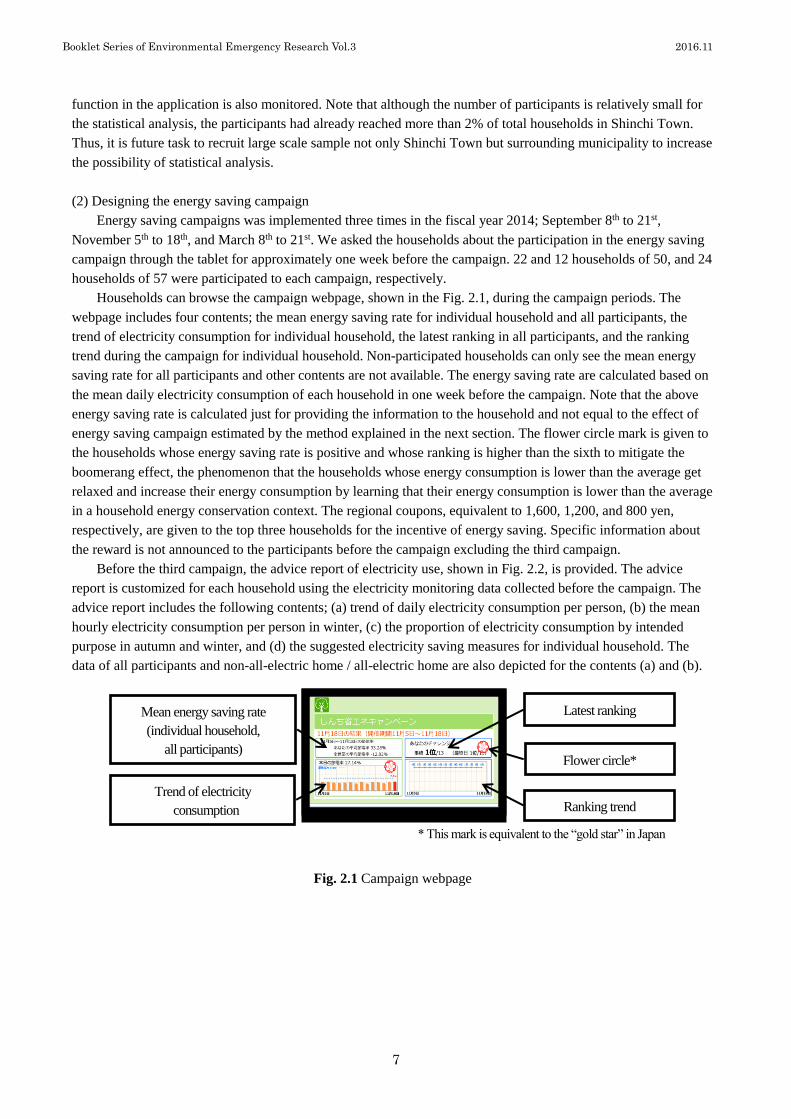
Households can browse the campaign webpage, shown in the Fig. 2.1, during the campaign periods. The
webpage includes four contents; the mean energy saving rate for individual household and all participants, the
trend of electricity consumption for individual household, the latest ranking in all participants, and the ranking
trend during the campaign for individual household. Non-participated households can only see the mean energy
saving rate for all participants and other contents are not available. The energy saving rate are calculated based on
the mean daily electricity consumption of each household in one week before the campaign. Note that the above
energy saving rate is calculated just for providing the information to the household and not equal to the effect of
energy saving campaign estimated by the method explained in the next section. The flower circle mark is given to
the households whose energy saving rate is positive and whose ranking is higher than the sixth to mitigate the
boomerang effect, the phenomenon that the households whose energy consumption is lower than the average get
relaxed and increase their energy consumption by learning that their energy consumption is lower than the average
in a household energy conservation context. The regional coupons, equivalent to 1,600, 1,200, and 800 yen,
respectively, are given to the top three households for the incentive of energy saving. Specific information about
the reward is not announced to the participants before the campaign excluding the third campaign.
Before the third campaign, the advice report of electricity use, shown in Fig. 2.2, is provided. The advice
report is customized for each household using the electricity monitoring data collected before the campaign. The
advice report includes the following contents; (a) trend of daily electricity consumption per person, (b) the mean
hourly electricity consumption per person in winter, (c) the proportion of electricity consumption by intended
purpose in autumn and winter, and (d) the suggested electricity saving measures for individual household. The
data of all participants and non-all-electric home / all-electric home are also depicted for the contents (a) and (b).
Fig. 2.1 Campaign webpage
Latest ranking
Ranking trend Trend of electricity
consumption
Mean energy saving rate
(individual household,
all participants) Flower circle*
* This mark is equivalent to the “gold star” in Japan

Booklet Series of Environmental Emergency Research Vol.3 2016.11
8
Fig. 2.2 Example of advice report for electricity use
(3) Estimating the effects of energy saving campaign
Effect of energy saving campaign was estimated by following fixed-effect model following the existing study
[2]:
(1)
where is total daily electricity consumption in household in day . equals 1 if household participate the
energy saving campaign in day . is a matrix which related to electricity consumption such as mean temperature in
day , mean temperature in previous three days, mean humidity in the day , and weekday dummy. is fixed effect
of household . is intercept, and are estimated coefficients for each variable, and is error term.
Daily electricity consumption data of 48, 45, and 53 households were used in the analysis after the exclusion of the
household with missing value although the numbers of participated households were 50 in the 1st and 2nd campaign and
57 in the 3rd campaign. We employed the difference-in difference design and the data from the pre-experiment days and
treatment days were included in the fixed-effect model.
2.3 Results and discussion
Table 2.1 shows the results of regression analysis. The number in the brackets is the standard error. Because
we use the natural log for the explained variable, the values in the table are log points. The effects in the exact
percentage term can calculated by . The variables which related to electricity consumption are
statistically significant excluding mean temperature in the previous three days in the second campaign. Row 1 in
Table 2.1 shows the effects of energy saving campaign on daily electricity use. The first energy saving campaign
in September has a negative effect to the electricity consumption by 0.01 log points (0.96 percent) with
statistically insignificant. The second campaign in November has a positive effect by 0.05 log points (5.09
percent). One of the reason may be due to the wearout effect according to the analysis with the application use
data explained in the next paragraph. The third campaign which distributes the advice report of electricity use
caused a reduction in daily electricity consumption by 0.029 log points (2.86 percent) with statistically significant
(1 percent level).
Mean hourly electricity
consumption per person
in winter
Trend of daily electricity
consumption per person
Suggested
electricity
saving
measures
Proportion of electricity
consumption by intended
purpose in autumn and
winter

Booklet Series of Environmental Emergency Research Vol.3 2016.11
9
Table 2.1 Effects of Energy saving campaign on daily electricity use
1st campaign 2nd campaign 3rd campaign
Energy saving campaign -0.010 0.050*** -0.029***
(0.012) (0.016) (0.009)
Mean temp. in the day 0.008*** -0.018*** -0.025***
(0.002) (0.002) (0.001)
Mean temp. in the previous three days 0.020*** -0.001 -0.006***
(0.003) (0.002) (0.002)
Mean humidity in the day 0.001*** 0.002*** 0.001***
(0.000) (0.000) (0.000)
Weekday dummy -0.031*** -0.023*** -0.046***
(0.007) (0.007) (0.006)
Intercept 1.844*** 2.714*** 2.940***
(0.051) (0.028) (0.017)
N (# of household) 48 45 53
Significant code: *** 1%, no symbol >10%. The number in the brackets is the standard error.
Fig. 2.3 shows the median of application use per week by participants and non-participants in each campaign.
Basically, the frequencies of application use of participants are higher than that of non-participants in every period.
This implies that the participants have higher interests in the application use includes checking their electricity
consumption. Comparing to the application use by participants among the campaigns, the frequency of application
use in first week in the second campaign was low (0.5 times in a week). This may be caused by the decrease of
interest due to repeating the same campaign. The increase of application use in second week in the second
campaign may be attributed to the checking their final ranking because most of application use were concentrate
near the last campaign day. The use in the first week in the third campaign was high. This may occur due to two
reasons; visiting to each household in the week before the campaign and distributing the advice report of
electricity use.
The application use in the second campaign period which has positive effect to the electricity consumption
was low and that in the third campaign which has negative effect was high. In addition, the application use may be
related to the interests in the application and campaign. Thus, the application use may explain the effect of energy
saving campaign. It is useful to analyze causal connection with the application use, the energy saving conscious,
and the effect of the energy saving to identify the way to promote the energy saving effects.
Fig. 2.3 Median of app. use per week by participants and non-participants
This study which focused on detached houses in the rural area shows relatively small effect compare to the
existing study which reported 10.1 percent decrease in the multiple dwelling houses in urban area (Mukai et al.,
Booklet Series of Environmental Emergency Research Vol.3 2016.11
10
2015). The reason of the difference may attribute to the household size. The average household size in this study
was 4.3 while that in the existing study was 2.6. Some participants argued that some members in their house were
not interested in and uncooperative to the campaign in the hearing survey. The possibility of uncooperative
participants would rise by increasing household size. Thus the incentive for the uncooperative participants might
be the key to increase the effect of the campaign detached houses in the rural area.
2.4 Conclusion
In this study, we present the results of monitoring survey to evaluate the effect of energy saving campaign in
Shinchi Town in Fukushima prefecture, Japan. The campaigns were implemented three times in the fiscal year
2014 and effect of energy saving campaign was estimated by fixed-effect model. The results showed that the first
and third campaigns have 0.96 percent and 2.86 percent of negative effect to the electricity consumption. The
advice report of electricity use may enhance the negative effect. The second campaign has 5.09 percent of positive
effect to the electricity consumption. This may be due to the “wear-out” effect. The application use in the second
campaign period which has positive effect to the electricity consumption was low and that in the third campaign
which has negative effect was high. It is necessary to establish the system to continuously promote the energy
saving motivation of household.
Acknowledgment
This study is supported by the Environmental Research & Technology Development Fund, the Ministry of
Environment of Japan, under permission No. 2–1404. We appreciate this support and express our heartfelt thanks.
We are grateful to the cooperation of the households and local government in the analyzed region.
References
Tohoku Regional Advancement Center (2013) Research report about the development of smart community in
Tohoku region (In Japanese), http://www.kasseiken.jp/pdf/library/guide/24fy-03.pdf
Ito K., Ida T., Tanaka M. (2015) The persistence of moral suasion and economic incentives: field experimental
evidence from energy demand, National Bureau of Economic Research, w20910.
Mukai T., Nishio K., Komatsu H., Uchida T., Ishida K. (2015) Peak Demand Management on High-Voltage Power
Receiving Condominium II: Evidence of Peak Savings' Temporal Change and Factors from the Winter of
FY2013 (In Japanese), Journal of Japan Society of Energy and Resources, 36(4).

Booklet Series of Environmental Emergency Research Vol.3 2016.11
11
3. Assessment of ecosystem services with land use maps:
Conservation priority under several greening scenario in Nagoya
City
Makoto Ooba 1, Kiichiro Hayashi 2, Hideyuki Ito 3
1 Fukushima Branch, National Institute for Environmental Studies 2 Nagoya University, Japan 3 Nihon University, Japan
3.1 Introduction
Population decline causes multiple problems in also urban area: shrinking resident area, infrastructure and
security problems, difficult to maintain shrunk area. While well-being of resident living in urban area related to
not only artificial services such as transportation, accessibility of communal and commercial facilities, and
security but also natural services from ecosystem (landscape, recreation, and so on) and rich biodiversity.
Aichi prefecture installed the mitigation system, "Aichi method" that is the first system of ecosystem offset in
Japan. The quantitative assessment tool was provided by the prefecture and the mitigation recommended to create
ecological network by compensation between development and offset sites. However quantitative spatial statistics
and ecosystem services are not referred by the tool.
Geographic Information Systems (GIS) in particular are often used to spatially evaluate ESs, however, it can
be stated that integrated quantitative evaluation tools which would encompass all ES concepts are still at the
research and development stage. A number of conservation planning support softwares were developed and
applied that use GIS to conserve certain specified species. For example, Moilanen et al. (2011) have used
Zonation to show biodiversity, carbon storage services, agricultural supply services and competitive land use
analysis of land use in cities in Great Britain. In this study, we depict an application of spatial assessment scheme
by using of relatively simple method to estimate ES in Nagoya City (Ooba et al., 2015), and the methodology is
clear and input data mainly depended on landuse map. This information may be useful for mitigation systems such
as "Aichi method".
The objective of this study was assessment of ecosystem services and comparison among current and future
with scenarios. Quantitative and geographical evaluation of ecosystem services is useful for finding high-priority
conservation sites. By using of a geographical information system (GIS), ecosystem services were estimated from
proxy variables using primary values almost same as the previous study (Ooba et al., 2015). To validate the
scenarios, conservation priority maps were compared.
3.2 Methodology
(1) Study area
Nagoya City is located in central Japan. Nagoya City (ca. 32,600 ha) represents urban Japan with a population
of about 2,260,000, and is the fourth largest city in Japan (Yokohama City, 2016).
(2) Methods of ES estimation
Methodology is the almost same as the previous study (Ooba et al., 2015). Digital land use map of Nagoya in
1997 at 10 m mesh level was used to categorize five types of land use: water surface, residential and industrial

Booklet Series of Environmental Emergency Research Vol.3 2016.11
12
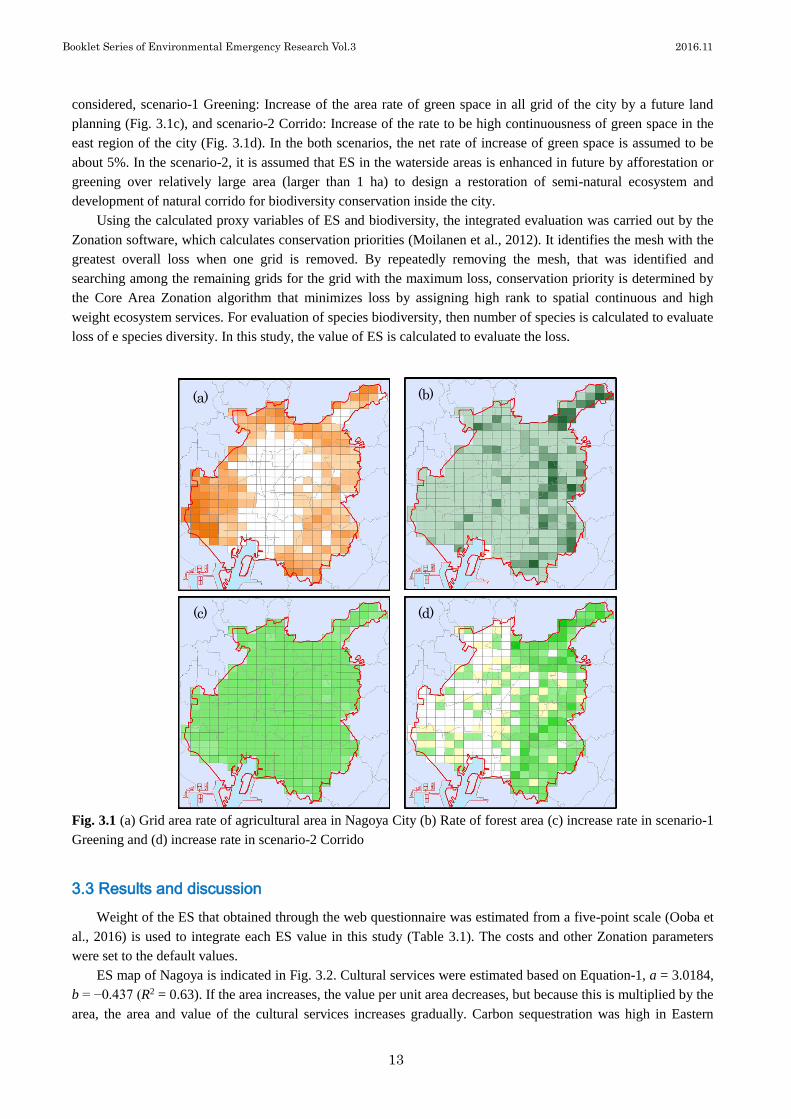
area (urban area), road, agricultural field, and forest (Fig. 3.1a, b).
The following variables were selected as proxy for ecosystem services (Table 3.1). Five variables were
considered, carbon sequestration, food supply, soil erosion, cultural variable, and biodiversity variable. The
cultural services were estimated by internet questionnaire survey. Recreation economic value is estimated by
generalized round-trip costs per capita were calculated based on required costs such as transportation and transfer
facility usage costs (Ooba et al., 2016). Four major green areas (area: 6.18 to 84.9 ha) in Nagoya City were
selected and the generalized round-trip costs to green areas and the other attribute from a questionnaire survey in
2014 (2,800 samples from Aichi Prefecture). The results of the result were used to estimate the economic values
of cultural services. The economic value V (106 JPY ha-1 y-1) per unit of area was estimated as follows:
V = a Ab (1)
Where A is area (ha), a and b are parameters obtained by a regression calculation (b < 0). For a green space of 1 ha
or greater, respective services were evaluated.
These variables were estimated at the Japanese standard mesh defined by Japan Industrial Standard,
corresponding to about 1 km-grid.
The estimated values are shown by different unit, so for inter-comparison purposes, values were convert into
[0, 1] scale by maximum and minimum value. Soil erosion variables have negative effect (high variables means
high negative ecosystem services), then the variable was converted into [0, 1] scale. Although all of distributions
of ES variables have exponential distributions, variables are convert by logarithmic conversion to be normal
distribution before the [0, 1] conversion. 0-value of variable is replaced a minimum value of corresponding ES
distribution due to the logarithmic conversion.
Table 3.1 Variables of proxy for ecosystem services and summary of estimation methods
ES Estimation Method details1 Unit Weight2
Support Carbon sequestration 3.09(F) t/y ha 0.200
Provision Food production 2.98(A) t/y ha 0.180
Regulation Reduction of soil
erosion coefficient
compared to bare soil
S = 65.41sin2θ+ 4.56sinθ+ 0.065
C = 1 (U), 0.33(A), 0.0085(F) - 0.207
Culture Economic value of
green space
Value per unit area as green belt
area A(ha) V = 3.0184A-0.437
106
JPY/y 0.209
Habitat Continuity of green
space
ArcGIS tool (Focal statistics)
proximity as 2 km radius - 0.205
1 Land-use codes—U: Roads and urban areas, F: Forestland, A: Agricultural land: The detailed description of
parameters and equation can find in Ooba et al. (2015) 2 The values that are an average of importance to ES are used for an integration of ES
Table 3.2 Landuse change scenarios
Scenario Change of agricultural and forest area
BAU Business as usual (no change)
(1) Greening Increase forest area in every grid (Total increase is 5% in the city)
(2) Corrido Increase forest in the eastern area of the city. Restoration of semi-natural
ecosystem and development of natural corrido for biodiversity near water
surface (rivers and ponds). Incensement is the same as (1) (5%)
(3) Scenario and conservation priority
Compare to the current evaluation of ES in Nagoya (BAU scenario, Table 3.2), two future scenarios are
Booklet Series of Environmental Emergency Research Vol.3 2016.11
13
considered, scenario-1 Greening: Increase of the area rate of green space in all grid of the city by a future land
planning (Fig. 3.1c), and scenario-2 Corrido: Increase of the rate to be high continuousness of green space in the
east region of the city (Fig. 3.1d). In the both scenarios, the net rate of increase of green space is assumed to be
about 5%. In the scenario-2, it is assumed that ES in the waterside areas is enhanced in future by afforestation or
greening over relatively large area (larger than 1 ha) to design a restoration of semi-natural ecosystem and
development of natural corrido for biodiversity conservation inside the city.
Using the calculated proxy variables of ES and biodiversity, the integrated evaluation was carried out by the
Zonation software, which calculates conservation priorities (Moilanen et al., 2012). It identifies the mesh with the
greatest overall loss when one grid is removed. By repeatedly removing the mesh, that was identified and
searching among the remaining grids for the grid with the maximum loss, conservation priority is determined by
the Core Area Zonation algorithm that minimizes loss by assigning high rank to spatial continuous and high
weight ecosystem services. For evaluation of species biodiversity, then number of species is calculated to evaluate
loss of e species diversity. In this study, the value of ES is calculated to evaluate the loss.
Fig. 3.1 (a) Grid area rate of agricultural area in Nagoya City (b) Rate of forest area (c) increase rate in scenario-1
Greening and (d) increase rate in scenario-2 Corrido
3.3 Results and discussion
Weight of the ES that obtained through the web questionnaire was estimated from a five-point scale (Ooba et
al., 2016) is used to integrate each ES value in this study (Table 3.1). The costs and other Zonation parameters
were set to the default values.
ES map of Nagoya is indicated in Fig. 3.2. Cultural services were estimated based on Equation-1, a = 3.0184,
b = −0.437 (R2 = 0.63). If the area increases, the value per unit area decreases, but because this is multiplied by the
area, the area and value of the cultural services increases gradually. Carbon sequestration was high in Eastern
(a) (b)
(c) (d)

Booklet Series of Environmental Emergency Research Vol.3 2016.11
14
Nagoya City and Moriyama, where there are many woodland areas. Food production was high in western Nagoya,
where there are relatively large areas of paddy and farmland. Cultural services and habitat quality tend to be low
in the central area but higher in the surrounding areas.
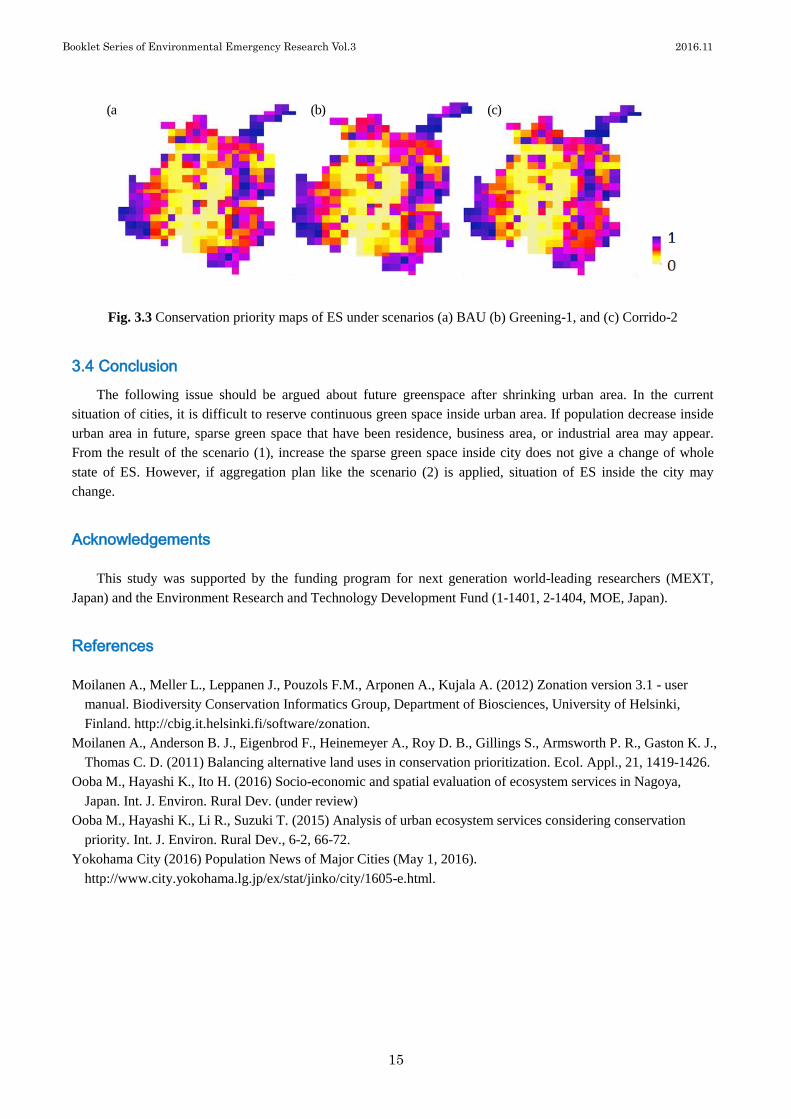
The conservation priority that is calculated by the Zonation software are shown in Fig. 3.2. Priority tends to
be high in the surrounding areas such as Higashiyama, Moriyama, and western Nagoya City. Serval green spaces
such as Atsuta Shrine, which is isolated inside the city, also earned high priority.
In detail, in the scenario-1, forest landuse increases in every mesh (but continuity is not recalculated), while
water-surface landuse that is located the selected mesh (Fig. 3.2) is replaced into forest landuse and recreation
value and continuity are recalculated in the scenario-2. It is note that labor cost for management of green space in
the both scenarios is the same.
Comparing to the current map (Fig. 3.3), priority of the scenario-1 is almost the same then relatively
continuous forest and the isolated forest have the same values. However, in scenario-2, the isolated forest was
relatively less important compared to that in scenario-1 and the green space in the east-region of Nagoya is
assigned more high priority that covered wide area compared to map of scenario-1.
Fig. 3.2 Relative values of ES under scenarios (a) BAU (b) Greening-1, and (c) Corrido-2
Support Provision Regulation
Culture Habitat
(a)
(b)
(c)
Booklet Series of Environmental Emergency Research Vol.3 2016.11
15
Fig. 3.3 Conservation priority maps of ES under scenarios (a) BAU (b) Greening-1, and (c) Corrido-2
3.4 Conclusion
The following issue should be argued about future greenspace after shrinking urban area. In the current
situation of cities, it is difficult to reserve continuous green space inside urban area. If population decrease inside
urban area in future, sparse green space that have been residence, business area, or industrial area may appear.
From the result of the scenario (1), increase the sparse green space inside city does not give a change of whole
state of ES. However, if aggregation plan like the scenario (2) is applied, situation of ES inside the city may
change.
Acknowledgements
This study was supported by the funding program for next generation world-leading researchers (MEXT,
Japan) and the Environment Research and Technology Development Fund (1-1401, 2-1404, MOE, Japan).
References
Moilanen A., Meller L., Leppanen J., Pouzols F.M., Arponen A., Kujala A. (2012) Zonation version 3.1 - user
manual. Biodiversity Conservation Informatics Group, Department of Biosciences, University of Helsinki,
Finland. http://cbig.it.helsinki.fi/software/zonation.
Moilanen A., Anderson B. J., Eigenbrod F., Heinemeyer A., Roy D. B., Gillings S., Armsworth P. R., Gaston K. J.,
Thomas C. D. (2011) Balancing alternative land uses in conservation prioritization. Ecol. Appl., 21, 1419-1426.
Ooba M., Hayashi K., Ito H. (2016) Socio-economic and spatial evaluation of ecosystem services in Nagoya,
Japan. Int. J. Environ. Rural Dev. (under review)
Ooba M., Hayashi K., Li R., Suzuki T. (2015) Analysis of urban ecosystem services considering conservation
priority. Int. J. Environ. Rural Dev., 6-2, 66-72.
Yokohama City (2016) Population News of Major Cities (May 1, 2016).
http://www.city.yokohama.lg.jp/ex/stat/jinko/city/1605-e.html.
(a) (b) (c)

Booklet Series of Environmental Emergency Research Vol.3 2016.11
16
4. Impacts of the 2011 tsunami on tidal flat ecosystems: future
perspectives for conservation of macrozoobenthic biodiversity
Gen Kanaya 1, Masanori Taru 2, Osamu Miura 3, Takeshi Yuhara 4, Tomoo Unagami 5,
Masaatsu Tanaka 2, Keisuke Mori 6, Misuzu Aoki 7, Shizuko Nakai 8, Hajime Itoh 9,
Takashi Inoue 10, Takao Suzuki 4
1 Center for Regional Environmental Research, National Institute for Environmental Studies 2 Toho University, Japan 3 Kochi University, Japan 4 Tohoku University, Japan 5 Center for Environmental Studies, Japan 6 National Institute for Minamata Disease, Japan 7 Wetlands International Japan, Japan 8 Nihon University, Japan 9 The University of Tokyo, Japan 10 Japan Wildlife Research Center, Japan
4.1 Introduction
The Pacific coast of northeastern Japan was struck by a huge tsunami generated by the M 9.0 Great East
Japan Earthquake on 11 March 2011 (Okada et al. 2011). The earthquake and tsunami intensively disturbed tidal
flats, salt marshes, and sandy shores in the area (Kanaya et al. in press). Drastic changes in the community
composition of macrozoobenthos have been reported from tidal flats across large spatial scales. For example,
Miura et al. (2012) noted a sharp reduction of the dominant gastropod Batillaria attramentaria on five tidal flats
in Sendai Bay. Urabe et al. (2013) also reported a taxon-specific reduction in species diversity of
macrozoobenthos on tidal flats.
Biotic communities in the affected areas have been recovering gradually over the past 5 years. However,
anthropogenic disturbances associated with ongoing restoration projects (e.g., reconstruction of huge sea walls)
have become a potential threat for biotic communities (Okoshi 2015; Kanaya et al. in press). In this study, we
classified the types of habitat alterations caused by the 2011 disaster. We also assessed the tsunami impacts on
five endangered macrozoobenthic taxa in Sendai Bay. Finally, we discuss the potential threats of ongoing
restoration projects on tidal flats in Japan.
4.2 Methodology
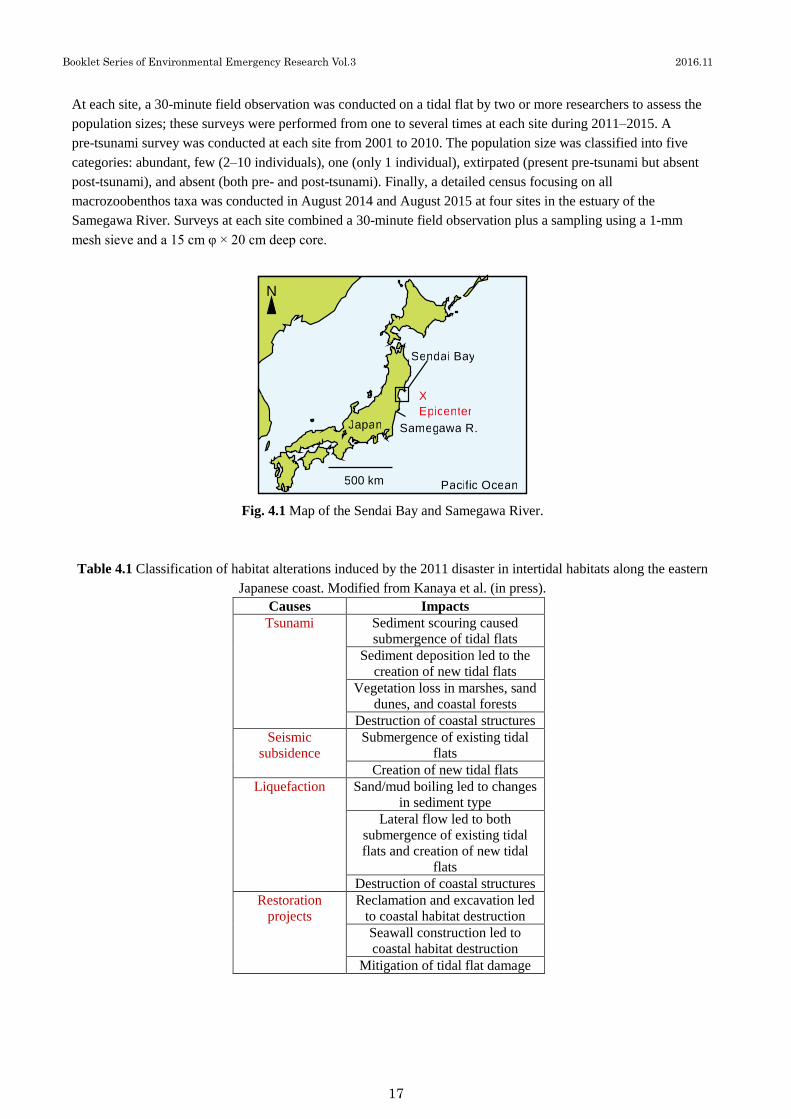
On 11 March 2011, an M 9.0 megathrust earthquake occurred in the western Pacific (38.322°N, 142.369°E),
centered about 130 km east of Sendai City, Miyagi Prefecture. Huge tsunami up to 20 m high hit broad areas of
the eastern Japanese coast (Okada et al. 2011). Seismic subsidence occurred intensively near the epicenter, with
surfaces shifting up to 90 cm near the Oshika Peninsula (Kanaya et al. in press).
First, we summarized the types of disturbance associated with the earthquake, tsunami, and restoration
projects based on the findings of Kanaya et al. (in press). Second, population sizes of four endangered
Cerithioidea gastropods, Batillaria multiformis (NT in Miyagi Prefectural Red List), B. zonalis (CR+EN),
Cerithidea moerchii (VU), and Cerithideopsilla djadjariensis (VU), and the marsh crab Chasmagnathus convexus
(CR+EN) were surveyed at the Tsuya River, Samegawa River, and 25 sites in Sendai Bay (see Figs. 4.1 and 4.2).
Booklet Series of Environmental Emergency Research Vol.3 2016.11
17
At each site, a 30-minute field observation was conducted on a tidal flat by two or more researchers to assess the
population sizes; these surveys were performed from one to several times at each site during 2011–2015. A
pre-tsunami survey was conducted at each site from 2001 to 2010. The population size was classified into five
categories: abundant, few (2–10 individuals), one (only 1 individual), extirpated (present pre-tsunami but absent
post-tsunami), and absent (both pre- and post-tsunami). Finally, a detailed census focusing on all
macrozoobenthos taxa was conducted in August 2014 and August 2015 at four sites in the estuary of the
Samegawa River. Surveys at each site combined a 30-minute field observation plus a sampling using a 1-mm
mesh sieve and a 15 cm φ × 20 cm deep core.
Fig. 4.1 Map of the Sendai Bay and Samegawa River.
Table 4.1 Classification of habitat alterations induced by the 2011 disaster in intertidal habitats along the eastern
Japanese coast. Modified from Kanaya et al. (in press).
Causes Impacts
Tsunami Sediment scouring caused
submergence of tidal flats
Sediment deposition led to the
creation of new tidal flats
Vegetation loss in marshes, sand
dunes, and coastal forests
Destruction of coastal structures
Seismic
subsidence
Submergence of existing tidal
flats
Creation of new tidal flats
Liquefaction Sand/mud boiling led to changes
in sediment type
Lateral flow led to both
submergence of existing tidal
flats and creation of new tidal
flats
Destruction of coastal structures
Restoration
projects
Reclamation and excavation led
to coastal habitat destruction
Seawall construction led to
coastal habitat destruction
Mitigation of tidal flat damage
P a c i f i c O c e a n 5 0 0 k m
N
J a p a n
S e n d a i B a y
S a m e g a w a R .
X E p i c e n t e r
Booklet Series of Environmental Emergency Research Vol.3 2016.11
18
4.3 Results and Discussion
(1) Disturbance of tidalflats after the 2011 earthquake
The disaster-linked changes in Japanese tidal flats are summarized into four major categories (Table 4.1).
First, the tsunami induced scouring, sediment deposition, vegetation losses, and destruction of coastal structures.
For example, the tsunami washed away marsh plants and sand dune vegetation in Gamo Lagoon (Kanaya et al. in
press). Tsunami currents also deposited a huge amount of drifting sea sand on coastal areas in Sendai Bay
(Szczuciński et al. 2012). Intense physical disturbance induced extirpation of macrozoobenthos on tidal flats
(Miura et al. 2012; Urabe et al. 2013). Second, seismic subsidence induced the elimination and/or creation of tidal
flats. In Mangoku-ura Inlet, most of the tidal flat became subtidal and a part of the land behind the shore became
intertidal (Okoshi 2015). Third, liquefaction caused mud boiling, lateral flow, and destruction of coastal structures.
Okoshi (2015) described the mud/sand boiling in inner Tokyo Bay. In some cases, liquefaction induced a massive
lateral flow, resulting in submergence of the intertidal zone (Kanaya et al. in press). Finally, restoration projects
have become potential threats for biodiversity on the tidalflats in the area (see below).
(2) Changes in population size of endangered macrozoobenthos
Intensive physical disturbances and changes in habitat structure drastically modified the associated biota. Fig.
4.2 shows the changes in population sizes of the five endangered taxa. The marsh-associated species C. moerchii
was extirpated at four of seven sites and maintained the pre-tsunami population size at only two sites in inner
Matsushima Bay. C. djadjariensis was extirpated at three of six sites, and it occurred abundantly only in
Mangoku-ura Inlet and inner Matsushima Bay. Before the tsunami disaster, B. multiformis had occurred
abundantly at most of the studied sites (20 of 27 sites), but except for populations in Mangoku-ura and inner
Matsushima Bay most of these populations were extirpated. B. zonalis had been found only at Hatsutsu-ura.
Fortunately, the population was maintained after the tsunami, and three additional populations were newly
discovered in Matsushima Bay. It was possible that new recruitment of B. zonalis occurred in the 3 habitats after
the tsunami. The marsh-associated crab C. convexus was nearly extirpated, whereas two new populations were
found in the Tsuya River and Samegawa River.
These findings indicate that tidal flats in the sheltered bay areas where the tsunami was distinctively
attenuated, namely inner Matsushima Bay and Mangoku-ura Inlet, are important sources of planktonic larvae of
the endangered taxa for other disturbed habitats. Such key tidal flats should be conserved for future restoration of
endangered macrozoobenthos in Sendai Bay.
(3) Endangered species in Samegawa River
During the 2014 and 2015 survey, we found 30 endangered taxa in the Samegawa River estuary (Table 4.2).
Stenohaline marine taxa such as the bivalves Acharax japonica, Macoma praetexta, Moerella jedoensis,
Nitidotellina hokkaidoensis, and Soletellina boeddinghausi and echiuran and sipunculan worms occurred at a
seawater-dominated lagoon on the northern side of the river mouth. Marsh-associated and/or polyhaline brackish
taxa such as assiminid gastropods, the bivalve Corbicula japonica, the polychaetes Tylorrhynchus osawai and
Notomastus sp., and the crabs C. convexus, Chiromantes haematocheir, Deiratonotus cristatus, and Sestrostoma
toriumii occurred at marshes and tidal flats in the freshwater-affected estuary.

Booklet Series of Environmental Emergency Research Vol.3 2016.11
19
(a) Cerithidea moerchii (b) Cerithideopsilla djadjariensis
(c) Batillaria multiformis (d) B. zonalis
10 km
?
?
?
?
?
?
(e) Chasmagnathus convexus
Matsushima BayMangoku ura
1
2 3
4 5
678 9 11
1213 14
1716
18
19
20
21
2223
24
25
26
27
Matsukawa ura
14
?
?
?
?
?
?
10
15
?
?
Abundant
Few (< 10 ind.)
One ind.
Extirpated
Absent
No data?
2001 to 2010 2011 to 2015
The 2011
disaster
Fig. 4.2 Tsunami-induced changes in population sizes of the 5 endangered taxa in Tsuya River (38.766 N, 141.513
E), Samegawa River, and 25 tidalflats in Sendai Bay. 1 Tsuya R., 2 Sawada, 3 Urashuku, 4 Ohama, 5 Inodoshi, 6
Hitsuga ura, 7 Sokanzan, 8 Fukuura Is., 9 Nishinohama, 10 Zenigami, 11 Tona, 12 Katsura Is., 13 Nono Is., 14 Sabusawa
Is., 15 Hatsutsu ura, 16 Otakamori, 17 Katsugiga ura, 18 Gamo, 19 Ido ura. 20 Hiro ura, 21 Torinoumi, 22 Ushibashi, 23
Obamahara, 24 Uda R., 25 Isobe, 26 Uno, 27 Samegawa R
Booklet Series of Environmental Emergency Research Vol.3 2016.11
20
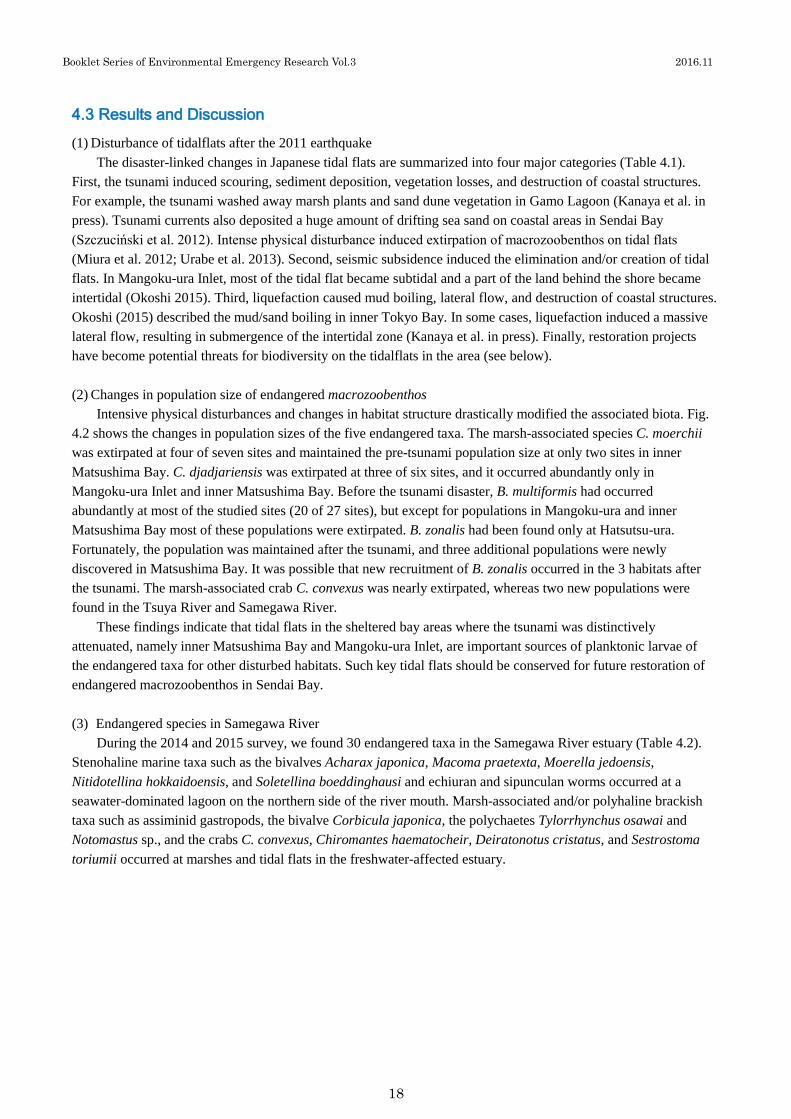
Table 4.2 List of endangered macrozoobenthos recorded in the Samegawa River estuary during the 2014-2015
survey
Taxa Red list category
MP a MOE b JAB c
Taxa Red list category
MP a MOE b JAB c
Anthozoa
Edwardsiidae sp. DD
Synandwakia hozawai NT NT
Gastropoda
Nozeba ziczac CR+EN NT NT
Retusa insignis NT
Assiminea aff. parasitologica NT NT NT
Angustassiminea castanea NT NT
An. yoshidayukioi VU NT NT
Bivalvia
Acharax japonica VU VU
Arthritica reikoae DD DD
Macoma contabulata NT NT
Ma. incongrua NT
Ma. praetexta NT NT
Moerella jedoensis NT NT
Mo. rutila NT NT NT
Nitidotellina hokkaidoensis NT NT NT
Soletellina boeddinghausi CR+EN CR+EN
Corbicula japonica NT NT
Nipponomysella subtruncata NT NT
Mya arenaria oonogai NT NT NT
Solen strictus NT
Polychaeta
Tylorrhynchus osawai NT NT
Chaetopterus cautus NT VU
Notomastus sp. NT NT
Echiura
Arhynchite cf. arhynchite DD
Sipuncula
Sipunculus nudus NT
Siphonosoma cumanense NT NT
Decapoda
Chasmagnathus convexus CR+EN NT
Chiromantes haematocheir NT LP
Deiratonotus cristatus NT VU
Sestrostoma toriumii VU NT
a Miyagi Prefecture (http://www.pref.miyagi.jp/uploaded/attachment/207586.pdf), b Ministry of the Environment
(https://www.env.go.jp/press/files/jp/20555.pdf, https://www.env.go.jp/press/files/jp/20556.pdf), c Japanese Association of
Benthology (http://benthos-society.jp/red_list_benthos_20150623.pdf). Red list category: CR+EN, critically endangered or
endangered; VU, vulnerable; NT, near threatened; DD, data deficient; LP, threatened local population.
Some of the endangered taxa rarely occurred at other tidal flats in northeastern Japan (Ministry of the
Environment 2015; authors’ unpubl. data), and the population size of C. convexus in the Samegawa River estuary
was the largest among those in Fukushima and Miyagi prefectures (Fig. 4.2e). Since the ocean current flows
northward (i.e., toward Sendai Bay; Higashi et al. 2015), macrozoobenthos in Samegawa River would be a
significant source of planktonic larvae for the meta-population network in Sendai Bay
(4) Impacts of restoration works on coastal biodiversity
Anthropogenic disturbances associated with ongoing restoration projects are now of increasing concern
(Okoshi 2015; Kanaya et al. in press). We found that the tidal flat and marshes in the Samegawa River were
damaged by construction of huge sea walls (Fig. 4.3a). Reed marsh habitat for C. convexus was intensively
disturbed by the reconstruction of a floodgate (Fig. 4.3b). In the Tsuya River, habitat of C. convexus is also
threatened by ongoing sea-wall construction (authors’ pers. obs.). Along the Sendai Bay coast, huge sea walls (7.2
to 16 m high; Fig. 4.3c) are now being constructed at a broad spatial scale, leading to loss of the natural coastline
in the area. Reclamation projects have also damaged the habitats of intertidal macrozoobenthos such as B.
multiformis (Kanaya et al. in press). In Matsukawa-ura, construction of a flood wall devastated the local
population of batillarid gastropods on the landward edges of the tidal flats. In this case, however, compensative
Booklet Series of Environmental Emergency Research Vol.3 2016.11
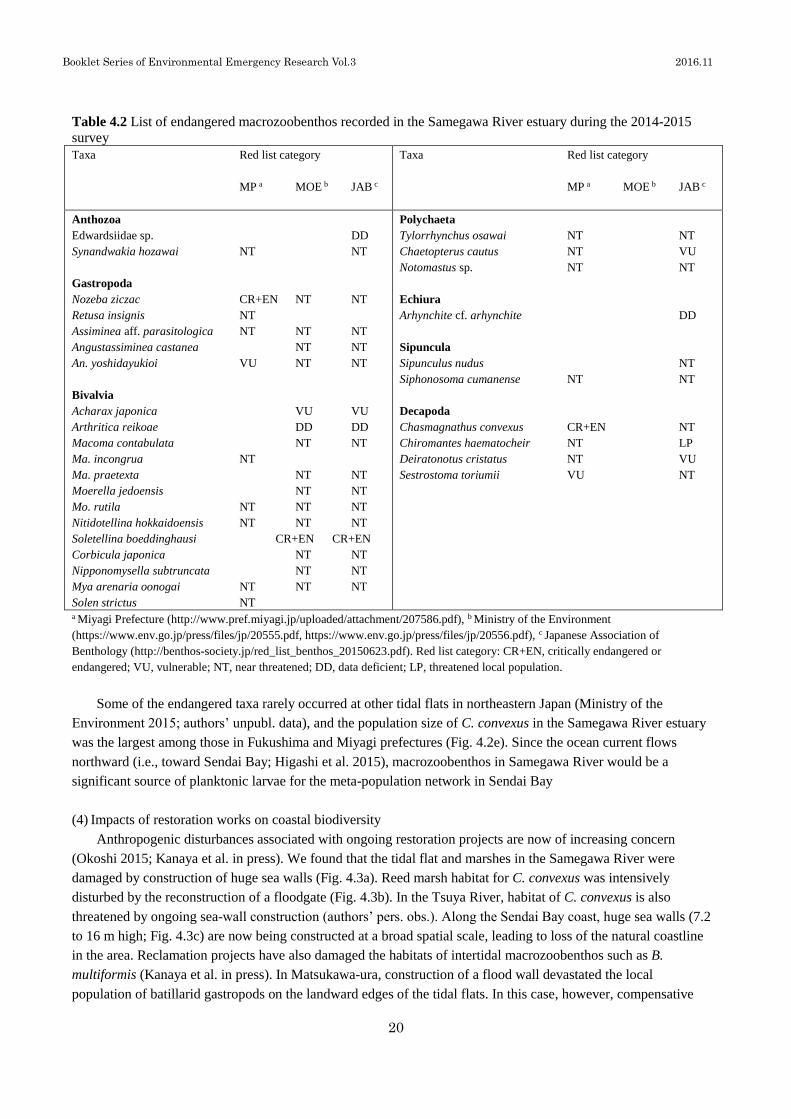
21
creation of the tidal flat was done after the bank revetment (Fig. 4.3d), which may allow for future recolonization
of macrozoobenthos after a certain period of time.
c d
a
b
Fig. 4.3 Disturbance caused by restoration projects after the 2011 tsunami: (a) construction of sea wall on the tidal
flat in the Samegawa River, (b) destruction of reed marsh by construction of a floodgate in the Samegawa River,
(c) huge sea wall (height; +6.4 m T.P.) in Hatsutsu ura, and (d) mitigation of tidal flat damage after construction of
the bank revetment in Obamahara, Matsukawa ura.
4.4 Conclusions
Our surveys revealed disaster- and restoration-induced changes in tidal flat habitats along the northeastern
Japanese coast. Endangered macrozoobenthos were extirpated at many tidal flats along Sendai Bay, but
populations still remained in Matsushima Bay, Mangoku-ura Inlet, and at several other sites. These remnant
populations are important source populations for future restoration of biodiversity. At present, ongoing restoration
projects are becoming a threat to the coastal biotic community. Appropriate assessment and adaptive management
are required for future restoration of coastal biodiversity in the tsunami-disturbed areas.
Booklet Series of Environmental Emergency Research Vol.3 2016.11
22
Acknowledgments
We thank staff members of Japan Wildlife Research Center and students at Tohoku University for their help
with fieldwork. Our research was partly funded by NIES, Tohoku Ecosystem-Associated Marine Sciences
(TEAMS), and Mitsui & Co., Ltd. environment funds. The 2015 survey in the Samegawa River was conducted
together with the monitoring program of the Ministry of the Environment.
References
Higashi H., Morino Y., Furuichi N., Ohara T. (2015) Ocean dynamic processes causing spatially heterogeneous
distribution of sedimentary caesium-137 massively released from the Fukushima Daiichi Nuclear Power Plant.
Biogeosciences, 12: 7107–7128.
Kanaya G., Suzuki T., Kinoshita K., Matsumasa M., Yamada K., Seike K., Okoshi K., Miura O., Nakai S.,
Sato-Okoshi W., Kikuchi E. (in press) Disaster-induced changes in coastal wetlands and soft-bottom habitats in
eastern Japan– an overview on 2011 Great East Japan Earthquake. Biology International.
Ministry of the Environment (2015) The ecosystems monitoring survey of the Pacific coastal areas of the Tohoku
region in FY2014. Biodiversity Center of Japan, Ministry of the Environment, 237.
Miura O., Sasaki Y., ChibaS. (2012). Destruction of populations of Batillaria attramentaria (Caenogastropoda:
Batillariidae) by tsunami waves of the 2011 Tohoku earthquake. J. Mollusc. Stud., 78: 377–380.
Okada N., Tao Y., Kajitani Y., Shi P., Tatano H. (2011). The 2011 eastern Japan great earthquake disaster:
Overview and comments. Int. J. Disaster Risk Sci., 2: 34–42.
Okoshi K. (2015). Impact of repeating massive earthquakes on intertidal mollusk community in Japan. In “Marine
Productivity: Perturbations and Resilience of Socio-ecosystems”, eds. Ceccaldi, H.J., et al., 55–62. Springer.
Szczuciński W., Kokociński M., Rzeszewski M., Chagué-Goff C., Cachão M., Goto K., Sugawara D. (2012)
Sediment sources and sedimentation processes of 2011 Tohoku-oki tsunami deposits on the Sendai Plain,
Japan–Insights from diatoms, nannoliths and grain size distribution. Sed. Geol., 282: 40–56.
Urabe J., Suzuki T., Nishita T., Makino W. (2013). Immediate ecological impacts of the 2011 Tohoku earthquake
tsunami on intertidal flat communities. PLOS ONE, 8: e62779