Embed Size (px)
Citation preview

JOURNAL OF BACTERIOLOGY, Sept. 1980, p. 1384-1394 Vol. 143, No. 30021-9193/80/09-1384/11$02.00/0
Reserve Carbohydrate Metabolism in Saccharomycescerevisiae: Responses to Nutrient Limitation
SUE H. LILLIE AND JOHN R. PRINGLE*Department of Cellular and Molecular Biology, Division of Biological Sciences, The University of
Michigan, Ann Arbor, Michigan 48109
The amounts of glycogen and trehalose have been measured in cells of aprototrophic diploid yeast strain subjected to a variety of nutrient limitations.Both glycogen and trehalose were accumulated in cells deprived specifically ofnitrogen, sulfur, or phosphorus, suggesting that reserve carbohydrate accumula-tion is a general response to nutrient limitation. The patterns of accumulationand utilization ofglycogen and trehalose were not identical under these conditions,suggesting that the two carbohydrates may play distinct physiological roles.Glycogen and trehalose were also accumulated by cells undergoing carbon andenergy limitation, both during diauxic growth in a relatively poor medium andduring the approach to stationary phase in a rich medium. Growth in the richmedium was shown to be carbon or energy limited or both, although theinteraction between carbon source limitation and oxygen limitation was complex.In both media, the pattern of glycogen accumulation and utilization was compat-ible with its serving as a source of energy both during respiratory adaptation andduring a subsequent starvation. In contrast, the pattern of trehalose accumulationand utilization seemed compatible only with the latter role. In cultures that weredepleting their supplies of exogenous glucose, the accumulation of glycogen beganat glucose concentrations well above those sufficient to suppress glycogen accu-mulation in cultures growing with a constant concentration of exogenous glucose.The mechanism of this effect is not clear, but may involve a response to the rapidrate of change in the glucose concentration.
The yeast Saccharomyces cerevisiae can syn-thesize and degrade both the polysaccharide gly-cogen and the disaccharide trehalose. Depend-ing on the environmental conditions and thestage of the life cycle, each of these carbohy-drates can represent less than 1%, or more than23%, of the dry weight of the cells (4, 10, 20, 26,27, 33; our unpublished data).These dramatic variations in glycogen and
trehalose content, and the large absoluteamounts that can be accumulated, suggest thatthese carbohydrates play important roles duringthe yeast life cycle. Indeed, studies correlatingglycogen and trehalose levels with the physio-logical and developmental activities of the cellshave suggested that these carbohydrates func-tion as important carbon and energy reserves instarving cells (4, 7, 8, 24), in cells undergoingrespiratory adaptation (21, 26, 28, 31), in sporu-lating cells (5, 9, 15), in germinating spores (15,34), in vegetative cells during emergence fromstationary phase in fresh medium (24, 39), andin cells traversing the mitotic cell cycle underconditions of carbon and energy limitation (19,20, 41). Unfortunately, many of these studies aredifficult to interpret in detail because they sufferfrom one or more of the following limitations:
use of a strain that was not well characterizedgenetically; failure to measure extracellular glu-cose concentrations; inadequate characterizationof the growth-limiting factors in the media used;inadequate characterization of the life cycle sta-tus of the cells (particularly the lack of reliabledata on cell numbers); failure to measure bothglycogen and trehalose; or use of a glycogenassay that seems to give spuriously high values(see Discussion). In addition, all such studiessuffer from the difficulty of establishing causalrelationships from data on correlations.A particular problem is to understand the
teleonomic value (6) to the cells of accumulatingtwo different reserve carbohydrates. Only in thecase of sporulating cells do there exist unequiv-ocal data indicating distinct roles for these twocarbohydrates (15), and in many studies, theirlevels in the cells seem to rise and fall in parallel(e.g., references 20 and 37). This situation raisesthe intriguing possibility that one or both ofthese carbohydrates plays a role in the cell inaddition to its presumed role as a carbon andenergy reserve.The dramatic variations in cellular levels of
glycogen and trehalose, apparently in responseto a variety of physiological and developmental
1384
on July 18, 2018 by guesthttp://jb.asm
.org/D
ownloaded from
RESERVE CARBOHYDRATES IN YEAST CELLS 1385
circumstances, suggest that the regulatorymechanisms governing the metabolism of thesecarbohydrates in yeasts must be complex. Stud-ies of the enzymes involved in this metabolism,although fragmentary, support this suggestion.It has been reported that the rate of yeast gly-cogen synthesis is strongly affected by the avail-ability of ammonium ions (32, 37), and that theactivity of yeast glycogen synthetase is con-trolled both by the concentrations of glucose 6-phosphate and adenine nucleotides (32) and bya covalent modification system involving phos-phorylation and dephosphorylation (13, 33), al-though the roles of these mechanisms in theregulation of glycogen synthesis in vivo remainunclear. There is also evidence that glycogenutilization in S. cerevisiae is regulated, at leastin part, by phosphorylation and dephosphoryl-ation of glycogen phosphorylase (22), althoughthe significance of these modifications in vivohas not really been assessed. Moreover, the roleof phosphorylase in glycogen utilization in S.cerevisiae is obscured by the evidence that insporulating cells, at least, glycogen degradationoccurs by hydrolysis rather than by phospho-rolysis (5, 9). Some attempts have been made tocorrelate cellular levels of trehalose with thelevels of trehalase activity (17, 19, 25, 40), butthe significance of these correlations is not clear,especially since so little is known about regula-tion of the enzyme(s) of trehalose synthesis (23).
In the hope of defining more precisely boththe biological roles of glycogen and trehalose inS. cerevisiae and the regulatory mechanismsthat allow those roles to be filled, we have beguna systematic examination of the metabolism ofthese carbohydrates. Our studies are based pri-marily on the isolation and characterization ofmutants defective in reserve carbohydrate me-tabolism. However, to fill certain lacunae in theexisting physiological literature, and to providea background of information about wild-typecells against which the properties of our mutantscan be viewed, we have determined the glycogenand trehalose levels in our wild-type parentstrain under a variety of environmental condi-tions. These studies have yielded some novelresults, which are reported here.
MATERIALS AND METHODSStrain. S. cerevisiae C276 a/a (42), a prototrophic
diploid derived from strain S288C, was used in allexperiments. It was maintained and handled as de-scribed elsewhere (29, 30).
Culture conditions. Glucose for all media wasautoclaved as separate stock solutions; except wherenoted, the concentration of these stocks was 200 g/liter. YM-P liquid medium contained (per liter): 6.3 gof Difco yeast nitrogen base without amino acids, 4.5g of Difco yeast extract, 9 g of Difco peptone, 9 g of
succinic acid, 5.4 g of NaOH, and 20 g of glucose. Forsome experiments, media identical to YM-P except inglucose concentration were used; these are denotedYM-P with x% glucose. To make YM-P and its var-iants, 9 parts of a 1.11-fold-concentrated YM-P stockwere mixed with 1 part of a glucose stock solution ofappropriate concentration. AC-1 liquid medium con-tained (per liter): 7 g of yeast nitrogen base withoutamino acids, 1 g of yeast extract, 10 g of succinic acid,4.5 g of NaOH, and 10 g of potassium acetate. Glucosestock solution was added to AC-1 to give appropriatefinal glucose concentrations; a small dilution of theother constituents resulted from this addition. Thesynthetic liquid medium MIN, as well as the nitrogen-free (MIN-N), sulfur-free (MIN-S), and phosphorus-free (MIN-P) media derived from it, have been de-scribed previously (14); however, we used 30 g ofglucose per liter in these media. YEPD solid mediumcontained (per liter): 10 g of yeast extract, 20 g ofpeptone, 20 g of agar (Difco), and 20 g of glucose.
Unless otherwise noted, liquid cultures were incu-bated in baffled Erlenmeyer flasks (Beilco, type 2543)that were about half full of medium, with rotary shak-ing at approximately 200 rpm, at room temperature(23 to 250C).To shift cells from one type of medium to another,
the cells were collected on a Millipore filter (typeHAWP, 0.45-um pore size, 47-mm diameter), washedthree times with 15-ml samples of the new medium,and suspended by swirling the filter in a flask of thenew medium. The filter was then removed by decant-ing the suspended culture into a fresh flask. The entireprocedure was carried out at room temperature and(except as noted) required from 3 to 5 min.Measurements of cellular parameters. Total
cell numbers were ordinarily determined with a Coul-ter Counter model ZB, using formaldehyde-fixed, son-icated samples (30). In the experiment shown in Fig.2, we measured the absorbance of the culture at 660nm with a Gilford Stasar II spectrophotometer andconverted the absorbance values to cell numbers byusing a standard curve previously established forstrain C276 growing under similar conditions (30).Viable cell numbers were determined by plating soni-cated samples on YEPD plates. Methods for deter-mining the proportions of unbudded cells and dryweights (by filtration) have been described previously(30).Carbohydrate determinations. Cells to be used
for glycogen or trehalose determinations were chilledquickly by addition of crushed ice, collected by cen-trifugation at 4°C, and washed three times with dis-tilled water at 4°C. The final pellets were frozen andstored at -20°C.
For trehalose measurements, the pellets werethawed in approximately three times their volumes of500 mM trichloroacetic acid and extracted for 40 to 60min at room temperature. After centrifugation and asecond extraction of the pellets for 40 to 60 min atroom temperature with a similar volume of 500 mMtrichloroacetic acid, the combined supernatants fromthe two extractions were assayed for anthrone-positivematerial (35). A third such extraction did not yieldadditional anthrone-positive material. Glucose stand-ards were used for the anthrone tests, and the values
VOL. 143, 1980
on July 18, 2018 by guesthttp://jb.asm
.org/D
ownloaded from

1386 LILLIE AND PRINGLE
for extracted cellular carbohydrate are expressed asglucose equivalents. In each experiment, we verifiedthat trehalose was indeed the only carbohydrate ex-tracted in appreciable quantity by 500 mM trichloro-acetic acid (36) by using thin-layer chromatographyon Silica Gel 60 F-254 plates (EM Laboratories), withn-butanol-pyridine-water (15:3:2) as a solvent. Car-bohydrate spots were visualized by spraying the plateswith 5 mg of vanillin per ml in concentrated H2SO4and heating at 130°C.
Glycogen was determined enzymatically by usingthe method ofGunja-Smith et al. (10), with the follow-ing modifications. The glycogen digestion mixture con-tained 29 1l of amyloglucosidase [Boehringer Mann-heim, 15043, obtained as a 10-mg/ml suspension in 3.2M (NH)2SO4] per ml and 48 ,ug of a-amylase (Sigma,A6380) per ml. Although control experiments indi-cated that a 2-h incubation led to maximal glucoserelease, we routinely extended the incubation to 6 to10 h. We measured total glycogen, making no distinc-tion between soluble and insoluble pools (10).
Glucose in the medium was measured by usingglucose oxidase (10), after removal of the cells fromculture samples by filtration through Millipore filters(type HAWP, 0.45-,um pore size; experiments shown inFig. 3 and 4) or centrifugation (other experiments).Both filtration and centrifugation were carried outquickly at room temperature.
RESULTSReserve carbohydrate levels during star-
vation for nitrogen, sulfur, or phosphorus.It is known that yeast cells accumulate glycogenand trehalose during nitrogen starvation in thepresence of excess carbon source (2, 20, 32, 36,37). To determine whether such accumulation isa specific response to nitrogen starvation or ageneral response to nutrient limitation, we com-pared glycogen and trehalose levels in cells de-prived specifically of nitrogen, of sulfur, or ofphosphorus. Cells growing exponentially in MINmedium had low levels of both glycogen andtrehalose (Table 1). When such cells were shiftedto MIN-N, MIN-S, or MIN-P medium, the cellnumber increased severalfold (Table 1) beforethe cells arrested as unbudded, Gl cells (11, 14,30, 38). In each culture, both glycogen and tre-halose accumulated, although to different ex-tents (Table 1). In a control culture that wasfiltered and suspended in MIN medium, no in-crease in the level of either carbohydrate wasobserved after filtration (data not shown).
After the final samples had been taken fromeach of the starved cultures, the putative limit-ing nutrient was added to a final concentrationequal to that in MIN medium. In each case, thecell number then increased at least 10-fold dur-ing the next 19 h, indicating that cell prolifera-tion had indeed been limited specifically by thenutrient in question. As confirmation that glu-cose limitation was not a factor in these experi-
TABLE 1. Glycogen and trehalose accumulation byyeast cells deprived of nitrogen, sulfur, or
phosphorusaTime Cell no.Gyo Glucose
Meim after (106 Treha-Glc- imeMeimshift cells per lose (% gen (% du(h) ml) dry wt) dry wt) (mg/nl)
MIN 0 11 0.3 2.5b -
MIN-N 0 1.7 - - 3417 4.2 9.7 22 -
40 4.3 14 16 -
96 4.2 16 14 34
MIN-S 0 1.7 - - 3417 7.1 1.8 9.4 -
40 7.2 7.3 12 -
96 7.2 8.4 11 30
MIN-P 0 1.5 - - 3417 8.8 0.3 1.5 -40 9.6 0.8 2.3 -
96 9.6 2.7 5.2 25192 10 4.0 7.6 20
a Cells from a culture growing exponentially in MINmedium at about 107 cells per ml were shifted byfiltration (see the text) to MIN-N, MIN-S, or MIN-Pmedium. Simultaneously, samples were taken fromthe MIN culture for cell number and carbohydratedeterminations. Approximately eight generations ofexponential growth, at cell densities less than 107 cellsper ml, preceded the sampling and shifts to starvationmedia. -, Not measured.
bIn other experiments, glycogen values rangingfrom 0.7 to 2.2% of the dry weight were observed forstrain C276 growing exponentially in MIN medium(see the text).
ments, we monitored glucose in the media (Ta-ble 1). Only in the MIN-P culture was there anappreciable drop in the glucose concentration.To verify that the reserve carbohydrate accu-mulation observed in this culture was not due tothe decreasing glucose concentration (see be-low), we performed an experiment analogous tothat of Table 1, except that cells were suspendedin MIN-P at 1.2 x 10⁵ cells per ml. In thisexperiment, the measured values for glucose inthe medium did not decrease appreciably (28.5mg/ml at 0 h, 28 mg/ml at 19 h, and 26.6 mg/mlat 168 h), but the glycogen and trehalose valuesobtained were indistinguishable from those ofTable 1.We looked more closely at the time course of
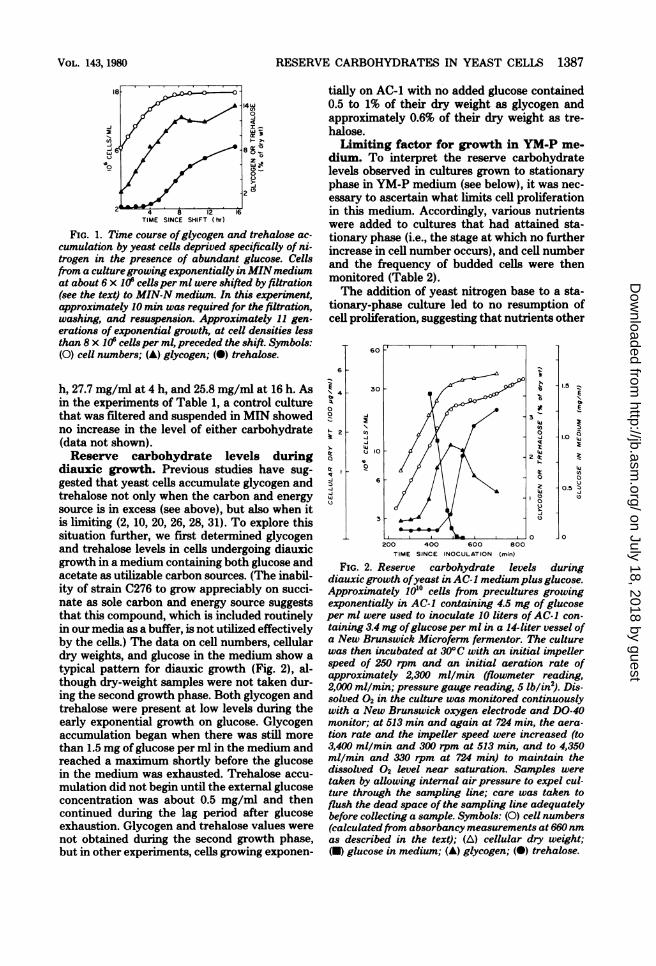
glycogen and trehalose accumulation by cellsdeprived of nitrogen (Fig. 1). Although glycogenaccumulation began within the first hour, tre-halose accumulation did not begin until 4 h afterthe shift. The concentration of glucose in themedium was essentially constant during the ex-periment; measured values were 27 mg/ml at 0
J. BACTERIOL.
on July 18, 2018 by guesthttp://jb.asm
.org/D
ownloaded from
RESERVE CARBOHYDRATES IN YEAST CELLS 1387
4 8 12 16TIME SINCE SHIFT hr)
FIG. 1. Time course ofglycogen and trehalose ac-cumulation by yeast cells deprived specifically of ni-trogen in the presence of abundant glucose. Cellsfrom a culturegrowing exponentially in MINmediumat about 6 x 10⁶ cells per ml were shifted by filtration(see the text) to MIN-N medium. In this experiment,approximately 10 min was required for the filtration,washing, and resuspension. Approximately 11 gen-erations of exponential growth, at cell densities lessthan 8 x 10⁶ cells per ml, preceded the shift. Symbols:(0) cel numbers; (v) glycogen; (0) trehalose.
h, 27.7 mg/ml at 4 h, and 25.8 mg/ml at 16 h. Asin the experiments of Table 1, a control culturethat was filtered and suspended in MIN showedno increase in the level of either carbohydrate(data not shown).Reserve carbohydrate levels during
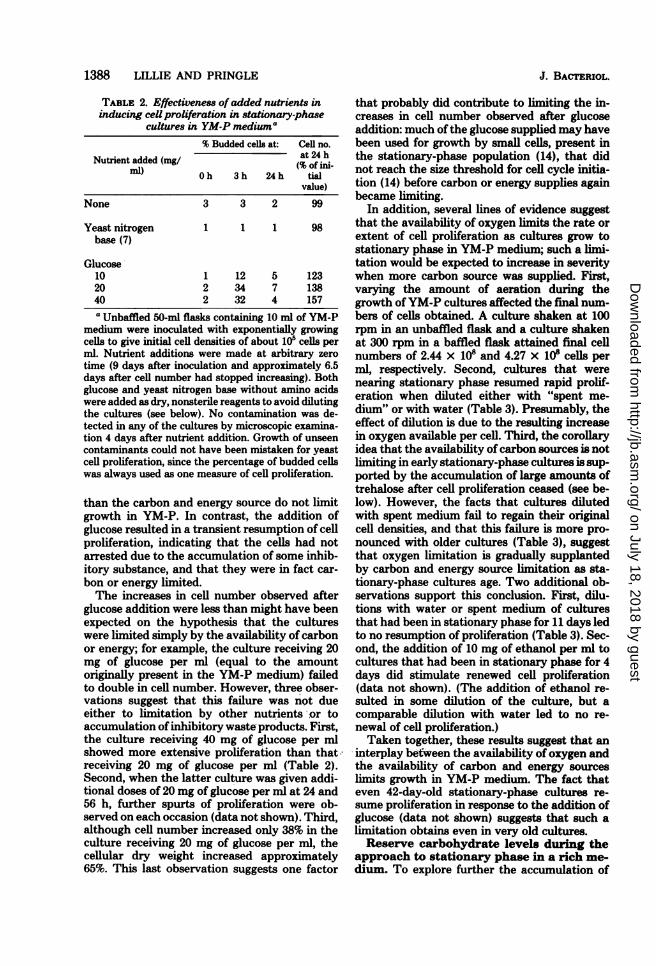
diauxic growth. Previous studies have sug-gested that yeast cells accumulate glycogen andtrehalose not only when the carbon and energysource is in excess (see above), but also when itis limiting (2, 10, 20, 26, 28, 31). To explore thissituation further, we first determined glycogenand trehalose levels in cells undergoing diauxicgrowth in a medium containing both glucose andacetate as utilizable carbon sources. (The inabil-ity of strain C276 to grow appreciably on succi-nate as sole carbon and energy source suggeststhat this compound, which is included routinelyin our media as a buffer, is not utilized effectivelyby the cells.) The data on cell numbers, cellulardry weights, and glucose in the medium show atypical pattern for diauxic growth (Fig. 2), al-though dry-weight samples were not taken dur-ing the second growth phase. Both glycogen andtrehalose were present at low levels during theearly exponential growth on glucose. Glycogenaccumulation began when there was still morethan 1.5 mg of glucose per ml in the medium andreached a maximum shortly before the glucosein the medium was exhausted. Trehalose accu-mulation did not begin until the external glucoseconcentration was about 0.5 mg/mil and thencontinued during the lag period after glucoseexhaustion. Glycogen and trehalose values werenot obtained during the second growth phase,but in other experiments, cells growing exponen-
tially on AC-1 with no added glucose contained0.5 to 1% of their dry weight as glycogen andapproximately 0.6% of their dry weight as tre-halose.Limiting factor for growth in YM-P me-
dium. To interpret the reserve carbohydratelevels observed in cultures grown to stationaryphase in YM-P medium (see below), it was nec-essary to ascertain what limits cell proliferationin this medium. Accordingly, various nutrientswere added to cultures that had attained sta-tionary phase (i.e., the stage at which no furtherincrease in cell number occurs), and cell numberand the frequency of budded cells were thenmonitored (Table 2).The addition of yeast nitrogen base to a sta-
tionary-phase culture led to no resumption ofcell proliferation, suggesting that nutrients other
6
z
4
00
2
IqU)0aU),U)
60
30
SJ
0
Sk
LuNtUoU)U0)
a
U)(3
0t
1.5 -
IS
z
1.0 Qz
Lu
0
0.5 ~k
0
200 400 600 600TIME SINCE INOCULATION (nin)
FIG. 2. Reserve carbohydrate levels duringdiauxic growth ofyeast in AC-1 mediumplus glucose.Approximately 101O cells from precultures growingexponentially in AC-1 containing 4.5 mg of glucoseper ml were used to inoculate 10 liters of AC-1 con-taining 3.4 mg ofglucoseper ml in a 14-liter vessel ofa New Brunswick Microferm fermentor. The culturewas then incubated at 30°C with an initial impellerspeed of 250 rpm and an initial aeration rate ofapproximately 2,300 ml/min (flowmeter reading,2,000 ml/min; pressure gauge reading, 5 lb/in2). Dis-solved 02 in the culture was monitored continuouslywith a New Brunswick oxygen electrode and DO-40monitor; at 513 min and again at 724 min, the aera-tion rate and the impeller speed were increased (to3,400 ml/min and 300 rpm at 513 min, and to 4,350ml/min and 330 rpm at 724 min) to maintain thedissolved 02 level near saturation. Samples weretaken by allowing internal air pressure to expel cul-ture through the sampling line; care was taken toflush the dead space of the sampling line adequatelybefore collecting a sample. Symbols: (0) cell numbers(calculatedfrom absorbancy measurements at 660nmas described in the text); (A) cellular dry weight;(-) glucose in medium; (A) glycogen; (0) trehalose.
VOL. 143, 1980
on July 18, 2018 by guesthttp://jb.asm
.org/D
ownloaded from
1388 LILLIE AND PRINGLE
TABLE 2. Effectiveness ofadded nutrients ininducing cell proliferation in stationary-phase
cultures in YM-P mediuma% Budded cells at: Cell no.
Nutrient added (mg/ at 24 -ml) O h 3 h 24 h tial
value)
None 3 3 2 99
Yeast nitrogen 1 1 1 98base (7)
Glucose10 1 12 5 12320 2 34 7 13840 2 32 4 157a Unbaffled 50-ml flasks containing 10 ml of YM-P
medium were inoculated with exponentially growingcells to give initial cell densities of about 105 cells perml. Nutrient additions were made at arbitrary zerotime (9 days after inoculation and approximately 6.5days after cell number had stopped increasing). Bothglucose and yeast nitrogen base without amino acidswere added as dry, nonsterile reagents to avoid dilutingthe cultures (see below). No contamination was de-tected in any of the cultures by microscopic examina-tion 4 days after nutrient addition. Growth of unseencontaminants could not have been mistaken for yeastcell proliferation, since the percentage of budded cellswas always used as one measure of cell proliferation.
than the carbon and energy source do not limitgrowth in YM-P. In contrast, the addition ofglucose resulted in a transient resumption of cellproliferation, indicating that the cells had notarrested due to the accumulation of some inhib-itory substance, and that they were in fact car-bon or energy limited.The increases in cell number observed after
glucose addition were less than might have beenexpected on the hypothesis that the cultureswere limited simply by the availability of carbonor energy; for example, the culture receiving 20mg of glucose per ml (equal to the amountoriginally present in the YM-P medium) failedto double in cell number. However, three obser-vations suggest that this failure was not dueeither to limitation by other nutrients or toaccumulation ofinhibitory waste products. First,the culture receiving 40 mg of glucose per mlshowed more extensive proliferation than that.'receiving 20 mg of glucose per ml (Table 2).Second, when the latter culture was given addi-tional doses of 20 mg of glucose per ml at 24 and56 h, further spurts of proliferation were ob-served on each occasion (data not shown). Third,although cell number increased only 38% in theculture receiving 20 mg of glucose per ml, thecellular dry weight increased approximately65%. This last observation suggests one factor
that probably did contribute to limiting the in-creases in cell number observed after glucoseaddition: much ofthe glucose supplied may havebeen used for growth by small cells, present inthe stationary-phase population (14), that didnot reach the size threshold for cell cycle initia-tion (14) before carbon or energy supplies againbecame limiting.
In addition, several lines of evidence suggestthat the availability of oxygen limits the rate orextent of cell proliferation as cultures grow tostationary phase in YM-P medium; such a limi-tation would be expected to increase in severitywhen more carbon source was supplied. First,varying the amount of aeration during thegrowth of YM-P cultures affected the final num-bers of cells obtained. A culture shaken at 100rpm in an unbaffled flask and a culture shakenat 300 rpm in a baffled flask attained final cellnumbers of 2.44 x i05 and 4.27 x i0W cells perml, respectively. Second, cultures that werenearing stationary phase resumed rapid prolif-eration when diluted either with "spent me-dium" or with water (Table 3). Presumably, theeffect of dilution is due to the resulting increasein oxygen available per cell. Third, the corollaryidea that the availability of carbon sources is notlimiting in early stationary-phase cultures is sup-ported by the accumulation of large amounts oftrehalose after cell proliferation ceased (see be-low). However, the facts that cultures dilutedwith spent medium fail to regain their originalcell densities, and that this failure is more pro-nounced with older cultures (Table 3), suggestthat oxygen limitation is gradually supplantedby carbon and energy source limitation as sta-tionary-phase cultures age. Two additional ob-servations support this conclusion. First, dilu-tions with water or spent medium of culturesthat had been in stationary phase for 11 days ledto no resumption of proliferation (Table 3). Sec-ond, the addition of 10 mg of ethanol per ml tocultures that had been in stationary phase for 4days did stimulate renewed cell proliferation(data not shown). (The addition of ethanol re-sulted in some dilution of the culture, but acomparable dilution with water led to no re-newal of cell proliferation.)Taken together, these results suggest that an
interplay befween the availability of oxygen andthe availability of carbon and energy sourceslimits growth in YM-P medium. The fact thateven 42-day-old stationary-phase cultures re-sume proliferation in response to the addition ofglucose (data not shown) suggests that such alimitation obtains even in very old cultures.Reserve carbohydrate levels during the
approach to stationary phase in a rich me-dium. To explore further the accumulation of
J. BACTERIOL.
on July 18, 2018 by guesthttp://jb.asm
.org/D
ownloaded from
RESERVE CARBOHYDRATES IN YEAST CELLS 1389
TABLE 3. Effects of dilution on cellproliferation incultures nearing or in stationary phase in YM-P
mediuma% Budded Cell no.
Age of cul- Treatment cells at: at 30 hture (h %o
since inoc Treatment valueulation) Oh 4 h 30 h just after
treat-ment)
26 None 3 7 5 14026 Mock dilutionb - - - 13026 Glucose addedc (20 5 44 3 220
mg/ml)Dilution with:
26 Water (5x) 3 32 4 25026 Spent medium 4 35 4 430
(5X)26 Spent medium 3 32 3 770
(lox)36d Spent medium - - - 380
(lox)64' Spent(medium - - - 183
(lox)264' Spent medium 4 3 3 100
(lox)264f Water (5x) 2 2 3 99a Unbaffled 50-ml flasks containing 10 ml of YM-P
medium were inoculated with stationary-phase cellsto give initial cell densities of about 10' cells per ml.Beginning about 24 h after inoculation, the cultureswere judged, from the presence of less than 5% buddedcells, to be nearing stationary phase. (Table 2 showsthe low proportions of budded cells characteristic ofstationary-phase cultures in YM-P medium, and Fig.4, below, shows the rapid drop in percentage of buddedcells that ensues during the phase of slow cell prolif-eration after glucose exhaustion.) At various timesthereafter (arbitrary zero time in each experiment),cultures were treated as indicated. To make dilutions,appropriate amounts of culture were removed fromeach flask and replaced either with sterile distilledwater or with spent medium. Spent medium was ob-tained by centrifuging under sterile conditions thesample of culture removed from the appropriate flaskand returning the supernatant to that same flask.-,Not measured.
b Mock dilution was performed as for a real dilutionwith spent medium, except that the pellet as well asthe supernatant was returned to the culture flask aftercentrifugation.
e Glucose addition was performed as described inTable 2.
d An untreated control showed a 25% increase incell number over the following 5 days.'An untreated control showed a 15% increase in cell
number over the following 5 days.fAn untreated control showed no increase in cell
number over the following 30 h.
reserve carbohydrates in cells subjected to car-bon and energy limitation, we monitored glyco-gen and trehalose levels in cells approachingstationary phase in YM-P medium. Under the
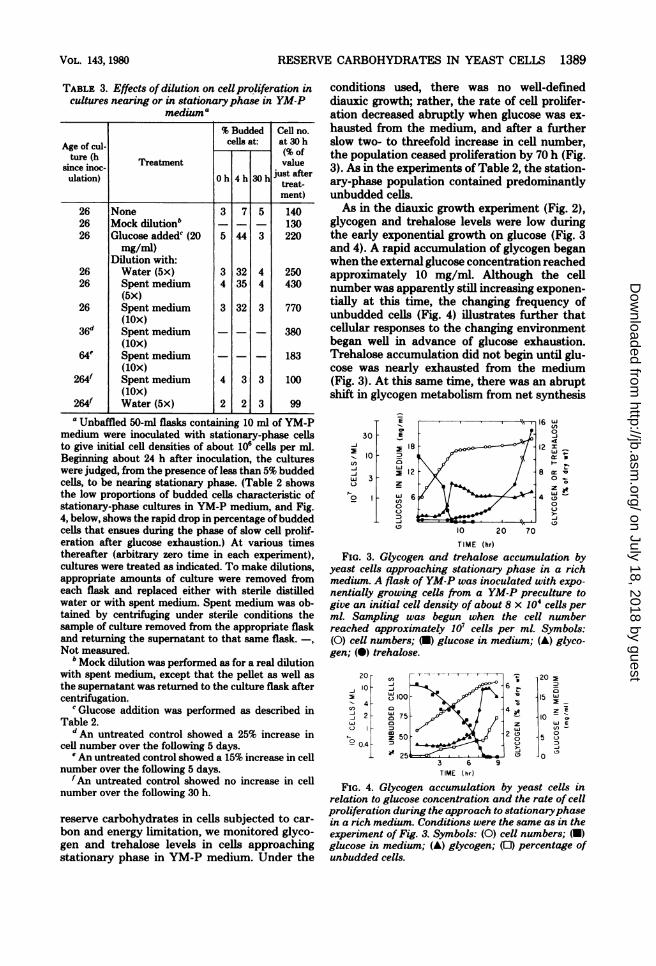
conditions used, there was no well-defineddiauxic growth; rather, the rate of cell prolifer-ation decreased abruptly when glucose was ex-hausted from the medium, and after a furtherslow two- to threefold increase in cell number,the population ceased proliferation by 70 h (Fig.3). As in the experiments of Table 2, the station-ary-phase population contained predominantlyunbudded cells.As in the diauxic growth experiment (Fig. 2),
glycogen and trehalose levels were low duringthe early exponential growth on glucose (Fig. 3and 4). A rapid accumulation of glycogen beganwhen the external glucose concentration reachedapproximately 10 mg/ml. Although the cellnumber was apparently still increasing exponen-tially at this time, the changing frequency ofunbudded cells (Fig. 4) illustrates further thatcellular responses to the changing environmentbegan well in advance of glucose exhaustion.Trehalose accumulation did not begin until glu-cose was nearly exhausted from the medium(Fig. 3). At this same time, there was an abruptshift in glycogen metabolism from net synthesis
E
30-_
X
10- 2(n 0
-Jw 3o z
o
0
0O-
18
12
6
10 20 70
TIME (hr)
w(A
C,4
I-
z0Z
JD0
FIG. 3. Glycogen and trehalose accumulation byyeast cells approaching stationary phase in a richmedium. A flask of YM-P was inoculated with expo-nentially growing cells from a YM-P preculture togive an initial cell density of about 8 x 10⁴ cells perml. Sampling was begun when the cell numberreached approximately 107 cells per ml. Symbols:(0) cell numbers; (U) glucose in medium; (A) glyco-gen; (0) trehalose.
20- 2205
o100 -15 W
4 0~~~~~~~-
3 6 9
TIME ( hr)
FIG. 4. Glycogen accumulation by yeast cells in
relation to glucose concentration and the rate of cell
proliferation during the approach to stationaryphase
in a rich medium. Conditions were the same as in the
experiment of Fig. 3. Symbols: (0) cell numbers; (U)
glucose in medium; (A) glycogen; (0) percentage of
unbudded cells.
\, 6
- 8
-4
VOL. 143, 1980
on July 18, 2018 by guesthttp://jb.asm
.org/D
ownloaded from

1390 LILLIE AND PRINGLE
to net degradation, which continued for somehours before a renewed slow accumulation be-gan. (The decline in glycogen level was evidentwhether values were expressed as percentage ofdry weight, as in Fig. 3, or as glycogen permilliliter of culture.) Trehalose accumulationcontinued in the absence of external glucose; by60 h after glucose exhaustion, this disaccharideconstituted 15% of the cellular dry weight. Inother experiments (data not shown), it was foundthat the levels of both glycogen and trehalosecontinued to increase for an additional 3 or 4days after cell number increase had ceased, ul-timately reaching 10 and 20% of the cellular dryweight, respectively.We were surprised to find that glycogen ac-
cumulation began when nearly half the initialglucose remained in the medium (Fig. 3 and 4).To learn more about the conditions giving riseto glycogen accumulation, we first determinedthe glycogen levels in cells growing exponentiallyin YM-P medium containing various concentra-tions of glucose (Table 4). Even at 2 mg ofglucose per ml, a low level of glycogen wasobserved. We then carried out experiments anal-ogous to that of Fig. 4, but with initial glucoseconcentrations of 60 and 5 mg/ml. (Experimentssimilar to those of Tables 2 and 3 showed that
TABLE 4. Glycogen accumulation patterns in cellsapproaching stationary phase in YM-P medium
with various glucose concentrationsGlycogen accumulation be-
Glycogen in gan atb:Initial glu- exponential Gucscose concn cells (% dry Glucose(mg/rnl) wt) concen- Cell density
tration (cells/ml)(mg/mi)
60 1.4 35 1 X10820 1.2 10 5 X 1075 1.5 2.7 1.5 X 1072 1.3 --
a Cells were grown exponentially in YM-P mediumwith the specified glucose concentrations for at least30 generations before sampling; dilutions were madeas needed to ensure that cell densities were nevergreater than 106 cells per ml. Samples for determina-tion of glycogen, dry weight, and glucose in the me-dium were taken at cell densities of 106 cells per ml; inno case was the concentration of glucose in the me-dium detectably less than the specified values.
b The values for the culture with 20 mg of glucoseper ml were taken from Fig. 4. Other values are fromexperiments analogous to that of Fig. 4, but carriedout with initial glucose concentrations of 60 and 5 mg/ml. In each case, a flask of YM-P medium with theappropriate glucose concentration was inoculated withexponentially growing cells from a YM-P preculture(with the same glucose concentration) to give an initialcell density of approximately 3 x 10⁵ cells per ml.-,Not determined.
even the cultures with 60 mg of glucose per mlwere carbon or energy limited or both.) Thesame pattern ofglycogen accumulation, followedby a net degradation after glucose exhaustion,was observed in each experiment, and in eachcase glycogen accumulation began when approx-imately half the initial glucose remained in themedium (Table 4). As one approach to findingout whether the cells might be responding tochanges in glucose concentration, we abruptlyshifted cells, growing exponentially in YM-Pmedium with 20 mg of glucose per ml, to freshYM-P medium with 5 mg of glucose per ml. Wedid not detect an increase in cellular glycogenafter this shift (data not shown).Reserve carbohydrate levels during a
prolonged stationary phase. The accumula-tion of large amounts of glycogen and trehaloseby cells entering an energy-limited stationaryphase (see above) suggests that one or both ofthese carbohydrates may be important to suchnonproliferating cells. To explore this possibility,the utilization of glycogen and trehalose by cellsduring a prolonged period in stationary phasewas followed and related to the retention of cellviability.
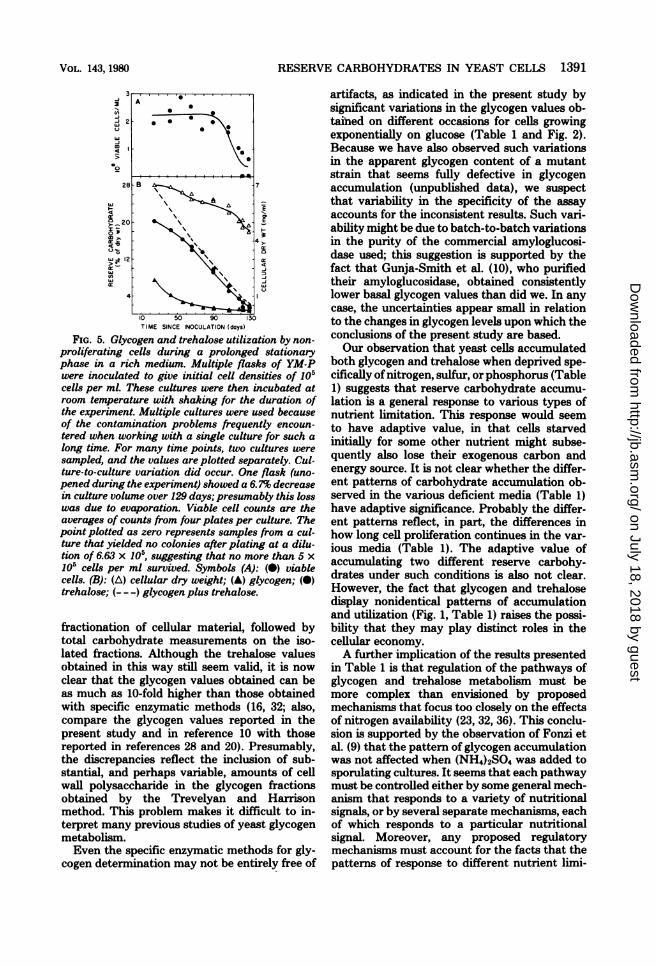
Cultures were grown to stationary phase inYM-P medium and incubated for an additional23 days before periodic sampling was begun (Fig.5). Other experiments (data not shown) haddemonstrated that detectable net degradation ofglycogen and trehalose did not begin until about14 days after attainment of stationary phase,and that the rate of degradation of each reservebetween 14 and 23 days was comparable to thatobserved initially in the experiment shown inFig. 5. As can be seen in Fig. 5, glycogen reachedits basal level of about 1% of the dry weight (seebelow) when nearly half the trehalose remained;however, the sum of the rates of degradation ofthese reserves was nearly constant throughoutthe course of the experiment. Cell viability didnot show a significant decline until the cultureshad been in stationary phase for more than 100days, at which time the trehalose levels haddropped to about 5% ofthe dry weights, glycogenhaving reached its basal level at least 20 daysearlier. The culture whose viable count was re-duced at least 400-fold by 122 days still yieldeda trehalose value of 1.5% of the cellular dryweight at 129 days. However, it is not clearwhether such a measurement is significant on apopulation in which most of the cells are dead.
DISCUSSIONMost studies of glycogen and trehalose metab-
olism in yeasts have used the method of Treve-lyan and Harrison (37) to measure these carbo-hydrates. This method consists of a chemical
J. BACTERIOL.
on July 18, 2018 by guesthttp://jb.asm
.org/D
ownloaded from
RESERVE CARBOHYDRATES IN YEAST CELLS 1391
E
F
3:4 >-
a:
cr-J
J:-J
TIME SINCE INOCULATION (days)
FIG. 5. Glycogen and trehalose utilization by non-proliferating cells during a prolonged stationaryphase in a rich medium. Multiple flasks of YM-Pwere inoculated to give initial cell densities of 105cells per ml. These cultures were then incubated atroom temperature with shaking for the duration ofthe experiment. Multiple cultures were used becauseof the contamination problems frequently encoun-tered when working with a single culture for such along time. For many time points, two cultures weresampled, and the values are plotted separately. Cul-ture-to-culture variation did occur. One flask (uno-pened during the experiment) showed a 6.7% decreasein culture volume over 129 days; presumably this losswas due to evaporation. Viable cell counts are theaverages of counts from four plates per culture. Thepoint plotted as zero represents samples from a cul-ture that yielded no colonies after plating at a dilu-tion of 6.63 x 10⁵, suggesting that no more than 5 x10⁵ cells per ml survived. Symbols (A): (0) viablecells. (B): (A) cellular dry weight; (A) glycogen; (0)trehalose; (---) glycogen plus trehalose.
fractionation of cellular material, followed bytotal carbohydrate measurements on the iso-lated fractions. Although the trehalose valuesobtained in this way still seem valid, it is nowclear that the glycogen values obtained can beas much as 10-fold higher than those obtainedwith specific enzymatic methods (16, 32; also,compare the glycogen values reported in thepresent study and in reference 10 with thosereported in references 28 and 20). Presumably,the discrepancies reflect the inclusion of sub-stantial, and perhaps variable, amounts of cellwall polysaccharide in the glycogen fractionsobtained by the Trevelyan and Harrisonmethod. This problem makes it difficult to in-terpret many previous studies of yeast glycogenmetabolism.Even the specific enzymatic methods for gly-
cogen determination may not be entirely free of
artifacts, as indicated in the present study bysignificant variations in the glycogen values ob-taihed on different occasions for cells growingexponentially on glucose (Table 1 and Fig. 2).Because we have also observed such variationsin the apparent glycogen content of a mutantstrain that seems fully defective in glycogenaccumulation (unpublished data), we suspectthat variability in the specificity of the assayaccounts for the inconsistent results. Such vari-ability might be due to batch-to-batch variationsin the purity of the commercial amyloglucosi-dase used; this suggestion is supported by thefact that Gunja-Smith et al. (10), who purifiedtheir amyloglucosidase, obtained consistentlylower basal glycogen values than did we. In anycase, the uncertainties appear small in relationto the changes in glycogen levels upon which theconclusions of the present study are based.Our observation that yeast cells accumulated
both glycogen and trehalose when deprived spe-cifically ofnitrogen, sulfur, or phosphorus (Table1) suggests that reserve carbohydrate accumu-lation is a general response to various types ofnutrient limitation. This response would seemto have adaptive value, in that cells starvedinitially for some other nutrient might subse-quently also lose their exogenous carbon andenergy source. It is not clear whether the differ-ent patterns of carbohydrate accumulation ob-served in the various deficient media (Table 1)have adaptive significance. Probably the differ-ent patterns reflect, in part, the differences inhow long cell proliferation continues in the var-ious media (Table 1). The adaptive value ofaccumulating two different reserve carbohy-drates under such conditions is also not clear.However, the fact that glycogen and trehalosedisplay nonidentical patterns of accumulationand utilization (Fig. 1, Table 1) raises the possi-bility that they may play distinct roles in thecellular economy.A further implication of the results presented
in Table 1 is that regulation of the pathways ofglycogen and trehalose metabolism must bemore complex than envisioned by proposedmechanisms that focus too closely on the effectsof nitrogen availability (23, 32, 36). This conclu-sion is supported by the observation of Fonzi etal. (9) that the pattern of glycogen accumulationwas not affected when (NH4)2SO4 was added tosporulating cultures. It seems that each pathwaymust be controlled either by some general mech-anism that responds to a variety of nutritionalsignals, or by several separate mechanisms, eachof which responds to a particular nutritionalsignal. Moreover, any proposed regulatorymechanisms must account for the facts that thepatterns of response to different nutrient limi-
VOL. 143, 1980
w-im4
a0
2
w
4
9>-_2x i0co 2-1Cc ,,q lau tw gecr-wcnwcr
on July 18, 2018 by guesthttp://jb.asm
.org/D
ownloaded from
1392 LILLIE AND PRINGLE
tations are similar, but not identical (Table 1);that the patterns of glycogen metabolism aresimilar, but not identical, to those of trehalose(Fig. 1, Table 1); and that both glycogen andtrehalose are also accumulated, with differentpatterns, in response to carbon and energy lim-itation (see below).
Possibly relevant to these differences in pat-tern is the report by Panek and Mattoon (26)that yeast cells must be released from glucoserepression before they can accumulate apprecia-ble trehalose. Our results show extensive treha-lose accumulation by cells incubated continu-ously in the presence of high concentrations ofglucose (Table 1), suggesting that release fromglucose repression is not a prerequisite for tre-halose accumulation. However, it should benoted that in marked contrast to glycogen ac-cumulation, trehalose accumulation during ni-trogen starvation began only after a 4-h lag (Fig.1). This observation explains the apparent dis-crepancy between our results and those ofPanekand Mattoon (26), since these workers sampledfor only 1 h after a shift of exponentially growingcells to starvation conditions. It is possible thatduring the 4-h lag the cells were somehow re-leased from glucose repression, although weknow of no evidence to support this idea.Whether or not release from glucose repres-
sion is necessary for trehalose accumulation,there is evidence from both batch culture (2, 10,26, 28, 31) and chemostat (20) studies that glu-cose limitation is sufficient to trigger both tre-halose accumulation and glycogen accumula-tion. In the present study, we have confirmedand extended this conclusion by demonstratingthe accumulation of glycogen and trehalose inresponse to carbon and energy limitation duringdiauxic growth in a relatively poor medium (Fig.2) and during the approach to stationary phasein a rich medium (Fig. 3 and 4, Table 4). Al-though at first glance perhaps surprising, theaccumulation of internal energy reserves in theface of a shortage of external supplies is readilyseen to be teleonomically sensible.
Interpretation of many previous studies usingrich media is handicapped by uncertainty aboutwhat actually limits growth in the media inquestion. Here we have shown unequivocally(Tables 2 and 3) that strain C276 growing inYM-P medium becomes carbon and energy lim-ited. However, it should be noted that theseresults cannot necessarily be generalized to othermedia and other strains, particularly strains withauxotrophic requirements.Both during diauxic growth and during the
approach to stationary phase, we observed astriking difference between the pattern of gly-cogen accumulation and that of trehalose (Fig.
2 and 3). Similar differences had been observedpreviously (28, 31), although detailed interpre-tation of the earlier studies is difficult becauseof uncertainty about growth-limiting factors, alack of data on cell number, and problems withthe glycogen assay used (see above). These ob-servations suggest that glycogen and trehalosemay play distinct roles in cells undergoing car-bon and energy limitation. The decline in gly-cogen levels during the several hours after ex-haustion of glucose from the medium (Fig. 2 and3) suggests that glycogen may serve as an energysource for the respiratory adaptation that occursafter the release from glucose repression duringaerobic growth (1, 28, 31). However, it should benoted that we have no evidence either that theglycogen degradation supplies energy to thecells, or that any energy so supplied is essentialfor respiratory adaptation. Indeed, the amountsof glycogen degraded are less (Fig. 2) or onlyslightly greater (Fig. 3) than the amounts oftrehalose accumulated during the same inter-vals, and a similar decline in glycogen levelsafter glucose exhaustion has been observed inanaerobically grown cells, in which no respira-tory adaptation occurs (4, 21).
It has also been proposed that trehalose mayserve as an energy source for respiratory adap-tation during diauxic growth (26, 28, 31). How-ever, this proposal is difficult to reconcile withthe observation that at least for strain C276,trehalose accumulation occurred predominantlyafter exhaustion of glucose from the medium(Fig. 2 and 3), with no sign of a period of nettrehalose degradation. Presumably, trehaloseaccumulation under these conditions occurs pri-marily at the expense of nonfermentable carbonsources (including glucose-derived fermentationproducts), an idea supported by the finding thata respiration-deficient strain accumulated only25% as much trehalose as did a respiration-com-petent strain (26).Whatever their roles in respiratory adapta-
tion, the patterns of accumulation of trehalose(Fig. 2 and 3) and glycogen (Fig. 3) suggest thatboth carbohydrates may be important to thecells during a subsequent period of starvation.This suggestion is supported by the observationthat both carbohydrates are degraded steadilyas starvation proceeds (Fig. 5), and also by thetemporal correlation between reserve carbohy-drate depletion and the onset of cell death (Fig.5). (Although some trehalose could still be de-tected in the cultures in which most of the cellswere dead, it is possible that most of this treha-lose was present in the individual cells thatremained alive.) These observations contrastwith previous reports that energy is suppliedprimarily (4, 8) or exclusively (7, 24) by glycogen
J. BACTERIOL.
on July 18, 2018 by guesthttp://jb.asm
.org/D
ownloaded from
RESERVE CARBOHYDRATES IN YEAST CELLS 1393
degradation during starvation under aerobicconditions, or, alternatively, that glycogen is notconsumed under such conditions (2); it is possi-ble that differences in the strains used, in theprecise conditions of incubation, or in the timescales of the experiments account for the dis-crepancy.Probably the most striking feature of the cel-
lular response to carbon and energy limitationwas that glycogen accumulation began well inadvance of exhaustion of glucose from the me-dium (Fig. 2 to 4 and Table 4; see also reference2). Although it may be mere numerology, it is ofinterest that in each culture, glycogen accumu-lation began when approximately half the origi-nal glucose remained. To begin anticipating glu-cose exhaustion at this time is teleonomicallysensible, since a culture growing exponentiallyon glucose will exhaust its external glucose sup-ply approximately one generation time after halfthe original glucose remains, regardless of theoriginal glucose concentration. However, it isdifficult to see what aspect of the cells' environ-ment can serve as the signal of impending glu-cose exhaustion. Clearly, the onset of glycogenaccumulation is not simply correlated eitherwith the external glucose concentration or withthe cell density of the culture (Table 4). It alsoseems unlikely that glycogen accumulation be-gins in response to the accumulation of glucose-derived fermentation products; in this case, onewould expect glycogen accumulation to beginwhen the same amount of glucose had beenmetabolized, regardless ofthe initial glucose con-centration. Clearly, this expectation is not real-ized (Table 4).
It seems most likely that glycogen accumula-tion begins in response to the rapidly changingglucose concentration, although it is difficult toenvision a mechanism that could span the rangeof glucose concentrations involved. The reportedKm values for glucose uptake by yeast cells rangefrom 1 to 17 mM (3, 12, 18). In our cultures,glycogen accumulation began at glucose concen-trations ranging from 15 mM (2.7 mg/nil) to 195mM (35 mg/ml) (Table 4), so that at least insome cultures, and possibly in all, the glucoseuptake system should have been saturated untilwell after the onset of glycogen accumulation.For at least two reasons, our failure to detectglycogen accumulation in cells shifted abruptlyfrom high to low glucose concentrations is notstrong evidence against the hypothesis that cellsrespond to changing glucose concentrations.First, one would expect only transitory glycogenaccumulation before the cells adjusted to thenew constant conditions; such a transitory re-sponse could easily be missed by the availableassay methods. Second, the technique used for
the shift required about 5 min for filtration andresuspension; the stress imposed by this proce-dure could have seriously affected the subse-quent behavior of the cells.
In summary, our results suggest several pos-sible roles for glycogen and trehalose during theyeast life cycle and indicate several constraintson the complex regulatory mechanisms that gov-ern glycogen and trehalose metabolism. How-ever, it must be emphasized that correlations ofthe types reported here and in previous studiesare not sufficient to establish cause-and-effectrelations. We hope that genetic studies will allowmore definitive conclusions to be drawn.
ACKNOWLEDGMENT1SWe thank Armin Fiechter, in whose laboratory some pre-
liminary experiments were done, for his advice and support;Hiroshi Ikuma for his advice; and Beverly S. Mitchell for herextensive comments on the manuscript.
This work was supported by Public Health Service grantGM-23936 from the National Institutes of Health and by agrant from the H. H. Rackham Graduate School of the Uni-versity of Michigan.
LITERATURE CITED1. Beck, C., and H. K. von Meyenburg. 1968. Enzyme
pattern and aerobic growth of Saccharomyces cerevi-siae under various degrees of glucose limitation. J.Bacteriol. 96:479-486.
2. Becker, J. U., H. J. Vohmann, and C. Eilers-Konig.1979. Glycogen metabolism in resting and growing cellsof Saccharomyces carlsbergensis. Arch. Microbiol.123:143-149.
3. Belaich, J. P., J. C. Senez, and M. Murgier. 1968.Microcalorimetric study of glucose permeation in mi-crobial cells. J. Bacteriol. 95:1750-1757.
4. Chester, V. E. 1963. The dissimilation of the carbohy-drate reserves of a strain of Saccharomyces cerevisiae.Biochem. J. 86:153-160.
5. Colonna, W. J., and P. T. Magee. 1978. Glycogenolyticenzymes in sporulating yeast. J. Bacteriol. 134:844-853.
6. Davis, B. D. 1961. The teleonomic significance of biosyn-thetic control mechanisms. Cold Spring Harbor Symp.Quant. Biol. 26:1-10.
7. Eaton, N. R. 1960. Endogenous respiration of yeast. 1.The endogenous substrate. Arch. Biochem. Biophys.88:17-25.
8. Fales, F. W. 1951. The assimilation and degradation ofcarbohydrates by yeast cells. J. Biol. Chem. 193:113-124.
9. Fonzi, W. A., M. Shanley, and D. J. Opheim. 1979.Relationship of glycolytic intermediates, glycolytic en-zymes, and ammonia to glycogen metabolism duringsporulation in the yeast Saccharomyces cerevisiae. J.Bacteriol. 137:285-294.
10. Gunja-Smith, Z., N. B. Patil, and E. E. Smith. 1977.Two pools of glycogen in Saccharomyces. J. Bacteriol.130:818-825.
11. Hartwell, L. H. 1974. Saccharomyces cerevisiae cell cy-cle. Bacteriol. Rev. 38:164-198.
12. Heredia, C. F., A. Sols, and G. DelaFuente. 1968.Specificity of the constitutive hexose transport in yeast.Eur. J. Biochem. 5:321-329.
13. Huang, K.-P., and E. Cabib. 1974. Yeast glycogen syn-thetase in the glucose-6-phosphate-dependent form. 1.Purification and properties. J. Biol. Chem. 249:3851-3857.
14. Johnston, G. C., J. R. Pringle, and L. H. Hartwell.
VOL. 143, 1980
on July 18, 2018 by guesthttp://jb.asm
.org/D
ownloaded from
1394 LILLIE AND PRINGLE
1977. Coordination of growth with cell division in theyeast Saccharomyces cerevisiae. Exp. Cell Res. 105:79-98.
15. Kane, S. M., and R. Roth. 1974. Carbohydrate metabo-lism during ascospore development in yeast. J. Bacte-riol. 118:8-14.
16. Kiippeli, O., H. Aeschbach, H. Schneider, and A.Fiechter. 1975. A comparative study of carbon energyreserve metabolism of C. tropicalis growing on glucoseand on hydrocarbons. Eur. J. Appl. Microbiol. 1:199-211.
17. Kelly, P. J., and B. J. Catley. 1976. A purification oftrehalase from Saccharomyces cerevisiae. Anal. Bio-chem. 72:353-358.
18. Kotyk, A., and A. Kleinzelier. 1967. Affinity ofthe yeastmembrane carrier for glucose and its role in the Pasteureffect. Biochim. Biophys. Acta 135:106-111.
19. Kuenzi, M. T., and A. Fiechter. 1969. Changes in car-bohydrate composition and trehalase-activity duringthe budding cycle of Saccharomyces cerevisiae. Arch.Mikrobiol. 64:396-407.
20. Kuenzi, M. T., and A. Fiechter. 1972. Regulation ofcarbohydrate composition ofSaccharomyces cerevisiaeunder growth limitation. Arch. Mikrobiol. 84:254-265.
21. Labbe-Bois, R., C. Voliand, J.-P. Forestier, and P.Labbe. 1973. Protohaem synthesis by the yeast Sac-charomyces cerevisiae during respiratory adaptation.Relationships with glycogen metabolism. Enzyme 16:9-20.
22. Lerch, K., and E. H. Fischer. 1975. Amino acid sequenceof two functional sites in yeast glycogen phosphorylase.Biochemistry 14:2009-2014.
23. Panek, A. 1962. Synthesis of trehalose by baker's yeast(Saccharomyces cerevisiae). Arch. Biochem. Biophys.98:349-355.
24. Panek, A. 1963. Function of trehalose in baker's yeast(Saccharomyces cerevisiae). Arch. Biochem. Biophys.100:422-425.
25. Panek, A. D. 1969. Adenosine triphosphate inhibition ofyeast trehalase. J. Bacteriol. 99:904-905.
26. Panek, A. D., and J. R. Mattoon. 1977. Regulation ofenergy metabolism in Saccharomyces cerevisiae. Re-lationships between catabolite repression, trehalosesynthesis, and mitochondrial development. Arch. Bio-chem. Biophys. 183:306-316.
27. PateL G. B., and W. M. Ingledew. 1975. The relation-ship of acid-soluble glycogen to yeast flocculation. Can.J. Microbiol. 21:1608-1613.
28. Polaklis, E. S., and W. Bartley. 1966. Changes in dryweight, protein, deoxyribonucleic acid, ribonucleic acid
and reserve and structural carbohydrate during theaerobic growth cycle of yeast. Biochem. J. 98:8834887.
29. Pringle, J. R. 1975. Induction, selection, and experimen-tal uses of temperature-sensitive and other conditionalmutants of yeast. Methods Cell Biol. 12:233-272.
30. Pringle, J. R., and J.-R. Mor. 1975. Methods for moni-toring the growth of yeast cultures and for dealing withthe clumping problem. Methods Cell Biol. 11:131-168.
31. Quain, D. E., and J. M. Haslam. 1979. Changes inglucose-6-phosphate and storage carbohydrates duringcatabolite derepression in Saccharomyces cerevisiae. J.Gen. Microbiol. 113:195-198.
32. Rothman, L B., and E. Cabib. 1969. Regulation ofglycogen synthesis in the intact yeast cell. Biochemistry8:3332-3341.
33. Rothman-Denes, L B., and E. Cabib. 1970. Two formsof yeast glycogen synthetase and their role in glycogenaccumulation. Proc. Natl. Acad. Sci. U.S.A. 66:967-974.
34. Rousseau, P., H. 0. Halvorson, L A. Bulla, Jr., andG. St. Julian. 1972. Germination and outgrowth ofsingle spores of Saccharomyces cerevisiae viewed byscanning electron and phae-contrast microscopy. J.Bacteriol. 109:1232-1238.
35. Spiro, R. G. 1966. Analysis of sugars found in glycopro-teins. Methods Enzymol. 8:3-5.
36. Trevelyan, W. E., and J. S. Harrison. 1956. Studies onyeast metabolism. 5. The trehalose content of baker'syeast during anaerobic fermentation. Biochem. J. 62:177-183.
37. Trevelyan, W. E., and J. S. Harrison. 1956. Studies onyeast metabolism. 7. Yeast carbohydrate fractions. Sep-aration from nucleic acid, analysis, and behavior duringanaerobic fermentation. Biochem. J. 63:23-33.
38. Unger, M. W., and L H. Hartwell. 1976. Control of celldivision in Saccharomyces cerevisuae by methionyl-tRNA. Proc. Natl. Acad. Sci. U.S.A. 73:1664-1668.
39. Van der Plaat, J. B. 1974. Cyclic 3',5'-adenosine mono-phosphate stimulates trehalose degradation in baker'syeast. Biochem. Biophys. Res. Commun. 56:580-587.
40. Van Solingen, P., and J. B. van der Plaat. 1975. Partialpurification of the protein system controlling the break-down of trehalose in baker's yeast. Biochem. Biophys.Res. Commun. 62:553-560.
41. Von Meyenburg, H. K. 1969. Energetics of the buddingcycle of Saccharomyces cerevisiae during glucose lim-ited aerobic growth. Arch. Mikrobiol. ":289-303.
42. Wilkinson, L E., and J. R. Pringle. 1974. Transient Glarrest of S. cerevisiae cells of mating type a by a factorproduced by cells of mating type a. Exp. Cell Res. 89:175-187.
J. BACTERIOL.
on July 18, 2018 by guesthttp://jb.asm
.org/D
ownloaded from


![Tachdjian's Pediatric Orthopaedics [Chapter 12] · 12—2). Lumbar Scheuermann's disease, characterized pri- marily by the typical radiographic changes associated with Scheuermann's](https://img.pdfslide.net/doc/110x75/5f9b9f5b43f9d35596057423/tachdjians-pediatric-orthopaedics-chapter-12-12a2-lumbar-scheuermanns-disease.jpg)