Embed Size (px)
Citation preview
RMAG, Denver, Colorado, August 2004
1
RESERVOIR CATEGORIZATION OF TIGHT GAS SANDSTONES BY CORRELATING PETROPHYSICS WITH CORE-MEASURED CAPILLARY PRESSURE
Michael Holmes, Antony Holmes and Dominic Holmes, Digital Formation, Inc.
Copyright 2004, held by the submitting authors. This paper was prepared for presentation at RMAG, Denver, Colorado, August, 2004.
ABSTRACT
Tight gas sandstones have the characteristics of medium to low porosity, low to very low permeability and variable porosity/saturation relations. Often a free water level is difficult or impossible to identify in the wellbore. Erratically changing profiles of porosity and saturation are difficult to interpret with respect to identification of pay intervals. Additionally, in some areas water salinity varies. Sometimes there is a mixing of wet sandstones with gas-bearing sandstones, with both groups having high resistivities and not always easy to differentiate. A method is described whereby detailed examination of density and neutron responses can quantify this distinction.
A second technique presented here involves linking capillary pressure saturation/depth profiles with petrophysically-defined porosity and saturation depth profiles. Source core capillary pressure data should be from the same reservoir sequence, but not necessarily from the same well. Core samples, showing a range of porosity/permeability relationships, are analyzed to yield a spectrum of saturation/height relationships, linked to porosity.
Integration into petrophysically-defined saturation/porosity profiles involves first a choice of the free water level interpreted to control the gas within a continuous hydraulic unit. This level may be below the total depth of the well. Then, a spectrum of saturation/height curves is calculated, specific to the petrophysically-defined porosity profile. Finally, a comparison with petrophysically-determined saturation permits an
automatic definition of rock quality, mobile vs. immobile water and permeability.
By incorporating relative permeability concepts, profiles of effective permeability to each fluid (gas and water) can be estimated. Flow units can be differentiated from barriers. The data can also be used to identify which intervals should be completed, and which zones should be isolated from one another.
A data set of ten wells from the Piceance Basin, NW Colorado, is used to show results from the petrophysical techniques described.
INTRODUCTION- GEOLOGIC BACKGROUND
Gas production in the Piceance Basin is primarily from non-marine sandstones of the late Cretaceous William Fork Formation. Figure 1 shows a location map, and Figure 2 presents a stratigraphic column. Drilled depths to the top of the gas accumulation range from about 3500 feet in the Dubuque Field to 5800 feet in Rulison. Thickness of the gross gas productive interval ranges from 1700 feet to 2400 feet. Reservoirs are over-pressured, ranging up to a gradient of 0.8 psi per foot.
Source of the gas is probably the underlying Mancos Shale as well as coals in the paludal Cameo interval. Operators in the area have identified a top of Continuous Gas Saturation. It has been demonstrated that the non-marine gas-bearing sandstones are limited in lateral extent. Above the Continuous Gas Column is a mixed interval of fresh water filled sandstones (probably the more continuous layers) and gas filled sandstones (discontinuous).

RMAG, Denver, Colorado, August 2004
Figure 1: Location map. The Debeque Field is five miles to the SSW of the SW corner of the map.
Figure 2 Stratigraphic column.
THE PROBLEM OF FRESH WATER SANDSTONES – A PETROPHYSICAL CHALLENGE
Above the top Continuous Gas Saturation, discontinuous gas-bearing sandstones are intermingled with generally more laterally continuous fresh water sandstones. Each sandstone
type has relatively high resistivity (usually from 30 to 50 ohms) due to one of the following reasons:
• Gas-bearing with relatively low water resistivity (RW)
• Fresh water with much higher water resistivity (RW)
Qualitative distinction between the two is possible by examining density/neutron response. If the two curves are plotted using consistent lithology (calcareous sandstone is appropriate for these rocks) then fresh water sandstones should show no cross over, whereas gas-bearing sandstones will show cross over (suppression of the neutron log in the presence of gas).
2

RMAG, Denver, Colorado, August 2004
We have quantified this distinction for the full range of shaley formations by creating pseudo logs. The technique works as follows:
• Determine clean formation and shale properties from porosity cross plots. This is best done in sandstones known to be wet. For this sequence we used sandstones high in the Mesaverde Formation (i.e. remote from the top continuous gas, in sandstones most likely to be wet).
• Calculate porosity from a density/neutron cross plot. This calculation is relatively independent of fluid content or matrix properties.
• Calculate pseudo density and pseudo neutron logs knowing porosity, matrix volume, shale volume, and fluid saturation (calculations made for both wet rocks and gas-filled rocks).
• Compare actual log response with the wet and gas-filled pseudo logs. From this comparison, a gas saturation profile can be quantified from each porosity log individually.
If an acoustic log is also available (as it is for a few wells in this study area) pseudo logs can be created in an analogous way using Gassmann’s approach (Gassmann, 1951).
As an extension of this approach, gas saturation for the entire sequence can be calculated with no requirement for assumptions as to salinity of the formation water.
The first set of interpretations involves examining the “transition zone,” above the Continuous Gas Column, to distinguish wet sandstones with fresh water from gas-bearing sandstones.
PETROPHYSICS COMBINED WITH CAPILLARY PRESSURE MODELING OF THE ENTIRE GAS-BEARING SEQUENCE
Another modeling technique we have developed over the past few years involves combining capillary pressure core measurements with petrophysical calculations. The method is covered by patent number 6,484,102 issued in November 2002.
A capillary pressure curve can be described by its principal components, as shown in Figure 3. A table of the symbols used is presented in Figure 4.
Figure 3: Elements of a capillary pressure
curve.
3

RMAG, Denver, Colorado, August 2004
Figure 4: Description of the symbols used throughout the paper. From extensive examination of a large number of reservoirs – oil and gas, clastic and carbonates, and covering a wide range of porosity and permeability – we have determined relationships for samples in any one reservoir, among:
• Porosity – Pce
• Porosity – Hyp1
• Porosity – SWmc
• Porosity – Pcmc
• Porosity – Hyp2
• Porosity – SWi
Note: all correlations are different for each pair, and change from one reservoir to the next (see Fig. 5 for a schematic example).
In a homogeneous reservoir (one with a single porosity/permeability trend) the individual correlations will approximate a straight line on a linear-log correlation. However, most reservoirs are heterogeneous and will have several porosity/permeability trends, and the plots of Figure 5 will show data scatter.
Figure 5: Schematic relationship between
porosity and capillary pressure elements.
A stylistic porosity/permeability cross plot for a heterogeneous reservoir is shown in Figure 6. It is suggested that different rock types will group such that the slope is similar but the intercept varies. Timur and Coates petrophysical permeability equations both show that the slope of the correlation is about three decades of permeability change for each 10% porosity change. Many reservoirs, where rock types are recognized, show
4

RMAG, Denver, Colorado, August 2004
the same pattern. Thus, a rock type can be defined on the basis of the intercept of permeability at zero porosity. The higher the value of this intercept, the “better” the rock – i.e. for any given porosity the higher the permeability.
Figure 6: Stylistic porosity/permeability cross
plot for a heterogonous reservoir. Note different values of k intercept at zero porosity.
When this type of categorization is added to the porosity vs. capillary pressure component plots (Fig. 5), trends are established which explain the data scatter. These correlations then permit construction of a series of saturation profiles covering the full range of rock types in the reservoir under consideration.
Procedures to compare with petrophysical analysis are as follows:
1. Run standard petrophysical analysis to include effective porosity and water saturation.
2. Choose the hydrocarbon/water contact for an interval believed to belong to a single hydraulic unit. Use trends of downward-increasing SW to help in this choice, as appropriate.
3. Run the appropriate reservoir capillary pressure model which will calculate, for the specific porosity profile, an entire range of possible theoretical SW values for all rock categories (as established by
the intercept values on the porosity/permeability cross plots.)
4. The program then chooses, level by level, the closest match to the petrophysically defined SW; this match is the rock category.
5. From the value of rock category and petrophysically-defined porosity, an estimate of permeability is available.
6. Using normalized hydrocarbon/water relative permeability curves, and knowing SW at each level, relative permeability to each fluid phase can be estimated.
7. From total permeability and relative permeability, effective permeability to each fluid phase is available.
CONCEPT OF THE “PERMEABILITY JAIL”
Recently publication introduced the concept of a “permeability jail” in the analysis of tight gas reservoirs (Shanley et al., 2003). The concept they have developed is that for reservoirs with less than about ten microdarcies of permeability, even though the rock is gas saturated, there is essentially zero effective permeability to gas.
In our capillary pressure and petrophysical models, we have included calculations whereby rocks within the jail are distinguished from those outside.
CAPILLARY PRESSURE RESERVOIR ANALOGUE
A series of mercury injection capillary pressure measurements from the Grand Mesa area, Garfield County were analyzed, to create the capillary pressure model. Figure 7 is a porosity/permeability cross plot for the capillary pressure samples. Porosity ranges from 5% to 14% and permeability from 0.001 to 0.2 md. The symbols (5, 6, 7) are different rock categories. Porosity range is similar to the petrophysically-defined porosities for the ten wells examined in this study.
5

RMAG, Denver, Colorado, August 2004
Figure 7: Porosity/Permeability Cross Plot for
capillary pressure measurements from MWX wells, Garfield County Colorado.
DATABASE
A total of ten wells from Grand Valley, Paradise and Rulison Fields, kindly provided by Williams Production RMT Co. were analyzed; a good digital log data suite exists on all wells. In addition to density/neutron logs on all wells, three wells have acoustic logs. Perforations, formation tops, and EUR data were also provided.
RESULTS – ANALYSIS OF TRANSITION ZONE
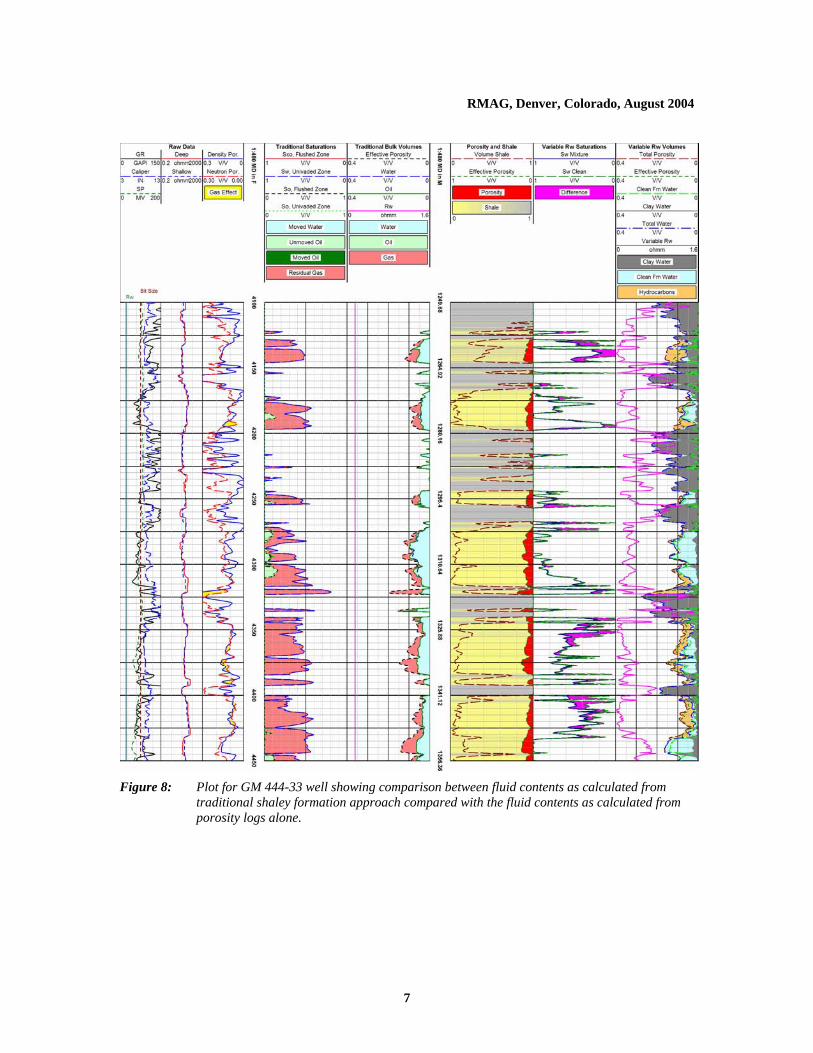
Figure 8 shows a comparison of fluid content from traditional shaley formation saturation modeling, (accounting for changes in RW as best as possible) with saturation from porosity logs analysis. For the porosity log SW analysis the density log was used as the source, because the petrophysical model is much simpler and deemed to be more reliable than for the neutron log.
Figure 9 shows an interpretation among three wells for the upper part of the Mesaverde Formation. Wet sandstones (in blue) are more continuous than gas-bearing sandstones (in orange). It is clear from the cross section that there are significant volumes of gas above the top continuous gas column (KMV Gas). A challenge to completion engineers is
whether or not these isolated gas sandstones can be stimulated without connecting to adjacent wet sandstones.
RESULTS – CAPILLARY PRESSURE MODELING
For all wells it was assumed that the main gas accumulation has a downdip limit of about 9000 feet. This depth is several thousand feet below the total depth of any of the wells, and indicates that all sandstones should be above any gas/water transition zone. With few exceptions petrophysical interpretation supports this conclusion. However, occasional sandstones, mostly within the Cameo coal sequence on initial analysis appear to be wet (based on density/neutron response). However, these sandstones have different mineralogic components causing an apparent absence of density/neutron cross over.
Figure 10 gives an example of petrophysical interpretation, combined with capillary pressure modeling. Figure 11 is a modified Lorenz plot, showing the recognition of gas flow units.
For all wells, the intervals categorized as outside the jail were perforated. Other gas-bearing sandstones identified in this study as being within the jail were also sometimes perforated.
A comparison of EUR by well with net pay criteria established from logs is shown in Figure 12.
Figure 13 is a cross plot of k*h vs. Phi*h*Sg with values of EUR included, Figure 14 is a cross plot of Phi*h*Sg vs. EUR with the values of k*h included, and Figure 15 is a cross plot of Gas in Place outside the jail vs. EUR with values of k*h included:
• EUR increases as Phi*h increases
• k*h appears to reach a maximum of about 12 md-ft for EUR above about 1.2 BCF
• Below an EUR of 1.2 BCF, k*h decreases as EUR decreases.
• There is good correlation between volumetric calculations of Gas in Place (outside the jail) and EUR.
Figure 16 is a comparison of log responses among three wells in the Continuous Gas Column.
6
RMAG, Denver, Colorado, August 2004
Figure 8: Plot for GM 444-33 well showing comparison between fluid contents as calculated from
traditional shaley formation approach compared with the fluid contents as calculated from porosity logs alone.
7

RMAG, Denver, Colorado, August 2004
Figure 9: Interpretation among three wells for the upper part of the Mesaverde Formation, showing
distinction between wet and gas-bearing sandstones.
8

RMAG, Denver, Colorado, August 2004
Figure 10: Examples of Capillary Pressure/Petrophysical Modeling – MV 4-3 well.
9

RMAG, Denver, Colorado, August 2004
Figure 13: Cross plot of k*h vs. Phi*h*Sg
with EUR (BCF) in the Z Axis.Figure 11: Modified Lorenz plot to show gas flow units – GM 211-32 well.
Figure 12: Table of Comparison of EUR by well with net pay criteria. Gas-in-Place calculated
assuming an average reservoir pressure of 5000 psi and a gas formation volume factor (Bg) of 0.0027 RCF/SCF.
10

RMAG, Denver, Colorado, August 2004
Figure 14: Cross plot of Phi*h*Sg vs. EUR
with k*h (md-ft) in the Z Axis.
Figure 15: Cross plot of Gas-in-Place vs.
EUR with k*h (md-ft) in the Z Axis.
11

RMAG, Denver, Colorado, August 2004
Figure 16: Interpretation among three wells of log responses in the continuous gas column.
12

RMAG, Denver, Colorado, August 2004
13
CONCLUSIONS
A technique has been developed to quantify fresh water wet sandstones from gas-bearing sandstones at the top of the William Fork Formation. Basis of the technique is detailed analysis of density and neutron responses to estimate gas saturation independently of water resistivity. From correlations among the study wells, it can be shown that the wet sandstones are mostly more continuous laterally than the gas-bearing sandstones. Accurate distinction between gas-bearing and wet intervals is important when wells are completed.
Other approaches combine core measured capillary pressure measurements with petrophysics, to recognize different rock categories in the main gas accumulation. From these rock categories, permeabilities to gas were calculated at each reservoir depth level. Cumulative flow capacities (kgas*h) and storage capacities (Phi*Sg*h) were compared with estimated ultimate recoveries. A logical correlation of increasing storage capacity as EUR increases exists. There appears to be a maximum flow capacity in this data set of about 12 md-ft.
REFERENCES
Cumella, S. and D. Ostby, October 2003, Geology of Basin-Centered Gas Accumulation, Piceance Basin, Colorado: RMAG and AIPG Piceance Basin Field Symposium.
Gassmann, F., 1951. Über die Elastizität poröser Medien. Vier. der Natur. Gesellschaft in Zürich, 96, 1-23.
Holmes, M., and S.P. Cumella, October 2003, Reservoir Categorization from Petrophysical Analysis – Mesaverde Sandstone of the Piceance Basin, Northwestern Colorado: RMAG and AIPG Piceance Basin Field Symposium.
Shanley, K.W., R.M. Cluff, L.T. Shannon, and J.W. Robinson, September 2003, Controls on Prolific Gas Production from Low-Permeability Sandstone Reservoirs: Insights and Implications from the Green River Basin: RMAG and Petroleum Technology Transfer Council (PTTC) Petroleum Systems and Reservoirs of Southwest Wyoming Symposium.
ACKNOWLEDGEMENTS
Stephen Cumella of Williams Production RMT Company kindly provided digital log information, perforated intervals and EUR information on ten wells used as a basis for this paper. He also gave valuable insight into the geologic controls of gas production from this reservoir.
ABOUT THE AUTHORS
Michael Holmes has a Ph.D. from the University of London in geology and a MSc. from the Colorado School of Mines in Petroleum Engineering. His professional career has involved employment with British Petroleum, Shell Canada, Marathon Oil Company and H.K. van Poollen and Associates. For the past 15 years he has worked on petrophysical analyses for reservoirs worldwide under the auspices of Digital Formation, Inc.
Antony M. Holmes has a BS in Computer Science from the University of Colorado. He has been involved with the development of petrophysical software for 15 years with Digital Formation, Inc., particularly with regards to the implementation of petrophysical analyses.
Dominic I. Holmes has a BS in Chemistry and a BS in Mathematics from the Colorado School of Mines. He has been involved with the development of petrophysical software for 15 years with Digital Formation, Inc., particularly with regards to the presentation of petrophysical information in a graphical format.


![Capillary thermostatting in capillary electrophoresis · Capillary thermostatting in capillary electrophoresis ... 75 µm BF 3 Injection: ... 25-µm id BF 5 capillary. Voltage [kV]](https://img.pdfslide.net/doc/110x75/5c176ff509d3f27a578bf33a/capillary-thermostatting-in-capillary-electrophoresis-capillary-thermostatting.jpg)