Embed Size (px)
Citation preview
Reservoir Quality and Petrophysical Model of the Tarn Deep-Water Slope-Apron System, North Slope, Alaska
Pacific Section AAPGMay 8, 2006
Alaska Department ofNaturalResources
Kenneth P. Helmold, Alaska Division of Oil & GasWayne J. Campaign, ConocoPhillips Alaska, Inc.William R. Morris, ConocoPhillips Co.Douglas S. Hastings, Brooks Range Petro. Corp.Steven R. Moothart, ConocoPhillips Alaska, Inc.
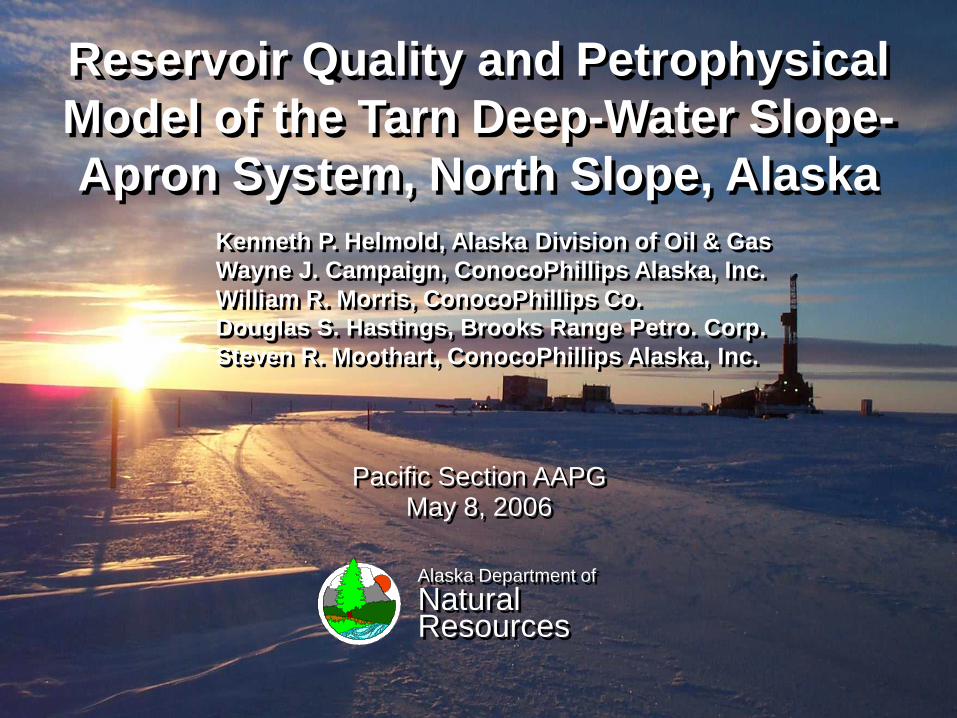
Outline
• Regional setting• Petrology of sandstones• Facies and reservoir quality• Regional reservoir quality model• Petrophysical model• Conclusions
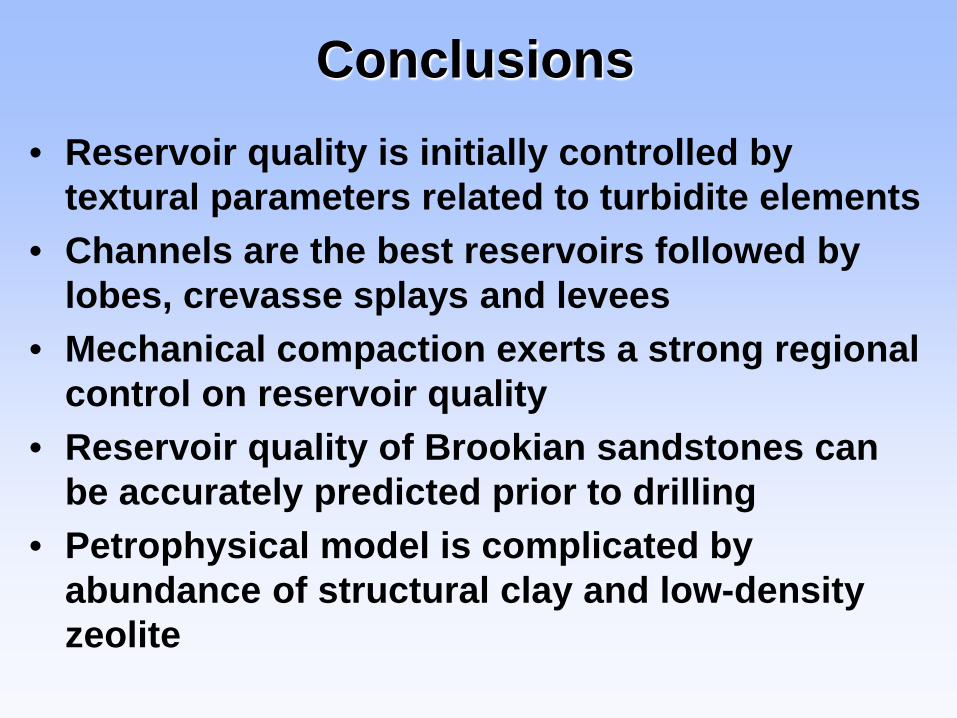
Conclusions• Reservoir quality is initially controlled by
textural parameters related to turbidite elements• Channels are the best reservoirs followed by
lobes, crevasse splays and levees• Mechanical compaction exerts a strong regional
control on reservoir quality• Reservoir quality of Brookian sandstones can
be accurately predicted prior to drilling • Petrophysical model is complicated by
abundance of structural clay and low-density zeolite
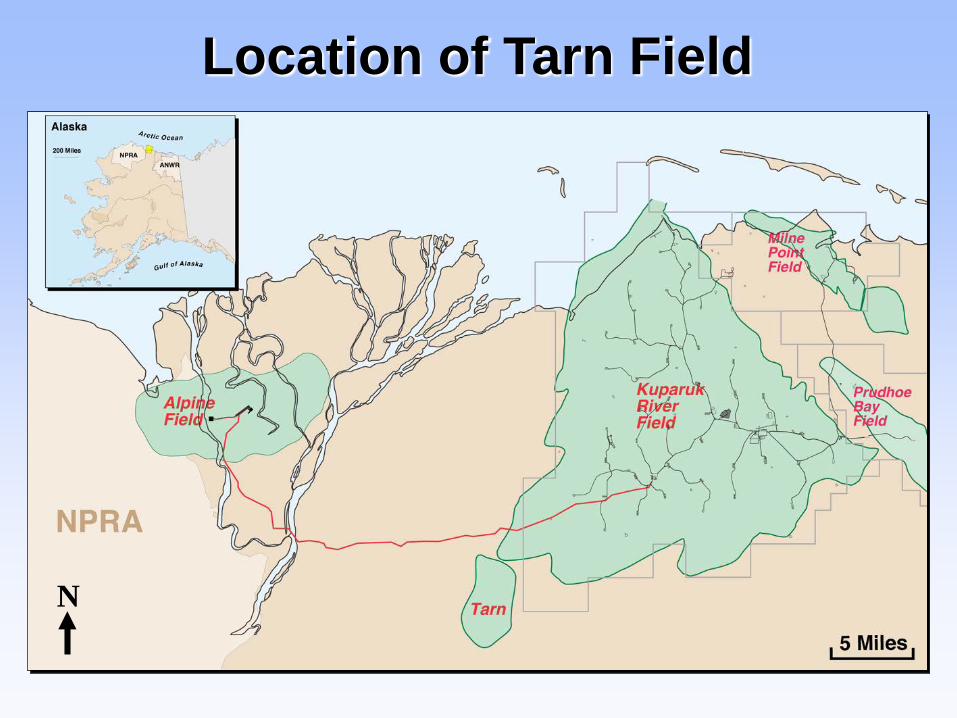
Location of Tarn Field
N
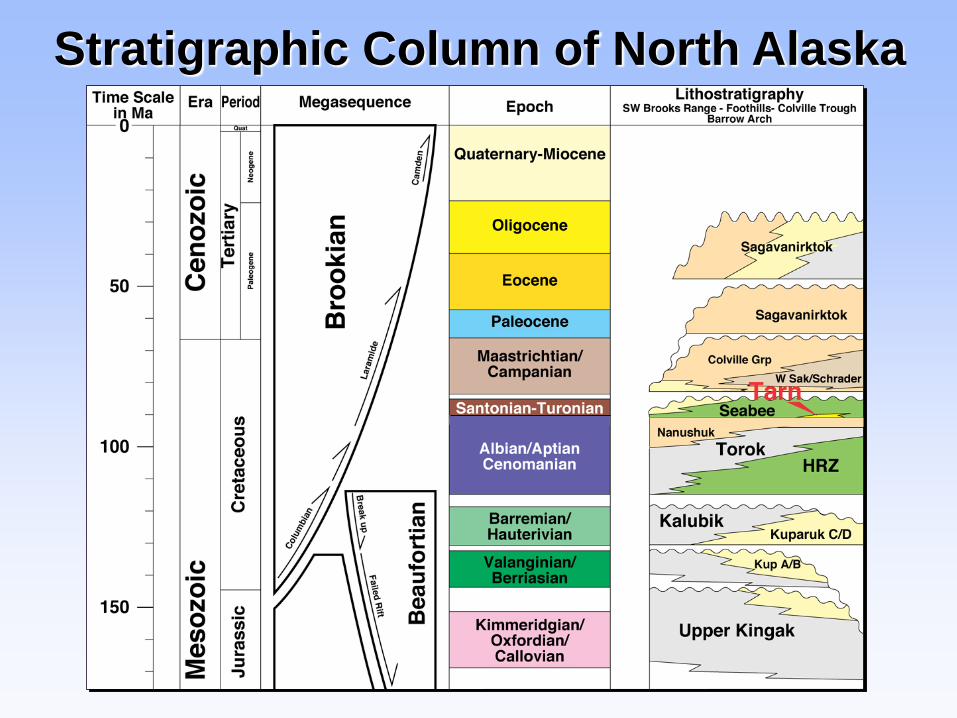
Stratigraphic Column of North Alaska
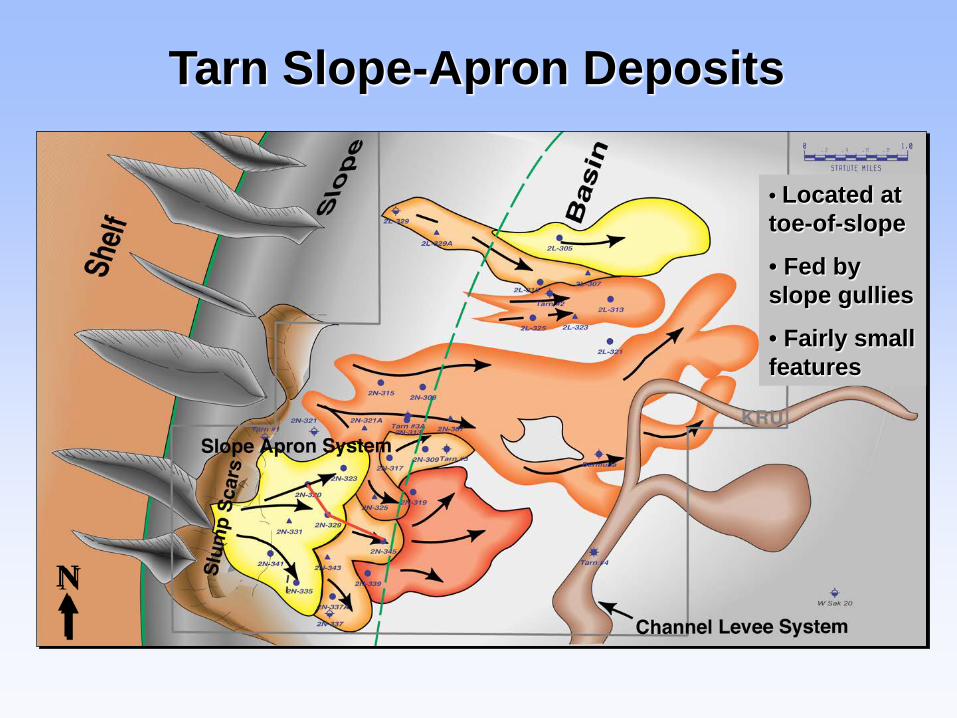
Tarn Slope-Apron Deposits
N
• Located at toe-of-slope
• Fed by slope gullies
• Fairly small features
Outline
• Regional setting• Petrology of sandstones• Facies and reservoir quality• Regional reservoir quality model• Petrophysical model• Conclusions
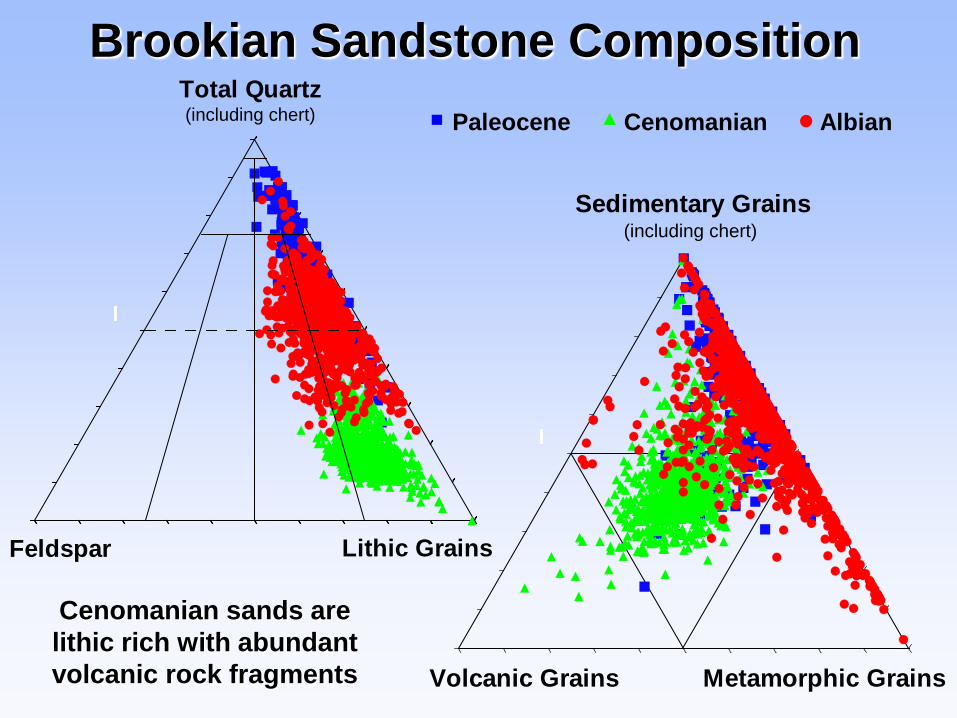
Brookian Sandstone CompositionTotal Quartz
Feldspar Lithic Grains
(including chert)
Sedimentary Grains
Volcanic Grains Metamorphic Grains
(including chert)
Paleocene Cenomanian Albian
Cenomanian sands are lithic rich with abundant volcanic rock fragments
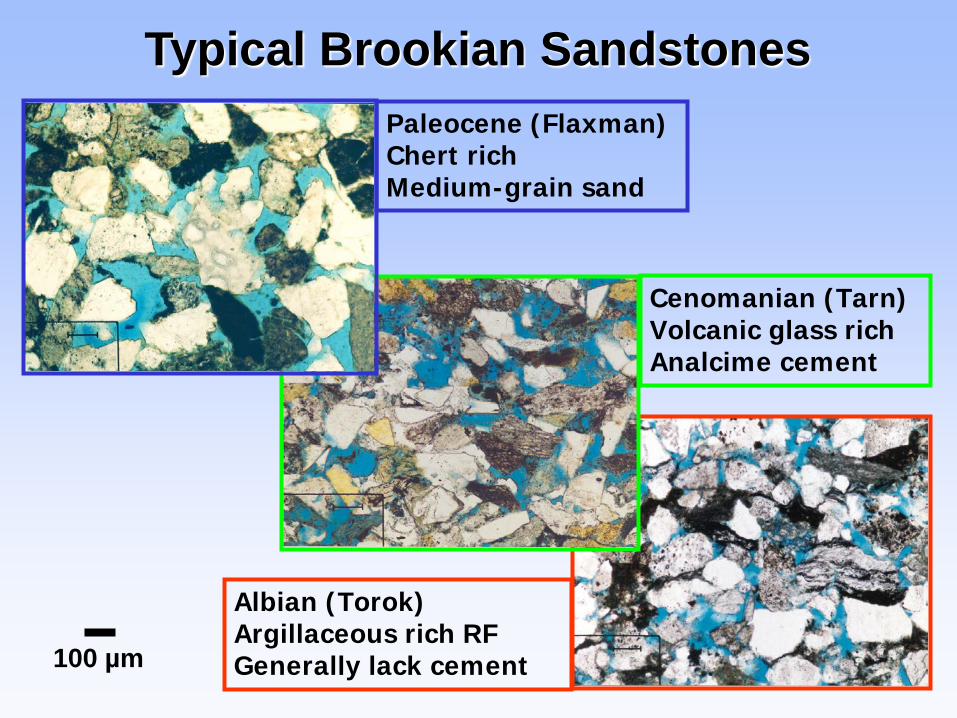
Typical Brookian Sandstones
Albian (Torok)Argillaceous rich RFGenerally lack cement
Paleocene (Flaxman)Chert richMedium-grain sand
Cenomanian (Tarn)Volcanic glass richAnalcime cement
100 µm
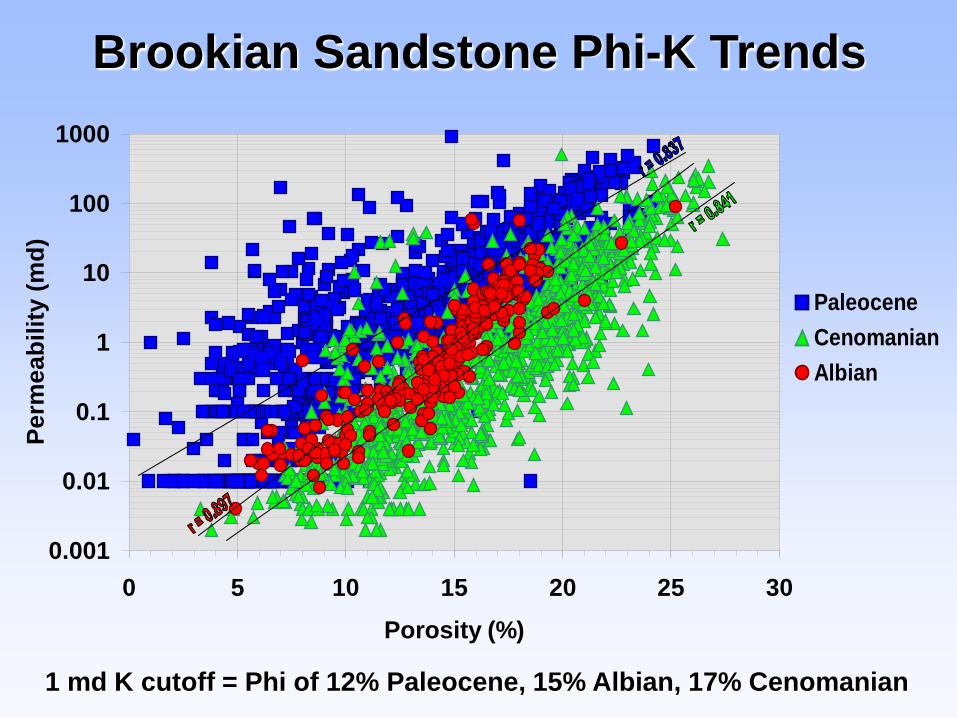
Brookian Sandstone Phi-K Trends
0.001
0.01
0.1
1
10
100
1000
0 5 10 15 20 25 30Porosity (%)
Perm
eabi
lity
(md)
PaleoceneCenomanianAlbian
1 md K cutoff = Phi of 12% Paleocene, 15% Albian, 17% Cenomanian
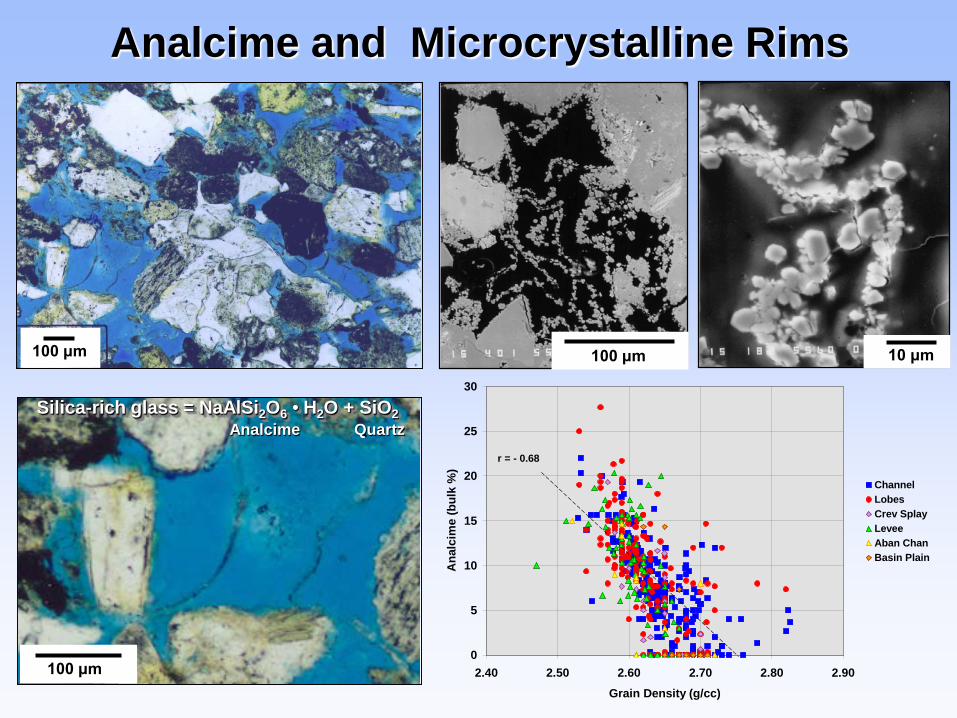
Analcime and Microcrystalline Rims
100 μm
100 μm
Silica-rich glass = NaAlSi2O6 • H2O + SiO2Analcime Quartz
0
5
10
15
20
25
30
2.40 2.50 2.60 2.70 2.80 2.90Grain Density (g/cc)
Ana
lcim
e (b
ulk
%)
ChannelLobesCrev SplayLeveeAban ChanBasin Plain
r = - 0.68
10 μm100 μm
Outline
• Regional setting• Petrology of sandstones• Facies and reservoir quality• Regional reservoir quality model• Petrophysical model• Conclusions
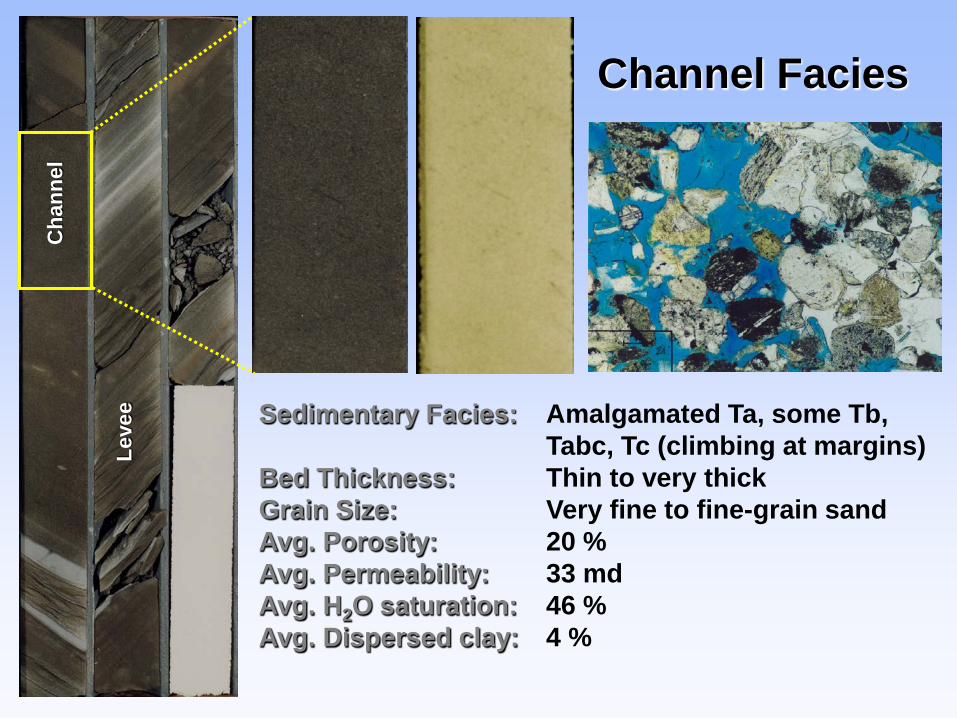
Channel Facies
Sedimentary Facies: Amalgamated Ta, some Tb, Tabc, Tc (climbing at margins)
Bed Thickness: Thin to very thickGrain Size: Very fine to fine-grain sandAvg. Porosity: 20 %Avg. Permeability: 33 mdAvg. H2O saturation: 46 %Avg. Dispersed clay: 4 %
Cha
nnel
Leve
e
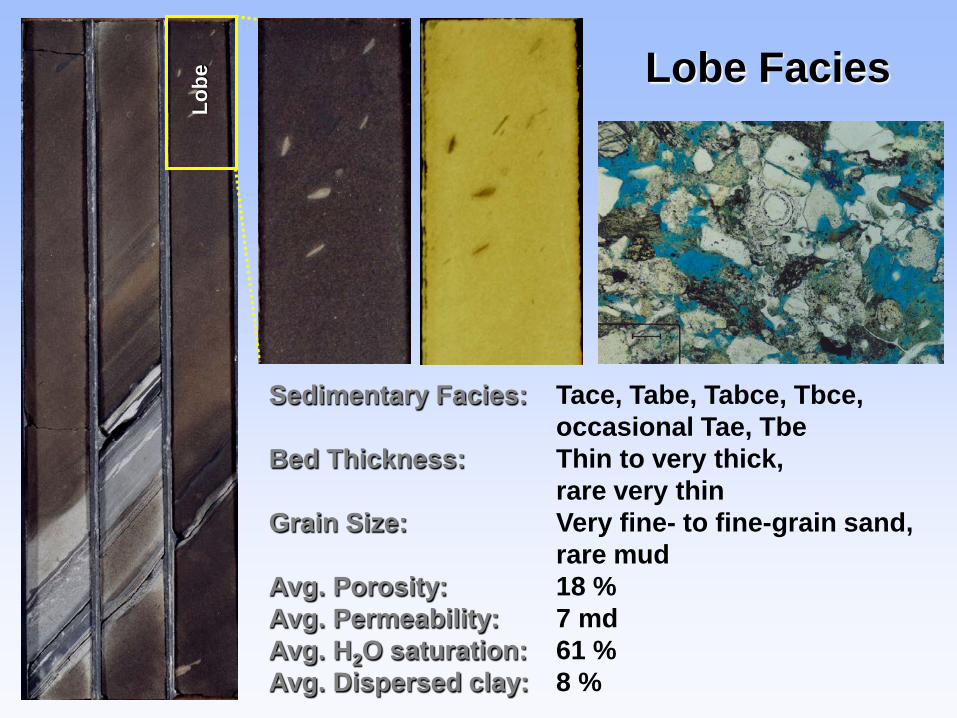
Lobe Facies
Sedimentary Facies: Tace, Tabe, Tabce, Tbce, occasional Tae, Tbe
Bed Thickness: Thin to very thick,rare very thin
Grain Size: Very fine- to fine-grain sand, rare mud
Avg. Porosity: 18 %Avg. Permeability: 7 mdAvg. H2O saturation: 61 %Avg. Dispersed clay: 8 %
Lobe
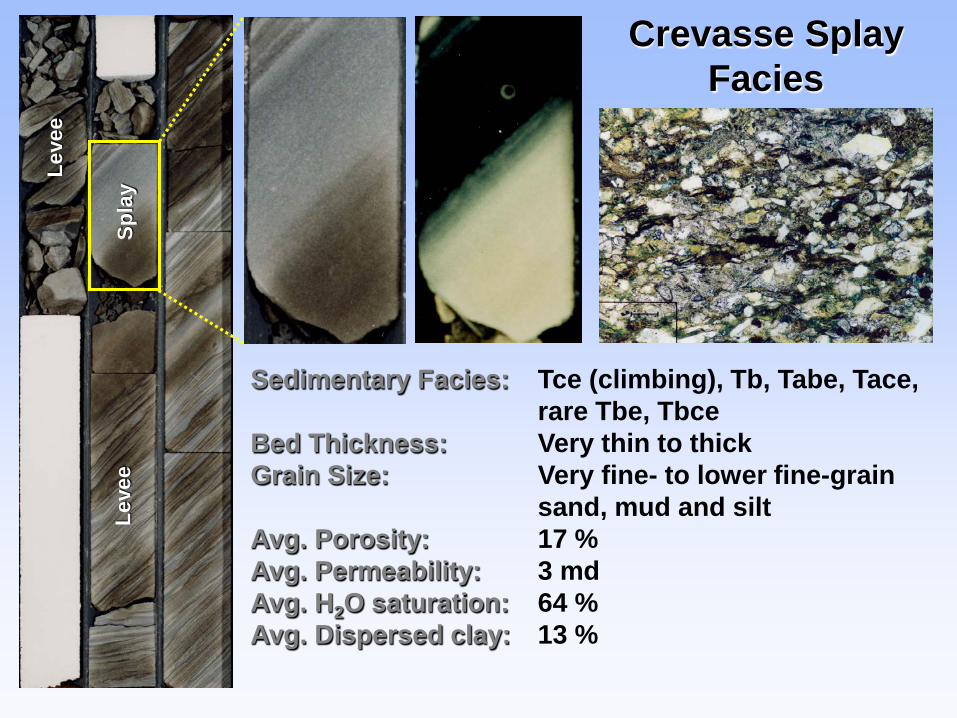
Crevasse SplayFacies
Sedimentary Facies: Tce (climbing), Tb, Tabe, Tace, rare Tbe, Tbce
Bed Thickness: Very thin to thickGrain Size: Very fine- to lower fine-grain
sand, mud and siltAvg. Porosity: 17 %Avg. Permeability: 3 mdAvg. H2O saturation: 64 %Avg. Dispersed clay: 13 %
Spla
yLe
vee
Leve
e
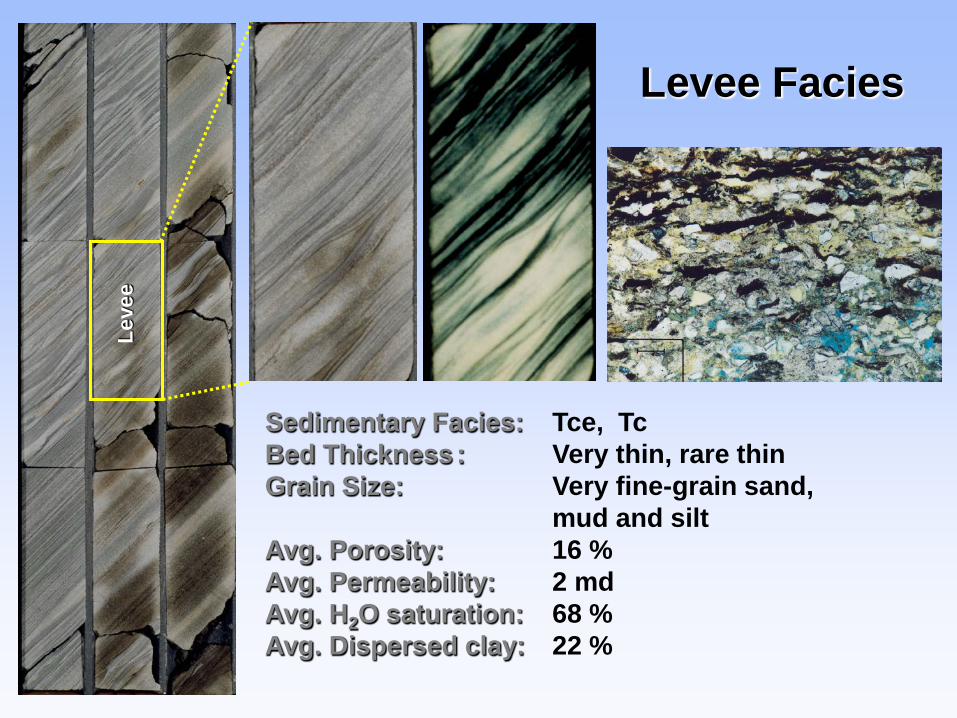
Levee Facies
Sedimentary Facies: Tce, TcBed Thickness: Very thin, rare thinGrain Size: Very fine-grain sand,
mud and siltAvg. Porosity: 16 %Avg. Permeability: 2 mdAvg. H2O saturation: 68 %Avg. Dispersed clay: 22 %
Leve
e
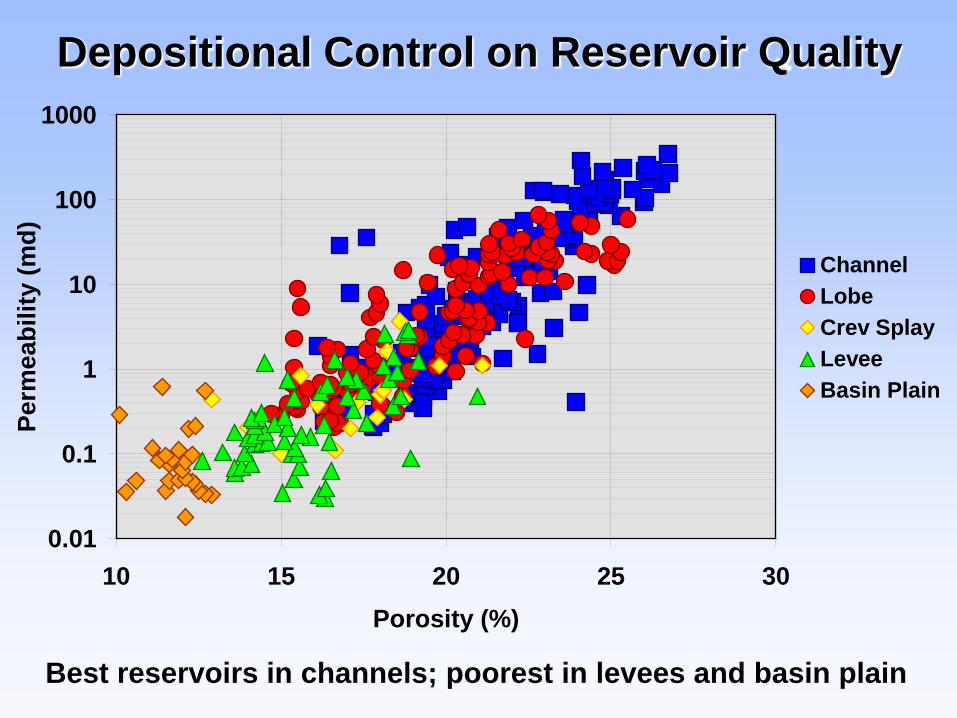
Depositional Control on Reservoir Quality
Best reservoirs in channels; poorest in levees and basin plain
0.01
0.1
1
10
100
1000
10 15 20 25 30Porosity (%)
Perm
eabi
lity
(md)
ChannelLobeCrev SplayLeveeBasin Plain
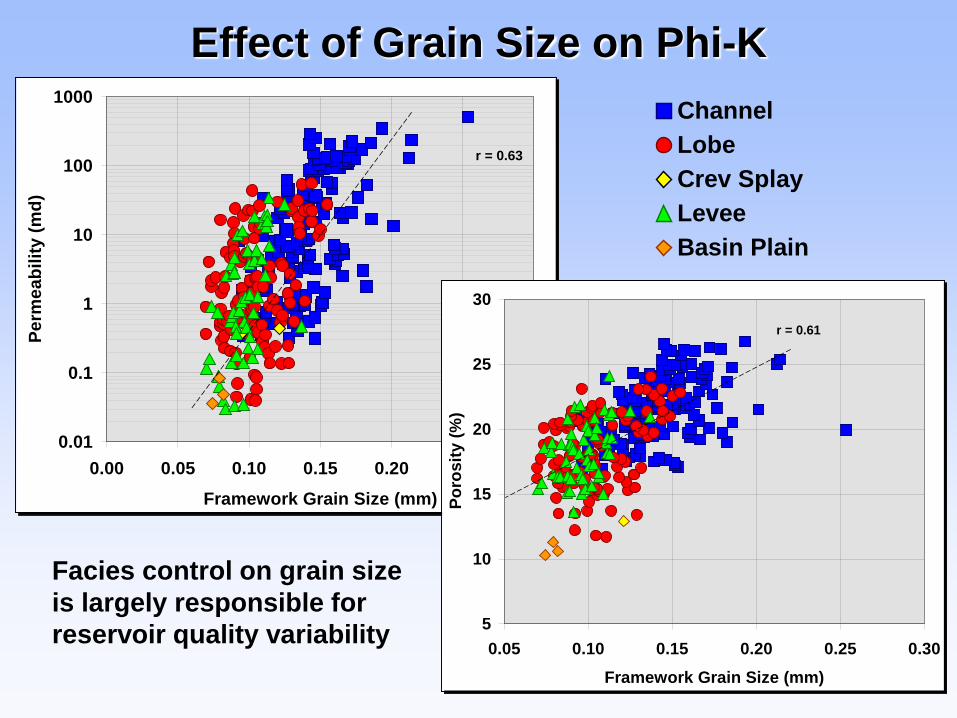
Effect of Grain Size on Phi-K
0.01
0.1
1
10
100
1000
0.00 0.05 0.10 0.15 0.20 0.25 0.30Framework Grain Size (mm)
Perm
eabi
lity
(md)
r = 0.63
ChannelLobeCrev SplayLeveeBasin Plain
5
10
15
20
25
30
0.05 0.10 0.15 0.20 0.25 0.30Framework Grain Size (mm)
Poro
sity
(%)
r = 0.61
Facies control on grain size is largely responsible for reservoir quality variability
Outline
• Regional setting• Petrology of sandstones• Facies and reservoir quality• Regional reservoir quality model• Petrophysical model• Conclusions
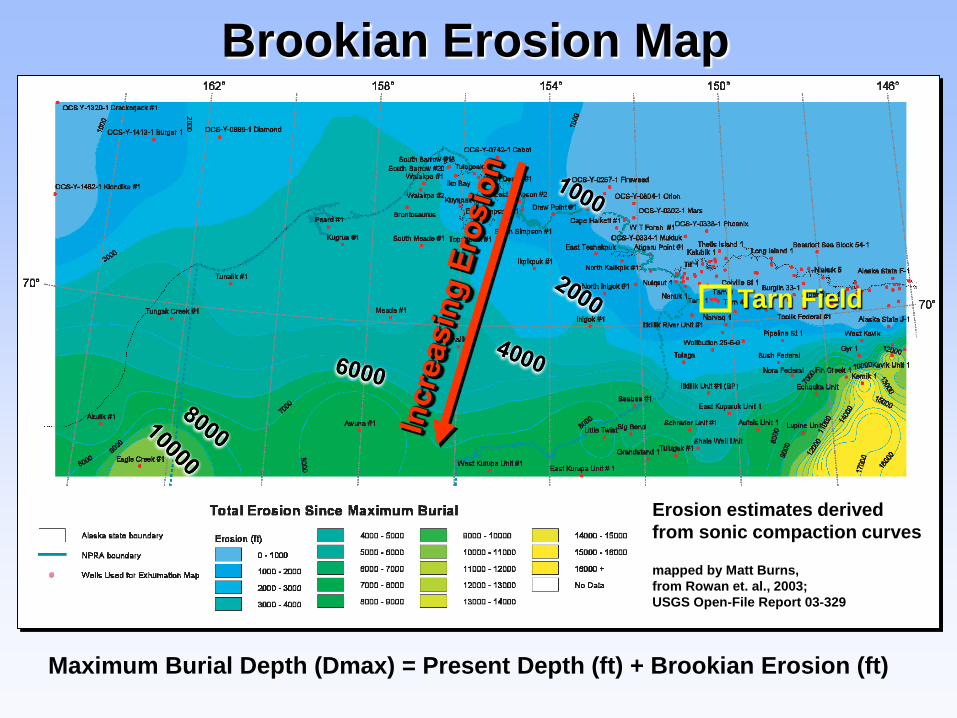
Brookian Erosion Map80 Miles
Tarn Field
Erosion estimates derived from sonic compaction curves
mapped by Matt Burns,from Rowan et. al., 2003;USGS Open-File Report 03-329
Maximum Burial Depth (Dmax) = Present Depth (ft) + Brookian Erosion (ft)
0.001
0.01
0.1
1
10
100
1000
2000 4000 6000 8000 10000 12000 14000 16000
Dmax (feet)
Perm
eabi
lity
(md)
0
5
10
15
20
25
30
35
40
2000 4000 6000 8000 10000 12000 14000 16000
Dmax (feet)
Poro
sity
(%)
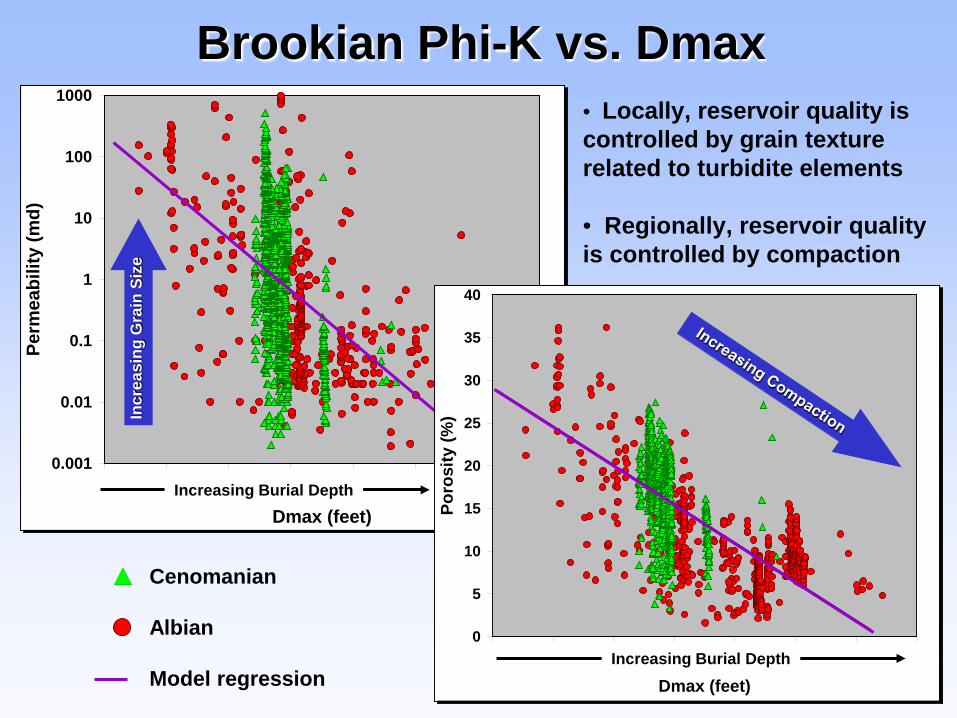
Brookian Phi-K vs. Dmax
Cenomanian
Albian
Model regression
Increasing Burial Depth
Incr
easi
ng G
rain
Siz
e
Increasing Burial Depth
• Locally, reservoir quality is controlled by grain texture related to turbidite elements
• Regionally, reservoir quality is controlled by compaction
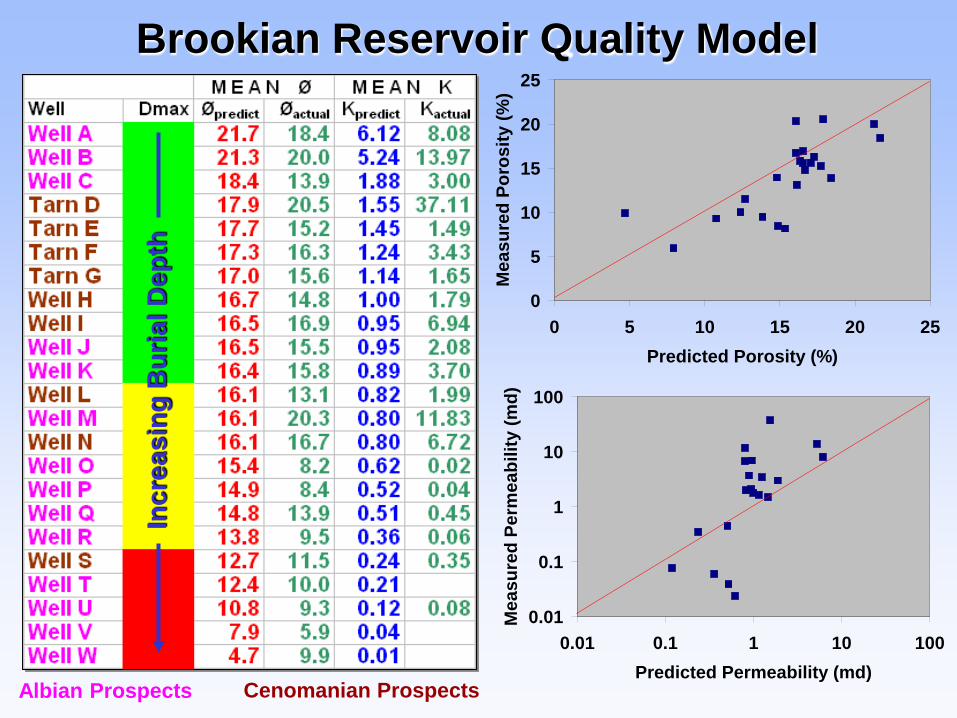
Albian Prospects Cenomanian Prospects
Brookian Reservoir Quality Model
0
5
10
15
20
25
0 5 10 15 20 25Predicted Porosity (%)
Mea
sure
d Po
rosi
ty (%
)
0.01
0.1
1
10
100
0.01 0.1 1 10 100Predicted Permeability (md)
Mea
sure
d Pe
rmea
bilit
y (m
d)
Incr
easi
ng B
uria
l Dep
th
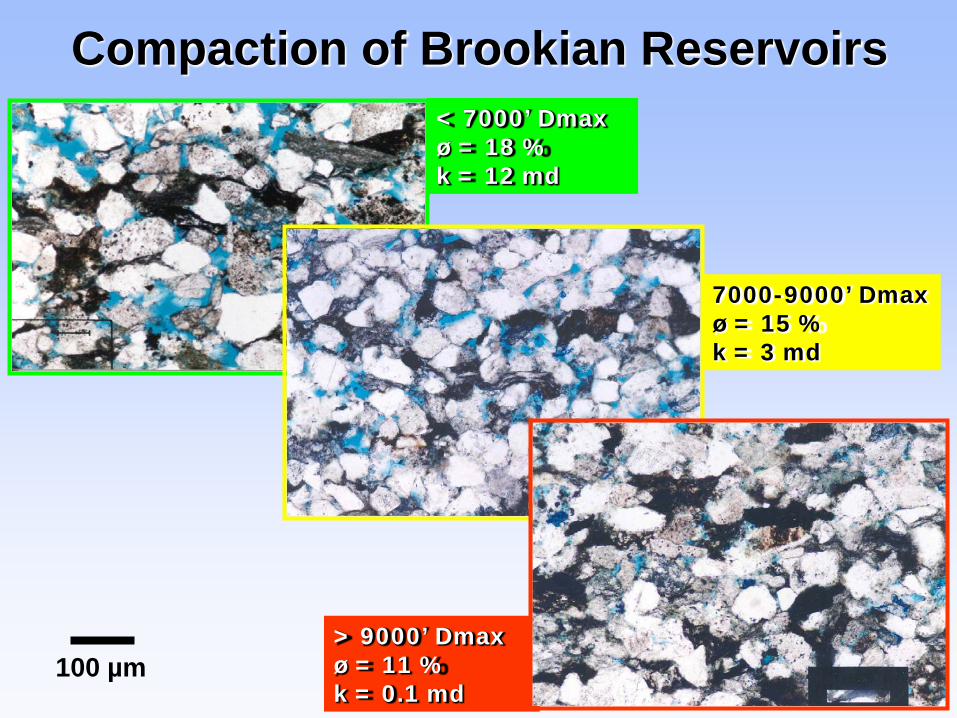
Compaction of Brookian Reservoirs
> 9000’ Dmaxø = 11 %k = 0.1 md
7000-9000’ Dmaxø = 15 %k = 3 md
< 7000’ Dmaxø = 18 %k = 12 md
100 µm
Outline
• Regional setting• Petrology of sandstones• Facies and reservoir quality• Regional reservoir quality model• Petrophysical model• Conclusions
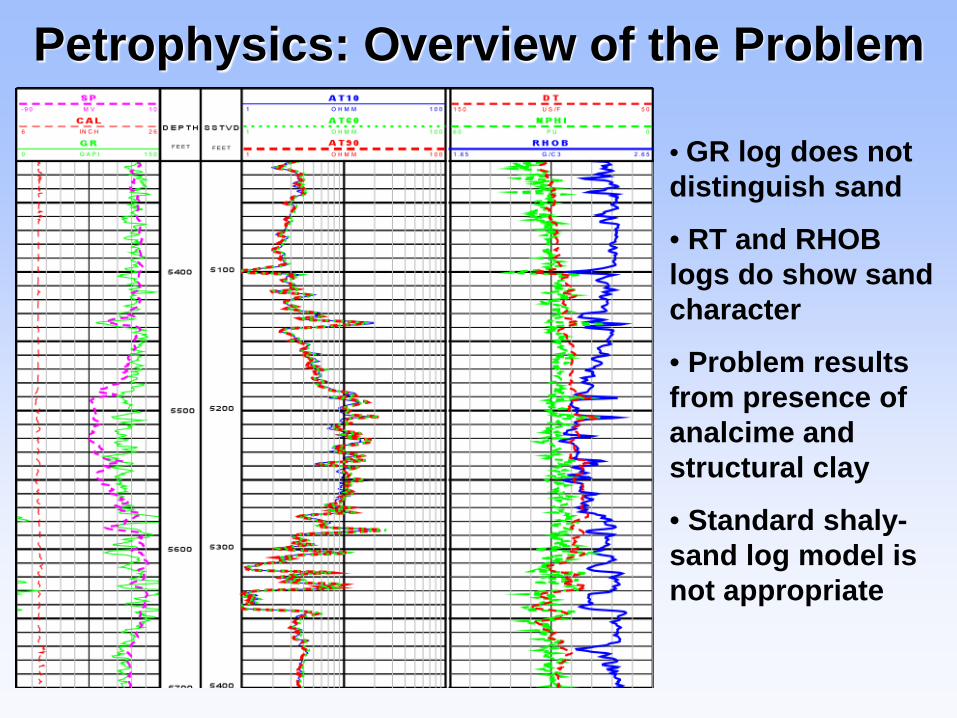
Petrophysics: Overview of the Problem
• GR log does not distinguish sand
• RT and RHOB logs do show sand character
• Problem results from presence of analcime and structural clay
• Standard shaly-sand log model is not appropriate
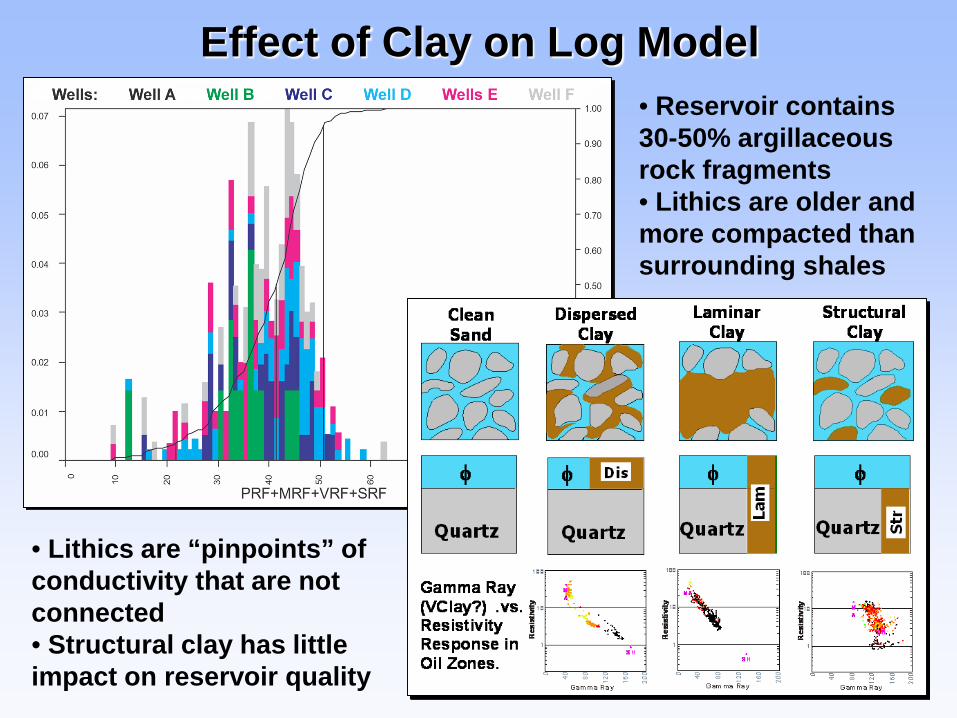
Effect of Clay on Log Model• Reservoir contains 30-50% argillaceous rock fragments• Lithics are older and more compacted than surrounding shales
• Lithics are “pinpoints” of conductivity that are not connected• Structural clay has little impact on reservoir quality
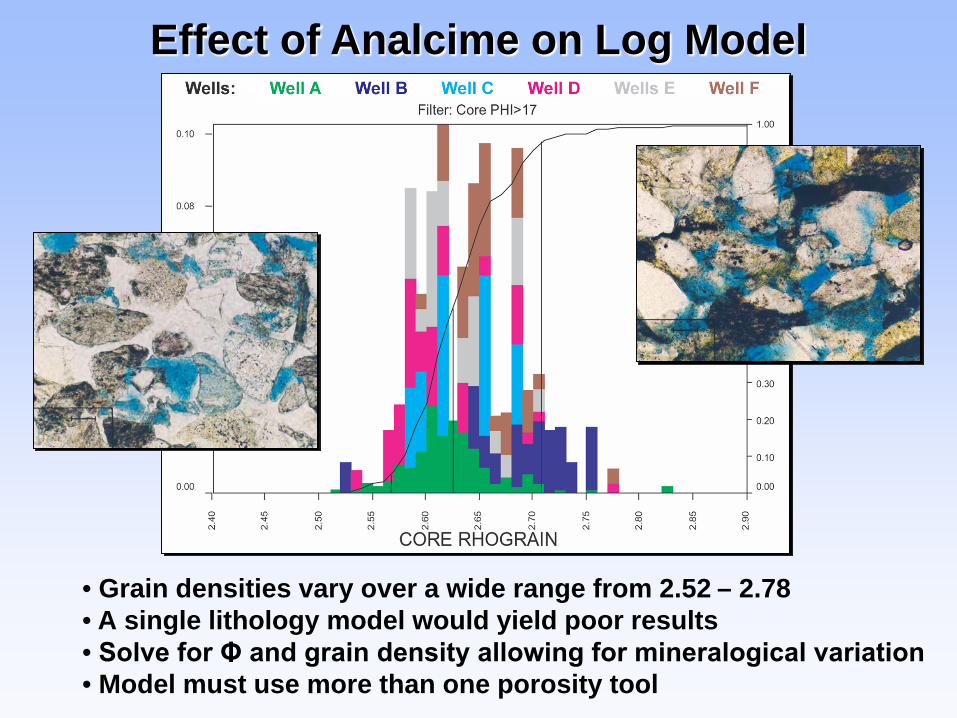
Effect of Analcime on Log Model
• Grain densities vary over a wide range from 2.52 – 2.78• A single lithology model would yield poor results• Solve for Φ and grain density allowing for mineralogical variation• Model must use more than one porosity tool
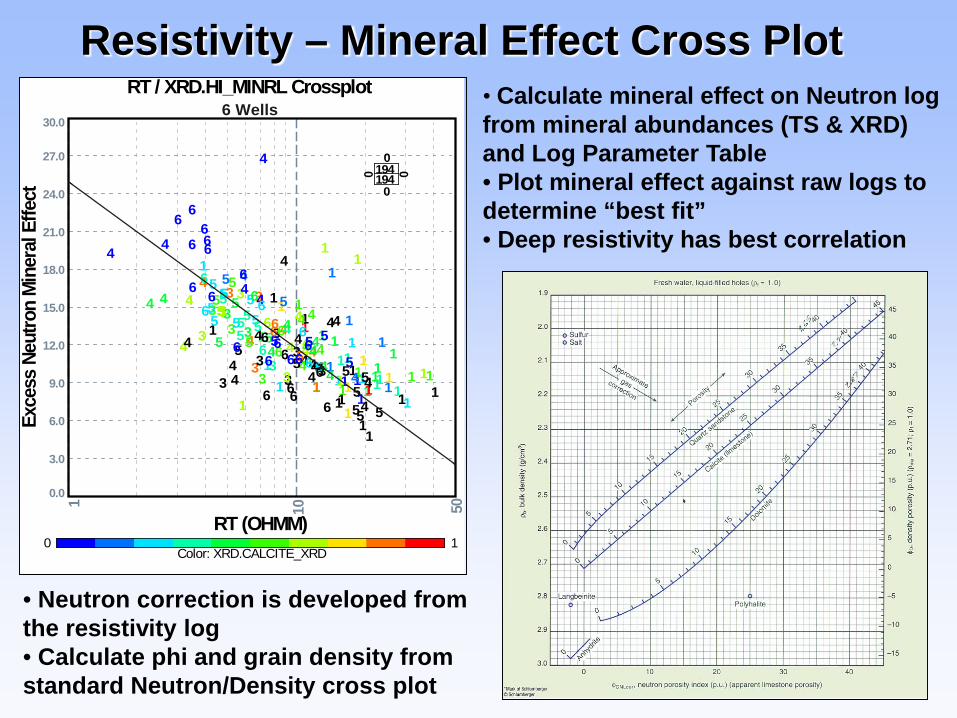
Resistivity – Mineral Effect Cross PlotEx
cess
Neut
ron
Mine
ralE
ffect
1 10
0.0
3.0
6.0
9.0
12.0
15.0
18.0
21.0
24.0
27.0
30.0
RT (OHMM)0 1
Color: XRD.CALCITE_XRD
1
1
11
1
11
1
11
1111
1
1
1
11 11
11
1
11
1
11
11
11
11
11
11
1
1
1
11
1
11
1
1
1
1
1
1
1
11
3
3
33
33
3333
3
3
33
33
3
33
3
44
4
444
444
4
444
4
4
44
4444
44
4
4
44444
4
44
44
4
44
4
4
4
4
4
4
44
45
5
5
55555
5
5555
555
5
5
55
5
5
5
5
5 5
55
55
5
55
555 56
6
6
6
6
66
66
6
66
6
6
6
66
66
666
6
6
66
6
6
6
6
6
6
6
6
194194
0
0 0
0
50
RT / XRD.HI_MINRL Crossplot6 Wells
• Neutron correction is developed from the resistivity log• Calculate phi and grain density from standard Neutron/Density cross plot
• Calculate mineral effect on Neutron log from mineral abundances (TS & XRD) and Log Parameter Table• Plot mineral effect against raw logs to determine “best fit”• Deep resistivity has best correlation
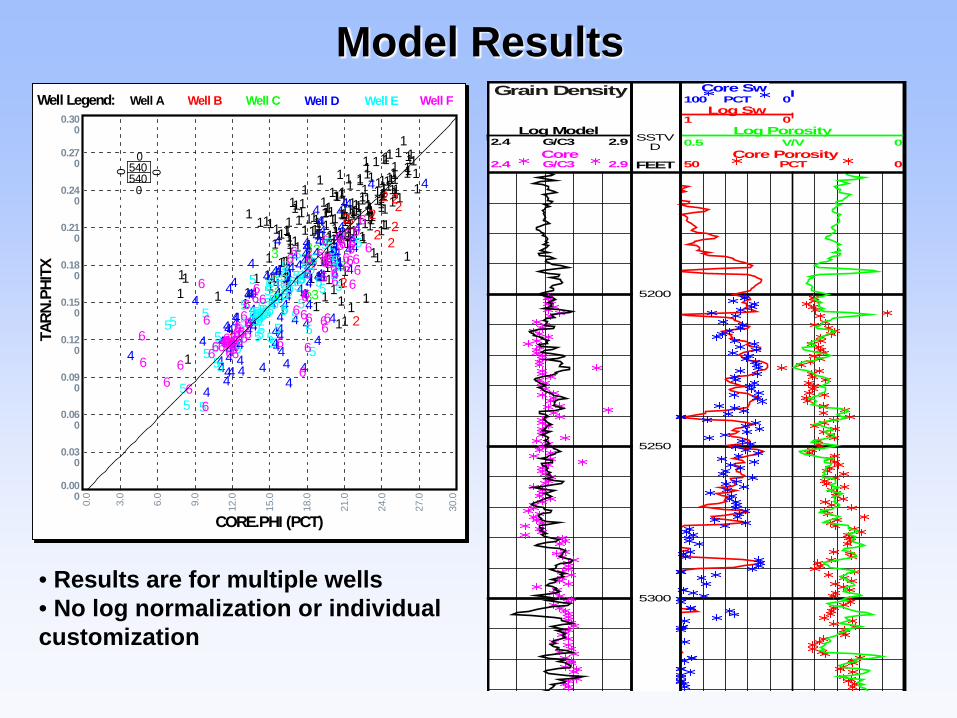
CoreG/C32.4 2.9
Log ModelG/C32.4 2.9
5200
5250
5300
SSTVD
FEETCore Porosity
PCT50 0
Log PorosityV/V0.5 0
Log Sw1 0
Core SwPCT100 0
Grain Density
Model ResultsWell Legend: Well A Well B Well C Well D Well E Well F
0.0
3.0
6.0
9.0
12.0
15.0
18.0
21.0
24.0
27.0
30.0
0.000
0.030
0.060
0.090
0.120
0.150
0.180
0.210
0.240
0.270
0.300
TARN
.PHI
TX
CORE.PHI (PCT)
1 111
1 11 1
1
1111 11
1111
1
1
11 1
1111
111 1
11
11
111
11 111 1
1
1 111
11
111
1 11111 1
11 1
1 1
1
1
111
1
1
1
1
111
111 11111
11111 1
1
11 1
11 1
1
1 11 11
1
11
111
1 11111
11
1111 1
11 11
111
1111 1111
11
1111
1
11
11 1
11
1
1111
11 1
11
11
1 11 1
1
1
1
1
1111
1
11
1 111 1
111
111
11
1
1
1
11
1
1
1
11
1
1 11
11
12
222
2 222
2
2
22
223
3 3 33 33
33 33
344 444
44
444
4
444 444
44
4
44 4
44
44 4
4444
444
4
4
44
4
44
44
44
4
44
44
4
444 444 4
4444
444 4
44
4
44
4 4
444 444
4
444
4
44
4
444
44
4444
4
44
4
44
444
4
44
44 4
444
4
4
4
4 4
44
4
4444
5 55
55
55
55 55 5555555
5 55
5 555 555 5 5
5555
55
5555555 55 5 55555
5555 5 55
55
55 555
5
5
5 5
5
5
55 5
5
5 55 5
55
5
5
555
55
5
5
56
66 66
6
66
6
66
666
66 66 66
66
6
66
66
6
6
6
6666
666
666 6
6
6
6
6666
66
6
6
6
66
6
6
6
666 6
666666 666666
66 666666666
540540
0
0
0 0
• Results are for multiple wells• No log normalization or individual customization

Conclusions• Reservoir quality is initially controlled by
textural parameters related to turbidite elements• Channels are the best reservoirs followed by
lobes, crevasse splays and levees• Mechanical compaction exerts a strong regional
control on reservoir quality• Reservoir quality of Brookian sandstones can
be accurately predicted prior to drilling • Petrophysical model is complicated by
abundance of structural clay and low-density zeolite
The End


![Petrophysical Analysis Of Reservoir Rock Of Kadanwari Gas [Autosaved]](https://img.pdfslide.net/doc/110x75/58ae7f291a28abea4f8b5e23/petrophysical-analysis-of-reservoir-rock-of-kadanwari-gas-autosaved.jpg)