Embed Size (px)
Citation preview

Impact factor 1.472
“International Journal for Science and Emerging ISSN No. (Online):2250-3641
Technologies with Latest Trends” 13(1): 46-64 (2013) ISSN No. (Print): 2277-8136
Reservoir Quality Evaluation of Sand Bodies of K-Field, Onshore
Niger Delta, Using Wireline Logs
Ogbe*, Ovie Benjamin*,Opatola**, Olatunji Abraham**, Idjerhe Wilson***
and Ocheli Azuka*** *, ***
Department of Geological Sciences, Nnamdi Azikiwe University, Awka, Nigeria **
Department of Geology, University of Lagos, Lagos, Nigeria ***
Department of Petroleum Resources, Warri, Nigeria (Received 07 November 2013 Accepted 04 December 2013)
Abstract-Seven reservoirs were identified across three wells A1, A2 and A3; three reservoirs contain hydrocarbon in
well A1, six reservoirs contain hydrocarbon in well A2, and four reservoirs contain hydrocarbon in well A3. The
reservoirs were correlated using gamma ray log and the reservoirs were found to be continuous across the wells. The
petrophysical parameters of the reservoirs evaluated indicate average porosity, permeability, water-saturation and
hydrocarbon-saturation values of 31.89%, 305.17md, 40.00% and 60.00%, respectively. The porosity value indicates
excellent porosity and permeability very good. The field has both associated gas and non-associated gas reservoirs. The
crossplot of water-saturation and porosity revealed that the grain size variation of the reservoirs ranges from coarse-
grained to very fine-grained sands. The BVW crossplot indicated that most of the reservoirs are heterogeneous. The
environments prevalent in the studied reservoirs, using standard gamma-ray log motif, range from channel sand of
deltaic plain settings to shoreface environment.
Key words-Reservoir quality, sand bodies, wireline logs, crossplot, correlation.
1. INTRODUCTION
This study is on the evaluation of
petrophysical parameters, depositional
environment and correlation of reservoir sand
bodies using well logs of three (3) wells in
pseudo-named K-Field, Onshore Niger Delta.
The petrophysical analyses with wireline logs
provide reservoir characteristics (porosity,
permeability and fluid saturation). Integrating
with other data would guide and enhance
exploration and development of the reservoir
sand bodies.
The field under study is pseudo-named K-
Field in accordance with the Nigerian Agip Oil
company (NAOC) confidentiality agreement.
The field is an onshore field, located within
the Coastal Swamp-1 depobelt (Figure 1). The
co-ordinates of the location of this field were
concealed due to proprietary reasons. It covers
an area extent of 19.89km2.
Figure 1. Concession map of Niger Delta
showing Exploration Blocks, and the K-Field
2. Objectives of the Study
To identify the various sand
bodies and correlate them across
the field.

Impact factor 1.472 47. Ogbe*, Ovie Benjamin*,Opatola**, Olatunji Abraham**, Idjerhe
Wilson*** and Ocheli Azuka***
To identify and quantify
hydrocarbons in the reservoir sand
bodies and to evaluate the fluid
and rock properties.
To discriminate the gas and oil
bearing zones and their contacts.
To determine the depositional
environment using standard
wireline log motifs.
3. Scope of Work This research work covers the petrophysical
analysis of reservoir sand bodies of three (3)
wells: A1, A2 and A3 of total depths 3,580m,
3,170m and 3490m, respectively, wireline log
correlation of the wells and depositional
environment determination of the reservoir
sand bodies from wireline logs.
4.1. Niger Delta Province Geology
The Niger Delta is a prograding depositional
complex within the Cenozoic formation of
Southern Nigeria. It is located in southern
Nigeria. It extends from the Calabar flank and
Abakaliki Trough in Eastern Nigeria to the
Benin Flank in the west; it opens to the
Atlantic Ocean in the south and protrudes into
the Gulf of Guinea as an extension from the
Benue Trough and Anambra Basin province
(Burke and Whiteman, 1970; Tuttle et al,
1999). The delta complex merges westwards
across the Okitipupa high into the Dahomey
embayment. Onshore portion of the Niger
Delta Province is delineated by the geology of
southern Nigeria and southwestern Cameroon
and the offshore boundary of the province is
defined by the Cameroon volcanic line to the
east, the eastern boundary of the Dahomey
basin to the west (Figure 2).
Figure 2. Map showing location of Niger
Delta
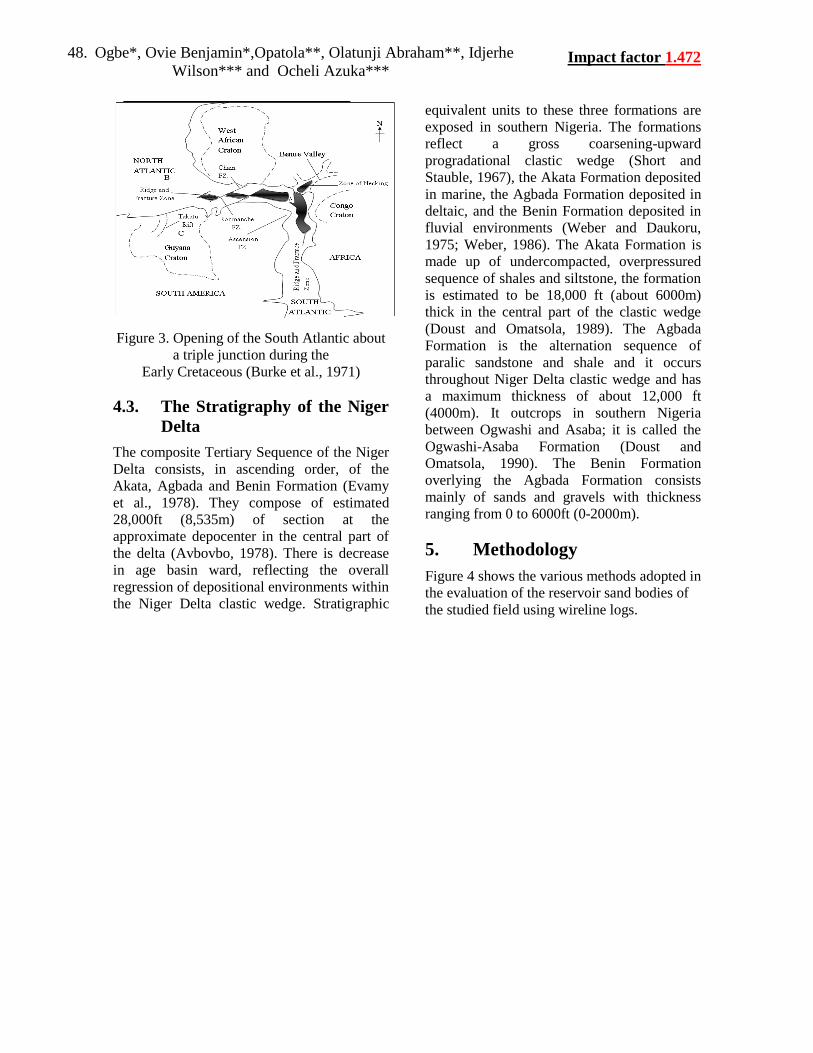
4.2. Evolution of the Niger Delta
The evolution of the Niger delta is related to
the development of the Ridge-Ridge-Ridge
(RRR) triple junction and the subsequent
separation of the South American and African
continents (Short and Stauble, 1967) (Figure
3). The Niger delta has built out over the
collapsed continental margin at the site of the
triple junction formed during the Middle
Cretaceous. The main sediment supply has
been provided by an extensive drainage
system, the Niger-Benue system through the
Anambra basin north of Onitsha and the less
important Cross River system through the
Afikpo basin (Etu-Efeotor, 1997), which in its
lower reaches follows two failed rift arms, the
Benue and Bida basins (Burke et al., 1971). In
Eocene-Oligocene times, the two river systems
appear to have been separated from each other
by the late Cretaceous Abakaliki anticlinorium
(Figure 2).
Impact factor 1.472 48. Ogbe*, Ovie Benjamin*,Opatola**, Olatunji Abraham**, Idjerhe
Wilson*** and Ocheli Azuka***
Figure 3. Opening of the South Atlantic about
a triple junction during the
Early Cretaceous (Burke et al., 1971)
4.3. The Stratigraphy of the Niger
Delta
The composite Tertiary Sequence of the Niger
Delta consists, in ascending order, of the
Akata, Agbada and Benin Formation (Evamy
et al., 1978). They compose of estimated
28,000ft (8,535m) of section at the
approximate depocenter in the central part of
the delta (Avbovbo, 1978). There is decrease
in age basin ward, reflecting the overall
regression of depositional environments within
the Niger Delta clastic wedge. Stratigraphic
equivalent units to these three formations are
exposed in southern Nigeria. The formations
reflect a gross coarsening-upward
progradational clastic wedge (Short and
Stauble, 1967), the Akata Formation deposited
in marine, the Agbada Formation deposited in
deltaic, and the Benin Formation deposited in
fluvial environments (Weber and Daukoru,
1975; Weber, 1986). The Akata Formation is
made up of undercompacted, overpressured
sequence of shales and siltstone, the formation
is estimated to be 18,000 ft (about 6000m)
thick in the central part of the clastic wedge
(Doust and Omatsola, 1989). The Agbada
Formation is the alternation sequence of
paralic sandstone and shale and it occurs
throughout Niger Delta clastic wedge and has
a maximum thickness of about 12,000 ft
(4000m). It outcrops in southern Nigeria
between Ogwashi and Asaba; it is called the
Ogwashi-Asaba Formation (Doust and
Omatsola, 1990). The Benin Formation
overlying the Agbada Formation consists
mainly of sands and gravels with thickness
ranging from 0 to 6000ft (0-2000m).
5. Methodology
Figure 4 shows the various methods adopted in
the evaluation of the reservoir sand bodies of
the studied field using wireline logs.

Impact factor 1.472 49. Ogbe*, Ovie Benjamin*,Opatola**, Olatunji Abraham**, Idjerhe
Wilson*** and Ocheli Azuka***
Figure 4. Methodology Flow Chart
6. Results and Interpretation
6.1. Correlation of the reservoir
sands
The correlation was carried out based on the
positions of the reservoir in the succession of
sands and shales on the well logs across the
wells (Figure 5). The gamma ray (GR) logs
were the main log used because it exhibits
patterns that are easier to recognized and
correlate from well to well. The resistivity logs
were then used to for the correlation because
individual shale beds exhibit distinctive
resistivity characteristic across the wells, the
shale resistivity markers (SRM) were
identified on the three (3) wells logs before the
cross-checking.
The Shale resistivity markers (SRM) were
used to cross-check the correlation of the GR
log and the reservoir sand bodies were found
to be continuous. The correlation was done
from the top to the bottom of the well logs
(Figure 5). From the correlation, it was
observed that reservoir R1 to R7 is correlatable
in all the wells in the field. This implies that
the correlatable reservoirs are genetically
equivalent laterally (in the same depositional
environment). Some of the correlatable
reservoir does not contain hydrocarbon in
some wells. The displacement of some
correlatable reservoirs in depth is probably as
a result of synthetic fault (Figure 5).

Impact factor 1.472 50. Ogbe*, Ovie Benjamin*,Opatola**, Olatunji Abraham**, Idjerhe
Wilson*** and Ocheli Azuka***
Figure 5. Log correlation profile through well A1, A2 and A3 (S-N): Insert the base map of K-Field
showing the positions of the wells

Impact factor 1.472 51. Ogbe*, Ovie Benjamin*,Opatola**, Olatunji Abraham**, Idjerhe
Wilson*** and Ocheli Azuka***
6.2. Petrophysical results and
interpretation Total of seven (7) reservoirs (Rn) were
identified and evaluated/analyzed: well A1
does not have hydrocarbon in R4, R5, R6 and
R7; well A2 does not have hydrocarbon in R3;
and well A3 does not have hydrocarbon in R1,
R2, and R5. The correlations were done from
top to the bottom of the well and across the
field (Figure 5). Only correlatable reservoirs
that contain hydrocarbons were evaluated
(Table 1). The following petrophysical
parameters were computed for the reservoirs:
Table 1. Summary of average petrophysical values for the three wells of K-Field
Sand Reservoir Top - Bottom Sand
(m)
Gross
Thickness
of Sand
(m)
Net
thicknes
s of Sand
(m)
N/G
Ratio
Φ
(%)
Sw
(%)
Sh
(%)
K
(md)
Well A1
F3 R1 2107.50 - 2127.50 20.00 17.50 0.88 30.00 39.33 60.67 271.36
F2 R2 2150.00 - 2162.50 12.50 10.00 0.80 33.50 44.33 55.67 330.80
F1 R3 2372.50 - 2392.50 20.00 17.50 0.88 31.11 48.89 51.11 228.32
Well A2
F3 R1 2110.00 - 2130.00 20.00 18.50 0.93 32.33 47.56 52.44 314.39
F1 R3 2367.50 - 2390.00 22.50 17.50 0.78 32.50 44.20 55.80 314.55
E R4 2607.50 - 2647.50 40.00 35.00 0.88 32.06 35.24 64.76 307.90
D R5 2700.00 - 2756.00 60.00 55.00 0.92 31.48 40.60 59.40 297.76
C R6 2797.50 - 2837.50 40.00 35.00 0.88 27.41 40.82 59.18 262.49
A R7 3072.50 - 3037.50 37.50 35.00 0.93 28.63 18.63 81.37 249.76
Well A3
F1 R3 2362.50 - 2382.50 20.00 14.50 0.73 30.22 25.33 74.67 273.37
E R4 2617.50 - 2652.50 35.00 33.00 0.94 30.33 53.53 46.47 275.01
C R6 2802.50 - 2877.50 75.00 67.50 0.90 30.58 57.74 42.26 281.22
A R7 3090.00 - 3110.00 20.00 12.50 0.63 30.78 26.00 74.00 302.18
6.3. Characteristics of reservoir
sand body, R1 well A1

Impact factor 1.472 52. Ogbe*, Ovie Benjamin*,Opatola**, Olatunji Abraham**, Idjerhe
Wilson*** and Ocheli Azuka***
It occurs at interval of 2107.5 – 2127.5m and
has a gross (G) and net (N) thickness of sand,
20.0 and 17.5m respectively, with N/G ratio of
0.88; average water saturation (Sw) of 39.33%
and hydrocarbon saturation (Sh) of 60.67%,
the gas water contact (GWC) and oil water
contact (OWC) at 2117.5 and 2122.5m
respectively; average porosity (φ) and
permeability (K) of 30.00% and 271.36md
respectively (Table 1). The reservoir therefore,
has excellent porosity and very good
permeability. The environment of deposition
inferred to be fluvial channel. The crossplot of
water saturation (Sw) versus porosity (φ)
shows grain size variation is medium to very
fine-grained sand (Figure 6a). The bulk
volume water plot (Figure 6b) shows that the
reservoir is heterogeneous and the formation
has more water than it can hold by capillary
pressure, thus the reservoir is not at irreducible
water saturation (Swirr) and cannot produce
water-free hydrocarbon during production.
Figure 6. Crossplots of reservoir R1 in well A1 (A) Grain size determination (B) Bulk volume plot
6.4. Characteristics of reservoir
sand body, R2 well A1
It occurs at interval of 2150.0 – 2162.5m and
has a gross (G) and net (N) thickness of sand,
12.5 and 10m respectively, with N/G ratio of
0.80; average water saturation (Sw) of 44.33%
and hydrocarbon saturation (Sh) of 55.67%,
the GWC is at 2157.5m; average porosity (φ)
and permeability (K) of 33.50% and 330.80md
respectively (Table 1). The reservoir therefore,
has excellent porosity and very good
permeability. The environment of deposition
inferred to be fluvial channel. The crossplot of
water saturation (Sw) versus porosity (φ)
shows grain size variation is predominantly
very fine-grained sand (Figure 7a). The bulk
volume water plot (Figure 7b) shows that the
reservoir is heterogeneous and the formation
has more water than it can hold by capillary
pressure, thus the reservoir is not at irreducible
water saturation (Swirr) and cannot produce
water-free hydrocarbon during production.

Impact factor 1.472 53. Ogbe*, Ovie Benjamin*,Opatola**, Olatunji Abraham**, Idjerhe
Wilson*** and Ocheli Azuka***
Figure 7. Crossplots of reservoir R2 in well A1 (A) Grain size determination (B) Bulk volume plot
6.5. Characteristics of reservoir
sand body, R3 well A1 It occurs at interval of 2372.5 – 2392.5m and
has a gross (G) and net (N) thickness of sand,
20.0 and 17.5m respectively, with N/G ratio of
0.88; average water saturation (Sw) of 48.89%
and hydrocarbon saturation (Sh) of 51.11%,
the GWC is at 2382.5m; average porosity (φ)
and permeability (K) of 31.11% and 292.12md
respectively (Table 3.1). The reservoir
therefore, has excellent porosity and very good
permeability. The environment of deposition
inferred to be fluvial channel. The crossplot of
water saturation (Sw) versus porosity (φ)
shows grain size variation is predominantly
fine to medium-grained sand (Figure 8a). The
bulk volume water plot (Figure 8b) shows that
the reservoir is heterogeneous and the
formation has more water than it can hold by
capillary pressure, thus the reservoir is not at
irreducible water saturation (Swirr) and cannot
produce water-free hydrocarbon during
production.
Figure 8. Crossplots of reservoir R3 in well A1 (A) Grain size determination (B) Bulk volume plot

Impact factor 1.472 54. Ogbe*, Ovie Benjamin*,Opatola**, Olatunji Abraham**, Idjerhe
Wilson*** and Ocheli Azuka***
6.6. Characteristics of reservoir
sand body, R1 well A2
It occurs at interval of 2110.0 – 2130.0m and
has a gross (G) and net (N) thickness of sand,
20.0 and 18.5m respectively, with N/G ratio of
0.93; average water saturation (Sw) of 47.56%
and hydrocarbon saturation (Sh) of 52.44%,
the GWC is at 2120m; average porosity (φ)
and permeability (K) of 32.33% and 314.39md
respectively (Table 1). The reservoir therefore,
has excellent porosity and very good
permeability. The environment of deposition
inferred to be fluvial channel. The crossplot of
water saturation (Sw) versus porosity (φ)
shows grain size variation is predominantly
very fine-grained sand (Figure 9a). The bulk
volume water plot (Figure 9b) shows that the
reservoir is heterogeneous and the formation
has more water than it can hold by capillary
pressure, thus the reservoir is not at irreducible
water saturation (Swirr) and cannot produce
water-free hydrocarbon during production.
Figure 9. Crossplots of reservoir R1 in well A2 (A) Grain size determination (B) Bulk volume plot
6.7. Characteristics of reservoir
sand body, R3 well A2
It occurs at interval of 2367.5 – 2390.0m and
has a gross (G) and net (N) thickness of sand,
22.5 and 17.5m respectively, with N/G ratio of
0.78; average water saturation (Sw) of 44.20%
and hydrocarbon saturation (Sh) of 55.80%,
the GWC is at 2377.5m; average porosity (φ)
and permeability (K) of 32.50% and 314.55md
respectively (Table 1). The reservoir therefore,
has excellent porosity and very good
permeability. The environment of deposition
inferred to be fluvial channel. The crossplot of
water saturation (Sw) versus porosity (φ)
shows grain size variation from medium to
very fine-grained sand (Figure 10a). The bulk
volume water plot (Figure 10b) shows that the
reservoir is heterogeneous and the formation
has more water than it can hold by capillary
pressure, thus the reservoir is not at irreducible
water saturation (Swirr) and cannot produce
water-free hydrocarbon during production.

Impact factor 1.472 55. Ogbe*, Ovie Benjamin*,Opatola**, Olatunji Abraham**, Idjerhe
Wilson*** and Ocheli Azuka***
Figure 10. Crossplots of reservoir R3 in well A2 (A) Grain size determination (B) Bulk volume plot
6.8. Characteristics of reservoir
sand body, R4 well A2
It occurs at interval of 2607.5 – 2647.5m and
has a gross (G) and net (N) thickness of sand,
40.0 and 35m respectively, with N/G ratio of
0.88; average water saturation (Sw) of 35.24%
and hydrocarbon saturation (Sh) of 64.76%,
the gas down to (GDT) is at 2382.5m; average
porosity (φ) and permeability (K) of 32.06%
and 307.96md respectively (Table 1). The
reservoir therefore, has excellent porosity and
very good permeability. The environment of
deposition inferred to be tidal channel. The
crossplot of water saturation (Sw) versus
porosity (φ) shows grain size variation from
medium to very fine-grained sand (Fig. 11a).
The bulk volume water plot (Fig.11b) shows
that the reservoir is heterogeneous and the
formation has more water than it can hold by
capillary pressure, thus the reservoir is not at
irreducible water saturation (Swirr) and cannot
produce water-free hydrocarbon during
production.
Figure 11. Crossplots of reservoir R4 in well A2 (A) Grain size determination (B) Bulk volume plot
Impact factor 1.472 56. Ogbe*, Ovie Benjamin*,Opatola**, Olatunji Abraham**, Idjerhe
Wilson*** and Ocheli Azuka***
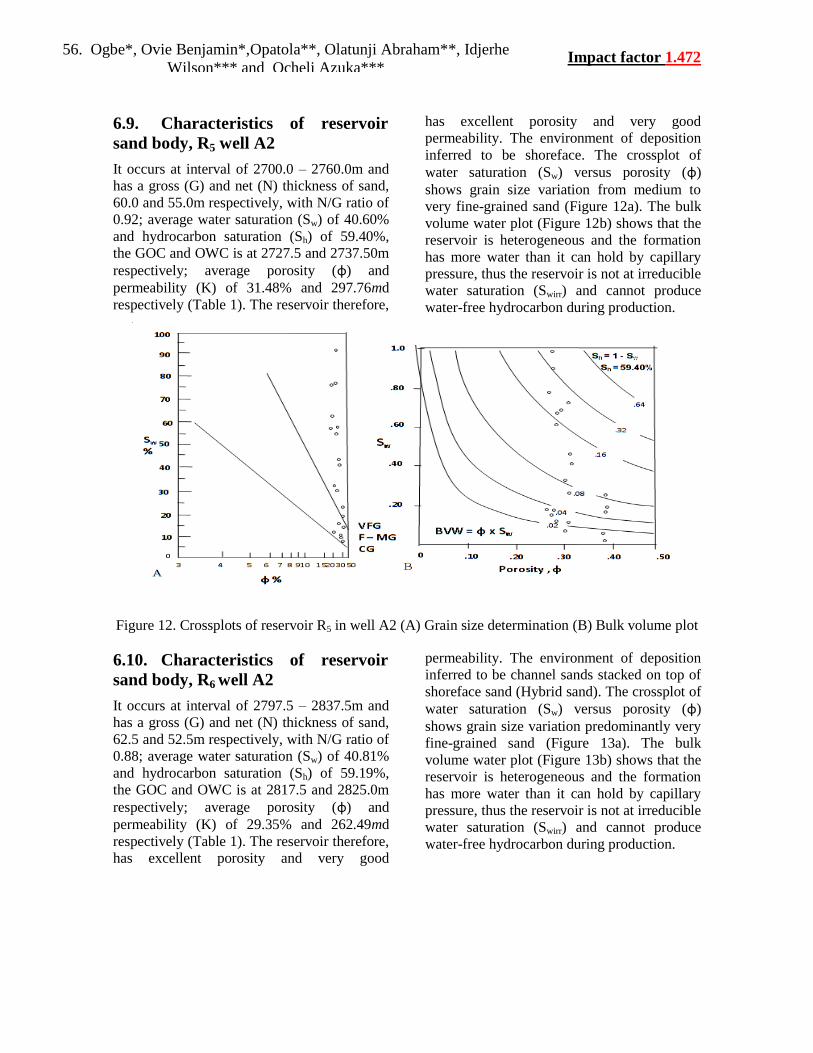
6.9. Characteristics of reservoir
sand body, R5 well A2
It occurs at interval of 2700.0 – 2760.0m and
has a gross (G) and net (N) thickness of sand,
60.0 and 55.0m respectively, with N/G ratio of
0.92; average water saturation (Sw) of 40.60%
and hydrocarbon saturation (Sh) of 59.40%,
the GOC and OWC is at 2727.5 and 2737.50m
respectively; average porosity (φ) and
permeability (K) of 31.48% and 297.76md
respectively (Table 1). The reservoir therefore,
has excellent porosity and very good
permeability. The environment of deposition
inferred to be shoreface. The crossplot of
water saturation (Sw) versus porosity (φ)
shows grain size variation from medium to
very fine-grained sand (Figure 12a). The bulk
volume water plot (Figure 12b) shows that the
reservoir is heterogeneous and the formation
has more water than it can hold by capillary
pressure, thus the reservoir is not at irreducible
water saturation (Swirr) and cannot produce
water-free hydrocarbon during production.
Figure 12. Crossplots of reservoir R5 in well A2 (A) Grain size determination (B) Bulk volume plot
6.10. Characteristics of reservoir
sand body, R6 well A2
It occurs at interval of 2797.5 – 2837.5m and
has a gross (G) and net (N) thickness of sand,
62.5 and 52.5m respectively, with N/G ratio of
0.88; average water saturation (Sw) of 40.81%
and hydrocarbon saturation (Sh) of 59.19%,
the GOC and OWC is at 2817.5 and 2825.0m
respectively; average porosity (φ) and
permeability (K) of 29.35% and 262.49md
respectively (Table 1). The reservoir therefore,
has excellent porosity and very good
permeability. The environment of deposition
inferred to be channel sands stacked on top of
shoreface sand (Hybrid sand). The crossplot of
water saturation (Sw) versus porosity (φ)
shows grain size variation predominantly very
fine-grained sand (Figure 13a). The bulk
volume water plot (Figure 13b) shows that the
reservoir is heterogeneous and the formation
has more water than it can hold by capillary
pressure, thus the reservoir is not at irreducible
water saturation (Swirr) and cannot produce
water-free hydrocarbon during production.

Impact factor 1.472 57. Ogbe*, Ovie Benjamin*,Opatola**, Olatunji Abraham**, Idjerhe
Wilson*** and Ocheli Azuka***
Figure 13. Crossplots of reservoir R6 in well A2 (A) Grain size determination (B) Bulk volume plot
6.11. Characteristics of reservoir
sand body, R7 well A2
It occurs at interval of 3037.5 – 3075.0m and
has a gross (G) and net (N) thickness of sand,
37.5 and 35.0m respectively, with N/G ratio of
0.93; average water saturation (Sw) of 18.63%
and hydrocarbon saturation (Sh) of 81.37%,
the GDT is at 3072.5m; average porosity (φ)
and permeability (K) of 28.63% and 249.76md
respectively (Table 1). The reservoir therefore,
has excellent porosity and very good
permeability. The environment of deposition
inferred to be tidal channel. The crossplot of
water saturation (Sw) versus porosity (φ)
shows grain size variation from coarse-grained
to fine-grained sand (Figure 14a). The bulk
volume water plot (Figure 14b) shows that the
reservoir is homogeneous and thus the
reservoir is at irreducible water saturation
(Swirr), this implies that the reservoir will
produce water-free hydrocarbon during
production.
Figure 14. Crossplots of reservoir R7 in well A2 (A) Grain size determination (B) Bulk volume plot

Impact factor 1.472 58. Ogbe*, Ovie Benjamin*,Opatola**, Olatunji Abraham**, Idjerhe
Wilson*** and Ocheli Azuka***
6.12. Characteristics of reservoir
sand body, R3 well A3
It occurs at interval of 2362.5 – 2382.5m and
has a gross (G) and net (N) thickness of sand,
20 and 14.5m respectively, with N/G ratio of
0.73; average water saturation (Sw) of 25.33%
and hydrocarbon saturation (Sh) of 74.67%,
the GWC is at 2380.0m; average porosity (φ)
and permeability (K) of 30.22% and 273.37md
respectively (Table 1). The reservoir therefore,
has excellent porosity and very good
permeability. The environment of deposition
inferred to be fluvial channel. The crossplot of
water saturation (Sw) versus porosity (φ)
shows grain size variation is predominantly
fine to medium-grained sand (Figure 15a). The
bulk volume water plot (Figure 15b) shows
that the reservoir is homogeneous and thus the
reservoir is at irreducible water saturation
(Swirr), this implies that the reservoir will
produce water-free hydrocarbon during
production.
Figure 15. Crossplots of reservoir R3 in well A3 (A) Grain size determination (B) Bulk volume plot
6.13. Characteristics of reservoir
sand body, R4 well A3
It occurs at interval of 2617.5 – 2652.5m and
has a gross (G) and net (N) thickness of sand,
35 and 33m respectively, with N/G ratio of
0.94; average water saturation (Sw) of 53.53%
and hydrocarbon saturation (Sh) of 46.47%,
the G0C and OWC is at 2630.0 and 2637.5m
respectively; average porosity (φ) and
permeability (K) of 30.33% and 275.01md
respectively (Table 1). The reservoir therefore,
has excellent porosity and very good
permeability. The environment of deposition
inferred to be tidal channel. The crossplot of
water saturation (Sw) versus porosity (φ)
shows grain size variation is very fine-grained
sand (Figure 16a). The bulk volume water plot
(Figure 16b) shows that the reservoir is
heterogeneous and the formation has more
water than it can hold by capillary pressure,
thus the reservoir is not at irreducible water
saturation (Swirr) and cannot produce water-
free hydrocarbon during production.
Impact factor 1.472 59. Ogbe*, Ovie Benjamin*,Opatola**, Olatunji Abraham**, Idjerhe
Wilson*** and Ocheli Azuka***
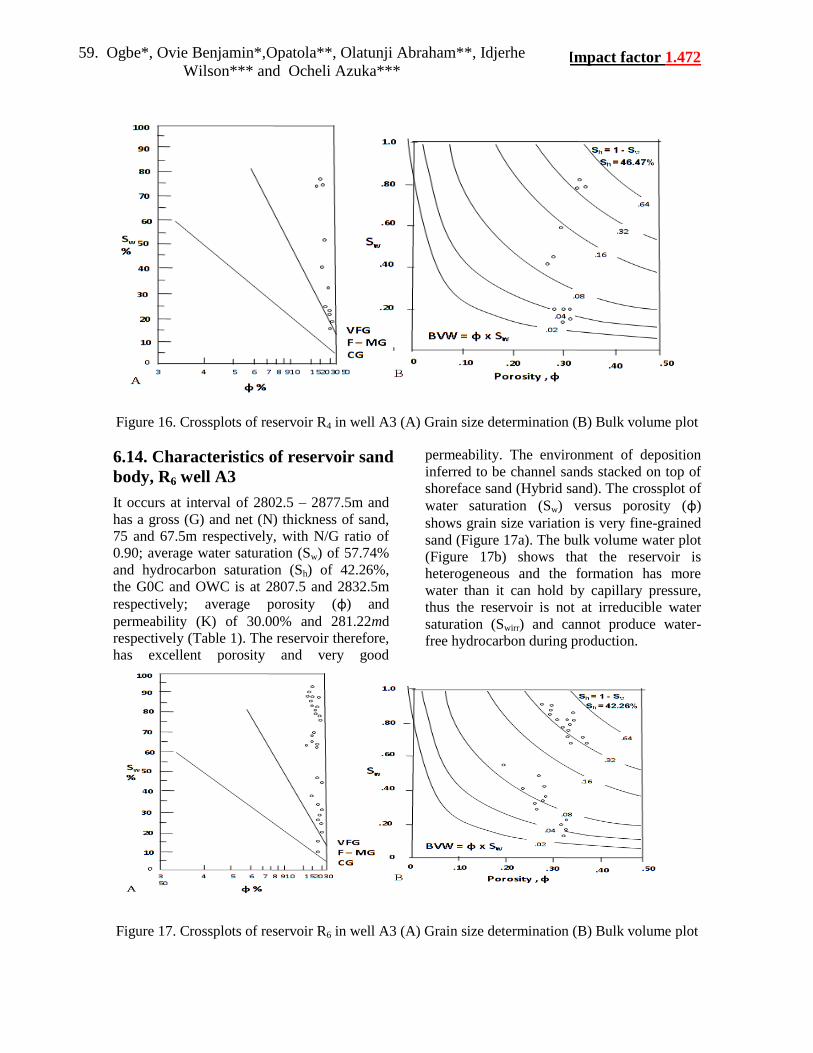
Figure 16. Crossplots of reservoir R4 in well A3 (A) Grain size determination (B) Bulk volume plot
6.14. Characteristics of reservoir sand
body, R6 well A3
It occurs at interval of 2802.5 – 2877.5m and
has a gross (G) and net (N) thickness of sand,
75 and 67.5m respectively, with N/G ratio of
0.90; average water saturation (Sw) of 57.74%
and hydrocarbon saturation (Sh) of 42.26%,
the G0C and OWC is at 2807.5 and 2832.5m
respectively; average porosity (φ) and
permeability (K) of 30.00% and 281.22md
respectively (Table 1). The reservoir therefore,
has excellent porosity and very good
permeability. The environment of deposition
inferred to be channel sands stacked on top of
shoreface sand (Hybrid sand). The crossplot of
water saturation (Sw) versus porosity (φ)
shows grain size variation is very fine-grained
sand (Figure 17a). The bulk volume water plot
(Figure 17b) shows that the reservoir is
heterogeneous and the formation has more
water than it can hold by capillary pressure,
thus the reservoir is not at irreducible water
saturation (Swirr) and cannot produce water-
free hydrocarbon during production.
Figure 17. Crossplots of reservoir R6 in well A3 (A) Grain size determination (B) Bulk volume plot
Impact factor 1.472 60. Ogbe*, Ovie Benjamin*,Opatola**, Olatunji Abraham**, Idjerhe
Wilson*** and Ocheli Azuka***
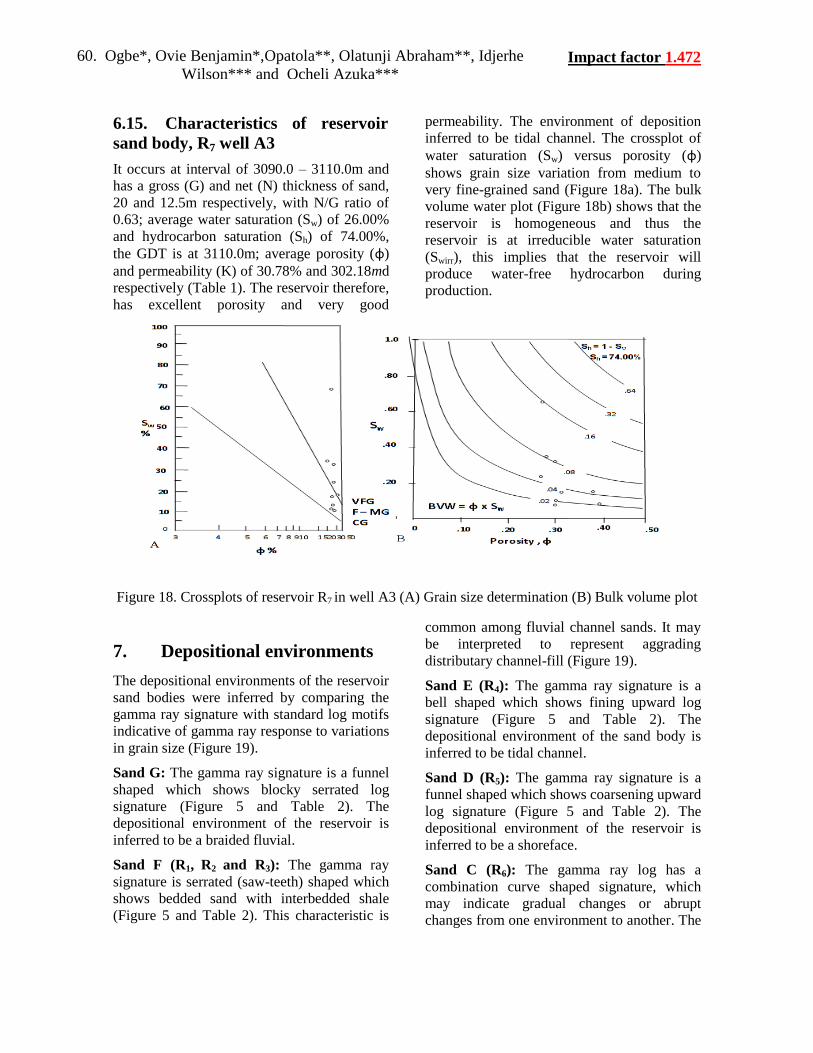
6.15. Characteristics of reservoir
sand body, R7 well A3
It occurs at interval of 3090.0 – 3110.0m and
has a gross (G) and net (N) thickness of sand,
20 and 12.5m respectively, with N/G ratio of
0.63; average water saturation (Sw) of 26.00%
and hydrocarbon saturation (Sh) of 74.00%,
the GDT is at 3110.0m; average porosity (φ)
and permeability (K) of 30.78% and 302.18md
respectively (Table 1). The reservoir therefore,
has excellent porosity and very good
permeability. The environment of deposition
inferred to be tidal channel. The crossplot of
water saturation (Sw) versus porosity (φ)
shows grain size variation from medium to
very fine-grained sand (Figure 18a). The bulk
volume water plot (Figure 18b) shows that the
reservoir is homogeneous and thus the
reservoir is at irreducible water saturation
(Swirr), this implies that the reservoir will
produce water-free hydrocarbon during
production.
Figure 18. Crossplots of reservoir R7 in well A3 (A) Grain size determination (B) Bulk volume plot
7. Depositional environments
The depositional environments of the reservoir
sand bodies were inferred by comparing the
gamma ray signature with standard log motifs
indicative of gamma ray response to variations
in grain size (Figure 19).
Sand G: The gamma ray signature is a funnel
shaped which shows blocky serrated log
signature (Figure 5 and Table 2). The
depositional environment of the reservoir is
inferred to be a braided fluvial.
Sand F (R1, R2 and R3): The gamma ray
signature is serrated (saw-teeth) shaped which
shows bedded sand with interbedded shale
(Figure 5 and Table 2). This characteristic is
common among fluvial channel sands. It may
be interpreted to represent aggrading
distributary channel-fill (Figure 19).
Sand E (R4): The gamma ray signature is a
bell shaped which shows fining upward log
signature (Figure 5 and Table 2). The
depositional environment of the sand body is
inferred to be tidal channel.
Sand D (R5): The gamma ray signature is a
funnel shaped which shows coarsening upward
log signature (Figure 5 and Table 2). The
depositional environment of the reservoir is
inferred to be a shoreface.
Sand C (R6): The gamma ray log has a
combination curve shaped signature, which
may indicate gradual changes or abrupt
changes from one environment to another. The

Impact factor 1.472 61. Ogbe*, Ovie Benjamin*,Opatola**, Olatunji Abraham**, Idjerhe
Wilson*** and Ocheli Azuka***
lower part of the log signature is a funnel
shaped curve which represents a coarsening
upward sequence (Figure 5 and Table 2). The
environment of deposition is inferred to be
shoreface environment. The upper part of the
log signature is a bell shaped curve, which
shows a fining upward sequence (Figure 5 and
Table 2); the environment of deposition of this
part is inferred to be tidal channel
environment. The reservoir is then made up of
channel sands stacked on top of shoreface
sand. The sand of this type of environment is
referred to as hybrid sand.
Sand B: The gamma ray signature is funnel
shaped which shows coarsening upward log
signature (Figure 5 and Table 2); the
depositional environment of the reservoir is
inferred to be a shoreface.
Sand A (R7): The gamma ray signature is bell
shaped, which shows fining upward log
signature (Figure 5 and Table 2). The
depositional environment of the sand body is
inferred to be tidal channel.
Figure 19. Standard log motifs, gamma ray response to variations in grain size (Modified from
Emery and Myers, 1996)

Impact factor 1.472 62. Ogbe*, Ovie Benjamin*,Opatola**, Olatunji Abraham**, Idjerhe
Wilson*** and Ocheli Azuka***
Sand
GR log
shapes/
stacking
patters
Characteristic
description
Inferred
depositional
environment
Φ (%) K (md) Sh (%) Sw (%)
G
The gamma ray
signature is blocky
shaped and serrated
pattern
Braided fluvial - - - -
F (R1,
R2 and
R3)
The gamma ray
signature is cylindrical
shaped with blocky
thickly bedded sand with
few interbedded shale
Fluvial channel
sand 31.26 293.42 60.90 39.10
E (R4)
The gamma ray
signature is bell shaped Tidal channel 32.06 307.90 64.76 35.24
D (R5)
The gamma ray
signature is funnel
shaped
Shoreface 31.48 297.76 59.40 40.60
C (R6)
The gamma ray log has
a combination curve
shaped signature. Lower
part: funnel shaped; and
upper part bell shaped
signature
Channel sand
stacked on top
of shoreface
sand (Hybrid
sand)
27.41 262.49 59.18 40.82
B
The gamma ray
signature is funnel
shaped
Shoreface - - - -
A (R7)
The gamma ray
signature is bell shaped Tidal channel 29.71 275.97 77.69 22.31

Impact factor 1.472 63. Ogbe*, Ovie Benjamin*,Opatola**, Olatunji Abraham**, Idjerhe
Wilson*** and Ocheli Azuka***
8. Discussion
The reservoirs in the study area are sandstones
within the Agbada Formation. Petrophysical
evaluation was carried out on the wireline
logs. A total of seven (7) reservoirs were
identified and are correlatable across the entire
wells. Though, some of the correlatable
reservoirs do not contain hydrocarbon in some
wells; three (3) reservoirs contain
hydrocarbons in well A1, six (6) reservoirs
contain hydrocarbons in well A2 and four (4)
reservoirs contain hydrocarbons in well A3.
The average petrophysical parameters of the
reservoirs range from 37.78 – 27.41%, 409.15
– 249.76md, 57.74 – 18.63%, and 81.37 –
42.26% for porosity (ф), permeability (K),
water saturation (Sw) and hydrocarbon
saturation (Sh), respectively. From the
Schlumberger standard (Schlumberger, 1972)
the porosity (ф) ranges from excellent to very
good, while the permeability (K) is very good.
These values show a gradual decrease from
top to bottom of the wells, reflecting increase
in compaction with depth. The permeability
also followed the same trend, though there are
fluctuations from reservoir to reservoir. With
these petrophysical values, the reservoirs of
the study area can be said to be prolific in
terms of hydrocarbon production. The
crossplots (Asquith and Gibson, 1982)
revealed that grain size ranges from coarse-
grained to very fine-grained sands.
Most of the reservoirs bulk volume water
(BVW) values calculated and plotted on
crossplot, as established by Asquith and
Gibson, 1982, exhibit wide variation, this
indicates that the reservoir are not
homogeneous and not at irreducible water
saturation (Swirr) and the reservoirs can hardly
produce hydrocarbon water-free, though such
reservoirs can produce hydrocarbon water-free
when the reservoirs have high content of clay.
When a reservoir is at Swirr, water saturation
(Sw) will not move because it is held on grains
by capillary pressure. Hydrocarbon production
from a reservoir at Swirr should be water-free.
Only R7 in well A2, R3 and R7 in A3 showed
BVW values close to constant and can produce
hydrocarbon water-free.
Depositional environments of the reservoir
sand bodies were inferred by comparing the
standard gamma ray wireline log motif which
ranged in signatures from channel sand of
deltaic plain settings to shoreface
environments.
9. CONCLUSION The reservoir sand bodies of K-Field have
both associated and non-associated reservoirs,
but the field is more or less a Gas Field. The
porosity values that range from excellent to
very good. The permeability is very good and
the hydrocarbon saturation ranges from
81.37% to 42.26%. The reservoirs of the
reservoir sand bodies are not at the zone of
irreducible water saturation, except reservoirs
R7 in well A2, R3 and R7 in well A3; this
implies that the rest will not produce water
free hydrocarbons due to their high water
saturation, although some others factors like
clay within a reservoir, can makes reservoir
with high water saturation to produce water
free hydrocarbon. Thus, reservoir R7 in well
A2, R3 and R7 in well A3 of K-Field are the
best in terms of hydrocarbon production, also
the channel sands have the best reservoir
quality and potential compared to the
shoreface reservoir sand bodies studied.
REFERENCES
[1] Burke, R.C. and Whiteman, A.J., (1970)
“The geological history of the Gulf of
Guinea”. Scientific Committee on
Oceanographic Research (SCOR)
Conference, Cambridge University, Easter.
[2] Tuttle, M.L.W., Brownfield, M.E., and
Charpentier, R.R., (1999) “The Niger Delta
petroleum system. USGS Science for a
changing world: Open File Report 99-50,
65p
[3] Short, K. C., and Stauble, A.J., (1965)
“Outline of geology of Niger Delta”,
American Association of Petroleum
Geologists Bulletin, vol. 51, pp761-779.

Impact factor 1.472 64. Ogbe*, Ovie Benjamin*,Opatola**, Olatunji Abraham**, Idjerhe
Wilson*** and Ocheli Azuka***
[4] Etu-Efeotor, J.O., (1997) “Fundamentals of
Petroleum Geology”, Paragraphics (An
imprint of Jeson Services) Publisher, Port
Harcourt, pp1-146.
[5] Burke, K., Dessauvagie, T.F.J., and
Whiteman, A.J., (1971) “Opening of the
Gulf of Guinea and geological history of
benue depression and Niger Delta”. Nature
Physical Science, vol. 233, pp51-55.
[6] Evamy, B.D., Haremboure, J., Kamerling,
P., Knaap, W.A., Molloy, F.A., and
Rowlands, P.H., (1978) “Hydrocarbon
habitat of Tertiary Niger Delta”. American
Association of Petroleum Geologists
Bulletin, vol. 62, pp277-298.t
[7] Avbovbo, A. A., (1978) “Tertiary
lithostratigraphy of Niger Delta”, American
Association of Petroleum Geologists
Bulletin, vol. 62, pp295-300.
[8] Weber, K. J., and Daukoru, E.M., (1975)
“Petroleum geology of the Niger Delta”
Proceedings of the Ninth World Petroleum
Congress, vol. 2, Geology: London, Applied
Science Publishers, Ltd., pp210-221.
[9] Weber, K.J., (1971) “Sedimentological
aspects of oil fields in the Niger Delta”
geologie en mijnbouw, vol. 50, pp559-576.
[10] Doust, H., and Omatsola, E., (1990) “Niger
Delta”, in, Edwards, J. D., and Santogrossi,
P.A., eds., “Divergent/passive Margin
Basins”, AAPG Memoir 48: Tulsa,
American Association of Petroleum
Geologists, pp239-248.
[11] Emery, D., and Myers, K.J. (1996)
“Sequence stratigraphy”, Black Ltd.,
Oxford, U.K., p. 297.
[12] Schlumberger, (1972) “Log
interpretation/charts”, Houston,
Schlumberger well services, Inc.
[13] Asquith, G.B., and Gibson, C.R., (1982)
“Basic Well Log Analysis for Geologists”.
3rd
Printing, American Association of
Petroleum Geologists, Tulsa Oklahoma
USA. p.216 .
Authors
Ogbe, Ovie Benjamin, hold a Master of Science
(M.Sc) degree in petroleum geology from the
University of Port Harcourt, Nigeria. He is
currently a Ph.D student of the Nnamdi Azikiwe
University, Awka Nigeria, with research interests
in petroleum geology, Sedimentolgy and Field
Geology.
Opatola, Olatunji Abraham just concluded his
Ph.D research work with specialty in
sedimentology and Reservoir Geology from
University of PortHarcourt. He currently Lecture at
Geosciences Department of University of Lagos.
Idjerhe, Wilson hold a Master of Science (M.Sc)
degree in Petroleum Geology from the University
of Port Harcourt, Nigeria. He is currently working
as a Geologist with Department of Petroleum
Resources.
Ocheli, Azuka hold a M.Sc degree in
Sedimentology and Stratigraphy and currently a
Doctoral student of the Nnamdi Azikiwe
University, Awka, with researcn interest in
Sedimentology and Stratigraphy.


![SUNDAY OLUSANYA OLATUNJI [Aadam] (B.Sc., M.Sc., M.S., PhD) · 2015-12-08 · Dr. S. O. Olatunji Curriculum Vitae Page 6 of 19 Publication(S) Up To Date A. Thesis/Dessertation 1. Enhanced](https://img.pdfslide.net/doc/110x75/5e73178d22c95048167b6454/sunday-olusanya-olatunji-aadam-bsc-msc-ms-phd-2015-12-08-dr-s-o.jpg)