Embed Size (px)
Citation preview
2020 Reference Scenario
April 2, 2020
Maryland PATHWAYS
Tory Clark, Director
Charles Li, Consultant
Snuller Price, Senior Partner
2
Agenda
Background
Policies Represented in the Reference Scenario
2020 Updates for the Reference Scenario
GHG emissions trajectory and benchmarking
Appendix
3
Background
The goal of this project is to quantify energy and emissions impacts
from Maryland’s current and potential future policies in the E3
PATHWAYS model
The PATHWAYS modeling framework allows for:
• Detailed tracking of existing and future household appliances and vehicles
• Hourly treatment of electricity sector
• Comprehensive emissions accounting in buildings, transportation, industry, electricity
generation, non-energy, and forestry
Reference Scenario (current policy case) was modeled in 2017,
Mitigation Scenarios were modeled in 2018-2019. We are now in the
process of making final updates in 2020.
44
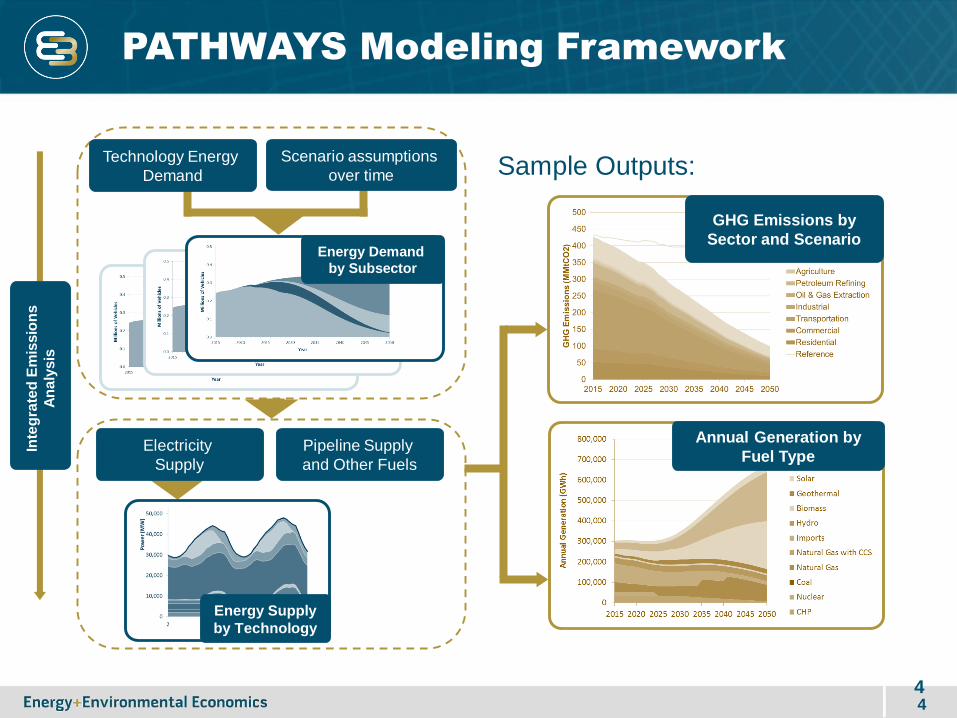
PATHWAYS Modeling Framework
Technology Energy
Demand
Energy Demand
by Subsector
Electricity
Supply
Pipeline Supply
and Other Fuels
Scenario assumptions
over time
Inte
gra
ted
Em
issio
ns
An
aly
sis
GHG Emissions by
Sector and Scenario
Energy Supply
by Technology
Sample Outputs:
Annual Generation by
Fuel Type
5
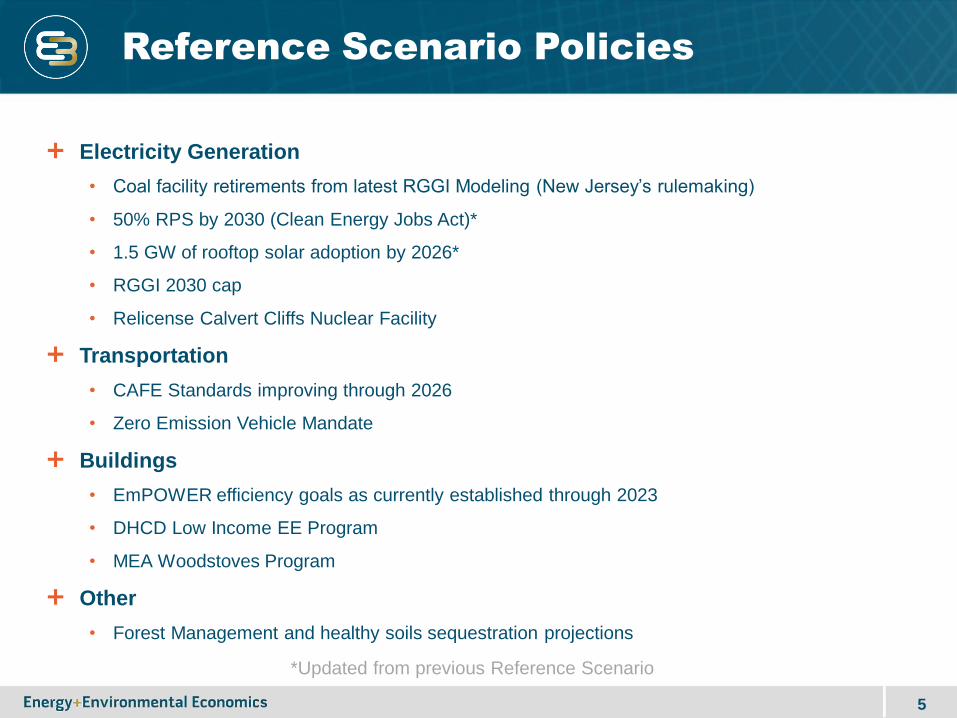
Reference Scenario Policies
Electricity Generation
• Coal facility retirements from latest RGGI Modeling (New Jersey’s rulemaking)
• 50% RPS by 2030 (Clean Energy Jobs Act)*
• 1.5 GW of rooftop solar adoption by 2026*
• RGGI 2030 cap
• Relicense Calvert Cliffs Nuclear Facility
Transportation
• CAFE Standards improving through 2026
• Zero Emission Vehicle Mandate
Buildings
• EmPOWER efficiency goals as currently established through 2023
• DHCD Low Income EE Program
• MEA Woodstoves Program
Other
• Forest Management and healthy soils sequestration projections
*Updated from previous Reference Scenario
6
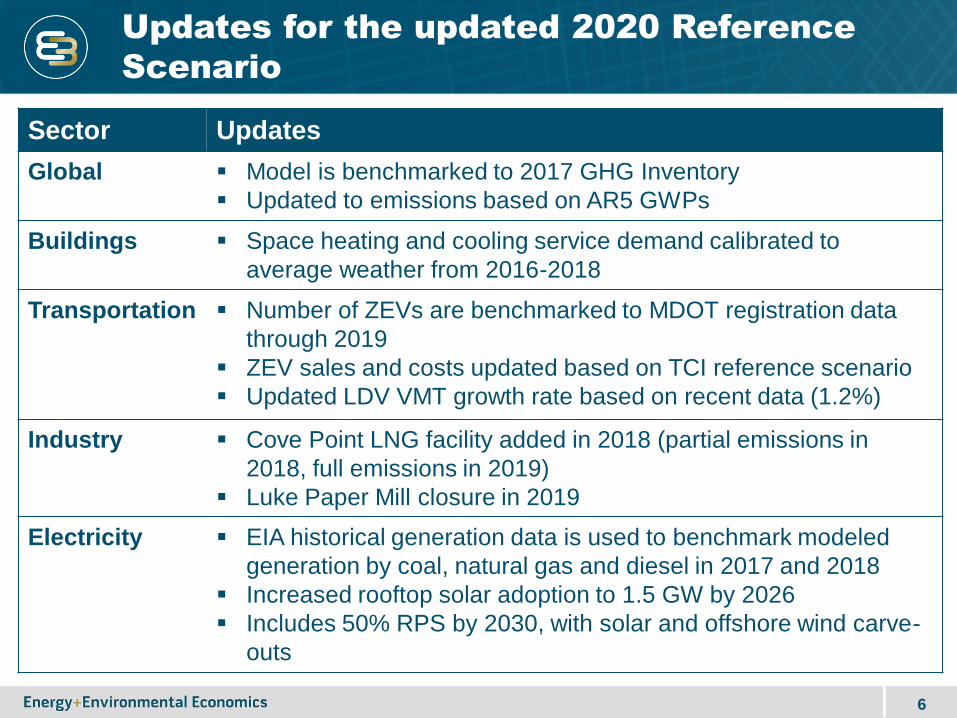
Sector Updates
Global ▪ Model is benchmarked to 2017 GHG Inventory
▪ Updated to emissions based on AR5 GWPs
Buildings ▪ Space heating and cooling service demand calibrated to
average weather from 2016-2018
Transportation ▪ Number of ZEVs are benchmarked to MDOT registration data
through 2019
▪ ZEV sales and costs updated based on TCI reference scenario
▪ Updated LDV VMT growth rate based on recent data (1.2%)
Industry ▪ Cove Point LNG facility added in 2018 (partial emissions in
2018, full emissions in 2019)
▪ Luke Paper Mill closure in 2019
Electricity ▪ EIA historical generation data is used to benchmark modeled
generation by coal, natural gas and diesel in 2017 and 2018
▪ Increased rooftop solar adoption to 1.5 GW by 2026
▪ Includes 50% RPS by 2030, with solar and offshore wind carve-
outs
Updates for the updated 2020 Reference
Scenario
7
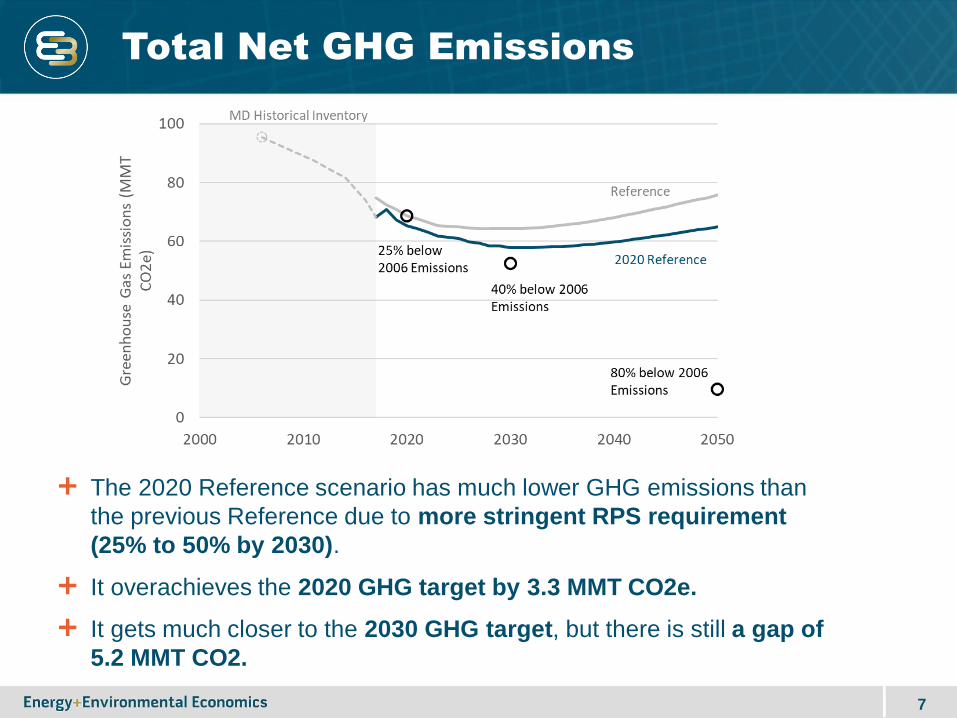
Total Net GHG Emissions
The 2020 Reference scenario has much lower GHG emissions than
the previous Reference due to more stringent RPS requirement
(25% to 50% by 2030).
It overachieves the 2020 GHG target by 3.3 MMT CO2e.
It gets much closer to the 2030 GHG target, but there is still a gap of
5.2 MMT CO2.
8
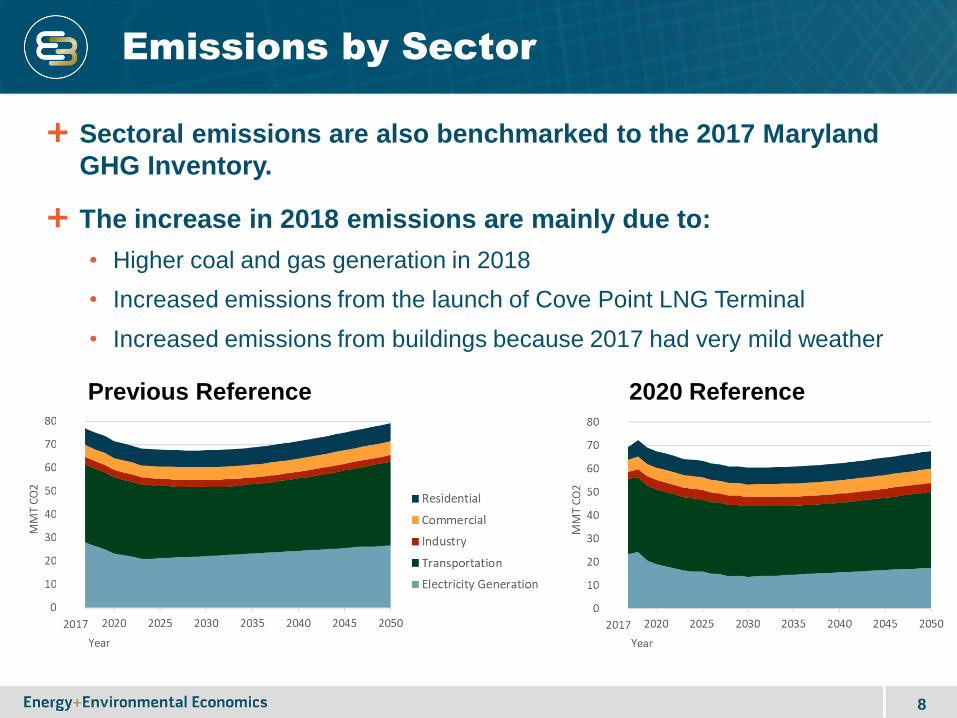
Sectoral emissions are also benchmarked to the 2017 Maryland
GHG Inventory.
The increase in 2018 emissions are mainly due to:
• Higher coal and gas generation in 2018
• Increased emissions from the launch of Cove Point LNG Terminal
• Increased emissions from buildings because 2017 had very mild weather
Emissions by Sector
Previous Reference 2020 Reference
9
Light-duty Vehicles Stock Share:
Previous Reference vs. 2020 Reference
Previous Reference 2020 Reference
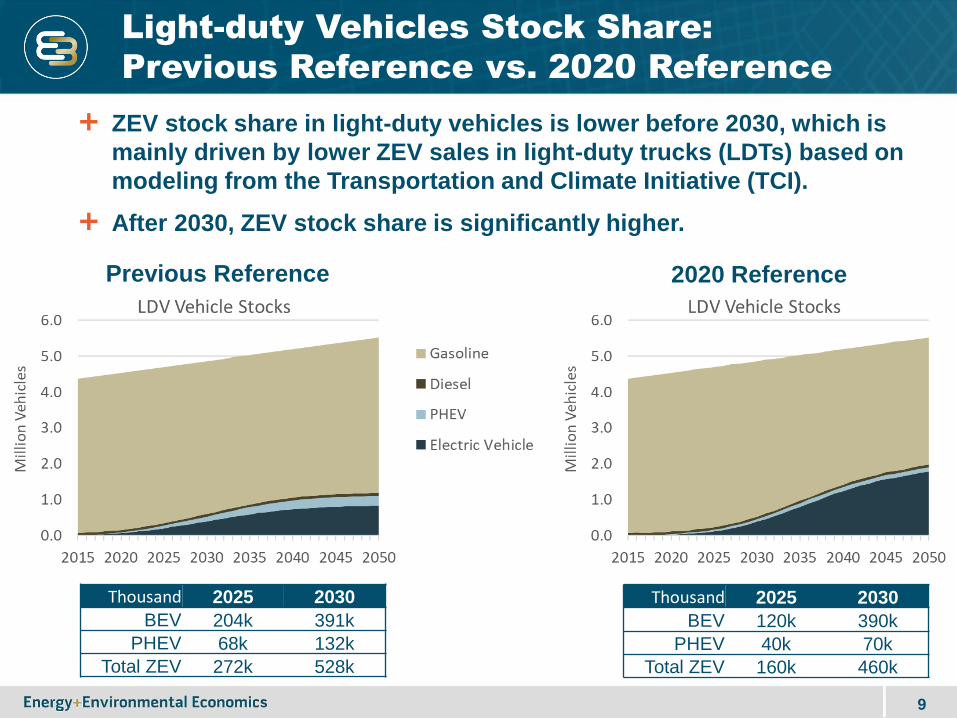
ZEV stock share in light-duty vehicles is lower before 2030, which is
mainly driven by lower ZEV sales in light-duty trucks (LDTs) based on
modeling from the Transportation and Climate Initiative (TCI).
After 2030, ZEV stock share is significantly higher.
Thousand 2025 2030
BEV 204k 391k
PHEV 68k 132k
Total ZEV 272k 528k
Thousand 2025 2030
BEV 120k 390k
PHEV 40k 70k
Total ZEV 160k 460k
10
Electricity Generation
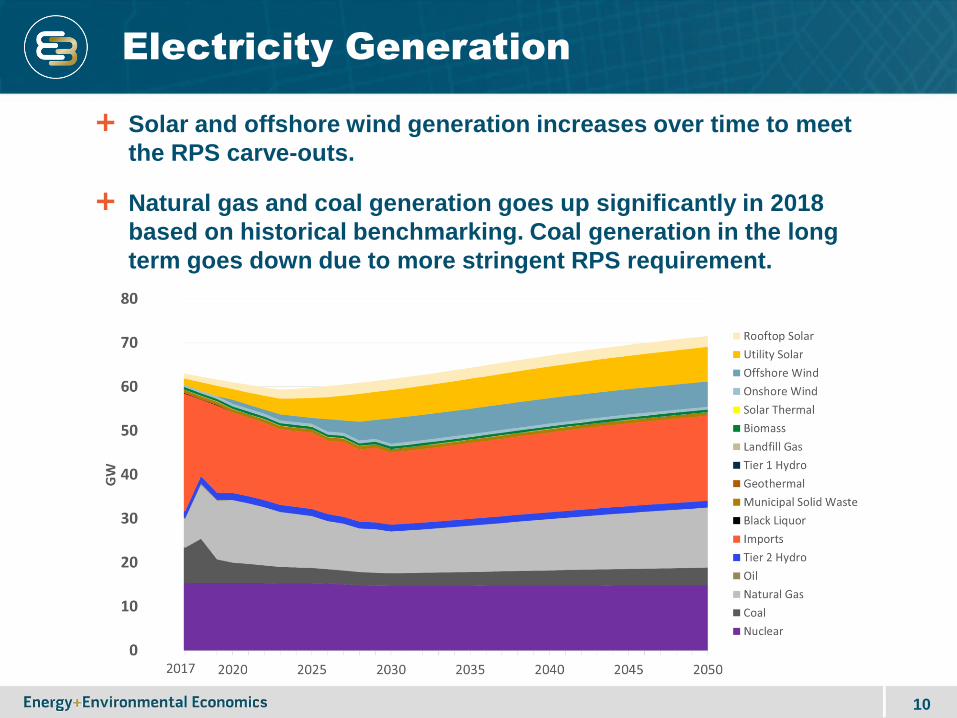
Solar and offshore wind generation increases over time to meet
the RPS carve-outs.
Natural gas and coal generation goes up significantly in 2018
based on historical benchmarking. Coal generation in the long
term goes down due to more stringent RPS requirement.
11
RPS
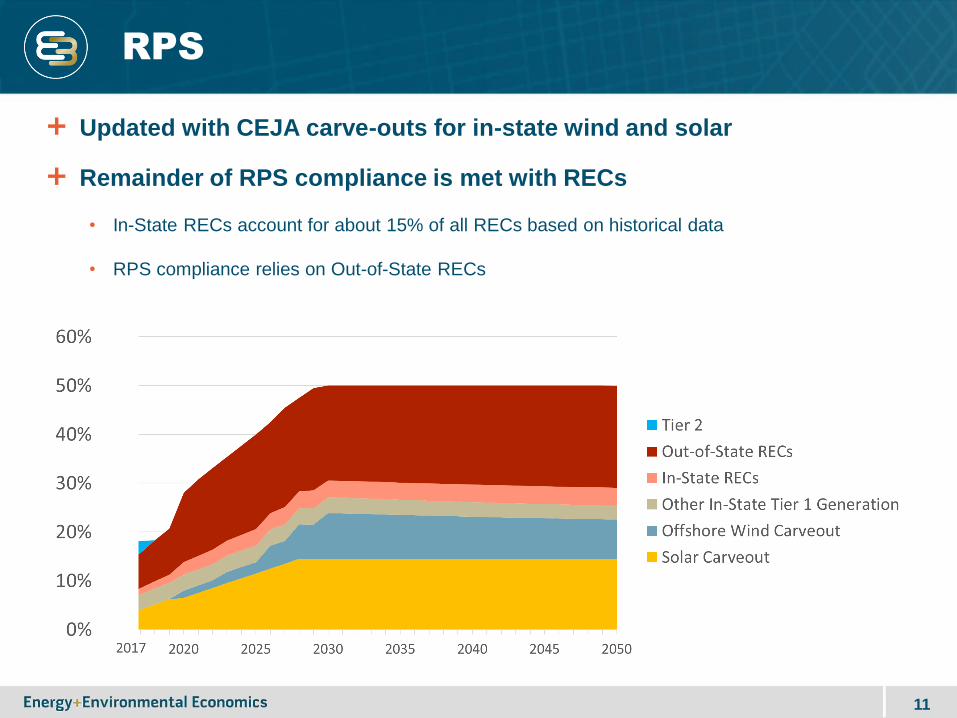
Updated with CEJA carve-outs for in-state wind and solar
Remainder of RPS compliance is met with RECs
• In-State RECs account for about 15% of all RECs based on historical data
• RPS compliance relies on Out-of-State RECs
12
Next Steps
Update Policy Scenario modeling based on feedback
Work with RESI at Towson University to update macroeconomic
modeling
Finish modeling by June 2020
Appendix
14
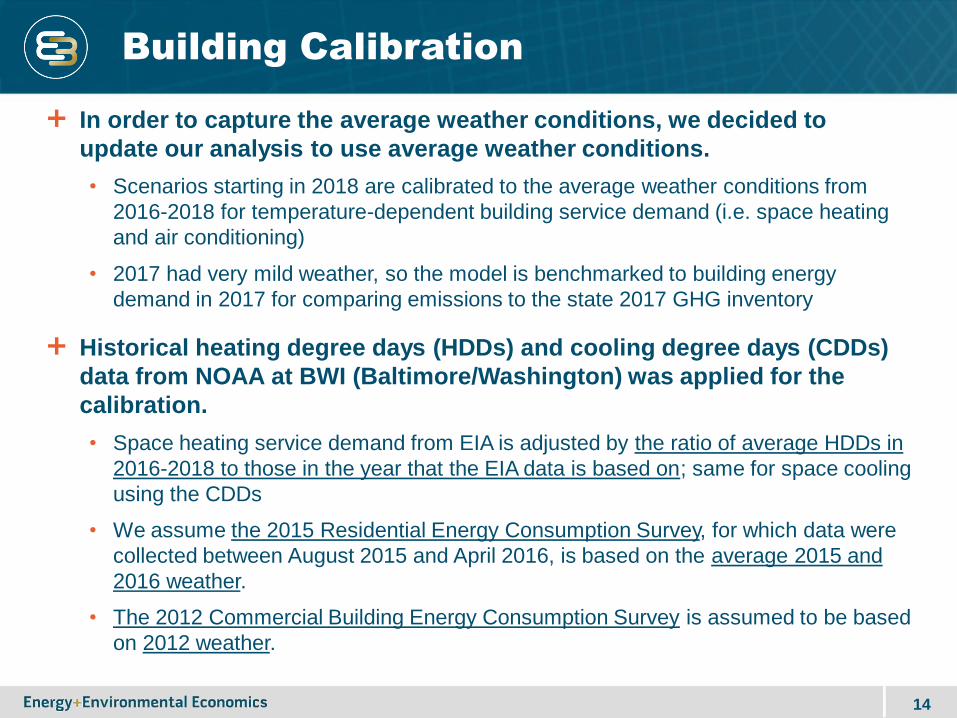
In order to capture the average weather conditions, we decided to
update our analysis to use average weather conditions.
• Scenarios starting in 2018 are calibrated to the average weather conditions from
2016-2018 for temperature-dependent building service demand (i.e. space heating
and air conditioning)
• 2017 had very mild weather, so the model is benchmarked to building energy
demand in 2017 for comparing emissions to the state 2017 GHG inventory
Historical heating degree days (HDDs) and cooling degree days (CDDs)
data from NOAA at BWI (Baltimore/Washington) was applied for the
calibration.
• Space heating service demand from EIA is adjusted by the ratio of average HDDs in
2016-2018 to those in the year that the EIA data is based on; same for space cooling
using the CDDs
• We assume the 2015 Residential Energy Consumption Survey, for which data were
collected between August 2015 and April 2016, is based on the average 2015 and
2016 weather.
• The 2012 Commercial Building Energy Consumption Survey is assumed to be based
on 2012 weather.
Building Calibration
15
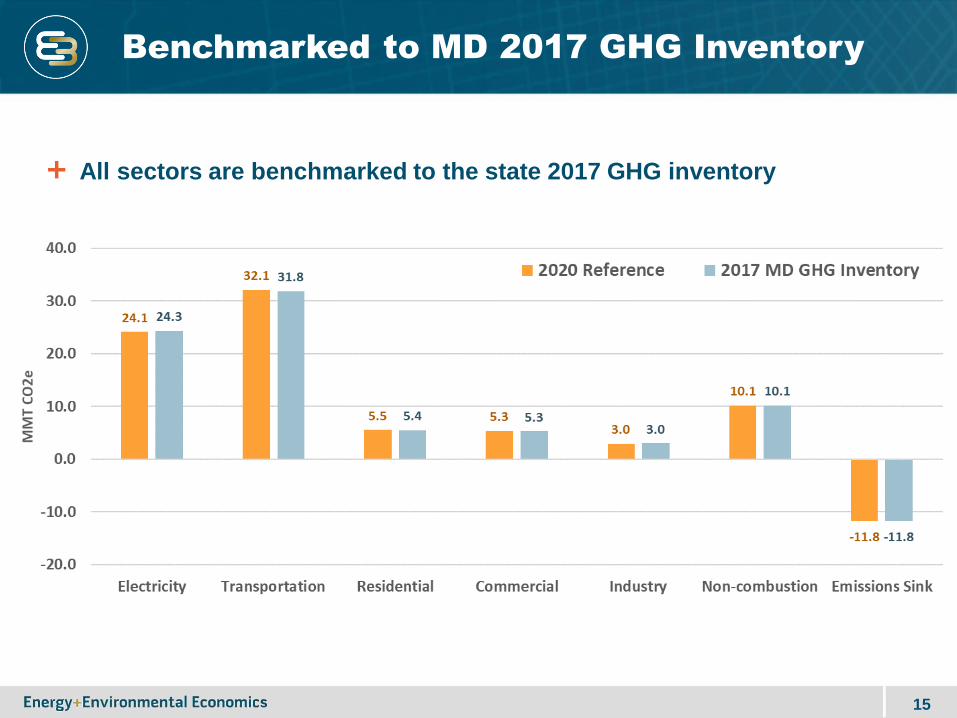
Benchmarked to MD 2017 GHG Inventory
All sectors are benchmarked to the state 2017 GHG inventory
16
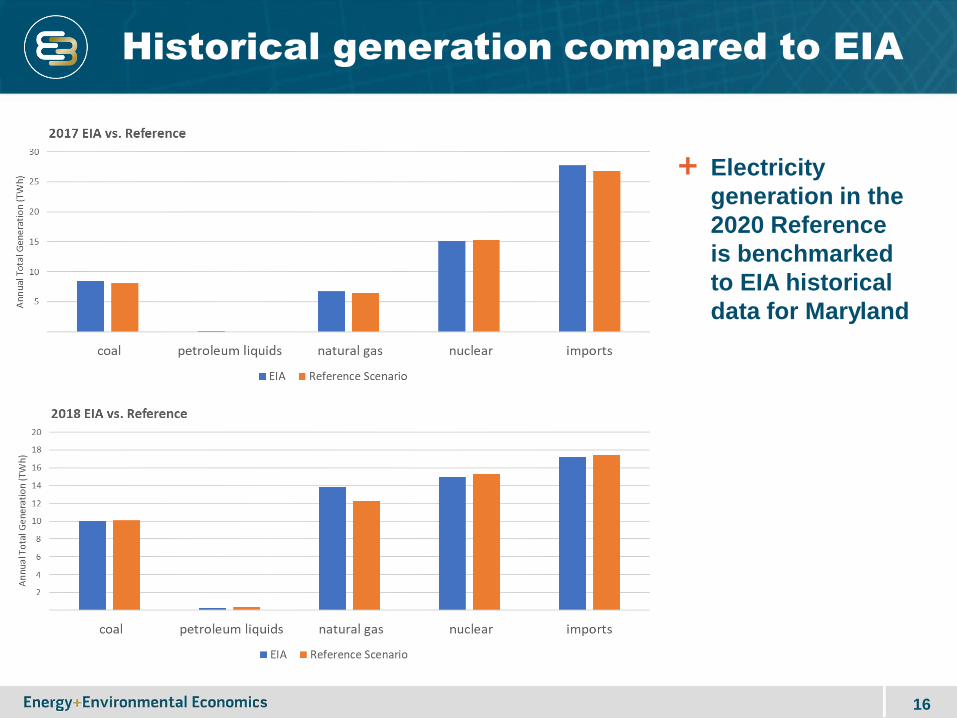
Historical generation compared to EIA
Electricity
generation in the
2020 Reference
is benchmarked
to EIA historical
data for Maryland