Embed Size (px)
Citation preview
Resident attitudes towards tourism
Testing the Resident Empowerment through
Tourism Scale (RETS) in Bruges
Master Thesis submitted in fulfillment of the Degree
Master of Business Administration
in Tourism Management
Submitted to Prof. Dr. Karl Wöber (supervisor)
And Prof. em. Dr. Josef Mazanec (co-supervisor)
Vincent Nijs
1302013
<Place>, <Day> <Month> <Year>


I
AFFIDAVIT
I hereby affirm that this Master’s Thesis represents my own written work and that I have used
no sources and aids other than those indicated. All passages quoted from publications or para-
phrased from these sources are properly cited and attributed.
The thesis was not submitted in the same or in a substantially similar version, not even par-
tially, to another examination board and was not published elsewhere.
Date Signature

II

III
ABSTRACT
With both visitor and resident numbers growing fast in many cities, the tourism carrying capacity
of the city is getting more and more attention. Tourism managers understand that a focus on
the principles of sustainable development in tourism activities will help them to preserve or
create tourism cities where tourist and residents can live in harmony. This study looks at one of
the aspects of the sustainable tourism city: the residents’ attitudes towards tourism. The study
tests the Resident Empowerment through Tourism Scale (RETS), developed by Boley et al. (2014)
in a European heritage city: Bruges, Flanders. The same hypotheses, except one, as in the origi-
nal study are discovered. Perceived economic benefits from tourism and psychological empow-
erment have a direct effect on resident support for tourism. Social and political empowerment
have an indirect relationship with the support for tourism via perceived impacts of tourism.
These results imply the consideration for tourism managers to include in their actions those
elements that empower citizens in order to boost the support for tourism. Empowered residents
support tourism more. We succeeded also in a second goal to select a more lean RETS model
structure to facilitate and encourage other destinations to apply the same model and to create
benchmarking opportunities.

IV

V
ACKNOWLEDGEMENTS
A list of institutions and people who may have contributed to your thesis, which you think de-
serve a mention under this heading.
VI
TABLE OF CONTENTS
Affidavit .......................................................................................................................................... I
Abstract ........................................................................................................................................ III
Acknowledgements ....................................................................................................................... V
List of Figures ................................................................................................................................ XI
List of Abbreviations ................................................................................................................... XIII
1 Introduction ........................................................................................................................ 1
2 Literature review ................................................................................................................. 5
2.1 Introduction to sustainability in tourism in the context of the impact on residents ......... 5
2.2 Tourism growth and resident impact .................................................................................. 5
2.2.1 Extrinsic VS extrinsic models .......................................................................................................... 5
2.2.2 Crowding & carrying capacity ........................................................................................................ 8
2.2.3 Resident attitudes towards tourism .............................................................................................. 9
2.2.4 Social Exchange Theory ................................................................................................................ 11
2.2.5 RETS: beyond Social Exchange ..................................................................................................... 13
2.3 Conclusion ......................................................................................................................... 16
3 Research area and methodology ...................................................................................... 17
3.1 Research area: the city of Bruges ..................................................................................... 17
3.1.1 Tourism in Bruges? ....................................................................................................................... 17
3.1.2 Location and situation of Bruges ................................................................................................. 18
3.1.3 Tourism concentration in the ‘Golden Triangle’ and ‘hotel stop’ ................................................ 21
3.1.4 Tourism trends in Bruges: key figures .......................................................................................... 25
3.1.5 Image, satisfaction and economic impact of the Bruges leisure market ..................................... 36
3.1.6 Crowding in Bruges ...................................................................................................................... 39
3.1.7 Conclusion .................................................................................................................................... 42
3.2 Selection of methodology ................................................................................................. 43
3.2.1 Introduction ................................................................................................................................. 43
3.2.2 Introduction to replication studies .............................................................................................. 43
3.2.3 Research model & hypotheses .................................................................................................... 45
3.2.4 Research instrument .................................................................................................................... 48
3.2.5 Questionnaire .............................................................................................................................. 49
3.2.6 Survey launch and pilot tests ....................................................................................................... 51
3.2.7 Response and representativeness ............................................................................................... 51
3.2.8 Data analysis ................................................................................................................................ 55
3.3 Conclusion ......................................................................................................................... 56
4 Results and discussion ...................................................................................................... 57
VII
4.1 Introduction ...................................................................................................................... 57
4.2 Results ............................................................................................................................... 57
4.2.1 Introduction to the results ............................................................................................................ 57
4.2.2 Scores on the RETS and SET constructs ........................................................................................ 58
4.2.3 RETS and SET CFA and construct validity ...................................................................................... 58
4.2.4 RETS and SET model relations....................................................................................................... 62
4.2.5 RETS model relations by city area ................................................................................................. 66
4.2.6 Resident group differences in attitudes towards tourism in Bruges ............................................ 70
4.2.7 The impact of talking to tourists on RETS scores .......................................................................... 79
4.2.8 Towards a reduction of the RETS construct items ........................................................................ 80
4.3 Discussion, limitations and areas for future research ...................................................... 83
4.3.1 Discussion ..................................................................................................................................... 83
4.3.2 Limitations and areas for future research .................................................................................... 87
5 Conclusion ......................................................................................................................... 89
6 Bibliography ...................................................................................................................... 91
Appendices .................................................................................................................................. 99
Appendix 1: Questionnaire in English ....................................................................................... 100
Appendix 2: Questionnaire in Dutch ......................................................................................... 107
VIII
LIST OF TABLES
Table 3-1 Leisure overnights in Belgian cities, top 15, 2015 ....................................................... 26
Table 3-2 Hotel category in Bruges, based on capacity in beds, 2014 ........................................ 29
Table 3-3 Hotel size in Bruges, based in capacity in beds, 2014 ................................................. 30
Table 3-4 Total and leisure overnights in Belgian historic cities ................................................. 30
Table 3-5 Total estimated number of visitors in Bruges in 2015 based on mobile big data ....... 32
Table 3-6 Seasonality of the visitors in Bruges in 2015 based on mobile big data (absolute) .... 32
Table 3-7 Seasonality (Gini coefficient) of 85 European tourist cities in 2015, based on overnights
in all paid forms of accommodation ........................................................................................... 34
Table 3-8 Tourism intensity rates for Bruges 2015 ..................................................................... 40
Table 3-9 Tourism intensity in European cities based on official accommodation statistics ..... 42
Table 3-10 RETS scale items for seven constructs Source: Boley et al. 2014 .............................. 51
Table 3-11 Fieldwork overview completes .................................................................................. 52
Table 3-12 Overview socio demographic variables for the population and the unweight and
weight sample ............................................................................................................................. 53
Table 3-13 Applied weights per socio-demographic variable ..................................................... 54
Table 3-14 Range and frequencies of weight factors .................................................................. 55
Table 3-15 Overview socio demographic variables for the population and the unweight and
weight sample ............................................................................................................................. 55
Table 4-1 Mean scores on the seven RETS and SET constructs .................................................. 57
Table 4-2 Mean scores on the seven RETS and SET constructs .................................................. 58
Table 4-3 CFA output for construct validity ................................................................................ 60
Table 4-4 Comparing factor loadings of Bruges and US study .................................................... 61

IX
Table 4-5 Hypothesized relationships between seven constructs and observed relationships
from the SEM .............................................................................................................................. 63
Table 4-6 Comparison observed relationships in Bruges (2016) and Virginia (Boley et al.,
2014) ........................................................................................................................................... 65
Table 4-7 Mean scores on the seven RETS and SET constructs in Bruges (2016) and the Virginia
study (Boley et al., 2014) ............................................................................................................ 65
Table 4-8 Mean scores on the seven RETS and SET constructs for the inner and outer city
area ............................................................................................................................................. 67
Table 4-9 CFA output for construct validity in the inner and outer city areas ........................... 68
Table 4-10 Hypothesized relationships between seven constructs and observed relationships
from the SEM for inner and outer city region ............................................................................. 69
Table 4-11 Results of the support for tourism statements ......................................................... 71
Table 4-12 Results of the psychological empowerment statements .......................................... 71
Table 4-13 Results of the social empowerment statements ...................................................... 72
Table 4-14 Results of the political empowerment statements ................................................... 73
Table 4-15 The desire to get more involved in policy making .................................................... 73
Table 4-16 Results of the personal economic benefits statements ............................................ 74
Table 4-17 Results of the negative impact statements............................................................... 75
Table 4-18 Can tourists in Bruges be a nuisance ........................................................................ 75
Table 4-19 Can tourists in Bruges be a nuisance – details Golden Triangle ............................... 75
Table 4-20 Types of nuisance by tourists in Bruges .................................................................... 76
Table 4-21 Results of the positive impact statements ................................................................ 77
Table 4-22 Less, equal or more tourists in Bruges? .................................................................... 78
Table 4-23 Considering to move out of Bruges ........................................................................... 79
Table 4-24 Frequency of talking to tourists ................................................................................ 79
Table 4-25 Frequency of talking to tourists – significant differences ......................................... 80

X
Table 4-24 Proposal for reducing number of RETS statements .................................................. 81
Table 4-25 CFA output for construct validity in the reduced RET model .................................... 82
Table 4-26 Hypothesized relationships between seven constructs and observed relationships
from the SEM in the reduced RETS model .................................................................................. 83

XI
LIST OF FIGURES
Figure 1-1 Long term trend arrivals in Flanders: historic cities, countryside and coast (1994-2014)
........................................................................................................................................................2
Figure 2-1 A framework for analyzing the social impacts of tourism ............................................6
Figure 2-2 A Hypothetical evolution of a tourist area (TALC model) .............................................7
Figure 2-3 European Tourism Products – A Product Life Cycle Approach .....................................8
Figure 2-4 Four forces (groups) in tourism development ........................................................... 10
Figure 2-5 The community tension-directed mechanism of tourism’s impacts ......................... 10
Figure 2-6 The mechanism of SET in a theoretical model: the relation between economic benefits
from tourism, perceived impacts and support ........................................................................... 12
Figure 2-7 Model for empowerment’s influence on resident attitudes toward tourism, based on
RETS & SET. ................................................................................................................................. 14
Figure 3-1 Beautiful view on the belfry from the ‘Rozenhoedkaai’ in Bruges ............................ 17
Figure 3-2 Location of Bruges ..................................................................................................... 19
Figure 3-3 The Bruges municipalities and “the Egg” ................................................................... 20
Figure 3-4 Trend in the number of Cruise ships and cruise passengers, 2008-2015 .................. 20
Figure 3-5 Population trends in Bruges, the Bruges Municipality and the inner city. ................ 21
Figure 3-6 Distribution of commercial activities in Bruges ......................................................... 22
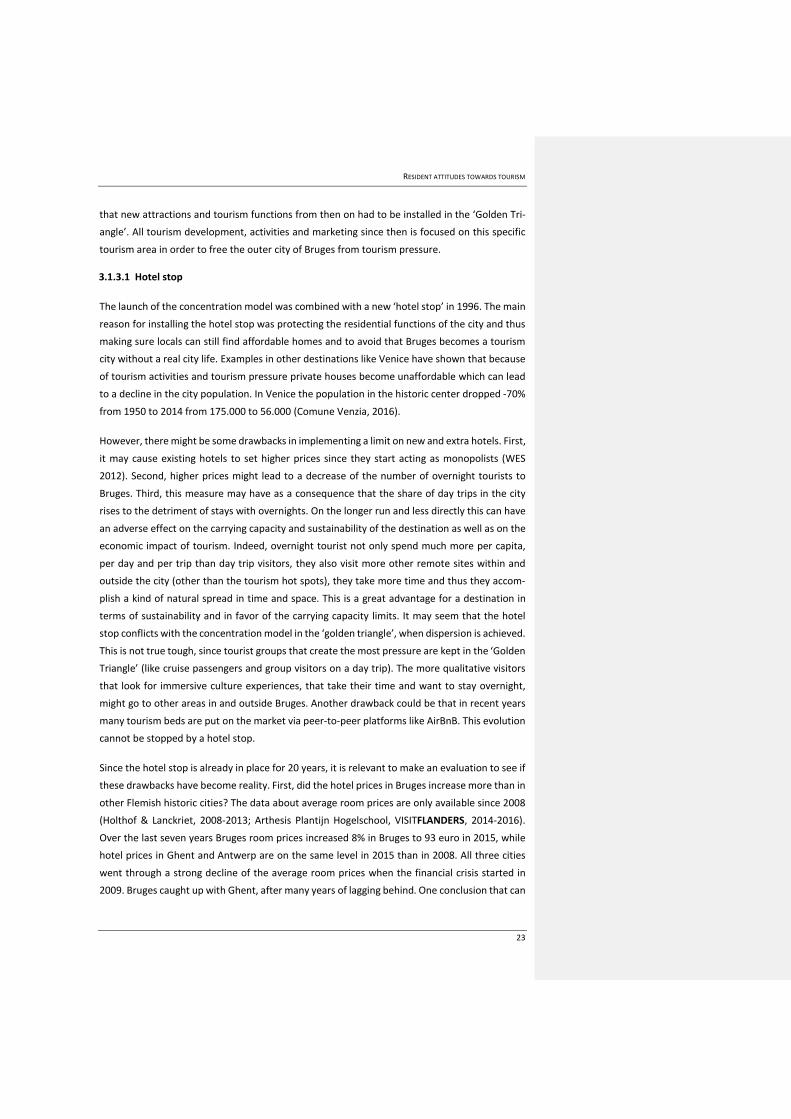
Figure 3-7 Trend of the average room price in Bruges, Ghent and Antwerp, 2006-2015 .......... 24
Figure 3-8 Trend of the average hotel occupancy rates in Bruges, 2006-2015 .......................... 25
Figure 3-9 Accommodation supply in Bruges 2014: number of accommodations ..................... 27
Figure 3-10 Accommodation supply in Bruges 2014: number of bed spaces ............................. 27
Figure 3-11 Accommodation supply in Bruges 2004-2014 ......................................................... 28
Figure 3-12 Accommodation supply in Bruges 2004-2015 – number of accommodations ....... 29
Figure 3-13 Accommodation supply in Bruges 2004-2014 – capacity ........................................ 29
XII
Figure 3-14 Seasonality of the visitors in Bruges in 2015 based on mobile big data (%) ............ 33
Figure 3-15 Seasonality trend (Gini coefficient) in Bruges, 2004-2015 ....................................... 34
Figure 3-16 Long term trend overnights and arrivals in Bruges, 2004-2015 .............................. 35
Figure 3-17 Trend market mix in Bruges, based on overnights, 2005-2015 ............................... 36
Figure 3-18 Image of Bruges, Antwerp, Brussels and Ghent among leisure tourists (2011), top 15
based on total of 6 cities (including Leuven & Mechelen) .......................................................... 37
Figure 3-19 Average satisfaction of leisure tourists in Bruges, Antwerp, Brussels & Ghent (2011,
score /5) ...................................................................................................................................... 38
Figure 3-20 Trend of the tourist intensity rate, based in nights, for Bruges, 2005-2015 ........... 41
Figure 3-21 Model for empowerment’s influence on resident attitudes toward tourism, based
on RETS ........................................................................................................................................ 46
Figure 4-1 Hypothesized relationships between seven constructs and observed relationships
from the SEM............................................................................................................................... 64
Figure 4-2 Hypothesized relationships between seven constructs and observed relationships
from the SEM for Bruges (2016) and the Virginia study (Boley et al., 2014) .............................. 66
Figure 4-3 Hypothesized relationships between seven constructs and observed relationships
from the SEM in the Bruges inner and outer city areas .............................................................. 70
XIII
LIST OF ABBREVIATIONS
B&B Bed & Breakfast
CIM Centrum voor Informatie over de Media (Media Information Center)
CFA Confirmatory Factor Analysis
CFI Comparative Fit index
DF Defert Function
DMO Destination Management Organization
EFA Exploratory Factor Analysis
ETC European Travel Commission
RETS Resident Empowerment through Tourism Scale
RMSEA Root Mean Square Error of Approximation
TLI Tucket Lewis Index
SEM Structural Equation Modeling
SET Social Exchange Theory
SPSS Statistical Package for the Social Sciences
TIR Tourism Intensity Rate
TL impact of Tourism on the Locality
TLAC Tourist Area Life Cycle
UNESCO United Nations Educational, Scientific and Cultural Organization
UNWTO United Nations World Tourism Organization
WCED World Commission on Environment and Development
WFSR Weber’s theory of Formal and Substantive Rationality

XIV
RESIDENT ATTITUDES TOWARDS TOURISM
1
1 INTRODUCTION
The size and growth of worldwide tourism flows and the potential economic benefits of tourism
activities for destinations are indisputable. ‘World tourism rises faster than trade for forth year’,
headlines BBC, based on the latest UNWTO figures (BBC, 2016). International tourism grew by
4% in 2015 generating $ 1,4trn (UNWTO 2016). In comparison, global trade increased by just
2,8% (World Trade Organization, 2016). As Mr. Talib Riffai, Secretary General of the United Na-
tions World Tourism Organization, stated: “Tourism is increasingly an essential component of
export diversification for many emerging economies as well as several advanced ones” (BBC,
2016). This means that for emerging economies, tourism is a major, and sometimes even the
main, contributor to their economic activities. Furthermore, yet in advanced economies with a
wide variety of successful economic subsectors, tourism often stands for 5-10% (or more) of
their production, according to local Tourism Satellite Accounts.
However, these news items are only focusing on the economic benefits of tourism and generally
ignore potential negative effects of the tourism activity. Unfortunately examples of negative
impact are nonetheless numerous: overcrowded beaches or city squares, damaged vulnerable
heritage sites, locals caught up in traffic jams, loss of residents’ public domain, air and water
pollution, noise, litter, electricity shortage, rising cost of living and declining quality of life for
residents, pressure on local housing, intrusion in the private domain, crime, disruption of peace,
etc. Often these negative effects of tourism are both a consequence of tourism activities and
equally a threat to further development and growth, thus threatening the population in tourism
areas in at least two ways. They might suffer from direct impacts on the short turn as well as
indirect impacts and effects in the long run. Moreover, “the relationship between tourism de-
velopment and quality of life (of residents) is not unidirectional but reciprocal, and that while
tourism can affect the quality of life, quality of life of residents can also affect tourism develop-
ment” (Ridderstaat, Croes & Nijkamp, 2014 cited in Suntikul et al., 2016, p. 4).
Over recent decades the attention for sustainable development and research on the sustaina-
bility aspects of tourism growth has been rising. The wide variety of sustainability studies in the
tourism sector prove the sense of urgency and the importance that has been given to this sub-
ject. In recent years more and more destinations decide to protect their natural resources, their
inhabitants and heritage sites against an overload of tourists. Nunkoo et al. listed not less than
140 academic articles on residents’ attitudes to tourism, published between 1984 and 2010 in
RESIDENT ATTITUDES TOWARDS TOURISM
2
Annals of Tourism Research, Journal of Travel Research or Tourism Management (Nunkoo et al.,
2013). And many more have been published since 2010. Most often these studies focus on na-
ture reserves, islands or sunny beach destinations and their struggle with raising volumes of
tourists. Fewer, or even hardly any, studies focus on cultural cities. Though, the last two decades
tourism volumes in heritage cities grew at a higher pace than the average tourism growth in the
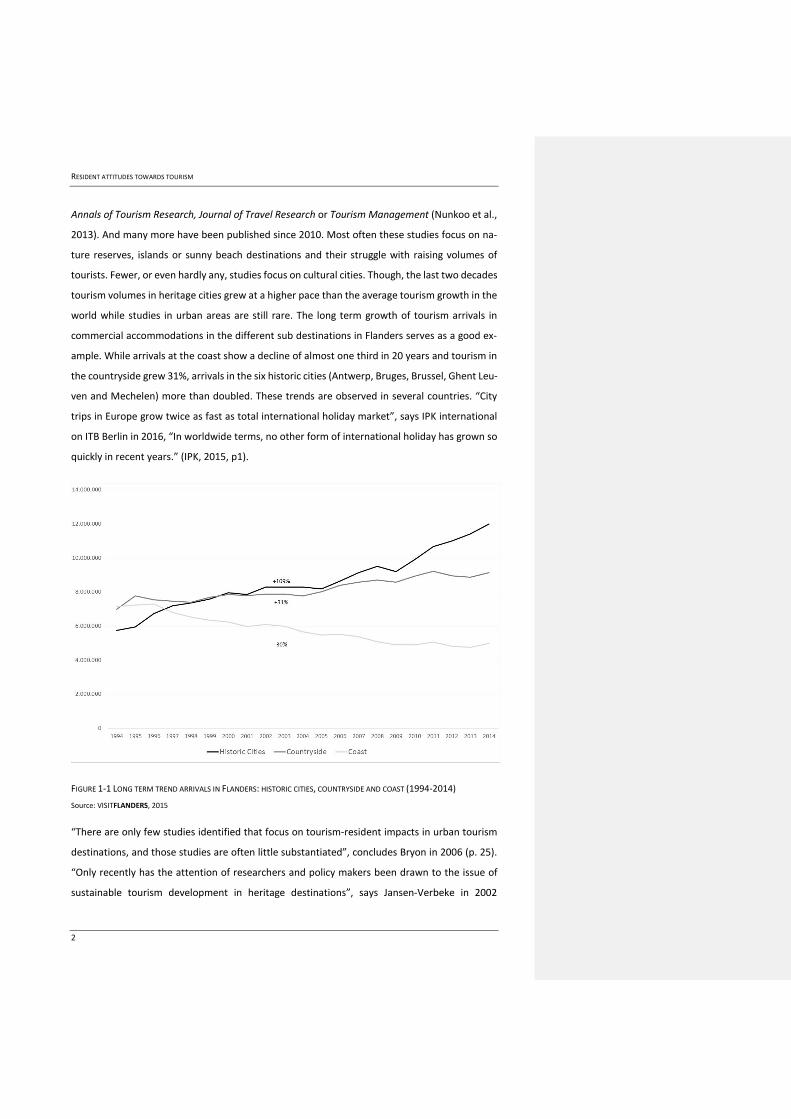
world while studies in urban areas are still rare. The long term growth of tourism arrivals in
commercial accommodations in the different sub destinations in Flanders serves as a good ex-
ample. While arrivals at the coast show a decline of almost one third in 20 years and tourism in
the countryside grew 31%, arrivals in the six historic cities (Antwerp, Bruges, Brussel, Ghent Leu-
ven and Mechelen) more than doubled. These trends are observed in several countries. “City
trips in Europe grow twice as fast as total international holiday market”, says IPK international
on ITB Berlin in 2016, “In worldwide terms, no other form of international holiday has grown so
quickly in recent years.” (IPK, 2015, p1).
FIGURE 1-1 LONG TERM TREND ARRIVALS IN FLANDERS: HISTORIC CITIES, COUNTRYSIDE AND COAST (1994-2014)
Source: VISITFLANDERS, 2015
“There are only few studies identified that focus on tourism-resident impacts in urban tourism
destinations, and those studies are often little substantiated”, concludes Bryon in 2006 (p. 25).
“Only recently has the attention of researchers and policy makers been drawn to the issue of
sustainable tourism development in heritage destinations”, says Jansen-Verbeke in 2002

RESIDENT ATTITUDES TOWARDS TOURISM
3
(2002b, p. 6). Also Ashworth (1989, p. 33 ) pointed out the “double neglect of city tourism. Tour-
ism researchers had neglected the city, though so many tourism took place there, and urbanists
had neglected tourism, despite its rapid growth and increasing influence on cities”. Boley et al.
state in 2014: “…it would be of interest to test empowerment’s influence on residents’ attitudes
toward tourism in urban settings…” a call to carry out residents’ attitude studies in historic tour-
ism cities as well (Boley et al., 2014, p. 48).
Despite the threat of overcrowded tourist places and stories about the potential negative impact
“…the dynamics of tourism affect the future of historic and heritage sites in many ways, both
good and bad” (Jansen-Verbeke, 2002b, p. 6). Decent planning, strategy building and good city
management can lead to the achievement of sustainable tourism development objectives
(Faulkner & Tideswell, 1997).
The four most important stakeholder groups in a tourism sustainability context are: tourists, the
tourism sector, the inhabitants and governments (Yang et al., 2013). Given the importance of
the locals in the tourism field and the lack of studies about them in city heritage sites this study
wants to focus on the residents’ view of the complex sustainability situation in a historic city.
The additional pressure on destinations created by the peer-to-peer accommodation websites
(like AirBnB) might have accelerated the interest in the topic. As “…residents need to become
the first-line ambassadors for a destination” (Destination Think, 2016), they have a personal
power and a personal choice to support or oppose to tourism activities in their city. Knowledge
about residents’ attitudes is an important pillar in solving possible sustainability issues in urban
heritage sites. There is the danger that if historic cities are managed in a sense that they slowly
turn into open air museums, where residents have to play their role: becoming part of the tour-
ism scene but losing their city for their own functional and recreational purposes (Jansen-
Verbeke 2002b). It is the policy makers’ responsibility to create such tourism planning, develop-
ment and marketing that residents are empowered by tourism and support tourism initiatives,
in a sustainable way. As stated by Vanhove (2002, p. 22) “The purpose of tourism policy is two-
fold: to provide maximum benefits to the stakeholders (including residents) … while minimizing
negative impacts”.
Bruges, “one of the most beautiful and well-preserved heritage sites in Europe” (Russo 2002a,
p. 32), a historic city in Flanders, will serve as a case to test an international validated model
from Boley et al. to investigate residents’ attitudes towards tourism in a historic city setting:
Residents Empowerment through Tourism Scale (RETS) (Boley et al., 2014; Boley & McGehee,
2014; Boley et al., 2015, Strzelecka et al. 2016). A secondary goal is to develop a more lean RETS

RESIDENT ATTITUDES TOWARDS TOURISM
4
model structure to facilitate and encourage other destinations to apply the same model. And
besides serving as a replication study for the RETS constructs, the gained insights in the resi-
dents’ attitudes towards tourism in Bruges will be used as input for a new strategy about carry-
ing capacity of the destination in Flanders, Belgium, for the regional DMO (Destination Manage-
ment Organization) ‘VISITFLANDERS’ as well as input for the new strategic tourism plan 2017-
2020 for tourism in Bruges.
RESIDENT ATTITUDES TOWARDS TOURISM
5
2 LITERATURE REVIEW
2.1 Introduction to sustainability in tourism in the context of the impact
on residents
In the Eighties of the 20th century the need for more sustainable activities in tourism grew rapidly
(Saarinen, 2006). Growing tourism numbers, an overall rising concern about environmental is-
sues and the general introduction of the concept of ‘sustainability’ led to a focus on sustainable
development, also in tourism. Since the Brundtland Commission’s report ‘Our Common Future’
in 1987, sustainability in tourism became a central theme in discussions on tourism policies and
management (Saarinen, 2006; WCED, 1987). In the commission’s report, sustainable develop-
ment is defined as “development that meets the needs of present without compromising the
ability of future generations to meet their own needs” (WCED, 1987, p. 41). Three elements form
the basis of the sustainability concept: the ecological, sociocultural, and economic aspect, also
known as the 3 P’s: planet, people, profit1. The focus of this thesis is to be situated mainly in the
sociocultural element of sustainability: ‘what is the impact of tourists and tourism on the quality
of life of local residents?’ However, also ecological and economic aspects will influence residents
in their process of forming a perception and creating an attitude towards tourism in their living
areas. First we will look into theoretical models for understanding tourism growth in a destina-
tion. Second, the concept of carrying capacity is explained. Then different approaches towards
apprehending residents’ attitudes will be explored. Finally we focus on a specific model called
‘Resident Empowerment Through Tourism Scale’ (RETS) (Boley et al., 2014) and how it will be
applied in the field work of this research project in Bruges.
2.2 Tourism growth and resident impact
2.2.1 Extrinsic VS extrinsic models
According to Faulkner & Tideswell there are two categories of conceptual models that try to
understand social impacts of tourism and evolution in tourism destinations: extrinsic and intrin-
sic models (Faulkner & Tideswell, 1997). Both models differ in the sense that the perspective of
looking at the issues is based on a different viewpoint. As defined by the two authors: “The
extrinsic dimension refers to characteristics of the location with respect to its role as a tourist
destination, including the nature and stage of tourism development in the area. The intrinsic
dimension refers to characteristics of members of the host community” (Faulkner & Tideswell,
1 Recently, in 2015, the United Nations added two more P’s to the model: poverty and partnership when they published 17 global sustainable development goals (United Nations, 2016)
RESIDENT ATTITUDES TOWARDS TOURISM
6
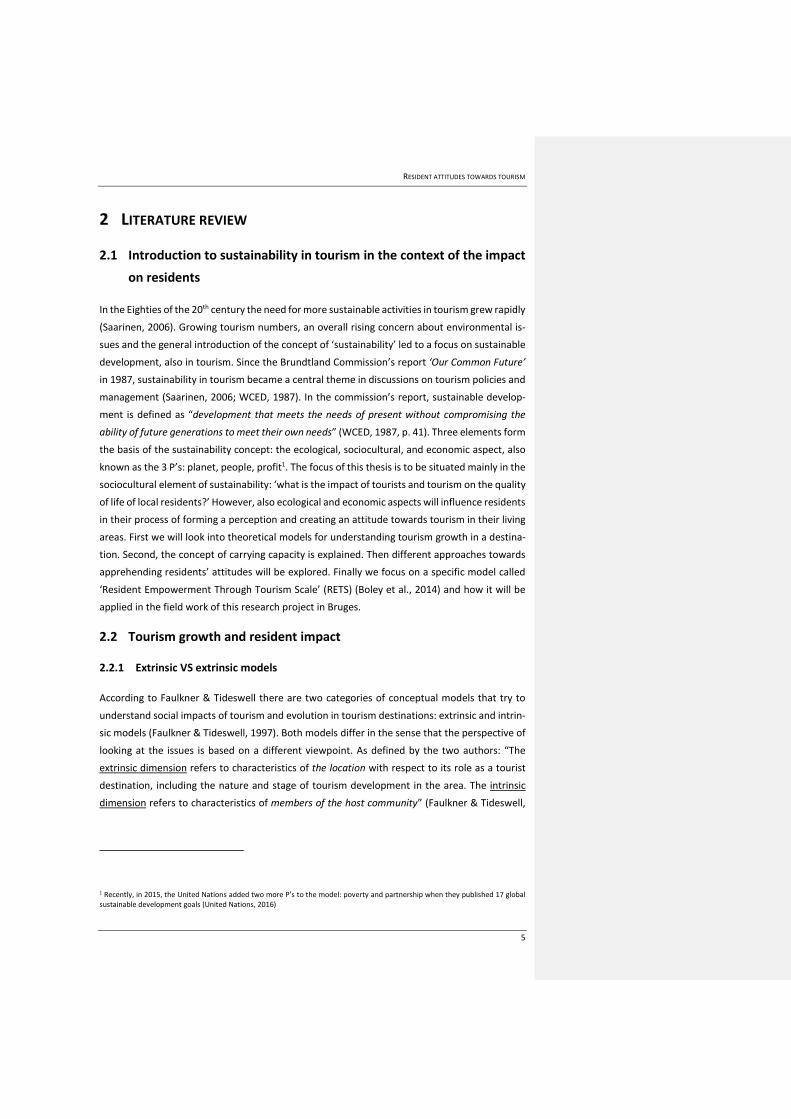
1997, p. 6). Consequently, in the first dimension the focus lies on the level of tourist activity and
the types of tourists involved in different stages. Both will have an impact on the resident-tourist
relation and thus on the host attitudes. In the latter dimension (intrinsic models) the focus is
more on the variations in the impacts of tourism within the community.
FIGURE 2-1 A FRAMEWORK FOR ANALYZING THE SOCIAL IMPACTS OF TOURISM
Source: Faulkner & Tideswell, 1997
The extrinsic models can even so be defined as ‘stage’ or ‘step’ models (Bryon, 2002). Well
known examples of extrinsic models are: ‘The index of tourist irritation’ (Irridex), by Doxey
(1975); Russo’s ‘Vicious Circle of Tourism Development in Heritage Destinations’ (Russo, 2002b);
and Butler’s ‘Tourist Area Life Cycle’ (TALC) (Butler, 1980.). In the TALC model the concept of a
product life cycle is implemented in a tourism destination context (see Figure 2-2). Extrinsic
models like TALC perceive the evolution of tourism in a destination as a homogeneous fact. In
intrinsic models however the “inherent heterogeneity of communities, reflected by the varia-
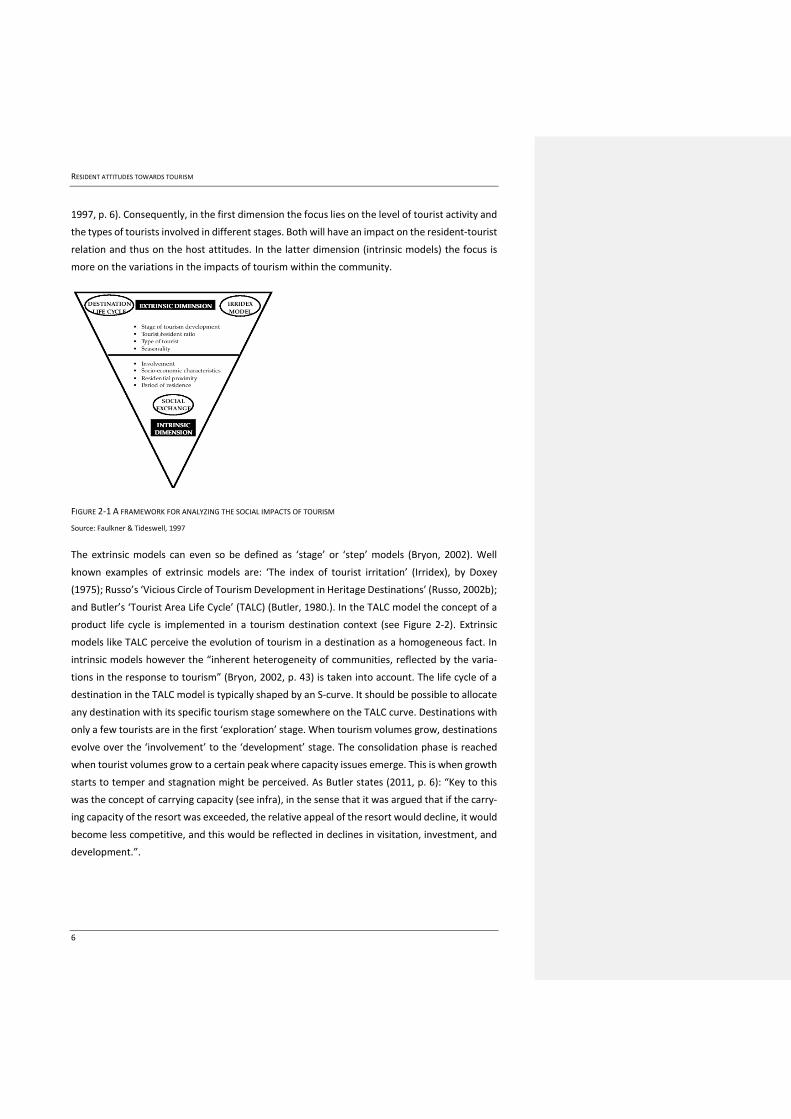
tions in the response to tourism” (Bryon, 2002, p. 43) is taken into account. The life cycle of a
destination in the TALC model is typically shaped by an S-curve. It should be possible to allocate
any destination with its specific tourism stage somewhere on the TALC curve. Destinations with
only a few tourists are in the first ‘exploration’ stage. When tourism volumes grow, destinations
evolve over the ‘involvement’ to the ‘development’ stage. The consolidation phase is reached
when tourist volumes grow to a certain peak where capacity issues emerge. This is when growth
starts to temper and stagnation might be perceived. As Butler states (2011, p. 6): “Key to this
was the concept of carrying capacity (see infra), in the sense that it was argued that if the carry-
ing capacity of the resort was exceeded, the relative appeal of the resort would decline, it would
become less competitive, and this would be reflected in declines in visitation, investment, and
development.”.
RESIDENT ATTITUDES TOWARDS TOURISM
7
FIGURE 2-2 A HYPOTHETICAL EVOLUTION OF A TOURIST AREA (TALC MODEL)
Source: Butler, 1980
Is the homogeneous Tourism Life Cycle Area model still applicable in 2016? The model has been
criticized since it was created by Butler more than 35 years ago. Butler himself in 2011 questions
if the TALC model is still relevant in today’s tourism world. Media, transport, technology and
other aspects have changed and influenced tourism flows dramatically in the last decades. Peer-
to-peer platforms, interfering with commercial activities, have an impact on tourism trends, vol-
umes, tourist behavior and residents’ activities and attitudes. Some authors criticize the meas-
urability of TALC, others state that the model was essentially only theoretical. The fact that
prices are not included in the model is criticized, together with the lack of additional stages (But-
ler, 2011). The homogeneity of the model and the difficulty to detect the tipping point towards
a new stage could be the major critics to the model.
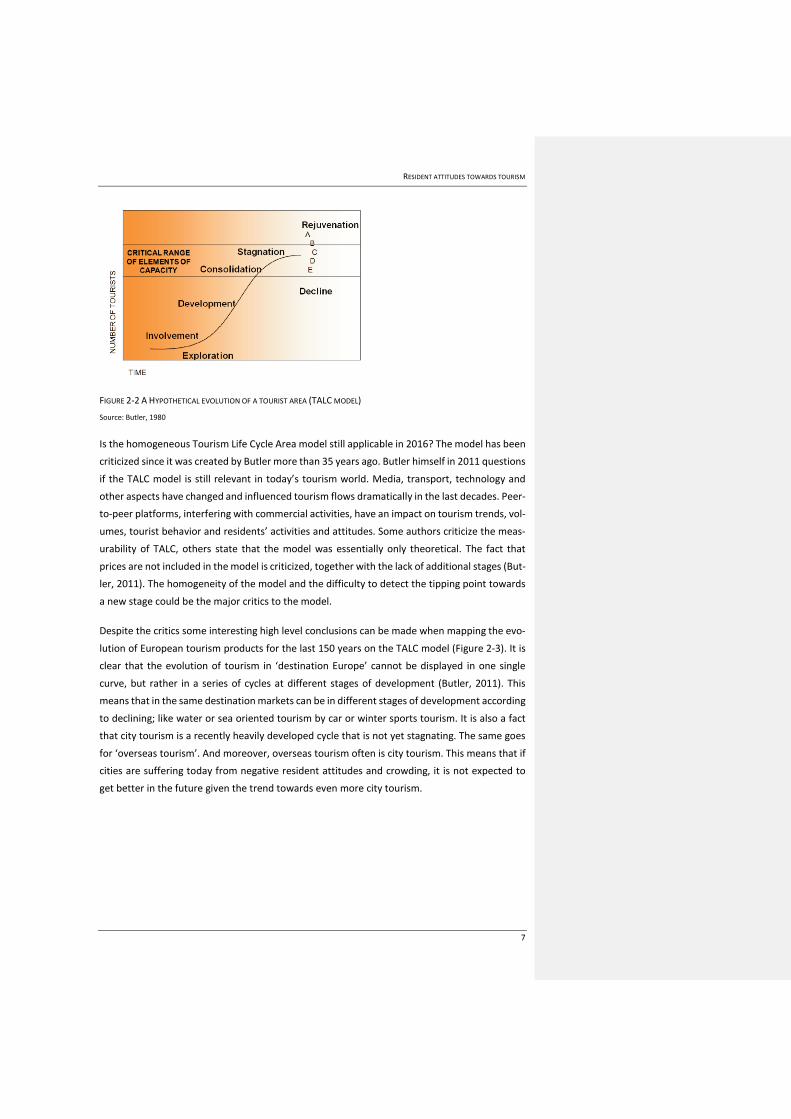
Despite the critics some interesting high level conclusions can be made when mapping the evo-
lution of European tourism products for the last 150 years on the TALC model (Figure 2-3). It is
clear that the evolution of tourism in ‘destination Europe’ cannot be displayed in one single
curve, but rather in a series of cycles at different stages of development (Butler, 2011). This
means that in the same destination markets can be in different stages of development according
to declining; like water or sea oriented tourism by car or winter sports tourism. It is also a fact
that city tourism is a recently heavily developed cycle that is not yet stagnating. The same goes
for ‘overseas tourism’. And moreover, overseas tourism often is city tourism. This means that if
cities are suffering today from negative resident attitudes and crowding, it is not expected to
get better in the future given the trend towards even more city tourism.
RESIDENT ATTITUDES TOWARDS TOURISM
8
FIGURE 2-3 EUROPEAN TOURISM PRODUCTS – A PRODUCT LIFE CYCLE APPROACH
Source: Zimmermann, 1997 in Butler, 2011
Besides extrinsic models, a well-known example of an intrinsic model is the Social Exchange The-
ory, or ‘SET’ (Andereck et al., 2005; Ap, 1990; Perdue et al., 1990). In intrinsic models in general
and SET in specific the relationship between tourists and locals is explored also on the individual
level. The basic form of human interaction is the value of the exchange of social and material
resources and people want to maximize the value of their exchange outcome (Kelley & Thibaut
1978). Given the specific focus of this thesis on a research model that is partly based on the
intrinsic social exchange model, all details of this theory will follow in the next paragraphs.
2.2.2 Crowding & carrying capacity
The aforementioned conceptual models above already indicated that either having too few or
having too many tourist or visitors can damage a (potential or mature) tourism destination.
When destinations are facing too few visitors the macro-economic input is too small for devel-
oping decent and enough attractive products, for investments, for creating growth and thus for
attracting more visitors. When tourism destinations, attractions, accommodations or city cen-
ters are facing very large numbers of visitors they might suffer from ‘crowding’ and the carrying
capacity could be exceeded. Crowding (or ‘overcrowding’) can basically take two different forms:
between tourist mutually and between tourist and locals (Neuts & Nijkamp, 2012). This proves
crowding is a subjective and not an objective aspect of tourism experience, from the tourists’ or
locals’ perceptions. This perception of crowding between tourists has been studied by Neuts
(2008) and Neuts & Nijkamp in Bruges (2012) and in different American and Canadian back coun-
try destinations (Cole & Steward, 2002; Patterson & Hammitt, 1990; Shelby, Vaske, & Heberlein,
1989; Steward & Cole, 2001; Tarrant & English, 1996). Research about the crowding perception
of residents is numerous. Most resident studies in a tourism context have at least an indirect
focus on this topic. And as seen supra, many studies were published about resident attitudes
(Nunkoo et al., 2013). Nunkoo et al. listed 140 studies about resident attitudes only in three
major international journals (Annals of Tourism Research, Tourism Management and Journal of
Travel Research).
RESIDENT ATTITUDES TOWARDS TOURISM
9
The concept of carrying capacity has found it roots in pastoral agriculture. A pasture could sup-
port a particular number of cattle. If that threshold was exceeded, the system was damaged, to
the point where it could no longer support grazing at all. “Carrying capacity as a concept
measures what level of use is sustainable”, says UNWTO (2004, p. 309). Correspondingly, ‘tour-
ism carrying capacity’, largely interrelated with crowding and sustainable tourism development,
indicates “where the upper limit of tourism development finds itself” (van der Borg, 2004). It is
the maximum number of visitors a destination can host. However in practice several different
aspects of the tourism destination’s characteristics should be taken into account in order to as-
sess the carrying capacity of a destination, not just the number of visitors. “Overall measuring
Tourism Carrying Capacity does not have to lead to a single number (threshold), like the number
of visitors”, concludes the European Commission (2002, p. xii). Different aspects of the tourism
performance should be monitored, like residents’ attitudes, tourists’ attitudes, local stakehold-
ers’ attitudes, the duration of the crowding, visitor numbers, etc. The European Commission
advises to set upper and lower limits to three components: physical-ecological, social-demo-
graphic and political-economic components. Basically this relates to the same elementary pillars
of sustainable development. Moreover, theoretical limits can develop over time, and residents’
and tourists’ norms might change. For UNWTO there is a wide range of environmental and socio-
economic factors that interact at tourism destinations. And many of them depend on the per-
ception of as well, host communities as well as tourists (UNWTO, 2004). The study that is carried
out in the context of this master’s thesis is tackling one of the aspects of the carrying capacity
issue of a historic city destination: the residents’ opinion of Bruges hosts about tourism in their
city and crowding in specific. In the following paragraph different aspects of resident attitudes
in a tourism destination are explored.
2.2.3 Resident attitudes towards tourism
2.2.3.1 Introduction
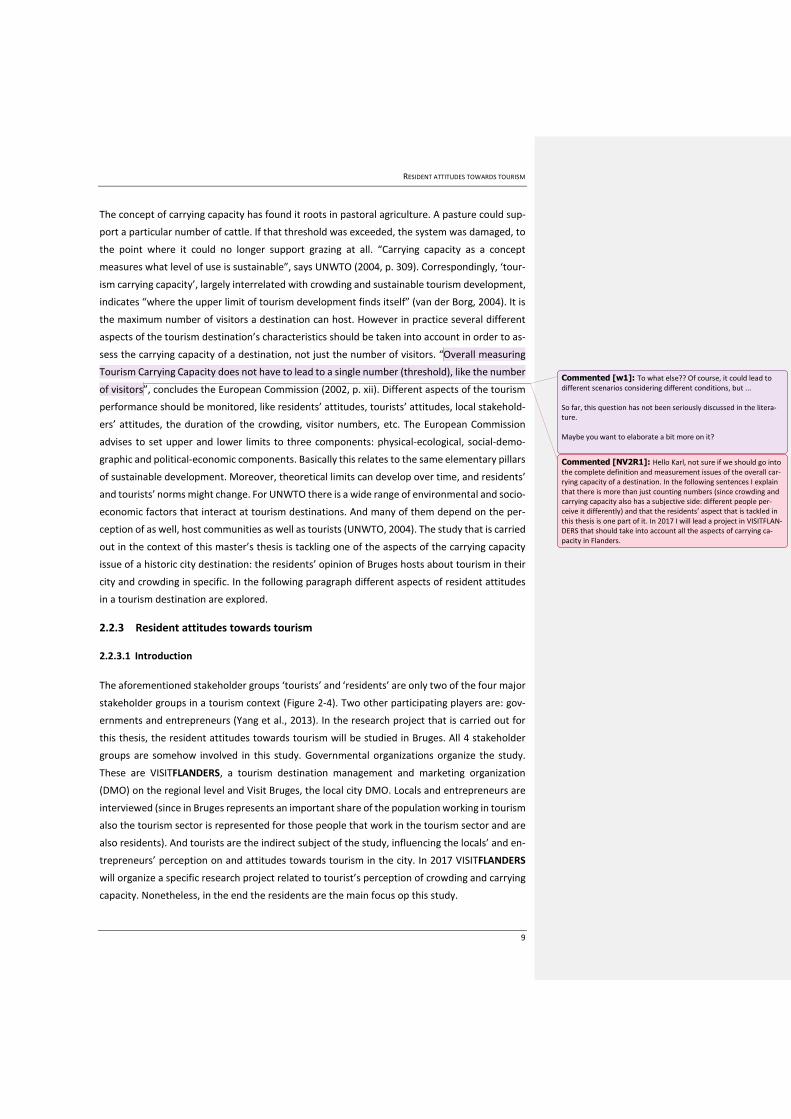
The aforementioned stakeholder groups ‘tourists’ and ‘residents’ are only two of the four major
stakeholder groups in a tourism context (Figure 2-4). Two other participating players are: gov-
ernments and entrepreneurs (Yang et al., 2013). In the research project that is carried out for
this thesis, the resident attitudes towards tourism will be studied in Bruges. All 4 stakeholder
groups are somehow involved in this study. Governmental organizations organize the study.
These are VISITFLANDERS, a tourism destination management and marketing organization
(DMO) on the regional level and Visit Bruges, the local city DMO. Locals and entrepreneurs are
interviewed (since in Bruges represents an important share of the population working in tourism
also the tourism sector is represented for those people that work in the tourism sector and are
also residents). And tourists are the indirect subject of the study, influencing the locals’ and en-
trepreneurs’ perception on and attitudes towards tourism in the city. In 2017 VISITFLANDERS
will organize a specific research project related to tourist’s perception of crowding and carrying
capacity. Nonetheless, in the end the residents are the main focus op this study.
Commented [w1]: To what else?? Of course, it could lead to different scenarios considering different conditions, but ... So far, this question has not been seriously discussed in the litera-ture. Maybe you want to elaborate a bit more on it?
Commented [NV2R1]: Hello Karl, not sure if we should go into the complete definition and measurement issues of the overall car-rying capacity of a destination. In the following sentences I explain that there is more than just counting numbers (since crowding and carrying capacity also has a subjective side: different people per-ceive it differently) and that the residents’ aspect that is tackled in this thesis is one part of it. In 2017 I will lead a project in VISITFLAN-DERS that should take into account all the aspects of carrying ca-pacity in Flanders.
RESIDENT ATTITUDES TOWARDS TOURISM
10
FIGURE 2-4 FOUR FORCES (GROUPS) IN TOURISM DEVELOPMENT
Source: Yang et al., 2013
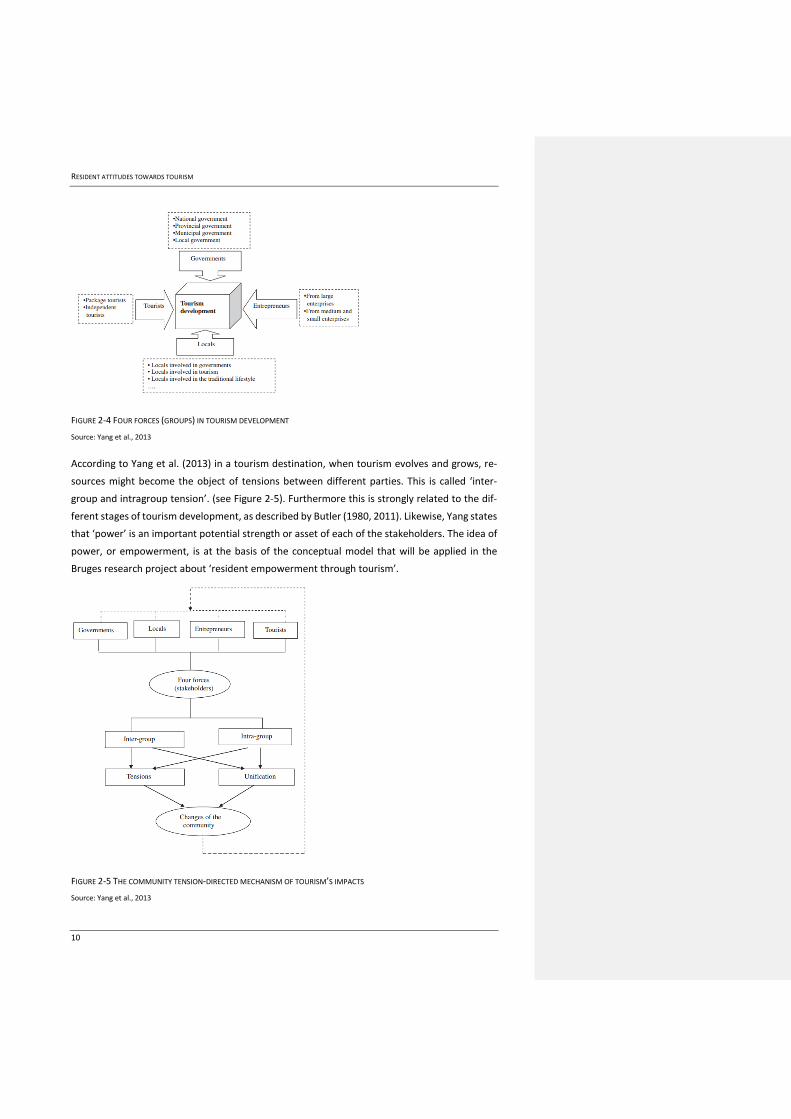
According to Yang et al. (2013) in a tourism destination, when tourism evolves and grows, re-
sources might become the object of tensions between different parties. This is called ‘inter-
group and intragroup tension’. (see Figure 2-5). Furthermore this is strongly related to the dif-
ferent stages of tourism development, as described by Butler (1980, 2011). Likewise, Yang states
that ‘power’ is an important potential strength or asset of each of the stakeholders. The idea of
power, or empowerment, is at the basis of the conceptual model that will be applied in the
Bruges research project about ‘resident empowerment through tourism’.
FIGURE 2-5 THE COMMUNITY TENSION-DIRECTED MECHANISM OF TOURISM’S IMPACTS
Source: Yang et al., 2013
RESIDENT ATTITUDES TOWARDS TOURISM
11
2.2.4 Social Exchange Theory
Before elaborating on the importance of power and empowerment in the process of tourism
development and in the interrelations of the different stakeholder groups we shed a light on
how for a long time resident studies in tourism were approached from a formal or economic
point of view in the ‘Social Exchange Theory’. The concept of the ‘Social Exchange Theory’ or
‘SET’ has its origin in economic theory and was modified by Thibaut & Kelley already in the Fifties
of the 20th century when studying the psychology of groups (1959) and was further developed
by Perdue, Long & Allen (Perdue et al., 1987; Long et al., 1990; Perdue et al., 1990). The theory
focuses on “the perceptions of the relative costs and benefits of relationships and their implica-
tions for relationship satisfaction” (Ward & Berno, 2011, p. 1557). Translated to a tourism con-
text it would mean that the attitude of residents in a tourism destination towards tourism and
their support for tourism will be determined by the evaluation of the benefits of tourism for
them (Andereck et al., 2005). Residents create an opinion about the benefits and costs of tour-
ism on their communities, about the positive versus the negative impact and their support for
tourism, which is covered by SET. Bryon states: “the assessed benefits and disadvantages of
tourism are nothing more than the perceived positive and negative impacts on the economic,
socio-cultural and spatial level as well as on the individual (micro) and collective (macro) level”
(2006, p. 40). If the resident believes the benefits from tourism outweigh the disadvantages, he
or she is more likely to choose for the ‘exchange’, to support tourism and to have a positive
attitude towards tourists, than when he or she thinks that the negative impacts have a higher
weight. According to Boley and Perdue (Boley et al., 2014), Emerson summarized SET as “a two-
sides, mutually contingent, and mutually rewarding process involving ‘transaction’ or simply ‘ex-
change’ and claimed SET different from economic exchange theory as it expanded the neoclas-
sical understanding of rationality to include the variability inherent in relational exchanges” (Em-
erson, 1976; cited in Boley et al., 2014, p. 35).
SET could also be one of the reasons behind development of, and investments in, tourism in a
destination. Indeed, because locals believe a stronger and better developed destination might
create more benefits from tourism for them, these developments will be supported and orga-
nized. The key issue in resident studies based on SET is that academics believe(d) that the be-
havior of residents could be anticipated by looking at the perception of benefits and disad-
vantages of tourism in their environment.
This theory has dominated research models in resident studies for a long time. 56% of the stud-
ies about residents’ attitudes towards tourism in theoretical studies that were detected by
Nunkoo et al. in academic articles published between 1984 and 2010 in Annals of Tourism Re-
search, Journal of Travel Research or Tourism Management were using SET (Nunkoo et al., 2013).
In many studies one of the conclusions of applying SET is that residents who have economic
RESIDENT ATTITUDES TOWARDS TOURISM
12
benefits from tourism, people that work in the tourism sector or whose job is related to the
tourism sector, have more positive attitudes towards tourism and tend to support tourism more
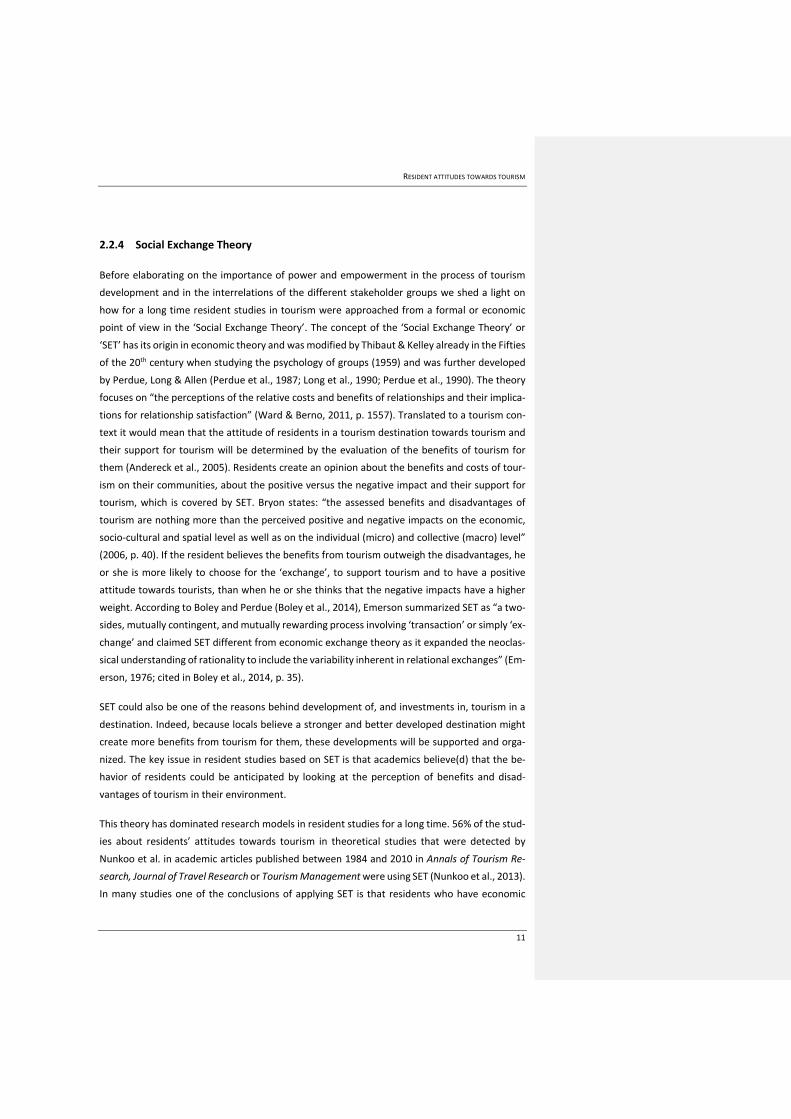
(Haley et al., 2005; Haralambopoulos & Pizam, 1996). This is visualized in Figure 2-6: based on
SET the five relations in this model should be confirmed. First of all, perceived positive impacts
should have a positive relationship with ‘support for tourism’ (1) and perceived negative impacts
should have a negative relationship with ‘support’ (2) (Boley et al., 2014). Moreover, a high level
of perceived personal economic benefits should lead to lower scores on perceived negative im-
pacts from tourism (3) and higher scores on perceived positive impacts (4). It is also expected
and proved in empirical research that there is a positive relationship between perceived per-
sonal economic benefits and the overall support for tourism (5).
FIGURE 2-6 THE MECHANISM OF SET IN A THEORETICAL MODEL: THE RELATION BETWEEN ECONOMIC BENEFITS FROM TOUR-
ISM, PERCEIVED IMPACTS AND SUPPORT
Source: author, based on Boley et al., 2014. - red arrows are expected negative relationships, green are positive; green relationship
numbers are supported hypotheses, red numbers are not supported hypotheses (in 3 Virginia counties - US)
Boley, Perdue et al. (2014) tested these hypotheses in rural tourism areas in Virginia, in the US.
Relationships 1 and 2 (Figure 2-6) are likely to be true: residents that perceive more positive
impacts from tourism tend to support tourism more. As well as the opposite: people, who see
negative impacts more, tend to support tourism less. For perceived personal economic benefit
the relationship with perceived impact was not as expected (3 and 4). It appears to be untrue
that there is an inverse relationship between personal economic benefit and perceived impacts.
Consequently, people whose income is related to tourism do not perceive less negative nor
more positive impact from tourism. Or if stated more positively: people who do not have a per-
sonal economic benefit from tourism don’t tend to perceive the impacts from tourism less pos-
itive. The last relationship (5) between perceived personal economic benefits and support for
tourism was true in the Virginia case. Hosts with personal benefits may not perceive positive
impact more, but they do support tourism more. In the study that is carried out with Bruges
residents in the framework of this thesis the same hypotheses will be tested.
SET was a step forward in the search for capturing resident attitudes in tourism destinations in
a theory or a model. Compared to extrinsic models like Butler’s TALC that only perceive the
tourism system as a homogeneous reality SET recognizes the heterogeneous nature of the host
Personal Economic
Benefit
Perceived Negative
Impacts of Tourism
Perceived Positive
Impacts of Tourism
Support for
Tourism
1
2 3
4
5
Commented [w3]: Doesn’t this appear like a contradiction to the direct relationship between economic benefit and support (5)? May this not also be an ethical issue? People who depend on tour-ism may support tourism development but may not be willing to get involved in the discussion about positive or negative impacts of tourism.
Commented [NV4R3]: Indeed; but also they are more in con-tact with tourists and see the negative aspects of it.
RESIDENT ATTITUDES TOWARDS TOURISM
13
community (Boley et al., 2014). However, experiences with SET and later insights in the dynam-
ics of tourism in a host community lead to further expanding theories focusing on more than the
impact of economic thinking of residents on their attitudes and behavior (Woosnam et al., 2009;
Boley et al., 2014; Boley & McGehee, 2014; McGehee and Andereck, 2004). Bryon cites Pearce
et al. when criticizing the SET theory, saying that Ap in 1992 concluded that social exchange
processes will take place as well on the individual level as on the collective level without making
a link between personal weighing of costs and benefits and the advantages of advantages versus
disadvantages of tourism for the community as a whole (Pearce et al., 1996). As proposed by
Látková and Vogt (2012) cited by Boley et al. (2014, p. 36), a solution for expanding SET to other
realities of resident attitudes should be “the application of social exchange theory in conjunction
with another theory, since the combination might provide a better insight into resident attitudes
towards tourism.” This insight was based on Weber’s ‘theory of Formal and Substantive Ration-
ality’ (WFSR) and lead to a new model introduced by Boley & McGehee (2014) and Boley, McGe-
hee, Perdue and Long (2014): ‘Residents Empowerment through Tourism Scale’ or RETS.
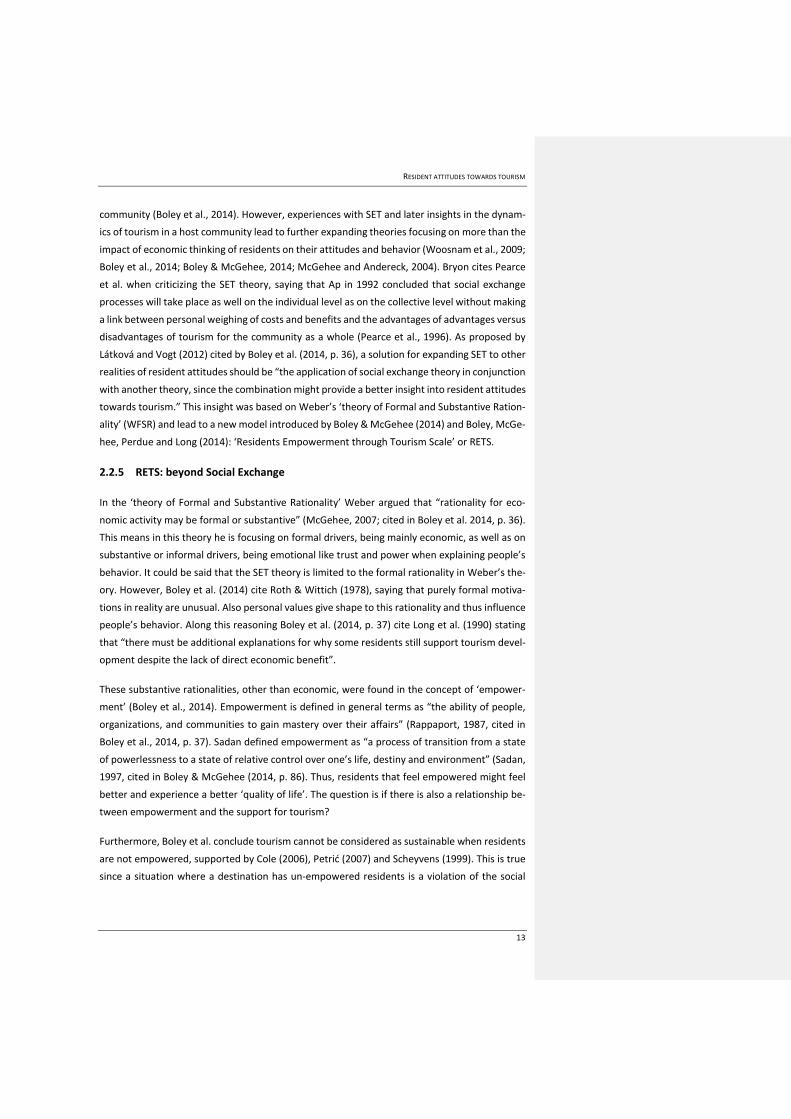
2.2.5 RETS: beyond Social Exchange
In the ‘theory of Formal and Substantive Rationality’ Weber argued that “rationality for eco-
nomic activity may be formal or substantive” (McGehee, 2007; cited in Boley et al. 2014, p. 36).
This means in this theory he is focusing on formal drivers, being mainly economic, as well as on
substantive or informal drivers, being emotional like trust and power when explaining people’s
behavior. It could be said that the SET theory is limited to the formal rationality in Weber’s the-
ory. However, Boley et al. (2014) cite Roth & Wittich (1978), saying that purely formal motiva-
tions in reality are unusual. Also personal values give shape to this rationality and thus influence
people’s behavior. Along this reasoning Boley et al. (2014, p. 37) cite Long et al. (1990) stating
that “there must be additional explanations for why some residents still support tourism devel-
opment despite the lack of direct economic benefit”.
These substantive rationalities, other than economic, were found in the concept of ‘empower-
ment’ (Boley et al., 2014). Empowerment is defined in general terms as “the ability of people,
organizations, and communities to gain mastery over their affairs” (Rappaport, 1987, cited in
Boley et al., 2014, p. 37). Sadan defined empowerment as “a process of transition from a state
of powerlessness to a state of relative control over one’s life, destiny and environment” (Sadan,
1997, cited in Boley & McGehee (2014, p. 86). Thus, residents that feel empowered might feel
better and experience a better ‘quality of life’. The question is if there is also a relationship be-
tween empowerment and the support for tourism?
Furthermore, Boley et al. conclude tourism cannot be considered as sustainable when residents
are not empowered, supported by Cole (2006), Petrić (2007) and Scheyvens (1999). This is true
since a situation where a destination has un-empowered residents is a violation of the social
RESIDENT ATTITUDES TOWARDS TOURISM
14
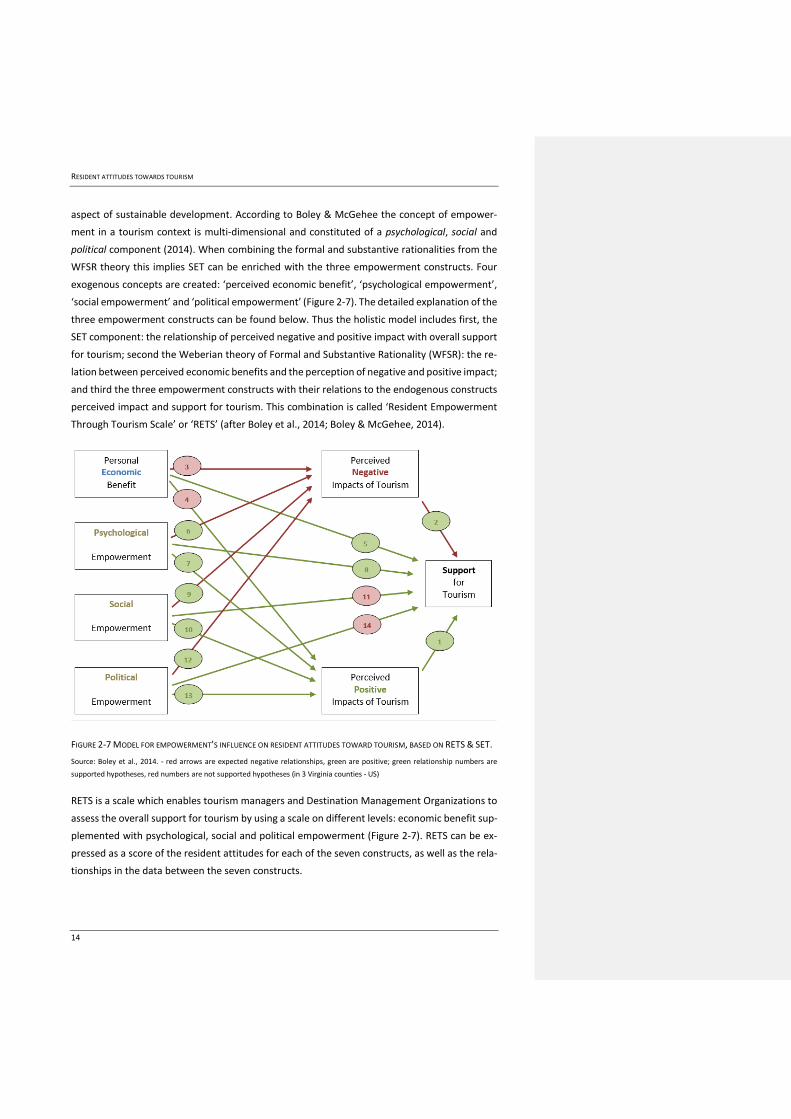
aspect of sustainable development. According to Boley & McGehee the concept of empower-
ment in a tourism context is multi-dimensional and constituted of a psychological, social and
political component (2014). When combining the formal and substantive rationalities from the
WFSR theory this implies SET can be enriched with the three empowerment constructs. Four
exogenous concepts are created: ‘perceived economic benefit’, ‘psychological empowerment’,
‘social empowerment’ and ‘political empowerment’ (Figure 2-7). The detailed explanation of the
three empowerment constructs can be found below. Thus the holistic model includes first, the
SET component: the relationship of perceived negative and positive impact with overall support
for tourism; second the Weberian theory of Formal and Substantive Rationality (WFSR): the re-
lation between perceived economic benefits and the perception of negative and positive impact;
and third the three empowerment constructs with their relations to the endogenous constructs
perceived impact and support for tourism. This combination is called ‘Resident Empowerment
Through Tourism Scale’ or ‘RETS’ (after Boley et al., 2014; Boley & McGehee, 2014).
FIGURE 2-7 MODEL FOR EMPOWERMENT’S INFLUENCE ON RESIDENT ATTITUDES TOWARD TOURISM, BASED ON RETS & SET.
Source: Boley et al., 2014. - red arrows are expected negative relationships, green are positive; green relationship numbers are
supported hypotheses, red numbers are not supported hypotheses (in 3 Virginia counties - US)
RETS is a scale which enables tourism managers and Destination Management Organizations to
assess the overall support for tourism by using a scale on different levels: economic benefit sup-
plemented with psychological, social and political empowerment (Figure 2-7). RETS can be ex-
pressed as a score of the resident attitudes for each of the seven constructs, as well as the rela-
tionships in the data between the seven constructs.

RESIDENT ATTITUDES TOWARDS TOURISM
15
2.2.5.1 Psychological empowerment
According to Boley et al. (2014, p. 38) psychological empowerment applies when “individual’s
pride and self-esteem are enhanced by the reactions of outsiders who recognize the uniqueness
and value of a community”. The construct of psychological empowerment and its relation to-
wards the perceived impact of tourism and the support for tourism was tested for the first time
in 2014 in three Virginia counties by Boley, McGehee, Perdue and Long (Boley et al., 2014). In
this study the conclusions with regards to the relationship of psychological empowerment with
perceived impact from tourism on one hand and with support for tourism on the other are as
follows (see relations 6, 7 and 8 in Figure 2-7): first, there is a negative relationship between
perceived psychological empowerment and perceived negative impacts from tourism (6); sec-
ond, there is a positive relationship between perceived psychological empowerment and per-
ceived positive impacts from tourism (7); and third, there is a positive relationship between per-
ceived psychological empowerment and overall support for tourism (8). This means in the study
in a rural area in the US, residents that show pride about their community, village, city or region
thanks to tourism tend to see more positive impacts from tourism, tend to see less negative
impacts from tourism and tend to support tourism more, than those residents who are less
proud of their environment (Boley et al., 2014). There are interesting consequences related to
this conclusion. This leads to the assumption that by organizing internal residents’ campaigns to
raise pride in the community not only the positive perception of tourism impact can be im-
proved, but also the general support for tourism. And knowing that residents that support tour-
ism are better ambassadors for tourism activities is a very relevant and practical fact.
In our resident study in Bruges it will be explored if this relation between psychological empow-
erment and perceived impact of tourism and support for tourism can also be found in a crowded
cultural heritage destination.
2.2.5.2 Social empowerment
In social empowerment the cohesion and collaboration in a community are essential require-
ments of local economic development (Kay, 2006; cited in Boley et al., 2014). If this is projected
to a tourism setting it means that socially empowered residents feel more connected and per-
ceive the positive social impact of tourism on their environment. Similar to psychological em-
powerment the same relations with perceived positive and negative impact are expected as well
as the same relation with overall support for tourism. In the study in the Virginia counties the
positive relationship between a high level of social empowerment and the perception of positive
impact from tourism was proven indeed (relation 10, in Figure 2-7), as well as the negative rela-
tion between social empowerment and perceived negative impact from tourism (relation 9).
However, the direct relation of social empowerment with the construct of ‘support for tourism’
is not present (11). Nonetheless there was an indirect relation between social empowerment
RESIDENT ATTITUDES TOWARDS TOURISM
16
and ‘support’ since there is a significant relation between perceived impact and overall support
for tourism (as seen in Figure 2-6).
In our residents’ research in Bruges it will be explored if the same relations between social em-
powerment and perceived impact of tourism and support for tourism will also be found.
2.2.5.3 Political empowerment
The last empowerment construct is political empowerment and is related to participation and
involvement into the decision making and policy planning process of tourism development in
the community, city or region. Do residents feel they are fairly presented and have outlets to
share their concerns about tourism development (Boley et al., 2014)? Politically empowered
residents feel they have a voice in this process. However, the question is if there is a relationship
between political empowerment and the described constructs related to perceived impacts and
support for tourism? In the US study in Virginia the same relationships were found as with the
social empowerment construct: no direct relationship between political empowerment and sup-
port for tourism, but a positive relation with perceived positive impact and a negative relation
with perceived negative impact. It means that people who have a voice, who feel involved in
tourism planning tend to experience tourism impact in a more positive way (and tend to see less
negative impact). As a consequence they have a bigger chance to support tourism more, given
the positive effect on perceived positive impact. In our Bruges resident survey these relation-
ships will be explored in a European historic tourism destination.
2.3 Conclusion
In this chapter we discovered the long history of resident surveys in a tourism context. However,
tourism studies focusing on residents in historic city destinations are rare. The Bruges residents’
attitudes towards tourism survey wants to meet this actual need, given the strong increase of
visitors in European heritage cities in recent years and the continued forecasted growth. After a
review of different models that tackle tourism growth and the impact on residents from differ-
ent angles, the concepts of crowding and carrying capacity were highlighted in this context. Fi-
nally the RETS model was introduced. In combination with SET, RETS offers a conceptual frame-
work for residents’ attitudes studies, based on Weber’s ‘theory of Formal and Substantive Ra-
tionality’ and the empowerment theory. In the next chapter the methodological topics are ex-
plained, after a detailed description of the research area: the historic city of Bruges.
RESIDENT ATTITUDES TOWARDS TOURISM
17
3 RESEARCH AREA AND METHODOLOGY
3.1 Research area: the city of Bruges
In this chapter all Bruges key indicators of the accommodation capacity and demand side will be
explored together with insights in the concept of tourism intensity rates as well as the visitor’s
opinion and satisfaction about the city. First we look into the history of this beautiful city.
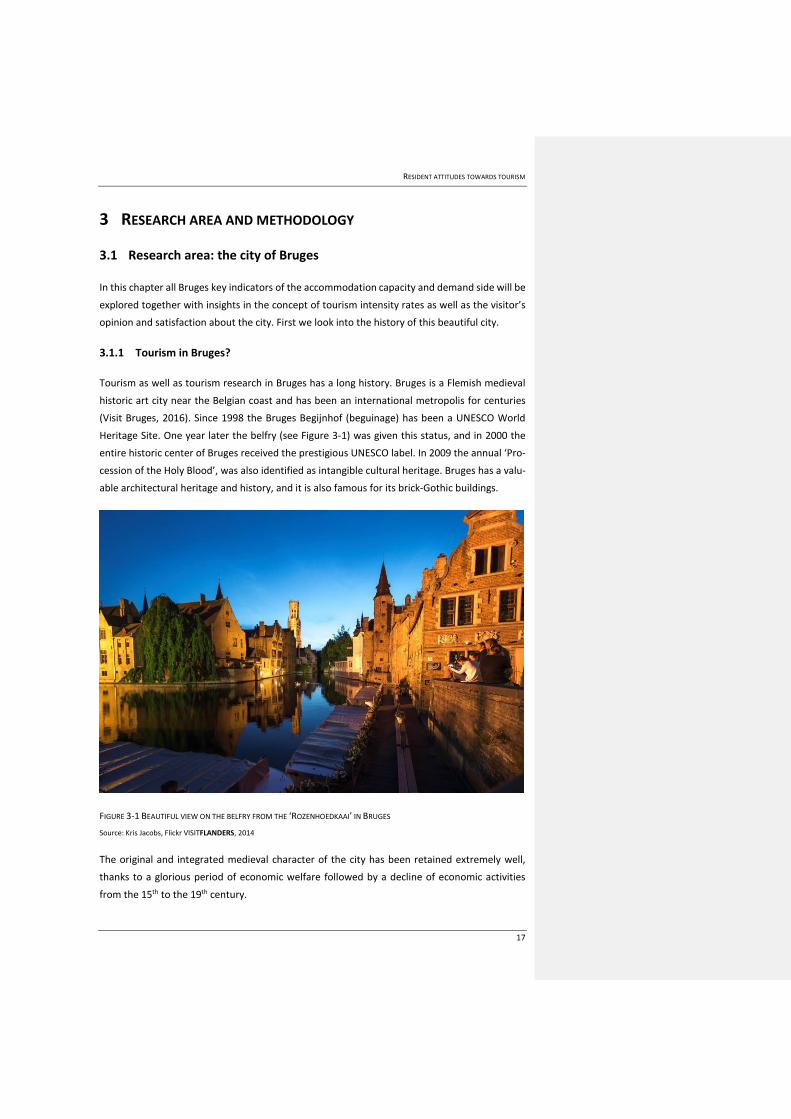
3.1.1 Tourism in Bruges?
Tourism as well as tourism research in Bruges has a long history. Bruges is a Flemish medieval
historic art city near the Belgian coast and has been an international metropolis for centuries
(Visit Bruges, 2016). Since 1998 the Bruges Begijnhof (beguinage) has been a UNESCO World
Heritage Site. One year later the belfry (see Figure 3-1) was given this status, and in 2000 the
entire historic center of Bruges received the prestigious UNESCO label. In 2009 the annual ‘Pro-
cession of the Holy Blood’, was also identified as intangible cultural heritage. Bruges has a valu-
able architectural heritage and history, and it is also famous for its brick-Gothic buildings.
FIGURE 3-1 BEAUTIFUL VIEW ON THE BELFRY FROM THE ‘ROZENHOEDKAAI’ IN BRUGES
Source: Kris Jacobs, Flickr VISITFLANDERS, 2014
The original and integrated medieval character of the city has been retained extremely well,
thanks to a glorious period of economic welfare followed by a decline of economic activities
from the 15th to the 19th century.
RESIDENT ATTITUDES TOWARDS TOURISM
18
The economy in Bruges boomed from the 11th until the 14th century induced by international
trade, mainly wool, and thanks to the import of resources and the export of finished products
(Jansen Verbeke, 2002a). Until 1450 for many decades Bruges was a leading commercial and
financial metropolis in Europe. The rich city center was occupied by merchants, nobles, artists
and civil servants, who lived in comfortable and often beautiful brick houses (Bryon, 2003). “The
urban morphology of streets, squares, walls and the social differentiation in urban quarters,
which is nowadays a major tourist asset, dates back to the 13th and 14th centuries. In addition to
this medieval structure, the architectural heritage of the 15th and 16th century is most valuable.
The industrial revolution and its impact on urban structure and morphology did not dramatically
change the city. In fact the poverty of the 19th century has become a tourist asset in the 20th
century.” (Jansen-Verbeke, 2002a, p. 4).
Thanks to its rich history, with all beautiful historic buildings, picturesque lanes, water canals
and top level museums Bruges attracts millions of visitors per annum. Travel guides like Lonely
Planet describe Bruges as “If you set out to design a fairy-tale medieval town, it would be hard
to improve on central Bruges (Brugge in Dutch). Picturesque cobbled lanes and dreamy canals
link photogenic market squares lined with soaring towers, historic churches and old white-
washed almshouses. And there’s plenty of it.” (Lonely Planet, 2016). However, travel guides
even so mention the drawback of this success: “The only downside is that everyone knows. That
means that there’s a constant crush of tourists in the center” (Lonely Planet 2016). Rough Guide
combines the positive attention to Bruges as one of the ‘must sees’ with realism about the num-
ber of tourist: “It’s true that Bruges’ reputation as one of the most perfectly preserved medieval
cities in western Europe has made it the most popular tourist destination in Belgium, packed
with visitors throughout the season. Inevitably, the crowds tend to overwhelm the city, but
you’d be mad to come to Flanders and miss the place.” (Rough Guide, 2016).
Is it true that Bruges with all the beautiful attractions, the unique preserved heritage sites and
the opportunity to have an authentic tourism experience, might become victim of its own suc-
cess? In 2002 Jansen-Verbeke already declared that “the historical city of Bruges has indeed
reached a critical stage in its development as tourist destination” (Jansen-Verbeke, 2002b, p. 7).
In the next paragraphs Bruges tourism volumes over recent years will be explored together with
tourism intensity indicators who give a theoretical insight in tourism pressure on the tourist his-
toric city.
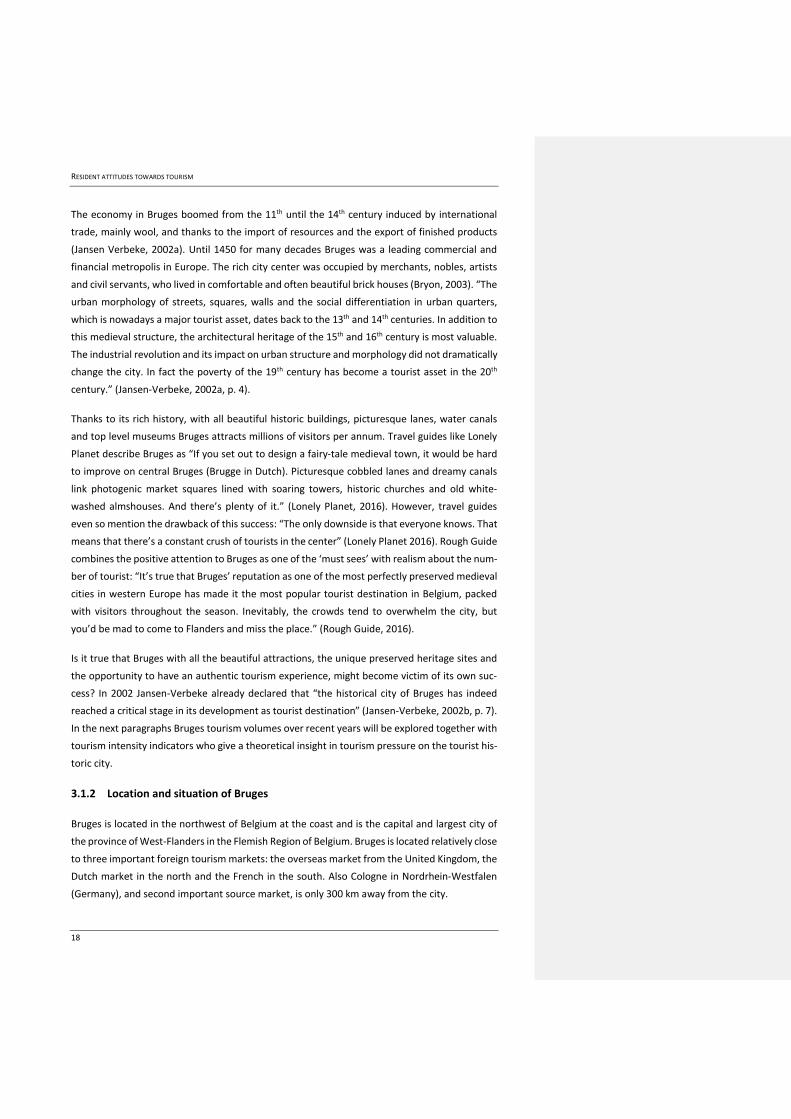
3.1.2 Location and situation of Bruges
Bruges is located in the northwest of Belgium at the coast and is the capital and largest city of
the province of West-Flanders in the Flemish Region of Belgium. Bruges is located relatively close
to three important foreign tourism markets: the overseas market from the United Kingdom, the
Dutch market in the north and the French in the south. Also Cologne in Nordrhein-Westfalen
(Germany), and second important source market, is only 300 km away from the city.
RESIDENT ATTITUDES TOWARDS TOURISM
19
FIGURE 3-2 LOCATION OF BRUGES
Source: Worldatlas, 2016
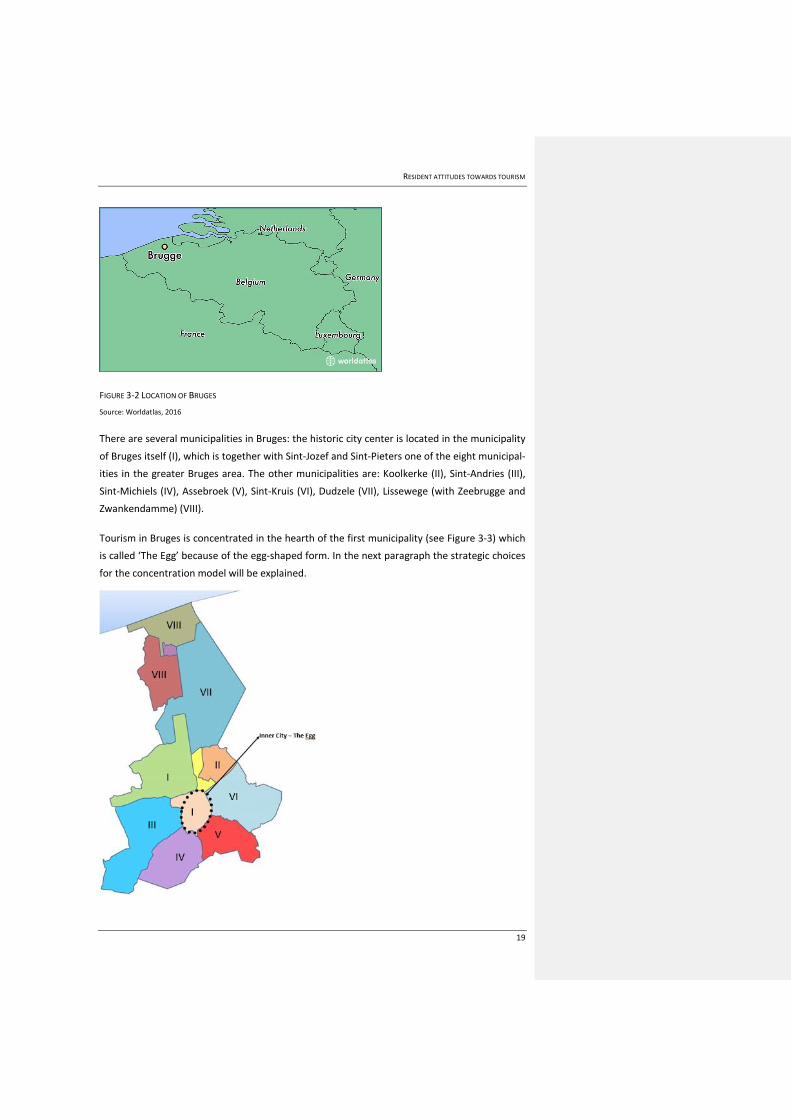
There are several municipalities in Bruges: the historic city center is located in the municipality
of Bruges itself (I), which is together with Sint-Jozef and Sint-Pieters one of the eight municipal-
ities in the greater Bruges area. The other municipalities are: Koolkerke (II), Sint-Andries (III),
Sint-Michiels (IV), Assebroek (V), Sint-Kruis (VI), Dudzele (VII), Lissewege (with Zeebrugge and
Zwankendamme) (VIII).
Tourism in Bruges is concentrated in the hearth of the first municipality (see Figure 3-3) which
is called ‘The Egg’ because of the egg-shaped form. In the next paragraph the strategic choices
for the concentration model will be explained.
RESIDENT ATTITUDES TOWARDS TOURISM
20
FIGURE 3-3 THE BRUGES MUNICIPALITIES AND “THE EGG”
Source: Brugse Maatschappij voor Huisvestiging, 2016
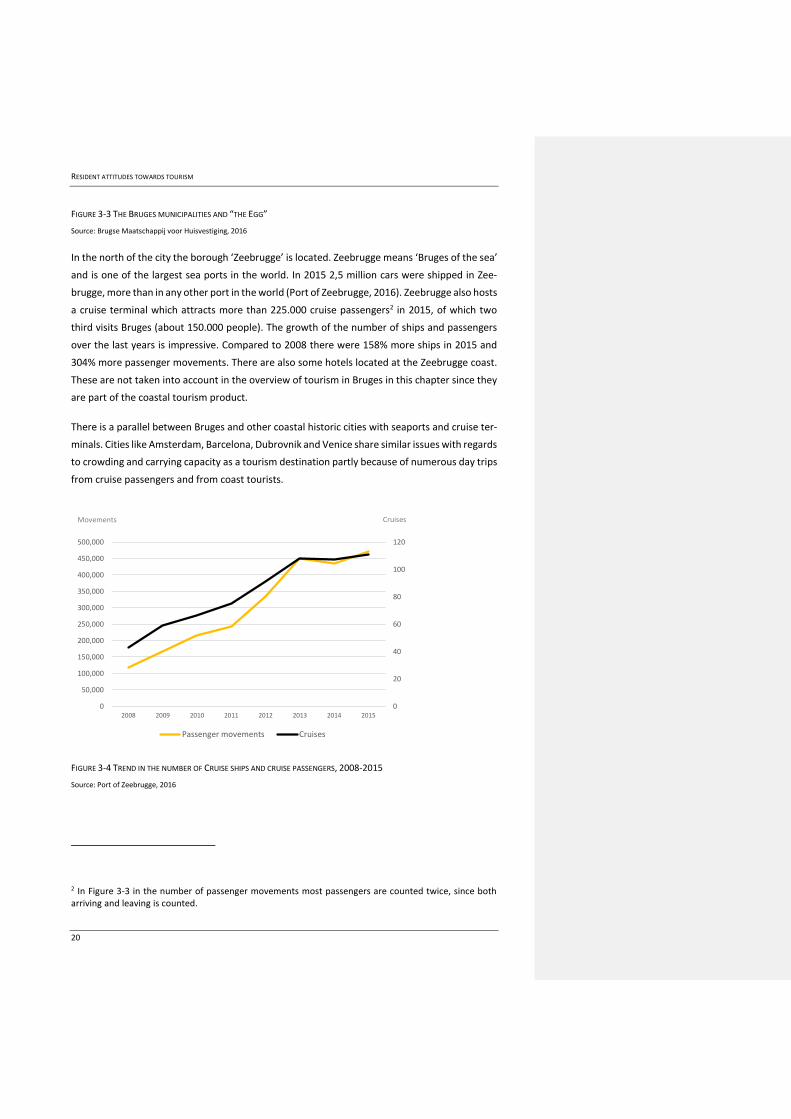
In the north of the city the borough ‘Zeebrugge’ is located. Zeebrugge means ‘Bruges of the sea’
and is one of the largest sea ports in the world. In 2015 2,5 million cars were shipped in Zee-
brugge, more than in any other port in the world (Port of Zeebrugge, 2016). Zeebrugge also hosts
a cruise terminal which attracts more than 225.000 cruise passengers2 in 2015, of which two
third visits Bruges (about 150.000 people). The growth of the number of ships and passengers
over the last years is impressive. Compared to 2008 there were 158% more ships in 2015 and
304% more passenger movements. There are also some hotels located at the Zeebrugge coast.
These are not taken into account in the overview of tourism in Bruges in this chapter since they
are part of the coastal tourism product.
There is a parallel between Bruges and other coastal historic cities with seaports and cruise ter-
minals. Cities like Amsterdam, Barcelona, Dubrovnik and Venice share similar issues with regards
to crowding and carrying capacity as a tourism destination partly because of numerous day trips
from cruise passengers and from coast tourists.
FIGURE 3-4 TREND IN THE NUMBER OF CRUISE SHIPS AND CRUISE PASSENGERS, 2008-2015
Source: Port of Zeebrugge, 2016
2 In Figure 3-3 in the number of passenger movements most passengers are counted twice, since both arriving and leaving is counted.
0
20
40
60
80
100
120
0
50,000
100,000
150,000
200,000
250,000
300,000
350,000
400,000
450,000
500,000
2008 2009 2010 2011 2012 2013 2014 2015
Passenger movements Cruises
Cruises Movements
RESIDENT ATTITUDES TOWARDS TOURISM
21
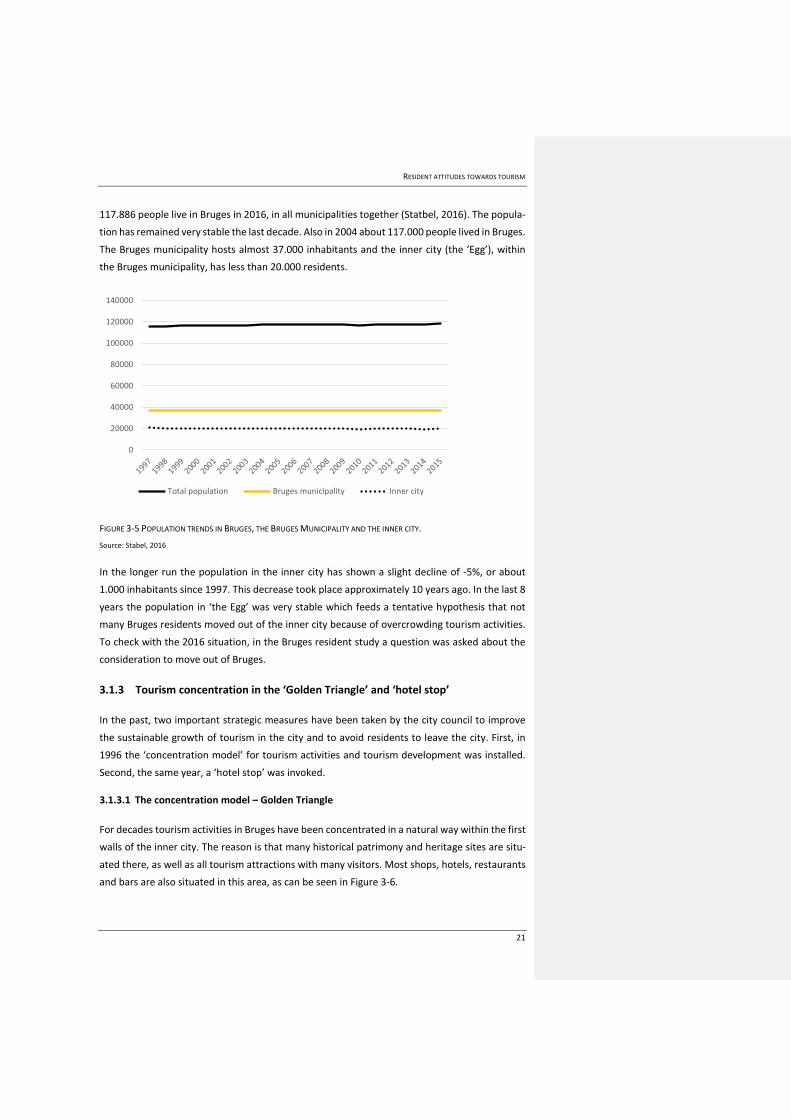
117.886 people live in Bruges in 2016, in all municipalities together (Statbel, 2016). The popula-
tion has remained very stable the last decade. Also in 2004 about 117.000 people lived in Bruges.
The Bruges municipality hosts almost 37.000 inhabitants and the inner city (the ‘Egg’), within
the Bruges municipality, has less than 20.000 residents.
FIGURE 3-5 POPULATION TRENDS IN BRUGES, THE BRUGES MUNICIPALITY AND THE INNER CITY.
Source: Stabel, 2016
In the longer run the population in the inner city has shown a slight decline of -5%, or about
1.000 inhabitants since 1997. This decrease took place approximately 10 years ago. In the last 8
years the population in ‘the Egg’ was very stable which feeds a tentative hypothesis that not
many Bruges residents moved out of the inner city because of overcrowding tourism activities.
To check with the 2016 situation, in the Bruges resident study a question was asked about the
consideration to move out of Bruges.
3.1.3 Tourism concentration in the ‘Golden Triangle’ and ‘hotel stop’
In the past, two important strategic measures have been taken by the city council to improve
the sustainable growth of tourism in the city and to avoid residents to leave the city. First, in
1996 the ‘concentration model’ for tourism activities and tourism development was installed.
Second, the same year, a ‘hotel stop’ was invoked.
3.1.3.1 The concentration model – Golden Triangle
For decades tourism activities in Bruges have been concentrated in a natural way within the first
walls of the inner city. The reason is that many historical patrimony and heritage sites are situ-
ated there, as well as all tourism attractions with many visitors. Most shops, hotels, restaurants
and bars are also situated in this area, as can be seen in Figure 3-6.
0
20000
40000
60000
80000
100000
120000
140000
Total population Bruges municipality Inner city
RESIDENT ATTITUDES TOWARDS TOURISM
22
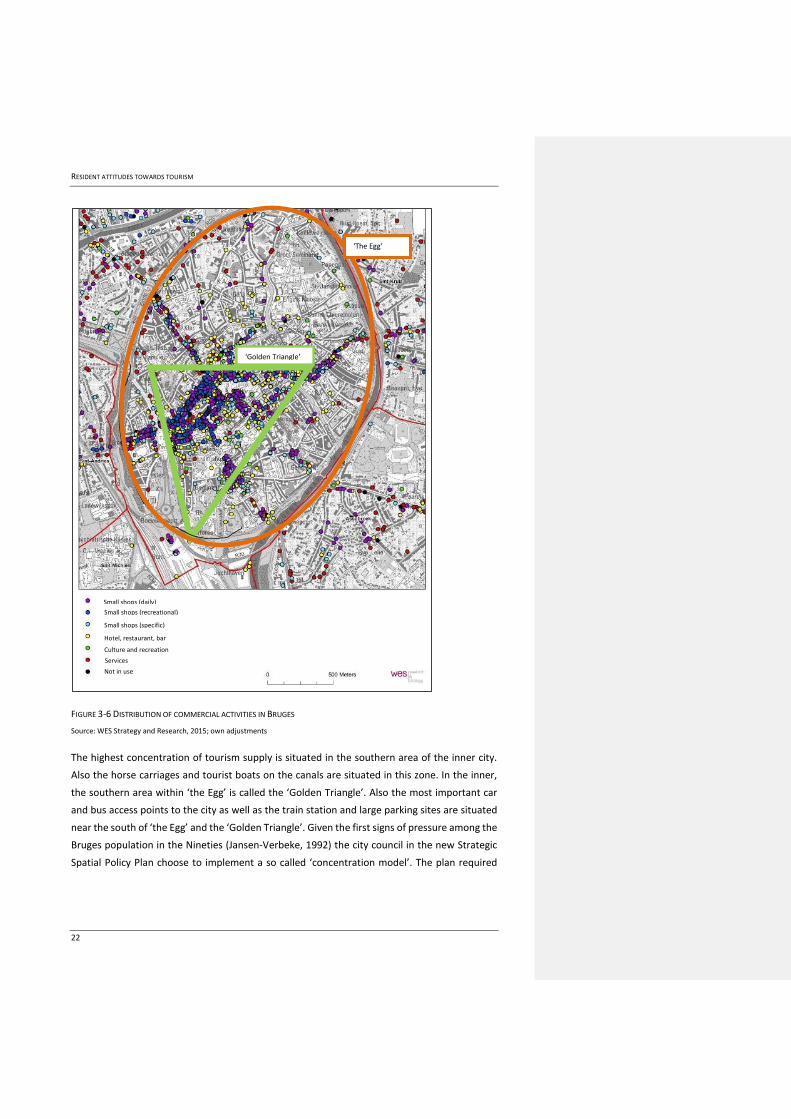
FIGURE 3-6 DISTRIBUTION OF COMMERCIAL ACTIVITIES IN BRUGES
Source: WES Strategy and Research, 2015; own adjustments
The highest concentration of tourism supply is situated in the southern area of the inner city.
Also the horse carriages and tourist boats on the canals are situated in this zone. In the inner,
the southern area within ‘the Egg’ is called the ‘Golden Triangle’. Also the most important car
and bus access points to the city as well as the train station and large parking sites are situated
near the south of ‘the Egg’ and the ‘Golden Triangle’. Given the first signs of pressure among the
Bruges population in the Nineties (Jansen-Verbeke, 1992) the city council in the new Strategic
Spatial Policy Plan choose to implement a so called ‘concentration model’. The plan required
‘Golden Triangle’
‘The Egg’
Small shops (daily)
Small shops (recreational)
Small shops (specific)
Hotel, restaurant, bar
Culture and recreation
Services
Not in use
RESIDENT ATTITUDES TOWARDS TOURISM
23
that new attractions and tourism functions from then on had to be installed in the ‘Golden Tri-
angle’. All tourism development, activities and marketing since then is focused on this specific
tourism area in order to free the outer city of Bruges from tourism pressure.
3.1.3.1 Hotel stop
The launch of the concentration model was combined with a new ‘hotel stop’ in 1996. The main
reason for installing the hotel stop was protecting the residential functions of the city and thus
making sure locals can still find affordable homes and to avoid that Bruges becomes a tourism
city without a real city life. Examples in other destinations like Venice have shown that because
of tourism activities and tourism pressure private houses become unaffordable which can lead
to a decline in the city population. In Venice the population in the historic center dropped -70%
from 1950 to 2014 from 175.000 to 56.000 (Comune Venzia, 2016).
However, there might be some drawbacks in implementing a limit on new and extra hotels. First,
it may cause existing hotels to set higher prices since they start acting as monopolists (WES
2012). Second, higher prices might lead to a decrease of the number of overnight tourists to
Bruges. Third, this measure may have as a consequence that the share of day trips in the city
rises to the detriment of stays with overnights. On the longer run and less directly this can have
an adverse effect on the carrying capacity and sustainability of the destination as well as on the
economic impact of tourism. Indeed, overnight tourist not only spend much more per capita,
per day and per trip than day trip visitors, they also visit more other remote sites within and
outside the city (other than the tourism hot spots), they take more time and thus they accom-
plish a kind of natural spread in time and space. This is a great advantage for a destination in
terms of sustainability and in favor of the carrying capacity limits. It may seem that the hotel
stop conflicts with the concentration model in the ‘golden triangle’, when dispersion is achieved.
This is not true tough, since tourist groups that create the most pressure are kept in the ‘Golden
Triangle’ (like cruise passengers and group visitors on a day trip). The more qualitative visitors
that look for immersive culture experiences, that take their time and want to stay overnight,
might go to other areas in and outside Bruges. Another drawback could be that in recent years
many tourism beds are put on the market via peer-to-peer platforms like AirBnB. This evolution
cannot be stopped by a hotel stop.
Since the hotel stop is already in place for 20 years, it is relevant to make an evaluation to see if
these drawbacks have become reality. First, did the hotel prices in Bruges increase more than in
other Flemish historic cities? The data about average room prices are only available since 2008
(Holthof & Lanckriet, 2008-2013; Arthesis Plantijn Hogelschool, VISITFLANDERS, 2014-2016).
Over the last seven years Bruges room prices increased 8% in Bruges to 93 euro in 2015, while
hotel prices in Ghent and Antwerp are on the same level in 2015 than in 2008. All three cities
went through a strong decline of the average room prices when the financial crisis started in
2009. Bruges caught up with Ghent, after many years of lagging behind. One conclusion that can
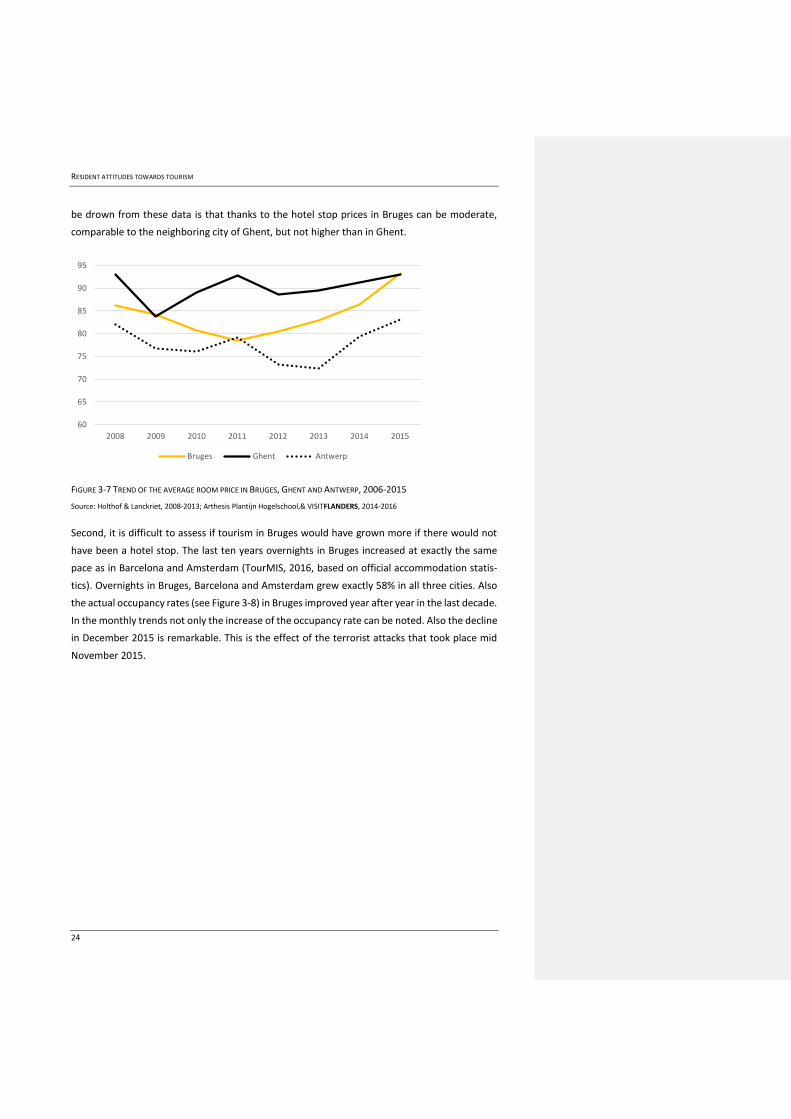
RESIDENT ATTITUDES TOWARDS TOURISM
24
be drown from these data is that thanks to the hotel stop prices in Bruges can be moderate,
comparable to the neighboring city of Ghent, but not higher than in Ghent.
FIGURE 3-7 TREND OF THE AVERAGE ROOM PRICE IN BRUGES, GHENT AND ANTWERP, 2006-2015
Source: Holthof & Lanckriet, 2008-2013; Arthesis Plantijn Hogelschool,& VISITFLANDERS, 2014-2016
Second, it is difficult to assess if tourism in Bruges would have grown more if there would not
have been a hotel stop. The last ten years overnights in Bruges increased at exactly the same
pace as in Barcelona and Amsterdam (TourMIS, 2016, based on official accommodation statis-
tics). Overnights in Bruges, Barcelona and Amsterdam grew exactly 58% in all three cities. Also
the actual occupancy rates (see Figure 3-8) in Bruges improved year after year in the last decade.
In the monthly trends not only the increase of the occupancy rate can be noted. Also the decline
in December 2015 is remarkable. This is the effect of the terrorist attacks that took place mid
November 2015.
60
65
70
75
80
85
90
95
2008 2009 2010 2011 2012 2013 2014 2015
Bruges Ghent Antwerp
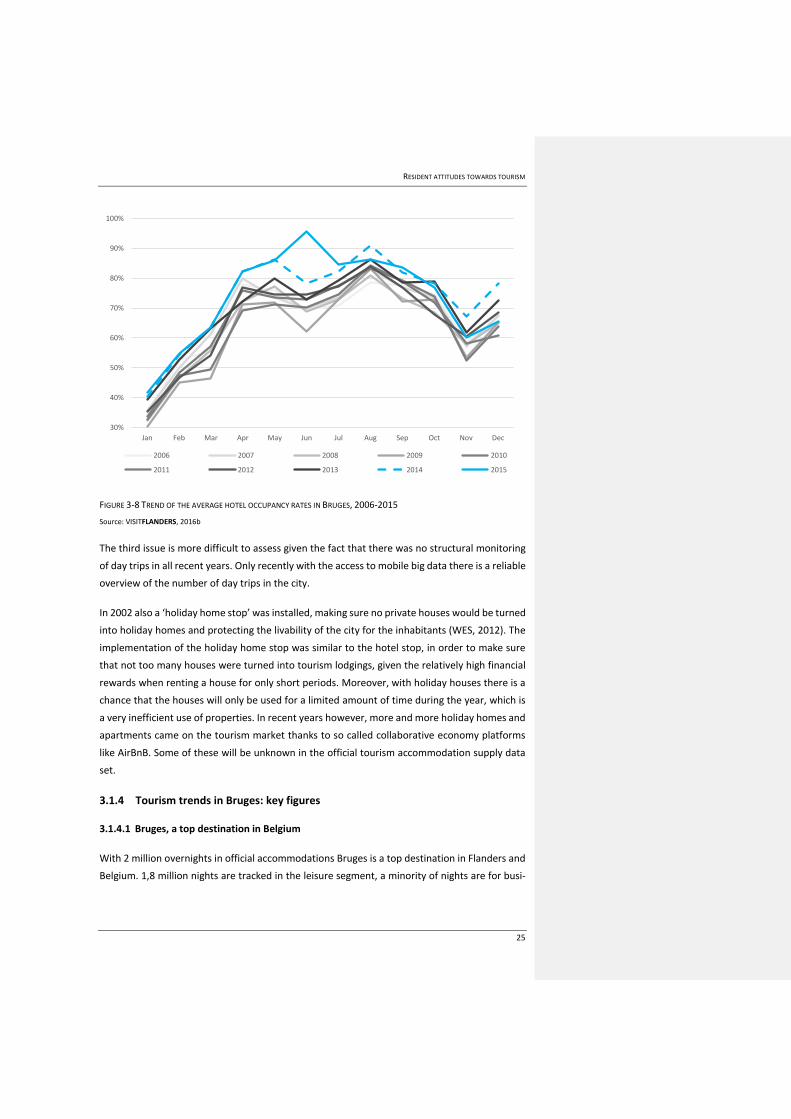
RESIDENT ATTITUDES TOWARDS TOURISM
25
FIGURE 3-8 TREND OF THE AVERAGE HOTEL OCCUPANCY RATES IN BRUGES, 2006-2015
Source: VISITFLANDERS, 2016b
The third issue is more difficult to assess given the fact that there was no structural monitoring
of day trips in all recent years. Only recently with the access to mobile big data there is a reliable
overview of the number of day trips in the city.
In 2002 also a ‘holiday home stop’ was installed, making sure no private houses would be turned
into holiday homes and protecting the livability of the city for the inhabitants (WES, 2012). The
implementation of the holiday home stop was similar to the hotel stop, in order to make sure
that not too many houses were turned into tourism lodgings, given the relatively high financial
rewards when renting a house for only short periods. Moreover, with holiday houses there is a
chance that the houses will only be used for a limited amount of time during the year, which is
a very inefficient use of properties. In recent years however, more and more holiday homes and
apartments came on the tourism market thanks to so called collaborative economy platforms
like AirBnB. Some of these will be unknown in the official tourism accommodation supply data
set.
3.1.4 Tourism trends in Bruges: key figures
3.1.4.1 Bruges, a top destination in Belgium
With 2 million overnights in official accommodations Bruges is a top destination in Flanders and
Belgium. 1,8 million nights are tracked in the leisure segment, a minority of nights are for busi-
30%
40%
50%
60%
70%
80%
90%
100%
Jan Feb Mar Apr May Jun Jul Aug Sep Oct Nov Dec
2006 2007 2008 2009 2010
2011 2012 2013 2014 2015
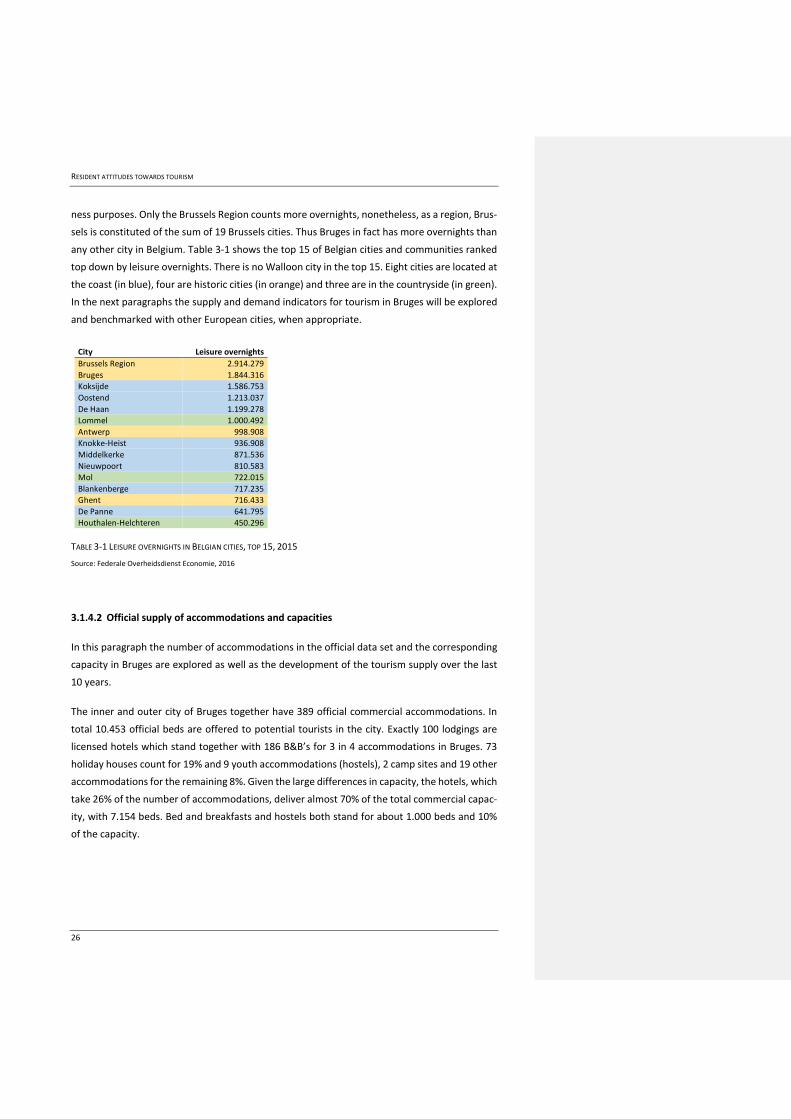
RESIDENT ATTITUDES TOWARDS TOURISM
26
ness purposes. Only the Brussels Region counts more overnights, nonetheless, as a region, Brus-
sels is constituted of the sum of 19 Brussels cities. Thus Bruges in fact has more overnights than
any other city in Belgium. Table 3-1 shows the top 15 of Belgian cities and communities ranked
top down by leisure overnights. There is no Walloon city in the top 15. Eight cities are located at
the coast (in blue), four are historic cities (in orange) and three are in the countryside (in green).
In the next paragraphs the supply and demand indicators for tourism in Bruges will be explored
and benchmarked with other European cities, when appropriate.
City Leisure overnights
Brussels Region 2.914.279
Bruges 1.844.316
Koksijde 1.586.753
Oostend 1.213.037
De Haan 1.199.278
Lommel 1.000.492
Antwerp 998.908
Knokke-Heist 936.908
Middelkerke 871.536
Nieuwpoort 810.583
Mol 722.015
Blankenberge 717.235
Ghent 716.433
De Panne 641.795
Houthalen-Helchteren 450.296
TABLE 3-1 LEISURE OVERNIGHTS IN BELGIAN CITIES, TOP 15, 2015
Source: Federale Overheidsdienst Economie, 2016
3.1.4.2 Official supply of accommodations and capacities
In this paragraph the number of accommodations in the official data set and the corresponding
capacity in Bruges are explored as well as the development of the tourism supply over the last
10 years.
The inner and outer city of Bruges together have 389 official commercial accommodations. In
total 10.453 official beds are offered to potential tourists in the city. Exactly 100 lodgings are
licensed hotels which stand together with 186 B&B’s for 3 in 4 accommodations in Bruges. 73
holiday houses count for 19% and 9 youth accommodations (hostels), 2 camp sites and 19 other
accommodations for the remaining 8%. Given the large differences in capacity, the hotels, which
take 26% of the number of accommodations, deliver almost 70% of the total commercial capac-
ity, with 7.154 beds. Bed and breakfasts and hostels both stand for about 1.000 beds and 10%
of the capacity.
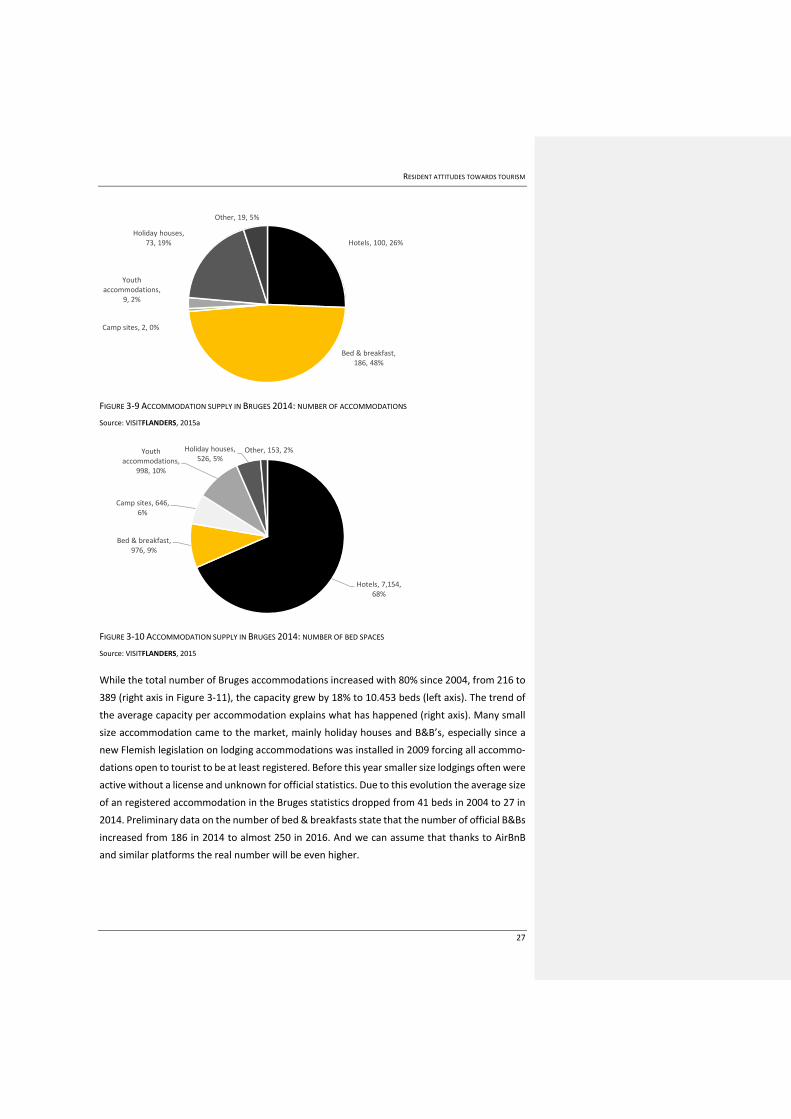
RESIDENT ATTITUDES TOWARDS TOURISM
27
FIGURE 3-9 ACCOMMODATION SUPPLY IN BRUGES 2014: NUMBER OF ACCOMMODATIONS
Source: VISITFLANDERS, 2015a
FIGURE 3-10 ACCOMMODATION SUPPLY IN BRUGES 2014: NUMBER OF BED SPACES
Source: VISITFLANDERS, 2015
While the total number of Bruges accommodations increased with 80% since 2004, from 216 to
389 (right axis in Figure 3-11), the capacity grew by 18% to 10.453 beds (left axis). The trend of
the average capacity per accommodation explains what has happened (right axis). Many small
size accommodation came to the market, mainly holiday houses and B&B’s, especially since a
new Flemish legislation on lodging accommodations was installed in 2009 forcing all accommo-
dations open to tourist to be at least registered. Before this year smaller size lodgings often were
active without a license and unknown for official statistics. Due to this evolution the average size
of an registered accommodation in the Bruges statistics dropped from 41 beds in 2004 to 27 in
2014. Preliminary data on the number of bed & breakfasts state that the number of official B&Bs
increased from 186 in 2014 to almost 250 in 2016. And we can assume that thanks to AirBnB
and similar platforms the real number will be even higher.
Hotels, 100, 26%
Bed & breakfast, 186, 48%
Camp sites, 2, 0%
Youth accommodations,
9, 2%
Holiday houses, 73, 19%
Other, 19, 5%
Hotels, 7,154, 68%
Bed & breakfast, 976, 9%
Camp sites, 646, 6%
Youth accommodations,
998, 10%
Holiday houses, 526, 5%
Other, 153, 2%
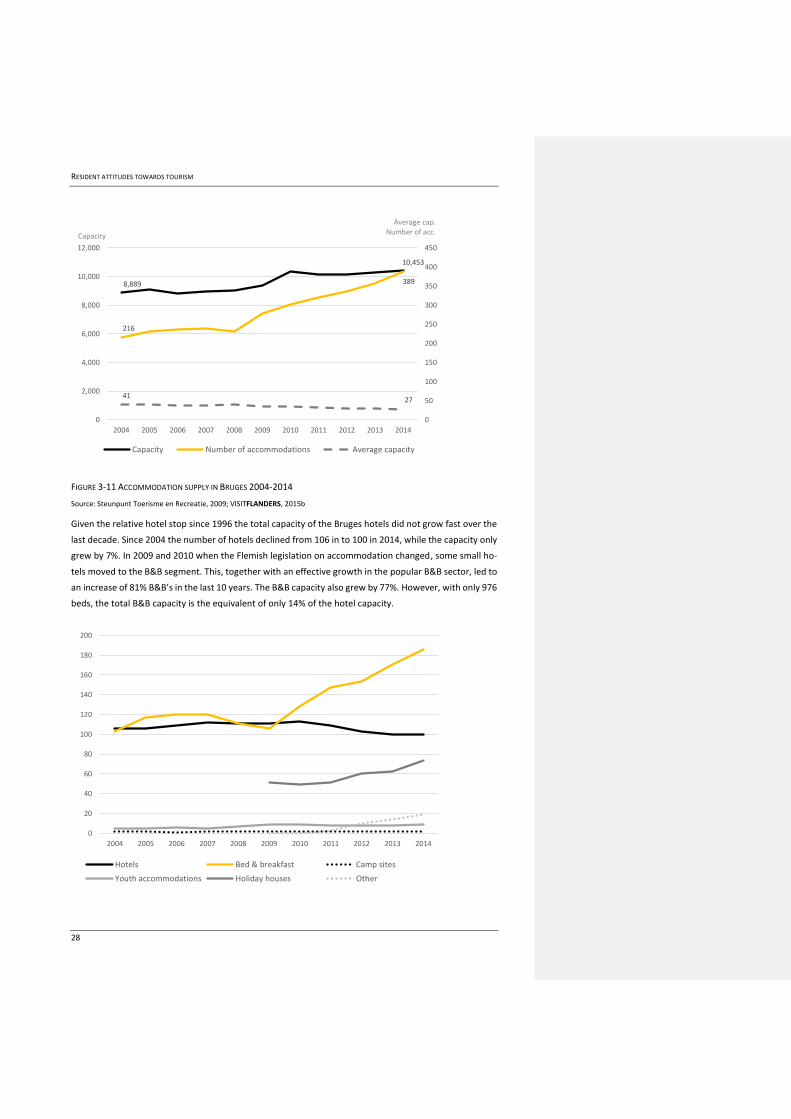
RESIDENT ATTITUDES TOWARDS TOURISM
28
FIGURE 3-11 ACCOMMODATION SUPPLY IN BRUGES 2004-2014
Source: Steunpunt Toerisme en Recreatie, 2009; VISITFLANDERS, 2015b
Given the relative hotel stop since 1996 the total capacity of the Bruges hotels did not grow fast over the
last decade. Since 2004 the number of hotels declined from 106 in to 100 in 2014, while the capacity only
grew by 7%. In 2009 and 2010 when the Flemish legislation on accommodation changed, some small ho-
tels moved to the B&B segment. This, together with an effective growth in the popular B&B sector, led to
an increase of 81% B&B’s in the last 10 years. The B&B capacity also grew by 77%. However, with only 976
beds, the total B&B capacity is the equivalent of only 14% of the hotel capacity.
8,889
10,453
216
389
4127
0
50
100
150
200
250
300
350
400
450
0
2,000
4,000
6,000
8,000
10,000
12,000
2004 2005 2006 2007 2008 2009 2010 2011 2012 2013 2014
Capacity Number of accommodations Average capacity
0
20
40
60
80
100
120
140
160
180
200
2004 2005 2006 2007 2008 2009 2010 2011 2012 2013 2014
Hotels Bed & breakfast Camp sites
Youth accommodations Holiday houses Other
Average cap. Number of acc.
Capacity
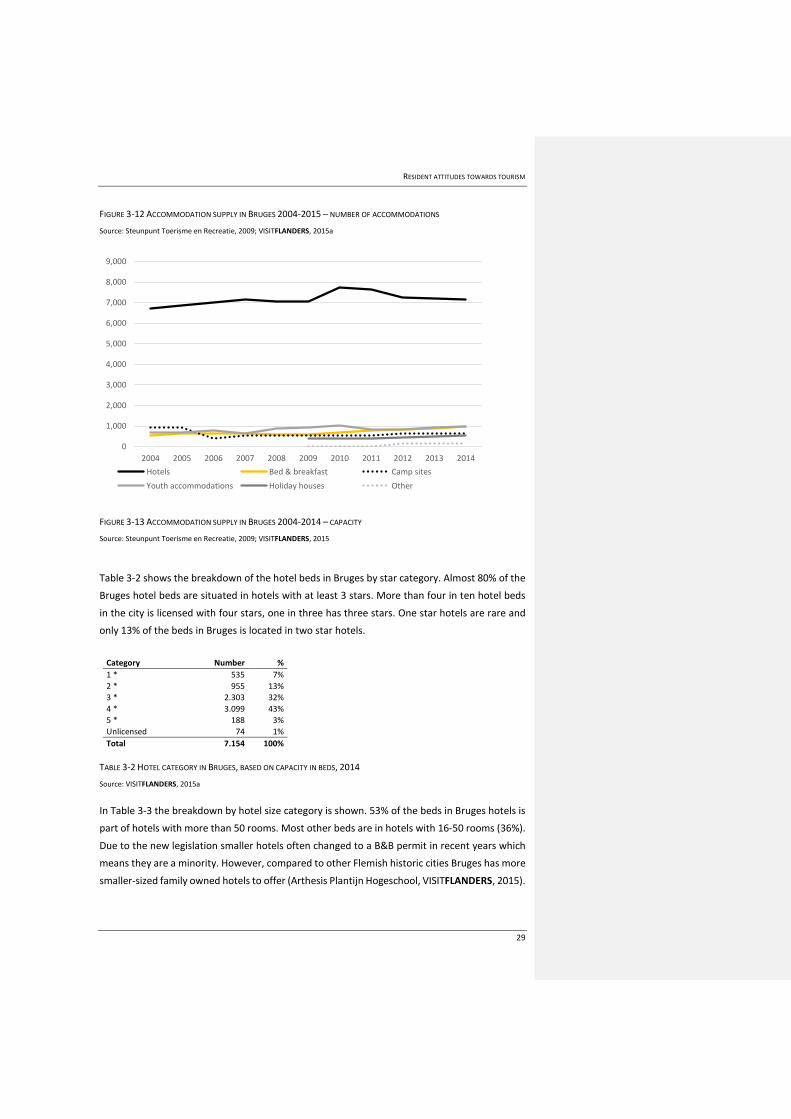
RESIDENT ATTITUDES TOWARDS TOURISM
29
FIGURE 3-12 ACCOMMODATION SUPPLY IN BRUGES 2004-2015 – NUMBER OF ACCOMMODATIONS
Source: Steunpunt Toerisme en Recreatie, 2009; VISITFLANDERS, 2015a
FIGURE 3-13 ACCOMMODATION SUPPLY IN BRUGES 2004-2014 – CAPACITY
Source: Steunpunt Toerisme en Recreatie, 2009; VISITFLANDERS, 2015
Table 3-2 shows the breakdown of the hotel beds in Bruges by star category. Almost 80% of the
Bruges hotel beds are situated in hotels with at least 3 stars. More than four in ten hotel beds
in the city is licensed with four stars, one in three has three stars. One star hotels are rare and
only 13% of the beds in Bruges is located in two star hotels.
Category Number %
1 * 535 7%
2 * 955 13%
3 * 2.303 32%
4 * 3.099 43%
5 * 188 3%
Unlicensed 74 1%
Total 7.154 100%
TABLE 3-2 HOTEL CATEGORY IN BRUGES, BASED ON CAPACITY IN BEDS, 2014
Source: VISITFLANDERS, 2015a
In Table 3-3 the breakdown by hotel size category is shown. 53% of the beds in Bruges hotels is
part of hotels with more than 50 rooms. Most other beds are in hotels with 16-50 rooms (36%).
Due to the new legislation smaller hotels often changed to a B&B permit in recent years which
means they are a minority. However, compared to other Flemish historic cities Bruges has more
smaller-sized family owned hotels to offer (Arthesis Plantijn Hogeschool, VISITFLANDERS, 2015).
0
1,000
2,000
3,000
4,000
5,000
6,000
7,000
8,000
9,000
2004 2005 2006 2007 2008 2009 2010 2011 2012 2013 2014
Hotels Bed & breakfast Camp sites
Youth accommodations Holiday houses Other
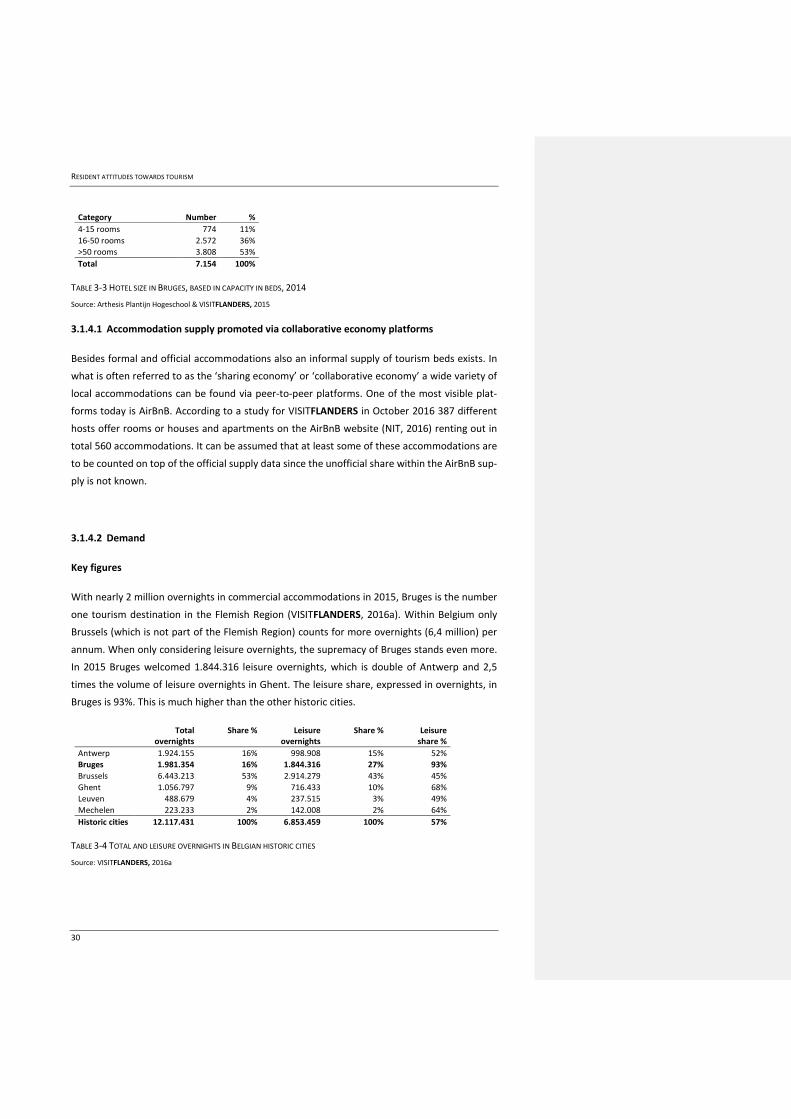
RESIDENT ATTITUDES TOWARDS TOURISM
30
Category Number %
4-15 rooms 774 11%
16-50 rooms 2.572 36%
>50 rooms 3.808 53%
Total 7.154 100%
TABLE 3-3 HOTEL SIZE IN BRUGES, BASED IN CAPACITY IN BEDS, 2014
Source: Arthesis Plantijn Hogeschool & VISITFLANDERS, 2015
3.1.4.1 Accommodation supply promoted via collaborative economy platforms
Besides formal and official accommodations also an informal supply of tourism beds exists. In
what is often referred to as the ‘sharing economy’ or ‘collaborative economy’ a wide variety of
local accommodations can be found via peer-to-peer platforms. One of the most visible plat-
forms today is AirBnB. According to a study for VISITFLANDERS in October 2016 387 different
hosts offer rooms or houses and apartments on the AirBnB website (NIT, 2016) renting out in
total 560 accommodations. It can be assumed that at least some of these accommodations are
to be counted on top of the official supply data since the unofficial share within the AirBnB sup-
ply is not known.
3.1.4.2 Demand
Key figures
With nearly 2 million overnights in commercial accommodations in 2015, Bruges is the number
one tourism destination in the Flemish Region (VISITFLANDERS, 2016a). Within Belgium only
Brussels (which is not part of the Flemish Region) counts for more overnights (6,4 million) per
annum. When only considering leisure overnights, the supremacy of Bruges stands even more.
In 2015 Bruges welcomed 1.844.316 leisure overnights, which is double of Antwerp and 2,5
times the volume of leisure overnights in Ghent. The leisure share, expressed in overnights, in
Bruges is 93%. This is much higher than the other historic cities.
Total overnights
Share % Leisure overnights
Share % Leisure share %
Antwerp 1.924.155 16% 998.908 15% 52%
Bruges 1.981.354 16% 1.844.316 27% 93%
Brussels 6.443.213 53% 2.914.279 43% 45%
Ghent 1.056.797 9% 716.433 10% 68%
Leuven 488.679 4% 237.515 3% 49%
Mechelen 223.233 2% 142.008 2% 64%
Historic cities 12.117.431 100% 6.853.459 100% 57%
TABLE 3-4 TOTAL AND LEISURE OVERNIGHTS IN BELGIAN HISTORIC CITIES
Source: VISITFLANDERS, 2016a
RESIDENT ATTITUDES TOWARDS TOURISM
31
The average length of stay in Bruges is 1,8 nights in 2015. In 2004 tourists and business travelers
stayed for 1,9 nights in Bruges on average. One can conclude there is a slight decline of the
average length of stay in the city, which is observed in most Flemish cities as well as in many
European city destinations and even more in rural and coastal destinations.
All visitors - measured via mobile big data
When examining destination performance statistics related to visitor pressure it is extremely
important to be able to get the full picture of all kinds of visitors. On top of the overnights in
commercial accommodations Bruges welcomes many other travelers and visitors in other seg-
ments: day trips, recreational trips and cruise passengers. An innovative project of Visit Bruges,
Westtoer and Proximus (the major Belgian mobile provider) in 2015 and 2016 revealed the ac-
tual total number of visitors in the Bruges inner city, using mobile big data (Visit Bruges et al.,
2016a&b). Mobile phone big data is more and more applied as a reliable source for estimating
visitor flows and volumes. Based on travelers’ mobile phone signals the number of people in a
certain area for a certain time can be monitored. Visitors can be divided into three groups: first
tourists, who stay at least for one night; second day travelers, who live at least 20 kilometers
away from Bruges and stay for longer than one hour and less than one day in Bruges. Also over-
night tourists in other destinations that undertake a day trip to Bruges are in this category. And
third: recreational visitors, who live within 20 kilometers from the city and visit Bruges for at
least one hour to maximum one day.
It is important to state that on two levels there is a deviation from international standards of
tourism statistics using these three definitions. The reason for this is very practical. First, recre-
ational visitors are included in the statistics given their significant volume and impact on crowd-
ing in the city. If they would be ignored, an important group that is crowding the city streets
would not be taken into account. Second, day trips not only count for a stay of four hours or
more, as often is used as a standard time restriction. Also stays for at least one to four hours are
taken into account. The reason is parallel to the later argument for the recreational trips. Given
the large number of cruise passengers and other group-travelers that visit the city for just a very
short time, the trips from one to four hours in the city are also taken into account. These two
groups might be considered as a threat for the city’s sustainable tourism development because
travelers and visitors who only stay for one or two hours put a burden on a destination in many
ways without leaving much economic value.
In total 8,75 million people visited Bruges as a tourist, day tourist, cruise passenger (that visits
the city) or recreational visitor in 20153. Note that the number of overnight stays of 2,2 million
3 ‘tourists’ were counted in ‘overnight stays’ since the nights reflect the real impact on the city more than the arrivals.
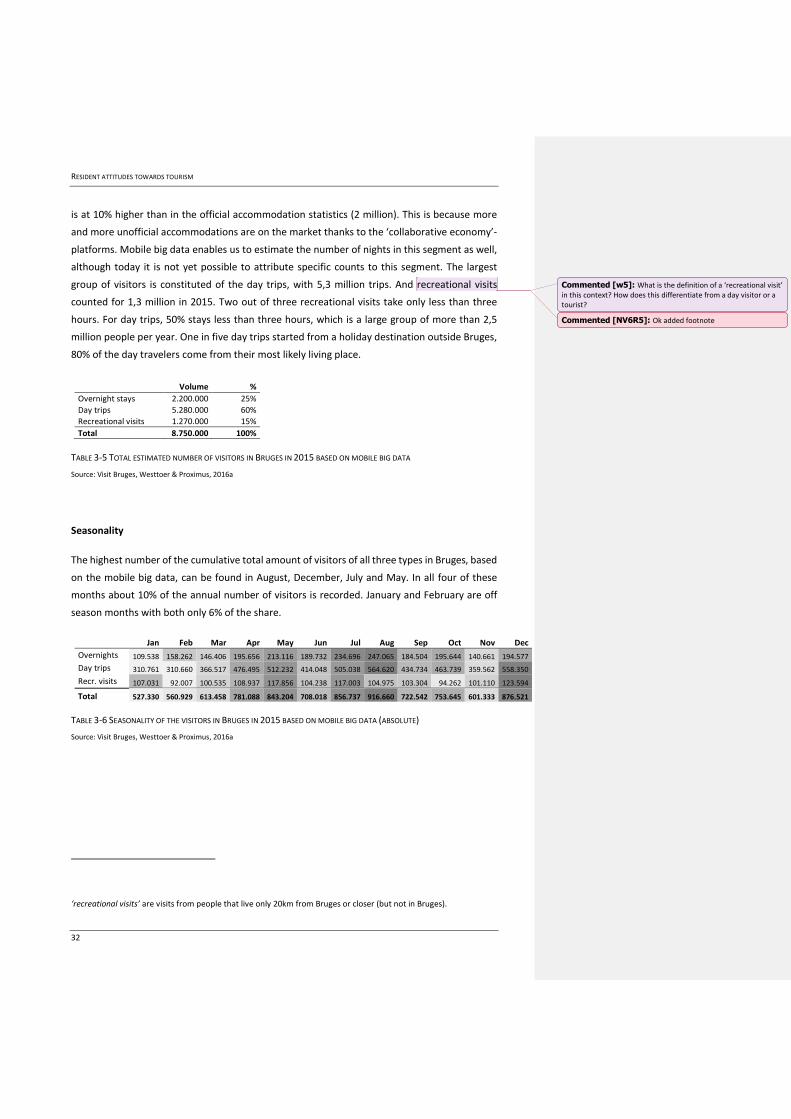
RESIDENT ATTITUDES TOWARDS TOURISM
32
is at 10% higher than in the official accommodation statistics (2 million). This is because more
and more unofficial accommodations are on the market thanks to the ‘collaborative economy’-
platforms. Mobile big data enables us to estimate the number of nights in this segment as well,
although today it is not yet possible to attribute specific counts to this segment. The largest
group of visitors is constituted of the day trips, with 5,3 million trips. And recreational visits
counted for 1,3 million in 2015. Two out of three recreational visits take only less than three
hours. For day trips, 50% stays less than three hours, which is a large group of more than 2,5
million people per year. One in five day trips started from a holiday destination outside Bruges,
80% of the day travelers come from their most likely living place.
Volume %
Overnight stays 2.200.000 25%
Day trips 5.280.000 60%
Recreational visits 1.270.000 15%
Total 8.750.000 100%
TABLE 3-5 TOTAL ESTIMATED NUMBER OF VISITORS IN BRUGES IN 2015 BASED ON MOBILE BIG DATA
Source: Visit Bruges, Westtoer & Proximus, 2016a
Seasonality
The highest number of the cumulative total amount of visitors of all three types in Bruges, based
on the mobile big data, can be found in August, December, July and May. In all four of these
months about 10% of the annual number of visitors is recorded. January and February are off
season months with both only 6% of the share.
Jan Feb Mar Apr May Jun Jul Aug Sep Oct Nov Dec
Overnights 109.538 158.262 146.406 195.656 213.116 189.732 234.696 247.065 184.504 195.644 140.661 194.577
Day trips 310.761 310.660 366.517 476.495 512.232 414.048 505.038 564.620 434.734 463.739 359.562 558.350
Recr. visits 107.031 92.007 100.535 108.937 117.856 104.238 117.003 104.975 103.304 94.262 101.110 123.594
Total 527.330 560.929 613.458 781.088 843.204 708.018 856.737 916.660 722.542 753.645 601.333 876.521
TABLE 3-6 SEASONALITY OF THE VISITORS IN BRUGES IN 2015 BASED ON MOBILE BIG DATA (ABSOLUTE)
Source: Visit Bruges, Westtoer & Proximus, 2016a
‘recreational visits’ are visits from people that live only 20km from Bruges or closer (but not in Bruges).
Commented [w5]: What is the definition of a ‘recreational visit’ in this context? How does this differentiate from a day visitor or a tourist?
Commented [NV6R5]: Ok added footnote
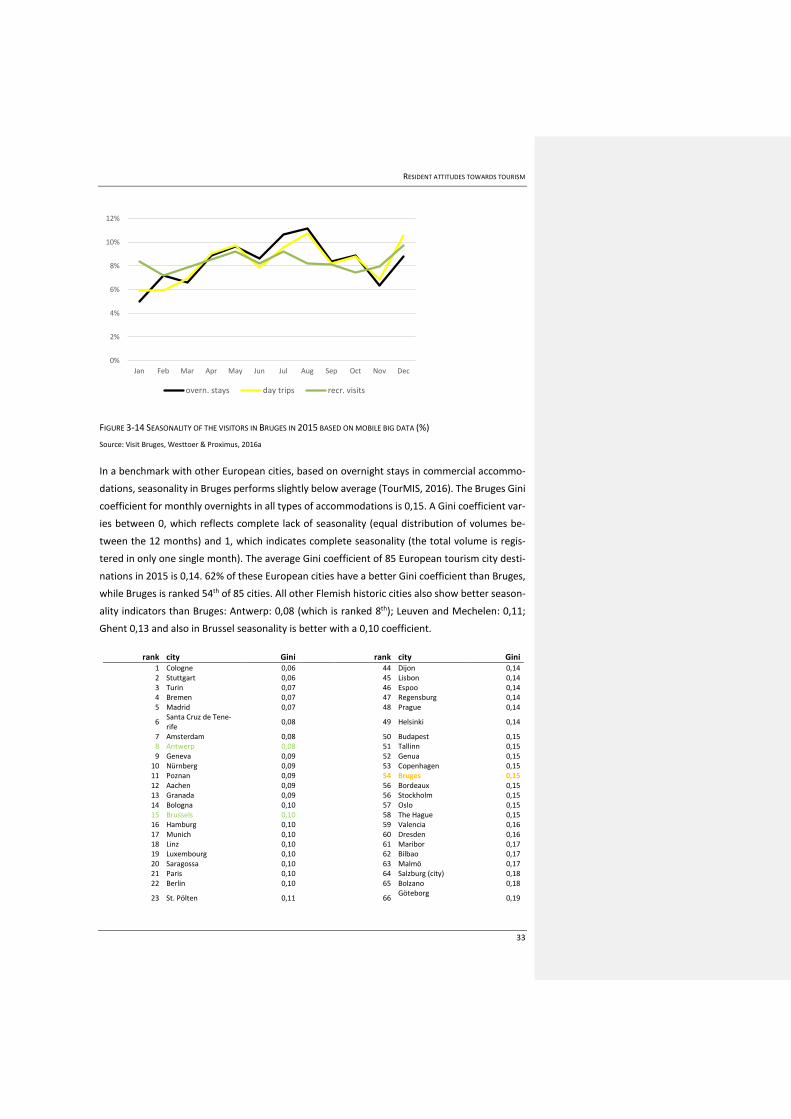
RESIDENT ATTITUDES TOWARDS TOURISM
33
FIGURE 3-14 SEASONALITY OF THE VISITORS IN BRUGES IN 2015 BASED ON MOBILE BIG DATA (%)
Source: Visit Bruges, Westtoer & Proximus, 2016a
In a benchmark with other European cities, based on overnight stays in commercial accommo-
dations, seasonality in Bruges performs slightly below average (TourMIS, 2016). The Bruges Gini
coefficient for monthly overnights in all types of accommodations is 0,15. A Gini coefficient var-
ies between 0, which reflects complete lack of seasonality (equal distribution of volumes be-
tween the 12 months) and 1, which indicates complete seasonality (the total volume is regis-
tered in only one single month). The average Gini coefficient of 85 European tourism city desti-
nations in 2015 is 0,14. 62% of these European cities have a better Gini coefficient than Bruges,
while Bruges is ranked 54th of 85 cities. All other Flemish historic cities also show better season-
ality indicators than Bruges: Antwerp: 0,08 (which is ranked 8th); Leuven and Mechelen: 0,11;
Ghent 0,13 and also in Brussel seasonality is better with a 0,10 coefficient.
rank city Gini rank city Gini 1 Cologne 0,06 44 Dijon 0,14 2 Stuttgart 0,06 45 Lisbon 0,14 3 Turin 0,07 46 Espoo 0,14 4 Bremen 0,07 47 Regensburg 0,14 5 Madrid 0,07 48 Prague 0,14
6 Santa Cruz de Tene-rife
0,08 49 Helsinki 0,14
7 Amsterdam 0,08 50 Budapest 0,15 8 Antwerp 0,08 51 Tallinn 0,15 9 Geneva 0,09 52 Genua 0,15
10 Nürnberg 0,09 53 Copenhagen 0,15 11 Poznan 0,09 54 Bruges 0,15 12 Aachen 0,09 56 Bordeaux 0,15 13 Granada 0,09 56 Stockholm 0,15 14 Bologna 0,10 57 Oslo 0,15 15 Brussels 0,10 58 The Hague 0,15 16 Hamburg 0,10 59 Valencia 0,16 17 Munich 0,10 60 Dresden 0,16 18 Linz 0,10 61 Maribor 0,17 19 Luxembourg 0,10 62 Bilbao 0,17 20 Saragossa 0,10 63 Malmö 0,17 21 Paris 0,10 64 Salzburg (city) 0,18 22 Berlin 0,10 65 Bolzano 0,18
23 St. Pölten 0,11 66 Göteborg
0,19
0%
2%
4%
6%
8%
10%
12%
Jan Feb Mar Apr May Jun Jul Aug Sep Oct Nov Dec
overn. stays day trips recr. visits
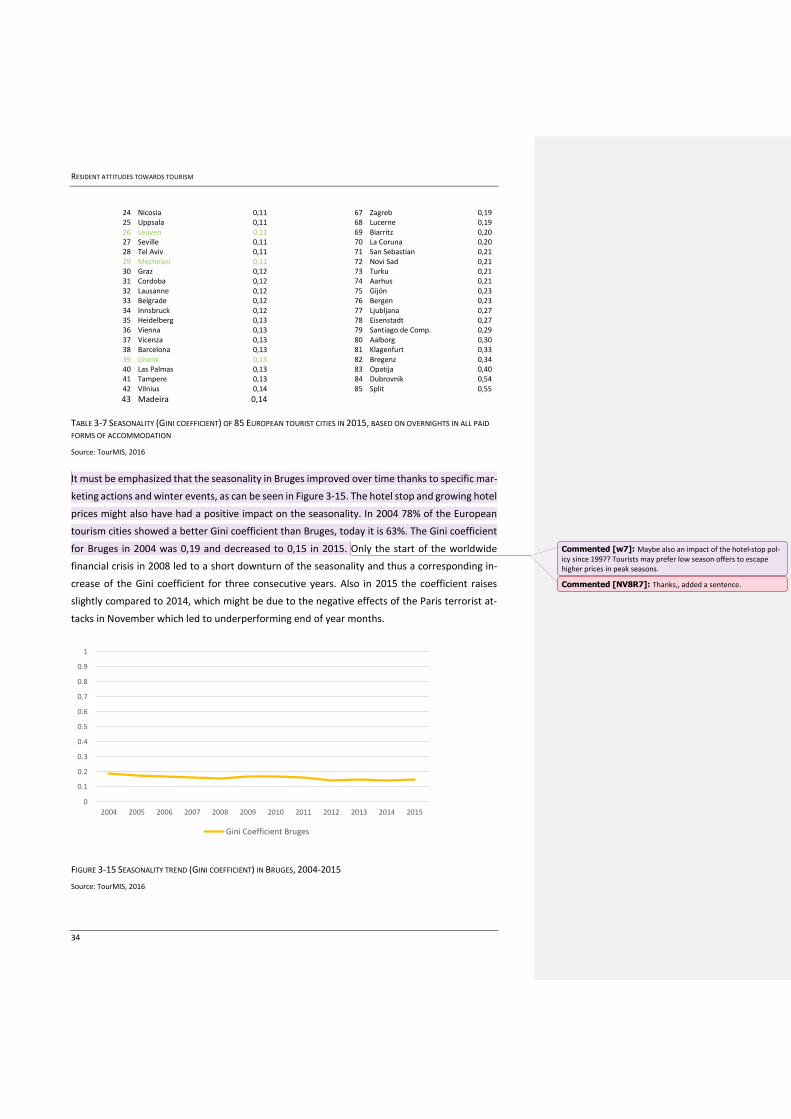
RESIDENT ATTITUDES TOWARDS TOURISM
34
24 Nicosia 0,11 67 Zagreb 0,19 25 Uppsala 0,11 68 Lucerne 0,19 26 Leuven 0,11 69 Biarritz 0,20 27 Seville 0,11 70 La Coruna 0,20 28 Tel Aviv 0,11 71 San Sebastian 0,21 29 Mechelen 0,11 72 Novi Sad 0,21 30 Graz 0,12 73 Turku 0,21 31 Cordoba 0,12 74 Aarhus 0,21 32 Lausanne 0,12 75 Gijón 0,23 33 Belgrade 0,12 76 Bergen 0,23 34 Innsbruck 0,12 77 Ljubljana 0,27 35 Heidelberg 0,13 78 Eisenstadt 0,27 36 Vienna 0,13 79 Santiago de Comp. 0,29 37 Vicenza 0,13 80 Aalborg 0,30 38 Barcelona 0,13 81 Klagenfurt 0,33 39 Ghent 0,13 82 Bregenz 0,34 40 Las Palmas 0,13 83 Opatija 0,40 41 Tampere 0,13 84 Dubrovnik 0,54 42 Vilnius 0,14 85 Split 0,55
43 Madeira 0,14
TABLE 3-7 SEASONALITY (GINI COEFFICIENT) OF 85 EUROPEAN TOURIST CITIES IN 2015, BASED ON OVERNIGHTS IN ALL PAID
FORMS OF ACCOMMODATION
Source: TourMIS, 2016
It must be emphasized that the seasonality in Bruges improved over time thanks to specific mar-
keting actions and winter events, as can be seen in Figure 3-15. The hotel stop and growing hotel
prices might also have had a positive impact on the seasonality. In 2004 78% of the European
tourism cities showed a better Gini coefficient than Bruges, today it is 63%. The Gini coefficient
for Bruges in 2004 was 0,19 and decreased to 0,15 in 2015. Only the start of the worldwide
financial crisis in 2008 led to a short downturn of the seasonality and thus a corresponding in-
crease of the Gini coefficient for three consecutive years. Also in 2015 the coefficient raises
slightly compared to 2014, which might be due to the negative effects of the Paris terrorist at-
tacks in November which led to underperforming end of year months.
FIGURE 3-15 SEASONALITY TREND (GINI COEFFICIENT) IN BRUGES, 2004-2015
Source: TourMIS, 2016
0
0.1
0.2
0.3
0.4
0.5
0.6
0.7
0.8
0.9
1
2004 2005 2006 2007 2008 2009 2010 2011 2012 2013 2014 2015
Gini Coefficient Bruges
Commented [w7]: Maybe also an impact of the hotel-stop pol-icy since 1997? Tourists may prefer low season offers to escape higher prices in peak seasons.
Commented [NV8R7]: Thanks,, added a sentence.
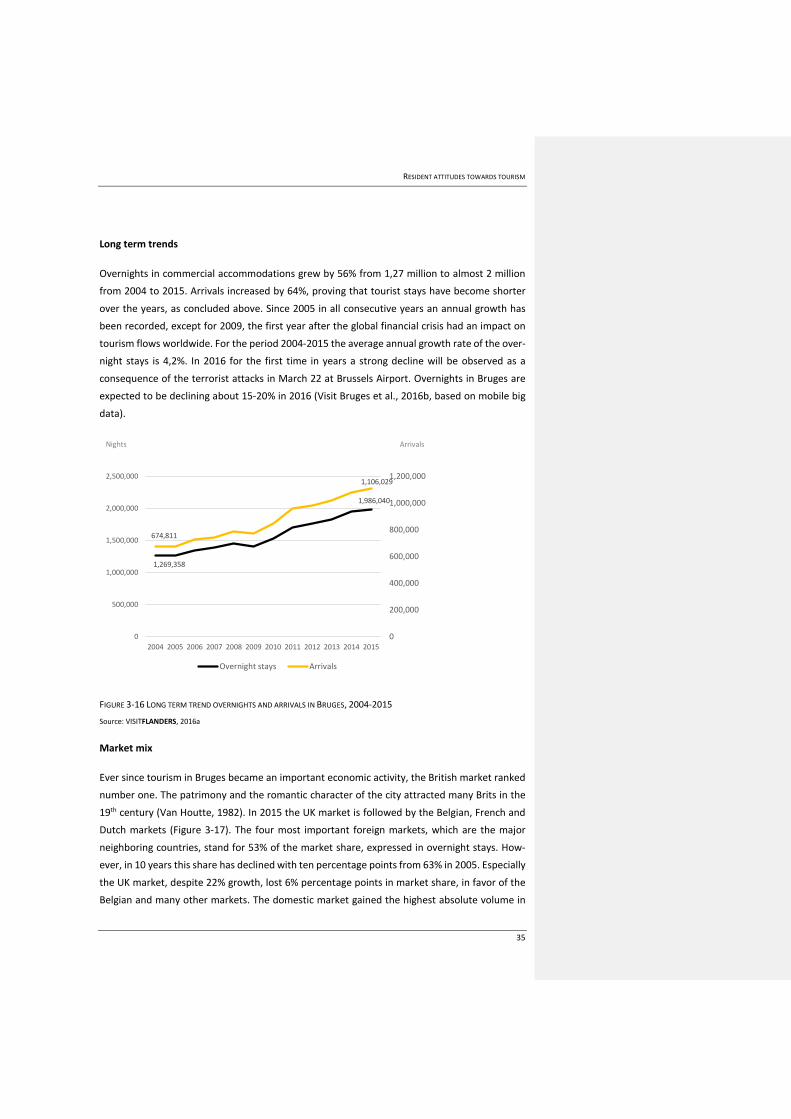
RESIDENT ATTITUDES TOWARDS TOURISM
35
Long term trends
Overnights in commercial accommodations grew by 56% from 1,27 million to almost 2 million
from 2004 to 2015. Arrivals increased by 64%, proving that tourist stays have become shorter
over the years, as concluded above. Since 2005 in all consecutive years an annual growth has
been recorded, except for 2009, the first year after the global financial crisis had an impact on
tourism flows worldwide. For the period 2004-2015 the average annual growth rate of the over-
night stays is 4,2%. In 2016 for the first time in years a strong decline will be observed as a
consequence of the terrorist attacks in March 22 at Brussels Airport. Overnights in Bruges are
expected to be declining about 15-20% in 2016 (Visit Bruges et al., 2016b, based on mobile big
data).
FIGURE 3-16 LONG TERM TREND OVERNIGHTS AND ARRIVALS IN BRUGES, 2004-2015
Source: VISITFLANDERS, 2016a
Market mix
Ever since tourism in Bruges became an important economic activity, the British market ranked
number one. The patrimony and the romantic character of the city attracted many Brits in the
19th century (Van Houtte, 1982). In 2015 the UK market is followed by the Belgian, French and
Dutch markets (Figure 3-17). The four most important foreign markets, which are the major
neighboring countries, stand for 53% of the market share, expressed in overnight stays. How-
ever, in 10 years this share has declined with ten percentage points from 63% in 2005. Especially
the UK market, despite 22% growth, lost 6% percentage points in market share, in favor of the
Belgian and many other markets. The domestic market gained the highest absolute volume in
1,269,358
1,986,040
674,811
1,106,029
0
200,000
400,000
600,000
800,000
1,000,000
1,200,000
0
500,000
1,000,000
1,500,000
2,000,000
2,500,000
2004 2005 2006 2007 2008 2009 2010 2011 2012 2013 2014 2015
Overnight stays Arrivals
Arrivals Nights
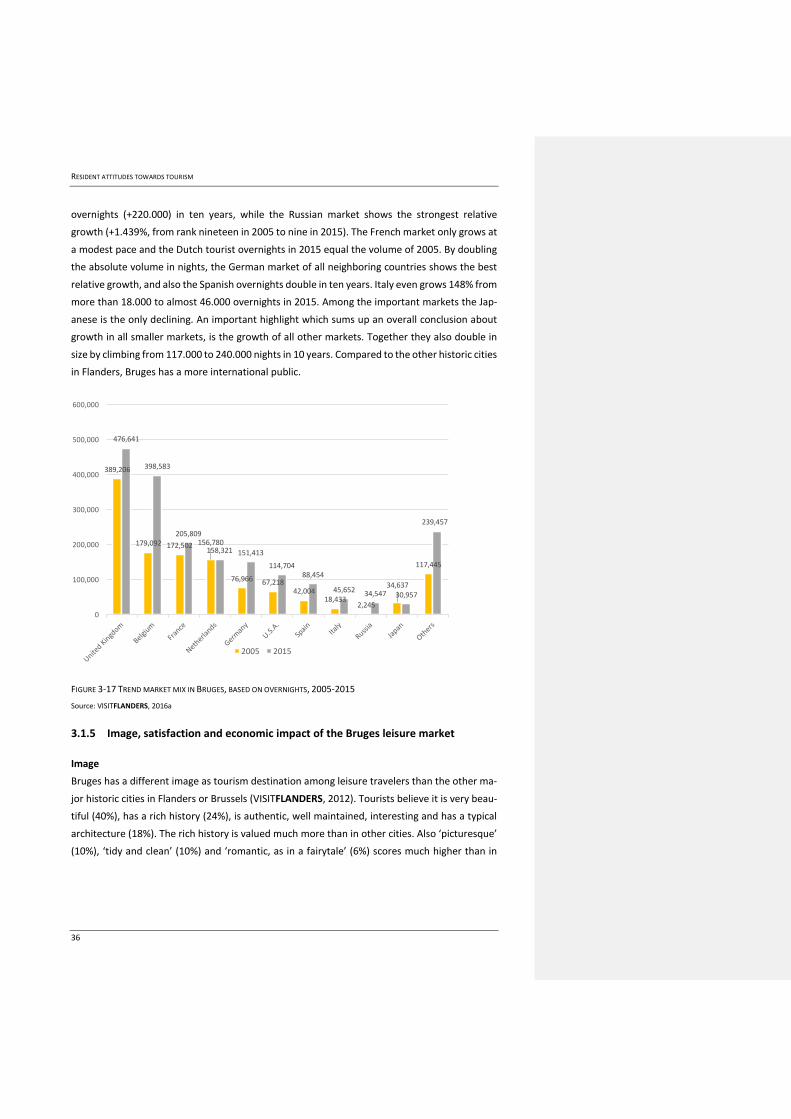
RESIDENT ATTITUDES TOWARDS TOURISM
36
overnights (+220.000) in ten years, while the Russian market shows the strongest relative
growth (+1.439%, from rank nineteen in 2005 to nine in 2015). The French market only grows at
a modest pace and the Dutch tourist overnights in 2015 equal the volume of 2005. By doubling
the absolute volume in nights, the German market of all neighboring countries shows the best
relative growth, and also the Spanish overnights double in ten years. Italy even grows 148% from
more than 18.000 to almost 46.000 overnights in 2015. Among the important markets the Jap-
anese is the only declining. An important highlight which sums up an overall conclusion about
growth in all smaller markets, is the growth of all other markets. Together they also double in
size by climbing from 117.000 to 240.000 nights in 10 years. Compared to the other historic cities
in Flanders, Bruges has a more international public.
FIGURE 3-17 TREND MARKET MIX IN BRUGES, BASED ON OVERNIGHTS, 2005-2015
Source: VISITFLANDERS, 2016a
3.1.5 Image, satisfaction and economic impact of the Bruges leisure market
Image
Bruges has a different image as tourism destination among leisure travelers than the other ma-
jor historic cities in Flanders or Brussels (VISITFLANDERS, 2012). Tourists believe it is very beau-
tiful (40%), has a rich history (24%), is authentic, well maintained, interesting and has a typical
architecture (18%). The rich history is valued much more than in other cities. Also ‘picturesque’
(10%), ‘tidy and clean’ (10%) and ‘romantic, as in a fairytale’ (6%) scores much higher than in
389,206
179,092 172,502 156,780
76,966 67,21842,004
18,4332,245
34,637
117,445
476,641
398,583
205,809
158,321 151,413
114,70488,454
45,652 34,547 30,957
239,457
0
100,000
200,000
300,000
400,000
500,000
600,000
2005 2015
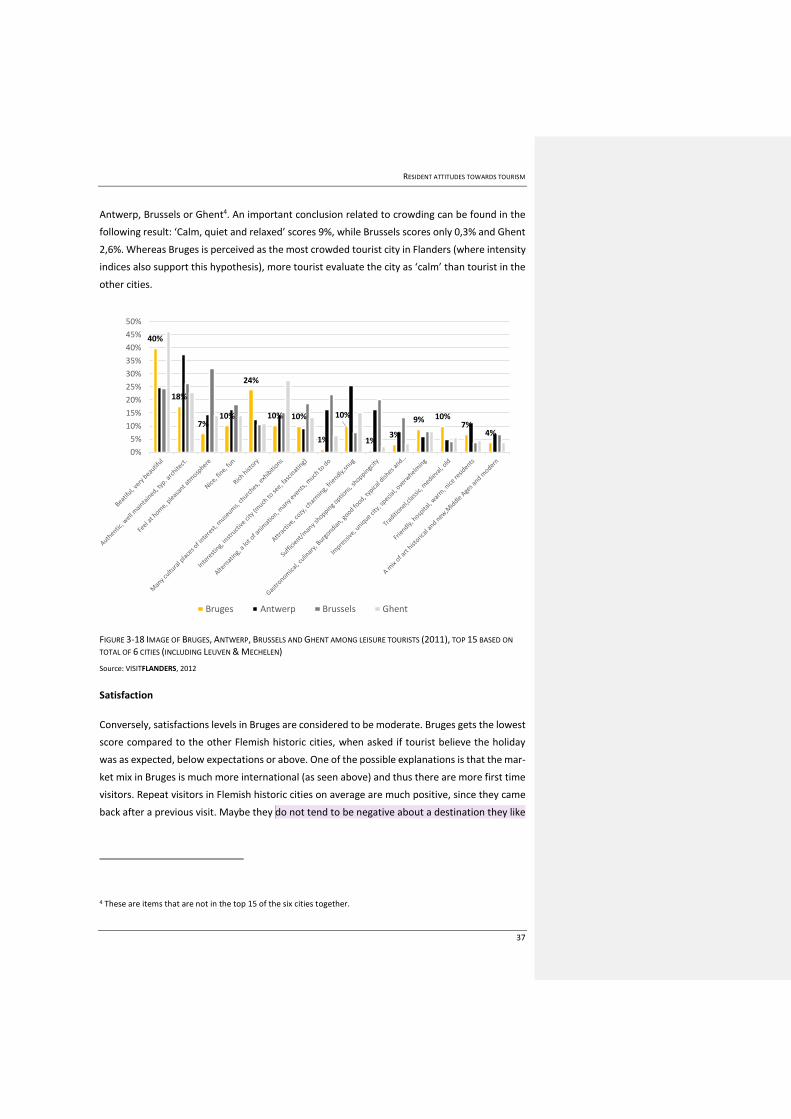
RESIDENT ATTITUDES TOWARDS TOURISM
37
Antwerp, Brussels or Ghent4. An important conclusion related to crowding can be found in the
following result: ‘Calm, quiet and relaxed’ scores 9%, while Brussels scores only 0,3% and Ghent
2,6%. Whereas Bruges is perceived as the most crowded tourist city in Flanders (where intensity
indices also support this hypothesis), more tourist evaluate the city as ‘calm’ than tourist in the
other cities.
FIGURE 3-18 IMAGE OF BRUGES, ANTWERP, BRUSSELS AND GHENT AMONG LEISURE TOURISTS (2011), TOP 15 BASED ON
TOTAL OF 6 CITIES (INCLUDING LEUVEN & MECHELEN)
Source: VISITFLANDERS, 2012
Satisfaction
Conversely, satisfactions levels in Bruges are considered to be moderate. Bruges gets the lowest
score compared to the other Flemish historic cities, when asked if tourist believe the holiday
was as expected, below expectations or above. One of the possible explanations is that the mar-
ket mix in Bruges is much more international (as seen above) and thus there are more first time
visitors. Repeat visitors in Flemish historic cities on average are much positive, since they came
back after a previous visit. Maybe they do not tend to be negative about a destination they like
4 These are items that are not in the top 15 of the six cities together.
40%
18%
7%10%
24%
10% 10%
1%
10%
1%3%
9% 10%7%
4%
0%
5%
10%
15%
20%
25%
30%
35%
40%
45%
50%
Bruges Antwerp Brussels Ghent
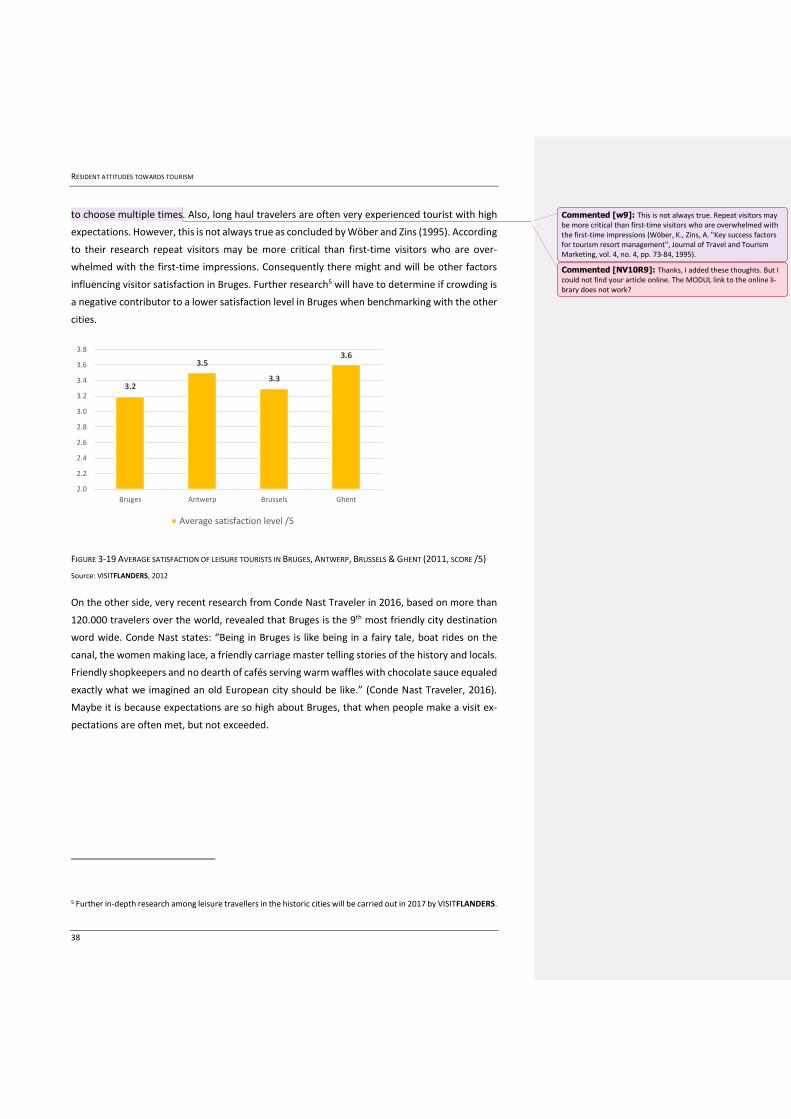
RESIDENT ATTITUDES TOWARDS TOURISM
38
to choose multiple times. Also, long haul travelers are often very experienced tourist with high
expectations. However, this is not always true as concluded by Wöber and Zins (1995). According
to their research repeat visitors may be more critical than first-time visitors who are over-
whelmed with the first-time impressions. Consequently there might and will be other factors
influencing visitor satisfaction in Bruges. Further research5 will have to determine if crowding is
a negative contributor to a lower satisfaction level in Bruges when benchmarking with the other
cities.
FIGURE 3-19 AVERAGE SATISFACTION OF LEISURE TOURISTS IN BRUGES, ANTWERP, BRUSSELS & GHENT (2011, SCORE /5)
Source: VISITFLANDERS, 2012
On the other side, very recent research from Conde Nast Traveler in 2016, based on more than
120.000 travelers over the world, revealed that Bruges is the 9th most friendly city destination
word wide. Conde Nast states: “Being in Bruges is like being in a fairy tale, boat rides on the
canal, the women making lace, a friendly carriage master telling stories of the history and locals.
Friendly shopkeepers and no dearth of cafés serving warm waffles with chocolate sauce equaled
exactly what we imagined an old European city should be like.” (Conde Nast Traveler, 2016).
Maybe it is because expectations are so high about Bruges, that when people make a visit ex-
pectations are often met, but not exceeded.
5 Further in-depth research among leisure travellers in the historic cities will be carried out in 2017 by VISITFLANDERS.
3.2
3.5
3.3
3.6
2.0
2.2
2.4
2.6
2.8
3.0
3.2
3.4
3.6
3.8
Bruges Antwerp Brussels Ghent
Average satisfaction level /5
Commented [w9]: This is not always true. Repeat visitors may be more critical than first-time visitors who are overwhelmed with the first-time impressions (Wöber, K., Zins, A. "Key success factors for tourism resort management", Journal of Travel and Tourism Marketing, vol. 4, no. 4, pp. 73-84, 1995).
Commented [NV10R9]: Thanks, I added these thoughts. But I could not find your article online. The MODUL link to the online li-brary does not work?
RESIDENT ATTITUDES TOWARDS TOURISM
39
3.1.6 Crowding in Bruges
3.1.6.1 Living with tourism in Bruges
As can be seen supra, more than 8,7 million visitors have spent some time in the Bruges inner
city, while only about 19.500 people live in this area. It is clear that these two extreme volumes:
a rather small population and a very large amount of visitors might be or become an issue, now
or in the future. Tourism activities have been developed in Bruges for decades, which might lead
to the conclusion that locals have set their reference accordingly. It can be that hosts have
learned to live with these volumes of tourists and have set their expectations consequently. And
indeed, former studies with Bruges hosts often concluded that the overall perception of Bruges
inhabitants towards tourism is rather positive. And even so, if tourism is still growing, it does not
mean that that future pressure is still manageable. As Bryon states: “Earlier research had proven
that the social acceptance of tourism by the local population is high.” (2003, p. 20). On the other
hand, Bryon also discovered a group of tourism rejecters which he called ‘haters’ (2006). They
represented 15% of the inner city population in 2003. Apparently, in the Eighties, city residents
started to organize themselves to take action and to get the negative impacts from tourism on
the agenda (Bryon, 2002). It was the first time that the growth and impacts from tourism in the
city were openly questioned.
3.1.6.2 Tourism intensity rate for Bruges
One of the theoretical techniques to assess crowding in tourism destinations is the use of tour-
ism intensity rates. Dumbrovská & Fialová created four indicators to approach a crowding indi-
cator (2014): ‘Tourist intensity rate’ (TIR), ‘Tourist density rate’ (TDR), ‘Defert function’ (DF) and
‘Impact of tourism activities on the locality’ (TL). All indicators are based tourism intensity indi-
cators, which measure the volume of tourism (numbers of arrivals, number of overnight) to-
gether with supply data (number of beds in collective accommodation establishments) and pop-
ulation data.
The TIR is calculated by the number of arrivals or overnights per 100 inhabitants per day. The
TDR indicates how many tourists are approximately in the destination per day per km2. The DF
is the number of beds per 100 inhabitants. The TL shows the density of tourist accommodation
facilities (in beds) in the destination by measuring the number of beds per km2.
The difficulty in benchmarking tourism cities with these indicators is the question which city area
to take and which according part of the population. As stated above, the total population for
Bruges is nearly 118.000 people, including all communities where most tourists never go to. In
order to have a correct indicator only the population of the inner city should be used, which is
representing about 19.500 people. Another critical note one can have to this methodology is
which type of tourist should be included. In the research paper by Dumbrovská & Fialová only
arrivals and nights in ‘collective accommodation establishments’ are applied. This means that all
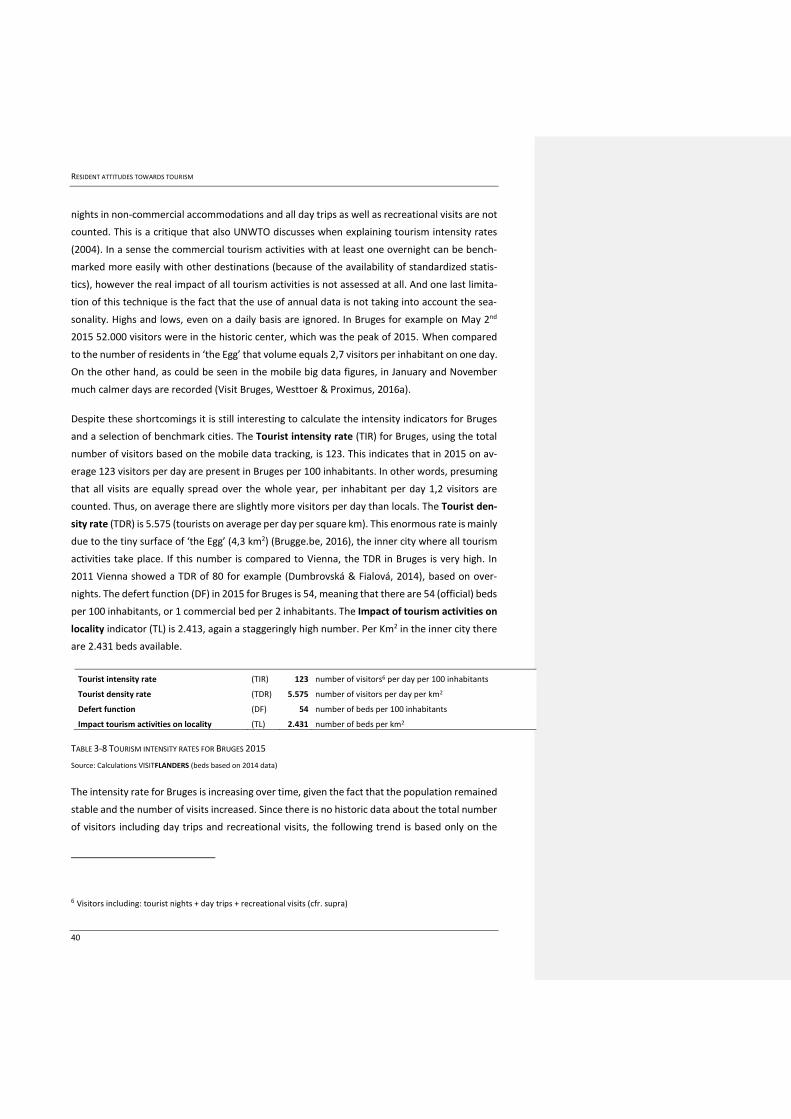
RESIDENT ATTITUDES TOWARDS TOURISM
40
nights in non-commercial accommodations and all day trips as well as recreational visits are not
counted. This is a critique that also UNWTO discusses when explaining tourism intensity rates
(2004). In a sense the commercial tourism activities with at least one overnight can be bench-
marked more easily with other destinations (because of the availability of standardized statis-
tics), however the real impact of all tourism activities is not assessed at all. And one last limita-
tion of this technique is the fact that the use of annual data is not taking into account the sea-
sonality. Highs and lows, even on a daily basis are ignored. In Bruges for example on May 2nd
2015 52.000 visitors were in the historic center, which was the peak of 2015. When compared
to the number of residents in ‘the Egg’ that volume equals 2,7 visitors per inhabitant on one day.
On the other hand, as could be seen in the mobile big data figures, in January and November
much calmer days are recorded (Visit Bruges, Westtoer & Proximus, 2016a).
Despite these shortcomings it is still interesting to calculate the intensity indicators for Bruges
and a selection of benchmark cities. The Tourist intensity rate (TIR) for Bruges, using the total
number of visitors based on the mobile data tracking, is 123. This indicates that in 2015 on av-
erage 123 visitors per day are present in Bruges per 100 inhabitants. In other words, presuming
that all visits are equally spread over the whole year, per inhabitant per day 1,2 visitors are
counted. Thus, on average there are slightly more visitors per day than locals. The Tourist den-
sity rate (TDR) is 5.575 (tourists on average per day per square km). This enormous rate is mainly
due to the tiny surface of ‘the Egg’ (4,3 km2) (Brugge.be, 2016), the inner city where all tourism
activities take place. If this number is compared to Vienna, the TDR in Bruges is very high. In
2011 Vienna showed a TDR of 80 for example (Dumbrovská & Fialová, 2014), based on over-
nights. The defert function (DF) in 2015 for Bruges is 54, meaning that there are 54 (official) beds
per 100 inhabitants, or 1 commercial bed per 2 inhabitants. The Impact of tourism activities on
locality indicator (TL) is 2.413, again a staggeringly high number. Per Km2 in the inner city there
are 2.431 beds available.
Tourist intensity rate (TIR) 123 number of visitors6 per day per 100 inhabitants
Tourist density rate (TDR) 5.575 number of visitors per day per km2
Defert function (DF) 54 number of beds per 100 inhabitants
Impact tourism activities on locality (TL) 2.431 number of beds per km2
TABLE 3-8 TOURISM INTENSITY RATES FOR BRUGES 2015
Source: Calculations VISITFLANDERS (beds based on 2014 data)
The intensity rate for Bruges is increasing over time, given the fact that the population remained
stable and the number of visits increased. Since there is no historic data about the total number
of visitors including day trips and recreational visits, the following trend is based only on the
6 Visitors including: tourist nights + day trips + recreational visits (cfr. supra)
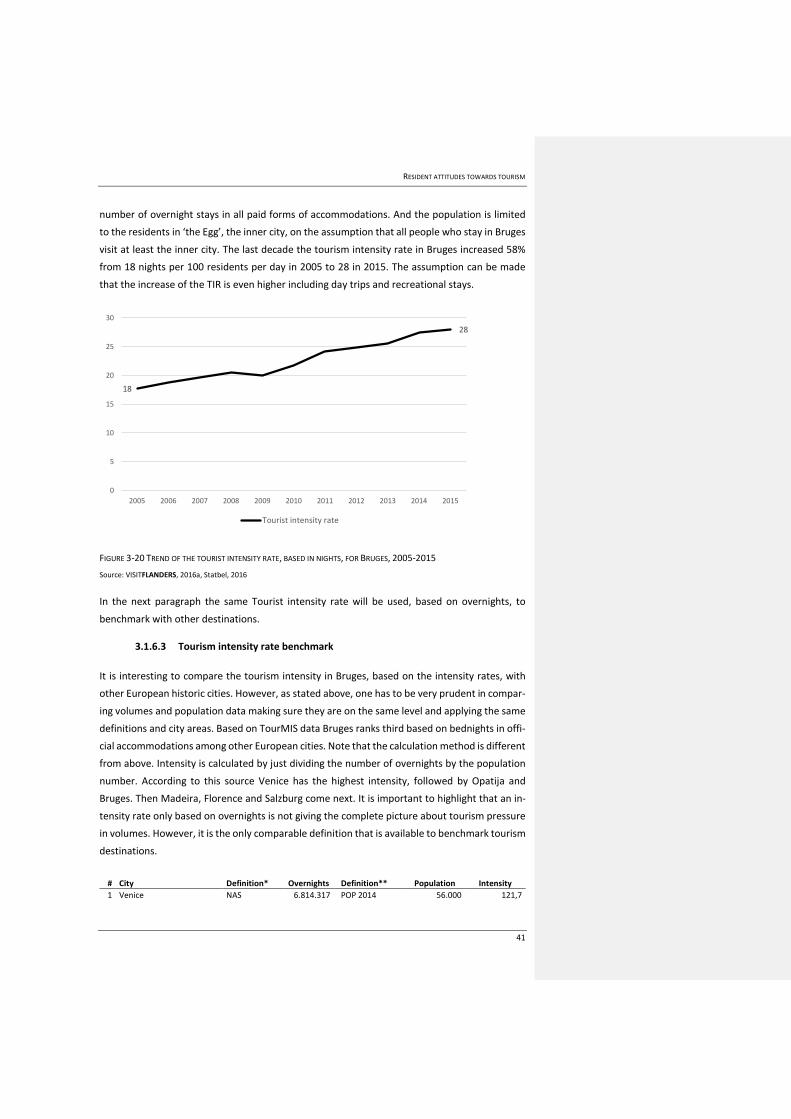
RESIDENT ATTITUDES TOWARDS TOURISM
41
number of overnight stays in all paid forms of accommodations. And the population is limited
to the residents in ‘the Egg’, the inner city, on the assumption that all people who stay in Bruges
visit at least the inner city. The last decade the tourism intensity rate in Bruges increased 58%
from 18 nights per 100 residents per day in 2005 to 28 in 2015. The assumption can be made
that the increase of the TIR is even higher including day trips and recreational stays.
FIGURE 3-20 TREND OF THE TOURIST INTENSITY RATE, BASED IN NIGHTS, FOR BRUGES, 2005-2015
Source: VISITFLANDERS, 2016a, Statbel, 2016
In the next paragraph the same Tourist intensity rate will be used, based on overnights, to
benchmark with other destinations.
3.1.6.3 Tourism intensity rate benchmark
It is interesting to compare the tourism intensity in Bruges, based on the intensity rates, with
other European historic cities. However, as stated above, one has to be very prudent in compar-
ing volumes and population data making sure they are on the same level and applying the same
definitions and city areas. Based on TourMIS data Bruges ranks third based on bednights in offi-
cial accommodations among other European cities. Note that the calculation method is different
from above. Intensity is calculated by just dividing the number of overnights by the population
number. According to this source Venice has the highest intensity, followed by Opatija and
Bruges. Then Madeira, Florence and Salzburg come next. It is important to highlight that an in-
tensity rate only based on overnights is not giving the complete picture about tourism pressure
in volumes. However, it is the only comparable definition that is available to benchmark tourism
destinations.
# City Definition* Overnights Definition** Population Intensity
1 Venice NAS 6.814.317 POP 2014 56.000 121,7
18
28
0
5
10
15
20
25
30
2005 2006 2007 2008 2009 2010 2011 2012 2013 2014 2015
Tourist intensity rate
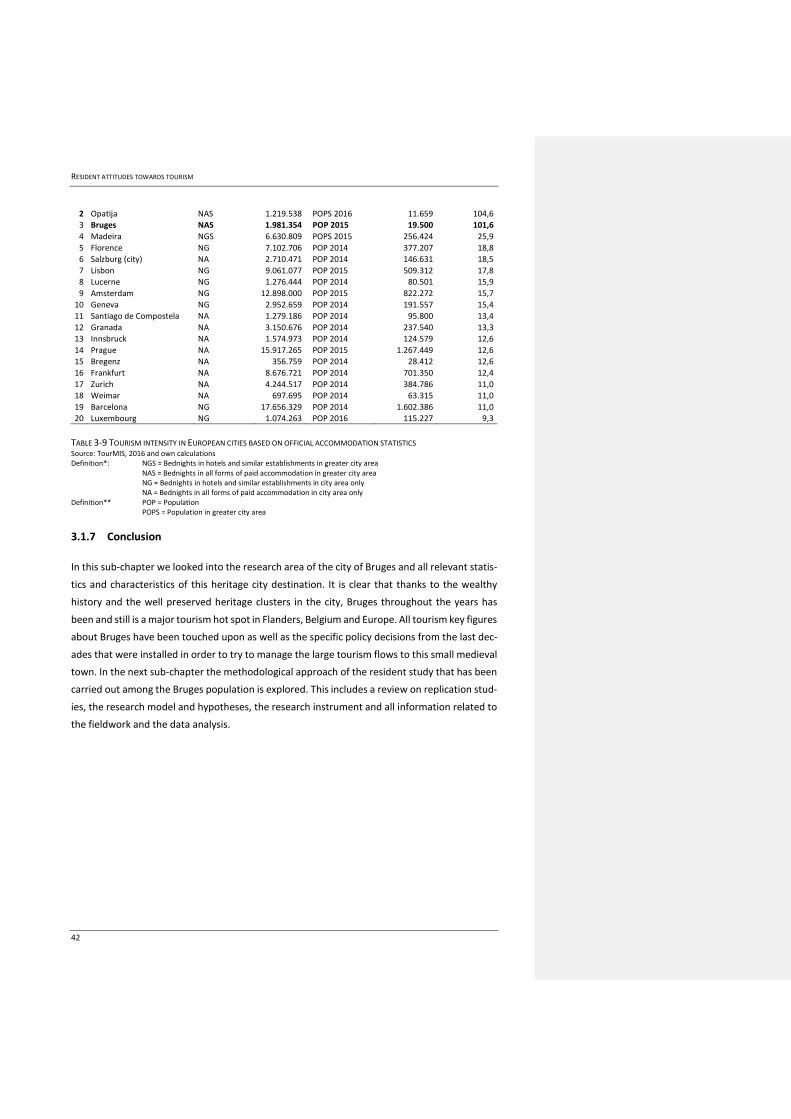
RESIDENT ATTITUDES TOWARDS TOURISM
42
2 Opatija NAS 1.219.538 POPS 2016 11.659 104,6
3 Bruges NAS 1.981.354 POP 2015 19.500 101,6
4 Madeira NGS 6.630.809 POPS 2015 256.424 25,9
5 Florence NG 7.102.706 POP 2014 377.207 18,8
6 Salzburg (city) NA 2.710.471 POP 2014 146.631 18,5
7 Lisbon NG 9.061.077 POP 2015 509.312 17,8
8 Lucerne NG 1.276.444 POP 2014 80.501 15,9
9 Amsterdam NG 12.898.000 POP 2015 822.272 15,7
10 Geneva NG 2.952.659 POP 2014 191.557 15,4
11 Santiago de Compostela NA 1.279.186 POP 2014 95.800 13,4
12 Granada NA 3.150.676 POP 2014 237.540 13,3
13 Innsbruck NA 1.574.973 POP 2014 124.579 12,6
14 Prague NA 15.917.265 POP 2015 1.267.449 12,6
15 Bregenz NA 356.759 POP 2014 28.412 12,6
16 Frankfurt NA 8.676.721 POP 2014 701.350 12,4
17 Zurich NA 4.244.517 POP 2014 384.786 11,0
18 Weimar NA 697.695 POP 2014 63.315 11,0
19 Barcelona NG 17.656.329 POP 2014 1.602.386 11,0
20 Luxembourg NG 1.074.263 POP 2016 115.227 9,3
TABLE 3-9 TOURISM INTENSITY IN EUROPEAN CITIES BASED ON OFFICIAL ACCOMMODATION STATISTICS Source: TourMIS, 2016 and own calculations Definition*: NGS = Bednights in hotels and similar establishments in greater city area
NAS = Bednights in all forms of paid accommodation in greater city area NG = Bednights in hotels and similar establishments in city area only NA = Bednights in all forms of paid accommodation in city area only
Definition** POP = Population POPS = Population in greater city area
3.1.7 Conclusion
In this sub-chapter we looked into the research area of the city of Bruges and all relevant statis-
tics and characteristics of this heritage city destination. It is clear that thanks to the wealthy
history and the well preserved heritage clusters in the city, Bruges throughout the years has
been and still is a major tourism hot spot in Flanders, Belgium and Europe. All tourism key figures
about Bruges have been touched upon as well as the specific policy decisions from the last dec-
ades that were installed in order to try to manage the large tourism flows to this small medieval
town. In the next sub-chapter the methodological approach of the resident study that has been
carried out among the Bruges population is explored. This includes a review on replication stud-
ies, the research model and hypotheses, the research instrument and all information related to
the fieldwork and the data analysis.
RESIDENT ATTITUDES TOWARDS TOURISM
43
3.2 Selection of methodology
3.2.1 Introduction
Is it true there are too many tourists in Bruges today, and is the overwhelming current crowd
already a threat to the city’s image, to the inhabitants’ attitudes towards tourism and to the
future sustainable developments of tourism in the city? It will be a combination of insights and
indicators both qualitative and quantitative that will have to lead to one or the other conclusion.
The object of this thesis is not to find the complex holistic answer to this broad subject. This
study wants to gain insight in the residents’ attitudes towards tourism in Bruges, which is one
part of the carrying capacity in Bruges.
Focusing on the residents’ attitudes, however, this study will have multiple goals. It will support
the creation of a strategy on crowding, carrying capacity and sustainability for the Regional Tour-
ism Organization ‘VISITFLANDERS’ in Belgium. The study also aims at gaining practical insights
for the new tourism city management strategy for the local Bruges Destination Management
Organization ‘Visit Bruges’, which will be developed in 2017. And it will serve as a replication
study for the RETS studies that were carried out in the US and in Japan by Boley et al. (2014,
2015) and Boley & McGehee (2014). In 2014, after finishing the first RETS study in Virginia in the
US, Boley et al. state in Annals of Tourism Research: “…it would be of interest to test empower-
ment’s influence on residents’ attitudes toward tourism in urban settings…” a call to carry out
residents’ attitude studies in tourism cities as well (Boley, McGehee, Perdue & Long, 2014, p.
48). This study aims at testing the RETS concept in the European historic touristic city of Bruges.
3.2.2 Introduction to replication studies
In a replication study another study is repeated with (partly) the same methods, using the same
concepts but with other subjects, often in another environment. The primary study should ad-
dress appropriate, theoretically interesting and currently relevant research questions, in order
to be suitable for replication (Mackey, 2012). In replication studies an existing theory or concept
can be applied in a new situation, another geographical area, another culture, etc. Replication
studies are useful to help extending the generalization of research results (Muma, 1993). They
provide two kinds of information: verification or disconfirmation. “If replications yield findings
similar to those in previous studies, a verification function would have been achieved. … Repli-
cations that yield findings in conflict with previous research disconfirm some aspects of the sub-
stantive base of a field” (Muma, 1993, p. 927). False findings may be originated either in the
original study or in the replication setting. These findings are known as Type 1 and Type 2 errors.
A Type 1 error is rejecting the null hypothesis when, in fact, the hypothesis is true. A Type 2 error
is accepting the null hypothesis when, in fact, it is false.
RESIDENT ATTITUDES TOWARDS TOURISM
44
Replication, therefore, can be important and useful for a number of reasons: first the assurance
that the results are valid and reliable. Muma (1993, p. 927) states that “a fact is not a fact unless
it is replicable”. Replicated results not only become factual but constitute a substantiation and
verification function that extends external validity. Second, the determination of generalizability
or the exploration of extraneous variables. Third, the application of results to real world situa-
tions. And finally, the inspiration of new research combining previous findings from related stud-
ies.
Replication studies have a long history in academic research and “are a key element of the sci-
entific method and a staple in many disciplines” (Duncan et al., 2014, p. 2417). In 1993 Muma
cited many different sources, going back to the Fifties of the previous century, demonstrating
the importance and relevance of replication studies: “Replication research is considered generic
to all science (Campbell, 1969), the cornerstone of any science (Lachenmeyer, 1971), at the heart
of science (Hensen & Barlow, 1976; McGuigan, 1978), a basic tenet of scientific advancement
(Smith, 1975), one of the basic principles of competent research (Huck, Cormier, & Bounds,
1974; Kessen, 1960), imperative to science (Madge, 1962), and generally important to scientific
concerns (Beveridge, 1957; Blalock, 1970)”. Within social science research “… replication is so
important that some scholars believe that a study is not complete until it has been replicated”
(Muma, 1993, p. 927).
Replication studies are widely accepted in many domains and a hallmark of scientific research
in specifically medical sciences (Spector et al., 2015). Not surprisingly most of these studies can
be found in medical academic work. In a search for academic articles that were tagged as ‘repli-
cation studies’ on the KULeuven University online library (Limo, 2016) over 70% of 2.129 repli-
cation studies were in medicine or pharmaceutical sciences. 11% were in psychology or psychi-
atry, only a few in biology, and most of the rest is published on the ‘PLoS One’ portal. Replication
studies in social sciences, except for psychology, and especially in tourism are very rare. Indeed,
replication study results in general often seems to be ignored in international journals, as Dwyer
et al. state in their handbook of research methods in tourism: “…although replication is a pillar
of scientific research, replication is not rewarded in scientific journals. Journal editors often do
not recognize the merit of replication to challenge or further develop existing measures and
methodologies.” Dwyer et al. even say: ”While this is true for many areas, it is particularly true
for tourism.” (2012, p. 466).
Spector et al. list 3 main barriers that have prevented researchers and developers from execut-
ing replication studies (2015). The first barrier is the necessary funding. New concepts and stud-
ies that do not extend beyond a few years are more likely to be funded than replications. Second
is the willingness and eagerness of researchers to create their own instruments and concepts.
This might be driven by personal interest and the merits of having a better chance for interna-
tional publication with new concepts and original or innovative findings. And the third barrier is
the willingness of the other researchers that developed new concepts and methodologies to
RESIDENT ATTITUDES TOWARDS TOURISM
45
openly and freely share their instruments and knowledge with others. In our case of the replica-
tion of RETS in the Bruges context we must compliment Prof. Boley for his open and supportive
attitude.
Mackey mentions the catch-22 of replication in the field, since original research is often more
valued by journals and even American universities require that dissertations should be original
work (Mackey, 2012). She speaks about the unglamorous status of replication research in pro-
fessional journals and in the academic community in general. Additionally there might be the
fear not reaching the same results in the replication as in the original study (Young, 2012). More-
over, a widely reported paper in ‘Science’ in 2016 found that less than half of published research
in top peer reviewed psychology journals failed to replicate when repeated by other researchers
(Young, 2012).
The latter fact might be one of the reasons that explain why it is very difficult to find replication
studies in social sciences and in tourism research. It might even be that academics do not use
the words ‘replication study’ in their academic papers in order to avoid a cautious or unenthu-
siastic attitude from publicists and journals. This explains why many replication study reports
are published on PLoS One rather than in international journals. PLoS One is a peer reviewed
open access scientific online platform from the Public Library of Science that publishes 30.000
papers per year (if authors can afford paying a significant publication fee).
3.2.3 Research model & hypotheses
As outlined in paragraph 2.2.5 a theoretic model ‘Residents Empowerment Through Tourism
Scale’ (RETS) that has been created and validated in a rural area in the US. Later the model is
tested in Japan (Boley et al., 2015) and in Poland (Strzelecka et al., 2016). In this master’s thesis
the model will be applied in a European heritage city destination: Bruges. In this model Weber’s
theory of Formal and Substantive Rationality (WFSR) is used as a complement to Social Exchange
Theory (SET). RETS serves as the substantive antecedent for resident attitudes in the model,
personal economic benefits serve as formal antecedent.
Virginia (US), Oizumi (JP), and Bruges (BE) are completely different environments. They are all
three situated in different continents, and different cultures, have a different tourism core prod-
uct and show very different population volumes. Pomerania (PL) destination is a rural and
coastal environment. In Floyd County, one of the study regions in Virginia, the population den-
sity is only 25 inhabitants per km2, in Oizumi 2.292 per km2, in Bruges 4.516 per km2 in the inner
city. The Bruges outer city is less dens populated with 733 inhabitants per km2. Also the city area
in Bruges is much smaller than the other research areas. The Bruges inner city is only 4,3 km2
much smaller than the other researched areas. The tourism product in the Virginia area in Floyd
County is based in the music heritage of bluegrass music (Boley et al. 2015). Tourism in Oizumi,
Japan, is still in a developmental stage and is related to the Brazilian culture (Boley, Maruyama
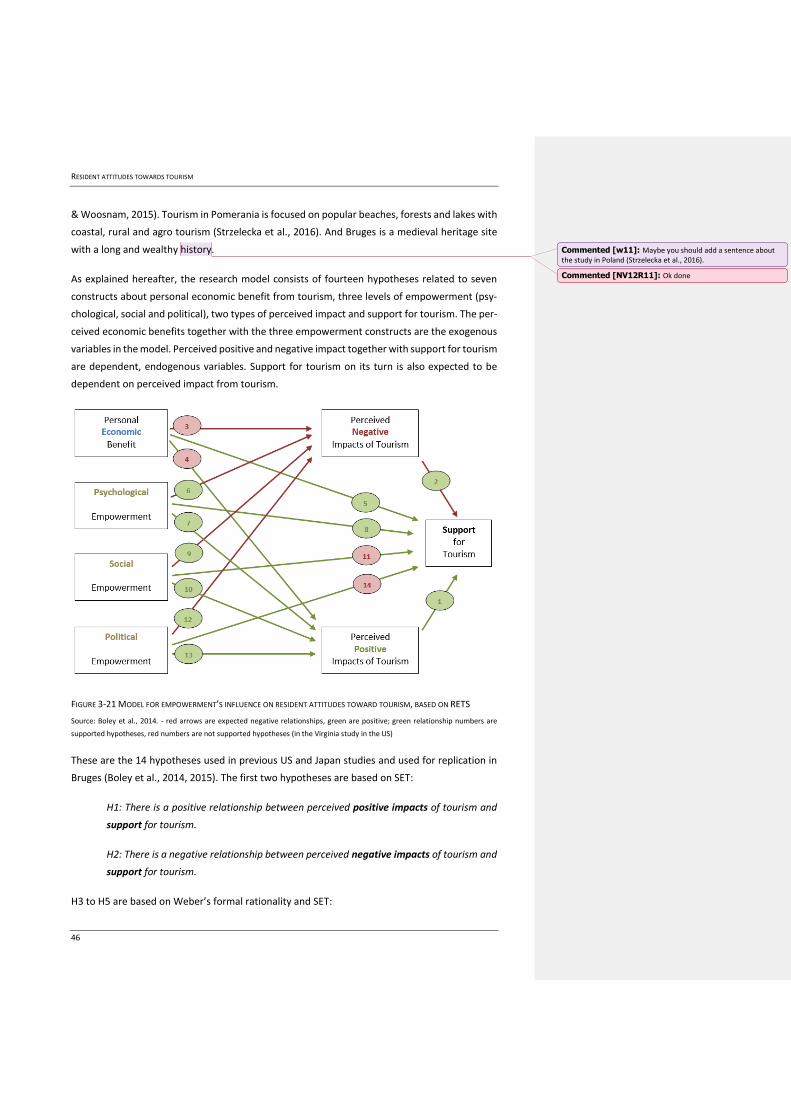
RESIDENT ATTITUDES TOWARDS TOURISM
46
& Woosnam, 2015). Tourism in Pomerania is focused on popular beaches, forests and lakes with
coastal, rural and agro tourism (Strzelecka et al., 2016). And Bruges is a medieval heritage site
with a long and wealthy history.
As explained hereafter, the research model consists of fourteen hypotheses related to seven
constructs about personal economic benefit from tourism, three levels of empowerment (psy-
chological, social and political), two types of perceived impact and support for tourism. The per-
ceived economic benefits together with the three empowerment constructs are the exogenous
variables in the model. Perceived positive and negative impact together with support for tourism
are dependent, endogenous variables. Support for tourism on its turn is also expected to be
dependent on perceived impact from tourism.
FIGURE 3-21 MODEL FOR EMPOWERMENT’S INFLUENCE ON RESIDENT ATTITUDES TOWARD TOURISM, BASED ON RETS
Source: Boley et al., 2014. - red arrows are expected negative relationships, green are positive; green relationship numbers are
supported hypotheses, red numbers are not supported hypotheses (in the Virginia study in the US)
These are the 14 hypotheses used in previous US and Japan studies and used for replication in
Bruges (Boley et al., 2014, 2015). The first two hypotheses are based on SET:
H1: There is a positive relationship between perceived positive impacts of tourism and
support for tourism.
H2: There is a negative relationship between perceived negative impacts of tourism and
support for tourism.
H3 to H5 are based on Weber’s formal rationality and SET:
Commented [w11]: Maybe you should add a sentence about the study in Poland (Strzelecka et al., 2016).
Commented [NV12R11]: Ok done

RESIDENT ATTITUDES TOWARDS TOURISM
47
H3: There is a negative relationship between perceived economic benefits from tourism
and negative impacts of tourism.
H4: There is a positive relationship between perceived economic benefits from tourism
and positive impacts of tourism.
H5: There is a positive relationship between perceived economic benefits from tourism
and support for tourism.
H6 to H14 are the RETS statements.
H6: Perceived psychological empowerment has a negative relationship with perceived
negative impacts from tourism.
H7: Perceived psychological empowerment has a positive relationship with perceived
positive impacts from tourism.
H8: Perceived psychological empowerment has a positive relationship with support for
tourism.
H9: Perceived social empowerment has a negative relationship with perceived negative
impacts from tourism.
H10: Perceived social empowerment has a positive relationship with perceived positive
impacts from tourism.
H11: Perceived social empowerment has a positive relationship with support for tour-
ism.
H12: Perceived political empowerment has a negative relationship with perceived neg-
ative impacts from tourism.
H13: Perceived political empowerment has a positive relationship with perceived posi-
tive impacts from tourism.
H14: Perceived political empowerment has a positive relationship with support for tour-
ism.
There are two more specific research questions related to the application of the RETS model.
One is linked to the output of RETS in Bruges: is there a difference in the relations between the
constructs and thus in the attitudes towards tourism in Bruges between the residents of the inner
city area versus the residents in the outer city area? The second one is the search for a leaner
RESIDENT ATTITUDES TOWARDS TOURISM
48
research model. The availability of benchmarking data about residents’ attitudes towards tour-
ism for different cities in Europe and in the world, based on the same model, would help tourism
managers in dealing with sustainability issues in their destinations. Therefore one of the goals is
to reduce the number of items in the seven constructs of the RETS model without compromising
on the model fit, the factor loadings or the discovered relations between the constructs. In other
words: is it possible to create a leaner set of construct items in RETS?
3.2.4 Research instrument
In the past many resident studies in tourism were carried out by means of a self-administered
door-to-door pen and paper research using a census-guided systematic random sampling
scheme (Boley et al. 2014). Advantages of this approach are: easy sampling abilities and repre-
sentativeness, a high response and the ability to include, or even focus on, minority groups that
are difficult to reach. Disadvantages include the time needed for visiting the residents and for
inputting the data, the danger of making manual input errors and the high cost. Already in 2002
Bryon stated that there should be possibilities in executing resident impact studies in tourism
online (Bryon, 2002). However, most resident studies in tourism that can be found today are still
not carried out online. In 2016 two examples of tourism host studies were executed via an online
methodology in Amsterdam (Stad Amsterdam, 2016) and Florence (ETOA, 2016).
For this study an online survey approach is chosen to investigate the Bruges residents’ attitudes
towards tourism. The aim is to test an online methodology that enables to replicate this study
in other cities in a time and cost efficient way, based on the RETS concept. Originally the main
focus for the fieldwork was supposed to be the Bruges inner city, also referred to as ‘the Egg’
(see Figure 3-6). About 19.500 people or 17% of all Bruges inhabitants live there, in or close to
the tourism center. The study population consists of 16.950 hosts that are 18 years and older
(Statbel, 2016). All other Bruges inhabitants from outside the ‘Egg’ that are 18 years or older
could also participate. In the rest of Bruges 98.000 people are living of which about 80.000 are
18 years and older. Taking into account both the inner and outer city the total research popula-
tion counts slightly over 97.000 residents 18 years and older. There were four reasons to include
the residents of the outer city as well. First, it will be very interesting and relevant to compare
the attitudes of the residents in the inner city to those of the people in the other communities.
Second, since one of the goals of this study is to support the creation of a new strategy for tour-
ism in Bruges, inhabitants from all municipalities should be able to have a voice. Third, never
before in resident studies in Bruges the hosts from outside the inner city were included. And
forth, a practical reason, it was not possible for all data sources to distinguish between inhabit-
ants of the inner city and the other communities. In the analysis this distinction can be made
based on the question in which borough or community people live.
RESIDENT ATTITUDES TOWARDS TOURISM
49
Since the citizens’ opinions about tourism in their surroundings can be a sensitive subject and
also action groups that manifest against tourism in the city exist, it is important to execute the
field work of the study in a closed setting. Consequently, only people that are invited to the
survey can participate. Other examples of recent residents studies in Amsterdam and Florence
managed to get several thousand respondents by opening the study up to all residents via social
media and local newspapers. In the Bruges case residents email addresses originated from two
main sources: a Bruges panel from a research company and an email database from the Bruges
city administration. A third source was created within the other two sources by giving respond-
ents the chance to offer a maximum of four email addresses from people that are living in the
inner city, in order to maximize the number of completes there. In order to avoid double entries
from the same respondent two levels of checks were included every time new invitees were
invited: first, email addresses of actual respondents were matched with email addresses from
new invitees from the other source, and second, in the beginning of the questionnaire respond-
ents had to state that this was the first time they replied to this questionnaire. If they did not
comply they were screened out. In the case of the responses from the research company this
check was performed by them since we did not have access to those people’s contact details.
Source 1, the panel, is consisted of a wide variety of Bruges inhabitants from all different munic-
ipalities and boroughs and from all ages and education levels. The same goes for the database
of the city administration. These email addresses were collected via the online city administra-
tion portal.
Residents were invited via email for a study jointly organized by ‘Visit Bruges’, ‘VISITFLANDERS’
and ‘MODUL University Vienna’ to share their opinion about tourism in their city. An English
translation of the invitation letter can be found in the Annex. Participants who completed the
full questionnaire had a chance to win a neutral incentive: one dinner for two in a Bruges res-
taurant or one of ten movie tickets for two.
As online research tool the professional system ‘Opinio’ from the Norwegian company ‘Object-
planet’ is used, hosted by VISITFLANDERS. Opinio surveys are responsive, respondents can an-
swer in a convenient way on PC, laptop, smartphone or tablet. Respondents can take a break if
they want, uncompleted surveys can be finalized at a later time.
3.2.5 Questionnaire
The questionnaire consisted of the seven building blocks, called ‘constructs’ of the RETS concep-
tual model: personal economic benefit from tourism, psychological empowerment, social em-
powerment, political empowerment, support for tourism, negative impacts of tourism and pos-
itive impacts of tourism. In order to assure translational and linguistic equivalence back transla-
tions from the RETS statements were performed from English to Dutch and vice versa (Boley et
RESIDENT ATTITUDES TOWARDS TOURISM
50
al. 2015). All original statements were translated from English into Dutch by four persons, com-
pared, and translated back into English by four other persons in order to have the best possible
translation and to avoid losing meaningful details in the translation. In total 35 statements from
the RETS model were translated: five for psychological empowerment, three for social empow-
erment, four for political empowerment, four for economic benefit, three for perceived negative
impact, ten for perceived positive impact and five for support for tourism. All statements for
each of the seven constructs are included in Table 3-10. Residents were asked to mark their level
of agreement on a five-point Likert type scale: 1= strongly disagree, 2=disagree, 3=neutral,
4=agree, 5=strongly agree.
Personal economic benefit from tourism
Tourism in Bruges helps me pay my bills A portion of my income is tied to tourism in Bruges I would economically benefit from more tourism development in Bruges My family’s economic future depends upon tourism in Bruges
Psychological empowerment
Tourism in Bruges… makes me proud to be a Bruges Resident makes me feel special because people travel to see my city's unique features makes me want to tell others about what we have to offer in Bruges reminds me that I have a unique culture to share with visitors makes me want to work to keep Bruges special
Social empowerment
Tourism in Bruges… makes me feel more connected to my community fosters a sense of ‘community spirit’ within me provides ways for me to get involved in my community
Political empowerment
I feel like… I have a voice in Bruges tourism development decisions I have access to the decision making process when it comes to tourism in Bruges my vote makes a difference in how tourism is developed in Bruges I have an outlet to share my concerns about tourism development in Bruges
Perceived negative impact
An increase in tourists in Bruges will lead to friction between homeowners and tourists Tourism causes Bruges to be overcrowded Tourism results in an increase of the cost of living in Bruges
Perceived positive impact
Tourism development improves the physical appearance of Bruges Tourism provides incentives for new park development in Bruges Tourism development increases the number of recreational opportunities for local homeowners in Bruges Tourism helps preserve the cultural identity and restoration of historical buildings in Bruges Shopping, restaurants, and entertainment options are better in Bruges as a result of tourism Tourism contributes to income and standard of living in Bruges Increasing the number of tourists visiting Bruges improves the local economy Tourism encourages more public development in Bruges (e.g., roads, public facilities) Tourism development increases the quality of life in Bruges Tourism provides incentives for protection and conservation of natural resources in Bruges
Support for tourism
In general, the positive benefits of tourism outweigh negative impacts in Bruges I believe tourism should be actively encouraged in Bruges
RESIDENT ATTITUDES TOWARDS TOURISM
51
I support tourism and want to see it remain important to Bruges Bruges should remain a tourist destination Bruges should support the promotion of tourism
TABLE 3-10 RETS SCALE ITEMS FOR SEVEN CONSTRUCTS SOURCE: BOLEY ET AL. 2014
Besides the RETS statements other relevant questions to support and feed tourism policy mak-
ing in the city of Bruges were included as well as behavioral characteristics of the inhabitants. A
selection of these subject were: the interest to be more involved in the planning and policy mak-
ing process of tourism in Bruges, the matter how to be involved in that planning process, the
desire to have more, equal or less tourists in the future (differentiated by type of tourists: Indi-
vidual tourists; Group tourists; Day tourists; Overnight stay tourists; Cruise tourists), participa-
tion in Bruges organizations or associations, mobility behavior within the city, avoiding behavior
with regards to the inner city and the attitude towards and participation in AirBnB.
The final questionnaire is checked with Prof. Bynum Boley, main author of the articles on RETS
applications in the US and Japan, in order to assure that the questionnaire is suitable for a rep-
lication study in Europe. Also Visit Bruges and several tourism research experts at VISITFLAN-
DERS, including a tourism researcher that has lived in Bruges for a very long time, have helped
to create the best possible questionnaire to be complementary to the RETS statements.
3.2.6 Survey launch and pilot tests
Mid-September 2016 a soft launch was organized on the panel database of the online research
company in order to test the overall performance of the online survey and to check the data and
the routings of the online questionnaire. When about 100 completes were saved checks were
performed. There was no need to make changes to the survey script. All data was properly
stored. The average length of survey was 15 minutes (trimmed for 5% outliers). After this exam-
ination the full launch was carried out. All non-responding invitees received a maximum of two
reminders in order to maximize the response.
After the first wave with the research company 1.739 Bruges residents from the city administra-
tion database were invited to answer the survey. In both waves (panel and city administration
database) respondents had the chance to provide a maximum of four email address from other
people in the inner city. This lead to an input of 271 extra invitees and 89 extra usable completes
in the inner city. This extra action can be evaluated as successful.
3.2.7 Response and representativeness
In total 1.545 respondents started the survey of which 88% completed. For the panel phase the
response rate cannot be determined. For the other two phases the response rate was 38% and
37% respectively, which can be considered to be high in online research. 107 entrees were from
people who recently moved out of Bruges (screenouts), they were excluded from the ‘valuable
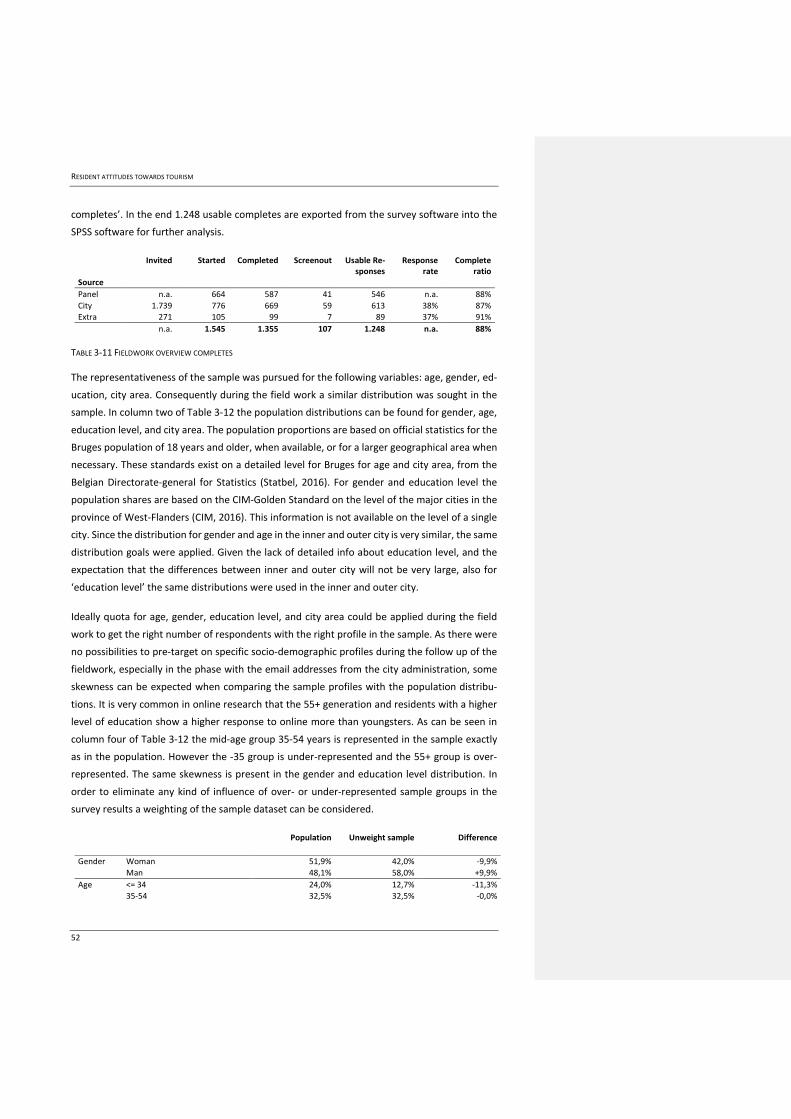
RESIDENT ATTITUDES TOWARDS TOURISM
52
completes’. In the end 1.248 usable completes are exported from the survey software into the
SPSS software for further analysis.
Source
Invited Started Completed Screenout Usable Re-sponses
Response rate
Complete ratio
Panel n.a. 664 587 41 546 n.a. 88%
City 1.739 776 669 59 613 38% 87%
Extra 271 105 99 7 89 37% 91%
n.a. 1.545 1.355 107 1.248 n.a. 88%
TABLE 3-11 FIELDWORK OVERVIEW COMPLETES
The representativeness of the sample was pursued for the following variables: age, gender, ed-
ucation, city area. Consequently during the field work a similar distribution was sought in the
sample. In column two of Table 3-12 the population distributions can be found for gender, age,
education level, and city area. The population proportions are based on official statistics for the
Bruges population of 18 years and older, when available, or for a larger geographical area when
necessary. These standards exist on a detailed level for Bruges for age and city area, from the
Belgian Directorate-general for Statistics (Statbel, 2016). For gender and education level the
population shares are based on the CIM-Golden Standard on the level of the major cities in the
province of West-Flanders (CIM, 2016). This information is not available on the level of a single
city. Since the distribution for gender and age in the inner and outer city is very similar, the same
distribution goals were applied. Given the lack of detailed info about education level, and the
expectation that the differences between inner and outer city will not be very large, also for
‘education level’ the same distributions were used in the inner and outer city.
Ideally quota for age, gender, education level, and city area could be applied during the field
work to get the right number of respondents with the right profile in the sample. As there were
no possibilities to pre-target on specific socio-demographic profiles during the follow up of the
fieldwork, especially in the phase with the email addresses from the city administration, some
skewness can be expected when comparing the sample profiles with the population distribu-
tions. It is very common in online research that the 55+ generation and residents with a higher
level of education show a higher response to online more than youngsters. As can be seen in
column four of Table 3-12 the mid-age group 35-54 years is represented in the sample exactly
as in the population. However the -35 group is under-represented and the 55+ group is over-
represented. The same skewness is present in the gender and education level distribution. In
order to eliminate any kind of influence of over- or under-represented sample groups in the
survey results a weighting of the sample dataset can be considered.
Population Unweight sample Difference
Gender Woman 51,9% 42,0% -9,9%
Man 48,1% 58,0% +9,9%
Age <= 34 24,0% 12,7% -11,3% 35-54 32,5% 32,5% -0,0%
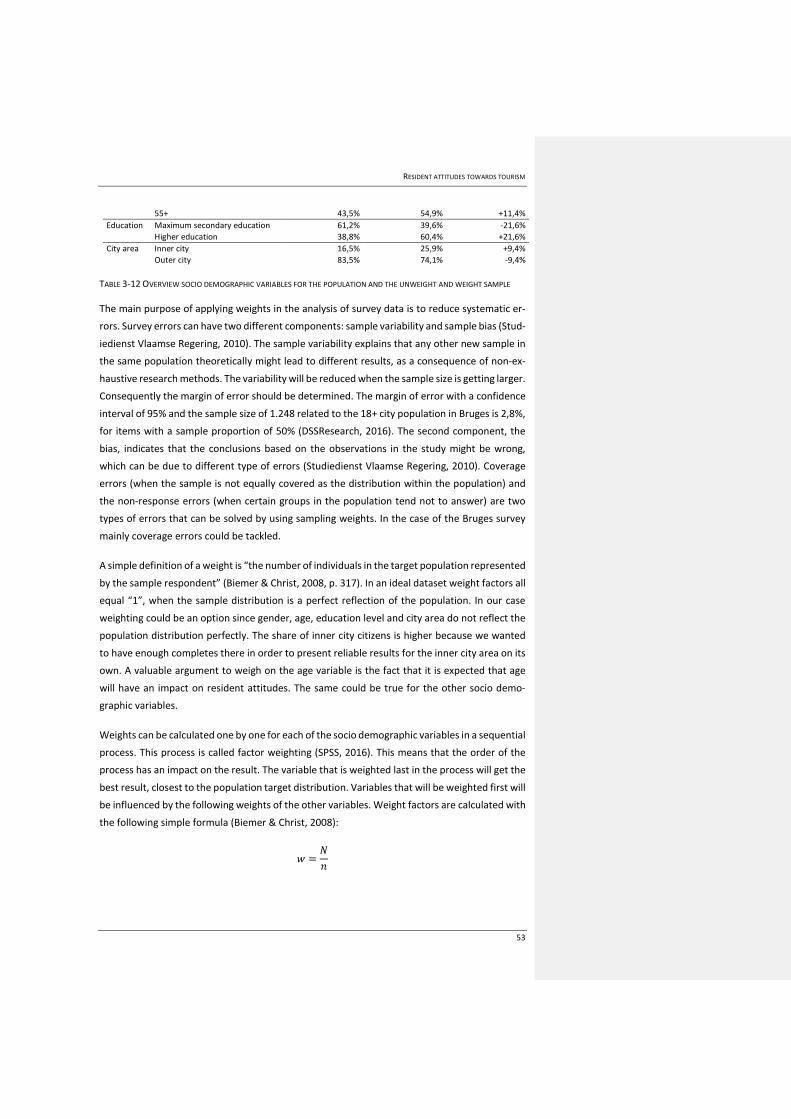
RESIDENT ATTITUDES TOWARDS TOURISM
53
55+ 43,5% 54,9% +11,4%
Education Maximum secondary education 61,2% 39,6% -21,6%
Higher education 38,8% 60,4% +21,6%
City area Inner city 16,5% 25,9% +9,4% Outer city 83,5% 74,1% -9,4%
TABLE 3-12 OVERVIEW SOCIO DEMOGRAPHIC VARIABLES FOR THE POPULATION AND THE UNWEIGHT AND WEIGHT SAMPLE
The main purpose of applying weights in the analysis of survey data is to reduce systematic er-
rors. Survey errors can have two different components: sample variability and sample bias (Stud-
iedienst Vlaamse Regering, 2010). The sample variability explains that any other new sample in
the same population theoretically might lead to different results, as a consequence of non-ex-
haustive research methods. The variability will be reduced when the sample size is getting larger.
Consequently the margin of error should be determined. The margin of error with a confidence
interval of 95% and the sample size of 1.248 related to the 18+ city population in Bruges is 2,8%,
for items with a sample proportion of 50% (DSSResearch, 2016). The second component, the
bias, indicates that the conclusions based on the observations in the study might be wrong,
which can be due to different type of errors (Studiedienst Vlaamse Regering, 2010). Coverage
errors (when the sample is not equally covered as the distribution within the population) and
the non-response errors (when certain groups in the population tend not to answer) are two
types of errors that can be solved by using sampling weights. In the case of the Bruges survey
mainly coverage errors could be tackled.
A simple definition of a weight is “the number of individuals in the target population represented
by the sample respondent” (Biemer & Christ, 2008, p. 317). In an ideal dataset weight factors all
equal “1”, when the sample distribution is a perfect reflection of the population. In our case
weighting could be an option since gender, age, education level and city area do not reflect the
population distribution perfectly. The share of inner city citizens is higher because we wanted
to have enough completes there in order to present reliable results for the inner city area on its
own. A valuable argument to weigh on the age variable is the fact that it is expected that age
will have an impact on resident attitudes. The same could be true for the other socio demo-
graphic variables.
Weights can be calculated one by one for each of the socio demographic variables in a sequential
process. This process is called factor weighting (SPSS, 2016). This means that the order of the
process has an impact on the result. The variable that is weighted last in the process will get the
best result, closest to the population target distribution. Variables that will be weighted first will
be influenced by the following weights of the other variables. Weight factors are calculated with
the following simple formula (Biemer & Christ, 2008):
𝑤 =𝑁
𝑛
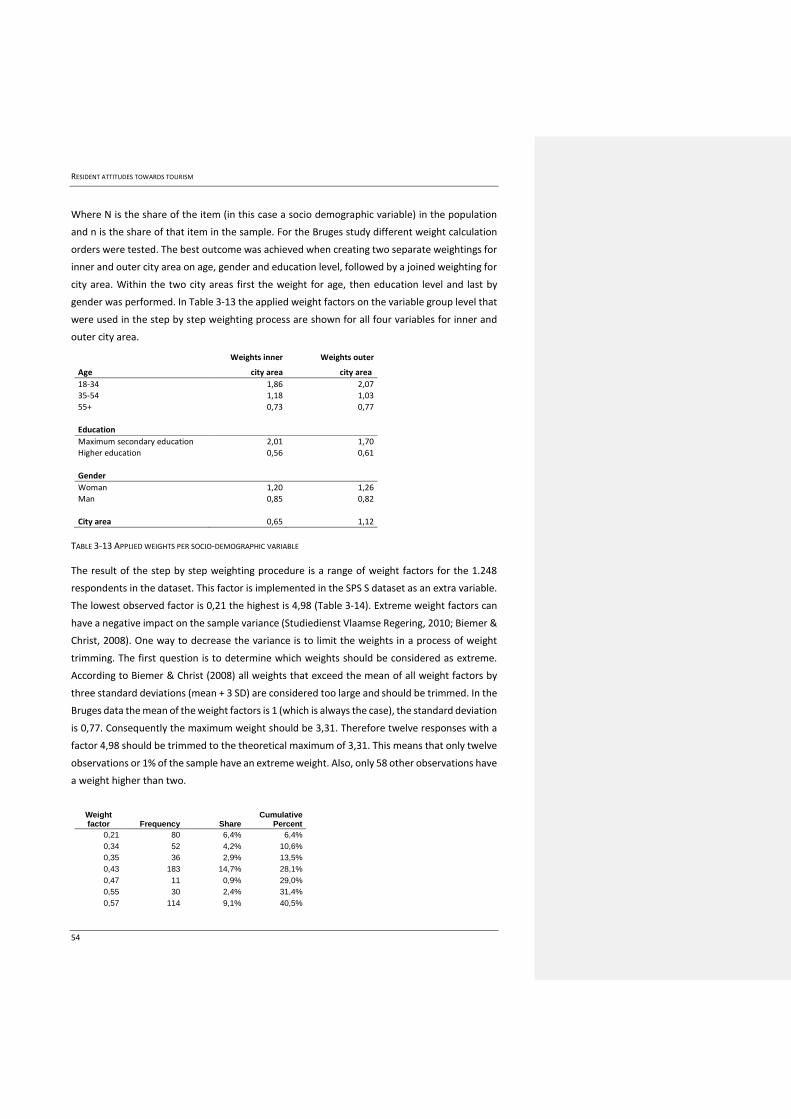
RESIDENT ATTITUDES TOWARDS TOURISM
54
Where N is the share of the item (in this case a socio demographic variable) in the population
and n is the share of that item in the sample. For the Bruges study different weight calculation
orders were tested. The best outcome was achieved when creating two separate weightings for
inner and outer city area on age, gender and education level, followed by a joined weighting for
city area. Within the two city areas first the weight for age, then education level and last by
gender was performed. In Table 3-13 the applied weight factors on the variable group level that
were used in the step by step weighting process are shown for all four variables for inner and
outer city area.
Weights inner Weights outer
Age city area city area
18-34 1,86 2,07
35-54 1,18 1,03
55+ 0,73 0,77
Education
Maximum secondary education 2,01 1,70
Higher education 0,56 0,61
Gender
Woman 1,20 1,26
Man 0,85 0,82
City area 0,65 1,12
TABLE 3-13 APPLIED WEIGHTS PER SOCIO-DEMOGRAPHIC VARIABLE
The result of the step by step weighting procedure is a range of weight factors for the 1.248
respondents in the dataset. This factor is implemented in the SPS S dataset as an extra variable.
The lowest observed factor is 0,21 the highest is 4,98 (Table 3-14). Extreme weight factors can
have a negative impact on the sample variance (Studiedienst Vlaamse Regering, 2010; Biemer &
Christ, 2008). One way to decrease the variance is to limit the weights in a process of weight
trimming. The first question is to determine which weights should be considered as extreme.
According to Biemer & Christ (2008) all weights that exceed the mean of all weight factors by
three standard deviations (mean + 3 SD) are considered too large and should be trimmed. In the
Bruges data the mean of the weight factors is 1 (which is always the case), the standard deviation
is 0,77. Consequently the maximum weight should be 3,31. Therefore twelve responses with a
factor 4,98 should be trimmed to the theoretical maximum of 3,31. This means that only twelve
observations or 1% of the sample have an extreme weight. Also, only 58 other observations have
a weight higher than two.
Weight factor Frequency Share
Cumulative Percent
0,21 80 6,4% 6,4%
0,34 52 4,2% 10,6%
0,35 36 2,9% 13,5%
0,43 183 14,7% 28,1%
0,47 11 0,9% 29,0%
0,55 30 2,4% 31,4%
0,57 114 9,1% 40,5%
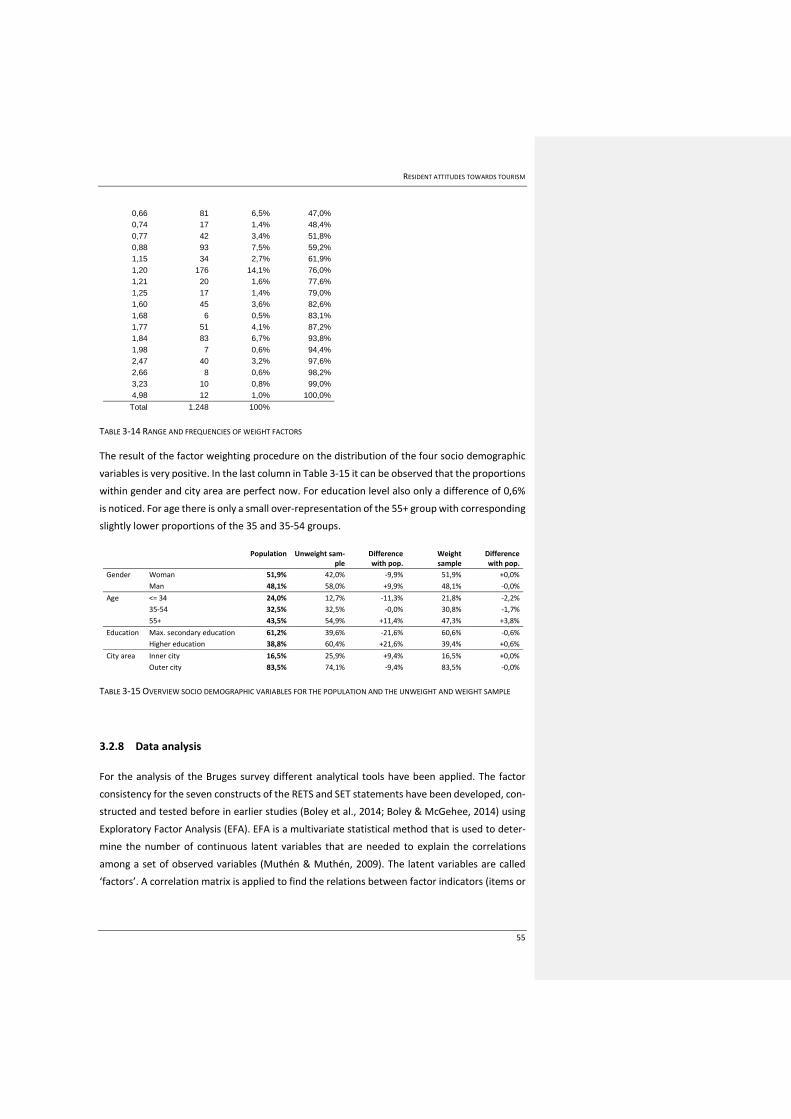
RESIDENT ATTITUDES TOWARDS TOURISM
55
0,66 81 6,5% 47,0%
0,74 17 1,4% 48,4%
0,77 42 3,4% 51,8%
0,88 93 7,5% 59,2%
1,15 34 2,7% 61,9%
1,20 176 14,1% 76,0%
1,21 20 1,6% 77,6%
1,25 17 1,4% 79,0%
1,60 45 3,6% 82,6%
1,68 6 0,5% 83,1%
1,77 51 4,1% 87,2%
1,84 83 6,7% 93,8%
1,98 7 0,6% 94,4%
2,47 40 3,2% 97,6%
2,66 8 0,6% 98,2%
3,23 10 0,8% 99,0%
4,98 12 1,0% 100,0%
Total 1.248 100%
TABLE 3-14 RANGE AND FREQUENCIES OF WEIGHT FACTORS
The result of the factor weighting procedure on the distribution of the four socio demographic
variables is very positive. In the last column in Table 3-15 it can be observed that the proportions
within gender and city area are perfect now. For education level also only a difference of 0,6%
is noticed. For age there is only a small over-representation of the 55+ group with corresponding
slightly lower proportions of the 35 and 35-54 groups.
Population Unweight sam-
ple Difference with pop.
Weight sample
Difference with pop.
Gender Woman 51,9% 42,0% -9,9% 51,9% +0,0%
Man 48,1% 58,0% +9,9% 48,1% -0,0%
Age <= 34 24,0% 12,7% -11,3% 21,8% -2,2% 35-54 32,5% 32,5% -0,0% 30,8% -1,7%
55+ 43,5% 54,9% +11,4% 47,3% +3,8%
Education Max. secondary education 61,2% 39,6% -21,6% 60,6% -0,6%
Higher education 38,8% 60,4% +21,6% 39,4% +0,6%
City area Inner city 16,5% 25,9% +9,4% 16,5% +0,0% Outer city 83,5% 74,1% -9,4% 83,5% -0,0%
TABLE 3-15 OVERVIEW SOCIO DEMOGRAPHIC VARIABLES FOR THE POPULATION AND THE UNWEIGHT AND WEIGHT SAMPLE
3.2.8 Data analysis
For the analysis of the Bruges survey different analytical tools have been applied. The factor
consistency for the seven constructs of the RETS and SET statements have been developed, con-
structed and tested before in earlier studies (Boley et al., 2014; Boley & McGehee, 2014) using
Exploratory Factor Analysis (EFA). EFA is a multivariate statistical method that is used to deter-
mine the number of continuous latent variables that are needed to explain the correlations
among a set of observed variables (Muthén & Muthén, 2009). The latent variables are called
‘factors’. A correlation matrix is applied to find the relations between factor indicators (items or
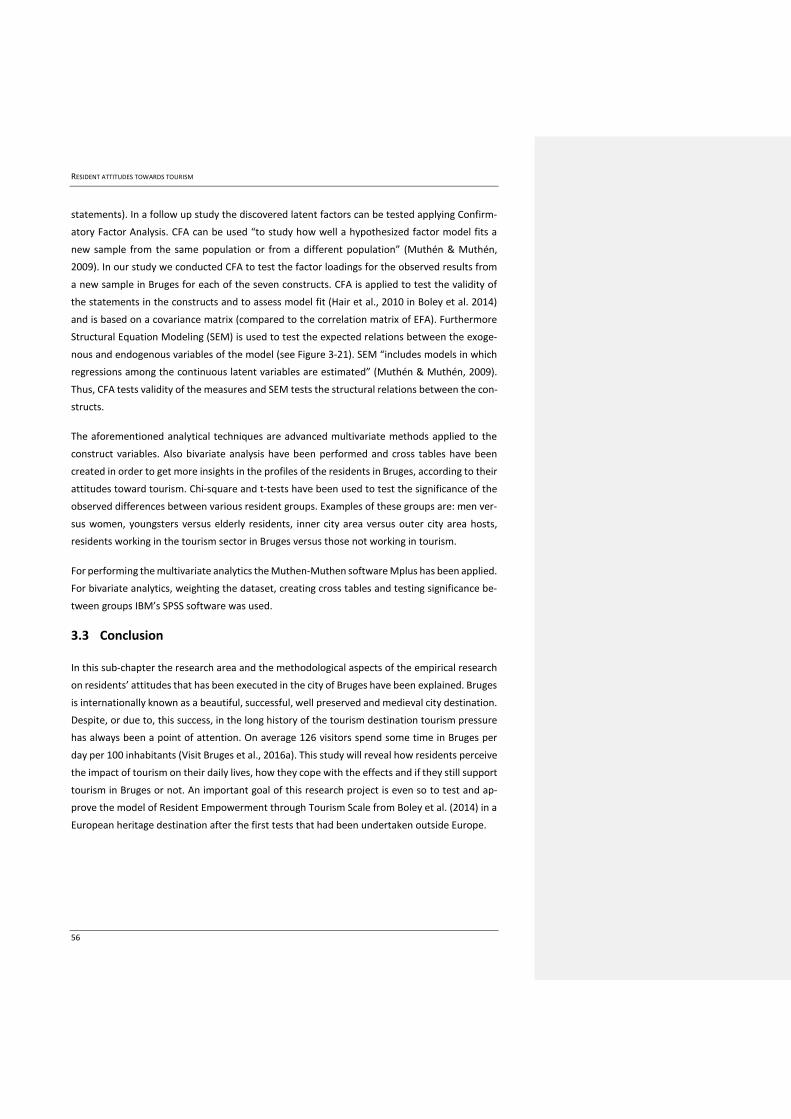
RESIDENT ATTITUDES TOWARDS TOURISM
56
statements). In a follow up study the discovered latent factors can be tested applying Confirm-
atory Factor Analysis. CFA can be used “to study how well a hypothesized factor model fits a
new sample from the same population or from a different population” (Muthén & Muthén,
2009). In our study we conducted CFA to test the factor loadings for the observed results from
a new sample in Bruges for each of the seven constructs. CFA is applied to test the validity of
the statements in the constructs and to assess model fit (Hair et al., 2010 in Boley et al. 2014)
and is based on a covariance matrix (compared to the correlation matrix of EFA). Furthermore
Structural Equation Modeling (SEM) is used to test the expected relations between the exoge-
nous and endogenous variables of the model (see Figure 3-21). SEM “includes models in which
regressions among the continuous latent variables are estimated” (Muthén & Muthén, 2009).
Thus, CFA tests validity of the measures and SEM tests the structural relations between the con-
structs.
The aforementioned analytical techniques are advanced multivariate methods applied to the
construct variables. Also bivariate analysis have been performed and cross tables have been
created in order to get more insights in the profiles of the residents in Bruges, according to their
attitudes toward tourism. Chi-square and t-tests have been used to test the significance of the
observed differences between various resident groups. Examples of these groups are: men ver-
sus women, youngsters versus elderly residents, inner city area versus outer city area hosts,
residents working in the tourism sector in Bruges versus those not working in tourism.
For performing the multivariate analytics the Muthen-Muthen software Mplus has been applied.
For bivariate analytics, weighting the dataset, creating cross tables and testing significance be-
tween groups IBM’s SPSS software was used.
3.3 Conclusion
In this sub-chapter the research area and the methodological aspects of the empirical research
on residents’ attitudes that has been executed in the city of Bruges have been explained. Bruges
is internationally known as a beautiful, successful, well preserved and medieval city destination.
Despite, or due to, this success, in the long history of the tourism destination tourism pressure
has always been a point of attention. On average 126 visitors spend some time in Bruges per
day per 100 inhabitants (Visit Bruges et al., 2016a). This study will reveal how residents perceive
the impact of tourism on their daily lives, how they cope with the effects and if they still support
tourism in Bruges or not. An important goal of this research project is even so to test and ap-
prove the model of Resident Empowerment through Tourism Scale from Boley et al. (2014) in a
European heritage destination after the first tests that had been undertaken outside Europe.
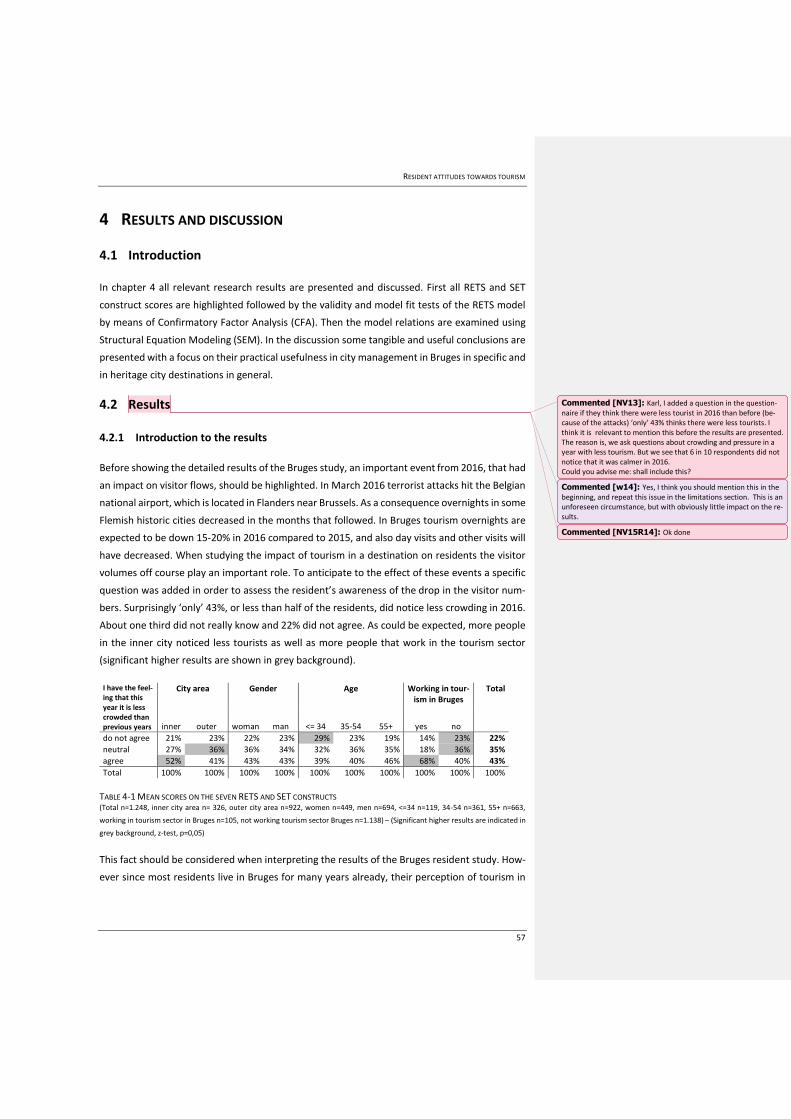
RESIDENT ATTITUDES TOWARDS TOURISM
57
4 RESULTS AND DISCUSSION
4.1 Introduction
In chapter 4 all relevant research results are presented and discussed. First all RETS and SET
construct scores are highlighted followed by the validity and model fit tests of the RETS model
by means of Confirmatory Factor Analysis (CFA). Then the model relations are examined using
Structural Equation Modeling (SEM). In the discussion some tangible and useful conclusions are
presented with a focus on their practical usefulness in city management in Bruges in specific and
in heritage city destinations in general.
4.2 Results
4.2.1 Introduction to the results
Before showing the detailed results of the Bruges study, an important event from 2016, that had
an impact on visitor flows, should be highlighted. In March 2016 terrorist attacks hit the Belgian
national airport, which is located in Flanders near Brussels. As a consequence overnights in some
Flemish historic cities decreased in the months that followed. In Bruges tourism overnights are
expected to be down 15-20% in 2016 compared to 2015, and also day visits and other visits will
have decreased. When studying the impact of tourism in a destination on residents the visitor
volumes off course play an important role. To anticipate to the effect of these events a specific
question was added in order to assess the resident’s awareness of the drop in the visitor num-
bers. Surprisingly ‘only’ 43%, or less than half of the residents, did notice less crowding in 2016.
About one third did not really know and 22% did not agree. As could be expected, more people
in the inner city noticed less tourists as well as more people that work in the tourism sector
(significant higher results are shown in grey background).
I have the feel-ing that this year it is less crowded than previous years
City area Gender Age Working in tour-ism in Bruges
Total
inner outer woman man <= 34 35-54 55+ yes no
do not agree 21% 23% 22% 23% 29% 23% 19% 14% 23% 22%
neutral 27% 36% 36% 34% 32% 36% 35% 18% 36% 35%
agree 52% 41% 43% 43% 39% 40% 46% 68% 40% 43%
Total 100% 100% 100% 100% 100% 100% 100% 100% 100% 100%
TABLE 4-1 MEAN SCORES ON THE SEVEN RETS AND SET CONSTRUCTS (Total n=1.248, inner city area n= 326, outer city area n=922, women n=449, men n=694, <=34 n=119, 34-54 n=361, 55+ n=663,
working in tourism sector in Bruges n=105, not working tourism sector Bruges n=1.138) – (Significant higher results are indicated in
grey background, z-test, p=0,05)
This fact should be considered when interpreting the results of the Bruges resident study. How-
ever since most residents live in Bruges for many years already, their perception of tourism in
Commented [NV13]: Karl, I added a question in the question-naire if they think there were less tourist in 2016 than before (be-cause of the attacks) ‘only’ 43% thinks there were less tourists. I think it is relevant to mention this before the results are presented. The reason is, we ask questions about crowding and pressure in a year with less tourism. But we see that 6 in 10 respondents did not notice that it was calmer in 2016. Could you advise me: shall include this?
Commented [NV15R14]: Ok done
Commented [w14]: Yes, I think you should mention this in the beginning, and repeat this issue in the limitations section. This is an unforeseen circumstance, but with obviously little impact on the re-sults.
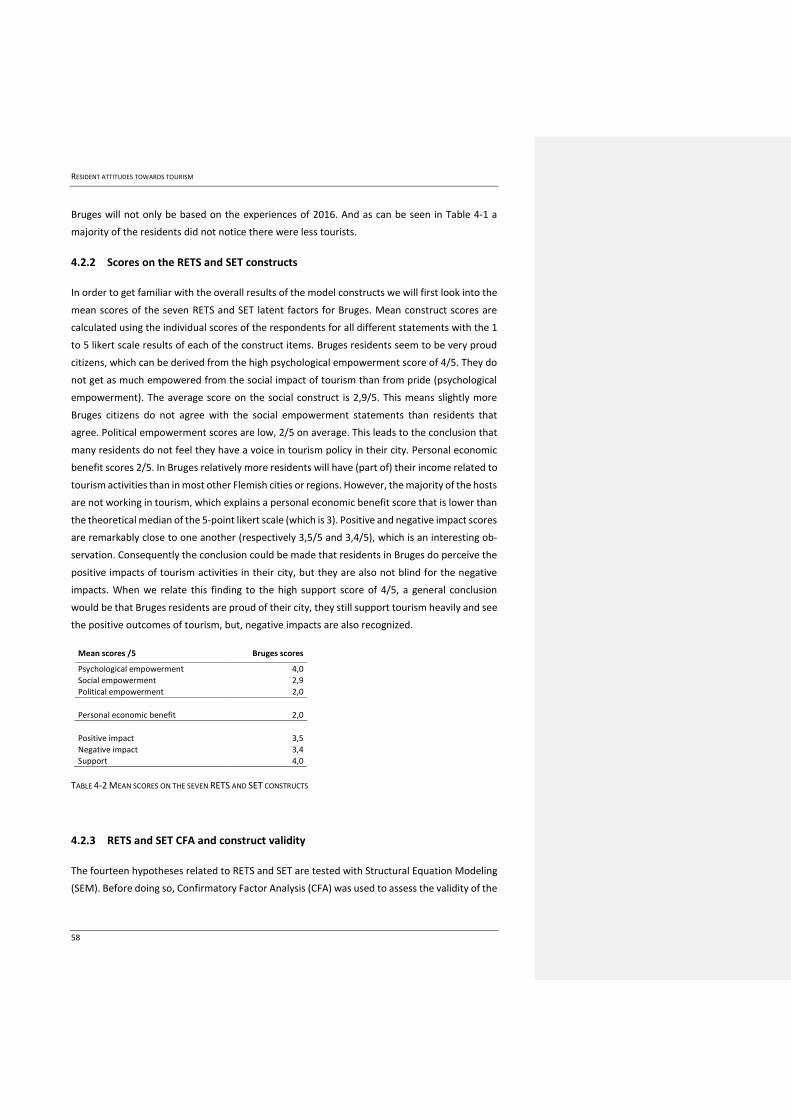
RESIDENT ATTITUDES TOWARDS TOURISM
58
Bruges will not only be based on the experiences of 2016. And as can be seen in Table 4-1 a
majority of the residents did not notice there were less tourists.
4.2.2 Scores on the RETS and SET constructs
In order to get familiar with the overall results of the model constructs we will first look into the
mean scores of the seven RETS and SET latent factors for Bruges. Mean construct scores are
calculated using the individual scores of the respondents for all different statements with the 1
to 5 likert scale results of each of the construct items. Bruges residents seem to be very proud
citizens, which can be derived from the high psychological empowerment score of 4/5. They do
not get as much empowered from the social impact of tourism than from pride (psychological
empowerment). The average score on the social construct is 2,9/5. This means slightly more
Bruges citizens do not agree with the social empowerment statements than residents that
agree. Political empowerment scores are low, 2/5 on average. This leads to the conclusion that
many residents do not feel they have a voice in tourism policy in their city. Personal economic
benefit scores 2/5. In Bruges relatively more residents will have (part of) their income related to
tourism activities than in most other Flemish cities or regions. However, the majority of the hosts
are not working in tourism, which explains a personal economic benefit score that is lower than
the theoretical median of the 5-point likert scale (which is 3). Positive and negative impact scores
are remarkably close to one another (respectively 3,5/5 and 3,4/5), which is an interesting ob-
servation. Consequently the conclusion could be made that residents in Bruges do perceive the
positive impacts of tourism activities in their city, but they are also not blind for the negative
impacts. When we relate this finding to the high support score of 4/5, a general conclusion
would be that Bruges residents are proud of their city, they still support tourism heavily and see
the positive outcomes of tourism, but, negative impacts are also recognized.
Mean scores /5 Bruges scores
Psychological empowerment 4,0
Social empowerment 2,9
Political empowerment 2,0
Personal economic benefit 2,0
Positive impact 3,5
Negative impact 3,4
Support 4,0
TABLE 4-2 MEAN SCORES ON THE SEVEN RETS AND SET CONSTRUCTS
4.2.3 RETS and SET CFA and construct validity
The fourteen hypotheses related to RETS and SET are tested with Structural Equation Modeling
(SEM). Before doing so, Confirmatory Factor Analysis (CFA) was used to assess the validity of the

RESIDENT ATTITUDES TOWARDS TOURISM
59
seven constructs and the model fit. The CFA is indicating good model fit in the Bruges dataset.
Chi-square = 2091,9 is high, which is ok, due to the large sample size of 1.248. Chi-square p value
= 0,000. According to the CFA theory chi-square p values should be >0,05 (Muthén & Muthén,
2009). However, “in large samples virtually any model tends to be rejected as inadequate”, as
stated by Bentler & Bonett (1980, p. 588). Also in the Boley et al. RETS study in the US (2014)
the chi-square p value was 0,000. The Root Mean Square Error of Approximation (RMSEA)
should be maximum 0,06 for good model fit (Hu & Bentler, 1999) and is 0,05. Also CFI and TLI,
which should be close to 1, in the Bruges dataset are with respectively 0,968 and 0,964 which
give indications for a strong fit in the model. CFI stands for ‘Comparative Fit Index’ and should
be greater than 0,9. Also TLI (Tucket Lewis Index) should be greater than 0,9 for good model fit.
CFA offers extra tools to measure the model fit, by means of construct validity tests. One of the
components of the construct validity is the convergent validity test. “Convergent validity tests
how much common variance the items of a construct share with the latent construct” (Hair et
al., 2010 in Boley et al., 2014, p. 43). Hair et al. recommend the factor loadings to be minimum
0,5 or higher to be statistically significant and to represent construct validity (Hair et al., 2010).
As can be seen in Table 4-3 all factor loadings range from 0,58 to 0,95 and two out of three
loadings are above 0,80, which proves very good convergent factor validity. In order to set a
reference, the mean scores of the construct items can be found in column one. The estimates
divided by the errors can be found in the third column in Table 4-3 (Est/S.E.). This indicator is a
z-score. “The critical value is an absolute value greater than 1,96” in order to have a significant
factor loading, as stated in the MPlus handbook (Muthén & Muthén, 1998-2015, p. 735). The z-
scores in the Bruges CFA output range from 21,9 to 165,2.
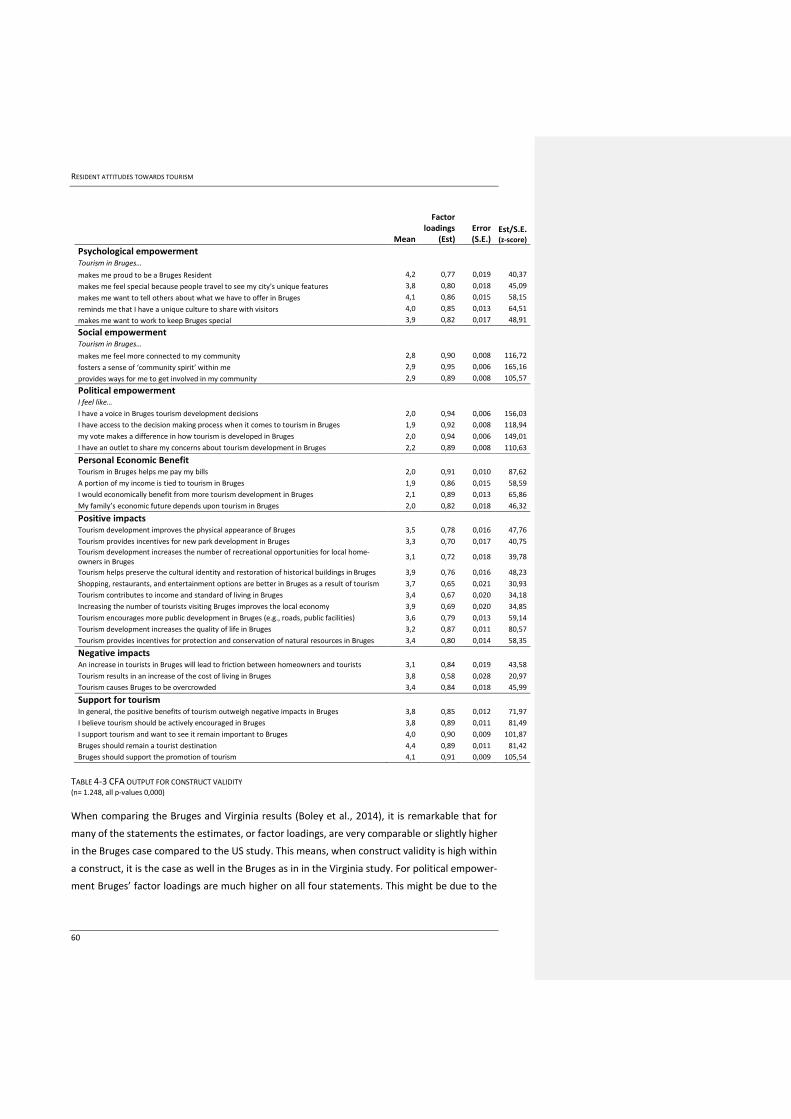
RESIDENT ATTITUDES TOWARDS TOURISM
60
Mean
Factor loadings
(Est) Error (S.E.)
Est/S.E. (z-score)
Psychological empowerment
Tourism in Bruges…
makes me proud to be a Bruges Resident 4,2 0,77 0,019 40,37
makes me feel special because people travel to see my city's unique features 3,8 0,80 0,018 45,09
makes me want to tell others about what we have to offer in Bruges 4,1 0,86 0,015 58,15
reminds me that I have a unique culture to share with visitors 4,0 0,85 0,013 64,51
makes me want to work to keep Bruges special 3,9 0,82 0,017 48,91
Social empowerment
Tourism in Bruges…
makes me feel more connected to my community 2,8 0,90 0,008 116,72
fosters a sense of ‘community spirit’ within me 2,9 0,95 0,006 165,16
provides ways for me to get involved in my community 2,9 0,89 0,008 105,57
Political empowerment
I feel like…
I have a voice in Bruges tourism development decisions 2,0 0,94 0,006 156,03
I have access to the decision making process when it comes to tourism in Bruges 1,9 0,92 0,008 118,94
my vote makes a difference in how tourism is developed in Bruges 2,0 0,94 0,006 149,01
I have an outlet to share my concerns about tourism development in Bruges 2,2 0,89 0,008 110,63
Personal Economic Benefit
Tourism in Bruges helps me pay my bills 2,0 0,91 0,010 87,62
A portion of my income is tied to tourism in Bruges 1,9 0,86 0,015 58,59
I would economically benefit from more tourism development in Bruges 2,1 0,89 0,013 65,86
My family’s economic future depends upon tourism in Bruges 2,0 0,82 0,018 46,32
Positive impacts
Tourism development improves the physical appearance of Bruges 3,5 0,78 0,016 47,76
Tourism provides incentives for new park development in Bruges 3,3 0,70 0,017 40,75
Tourism development increases the number of recreational opportunities for local home-owners in Bruges
3,1 0,72 0,018 39,78
Tourism helps preserve the cultural identity and restoration of historical buildings in Bruges 3,9 0,76 0,016 48,23
Shopping, restaurants, and entertainment options are better in Bruges as a result of tourism 3,7 0,65 0,021 30,93
Tourism contributes to income and standard of living in Bruges 3,4 0,67 0,020 34,18
Increasing the number of tourists visiting Bruges improves the local economy 3,9 0,69 0,020 34,85
Tourism encourages more public development in Bruges (e.g., roads, public facilities) 3,6 0,79 0,013 59,14
Tourism development increases the quality of life in Bruges 3,2 0,87 0,011 80,57
Tourism provides incentives for protection and conservation of natural resources in Bruges 3,4 0,80 0,014 58,35
Negative impacts
An increase in tourists in Bruges will lead to friction between homeowners and tourists 3,1 0,84 0,019 43,58
Tourism results in an increase of the cost of living in Bruges 3,8 0,58 0,028 20,97
Tourism causes Bruges to be overcrowded 3,4 0,84 0,018 45,99
Support for tourism
In general, the positive benefits of tourism outweigh negative impacts in Bruges 3,8 0,85 0,012 71,97
I believe tourism should be actively encouraged in Bruges 3,8 0,89 0,011 81,49
I support tourism and want to see it remain important to Bruges 4,0 0,90 0,009 101,87
Bruges should remain a tourist destination 4,4 0,89 0,011 81,42
Bruges should support the promotion of tourism 4,1 0,91 0,009 105,54
TABLE 4-3 CFA OUTPUT FOR CONSTRUCT VALIDITY (n= 1.248, all p-values 0,000)
When comparing the Bruges and Virginia results (Boley et al., 2014), it is remarkable that for
many of the statements the estimates, or factor loadings, are very comparable or slightly higher
in the Bruges case compared to the US study. This means, when construct validity is high within
a construct, it is the case as well in the Bruges as in in the Virginia study. For political empower-
ment Bruges’ factor loadings are much higher on all four statements. This might be due to the
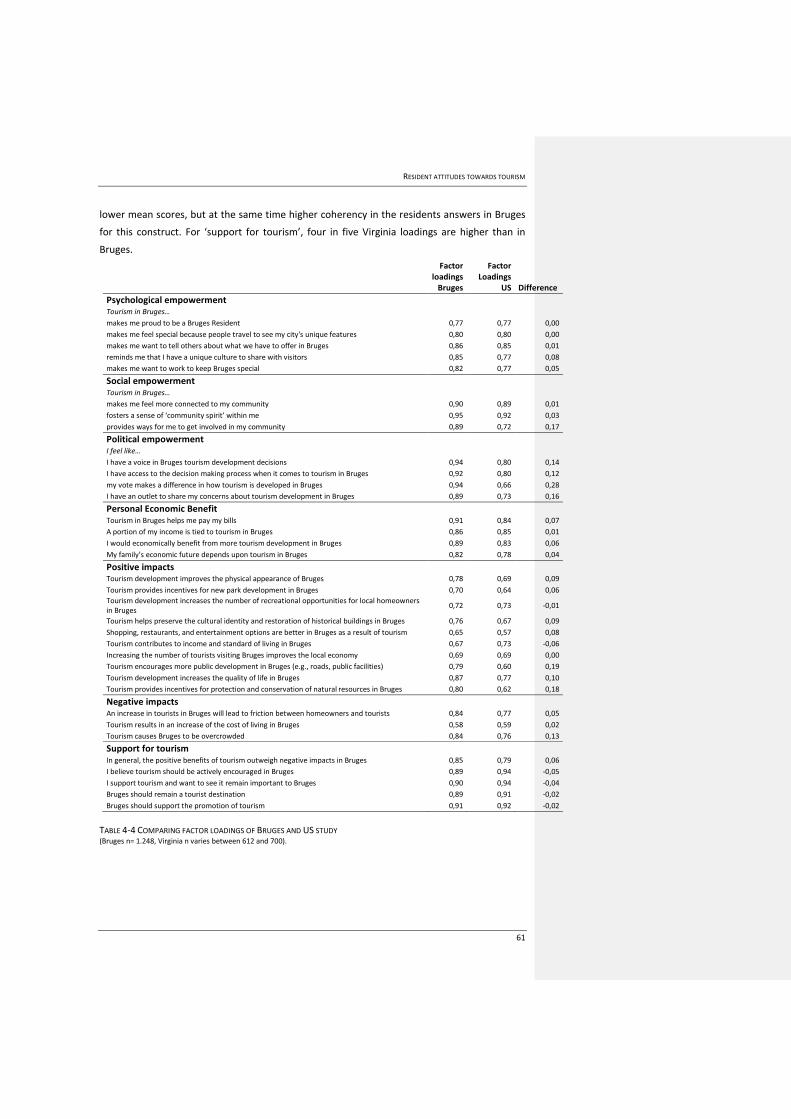
RESIDENT ATTITUDES TOWARDS TOURISM
61
lower mean scores, but at the same time higher coherency in the residents answers in Bruges
for this construct. For ‘support for tourism’, four in five Virginia loadings are higher than in
Bruges.
Factor loadings
Bruges
Factor Loadings
US Difference
Psychological empowerment
Tourism in Bruges…
makes me proud to be a Bruges Resident 0,77 0,77 0,00
makes me feel special because people travel to see my city's unique features 0,80 0,80 0,00
makes me want to tell others about what we have to offer in Bruges 0,86 0,85 0,01
reminds me that I have a unique culture to share with visitors 0,85 0,77 0,08
makes me want to work to keep Bruges special 0,82 0,77 0,05
Social empowerment
Tourism in Bruges…
makes me feel more connected to my community 0,90 0,89 0,01
fosters a sense of ‘community spirit’ within me 0,95 0,92 0,03
provides ways for me to get involved in my community 0,89 0,72 0,17
Political empowerment
I feel like…
I have a voice in Bruges tourism development decisions 0,94 0,80 0,14
I have access to the decision making process when it comes to tourism in Bruges 0,92 0,80 0,12
my vote makes a difference in how tourism is developed in Bruges 0,94 0,66 0,28
I have an outlet to share my concerns about tourism development in Bruges 0,89 0,73 0,16
Personal Economic Benefit
Tourism in Bruges helps me pay my bills 0,91 0,84 0,07
A portion of my income is tied to tourism in Bruges 0,86 0,85 0,01
I would economically benefit from more tourism development in Bruges 0,89 0,83 0,06
My family’s economic future depends upon tourism in Bruges 0,82 0,78 0,04
Positive impacts
Tourism development improves the physical appearance of Bruges 0,78 0,69 0,09
Tourism provides incentives for new park development in Bruges 0,70 0,64 0,06
Tourism development increases the number of recreational opportunities for local homeowners in Bruges
0,72 0,73 -0,01
Tourism helps preserve the cultural identity and restoration of historical buildings in Bruges 0,76 0,67 0,09
Shopping, restaurants, and entertainment options are better in Bruges as a result of tourism 0,65 0,57 0,08
Tourism contributes to income and standard of living in Bruges 0,67 0,73 -0,06
Increasing the number of tourists visiting Bruges improves the local economy 0,69 0,69 0,00
Tourism encourages more public development in Bruges (e.g., roads, public facilities) 0,79 0,60 0,19
Tourism development increases the quality of life in Bruges 0,87 0,77 0,10
Tourism provides incentives for protection and conservation of natural resources in Bruges 0,80 0,62 0,18
Negative impacts
An increase in tourists in Bruges will lead to friction between homeowners and tourists 0,84 0,77 0,05
Tourism results in an increase of the cost of living in Bruges 0,58 0,59 0,02
Tourism causes Bruges to be overcrowded 0,84 0,76 0,13
Support for tourism
In general, the positive benefits of tourism outweigh negative impacts in Bruges 0,85 0,79 0,06
I believe tourism should be actively encouraged in Bruges 0,89 0,94 -0,05
I support tourism and want to see it remain important to Bruges 0,90 0,94 -0,04
Bruges should remain a tourist destination 0,89 0,91 -0,02
Bruges should support the promotion of tourism 0,91 0,92 -0,02
TABLE 4-4 COMPARING FACTOR LOADINGS OF BRUGES AND US STUDY (Bruges n= 1.248, Virginia n varies between 612 and 700).

RESIDENT ATTITUDES TOWARDS TOURISM
62
4.2.4 RETS and SET model relations
The model constructs validity and overall model goodness-of-fit was tested and approved using
CFA. In a second step all relevant construct relationships are tested with Structural Equation
Modeling (SEM). As stated by Boley et al. “SEM transitions the attention away from the latent
construct and their measured variables to the nature and magnitude of the relationship be-
tween constructs” (Hair et al., 2010 in Boley et al., 2014, p. 44).
Following the same strategy as Boley et al. (2014) in the Virginia study the fourteen hypotheses
(Figure 3-21) are tested on two criteria: the significance of the relationship and the nature of the
relationship as hypothesized (the + or – sign of the relation). Table 4-5 shows all fourteen stand-
ard regression weights from the SEM and the p-values (significance levels). Eleven relations
show significant links, but two of them do not have the expected sign. In the end nine out of
fourteen hypotheses are approved, five are not.
For hypotheses H1 and H2, the SET hypotheses, the relationship between the perceived impact
of tourism and support for tourism is approved. This means that indeed residents’ support for
tourism is a function of their perceptions of advantages and disadvantages (or benefits and
costs) of tourism.
Hypotheses H3 to H5 expected relationships between perceived economic benefits from tour-
ism and the perceived impacts of tourism as well as the overall support for tourism. Both rela-
tions with the two levels of impact were not significant (p= 0,033 for Personal Economic Benefit
-> Negative Impacts and p= 0,816 for Personal Economic Benefit -> Positive Impacts). Hypothesis
5 however is supported by the Bruges study results. As Boley et al. (2014, p. 45) also conclude,
“this suggests that one’s perception of economically benefiting from tourism has a greater in-
fluence over their support for tourism than their perception of tourism’s impact”.
Hypothesis Hypothesized relationship
Std. re-
gression weights P.
Support for hy-
pothesis Reason
H1 Positive Impacts -> Support for Tourism 0,62 0,000 yes H2 Negative Impacts -> Support for Tourism -0,53 0,000 yes
H3 Personal Economic Benefit -> Negative Impacts 0,01 0,859 no not signif./sign
H4 Personal Economic Benefit -> Positive Impacts 0,04 0,266 no not signif.
H5 Personal Economic Benefit -> Support for Tourism 0,11 0,001 yes
H6 Psychological Empowerment -> Negative Impacts -0,19 0,000 yes
H7 Psychological Empowerment -> Positive Impacts 0,31 0,000 yes H8 Psychological Empowerment -> Support for Tourism 0,16 0,000 yes
H9 Social Empowerment -> Negative Impacts -0,50 0,000 yes
H10 Social Empowerment -> Positive Impacts 0,42 0,000 yes H11 Social Empowerment -> Support for Tourism -0,27 0,000 no sign
H12 Political Empowerment -> Negative Impacts -0,06 0,135 no not signif.
H13 Political Empowerment -> Positive Impacts 0,09 0,008 yes H14 Political Empowerment -> Support for Tourism -0,11 0,002 no sign
RESIDENT ATTITUDES TOWARDS TOURISM
63
TABLE 4-5 HYPOTHESIZED RELATIONSHIPS BETWEEN SEVEN CONSTRUCTS AND OBSERVED RELATIONSHIPS FROM THE SEM
Hypotheses H6 to H14 focus on the RETS relations in the model. Hypotheses H6 to H8 deal with
the psychological empowerment relations and impact of tourism as well as support for tourism.
Of all three empowerment constructs psychological empowerment is the only empowerment
aspect of the model approving all three expected relations. Consequently, perceived psycholog-
ical empowerment from tourism, or the subjective feeling of citizens’ pride, has a positive rela-
tion with perceived positive impact, a negative relation with perceived negative impact and a
positive relation with support for tourism. Therefore, proud citizens not only see more positive
and less negative impact from tourism, they also provide a strong overall support for tourism.
With hypotheses H9 to H11 the social empowerment relations are examined. Do perceived pos-
itive social effects from tourism have a positive influence on perceived positive impacts from
tourism? Yes, both relations with positive and negative impacts are observed as expected in
Bruges. Only the direct relation of social empowerment with support for tourism is not found.
On the contrary, the relationship is significant, but the sign is inverse compared to what was
expected.
To conclude, in hypotheses H12 to H14 the influence of political empowerment on perceived
impact and support is tested. Of all three empowerment constructs, political empowerment
shows the weakest relation with the perceived impacts from tourism and support for tourism.
The inverse relation between political empowerment (the feeling to have a voice in the decision
making process of tourism planning in the city) and perceived negative impacts from tourism is
not found. Also the direct relation with political empowerment and support is not approved,
only the relation with positive impacts is. This means that residents who are politically empow-
ered will perceive the positive impacts more than those who are not. But they will not see neg-
ative impacts less. This is quite understandable, residents that might have discussed tourism
related issues with policy makers or city tourism managers might feel politically empowered
because they feel they had a voice. But it can be assumed that quite often these discussions are
not about the positive effects of tourism, but rather about nuisance and other kinds of negative
impact. This then leads to a practical relation of high political empowerment on one hand and
perceived negative impact on the other (which is opposite the hypothesized relationship by
Boley et al., 2014).
Figure 4-1 visualizes the fourteen hypotheses and the results of the SEM analysis in Bruges. Hy-
potheses in green circles are supported by the Bruges data, those in red circles are not.
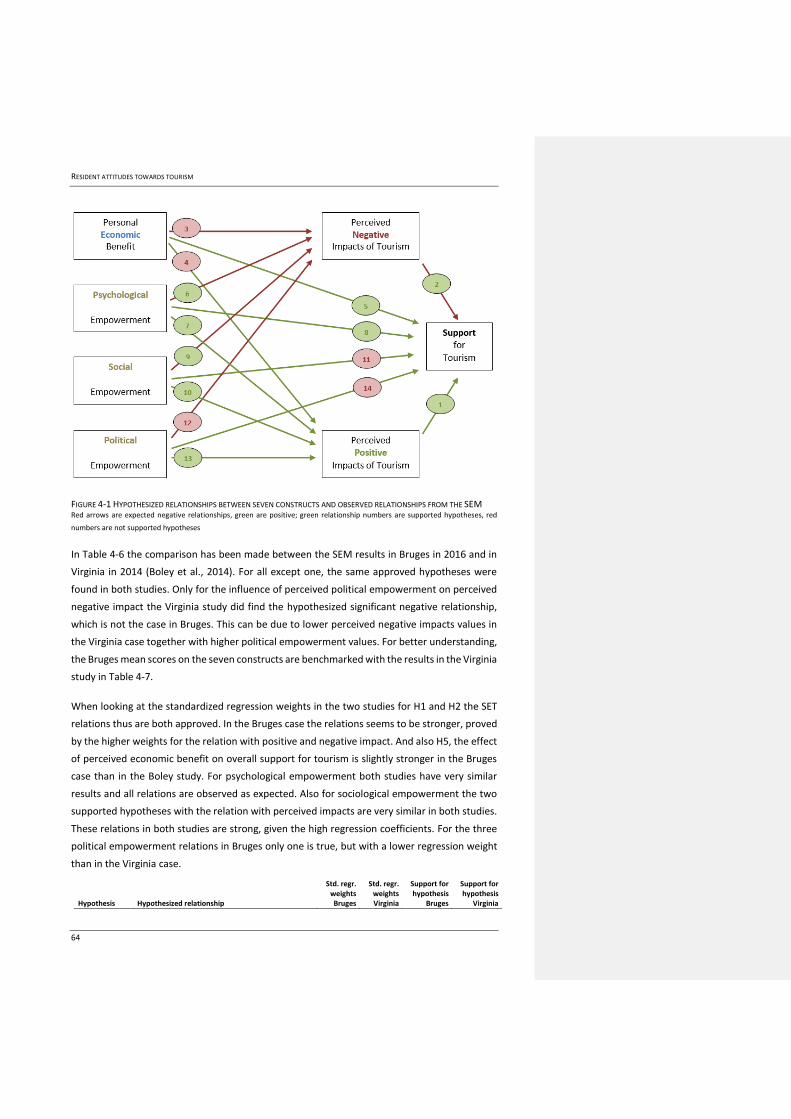
RESIDENT ATTITUDES TOWARDS TOURISM
64
FIGURE 4-1 HYPOTHESIZED RELATIONSHIPS BETWEEN SEVEN CONSTRUCTS AND OBSERVED RELATIONSHIPS FROM THE SEM Red arrows are expected negative relationships, green are positive; green relationship numbers are supported hypotheses, red
numbers are not supported hypotheses
In Table 4-6 the comparison has been made between the SEM results in Bruges in 2016 and in
Virginia in 2014 (Boley et al., 2014). For all except one, the same approved hypotheses were
found in both studies. Only for the influence of perceived political empowerment on perceived
negative impact the Virginia study did find the hypothesized significant negative relationship,
which is not the case in Bruges. This can be due to lower perceived negative impacts values in
the Virginia case together with higher political empowerment values. For better understanding,
the Bruges mean scores on the seven constructs are benchmarked with the results in the Virginia
study in Table 4-7.
When looking at the standardized regression weights in the two studies for H1 and H2 the SET
relations thus are both approved. In the Bruges case the relations seems to be stronger, proved
by the higher weights for the relation with positive and negative impact. And also H5, the effect
of perceived economic benefit on overall support for tourism is slightly stronger in the Bruges
case than in the Boley study. For psychological empowerment both studies have very similar
results and all relations are observed as expected. Also for sociological empowerment the two
supported hypotheses with the relation with perceived impacts are very similar in both studies.
These relations in both studies are strong, given the high regression coefficients. For the three
political empowerment relations in Bruges only one is true, but with a lower regression weight
than in the Virginia case.
Hypothesis Hypothesized relationship
Std. regr. weights Bruges
Std. regr. weights Virginia
Support for hypothesis
Bruges
Support for hypothesis
Virginia
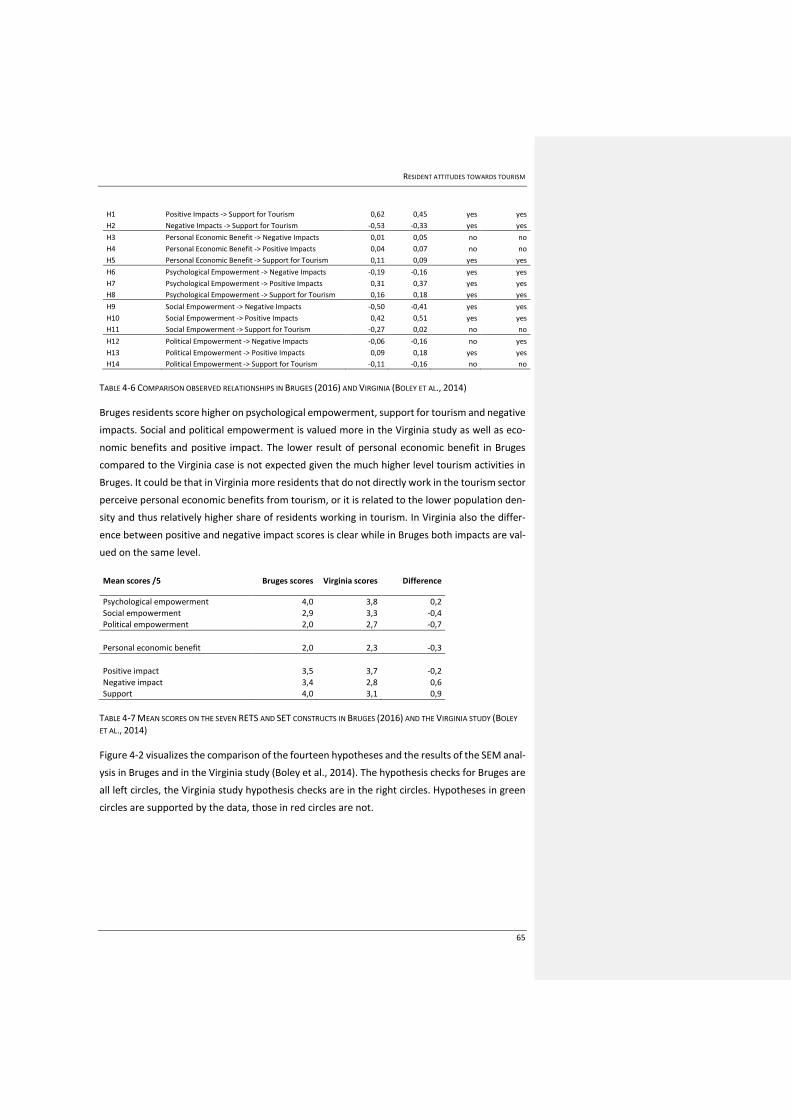
RESIDENT ATTITUDES TOWARDS TOURISM
65
H1 Positive Impacts -> Support for Tourism 0,62 0,45 yes yes
H2 Negative Impacts -> Support for Tourism -0,53 -0,33 yes yes
H3 Personal Economic Benefit -> Negative Impacts 0,01 0,05 no no
H4 Personal Economic Benefit -> Positive Impacts 0,04 0,07 no no
H5 Personal Economic Benefit -> Support for Tourism 0,11 0,09 yes yes
H6 Psychological Empowerment -> Negative Impacts -0,19 -0,16 yes yes
H7 Psychological Empowerment -> Positive Impacts 0,31 0,37 yes yes
H8 Psychological Empowerment -> Support for Tourism 0,16 0,18 yes yes
H9 Social Empowerment -> Negative Impacts -0,50 -0,41 yes yes
H10 Social Empowerment -> Positive Impacts 0,42 0,51 yes yes
H11 Social Empowerment -> Support for Tourism -0,27 0,02 no no
H12 Political Empowerment -> Negative Impacts -0,06 -0,16 no yes
H13 Political Empowerment -> Positive Impacts 0,09 0,18 yes yes
H14 Political Empowerment -> Support for Tourism -0,11 -0,16 no no
TABLE 4-6 COMPARISON OBSERVED RELATIONSHIPS IN BRUGES (2016) AND VIRGINIA (BOLEY ET AL., 2014)
Bruges residents score higher on psychological empowerment, support for tourism and negative
impacts. Social and political empowerment is valued more in the Virginia study as well as eco-
nomic benefits and positive impact. The lower result of personal economic benefit in Bruges
compared to the Virginia case is not expected given the much higher level tourism activities in
Bruges. It could be that in Virginia more residents that do not directly work in the tourism sector
perceive personal economic benefits from tourism, or it is related to the lower population den-
sity and thus relatively higher share of residents working in tourism. In Virginia also the differ-
ence between positive and negative impact scores is clear while in Bruges both impacts are val-
ued on the same level.
Mean scores /5 Bruges scores Virginia scores Difference
Psychological empowerment 4,0 3,8 0,2
Social empowerment 2,9 3,3 -0,4
Political empowerment 2,0 2,7 -0,7
Personal economic benefit 2,0 2,3 -0,3
Positive impact 3,5 3,7 -0,2
Negative impact 3,4 2,8 0,6
Support 4,0 3,1 0,9
TABLE 4-7 MEAN SCORES ON THE SEVEN RETS AND SET CONSTRUCTS IN BRUGES (2016) AND THE VIRGINIA STUDY (BOLEY
ET AL., 2014)
Figure 4-2 visualizes the comparison of the fourteen hypotheses and the results of the SEM anal-
ysis in Bruges and in the Virginia study (Boley et al., 2014). The hypothesis checks for Bruges are
all left circles, the Virginia study hypothesis checks are in the right circles. Hypotheses in green
circles are supported by the data, those in red circles are not.
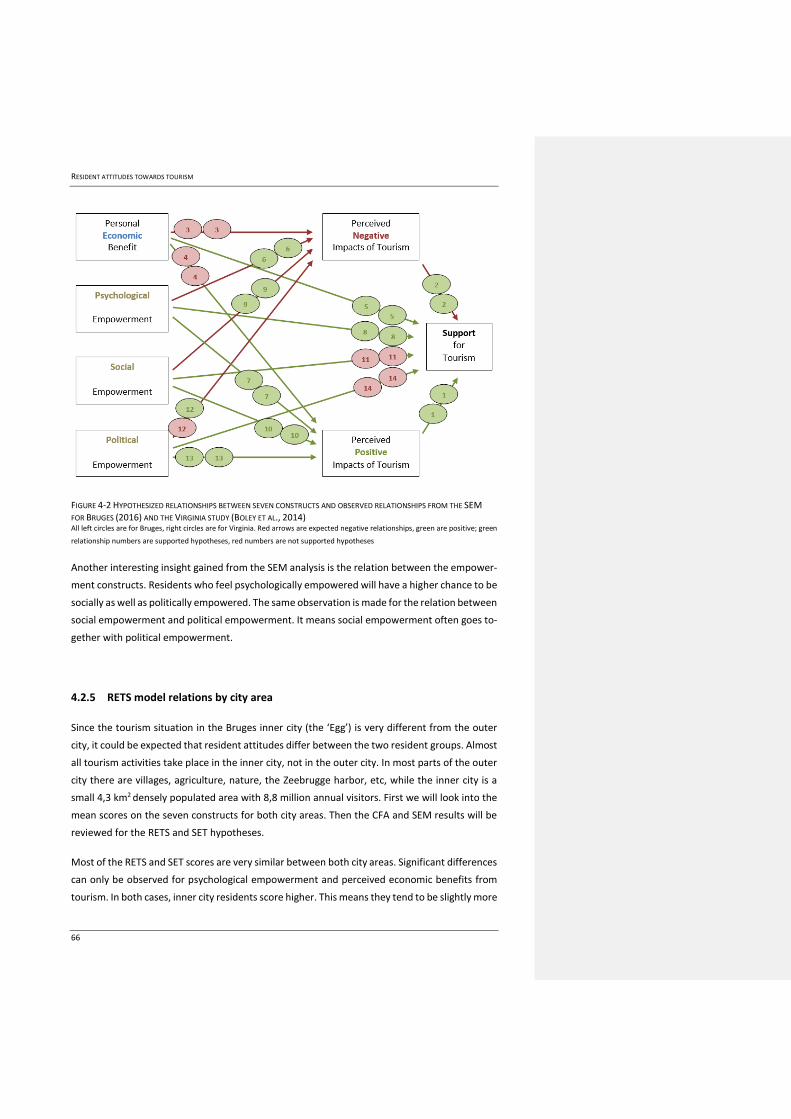
RESIDENT ATTITUDES TOWARDS TOURISM
66
FIGURE 4-2 HYPOTHESIZED RELATIONSHIPS BETWEEN SEVEN CONSTRUCTS AND OBSERVED RELATIONSHIPS FROM THE SEM
FOR BRUGES (2016) AND THE VIRGINIA STUDY (BOLEY ET AL., 2014) All left circles are for Bruges, right circles are for Virginia. Red arrows are expected negative relationships, green are positive; green
relationship numbers are supported hypotheses, red numbers are not supported hypotheses
Another interesting insight gained from the SEM analysis is the relation between the empower-
ment constructs. Residents who feel psychologically empowered will have a higher chance to be
socially as well as politically empowered. The same observation is made for the relation between
social empowerment and political empowerment. It means social empowerment often goes to-
gether with political empowerment.
4.2.5 RETS model relations by city area
Since the tourism situation in the Bruges inner city (the ‘Egg’) is very different from the outer
city, it could be expected that resident attitudes differ between the two resident groups. Almost
all tourism activities take place in the inner city, not in the outer city. In most parts of the outer
city there are villages, agriculture, nature, the Zeebrugge harbor, etc, while the inner city is a
small 4,3 km2 densely populated area with 8,8 million annual visitors. First we will look into the
mean scores on the seven constructs for both city areas. Then the CFA and SEM results will be
reviewed for the RETS and SET hypotheses.
Most of the RETS and SET scores are very similar between both city areas. Significant differences
can only be observed for psychological empowerment and perceived economic benefits from
tourism. In both cases, inner city residents score higher. This means they tend to be slightly more
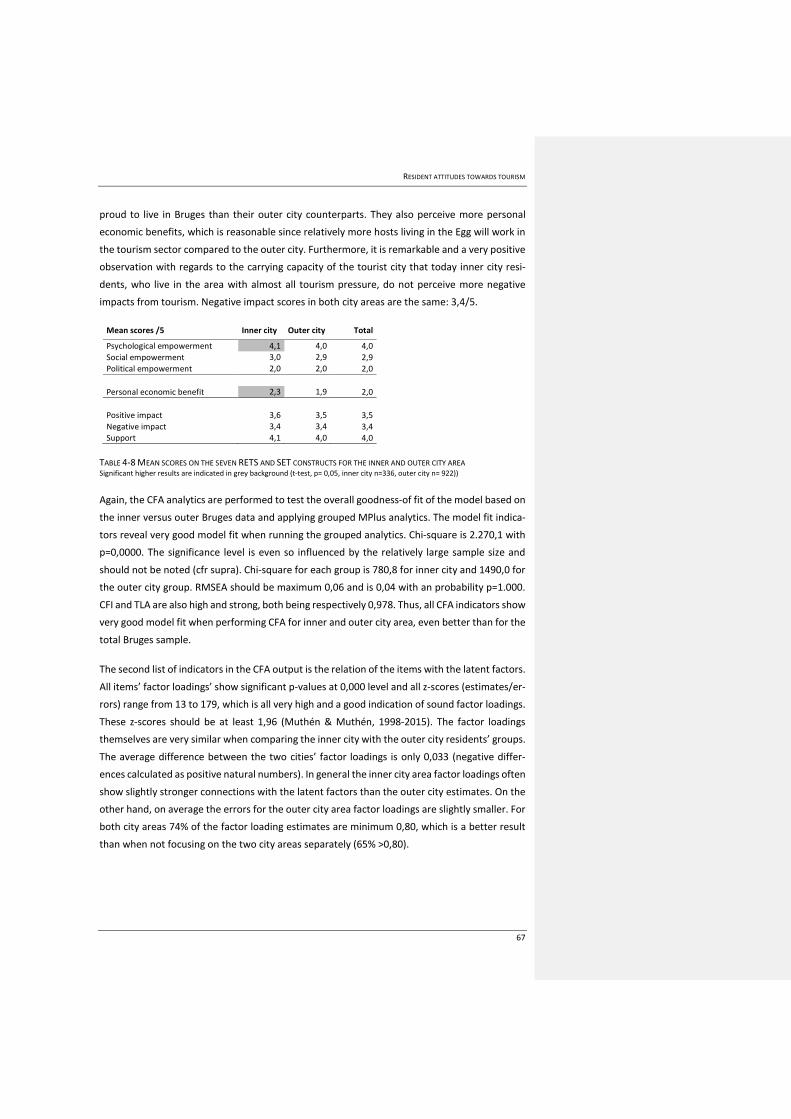
RESIDENT ATTITUDES TOWARDS TOURISM
67
proud to live in Bruges than their outer city counterparts. They also perceive more personal
economic benefits, which is reasonable since relatively more hosts living in the Egg will work in
the tourism sector compared to the outer city. Furthermore, it is remarkable and a very positive
observation with regards to the carrying capacity of the tourist city that today inner city resi-
dents, who live in the area with almost all tourism pressure, do not perceive more negative
impacts from tourism. Negative impact scores in both city areas are the same: 3,4/5.
Mean scores /5 Inner city Outer city Total
Psychological empowerment 4,1 4,0 4,0
Social empowerment 3,0 2,9 2,9
Political empowerment 2,0 2,0 2,0
Personal economic benefit 2,3 1,9 2,0
Positive impact 3,6 3,5 3,5
Negative impact 3,4 3,4 3,4
Support 4,1 4,0 4,0
TABLE 4-8 MEAN SCORES ON THE SEVEN RETS AND SET CONSTRUCTS FOR THE INNER AND OUTER CITY AREA Significant higher results are indicated in grey background (t-test, p= 0,05, inner city n=336, outer city n= 922))
Again, the CFA analytics are performed to test the overall goodness-of fit of the model based on
the inner versus outer Bruges data and applying grouped MPlus analytics. The model fit indica-
tors reveal very good model fit when running the grouped analytics. Chi-square is 2.270,1 with
p=0,0000. The significance level is even so influenced by the relatively large sample size and
should not be noted (cfr supra). Chi-square for each group is 780,8 for inner city and 1490,0 for
the outer city group. RMSEA should be maximum 0,06 and is 0,04 with an probability p=1.000.
CFI and TLA are also high and strong, both being respectively 0,978. Thus, all CFA indicators show
very good model fit when performing CFA for inner and outer city area, even better than for the
total Bruges sample.
The second list of indicators in the CFA output is the relation of the items with the latent factors.
All items’ factor loadings’ show significant p-values at 0,000 level and all z-scores (estimates/er-
rors) range from 13 to 179, which is all very high and a good indication of sound factor loadings.
These z-scores should be at least 1,96 (Muthén & Muthén, 1998-2015). The factor loadings
themselves are very similar when comparing the inner city with the outer city residents’ groups.
The average difference between the two cities’ factor loadings is only 0,033 (negative differ-
ences calculated as positive natural numbers). In general the inner city area factor loadings often
show slightly stronger connections with the latent factors than the outer city estimates. On the
other hand, on average the errors for the outer city area factor loadings are slightly smaller. For
both city areas 74% of the factor loading estimates are minimum 0,80, which is a better result
than when not focusing on the two city areas separately (65% >0,80).
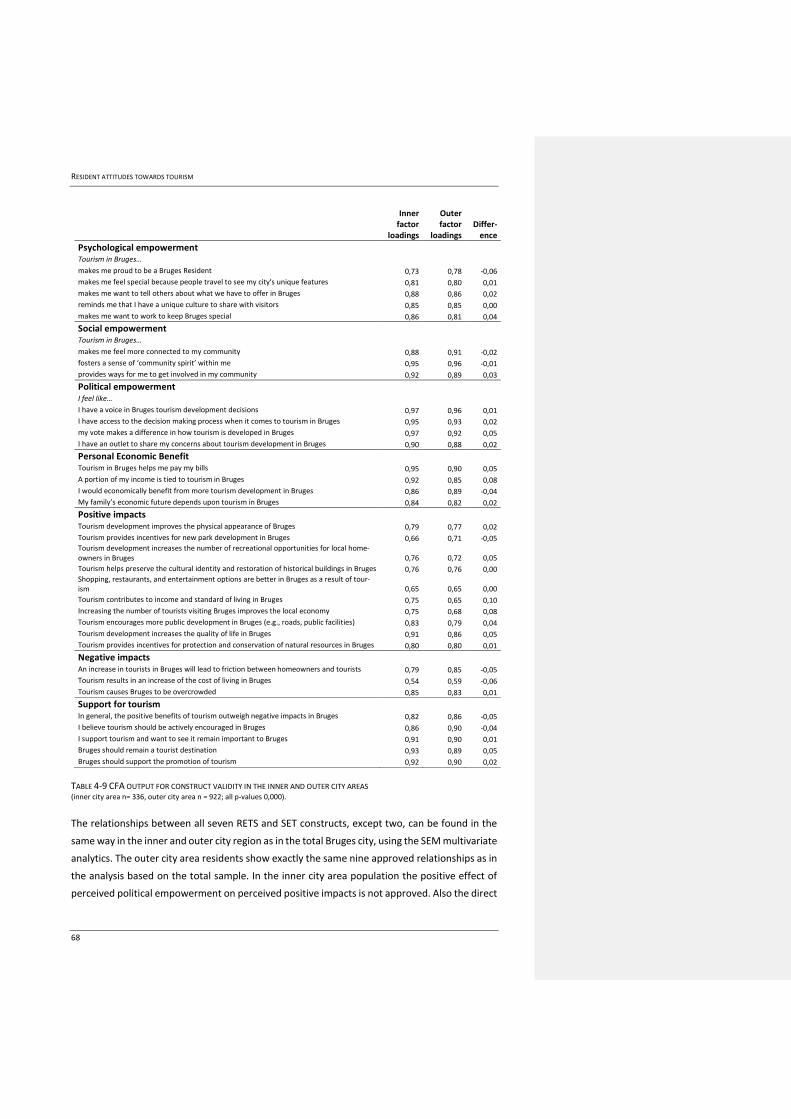
RESIDENT ATTITUDES TOWARDS TOURISM
68
Inner factor
loadings
Outer factor
loadings Differ-
ence
Psychological empowerment
Tourism in Bruges…
makes me proud to be a Bruges Resident 0,73 0,78 -0,06
makes me feel special because people travel to see my city's unique features 0,81 0,80 0,01
makes me want to tell others about what we have to offer in Bruges 0,88 0,86 0,02
reminds me that I have a unique culture to share with visitors 0,85 0,85 0,00
makes me want to work to keep Bruges special 0,86 0,81 0,04
Social empowerment Tourism in Bruges… makes me feel more connected to my community 0,88 0,91 -0,02
fosters a sense of ‘community spirit’ within me 0,95 0,96 -0,01
provides ways for me to get involved in my community 0,92 0,89 0,03
Political empowerment I feel like… I have a voice in Bruges tourism development decisions 0,97 0,96 0,01
I have access to the decision making process when it comes to tourism in Bruges 0,95 0,93 0,02
my vote makes a difference in how tourism is developed in Bruges 0,97 0,92 0,05
I have an outlet to share my concerns about tourism development in Bruges 0,90 0,88 0,02
Personal Economic Benefit Tourism in Bruges helps me pay my bills 0,95 0,90 0,05
A portion of my income is tied to tourism in Bruges 0,92 0,85 0,08
I would economically benefit from more tourism development in Bruges 0,86 0,89 -0,04
My family’s economic future depends upon tourism in Bruges 0,84 0,82 0,02
Positive impacts Tourism development improves the physical appearance of Bruges 0,79 0,77 0,02
Tourism provides incentives for new park development in Bruges 0,66 0,71 -0,05 Tourism development increases the number of recreational opportunities for local home-owners in Bruges 0,76 0,72 0,05
Tourism helps preserve the cultural identity and restoration of historical buildings in Bruges 0,76 0,76 0,00 Shopping, restaurants, and entertainment options are better in Bruges as a result of tour-ism 0,65 0,65 0,00
Tourism contributes to income and standard of living in Bruges 0,75 0,65 0,10
Increasing the number of tourists visiting Bruges improves the local economy 0,75 0,68 0,08
Tourism encourages more public development in Bruges (e.g., roads, public facilities) 0,83 0,79 0,04
Tourism development increases the quality of life in Bruges 0,91 0,86 0,05
Tourism provides incentives for protection and conservation of natural resources in Bruges 0,80 0,80 0,01
Negative impacts An increase in tourists in Bruges will lead to friction between homeowners and tourists 0,79 0,85 -0,05
Tourism results in an increase of the cost of living in Bruges 0,54 0,59 -0,06
Tourism causes Bruges to be overcrowded 0,85 0,83 0,01
Support for tourism In general, the positive benefits of tourism outweigh negative impacts in Bruges 0,82 0,86 -0,05
I believe tourism should be actively encouraged in Bruges 0,86 0,90 -0,04
I support tourism and want to see it remain important to Bruges 0,91 0,90 0,01
Bruges should remain a tourist destination 0,93 0,89 0,05
Bruges should support the promotion of tourism 0,92 0,90 0,02
TABLE 4-9 CFA OUTPUT FOR CONSTRUCT VALIDITY IN THE INNER AND OUTER CITY AREAS (inner city area n= 336, outer city area n = 922; all p-values 0,000).
The relationships between all seven RETS and SET constructs, except two, can be found in the
same way in the inner and outer city region as in the total Bruges city, using the SEM multivariate
analytics. The outer city area residents show exactly the same nine approved relationships as in
the analysis based on the total sample. In the inner city area population the positive effect of
perceived political empowerment on perceived positive impacts is not approved. Also the direct
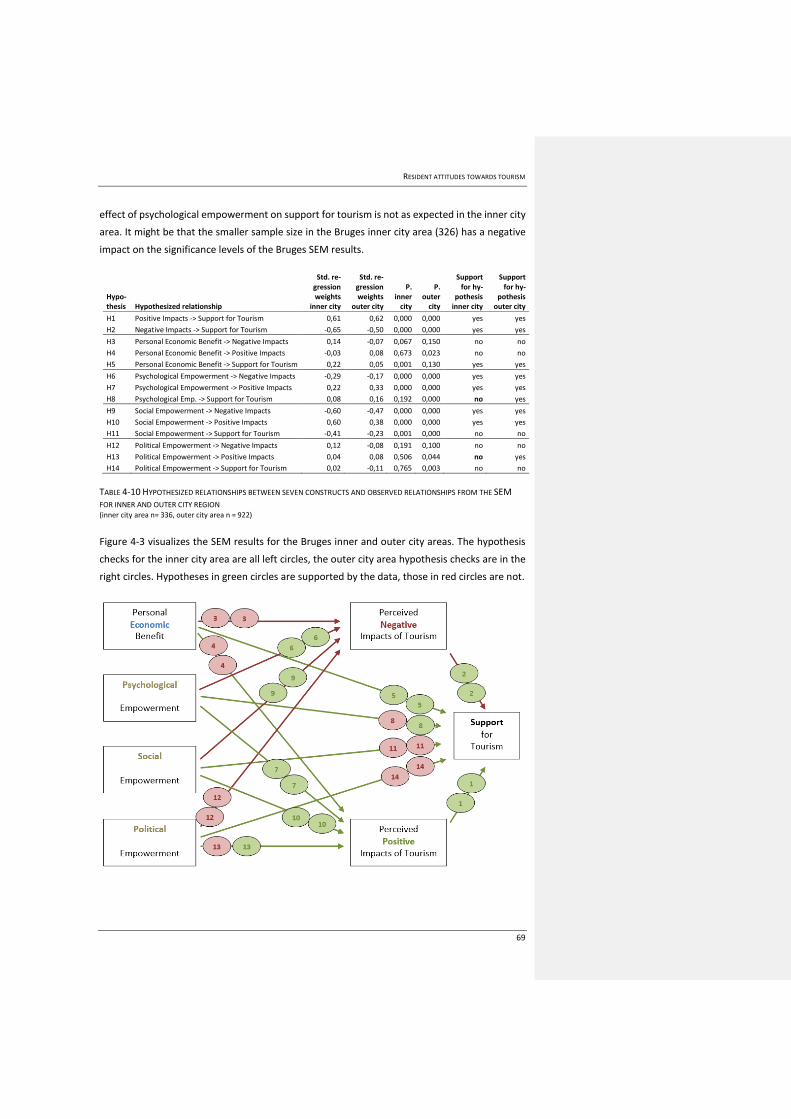
RESIDENT ATTITUDES TOWARDS TOURISM
69
effect of psychological empowerment on support for tourism is not as expected in the inner city
area. It might be that the smaller sample size in the Bruges inner city area (326) has a negative
impact on the significance levels of the Bruges SEM results.
Hypo-thesis Hypothesized relationship
Std. re-gression weights
inner city
Std. re-gression weights
outer city
P. inner
city
P. outer
city
Support for hy-
pothesis inner city
Support for hy-
pothesis outer city
H1 Positive Impacts -> Support for Tourism 0,61 0,62 0,000 0,000 yes yes
H2 Negative Impacts -> Support for Tourism -0,65 -0,50 0,000 0,000 yes yes
H3 Personal Economic Benefit -> Negative Impacts 0,14 -0,07 0,067 0,150 no no
H4 Personal Economic Benefit -> Positive Impacts -0,03 0,08 0,673 0,023 no no
H5 Personal Economic Benefit -> Support for Tourism 0,22 0,05 0,001 0,130 yes yes
H6 Psychological Empowerment -> Negative Impacts -0,29 -0,17 0,000 0,000 yes yes
H7 Psychological Empowerment -> Positive Impacts 0,22 0,33 0,000 0,000 yes yes
H8 Psychological Emp. -> Support for Tourism 0,08 0,16 0,192 0,000 no yes
H9 Social Empowerment -> Negative Impacts -0,60 -0,47 0,000 0,000 yes yes
H10 Social Empowerment -> Positive Impacts 0,60 0,38 0,000 0,000 yes yes
H11 Social Empowerment -> Support for Tourism -0,41 -0,23 0,001 0,000 no no
H12 Political Empowerment -> Negative Impacts 0,12 -0,08 0,191 0,100 no no
H13 Political Empowerment -> Positive Impacts 0,04 0,08 0,506 0,044 no yes
H14 Political Empowerment -> Support for Tourism 0,02 -0,11 0,765 0,003 no no
TABLE 4-10 HYPOTHESIZED RELATIONSHIPS BETWEEN SEVEN CONSTRUCTS AND OBSERVED RELATIONSHIPS FROM THE SEM
FOR INNER AND OUTER CITY REGION (inner city area n= 336, outer city area n = 922)
Figure 4-3 visualizes the SEM results for the Bruges inner and outer city areas. The hypothesis
checks for the inner city area are all left circles, the outer city area hypothesis checks are in the
right circles. Hypotheses in green circles are supported by the data, those in red circles are not.
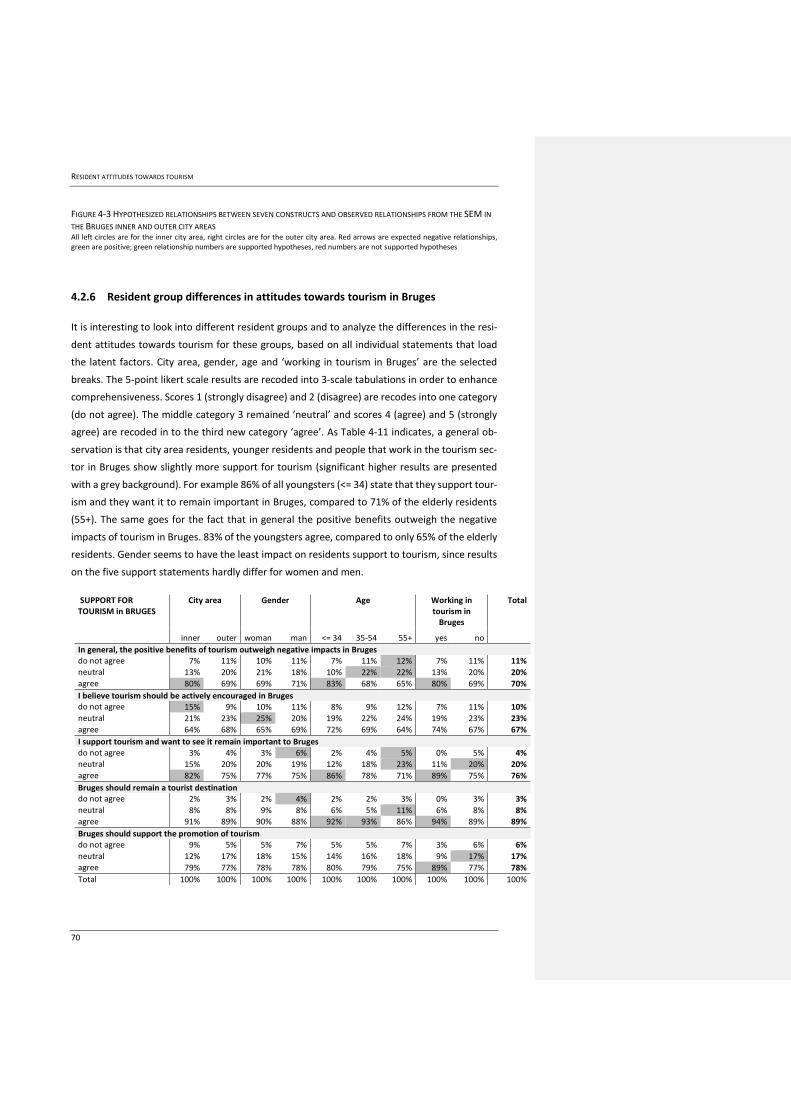
RESIDENT ATTITUDES TOWARDS TOURISM
70
FIGURE 4-3 HYPOTHESIZED RELATIONSHIPS BETWEEN SEVEN CONSTRUCTS AND OBSERVED RELATIONSHIPS FROM THE SEM IN
THE BRUGES INNER AND OUTER CITY AREAS All left circles are for the inner city area, right circles are for the outer city area. Red arrows are expected negative relationships, green are positive; green relationship numbers are supported hypotheses, red numbers are not supported hypotheses
4.2.6 Resident group differences in attitudes towards tourism in Bruges
It is interesting to look into different resident groups and to analyze the differences in the resi-
dent attitudes towards tourism for these groups, based on all individual statements that load
the latent factors. City area, gender, age and ‘working in tourism in Bruges’ are the selected
breaks. The 5-point likert scale results are recoded into 3-scale tabulations in order to enhance
comprehensiveness. Scores 1 (strongly disagree) and 2 (disagree) are recodes into one category
(do not agree). The middle category 3 remained ‘neutral’ and scores 4 (agree) and 5 (strongly
agree) are recoded in to the third new category ‘agree’. As Table 4-11 indicates, a general ob-
servation is that city area residents, younger residents and people that work in the tourism sec-
tor in Bruges show slightly more support for tourism (significant higher results are presented
with a grey background). For example 86% of all youngsters (<= 34) state that they support tour-
ism and they want it to remain important in Bruges, compared to 71% of the elderly residents
(55+). The same goes for the fact that in general the positive benefits outweigh the negative
impacts of tourism in Bruges. 83% of the youngsters agree, compared to only 65% of the elderly
residents. Gender seems to have the least impact on residents support to tourism, since results
on the five support statements hardly differ for women and men.
SUPPORT FOR TOURISM in BRUGES
City area Gender Age Working in tourism in
Bruges
Total
inner outer woman man <= 34 35-54 55+ yes no
In general, the positive benefits of tourism outweigh negative impacts in Bruges do not agree 7% 11% 10% 11% 7% 11% 12% 7% 11% 11% neutral 13% 20% 21% 18% 10% 22% 22% 13% 20% 20% agree 80% 69% 69% 71% 83% 68% 65% 80% 69% 70%
I believe tourism should be actively encouraged in Bruges do not agree 15% 9% 10% 11% 8% 9% 12% 7% 11% 10% neutral 21% 23% 25% 20% 19% 22% 24% 19% 23% 23% agree 64% 68% 65% 69% 72% 69% 64% 74% 67% 67%
I support tourism and want to see it remain important to Bruges do not agree 3% 4% 3% 6% 2% 4% 5% 0% 5% 4% neutral 15% 20% 20% 19% 12% 18% 23% 11% 20% 20% agree 82% 75% 77% 75% 86% 78% 71% 89% 75% 76%
Bruges should remain a tourist destination do not agree 2% 3% 2% 4% 2% 2% 3% 0% 3% 3% neutral 8% 8% 9% 8% 6% 5% 11% 6% 8% 8% agree 91% 89% 90% 88% 92% 93% 86% 94% 89% 89%
Bruges should support the promotion of tourism do not agree 9% 5% 5% 7% 5% 5% 7% 3% 6% 6%
neutral 12% 17% 18% 15% 14% 16% 18% 9% 17% 17% agree 79% 77% 78% 78% 80% 79% 75% 89% 77% 78%
Total 100% 100% 100% 100% 100% 100% 100% 100% 100% 100%
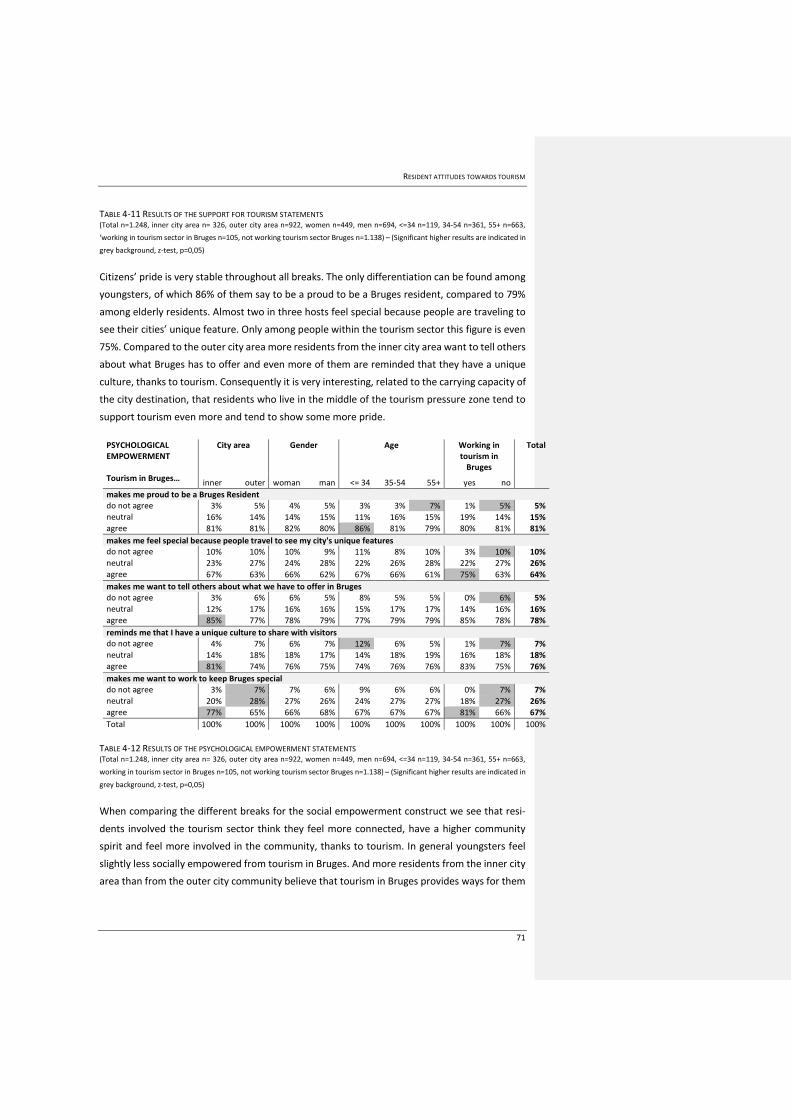
RESIDENT ATTITUDES TOWARDS TOURISM
71
TABLE 4-11 RESULTS OF THE SUPPORT FOR TOURISM STATEMENTS (Total n=1.248, inner city area n= 326, outer city area n=922, women n=449, men n=694, <=34 n=119, 34-54 n=361, 55+ n=663,
‘working in tourism sector in Bruges n=105, not working tourism sector Bruges n=1.138) – (Significant higher results are indicated in
grey background, z-test, p=0,05)
Citizens’ pride is very stable throughout all breaks. The only differentiation can be found among
youngsters, of which 86% of them say to be a proud to be a Bruges resident, compared to 79%
among elderly residents. Almost two in three hosts feel special because people are traveling to
see their cities’ unique feature. Only among people within the tourism sector this figure is even
75%. Compared to the outer city area more residents from the inner city area want to tell others
about what Bruges has to offer and even more of them are reminded that they have a unique
culture, thanks to tourism. Consequently it is very interesting, related to the carrying capacity of
the city destination, that residents who live in the middle of the tourism pressure zone tend to
support tourism even more and tend to show some more pride.
PSYCHOLOGICAL EMPOWERMENT Tourism in Bruges…
City area Gender Age Working in tourism in
Bruges
Total
inner outer woman man <= 34 35-54 55+ yes no
makes me proud to be a Bruges Resident do not agree 3% 5% 4% 5% 3% 3% 7% 1% 5% 5% neutral 16% 14% 14% 15% 11% 16% 15% 19% 14% 15% agree 81% 81% 82% 80% 86% 81% 79% 80% 81% 81%
makes me feel special because people travel to see my city's unique features do not agree 10% 10% 10% 9% 11% 8% 10% 3% 10% 10% neutral 23% 27% 24% 28% 22% 26% 28% 22% 27% 26% agree 67% 63% 66% 62% 67% 66% 61% 75% 63% 64%
makes me want to tell others about what we have to offer in Bruges do not agree 3% 6% 6% 5% 8% 5% 5% 0% 6% 5% neutral 12% 17% 16% 16% 15% 17% 17% 14% 16% 16% agree 85% 77% 78% 79% 77% 79% 79% 85% 78% 78%
reminds me that I have a unique culture to share with visitors do not agree 4% 7% 6% 7% 12% 6% 5% 1% 7% 7% neutral 14% 18% 18% 17% 14% 18% 19% 16% 18% 18% agree 81% 74% 76% 75% 74% 76% 76% 83% 75% 76%
makes me want to work to keep Bruges special do not agree 3% 7% 7% 6% 9% 6% 6% 0% 7% 7% neutral 20% 28% 27% 26% 24% 27% 27% 18% 27% 26% agree 77% 65% 66% 68% 67% 67% 67% 81% 66% 67%
Total 100% 100% 100% 100% 100% 100% 100% 100% 100% 100%
TABLE 4-12 RESULTS OF THE PSYCHOLOGICAL EMPOWERMENT STATEMENTS (Total n=1.248, inner city area n= 326, outer city area n=922, women n=449, men n=694, <=34 n=119, 34-54 n=361, 55+ n=663,
working in tourism sector in Bruges n=105, not working tourism sector Bruges n=1.138) – (Significant higher results are indicated in
grey background, z-test, p=0,05)
When comparing the different breaks for the social empowerment construct we see that resi-
dents involved the tourism sector think they feel more connected, have a higher community
spirit and feel more involved in the community, thanks to tourism. In general youngsters feel
slightly less socially empowered from tourism in Bruges. And more residents from the inner city
area than from the outer city community believe that tourism in Bruges provides ways for them
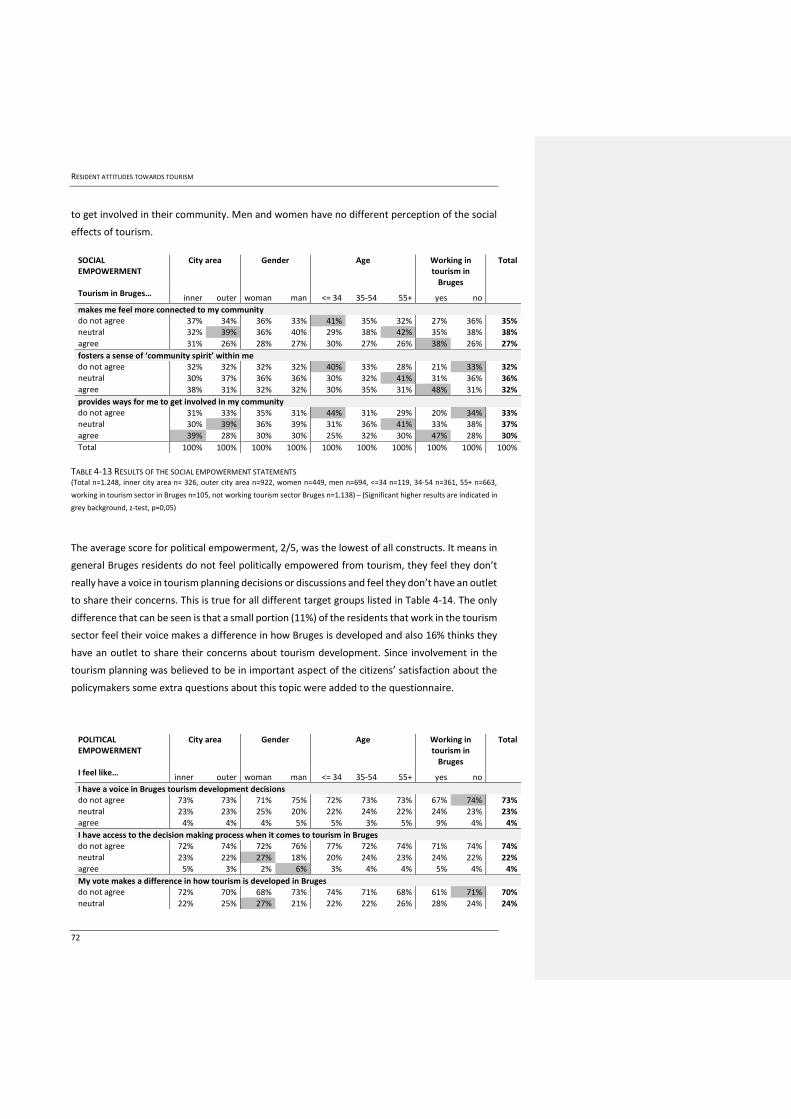
RESIDENT ATTITUDES TOWARDS TOURISM
72
to get involved in their community. Men and women have no different perception of the social
effects of tourism.
SOCIAL EMPOWERMENT Tourism in Bruges…
City area Gender Age Working in tourism in
Bruges
Total
inner outer woman man <= 34 35-54 55+ yes no
makes me feel more connected to my community do not agree 37% 34% 36% 33% 41% 35% 32% 27% 36% 35% neutral 32% 39% 36% 40% 29% 38% 42% 35% 38% 38%
agree 31% 26% 28% 27% 30% 27% 26% 38% 26% 27%
fosters a sense of ‘community spirit’ within me do not agree 32% 32% 32% 32% 40% 33% 28% 21% 33% 32% neutral 30% 37% 36% 36% 30% 32% 41% 31% 36% 36% agree 38% 31% 32% 32% 30% 35% 31% 48% 31% 32%
provides ways for me to get involved in my community do not agree 31% 33% 35% 31% 44% 31% 29% 20% 34% 33% neutral 30% 39% 36% 39% 31% 36% 41% 33% 38% 37%
agree 39% 28% 30% 30% 25% 32% 30% 47% 28% 30%
Total 100% 100% 100% 100% 100% 100% 100% 100% 100% 100%
TABLE 4-13 RESULTS OF THE SOCIAL EMPOWERMENT STATEMENTS (Total n=1.248, inner city area n= 326, outer city area n=922, women n=449, men n=694, <=34 n=119, 34-54 n=361, 55+ n=663,
working in tourism sector in Bruges n=105, not working tourism sector Bruges n=1.138) – (Significant higher results are indicated in
grey background, z-test, p=0,05)
The average score for political empowerment, 2/5, was the lowest of all constructs. It means in
general Bruges residents do not feel politically empowered from tourism, they feel they don’t
really have a voice in tourism planning decisions or discussions and feel they don’t have an outlet
to share their concerns. This is true for all different target groups listed in Table 4-14. The only
difference that can be seen is that a small portion (11%) of the residents that work in the tourism
sector feel their voice makes a difference in how Bruges is developed and also 16% thinks they
have an outlet to share their concerns about tourism development. Since involvement in the
tourism planning was believed to be in important aspect of the citizens’ satisfaction about the
policymakers some extra questions about this topic were added to the questionnaire.
POLITICAL EMPOWERMENT I feel like…
City area Gender Age Working in tourism in
Bruges
Total
inner outer woman man <= 34 35-54 55+ yes no
I have a voice in Bruges tourism development decisions do not agree 73% 73% 71% 75% 72% 73% 73% 67% 74% 73% neutral 23% 23% 25% 20% 22% 24% 22% 24% 23% 23% agree 4% 4% 4% 5% 5% 3% 5% 9% 4% 4%
I have access to the decision making process when it comes to tourism in Bruges do not agree 72% 74% 72% 76% 77% 72% 74% 71% 74% 74% neutral 23% 22% 27% 18% 20% 24% 23% 24% 22% 22% agree 5% 3% 2% 6% 3% 4% 4% 5% 4% 4%
My vote makes a difference in how tourism is developed in Bruges do not agree 72% 70% 68% 73% 74% 71% 68% 61% 71% 70% neutral 22% 25% 27% 21% 22% 22% 26% 28% 24% 24%
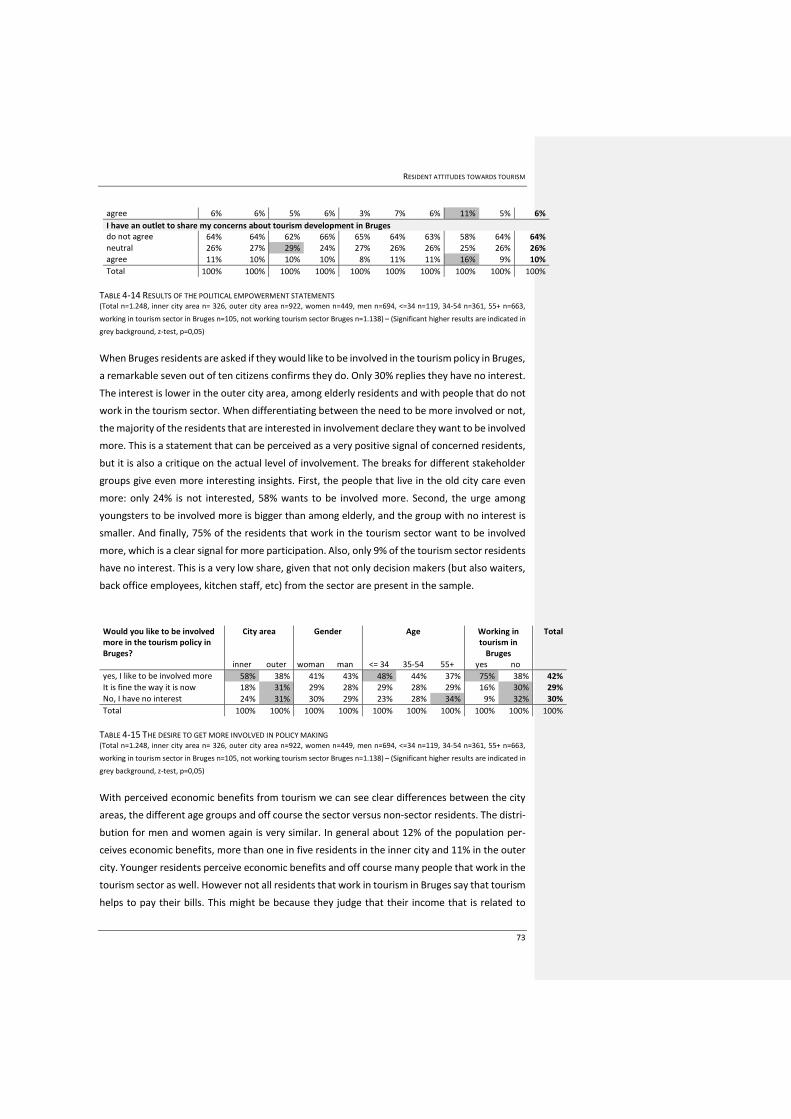
RESIDENT ATTITUDES TOWARDS TOURISM
73
agree 6% 6% 5% 6% 3% 7% 6% 11% 5% 6%
I have an outlet to share my concerns about tourism development in Bruges do not agree 64% 64% 62% 66% 65% 64% 63% 58% 64% 64% neutral 26% 27% 29% 24% 27% 26% 26% 25% 26% 26% agree 11% 10% 10% 10% 8% 11% 11% 16% 9% 10%
Total 100% 100% 100% 100% 100% 100% 100% 100% 100% 100%
TABLE 4-14 RESULTS OF THE POLITICAL EMPOWERMENT STATEMENTS (Total n=1.248, inner city area n= 326, outer city area n=922, women n=449, men n=694, <=34 n=119, 34-54 n=361, 55+ n=663,
working in tourism sector in Bruges n=105, not working tourism sector Bruges n=1.138) – (Significant higher results are indicated in
grey background, z-test, p=0,05)
When Bruges residents are asked if they would like to be involved in the tourism policy in Bruges,
a remarkable seven out of ten citizens confirms they do. Only 30% replies they have no interest.
The interest is lower in the outer city area, among elderly residents and with people that do not
work in the tourism sector. When differentiating between the need to be more involved or not,
the majority of the residents that are interested in involvement declare they want to be involved
more. This is a statement that can be perceived as a very positive signal of concerned residents,
but it is also a critique on the actual level of involvement. The breaks for different stakeholder
groups give even more interesting insights. First, the people that live in the old city care even
more: only 24% is not interested, 58% wants to be involved more. Second, the urge among
youngsters to be involved more is bigger than among elderly, and the group with no interest is
smaller. And finally, 75% of the residents that work in the tourism sector want to be involved
more, which is a clear signal for more participation. Also, only 9% of the tourism sector residents
have no interest. This is a very low share, given that not only decision makers (but also waiters,
back office employees, kitchen staff, etc) from the sector are present in the sample.
Would you like to be involved more in the tourism policy in Bruges?
City area Gender Age Working in tourism in
Bruges
Total
inner outer woman man <= 34 35-54 55+ yes no
yes, I like to be involved more 58% 38% 41% 43% 48% 44% 37% 75% 38% 42% It is fine the way it is now 18% 31% 29% 28% 29% 28% 29% 16% 30% 29% No, I have no interest 24% 31% 30% 29% 23% 28% 34% 9% 32% 30%
Total 100% 100% 100% 100% 100% 100% 100% 100% 100% 100%
TABLE 4-15 THE DESIRE TO GET MORE INVOLVED IN POLICY MAKING (Total n=1.248, inner city area n= 326, outer city area n=922, women n=449, men n=694, <=34 n=119, 34-54 n=361, 55+ n=663,
working in tourism sector in Bruges n=105, not working tourism sector Bruges n=1.138) – (Significant higher results are indicated in
grey background, z-test, p=0,05)
With perceived economic benefits from tourism we can see clear differences between the city
areas, the different age groups and off course the sector versus non-sector residents. The distri-
bution for men and women again is very similar. In general about 12% of the population per-
ceives economic benefits, more than one in five residents in the inner city and 11% in the outer
city. Younger residents perceive economic benefits and off course many people that work in the
tourism sector as well. However not all residents that work in tourism in Bruges say that tourism
helps to pay their bills. This might be because they judge that their income that is related to
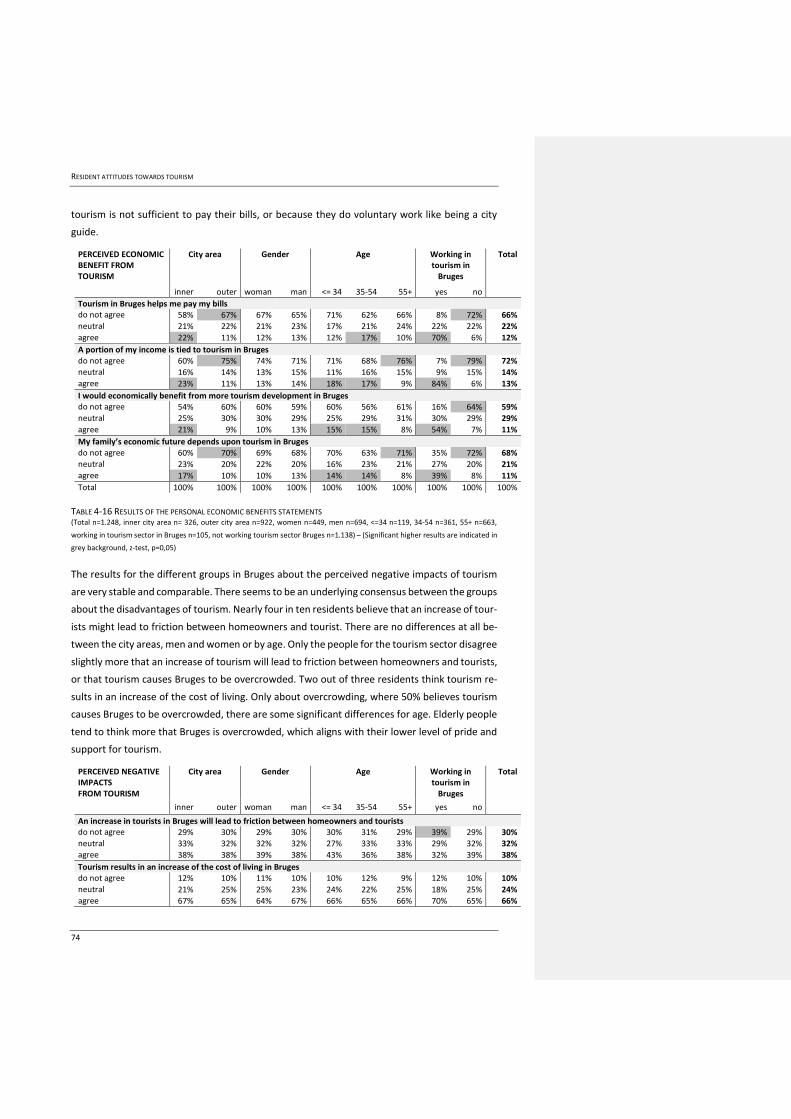
RESIDENT ATTITUDES TOWARDS TOURISM
74
tourism is not sufficient to pay their bills, or because they do voluntary work like being a city
guide.
PERCEIVED ECONOMIC BENEFIT FROM TOURISM
City area Gender Age Working in tourism in
Bruges
Total
inner outer woman man <= 34 35-54 55+ yes no
Tourism in Bruges helps me pay my bills do not agree 58% 67% 67% 65% 71% 62% 66% 8% 72% 66% neutral 21% 22% 21% 23% 17% 21% 24% 22% 22% 22%
agree 22% 11% 12% 13% 12% 17% 10% 70% 6% 12%
A portion of my income is tied to tourism in Bruges do not agree 60% 75% 74% 71% 71% 68% 76% 7% 79% 72% neutral 16% 14% 13% 15% 11% 16% 15% 9% 15% 14% agree 23% 11% 13% 14% 18% 17% 9% 84% 6% 13%
I would economically benefit from more tourism development in Bruges do not agree 54% 60% 60% 59% 60% 56% 61% 16% 64% 59% neutral 25% 30% 30% 29% 25% 29% 31% 30% 29% 29%
agree 21% 9% 10% 13% 15% 15% 8% 54% 7% 11%
My family’s economic future depends upon tourism in Bruges do not agree 60% 70% 69% 68% 70% 63% 71% 35% 72% 68% neutral 23% 20% 22% 20% 16% 23% 21% 27% 20% 21% agree 17% 10% 10% 13% 14% 14% 8% 39% 8% 11%
Total 100% 100% 100% 100% 100% 100% 100% 100% 100% 100%
TABLE 4-16 RESULTS OF THE PERSONAL ECONOMIC BENEFITS STATEMENTS (Total n=1.248, inner city area n= 326, outer city area n=922, women n=449, men n=694, <=34 n=119, 34-54 n=361, 55+ n=663,
working in tourism sector in Bruges n=105, not working tourism sector Bruges n=1.138) – (Significant higher results are indicated in
grey background, z-test, p=0,05)
The results for the different groups in Bruges about the perceived negative impacts of tourism
are very stable and comparable. There seems to be an underlying consensus between the groups
about the disadvantages of tourism. Nearly four in ten residents believe that an increase of tour-
ists might lead to friction between homeowners and tourist. There are no differences at all be-
tween the city areas, men and women or by age. Only the people for the tourism sector disagree
slightly more that an increase of tourism will lead to friction between homeowners and tourists,
or that tourism causes Bruges to be overcrowded. Two out of three residents think tourism re-
sults in an increase of the cost of living. Only about overcrowding, where 50% believes tourism
causes Bruges to be overcrowded, there are some significant differences for age. Elderly people
tend to think more that Bruges is overcrowded, which aligns with their lower level of pride and
support for tourism.
PERCEIVED NEGATIVE IMPACTS FROM TOURISM
City area Gender Age Working in tourism in
Bruges
Total
inner outer woman man <= 34 35-54 55+ yes no
An increase in tourists in Bruges will lead to friction between homeowners and tourists do not agree 29% 30% 29% 30% 30% 31% 29% 39% 29% 30% neutral 33% 32% 32% 32% 27% 33% 33% 29% 32% 32% agree 38% 38% 39% 38% 43% 36% 38% 32% 39% 38%
Tourism results in an increase of the cost of living in Bruges do not agree 12% 10% 11% 10% 10% 12% 9% 12% 10% 10% neutral 21% 25% 25% 23% 24% 22% 25% 18% 25% 24% agree 67% 65% 64% 67% 66% 65% 66% 70% 65% 66%
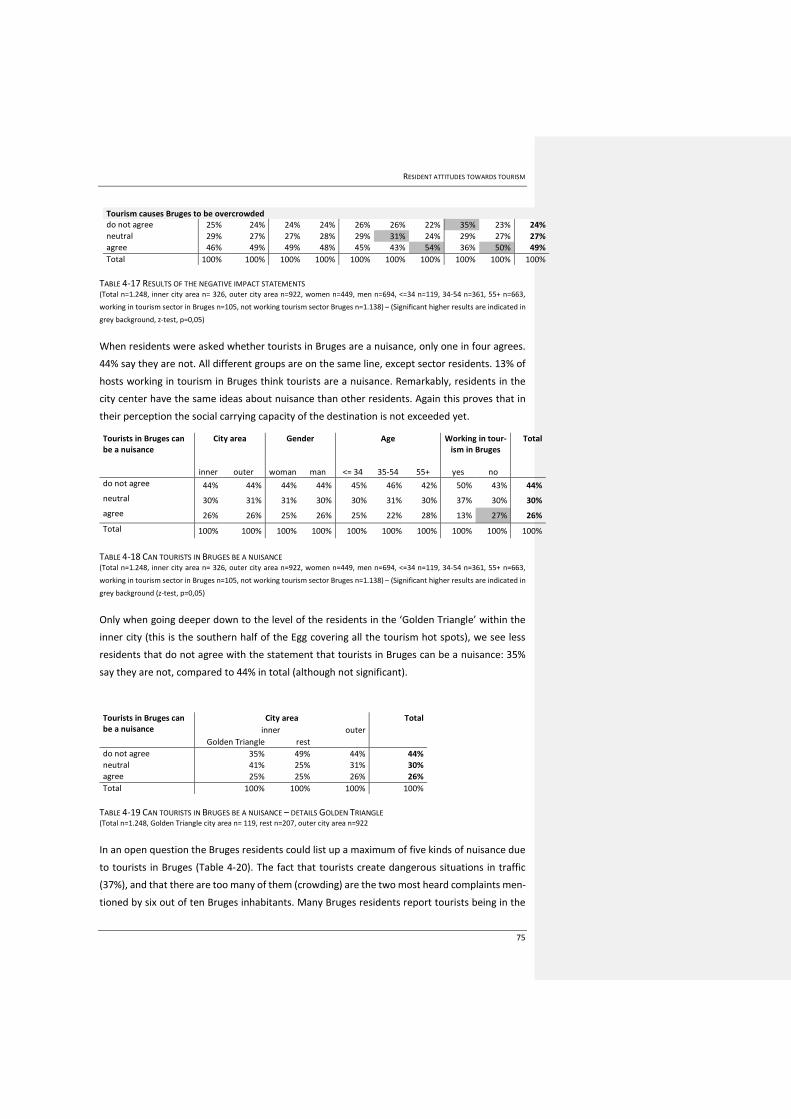
RESIDENT ATTITUDES TOWARDS TOURISM
75
Tourism causes Bruges to be overcrowded do not agree 25% 24% 24% 24% 26% 26% 22% 35% 23% 24% neutral 29% 27% 27% 28% 29% 31% 24% 29% 27% 27% agree 46% 49% 49% 48% 45% 43% 54% 36% 50% 49%
Total 100% 100% 100% 100% 100% 100% 100% 100% 100% 100%
TABLE 4-17 RESULTS OF THE NEGATIVE IMPACT STATEMENTS (Total n=1.248, inner city area n= 326, outer city area n=922, women n=449, men n=694, <=34 n=119, 34-54 n=361, 55+ n=663,
working in tourism sector in Bruges n=105, not working tourism sector Bruges n=1.138) – (Significant higher results are indicated in
grey background, z-test, p=0,05)
When residents were asked whether tourists in Bruges are a nuisance, only one in four agrees.
44% say they are not. All different groups are on the same line, except sector residents. 13% of
hosts working in tourism in Bruges think tourists are a nuisance. Remarkably, residents in the
city center have the same ideas about nuisance than other residents. Again this proves that in
their perception the social carrying capacity of the destination is not exceeded yet.
Tourists in Bruges can be a nuisance
City area Gender Age Working in tour-ism in Bruges
Total
inner outer woman man <= 34 35-54 55+ yes no
do not agree 44% 44% 44% 44% 45% 46% 42% 50% 43% 44%
neutral 30% 31% 31% 30% 30% 31% 30% 37% 30% 30%
agree 26% 26% 25% 26% 25% 22% 28% 13% 27% 26%
Total 100% 100% 100% 100% 100% 100% 100% 100% 100% 100%
TABLE 4-18 CAN TOURISTS IN BRUGES BE A NUISANCE (Total n=1.248, inner city area n= 326, outer city area n=922, women n=449, men n=694, <=34 n=119, 34-54 n=361, 55+ n=663,
working in tourism sector in Bruges n=105, not working tourism sector Bruges n=1.138) – (Significant higher results are indicated in
grey background (z-test, p=0,05)
Only when going deeper down to the level of the residents in the ‘Golden Triangle’ within the
inner city (this is the southern half of the Egg covering all the tourism hot spots), we see less
residents that do not agree with the statement that tourists in Bruges can be a nuisance: 35%
say they are not, compared to 44% in total (although not significant).
Tourists in Bruges can be a nuisance
City area Total
inner outer Golden Triangle rest
do not agree 35% 49% 44% 44% neutral 41% 25% 31% 30% agree 25% 25% 26% 26%
Total 100% 100% 100% 100%
TABLE 4-19 CAN TOURISTS IN BRUGES BE A NUISANCE – DETAILS GOLDEN TRIANGLE (Total n=1.248, Golden Triangle city area n= 119, rest n=207, outer city area n=922
In an open question the Bruges residents could list up a maximum of five kinds of nuisance due
to tourists in Bruges (Table 4-20). The fact that tourists create dangerous situations in traffic
(37%), and that there are too many of them (crowding) are the two most heard complaints men-
tioned by six out of ten Bruges inhabitants. Many Bruges residents report tourists being in the
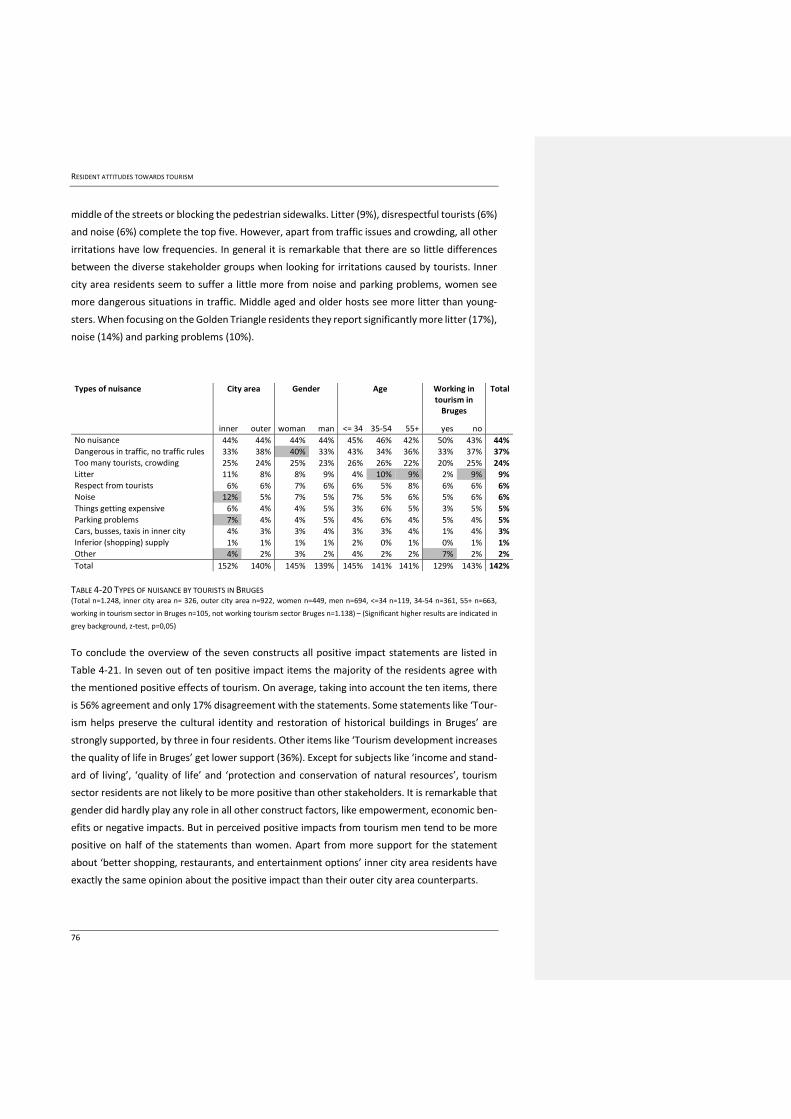
RESIDENT ATTITUDES TOWARDS TOURISM
76
middle of the streets or blocking the pedestrian sidewalks. Litter (9%), disrespectful tourists (6%)
and noise (6%) complete the top five. However, apart from traffic issues and crowding, all other
irritations have low frequencies. In general it is remarkable that there are so little differences
between the diverse stakeholder groups when looking for irritations caused by tourists. Inner
city area residents seem to suffer a little more from noise and parking problems, women see
more dangerous situations in traffic. Middle aged and older hosts see more litter than young-
sters. When focusing on the Golden Triangle residents they report significantly more litter (17%),
noise (14%) and parking problems (10%).
Types of nuisance City area Gender Age Working in tourism in
Bruges
Total
inner outer woman man <= 34 35-54 55+ yes no
No nuisance 44% 44% 44% 44% 45% 46% 42% 50% 43% 44% Dangerous in traffic, no traffic rules 33% 38% 40% 33% 43% 34% 36% 33% 37% 37% Too many tourists, crowding 25% 24% 25% 23% 26% 26% 22% 20% 25% 24% Litter 11% 8% 8% 9% 4% 10% 9% 2% 9% 9% Respect from tourists 6% 6% 7% 6% 6% 5% 8% 6% 6% 6% Noise 12% 5% 7% 5% 7% 5% 6% 5% 6% 6%
Things getting expensive 6% 4% 4% 5% 3% 6% 5% 3% 5% 5% Parking problems 7% 4% 4% 5% 4% 6% 4% 5% 4% 5% Cars, busses, taxis in inner city 4% 3% 3% 4% 3% 3% 4% 1% 4% 3% Inferior (shopping) supply 1% 1% 1% 1% 2% 0% 1% 0% 1% 1% Other 4% 2% 3% 2% 4% 2% 2% 7% 2% 2%
Total 152% 140% 145% 139% 145% 141% 141% 129% 143% 142%
TABLE 4-20 TYPES OF NUISANCE BY TOURISTS IN BRUGES (Total n=1.248, inner city area n= 326, outer city area n=922, women n=449, men n=694, <=34 n=119, 34-54 n=361, 55+ n=663,
working in tourism sector in Bruges n=105, not working tourism sector Bruges n=1.138) – (Significant higher results are indicated in
grey background, z-test, p=0,05)
To conclude the overview of the seven constructs all positive impact statements are listed in
Table 4-21. In seven out of ten positive impact items the majority of the residents agree with
the mentioned positive effects of tourism. On average, taking into account the ten items, there
is 56% agreement and only 17% disagreement with the statements. Some statements like ‘Tour-
ism helps preserve the cultural identity and restoration of historical buildings in Bruges’ are
strongly supported, by three in four residents. Other items like ‘Tourism development increases
the quality of life in Bruges’ get lower support (36%). Except for subjects like ‘income and stand-
ard of living’, ‘quality of life’ and ‘protection and conservation of natural resources’, tourism
sector residents are not likely to be more positive than other stakeholders. It is remarkable that
gender did hardly play any role in all other construct factors, like empowerment, economic ben-
efits or negative impacts. But in perceived positive impacts from tourism men tend to be more
positive on half of the statements than women. Apart from more support for the statement
about ‘better shopping, restaurants, and entertainment options’ inner city area residents have
exactly the same opinion about the positive impact than their outer city area counterparts.
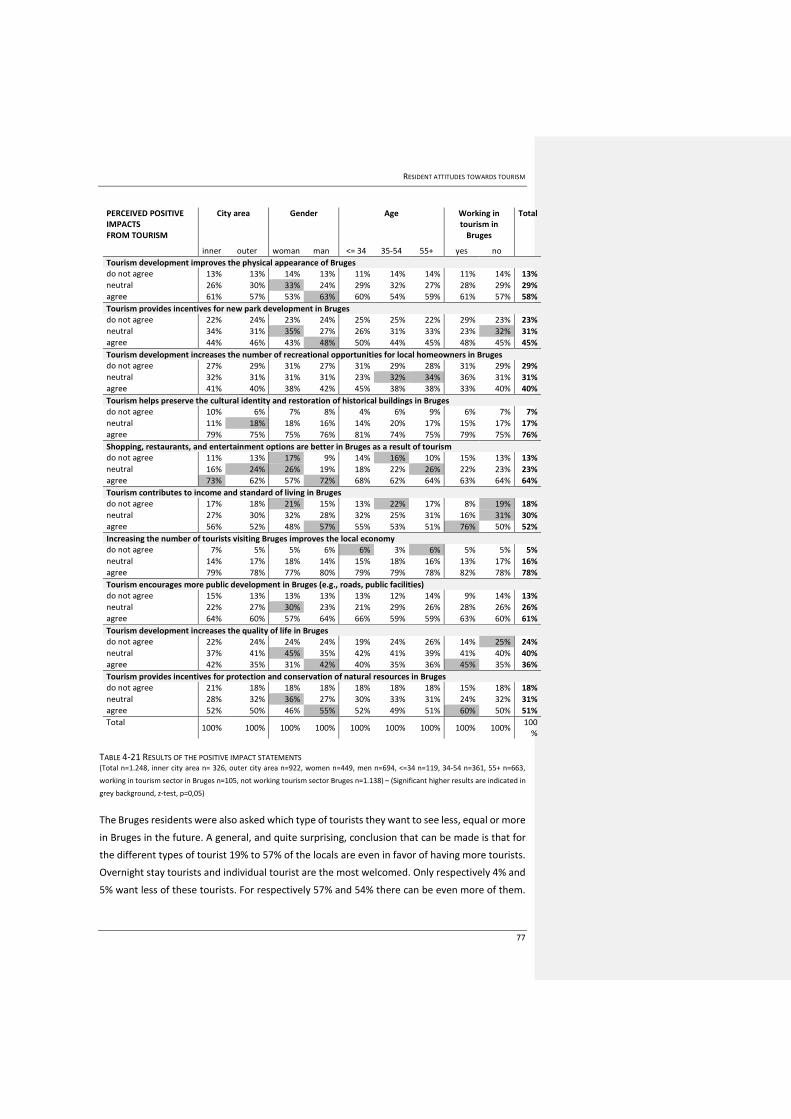
RESIDENT ATTITUDES TOWARDS TOURISM
77
PERCEIVED POSITIVE IMPACTS FROM TOURISM
City area Gender Age Working in tourism in
Bruges
Total
inner outer woman man <= 34 35-54 55+ yes no
Tourism development improves the physical appearance of Bruges do not agree 13% 13% 14% 13% 11% 14% 14% 11% 14% 13% neutral 26% 30% 33% 24% 29% 32% 27% 28% 29% 29% agree 61% 57% 53% 63% 60% 54% 59% 61% 57% 58%
Tourism provides incentives for new park development in Bruges do not agree 22% 24% 23% 24% 25% 25% 22% 29% 23% 23% neutral 34% 31% 35% 27% 26% 31% 33% 23% 32% 31% agree 44% 46% 43% 48% 50% 44% 45% 48% 45% 45%
Tourism development increases the number of recreational opportunities for local homeowners in Bruges do not agree 27% 29% 31% 27% 31% 29% 28% 31% 29% 29% neutral 32% 31% 31% 31% 23% 32% 34% 36% 31% 31% agree 41% 40% 38% 42% 45% 38% 38% 33% 40% 40%
Tourism helps preserve the cultural identity and restoration of historical buildings in Bruges do not agree 10% 6% 7% 8% 4% 6% 9% 6% 7% 7%
neutral 11% 18% 18% 16% 14% 20% 17% 15% 17% 17% agree 79% 75% 75% 76% 81% 74% 75% 79% 75% 76%
Shopping, restaurants, and entertainment options are better in Bruges as a result of tourism do not agree 11% 13% 17% 9% 14% 16% 10% 15% 13% 13% neutral 16% 24% 26% 19% 18% 22% 26% 22% 23% 23% agree 73% 62% 57% 72% 68% 62% 64% 63% 64% 64%
Tourism contributes to income and standard of living in Bruges do not agree 17% 18% 21% 15% 13% 22% 17% 8% 19% 18%
neutral 27% 30% 32% 28% 32% 25% 31% 16% 31% 30% agree 56% 52% 48% 57% 55% 53% 51% 76% 50% 52%
Increasing the number of tourists visiting Bruges improves the local economy do not agree 7% 5% 5% 6% 6% 3% 6% 5% 5% 5% neutral 14% 17% 18% 14% 15% 18% 16% 13% 17% 16% agree 79% 78% 77% 80% 79% 79% 78% 82% 78% 78%
Tourism encourages more public development in Bruges (e.g., roads, public facilities) do not agree 15% 13% 13% 13% 13% 12% 14% 9% 14% 13%
neutral 22% 27% 30% 23% 21% 29% 26% 28% 26% 26% agree 64% 60% 57% 64% 66% 59% 59% 63% 60% 61%
Tourism development increases the quality of life in Bruges do not agree 22% 24% 24% 24% 19% 24% 26% 14% 25% 24% neutral 37% 41% 45% 35% 42% 41% 39% 41% 40% 40% agree 42% 35% 31% 42% 40% 35% 36% 45% 35% 36%
Tourism provides incentives for protection and conservation of natural resources in Bruges do not agree 21% 18% 18% 18% 18% 18% 18% 15% 18% 18%
neutral 28% 32% 36% 27% 30% 33% 31% 24% 32% 31% agree 52% 50% 46% 55% 52% 49% 51% 60% 50% 51%
Total 100% 100% 100% 100% 100% 100% 100% 100% 100%
100%
TABLE 4-21 RESULTS OF THE POSITIVE IMPACT STATEMENTS (Total n=1.248, inner city area n= 326, outer city area n=922, women n=449, men n=694, <=34 n=119, 34-54 n=361, 55+ n=663,
working in tourism sector in Bruges n=105, not working tourism sector Bruges n=1.138) – (Significant higher results are indicated in
grey background, z-test, p=0,05)
The Bruges residents were also asked which type of tourists they want to see less, equal or more
in Bruges in the future. A general, and quite surprising, conclusion that can be made is that for
the different types of tourist 19% to 57% of the locals are even in favor of having more tourists.
Overnight stay tourists and individual tourist are the most welcomed. Only respectively 4% and
5% want less of these tourists. For respectively 57% and 54% there can be even more of them.
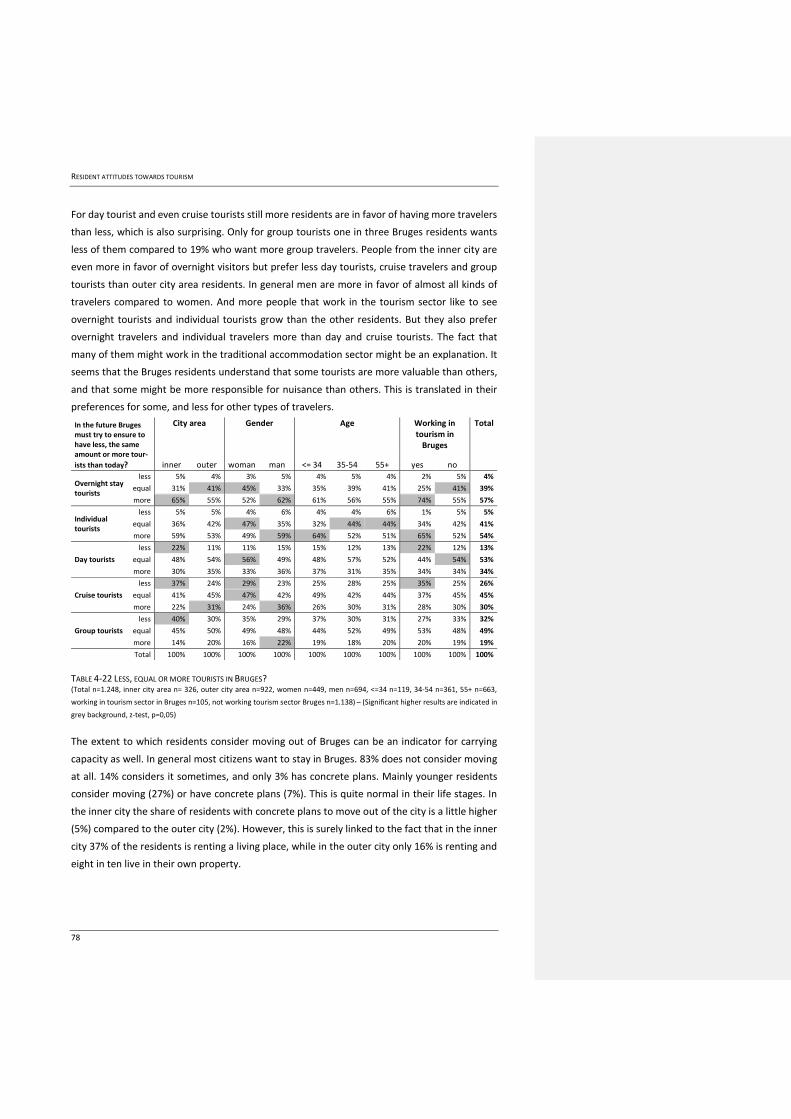
RESIDENT ATTITUDES TOWARDS TOURISM
78
For day tourist and even cruise tourists still more residents are in favor of having more travelers
than less, which is also surprising. Only for group tourists one in three Bruges residents wants
less of them compared to 19% who want more group travelers. People from the inner city are
even more in favor of overnight visitors but prefer less day tourists, cruise travelers and group
tourists than outer city area residents. In general men are more in favor of almost all kinds of
travelers compared to women. And more people that work in the tourism sector like to see
overnight tourists and individual tourists grow than the other residents. But they also prefer
overnight travelers and individual travelers more than day and cruise tourists. The fact that
many of them might work in the traditional accommodation sector might be an explanation. It
seems that the Bruges residents understand that some tourists are more valuable than others,
and that some might be more responsible for nuisance than others. This is translated in their
preferences for some, and less for other types of travelers.
In the future Bruges must try to ensure to have less, the same amount or more tour-
ists than today?
City area Gender Age Working in tourism in
Bruges
Total
inner outer woman man <= 34 35-54 55+ yes no
Overnight stay tourists
less 5% 4% 3% 5% 4% 5% 4% 2% 5% 4%
equal 31% 41% 45% 33% 35% 39% 41% 25% 41% 39%
more 65% 55% 52% 62% 61% 56% 55% 74% 55% 57%
Individual tourists
less 5% 5% 4% 6% 4% 4% 6% 1% 5% 5%
equal 36% 42% 47% 35% 32% 44% 44% 34% 42% 41%
more 59% 53% 49% 59% 64% 52% 51% 65% 52% 54%
Day tourists
less 22% 11% 11% 15% 15% 12% 13% 22% 12% 13%
equal 48% 54% 56% 49% 48% 57% 52% 44% 54% 53%
more 30% 35% 33% 36% 37% 31% 35% 34% 34% 34%
Cruise tourists
less 37% 24% 29% 23% 25% 28% 25% 35% 25% 26%
equal 41% 45% 47% 42% 49% 42% 44% 37% 45% 45%
more 22% 31% 24% 36% 26% 30% 31% 28% 30% 30%
Group tourists
less 40% 30% 35% 29% 37% 30% 31% 27% 33% 32%
equal 45% 50% 49% 48% 44% 52% 49% 53% 48% 49%
more 14% 20% 16% 22% 19% 18% 20% 20% 19% 19% Total 100% 100% 100% 100% 100% 100% 100% 100% 100% 100%
TABLE 4-22 LESS, EQUAL OR MORE TOURISTS IN BRUGES? (Total n=1.248, inner city area n= 326, outer city area n=922, women n=449, men n=694, <=34 n=119, 34-54 n=361, 55+ n=663,
working in tourism sector in Bruges n=105, not working tourism sector Bruges n=1.138) – (Significant higher results are indicated in
grey background, z-test, p=0,05)
The extent to which residents consider moving out of Bruges can be an indicator for carrying
capacity as well. In general most citizens want to stay in Bruges. 83% does not consider moving
at all. 14% considers it sometimes, and only 3% has concrete plans. Mainly younger residents
consider moving (27%) or have concrete plans (7%). This is quite normal in their life stages. In
the inner city the share of residents with concrete plans to move out of the city is a little higher
(5%) compared to the outer city (2%). However, this is surely linked to the fact that in the inner
city 37% of the residents is renting a living place, while in the outer city only 16% is renting and
eight in ten live in their own property.
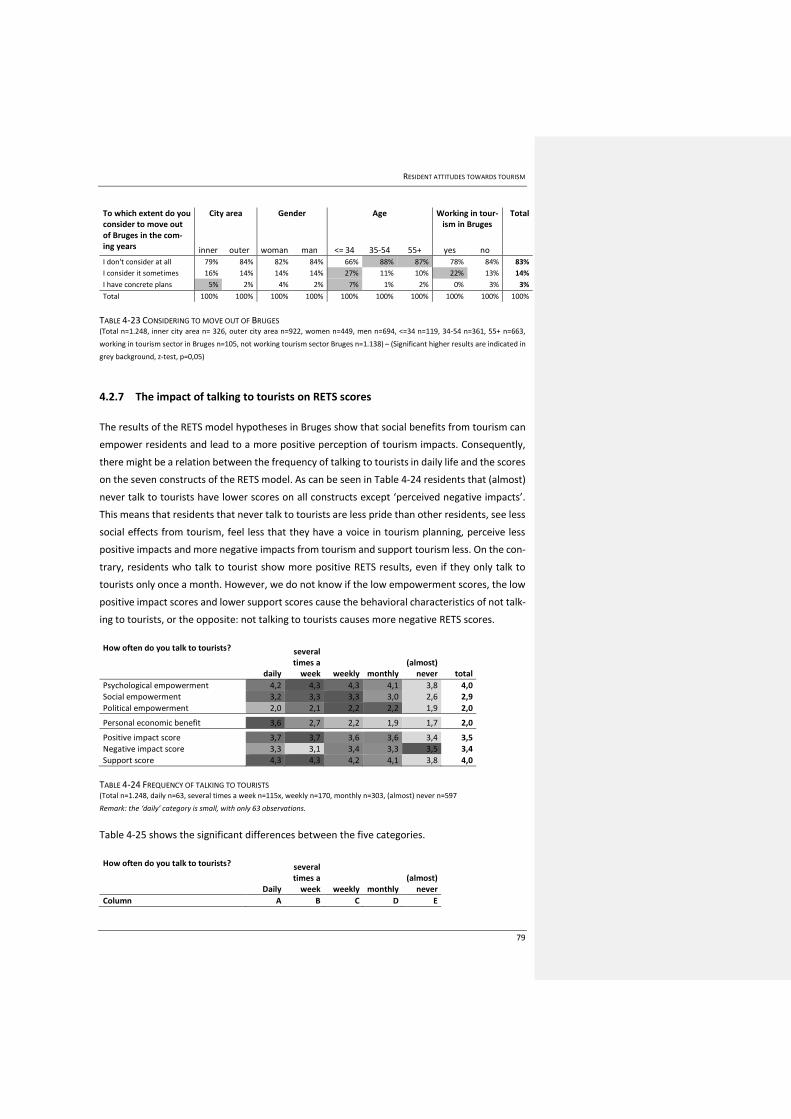
RESIDENT ATTITUDES TOWARDS TOURISM
79
To which extent do you consider to move out of Bruges in the com-ing years
City area Gender Age Working in tour-ism in Bruges
Total
inner outer woman man <= 34 35-54 55+ yes no
I don't consider at all 79% 84% 82% 84% 66% 88% 87% 78% 84% 83%
I consider it sometimes 16% 14% 14% 14% 27% 11% 10% 22% 13% 14%
I have concrete plans 5% 2% 4% 2% 7% 1% 2% 0% 3% 3%
Total 100% 100% 100% 100% 100% 100% 100% 100% 100% 100%
TABLE 4-23 CONSIDERING TO MOVE OUT OF BRUGES (Total n=1.248, inner city area n= 326, outer city area n=922, women n=449, men n=694, <=34 n=119, 34-54 n=361, 55+ n=663,
working in tourism sector in Bruges n=105, not working tourism sector Bruges n=1.138) – (Significant higher results are indicated in
grey background, z-test, p=0,05)
4.2.7 The impact of talking to tourists on RETS scores
The results of the RETS model hypotheses in Bruges show that social benefits from tourism can
empower residents and lead to a more positive perception of tourism impacts. Consequently,
there might be a relation between the frequency of talking to tourists in daily life and the scores
on the seven constructs of the RETS model. As can be seen in Table 4-24 residents that (almost)
never talk to tourists have lower scores on all constructs except ‘perceived negative impacts’.
This means that residents that never talk to tourists are less pride than other residents, see less
social effects from tourism, feel less that they have a voice in tourism planning, perceive less
positive impacts and more negative impacts from tourism and support tourism less. On the con-
trary, residents who talk to tourist show more positive RETS results, even if they only talk to
tourists only once a month. However, we do not know if the low empowerment scores, the low
positive impact scores and lower support scores cause the behavioral characteristics of not talk-
ing to tourists, or the opposite: not talking to tourists causes more negative RETS scores.
How often do you talk to tourists?
daily
several times a
week weekly monthly (almost)
never total
Psychological empowerment 4,2 4,3 4,3 4,1 3,8 4,0
Social empowerment 3,2 3,3 3,3 3,0 2,6 2,9
Political empowerment 2,0 2,1 2,2 2,2 1,9 2,0
Personal economic benefit 3,6 2,7 2,2 1,9 1,7 2,0
Positive impact score 3,7 3,7 3,6 3,6 3,4 3,5
Negative impact score 3,3 3,1 3,4 3,3 3,5 3,4
Support score 4,3 4,3 4,2 4,1 3,8 4,0
TABLE 4-24 FREQUENCY OF TALKING TO TOURISTS (Total n=1.248, daily n=63, several times a week n=115x, weekly n=170, monthly n=303, (almost) never n=597
Remark: the ‘daily’ category is small, with only 63 observations.
Table 4-25 shows the significant differences between the five categories.
How often do you talk to tourists?
Daily
several times a
week weekly monthly (almost)
never
Column A B C D E
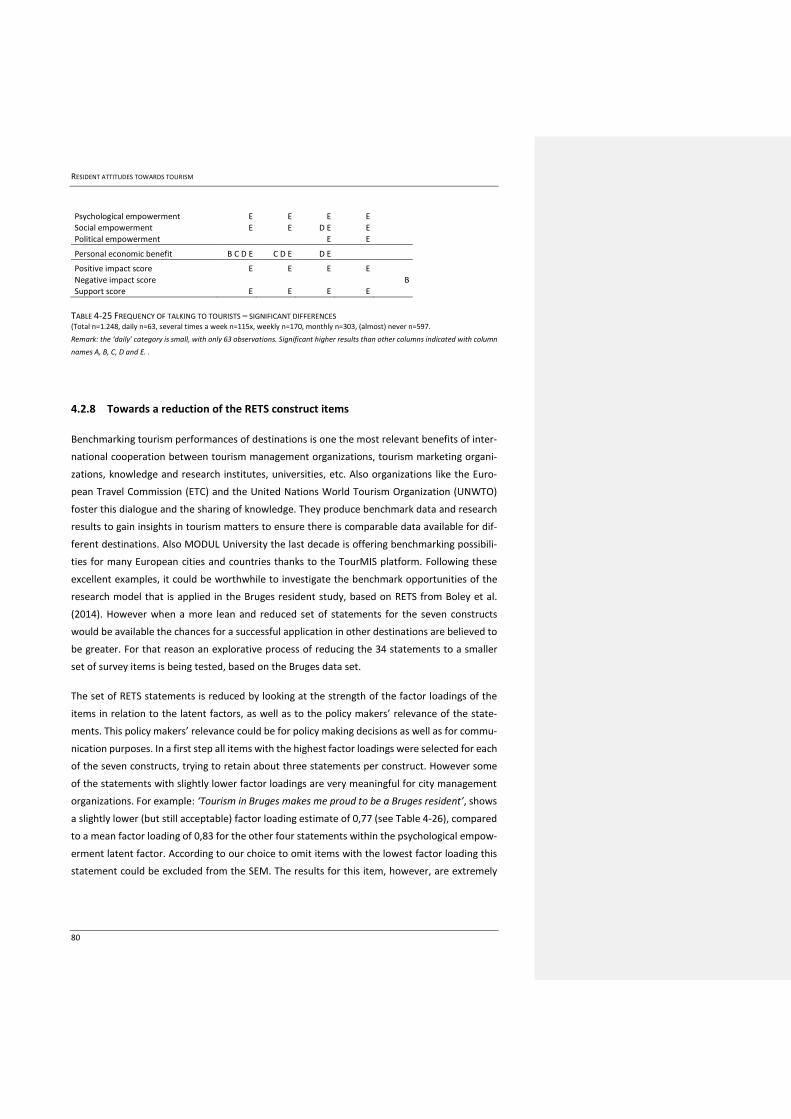
RESIDENT ATTITUDES TOWARDS TOURISM
80
Psychological empowerment E E E E
Social empowerment E E D E E
Political empowerment E E
Personal economic benefit B C D E C D E D E
Positive impact score E E E E
Negative impact score B
Support score E E E E
TABLE 4-25 FREQUENCY OF TALKING TO TOURISTS – SIGNIFICANT DIFFERENCES (Total n=1.248, daily n=63, several times a week n=115x, weekly n=170, monthly n=303, (almost) never n=597.
Remark: the ‘daily’ category is small, with only 63 observations. Significant higher results than other columns indicated with column
names A, B, C, D and E. .
4.2.8 Towards a reduction of the RETS construct items
Benchmarking tourism performances of destinations is one the most relevant benefits of inter-
national cooperation between tourism management organizations, tourism marketing organi-
zations, knowledge and research institutes, universities, etc. Also organizations like the Euro-
pean Travel Commission (ETC) and the United Nations World Tourism Organization (UNWTO)
foster this dialogue and the sharing of knowledge. They produce benchmark data and research
results to gain insights in tourism matters to ensure there is comparable data available for dif-
ferent destinations. Also MODUL University the last decade is offering benchmarking possibili-
ties for many European cities and countries thanks to the TourMIS platform. Following these
excellent examples, it could be worthwhile to investigate the benchmark opportunities of the
research model that is applied in the Bruges resident study, based on RETS from Boley et al.
(2014). However when a more lean and reduced set of statements for the seven constructs
would be available the chances for a successful application in other destinations are believed to
be greater. For that reason an explorative process of reducing the 34 statements to a smaller
set of survey items is being tested, based on the Bruges data set.
The set of RETS statements is reduced by looking at the strength of the factor loadings of the
items in relation to the latent factors, as well as to the policy makers’ relevance of the state-
ments. This policy makers’ relevance could be for policy making decisions as well as for commu-
nication purposes. In a first step all items with the highest factor loadings were selected for each
of the seven constructs, trying to retain about three statements per construct. However some
of the statements with slightly lower factor loadings are very meaningful for city management
organizations. For example: ‘Tourism in Bruges makes me proud to be a Bruges resident’, shows
a slightly lower (but still acceptable) factor loading estimate of 0,77 (see Table 4-26), compared
to a mean factor loading of 0,83 for the other four statements within the psychological empow-
erment latent factor. According to our choice to omit items with the lowest factor loading this
statement could be excluded from the SEM. The results for this item, however, are extremely
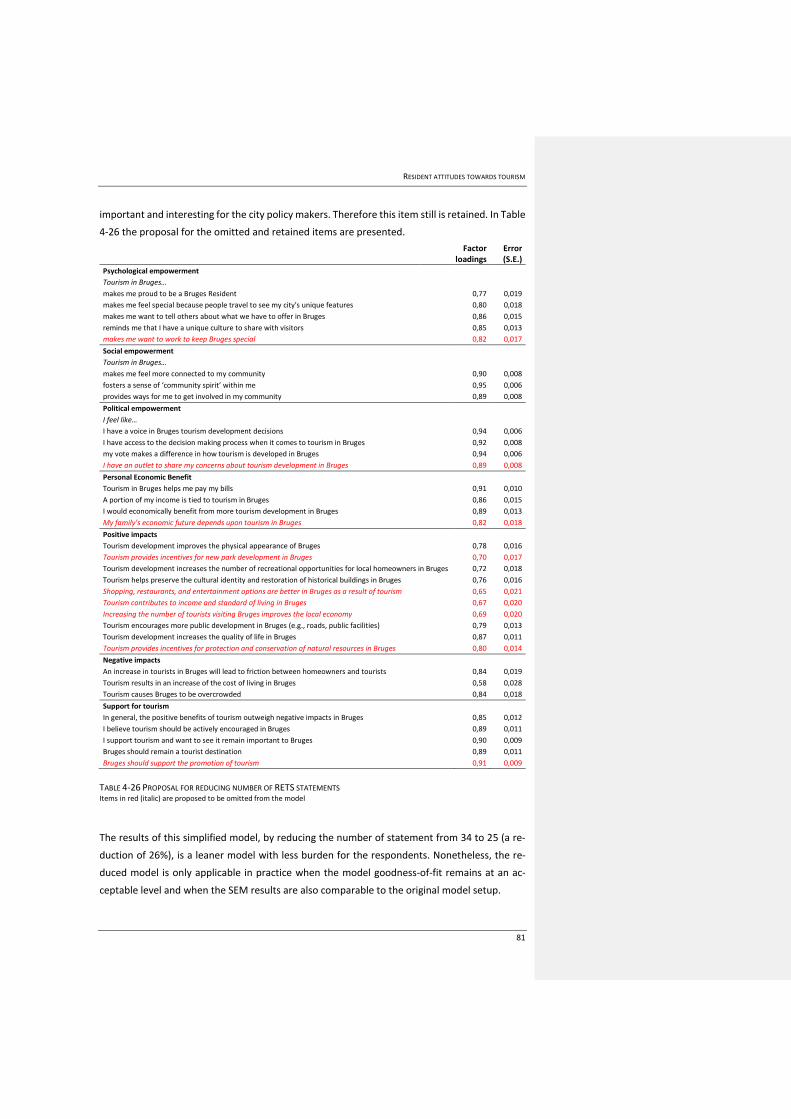
RESIDENT ATTITUDES TOWARDS TOURISM
81
important and interesting for the city policy makers. Therefore this item still is retained. In Table
4-26 the proposal for the omitted and retained items are presented.
Factor loadings
Error (S.E.)
Psychological empowerment
Tourism in Bruges…
makes me proud to be a Bruges Resident 0,77 0,019
makes me feel special because people travel to see my city's unique features 0,80 0,018
makes me want to tell others about what we have to offer in Bruges 0,86 0,015
reminds me that I have a unique culture to share with visitors 0,85 0,013
makes me want to work to keep Bruges special 0,82 0,017
Social empowerment
Tourism in Bruges…
makes me feel more connected to my community 0,90 0,008
fosters a sense of ‘community spirit’ within me 0,95 0,006
provides ways for me to get involved in my community 0,89 0,008
Political empowerment
I feel like…
I have a voice in Bruges tourism development decisions 0,94 0,006
I have access to the decision making process when it comes to tourism in Bruges 0,92 0,008
my vote makes a difference in how tourism is developed in Bruges 0,94 0,006
I have an outlet to share my concerns about tourism development in Bruges 0,89 0,008
Personal Economic Benefit
Tourism in Bruges helps me pay my bills 0,91 0,010
A portion of my income is tied to tourism in Bruges 0,86 0,015
I would economically benefit from more tourism development in Bruges 0,89 0,013
My family’s economic future depends upon tourism in Bruges 0,82 0,018
Positive impacts
Tourism development improves the physical appearance of Bruges 0,78 0,016
Tourism provides incentives for new park development in Bruges 0,70 0,017
Tourism development increases the number of recreational opportunities for local homeowners in Bruges 0,72 0,018
Tourism helps preserve the cultural identity and restoration of historical buildings in Bruges 0,76 0,016
Shopping, restaurants, and entertainment options are better in Bruges as a result of tourism 0,65 0,021
Tourism contributes to income and standard of living in Bruges 0,67 0,020
Increasing the number of tourists visiting Bruges improves the local economy 0,69 0,020
Tourism encourages more public development in Bruges (e.g., roads, public facilities) 0,79 0,013
Tourism development increases the quality of life in Bruges 0,87 0,011
Tourism provides incentives for protection and conservation of natural resources in Bruges 0,80 0,014
Negative impacts
An increase in tourists in Bruges will lead to friction between homeowners and tourists 0,84 0,019
Tourism results in an increase of the cost of living in Bruges 0,58 0,028
Tourism causes Bruges to be overcrowded 0,84 0,018
Support for tourism
In general, the positive benefits of tourism outweigh negative impacts in Bruges 0,85 0,012
I believe tourism should be actively encouraged in Bruges 0,89 0,011
I support tourism and want to see it remain important to Bruges 0,90 0,009
Bruges should remain a tourist destination 0,89 0,011
Bruges should support the promotion of tourism 0,91 0,009
TABLE 4-26 PROPOSAL FOR REDUCING NUMBER OF RETS STATEMENTS Items in red (italic) are proposed to be omitted from the model
The results of this simplified model, by reducing the number of statement from 34 to 25 (a re-
duction of 26%), is a leaner model with less burden for the respondents. Nonetheless, the re-
duced model is only applicable in practice when the model goodness-of-fit remains at an ac-
ceptable level and when the SEM results are also comparable to the original model setup.
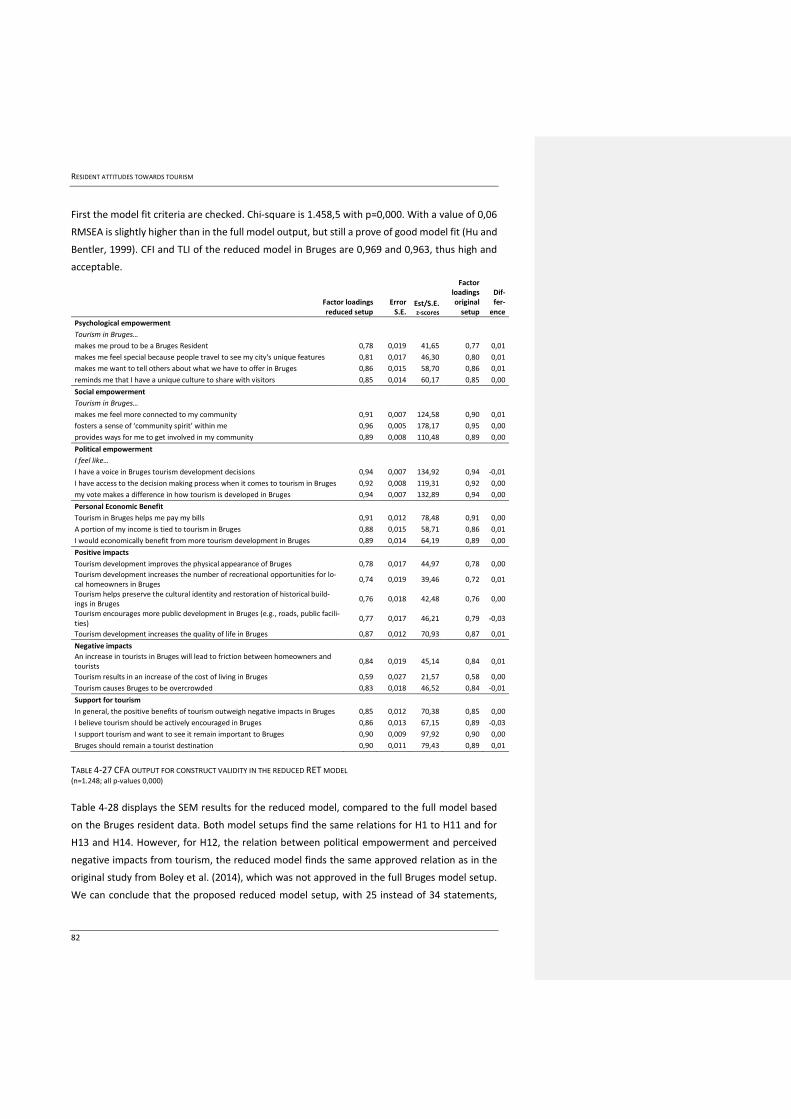
RESIDENT ATTITUDES TOWARDS TOURISM
82
First the model fit criteria are checked. Chi-square is 1.458,5 with p=0,000. With a value of 0,06
RMSEA is slightly higher than in the full model output, but still a prove of good model fit (Hu and
Bentler, 1999). CFI and TLI of the reduced model in Bruges are 0,969 and 0,963, thus high and
acceptable.
Factor loadings reduced setup
Error S.E.
Est/S.E. z-scores
Factor loadings original
setup
Dif-fer-
ence
Psychological empowerment
Tourism in Bruges…
makes me proud to be a Bruges Resident 0,78 0,019 41,65 0,77 0,01
makes me feel special because people travel to see my city's unique features 0,81 0,017 46,30 0,80 0,01
makes me want to tell others about what we have to offer in Bruges 0,86 0,015 58,70 0,86 0,01
reminds me that I have a unique culture to share with visitors 0,85 0,014 60,17 0,85 0,00
Social empowerment
Tourism in Bruges…
makes me feel more connected to my community 0,91 0,007 124,58 0,90 0,01
fosters a sense of ‘community spirit’ within me 0,96 0,005 178,17 0,95 0,00
provides ways for me to get involved in my community 0,89 0,008 110,48 0,89 0,00
Political empowerment
I feel like…
I have a voice in Bruges tourism development decisions 0,94 0,007 134,92 0,94 -0,01
I have access to the decision making process when it comes to tourism in Bruges 0,92 0,008 119,31 0,92 0,00
my vote makes a difference in how tourism is developed in Bruges 0,94 0,007 132,89 0,94 0,00
Personal Economic Benefit
Tourism in Bruges helps me pay my bills 0,91 0,012 78,48 0,91 0,00
A portion of my income is tied to tourism in Bruges 0,88 0,015 58,71 0,86 0,01
I would economically benefit from more tourism development in Bruges 0,89 0,014 64,19 0,89 0,00
Positive impacts
Tourism development improves the physical appearance of Bruges 0,78 0,017 44,97 0,78 0,00
Tourism development increases the number of recreational opportunities for lo-cal homeowners in Bruges
0,74 0,019 39,46 0,72 0,01
Tourism helps preserve the cultural identity and restoration of historical build-ings in Bruges
0,76 0,018 42,48 0,76 0,00
Tourism encourages more public development in Bruges (e.g., roads, public facili-ties)
0,77 0,017 46,21 0,79 -0,03
Tourism development increases the quality of life in Bruges 0,87 0,012 70,93 0,87 0,01
Negative impacts
An increase in tourists in Bruges will lead to friction between homeowners and tourists
0,84 0,019 45,14 0,84 0,01
Tourism results in an increase of the cost of living in Bruges 0,59 0,027 21,57 0,58 0,00
Tourism causes Bruges to be overcrowded 0,83 0,018 46,52 0,84 -0,01
Support for tourism
In general, the positive benefits of tourism outweigh negative impacts in Bruges 0,85 0,012 70,38 0,85 0,00
I believe tourism should be actively encouraged in Bruges 0,86 0,013 67,15 0,89 -0,03
I support tourism and want to see it remain important to Bruges 0,90 0,009 97,92 0,90 0,00
Bruges should remain a tourist destination 0,90 0,011 79,43 0,89 0,01
TABLE 4-27 CFA OUTPUT FOR CONSTRUCT VALIDITY IN THE REDUCED RET MODEL (n=1.248; all p-values 0,000)
Table 4-28 displays the SEM results for the reduced model, compared to the full model based
on the Bruges resident data. Both model setups find the same relations for H1 to H11 and for
H13 and H14. However, for H12, the relation between political empowerment and perceived
negative impacts from tourism, the reduced model finds the same approved relation as in the
original study from Boley et al. (2014), which was not approved in the full Bruges model setup.
We can conclude that the proposed reduced model setup, with 25 instead of 34 statements,
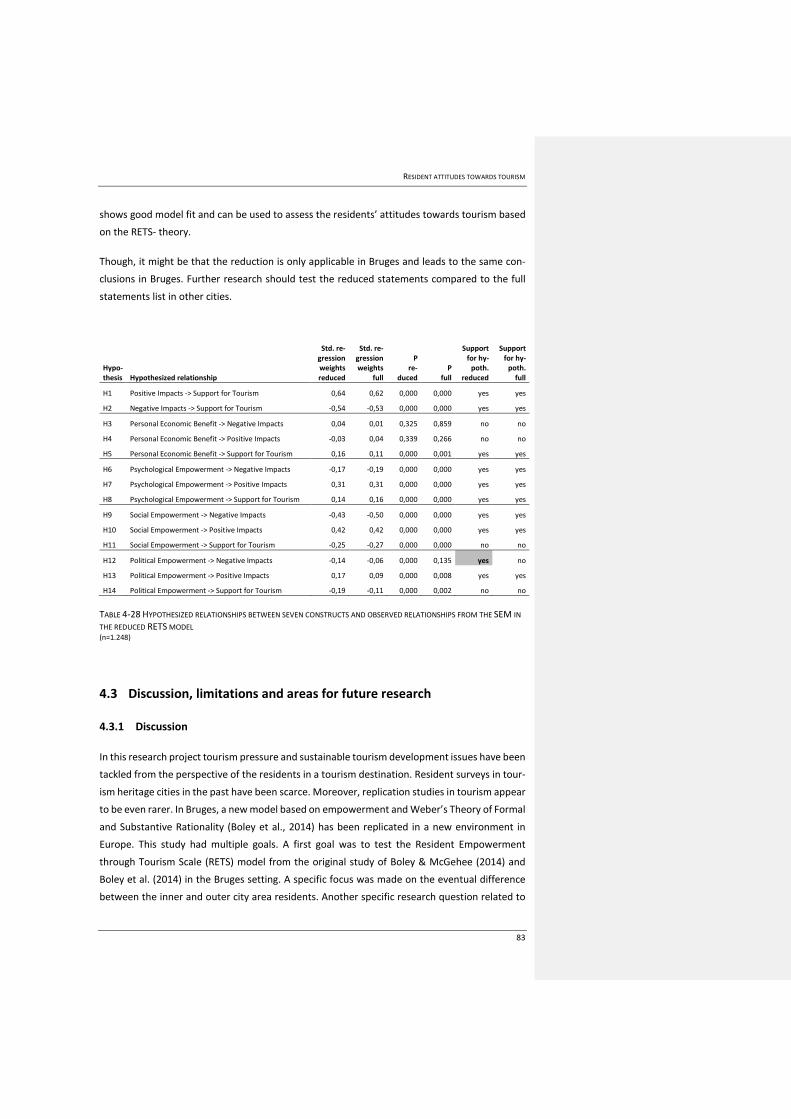
RESIDENT ATTITUDES TOWARDS TOURISM
83
shows good model fit and can be used to assess the residents’ attitudes towards tourism based
on the RETS- theory.
Though, it might be that the reduction is only applicable in Bruges and leads to the same con-
clusions in Bruges. Further research should test the reduced statements compared to the full
statements list in other cities.
Hypo-thesis Hypothesized relationship
Std. re-gression weights reduced
Std. re-gression weights
full
P re-
duced P
full
Support for hy-
poth. reduced
Support for hy-
poth. full
H1 Positive Impacts -> Support for Tourism 0,64 0,62 0,000 0,000 yes yes
H2 Negative Impacts -> Support for Tourism -0,54 -0,53 0,000 0,000 yes yes
H3 Personal Economic Benefit -> Negative Impacts 0,04 0,01 0,325 0,859 no no
H4 Personal Economic Benefit -> Positive Impacts -0,03 0,04 0,339 0,266 no no
H5 Personal Economic Benefit -> Support for Tourism 0,16 0,11 0,000 0,001 yes yes
H6 Psychological Empowerment -> Negative Impacts -0,17 -0,19 0,000 0,000 yes yes
H7 Psychological Empowerment -> Positive Impacts 0,31 0,31 0,000 0,000 yes yes
H8 Psychological Empowerment -> Support for Tourism 0,14 0,16 0,000 0,000 yes yes
H9 Social Empowerment -> Negative Impacts -0,43 -0,50 0,000 0,000 yes yes
H10 Social Empowerment -> Positive Impacts 0,42 0,42 0,000 0,000 yes yes
H11 Social Empowerment -> Support for Tourism -0,25 -0,27 0,000 0,000 no no
H12 Political Empowerment -> Negative Impacts -0,14 -0,06 0,000 0,135 yes no
H13 Political Empowerment -> Positive Impacts 0,17 0,09 0,000 0,008 yes yes
H14 Political Empowerment -> Support for Tourism -0,19 -0,11 0,000 0,002 no no
TABLE 4-28 HYPOTHESIZED RELATIONSHIPS BETWEEN SEVEN CONSTRUCTS AND OBSERVED RELATIONSHIPS FROM THE SEM IN
THE REDUCED RETS MODEL (n=1.248)
4.3 Discussion, limitations and areas for future research
4.3.1 Discussion
In this research project tourism pressure and sustainable tourism development issues have been
tackled from the perspective of the residents in a tourism destination. Resident surveys in tour-
ism heritage cities in the past have been scarce. Moreover, replication studies in tourism appear
to be even rarer. In Bruges, a new model based on empowerment and Weber’s Theory of Formal
and Substantive Rationality (Boley et al., 2014) has been replicated in a new environment in
Europe. This study had multiple goals. A first goal was to test the Resident Empowerment
through Tourism Scale (RETS) model from the original study of Boley & McGehee (2014) and
Boley et al. (2014) in the Bruges setting. A specific focus was made on the eventual difference
between the inner and outer city area residents. Another specific research question related to

RESIDENT ATTITUDES TOWARDS TOURISM
84
RETS was to reduce the construct items in the model without compromising on the quality of
the outcome and model fit. This way the model would become more lean and applicable in other
destinations. And a last goal was to gain practical insights for city and regional tourism destina-
tion managers to better understand the residents’ attitudes towards tourism and to be able to
better anticipate future tourism pressure related issues.
As in the original study from Boley et al. (2014) in the US, our study reveals that the application
of both formal and substantive elements in the residents’ attitudes is legitimated. Economic as
well as non-economic factors influence resident perception of tourism impact and support for
tourism. Policy makers should understand that residents who feel empowered through tourism
tend to perceive tourism impacts more positively and tend to support tourism more than those
who are not. It means that tourism managers can try to find ways to improve these empower-
ment levels among locals. This ‘empowerment’ through tourism can take different forms. In the
RETS model psychological, social and political empowerment are considered. The question for
local tourism managers is which actions are appropriate and realistic to achieve this goal of im-
proving the empowerment levels as well as the support for tourism? A first important insight is
gained from the direct relation between the perception of tourism impact and the support for
tourism. This confirms earlier findings of Social Exchange Theory in previous residents’ surveys
(Long et al., 1990; Perdue et al.; 1987; Perdue et al., 1990). Residents who perceive positive
impacts more tend to support tourism more; residents that perceive negative impacts from
tourism more, tend to support tourism less. Consequently, city managers can try to eliminate as
much as possible the negative impacts of tourism, like crowding, litter and non-respectful tour-
ists. Also highlighting the positive impacts, like the conservation of heritage sites and historic
buildings, the recreational and entertainment possibilities for locals, the public developments,
might improve the level of perceived positive impact from tourism. In the case of Bruges only
crowding and the negative effect of crowding on traffic situations are real irritations for the lo-
cals. Litter, ranked third, was only a problem for less than one in ten citizens. This means that
today there are not so many irritations, but when tourism volumes continue to grow, the per-
ceptions of negative impacts might grow too and thus the support for tourism will decrease.
It is also relevant to try to work on the empowerment level, given the relation of all three em-
powerment constructs with the perceived impacts from tourism and the indirect impact on tour-
ism support. Psychological empowerment is the only empowerment construct directly related
to the support for tourism. Working on citizens’ pride might therefore have an important effect
on residents’ attitudes. Policy makers could organize internal city marketing campaigns to make
more residents proud of their city and to raise the pride among those who are already proud.
Proud residents will be better ambassadors. They will be more helpful and friendly to tourists.
Proud residents also show more interest, want to work to keep the destination special and want
to be involved more. Moreover, sowing more interest is related to the impact of political em-
powerment. However, in Bruges the level of city pride is extremely high already, which is proved
RESIDENT ATTITUDES TOWARDS TOURISM
85
by other research by the Flemish Government in the ‘City monitor’ (Vlaamse Overheid, 2014).
In this study from 2014 Bruges noted the highest share of proud citizens compared to all other
Flemish cities. Consequently, for Bruges it will be difficult to make even more residents proud
or to raise the level of pride among residents. Therefore at least striving for maintaining the
actual high level should be a primary goal.
If tourism policy makers would be more open for discussion with residents and if residents would
have more opportunities to have a voice and share their opinions about tourism, the perception
of positive impact from tourism might improve (political empowerment). Involving residents in
debates, creating opportunities for sharing ideas through online platform or physical meetings
will raise their perceived positive impact from tourism, and thus indirectly raise their support
for tourism. This is even so very important for people from the tourism sector, who showed even
higher needs with regards to involvement in policy making debates. It is recommended to or-
ganize more specific debates and discussion groups with the people involved in the tourism sec-
tor. It might be necessary also to involve the sector stakeholders more directly, rather than their
federation representatives. The relation between political empowerment and perceived nega-
tive impact however was not confirmed in the Bruges data. There are probably two reasons for
this finding. First, the overall level of political empowerment is low which might lead, in combi-
nation to the high perceived negative impact from tourism scores in general, to a weak relation
between the two constructs. And second, those few people that feel politically empowered
might feel they had ‘a voice’ because they have discussed a problem related to tourism. There-
fore, they score high on the political empowerment scale, since they were heard, but also high
on the perceived negative impacts scale, because they were heard with their problems and is-
sues. This is not the expected negative relationship between political empowerment and per-
ceived negative impacts from tourism as suggested by the model. Further research should reveal
if in other crowded destinations the expected relation between political empowerment and per-
ceived negative impact is also not found.
Since residents that perceive the social effects of tourism in their society tend to see more pos-
itive impacts and less negative impacts from tourism, it is relevant to consider the organization
of events where both tourists and residents can meet and have positive experiences together.
For this reason, in heritage cities, focusing marketing initiatives on those types of tourists that
are the least intrusive and the most into deep cultural experiences might be rewarding. VIS-
ITFLANDERS and Visit Bruges both already made the strategic choice to concentrate on these
specific overnight stay tourists: the ‘cultural traveler’, which has multiple advantages related to
residents’ empowerment. First, ‘cultural travelers’ match with the DNA of the cultural city des-
tinations in Flanders and Bruges in specific. This means authentic, true stories can be used to
attract cultural travelers. Also residents could take part in storytelling. Second, previous research
demonstrates that actual ‘cultural travelers’ in Flanders stay longer than other travelers, which
RESIDENT ATTITUDES TOWARDS TOURISM
86
means they have more time available to get into contact with locals in a relaxing manner (VIS-
ITFLANDERS, 2012). Compared to their group travel counterparts they don’t have a tight sched-
ule and they can take time for nice discussions with residents. Third, thanks to their interest in
the details of the culture experiences they might visit more relatively unknown places, they walk
the unbeaten path, which is in favor of the crowding issues in the tourism hot spots of historic
cities and in favor of dispersion in the city. Moreover, these marketing ideas match with the
opinion of the residents. If the Bruges hosts could choose, they are more in support of growth
in the segment of individual tourists and tourists that stay overnight, and less in favor of day
tourists, cruise tourists and group tourists. It is clear that the real cultural traveler will be found
much more in the first group of individual and overnight travelers and much less in the latter
group. If we turn the social empowerment logic around: attracting more day tourists, cruise
travelers or group travelers will not be in favor of social empowerment among residents, and
thus it will not be in favor of the resident support for tourism. A last trend that can have an
impact on social empowerment is the effect of peer-to-peer platforms like AirBnB on the resi-
dents. When locals rent out a room, a house or an apartment via AirBnB to tourists themselves
they will often get into contact with tourists in a positive way. These contacts may lead to higher
social empowerment scores. On the other hand, there are limitations to the number of locals
that can be involved in this kind of activities to avoid compromising the city’s viability and liva-
bility.
To conclude, the overall positive relation between having economic benefits from tourism and
the support for tourism is proven. People with economic benefits from tourism do not perceive
tourism more positively, nor less negatively, but they do support tourism more. This proves that
this very specific and experienced group of tourism stakeholders and professionals has an hon-
est view on the tourism reality in their city. They do not ignore the disadvantages of tourism just
because their income is related to it. But they will support tourism heavily because of the rela-
tion to their income. Political empowerment is also strongly related to economic benefits. And
in Bruges there is a strong need for involvement in tourism planning by the residents that work
in the tourism sector.
With regards to the research question related to comparing the inner city area residents with
the outer city area residents some interesting conclusions can be drawn. Inner city hosts are
even more supportive to today’s tourism activities in Bruges. They prove that living in the middle
of a tourism hot spot with more than 8 million visitors annually in a positive way is possible. This
is not true for all city destinations. On 14 December 2016, shortly after the press conference of
the main findings of the Bruges resident study the Dutch tourism research Institute NRTI pub-
lishes a news article with this introduction: “Since the wave of negative media attention about
tourism crowding in Amsterdam, there is a general sentiment that residents find tourists annoy-
ing. However, that is not a correct assumption. Research in the Flemish art city of Bruges, where
every day more tourists than residents walk around, proves the opposite can be true” (NRIT,
RESIDENT ATTITUDES TOWARDS TOURISM
87
2016). In Bruges more inner city area than outer city area residents support tourism, more want
to work to keep Bruges special and more think they have a unique culture to share with visitors.
We can only advise the tourism policy makers to try to keep this positive attitude by working on
the empowerment levels and the perceived impacts in order to keep the support levels high in
the future.
And finally, the goal to create a lean RETS model setup that can be applied more easily in other
destinations is achieved. A 25 statements model was proposed and has proven to be as strong
as the original 34 statements model. The model fit of the reduced model is fine and relations
between the constructs are as expected. This will encourage other cities and other tourism des-
tinations to apply RETS for assessing resident attitudes towards tourism. The reduced model can
help them to create potential benchmark opportunities for their own destinations and organi-
zations as well as for others.
Thus, this study demonstrates the importance of the measurement and frequent monitoring of
the citizens’ empowerment levels in tourism destinations, given the direct or indirect relation
with support for tourism. As stated by Boley and McGehee about residents in tourism destina-
tions: “their support is essential to making tourists feel welcomed, and they are crucial to provid-
ing a quality experience” (Boley and McGehee, 2014, p. 92, based on Belisle & Hoy, 1980).
4.3.2 Limitations and areas for future research
While this study is a confirmation of the hypotheses that were created in the RETS model as
developed by Boley et al. (2014), some limitations should be recognized. For example, the tem-
porary decrease of visitors in Bruges in 2016 due to the terrorist attacks in the national airport
might have an impact on the residents’ perceptions and attitudes. Also the purely quantitative
approach might narrow down and simplify the reality to just numbers. A recommendation for
future research could be to complement this study with quantitative field work in Bruges. As
also stated by Boley et al.: “the use of qualitative interviews could perhaps capture a deeper
level of how tourism influences resident perceptions of psychological, social, and political em-
powerment” (Boley et al., 2014, p. 48).
In 4.2.7 we could see that there is a relationship between the level of contact or talking to tour-
ists and the scores on the seven constructs of the RETS model. Besides the level of contact with
tourists, another relevant aspect of residents characteristics and background that could be in-
cluded in future research is the residents own travel experience and frequency.
For the case of Bruges in order to tackle more aspects of the carrying capacity also the other
relevant stakeholder groups like the tourists and a broader sample of people from the tourism
sector (including non-Bruges residents) should be included in future research. On the Flemish

RESIDENT ATTITUDES TOWARDS TOURISM
88
level the resident study could be executed in other cities like Antwerp and Ghent. There the
reduced model analytics with less statements should also be tested. Likewise, the relation be-
tween political empowerment and perceived negative impact that was not found as expected
in Bruges should be tested in other crowded cities. It might be that the rural and not crowded
character of the test destinations in Virginia are at the basis of the negative relation between
political empowerment and perceived negative impact in the US study by Boley et al. (2014). In
Flanders also specific regions like Flanders Field and Ypres could be surveyed. Furthermore,
coastal cities like Ostend could be relevant study areas to create comparable benchmark data.
And finally, if other major European tourism city destinations would apply the same model there
would be plenty of interesting benchmarking opportunities on the European level as well. The
digital tourism management information system TourMIS (www.tourmis.info) could be used to
share resident attitudes study results. When the trends of resident attitude survey results could
be linked to the evolutions of visitors it could be possible to detect patterns. Cities that are in
early stages of development can learn from cities that are more developed, or even overdevel-
oped.
-o Influence of a city’s positioning (self-image); the results might be different in a
city which follows multiple purposes (e.g. New York) Commented [NV16]: Karl, could you just explain this a little more?
RESIDENT ATTITUDES TOWARDS TOURISM
89
5 CONCLUSION
Visitor numbers in destinations are growing and more growth is forecasted in the coming dec-
ades. Especially in the heritage city segment the increase of the number of visitors has been very
strong in recent years. As a consequence, the pressure on the city’s infrastructure, the services,
the attractions, the transport system, etc, is also growing strongly. These cities are lively net-
works of residents, commuters, expats, recreational visitors, day tourists, overnight tourists and
in Europe more recently also more and more fugitives. All these groups make use of city services
and consume the public domain. The residents live, study, work, move and recreate in their
cities. As long as there is a balance in all these functions in the city, the carrying capacity of the
city is not exceeded. However, when an overload of tourist overwhelm cities an imbalance might
arise, causing negative attitudes from residents towards tourism in their city.
This study approached the Bruges residents’ attitudes towards tourism both from a Weberian
viewpoint, expanded with Social Exchange Theory and including an empowerment based theory.
The model is called ‘RETS’ and is developed by Boley et al. (2014). This model was tested for the
first time in the US and Prof. Boley suggested further testing of this model in other continents,
other countries and specifically in a heritages setting. Our study meets this recommendation for
further research in another setting.
In general the same, except one, hypotheses are confirmed in the Bruges study, compared to
the original US study. Only the relationship between political empowerment and perceived neg-
ative impact is not confirmed in the Bruges inner city, as in the US study. The most important
relations are the links between perceived impacts from tourism and support for tourism, the
relation between perceived economic benefits from tourism and support for tourism and the
relations between empowerment (psychological, social and political) and perceived impacts
from tourism. Residents that support tourism strengthen the tourism activities in a city, they are
ambassadors, spokespersons of the city, mini marketers,… . And, the more residents feel em-
powered (are proud, feel connected, feel they can participate in policy making and planning),
the less they see negative impacts, the more they see positive impacts, the more they support
tourism, and as a consequence the more they might have a positive effect on tourism develop-
ment. Tourism managers should understand that working on residents’ psychological, social and
political empowerment will have a positive effect on their attitudes towards tourism.
Overall the support scores in Bruges are very high, largely driven by extremely high scores on
psychological empowerment. Bruges residents are very proud citizens, and citizens’ pride is an
direct and indirect antecedent for support for tourism (via perceived impact). In contrast, both
social and political empowerment levels show the most room for improvement in Bruges. Com-
pared to the US study, these levels are low. Furthermore, Bruges residents see both the negative
as well as the positive impacts from tourism.

RESIDENT ATTITUDES TOWARDS TOURISM
90
We also realized the goal to propose a leaner version of the RETS statement list without com-
promising on the model fit and the discovered relations. A reduced set of 25 instead of 34 state-
ments is proposed and confirmed to be solid in proving the same relations.
Furthermore, the resident survey results will be used in the VISITFLANDERS project on tourism
carrying capacity in Flanders and even so the new Visit Bruges strategic plan will be completed
with the resident study results. In 2017 also other Flemish cities will be surveyed, which will
create interesting benchmark opportunities. To conclude, we express our optimistic hope that
other cities in Europe will start using the same model which will create interesting benchmark
opportunities.
RESIDENT ATTITUDES TOWARDS TOURISM
91
6 BIBLIOGRAPHY
Andereck, K. L., Valentine K. M., Knopf, R. C., Vogt C. A. (2005). ‘Residents’ perceptions of com-munity tourism impacts’. Annals of Tourism Research, 32(4), pp. 1056-1076.
Ap, J. (1990). ‘Residents’ perceptions research on the social impacts of tourism’. Annals of Tourism Research, 17(4), pp. 610-616.
Ap, J. (1992). ‘Residents’ perceptions on tourism impacts’. Annals of Tourism Research, 19(4), pp. 665-690.
Arthesis Plantijn Hogeschool, VISITFLANDERS. (2014). ‘Hotelrapport Vlaamse kunststeden 2013’. Brussel: VISITFLANDERS.
Arthesis Plantijn Hogeschool, VISITFLANDERS. (2015). ‘Hotelrapport Vlaamse kunststeden 2014’. Brussel: VISITFLANDERS.
Arthesis Plantijn Hogeschool, VISITFLANDERS. (2016). ‘Hotelrapport Vlaamse kunststeden 2015’. Brussel: VISITFLANDERS.
Ashworth, G. J. (1989). ‘Urban tourism: an imbalance in attention’. In: Cooper C.P. (ed.), Pro-gress in Tourism , Recreation and Hospitality management, pp. 33-54, London: Belhaven.
BBC. (2016). ‘World tourism rises faster than trade for fourth year’. http://www.bbc.com/news/election-us-2016-36420693. Retrieved on: 5 Jun. 2016.
Belisle, F.J., Hoyd, D.R. (1980). ‘The perceived impact of tourism by residents, a case study in Santa Marta, Colombia, Annals of Tourism Research, 7(1), 83-101.
Bentler, P.M, Bonett, D.G. (1980). ‘Significance Tests and Goodness of Fit in the Analysis of Co-variance Structures’. Psychological Bulletin, 88 (3), pp. 588-606.
Beveridge, W. (1957). ‘The art of scientific investigation’, (2nd ed.). New York: Norton.
Biemer, P.,P. (2008). ‘Weighting Survey Data’, in De Leeuw, E., D., Hox, J., J., Dillman D., A. (ed.), International Handbook of Survey Methodology, pp.317-341, New York: Psychology Press.
Blalock, H. (1970). ‘Social research Englewood Cliffs’. NJ: Prentice Hall.
Boley, B., McGehee, N.G. (2014). ‘Measuring empowerment: Developing an validating the Resi-dent Empowerment through Tourism Scale (RETS)’. Tourism Management, 45, pp. 95-94.
Boley, B., McGehee, N.G., Perdue, R., Long, P. (2014). ‘Empowerment’s and resident attitudes toward tourism: Strengthening the theoretical foundation through a Weberian lens’. An-nals of Tourism Research, 49, pp. 33-50.
Boley, B.B., Maruyama, N., Woosnam, K.M. (2015). ‘Measuring empowerment in an eastern context: Findings from Japan’. Tourism Management, 50, pp. 112-122.
Brugge.be. (2016). ‘Feiten en cijfers’. https://www.brugge.be/feiten-en-cijfers. Retrieved on: 30 Jul. 2016.

RESIDENT ATTITUDES TOWARDS TOURISM
92
Brugse Huisvestigingsmaatschappij. (2016). http://www.brugse-mij-huisvesting.be/onzewonin-gen/huidigaanbod/tabid/8376/default.aspx. Retrieved on: 5 Jun. 2016.
Bryon, J. (2002). ‘The Challenge of Measuring Tourist Resident-Impact’. In: WES (ed.), Tourism Studies in Bruges, pp. 42-51, Bruges: WES.
Bryon, J. (2003). ‘Space and impact of mega-events on the residents' attitudes towards tourism in historic cities - case study Bruges’. Tourism Geographies, 5(4), Pages: pp. 496-498.
Bryon, J. (2006). ‘De dialectische relatie tussen stadsbewoners en de toeristisch-stedelijke ruimte’. Dissertation. Leuven: KULeuven University.
Butler, R.W. (1980). ‘The concept of a tourism area cycle of evolution: implications for manage-ment of resources’. Canadian Geographer, 24(1), pp. 5-12.
Butler, R.W. (2011). ‘Tourism Area Life Cycle’. Contemporary Tourism Reviews. Oxford: Good-fellow Publishers Ltd.
Campbell, D. (1969). ‘Reforms in experiments’. American Psychologist, 24, pp. 409-429.
CIM. (2016). http://www.cim.be. Retrieved on: 20 Oct. 2016.
Cole, D. N., Steward, W. P. (2002). ‘Variability of user-based evaluative standards for backcoun-try encounters’. Leisure Sciences, 24, pp. 313–324.
Cole, S. (2006). ‘Information and empowerment: the keys to achieving sustainable tourism’. Journal of Sustainable Tourism, 14(6), pp. 629-644.
Comune Venezia. (2016). ‘Serie storica della popolazione residente e dei numeri indice per zone del Comune di Venezia dal 1871’. http://www.comune.venezia.it/archivio/4055. Re-trieved on: 9 Dec. 2016.
Conde Nast Traveler. (2016). ‘The 2016 friendliest and unfriendliest tourist cities in the world’. http://www.cntraveler.com/galleries/2015-08-14/the-2015-friendliest-and-unfriendliest-cities-in-the-world/12. Retrieved on: 22 Aug. 2016.
Destination Think. (2016): ‘Community and Collaboration: People not product are your most important assets. Can you market a destination and attract visitors without engaging resi-dents?, Part 4 in Four critical trends impacting destination marketing leadership in 2016’. https://destinationthink.com/collaboration-community. Retrieved on: 5 Jun. 2016.
Doxey, G.V., (1975). ‘A causation theory of visitor-resident irritants’. Paper presented at The Travel Research Conference n°6 TTRA, San Diego, pp. 195-198.
DSSResearch. (2016). https://www.dssresearch.com/KnowledgeCenter/toolkitcalculators/sam-pleerrorcalculators.aspx. Retrieved on: 9 Dec. 2016.
Dumbrovská, V., Fialová, D. (2014). ‘Tourist Intensity in Capital Cities in Central Europe: Com-parative Analysis of Tourism in Prague, Vienna and Budapest’. Czech Journal of Tourism, 3(1), pp. 5-26.
Duncan, G.J., Engel, M., Claessens, A., Dowset, C.J. (2014). ‘Replication and Robustness in De-velopmental Research’. Developmental Psychology, 50(11), pp. 2417-2425.
RESIDENT ATTITUDES TOWARDS TOURISM
93
Dwyer, L., Gill, A., Seetaram, N. (2012). ‘Handbook of Research Methods in Tourism: Quantita-tive and Qualitative Approaches’. Masscusetts: Edward Elgar Publishing.
Emerson, R.M. (1976). ‘Social Exchange Theory’. Annual Review of Sociology, 2, pp. 335-362.
ETOA (2016). ‘Il Turismo a Firenze. Il Punto di Vista dei Residenti’. London: ETOA.
European Commission, (2002). ‘Defining, Measuring and Evaluating Carrying capacity in Euro-pean Tourism Destinations’. Athens: European Commission.
Faulkner, B., Tideswell, C. (1997). 'A framework for monitoring community impacts of tourism'. Journal of Sustainable Tourism, 5(1), pp. 3-28.
Federale Overheidsdienst Economie. (2016). ‘Overnachtingen en aankomsten 2015 per ge-meente’. Internal data set.
Hair, J., Black, W. C., Babin, B.J., Anderson, R.E. (2010). ‘Multivariate data analysis: A global perspective: Upper Saddle River’. New Jersey: Pearson.
Haley. A. J., Snaith, T., Miller, G. (2005). ‘The social impacts of Tourism: A case study of Bath, UK’. Annals of Tourism Research, 32, pp. 647-668.
Haralambopoulos, N., Pizam, A. (1996). ‘Perceived impacts of tourism. The case of Samos’. An-nals of Tourism Research, 23, pp. 503-526.
Hensen, M., & Barlow, D. (1976). ‘Single case experimental designs’. New York: Pergamon.
Holthof, C., Lanckriet, C. (2009). ‘Hotelrapport 2008’. Antwerpen: Plantijn Hogeschool.
Holthof, C., Lanckriet, C. (2010). ‘Hotelrapport 2009’. Antwerpen: Plantijn Hogeschool.
Holthof, C., Lanckriet, C. (2011). ‘Hotelrapport 2010’. Antwerpen: Plantijn Hogeschool.
Holthof, C., Lanckriet, C. (2012). ‘Hotelrapport 2011’. Antwerpen: Plantijn Hogeschool.
Holthof, C., Lanckriet, C. (2013). ‘Hotelrapport 2012’. Antwerpen: Plantijn Hogeschool.
Hu, L. T., Bentler, P. M. (1999). ‘Cutoff criteria for fit indexes in covariance structure analysis: Conventional criteria versus new alternatives’. Structural Equation Modeling: A Multidisci-plinary Journal, 6(1), pp. 1-55.
Huck, S., Cormier, W., & Bounds, W. (1974). ‘Reading statistics and research’. New York: Har-per & Row.
IPK International. (2015). ‘ITB Berlin and IPK International: Europeans still go on more city trips’. Press release.
Jacobs, K. (2014). https://www.flickr.com/photos/visitflanders. ‘A day in Bruges - the canals’. Retrieved on: 18 Aug. 2016.
Jansen-Verbeke, M. (1992). ‘Toerisme en de draagacht van de historische binnenstad’. Geogra-fie, juni, pp. 22-26.
RESIDENT ATTITUDES TOWARDS TOURISM
94
Jansen-Verbeke, M. (2002a). ‘Introduction, why Bruges’. In: WES (ed.), Tourism Studies in Bruges, pp. 4-5, Bruges: WES.
Jansen-Verbeke, M. (2002b). ‘Bruges Laboratory for Tourism Studies’. In: WES (ed.), Tourism Studies in Bruges, pp. 6-12, Bruges: WES.
Kay, A. (2006). ‘Social capital, the social economy and community development’. Community Development Journal, 41(2), pp. 160–173.
Kelley H., Thibaut J. (1978). ‘Interpersonal relations: A theory of interdependence’. New York: John Wiley and sons.
Kessen, W. (1960). ‘Research design in the study of developmental problems’. In: Mussen, P. (ed.), Handbook of research methods in child development, pp. 36-70, New York: Wiley.
KULeuven. (2016). http://limo.libis.be/primo_library/libweb. Retrieved on: 10 Aug. 2016.
Lachenmeyer, C. (1971). ‘The language of sociology’. New York: Columbia University Press.
Látková, P., Vogt, C. A. (2012). ‘Residents’ attitudes toward existing and future tourism devel-opment in rural communities’. Journal of Travel Research, 51(1), 50–67.
Lonely Planet. (2016). ‘Bruges, is soaring towers in the evening light’. https://www.lonelyplanet.com/belgium/flanders/bruges. Retrieved on: 12 Aug. 2016.
Long, P.T., Perdue, R.R., Allen, L. (1990). ‘Rural resident tourism perceptions and attitudes by community level of tourism’. Journal of Travel Research, 28(3), pp. 3-9.
Mackey, A., (2012). ‘Why, when, and how to Replicate Research’. In: Graeme K.C.A., Chapelle. S.,H. (ed.), Replication Research in Applied Linguistics, pp.34-69, Cambridge: Cambridge University Press.
Madge, J. (1962). ‘The origins of scientific sociology’. New York: Free Press.
Malhotra, N. K., Agarwal, J., Peterson, M. (1996). ‘Methodological issues in cross cultural mar-keting research: a state-of-the-art review’. International Marketing Review, 13(5), pp. 7-43.
McGehee, N.G. (2007). ‘An agritourism systems model: A Weberian perspective’. Journal of Sustainable Tourism, 15(2), pp. 111-124.
McGuigan, F. (1978). ‘Experimental psychology: A methodological approach’. Englewood Cliffs, NJ: Prentice-Hall.
Muma, J.R. (1993). ‘The need for replication’. Journal of Speech & Hearing Research, 36 (5), p 927-930.
Muthén, L.K., Muthén, B.O. (1998-2015). ‘Mplus User’s Guide. Seventh Edition’. Los Angeles, CA: Muthén & Muthén.
Muthén, L.K., Muthén, B.O. (2009). ‘MPlus short courses: Exploratory Factor Analysis, Confirm-atory Factor Analysis, And Structural Equation Modeling For Continuous Outcomes’. www.statmodel.com. Retrieved on: 1 October 2016.
RESIDENT ATTITUDES TOWARDS TOURISM
95
Neuts, B. (2008). ‘De socio-demografische draagkracht van een toeristisch-stedelijke omgeving vanuit het perspectief van de toeristische belevingswaarde. Case study Brugge’. Disserta-tion. Leuven: KULeuven University.
Neuts, B., Nijkamp, P. (2012). ‘Tourist crowding perception and acceptability in cities. An ap-plied modeling study on Bruges’. Annals of Tourism Research, 39(4), pp. 2133-2153.
NIT. (2016). ‘AirBnB capacities in the city of Bruges’. Kiel: internal study for VISITFLANDERS.
NRIT. (2016). ‘Inwoners Brugge omarmen toerisme’ http://www.nritmedia.nl/kennis-bank/37289/Inwoners_Brugge_omarmen_toerisme/?zoek-hash=c5aa797683be6aab7a4a66f208d7201d. Retrieved on: 23 Dec. 2016.
Nunkoo, R., Ramkissoon, H. (2009). ‘Applying the means-end-chain theory and the laddering technique to the study of host attitudes to tourism’. Journal of Sustainable Tourism, 17(3), pp. 337-355.
Nunkoo, R., Smith, S. L. J., Ramkissoon, H. (2013). ‘Residents’ attitudes to tourism: a longitudi-nal study of 140 articles from 1984 to 2010’. Journal of Sustainable Tourism, 21(1), pp. 5-25.
Patterson, M. E., Hammitt, W. E. (1990). ‘Backcountry encounter norms, actual reported en-counters, and their relationship to wilderness solitude’. Journal of Leisure Research, 22, pp. 259–275.
Pearce. P.L., Moscardo, G. (1996). ‘Tourism community relationships’. Oxford: Pergamon.
Perdue, R.R., Long, P.T., Allen, L. (1987). ‘Rural resident tourism perceptions and attitudes’. An-nals of Tourism Research. 14(3), pp. 420-429.
Perdue, R.R., Long, P.T., Allen, L. (1990). ‘Resident support for tourism development’. Annals of Tourism Research. 17(4), pp. 586-599.
Petrić, L. (2007). ‘Empowerment of communities for sustainable tourism development: case of Croatia’. Turizam: znanstveno-struccni casopis, 55(4), pp. 431-443.
Port of Zeebrugge. (2016). ‘Connect, Jaarmagazine van de Zeehaven van Brugge 2016’. Zee-brugge: Port of Zeebrugge.
Port of Zeebrugge. (2016). ‘Port of Zeebrugge strengthens its position as the biggest car han-dling port in the world ‘.http://www.portofzeebrugge.be/nl/node/1256. Retrieved on: 18 Aug. 2016.
Rappaport, J. (1987). ‘Terms of empowerment/exemplars of prevention: Toward a theory for community psychology’. American Journal of Community Psychology, 15(2), pp. 121-148.
Ridderstaat, J., Croes R., Nijkamp, P. (2014). ‘The Tourism Development – Quality of life nexus in a small island destination’. Journal of Travel Research, 55, pp. 79-94.
Roth, G., Wittich, C. (1978). ‘Max Weber: Economy and society’. Berkley: University of Califor-nia Press.
RESIDENT ATTITUDES TOWARDS TOURISM
96
Rough Guide. (2016). ‘Bruges’. http://www.roughguides.com/destinations/europe/bel-gium/bruges. Retrieved on: 12 Aug. 2016.
Russo, A.P. (2002a). ‘A stakeholders approach to tourism policies in Bruges’. In: Wes. (ed.), Tourism Studies in Bruges, pp. 32-41, Bruges: WES.
Russo, A.P. (2002b). ‘The “Vicious Circle” of tourism development in heritage cities’. Annals of Tourism Research, 29(1), pp. 165-182.
Saarinen, J. (2006). ‘Traditions of sustainability in tourism studies’. Annals of Tourism Research, 33(4), pp. 1121-1140.
Sadan, E. (1997). ‘Empowerment and community planning’. http://www.mpow.org. Retrieved on: 10 Dec. 2016.
Schmidt, S. (2009). ‘Shall We Really Do It Again? The Powerful Concept of Replication Is Ne-glected in the Social Sciences’. Review of General Psychology, 13(2), pp. 90-100.
Shelby, B., Vaske, J. J., & Heberlein, T. A. (1989). ‘Comparative analysis of crowding in multiple locations: Results from fifteen years of research’. Leisure Sciences, 11, pp. 269–291.
Smith, H. (1975). ‘Strategies of social research’. Englewood Cliffs, NJ: Prentice-Hall.
Spector, J., Johnson, T.E., Young, P.A. (2015). ‘An editorial on replication studies and scaling up efforts. Education’. Educational Technology Research and Development, 63(1), pp. 1-4.
SPSS. (2016). ‘Factor Weighting’. http://www.ibm.com/support/knowledge-center/SSLVQG_6.0.1/com.spss.ddl/weight_factor.htm. Retrieved on: 10 Dec. 2016.
Stad Amsterdam. (2016). ‘Stand van de Balans’. Amsterdam: Gemeente Amsterdam.
Statbel. (2016). Structuur van de bevolking volgens woonplaats: grootste gemeenten. http://statbel.fgov.be/nl/statistieken/cijfers/bevolking/structuur/woonplaats/groot. Re-trieved on: 18 Aug. 2016.
Steunpunt Recreatie en Toerisme. (2009). ‘Te Gast in Vlaanderen 2008’. Leuven: KULeuven.
Steward, W. P., Cole, D. N. (2001). ‘Number of encounters and experience quality in Grand Canyon backcountry: Consistently negative and weak relationships’. Journal of Leisure Re-search, 33(1), pp. 106–120.
Strzelecka, M., Boley, B., Strzelecka, C. (2016). Empowerment and resident support for tourism in rural Central and Eastern Europe (CEE): The case of Pomerania, Poland. Journal of Sus-tainable Tourism. http://dx.doi.org/10.1080/09669582.2016.1224891. Retrieved 17 Dec. 2016.
Studiedienst van de Vlaamse Regering. (2010). ‘Aanmaak en gebruik van gewichten voor sur-vey data’. Brussel: SVR.
Suntikul, W., Pratt, S., Kuan, W. I., Wong, C. I., Chan, C. C., Choi, W. L., Chong, O. F. (2016). ‘Im-pacts of tourism on the quality of life of local residents in Hue, Vietnam’. International Journal of Tourism and Hospitality Research, 05 February 2016, pp.1-16.

RESIDENT ATTITUDES TOWARDS TOURISM
97
Thibaut, J.W., Kelley, H.H. (1959). ‘The social psychology of groups’. New York: Wiley.
TourMIS. (2016). www.tourmis.info. Retrieved on: 12 Aug 2016.
United Nations. (2016). ‘Sustainable development goals’. http://www.un.org/sustainabledevel-opment/sustainable-development-goals. Retrieved on 10 Oct. 2016.
UNWTO. (2004). ‘Indicators of sustainable development for tourism destinations’. Madrid: UN-WTO.
UNWTO. (2016). ‘World Tourism Barometer, volume 14’. Madrid: UNWTO.
Van der Borg, J. (2004). ‘Tourism Management and Carrying Capacity in Heritage Cities and Sites’. In: Coccossis, H., Mexa, A. (ed.), The Challenge of Tourism Carrying Capacity Assess-ment, pp. 163-179, Cornwall: Ashgate Publishing.
Van Houtte, J.A. (1982). ‘De geschiedenis van Brugge’. Tielt: Lannoo.
Vanhove, N. (2002). ‘Tourism Policies in Bruges’. In: Wes (ed.), Tourism Studies in Bruges, pp. 22-31, Bruges: WES.
Visit Bruges, Westtoer & Proximus. (2016a). ‘Bezoekers Barometer Brugge 2015’. Visit Bruges. Internal document.
Visit Bruges, Westtoer & Proximus. (2016b). ‘Bezoekers Barometer Brugge 2016’. Visit Bruges. Internal document.
Visit Bruges. (2016). ‘UNESCO world heritage’. https://bezoekers.brugge.be/unesco-world-her-itage. Retrieved on: 12 Aug 2016.
VISITFLANDERS. (2012). ‘De Vlaanderen vakantieganger anno 2011’. http://toerismevlaande-ren.be/sites/toerismevlaanderen.be/files/assets/documents_KENNIS/onder-zoeken/2011_Vlaanderen_Vakantieganger.pdf. Retrieved on: 12 Aug 2016.
VISITFLANDERS. (2015a). ‘Te Gast in Vlaanderen 2015’. Brussel: VISITFLANDERS.
VISITFLANDERS. (2015b). ‘Tourism in Key figures 2014’. Brussel: VISITFLANDERS.
VISITFLANDERS. (2016a). ‘Tourism in key Figures XL’. http://www.toerismevlaanderen.be/tour-ism-figures-2015-xl. Retrieved on: 12 Aug 2016.
VISITFLANDERS. (2016b). ‘Hotelbarometer’. Brussel: VISITFLANDERS.
Vlaamse Overheid. (2014). ‘Stadsmonitor. Fierheid over de eigen stad’. http://www.stadsmoni-tor.be/fierheid-over-de-eigen-stad. Retrieved on: 18 Dec. 2016.
Ward, C., Berno, T. (2011). ‘Beyond social exchange theory, attitudes toward tourists’. Annals of Tourism Research, 38(4), pp. 1556–1569.
WCED. (1987). ‘Our Common Future’. Oxford: Oxford University Press.
WES Strategy & Research. (2015). ‘Winkel- en Horecaplan Brugge’. Brugge: WES.
WES. (2012). ‘Opmaak van een strategisch plan voor het toerisme in Brugge 2012-2016’.

RESIDENT ATTITUDES TOWARDS TOURISM
98
Wöber, K., Zins, A. (1995). ‘Key success factors for tourism resort management’. Journal of Travel and Tourism Marketing, 4(4), pp. 73-84.
World Trade Organization. (2016). ‘Trade growth to remain subdued in 2016 as uncertainties weigh on global demand’. https://www.wto.org/english/news_e/pres16_e/pr768_e.htm. Retrieved on: 5 Aug. 2016.
Worldatlas. (2016). Map of Bruges. http://www.worldatlas.com/eu/be/01/where-is-brugge.html. Retrieved on: 18 Aug. 2016.
Yang, J., Ryan, C., Zhang, L. (2013). ’Social conflict in communities impacted by tourism’. Tour-ism Management, 35, pp. 82-93.
Young, E. (2012). ‘Bad Copy. In the wake of high-profile controversies, psychologists are facing up to problems with replication’. Nature, 485, pp. 298-300.
Zimmermann, F. (1997). ‘Future Perspectives of Tourism: Traditional versus New Destinations’. In: Oppermann, M. (ed.), Pacific Rim Tourism, pp. 231-239, Wallingford: CAB Interna-tional.

RESIDENT ATTITUDES TOWARDS TOURISM
99
APPENDICES

RESIDENT ATTITUDES TOWARDS TOURISM
100
Appendix 1: Questionnaire in English
THE CITY OF BRUGES
Clarification of some city area concepts + city map
LIVING – WORKING – DEPENDANCE OF TOURISM
Q 1: WAT IS YOUR AGE? Numeric Open
… year Screenout -18
Q 2: WHERE IN BRUGES DO YOU LIVE Show map Closed single Randomize: yes
Brugse binnenstad - Steenstraatkwartier Brugse binnenstad - Ezelstraatkwartier Brugse binnenstad - Langestraatkwartier Brugse binnenstad - Magdalenakwartier Brugse binnenstad - Onze-Lieve-Vrouwekwartier Brugse binnenstad - Sint-Annakwartier (Seminariekwartier) Brugse binnenstad - Gezellekwartier Brugse binnenstad - Sint-Gilliskwartier Brugse binnenstad - Burgkwartier (Sint-Walburgakwartier) Brugse binnenstad- West-Bruggekwartier Brugse binnenstad - Boeveriewijk Brugge Kristus-Koning Brugge Sint-Jozef Brugge Sint-Pieters Koolkerke Sint-Andries Sint-Michiels Assebroek Sint-Kruis Dudzele Lissewege (Zeebrugge of Zwankendamme) I don’t live in Bruges screenout
Q 3: FOR HOW LONG DO YOU LIVE IN BRUGES? Numeric Open
… year
Q 4: WHICH SITUATION IS THE MOST APPLICABLE TO YOUR ACTUAL SITUATION? Closed single Randomize: no
I live in my own house/apartment, that I bought I live in a rented house/apartment Other: ….
Q 5: TO WHICH EXTENT DO YOU CONSIDER TO MOVE OUTSIDE BRUGES IN THE COMING YEARS? Closed 1 answer possible Randomize: no
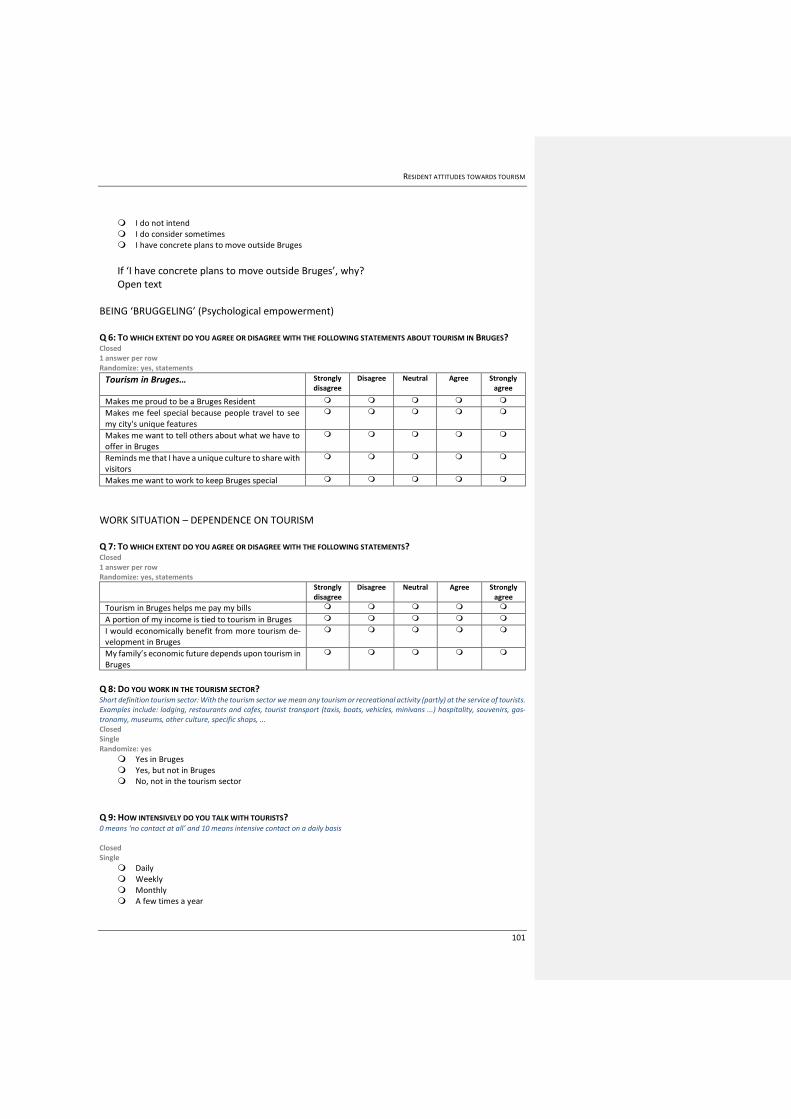
RESIDENT ATTITUDES TOWARDS TOURISM
101
I do not intend I do consider sometimes I have concrete plans to move outside Bruges
If ‘I have concrete plans to move outside Bruges’, why? Open text
BEING ‘BRUGGELING’ (Psychological empowerment) Q 6: TO WHICH EXTENT DO YOU AGREE OR DISAGREE WITH THE FOLLOWING STATEMENTS ABOUT TOURISM IN BRUGES? Closed 1 answer per row Randomize: yes, statements
Tourism in Bruges…
Strongly disagree
Disagree Neutral Agree Strongly agree
Makes me proud to be a Bruges Resident Makes me feel special because people travel to see my city's unique features
Makes me want to tell others about what we have to offer in Bruges
Reminds me that I have a unique culture to share with visitors
Makes me want to work to keep Bruges special
WORK SITUATION – DEPENDENCE ON TOURISM Q 7: TO WHICH EXTENT DO YOU AGREE OR DISAGREE WITH THE FOLLOWING STATEMENTS? Closed 1 answer per row Randomize: yes, statements
Strongly disagree
Disagree Neutral Agree Strongly agree
Tourism in Bruges helps me pay my bills
A portion of my income is tied to tourism in Bruges I would economically benefit from more tourism de-velopment in Bruges
My family’s economic future depends upon tourism in Bruges
Q 8: DO YOU WORK IN THE TOURISM SECTOR? Short definition tourism sector: With the tourism sector we mean any tourism or recreational activity (partly) at the service of tourists. Examples include: lodging, restaurants and cafes, tourist transport (taxis, boats, vehicles, minivans ...) hospitality, souvenirs, gas-tronomy, museums, other culture, specific shops, ... Closed Single Randomize: yes
Yes in Bruges Yes, but not in Bruges No, not in the tourism sector
Q 9: HOW INTENSIVELY DO YOU TALK WITH TOURISTS? 0 means ‘no contact at all’ and 10 means intensive contact on a daily basis Closed Single
Daily Weekly Monthly A few times a year
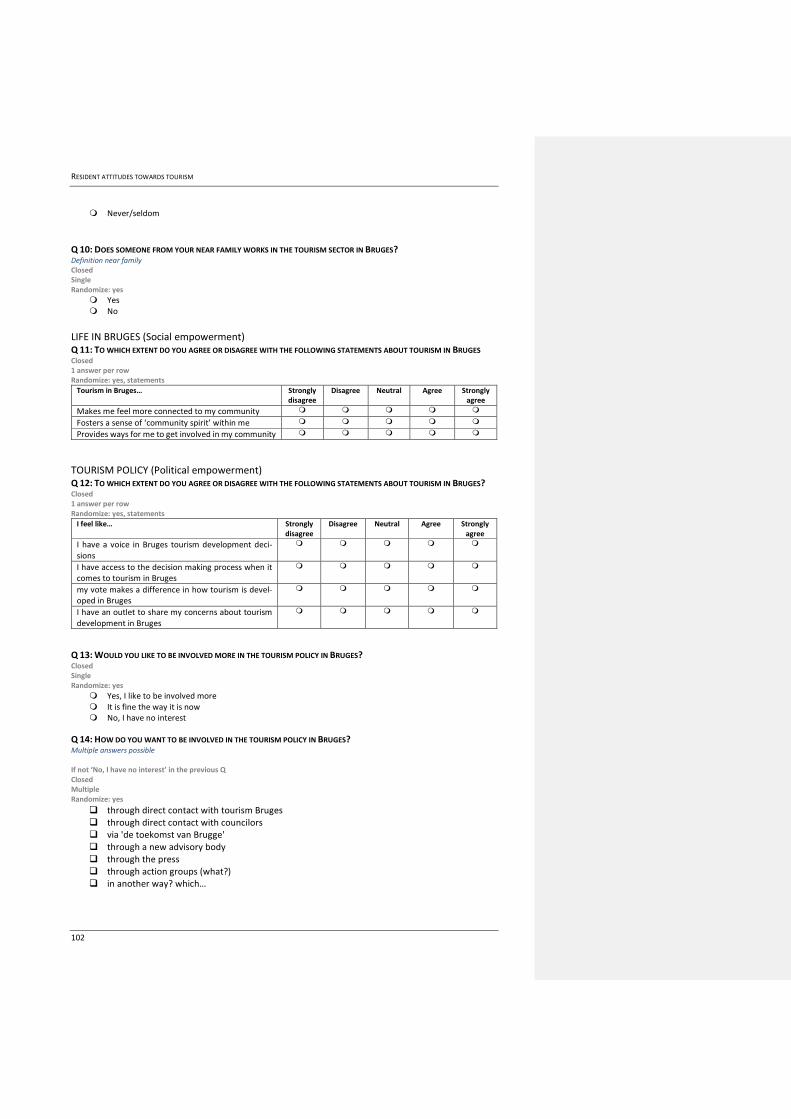
RESIDENT ATTITUDES TOWARDS TOURISM
102
Never/seldom
Q 10: DOES SOMEONE FROM YOUR NEAR FAMILY WORKS IN THE TOURISM SECTOR IN BRUGES? Definition near family Closed Single Randomize: yes
Yes No
LIFE IN BRUGES (Social empowerment) Q 11: TO WHICH EXTENT DO YOU AGREE OR DISAGREE WITH THE FOLLOWING STATEMENTS ABOUT TOURISM IN BRUGES Closed 1 answer per row Randomize: yes, statements
Tourism in Bruges… Strongly disagree
Disagree Neutral Agree Strongly agree
Makes me feel more connected to my community Fosters a sense of ‘community spirit’ within me Provides ways for me to get involved in my community
TOURISM POLICY (Political empowerment) Q 12: TO WHICH EXTENT DO YOU AGREE OR DISAGREE WITH THE FOLLOWING STATEMENTS ABOUT TOURISM IN BRUGES? Closed 1 answer per row Randomize: yes, statements
I feel like… Strongly disagree
Disagree Neutral Agree Strongly agree
I have a voice in Bruges tourism development deci-sions
I have access to the decision making process when it comes to tourism in Bruges
my vote makes a difference in how tourism is devel-oped in Bruges
I have an outlet to share my concerns about tourism development in Bruges
Q 13: WOULD YOU LIKE TO BE INVOLVED MORE IN THE TOURISM POLICY IN BRUGES? Closed Single Randomize: yes
Yes, I like to be involved more It is fine the way it is now No, I have no interest
Q 14: HOW DO YOU WANT TO BE INVOLVED IN THE TOURISM POLICY IN BRUGES? Multiple answers possible If not ‘No, I have no interest’ in the previous Q Closed Multiple Randomize: yes
through direct contact with tourism Bruges through direct contact with councilors via 'de toekomst van Brugge' through a new advisory body through the press through action groups (what?) in another way? which…
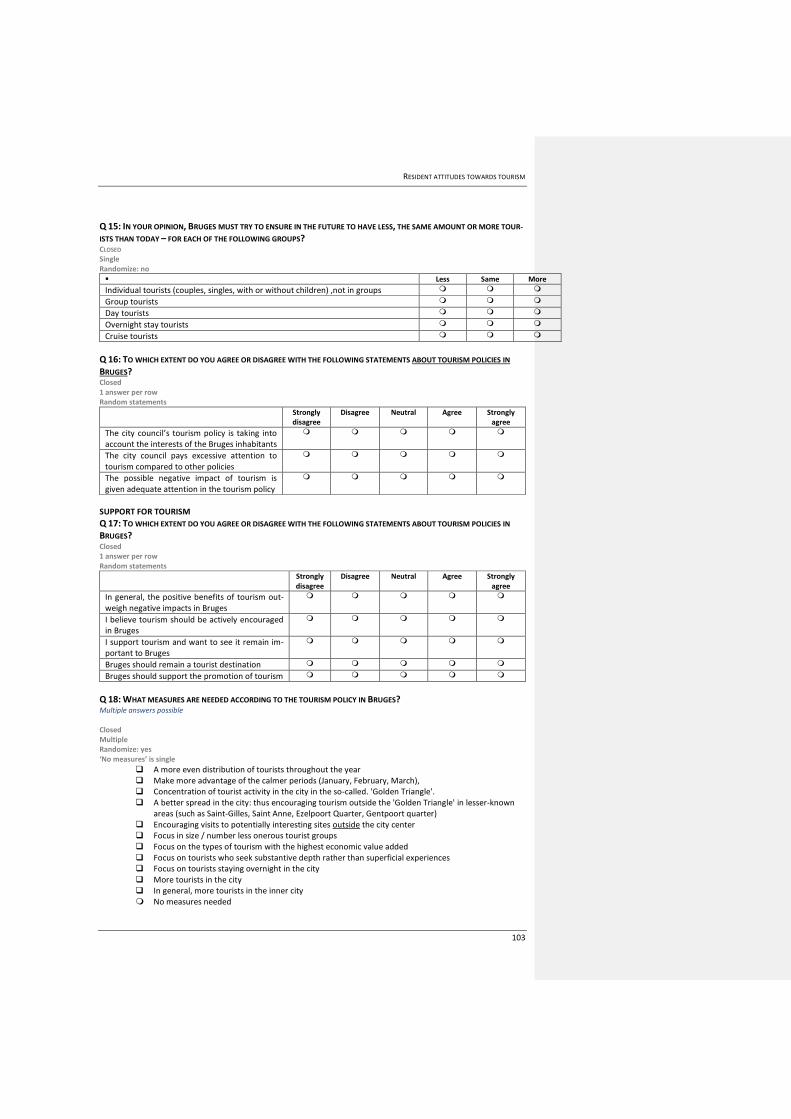
RESIDENT ATTITUDES TOWARDS TOURISM
103
Q 15: IN YOUR OPINION, BRUGES MUST TRY TO ENSURE IN THE FUTURE TO HAVE LESS, THE SAME AMOUNT OR MORE TOUR-
ISTS THAN TODAY – FOR EACH OF THE FOLLOWING GROUPS? CLOSED Single Randomize: no
Less Same More
Individual tourists (couples, singles, with or without children) ,not in groups Group tourists Day tourists Overnight stay tourists Cruise tourists
Q 16: TO WHICH EXTENT DO YOU AGREE OR DISAGREE WITH THE FOLLOWING STATEMENTS ABOUT TOURISM POLICIES IN
BRUGES? Closed 1 answer per row Random statements
Strongly disagree
Disagree Neutral Agree Strongly agree
The city council’s tourism policy is taking into account the interests of the Bruges inhabitants
The city council pays excessive attention to tourism compared to other policies
The possible negative impact of tourism is given adequate attention in the tourism policy
SUPPORT FOR TOURISM
Q 17: TO WHICH EXTENT DO YOU AGREE OR DISAGREE WITH THE FOLLOWING STATEMENTS ABOUT TOURISM POLICIES IN
BRUGES? Closed 1 answer per row Random statements
Strongly disagree
Disagree Neutral Agree Strongly agree
In general, the positive benefits of tourism out-weigh negative impacts in Bruges
I believe tourism should be actively encouraged in Bruges
I support tourism and want to see it remain im-portant to Bruges
Bruges should remain a tourist destination
Bruges should support the promotion of tourism
Q 18: WHAT MEASURES ARE NEEDED ACCORDING TO THE TOURISM POLICY IN BRUGES? Multiple answers possible Closed Multiple Randomize: yes ‘No measures’ is single
A more even distribution of tourists throughout the year Make more advantage of the calmer periods (January, February, March), Concentration of tourist activity in the city in the so-called. 'Golden Triangle'. A better spread in the city: thus encouraging tourism outside the 'Golden Triangle' in lesser-known
areas (such as Saint-Gilles, Saint Anne, Ezelpoort Quarter, Gentpoort quarter) Encouraging visits to potentially interesting sites outside the city center Focus in size / number less onerous tourist groups Focus on the types of tourism with the highest economic value added Focus on tourists who seek substantive depth rather than superficial experiences Focus on tourists staying overnight in the city More tourists in the city In general, more tourists in the inner city No measures needed
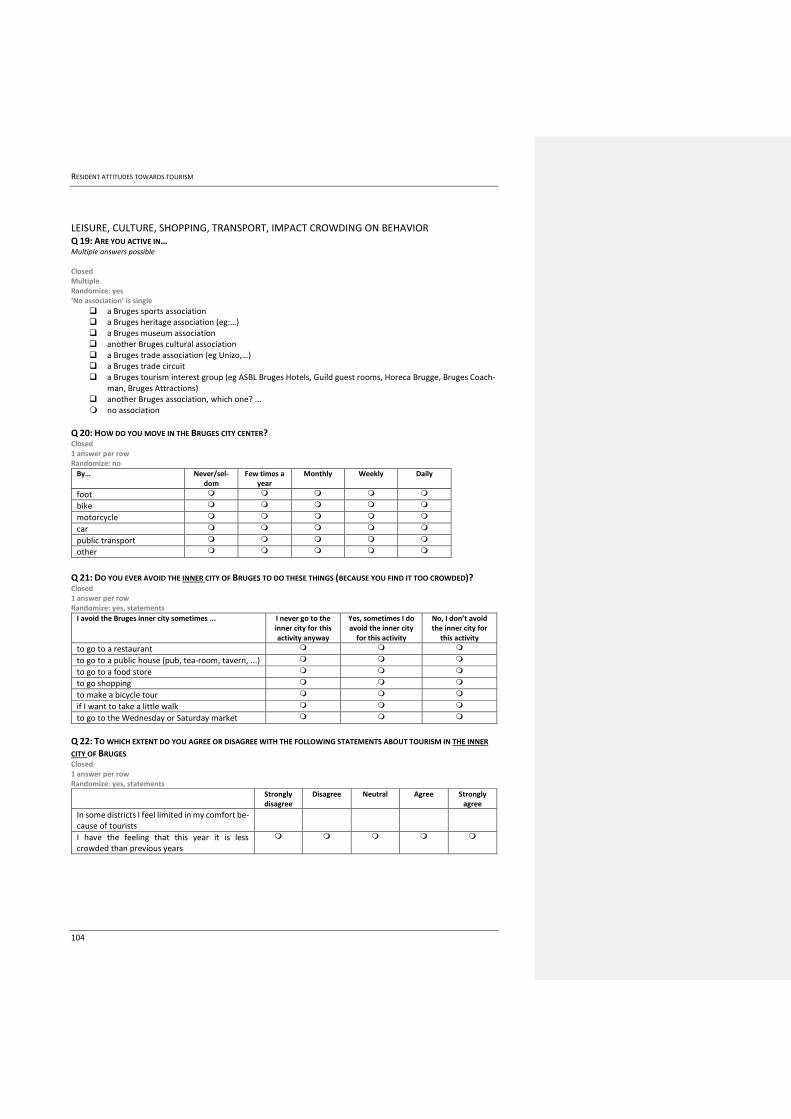
RESIDENT ATTITUDES TOWARDS TOURISM
104
LEISURE, CULTURE, SHOPPING, TRANSPORT, IMPACT CROWDING ON BEHAVIOR Q 19: ARE YOU ACTIVE IN… Multiple answers possible Closed Multiple Randomize: yes ‘No association’ is single
a Bruges sports association a Bruges heritage association (eg:…) a Bruges museum association another Bruges cultural association a Bruges trade association (eg Unizo,…) a Bruges trade circuit a Bruges tourism interest group (eg ASBL Bruges Hotels, Guild guest rooms, Horeca Brugge, Bruges Coach-
man, Bruges Attractions) another Bruges association, which one? ... no association
Q 20: HOW DO YOU MOVE IN THE BRUGES CITY CENTER? Closed 1 answer per row Randomize: no
By… Never/sel-dom
Few times a year
Monthly Weekly Daily
foot
bike
motorcycle
car
public transport
other
Q 21: DO YOU EVER AVOID THE INNER CITY OF BRUGES TO DO THESE THINGS (BECAUSE YOU FIND IT TOO CROWDED)? Closed 1 answer per row Randomize: yes, statements
I avoid the Bruges inner city sometimes ... I never go to the inner city for this activity anyway
Yes, sometimes I do avoid the inner city
for this activity
No, I don’t avoid the inner city for
this activity
to go to a restaurant to go to a public house (pub, tea-room, tavern, ...) to go to a food store to go shopping to make a bicycle tour if I want to take a little walk to go to the Wednesday or Saturday market
Q 22: TO WHICH EXTENT DO YOU AGREE OR DISAGREE WITH THE FOLLOWING STATEMENTS ABOUT TOURISM IN THE INNER
CITY OF BRUGES Closed 1 answer per row Randomize: yes, statements
Strongly disagree
Disagree Neutral Agree Strongly agree
In some districts I feel limited in my comfort be-cause of tourists
I have the feeling that this year it is less crowded than previous years
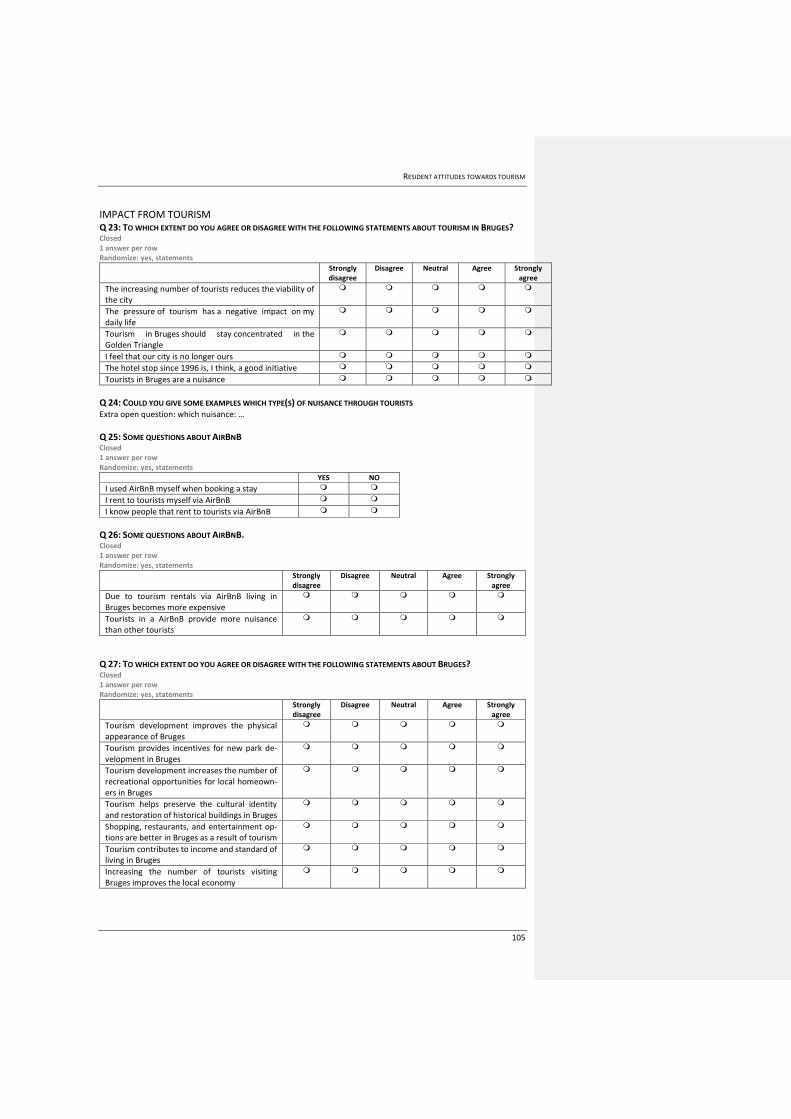
RESIDENT ATTITUDES TOWARDS TOURISM
105
IMPACT FROM TOURISM Q 23: TO WHICH EXTENT DO YOU AGREE OR DISAGREE WITH THE FOLLOWING STATEMENTS ABOUT TOURISM IN BRUGES? Closed 1 answer per row Randomize: yes, statements
Strongly disagree
Disagree Neutral Agree Strongly agree
The increasing number of tourists reduces the viability of the city
The pressure of tourism has a negative impact on my daily life
Tourism in Bruges should stay concentrated in the Golden Triangle
I feel that our city is no longer ours
The hotel stop since 1996 is, I think, a good initiative Tourists in Bruges are a nuisance
Q 24: COULD YOU GIVE SOME EXAMPLES WHICH TYPE(S) OF NUISANCE THROUGH TOURISTS Extra open question: which nuisance: …
Q 25: SOME QUESTIONS ABOUT AIRBNB Closed 1 answer per row Randomize: yes, statements
YES NO
I used AirBnB myself when booking a stay
I rent to tourists myself via AirBnB I know people that rent to tourists via AirBnB
Q 26: SOME QUESTIONS ABOUT AIRBNB. Closed 1 answer per row Randomize: yes, statements
Strongly disagree
Disagree Neutral Agree Strongly agree
Due to tourism rentals via AirBnB living in Bruges becomes more expensive
Tourists in a AirBnB provide more nuisance than other tourists
Q 27: TO WHICH EXTENT DO YOU AGREE OR DISAGREE WITH THE FOLLOWING STATEMENTS ABOUT BRUGES? Closed 1 answer per row Randomize: yes, statements
Strongly disagree
Disagree Neutral Agree Strongly agree
Tourism development improves the physical appearance of Bruges
Tourism provides incentives for new park de-velopment in Bruges
Tourism development increases the number of recreational opportunities for local homeown-ers in Bruges
Tourism helps preserve the cultural identity and restoration of historical buildings in Bruges
Shopping, restaurants, and entertainment op-tions are better in Bruges as a result of tourism
Tourism contributes to income and standard of living in Bruges
Increasing the number of tourists visiting Bruges improves the local economy

RESIDENT ATTITUDES TOWARDS TOURISM
106
Tourism encourages more public development in Bruges (e.g., roads, public facilities)
Tourism development increases the quality of life in Bruges
Tourism provides incentives for protection and conservation of natural resources in Bruges
Q 28: TO WHICH EXTENT DO YOU AGREE OR DISAGREE WITH THE FOLLOWING STATEMENTS ABOUT TOURISM IN BRUGES? Closed 1 answer per row Randomize: yes, statements
Strongly disagree
Disagree Neutral Agree Strongly agree
An increase in tourists in Bruges will lead to fric-tion between homeowners and tourists
Tourism causes Bruges to be overcrowded Tourism results in an increase of the cost of liv-ing in Bruges
The growth in tourism will result in a decline of inhabitants in the Bruges inner city
SOCIO DEMOGRAPHIC
Q 29: WHAT IS YOUR GENDER? Closed Single Randomize: yes
Woman Man
Q 30: WHAT IS THE HIGHEST LEVEL OF EDUCATION YOU HAVE COMPLETED SO FAR? Single Closed Randomize: yes
Primary school Lower secondary school Higher secondary school High school University
Q 31: WHAT IS YOUR PROFESSION Multiple answers possible Closed Multiple Single Randomize: yes
List of professions
Q 32: DO YOU HAVE ANY FINAL REMARKS ABOUT TOURISM IN BRUGES? Open text
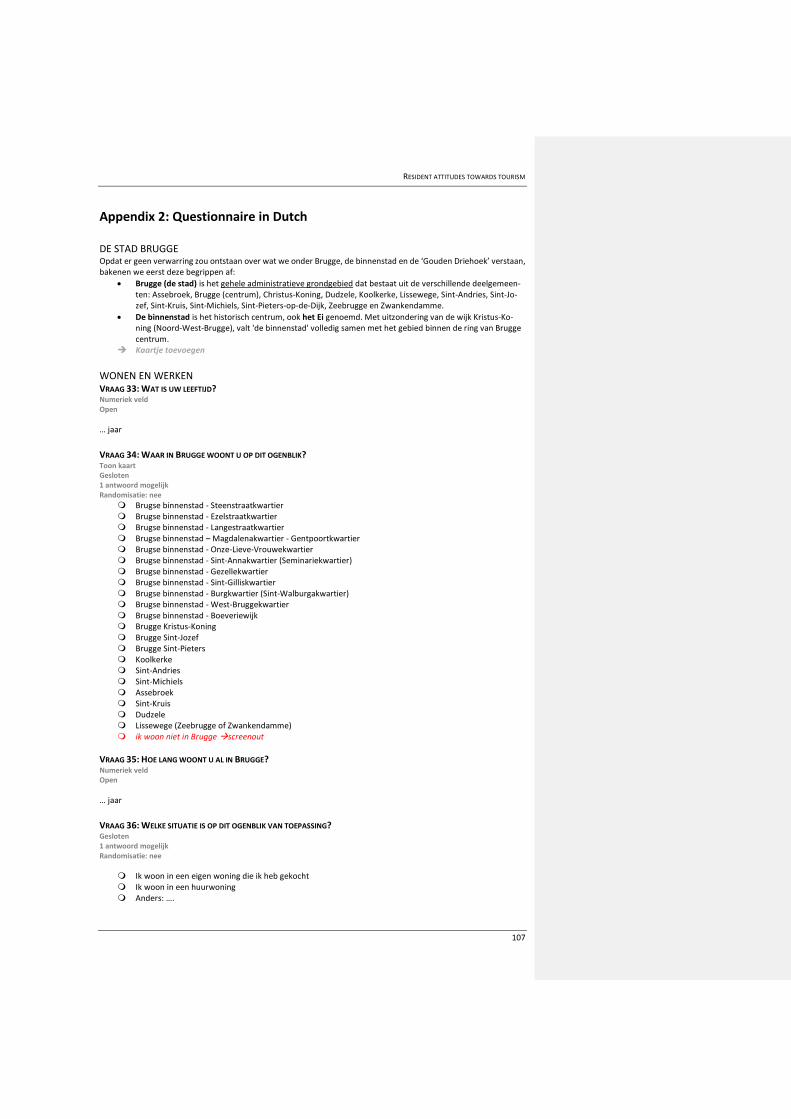
RESIDENT ATTITUDES TOWARDS TOURISM
107
Appendix 2: Questionnaire in Dutch
DE STAD BRUGGE Opdat er geen verwarring zou ontstaan over wat we onder Brugge, de binnenstad en de ‘Gouden Driehoek’ verstaan, bakenen we eerst deze begrippen af:
Brugge (de stad) is het gehele administratieve grondgebied dat bestaat uit de verschillende deelgemeen-ten: Assebroek, Brugge (centrum), Christus-Koning, Dudzele, Koolkerke, Lissewege, Sint-Andries, Sint-Jo-zef, Sint-Kruis, Sint-Michiels, Sint-Pieters-op-de-Dijk, Zeebrugge en Zwankendamme.
De binnenstad is het historisch centrum, ook het Ei genoemd. Met uitzondering van de wijk Kristus-Ko-ning (Noord-West-Brugge), valt 'de binnenstad' volledig samen met het gebied binnen de ring van Brugge centrum.
Kaartje toevoegen
WONEN EN WERKEN VRAAG 33: WAT IS UW LEEFTIJD? Numeriek veld Open
… jaar
VRAAG 34: WAAR IN BRUGGE WOONT U OP DIT OGENBLIK? Toon kaart Gesloten 1 antwoord mogelijk Randomisatie: nee
Brugse binnenstad - Steenstraatkwartier Brugse binnenstad - Ezelstraatkwartier Brugse binnenstad - Langestraatkwartier Brugse binnenstad – Magdalenakwartier - Gentpoortkwartier Brugse binnenstad - Onze-Lieve-Vrouwekwartier Brugse binnenstad - Sint-Annakwartier (Seminariekwartier) Brugse binnenstad - Gezellekwartier Brugse binnenstad - Sint-Gilliskwartier Brugse binnenstad - Burgkwartier (Sint-Walburgakwartier) Brugse binnenstad - West-Bruggekwartier Brugse binnenstad - Boeveriewijk Brugge Kristus-Koning Brugge Sint-Jozef Brugge Sint-Pieters Koolkerke Sint-Andries Sint-Michiels Assebroek Sint-Kruis Dudzele Lissewege (Zeebrugge of Zwankendamme) ik woon niet in Brugge screenout
VRAAG 35: HOE LANG WOONT U AL IN BRUGGE? Numeriek veld Open
… jaar
VRAAG 36: WELKE SITUATIE IS OP DIT OGENBLIK VAN TOEPASSING? Gesloten 1 antwoord mogelijk Randomisatie: nee
Ik woon in een eigen woning die ik heb gekocht Ik woon in een huurwoning Anders: ….
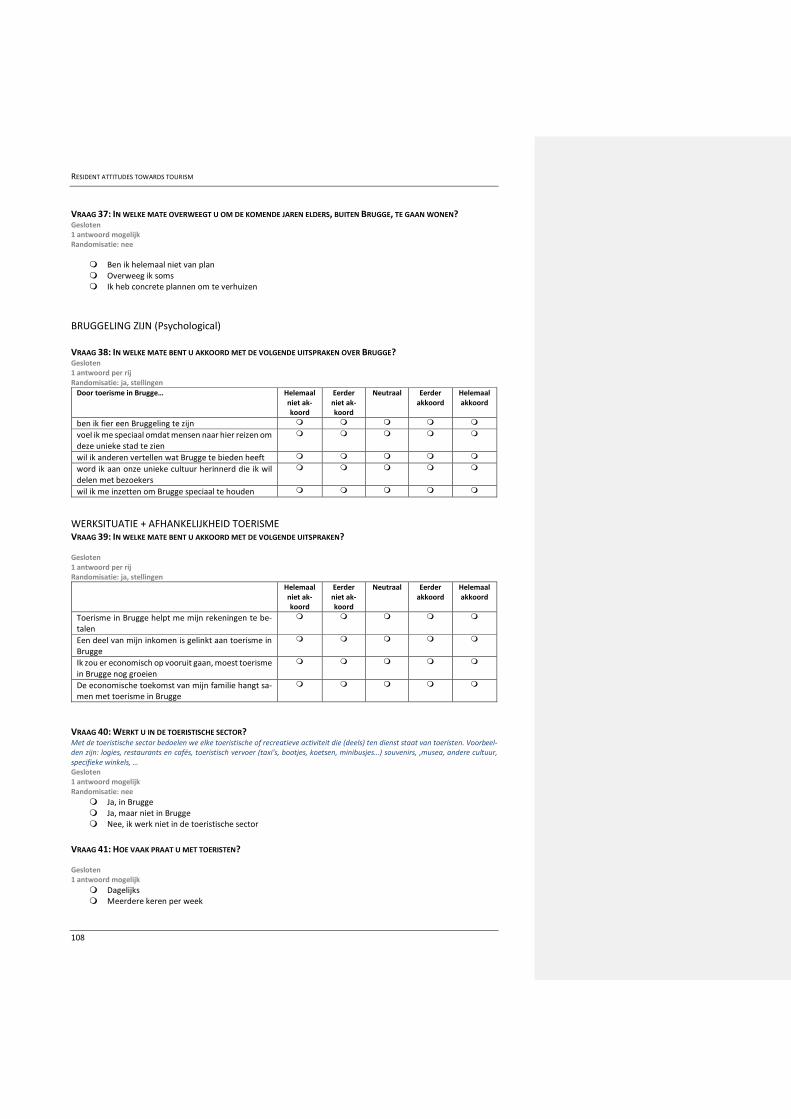
RESIDENT ATTITUDES TOWARDS TOURISM
108
VRAAG 37: IN WELKE MATE OVERWEEGT U OM DE KOMENDE JAREN ELDERS, BUITEN BRUGGE, TE GAAN WONEN? Gesloten 1 antwoord mogelijk Randomisatie: nee
Ben ik helemaal niet van plan Overweeg ik soms Ik heb concrete plannen om te verhuizen
BRUGGELING ZIJN (Psychological) VRAAG 38: IN WELKE MATE BENT U AKKOORD MET DE VOLGENDE UITSPRAKEN OVER BRUGGE? Gesloten 1 antwoord per rij Randomisatie: ja, stellingen
Door toerisme in Brugge… Helemaal niet ak-koord
Eerder niet ak-koord
Neutraal Eerder akkoord
Helemaal akkoord
ben ik fier een Bruggeling te zijn voel ik me speciaal omdat mensen naar hier reizen om deze unieke stad te zien
wil ik anderen vertellen wat Brugge te bieden heeft word ik aan onze unieke cultuur herinnerd die ik wil delen met bezoekers
wil ik me inzetten om Brugge speciaal te houden
WERKSITUATIE + AFHANKELIJKHEID TOERISME VRAAG 39: IN WELKE MATE BENT U AKKOORD MET DE VOLGENDE UITSPRAKEN? Gesloten 1 antwoord per rij Randomisatie: ja, stellingen
Helemaal niet ak-koord
Eerder niet ak-koord
Neutraal Eerder akkoord
Helemaal akkoord
Toerisme in Brugge helpt me mijn rekeningen te be-talen
Een deel van mijn inkomen is gelinkt aan toerisme in Brugge
Ik zou er economisch op vooruit gaan, moest toerisme in Brugge nog groeien
De economische toekomst van mijn familie hangt sa-men met toerisme in Brugge
VRAAG 40: WERKT U IN DE TOERISTISCHE SECTOR? Met de toeristische sector bedoelen we elke toeristische of recreatieve activiteit die (deels) ten dienst staat van toeristen. Voorbeel-den zijn: logies, restaurants en cafés, toeristisch vervoer (taxi’s, bootjes, koetsen, minibusjes…) souvenirs, ,musea, andere cultuur, specifieke winkels, … Gesloten 1 antwoord mogelijk Randomisatie: nee
Ja, in Brugge Ja, maar niet in Brugge Nee, ik werk niet in de toeristische sector
VRAAG 41: HOE VAAK PRAAT U MET TOERISTEN? Gesloten 1 antwoord mogelijk
Dagelijks Meerdere keren per week
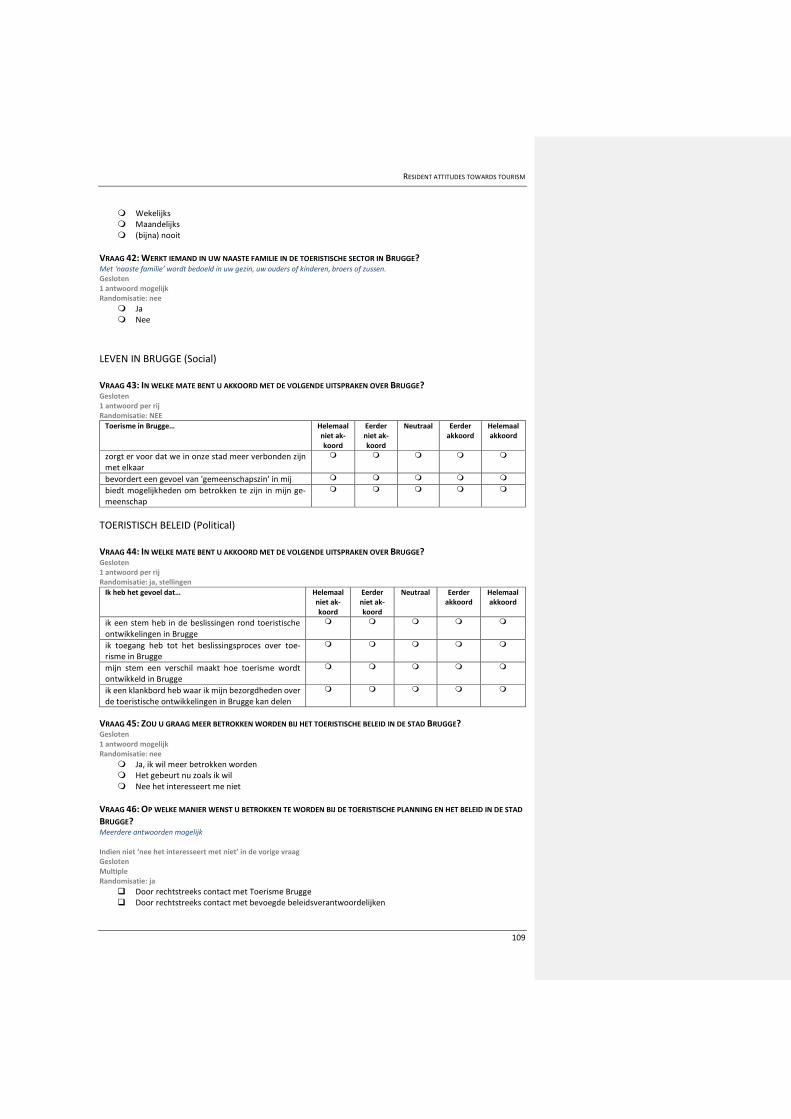
RESIDENT ATTITUDES TOWARDS TOURISM
109
Wekelijks Maandelijks (bijna) nooit
VRAAG 42: WERKT IEMAND IN UW NAASTE FAMILIE IN DE TOERISTISCHE SECTOR IN BRUGGE? Met ‘naaste familie’ wordt bedoeld in uw gezin, uw ouders of kinderen, broers of zussen. Gesloten 1 antwoord mogelijk Randomisatie: nee
Ja Nee
LEVEN IN BRUGGE (Social) VRAAG 43: IN WELKE MATE BENT U AKKOORD MET DE VOLGENDE UITSPRAKEN OVER BRUGGE? Gesloten 1 antwoord per rij Randomisatie: NEE
Toerisme in Brugge… Helemaal niet ak-koord
Eerder niet ak-koord
Neutraal Eerder akkoord
Helemaal akkoord
zorgt er voor dat we in onze stad meer verbonden zijn met elkaar
bevordert een gevoel van 'gemeenschapszin' in mij biedt mogelijkheden om betrokken te zijn in mijn ge-meenschap
TOERISTISCH BELEID (Political) VRAAG 44: IN WELKE MATE BENT U AKKOORD MET DE VOLGENDE UITSPRAKEN OVER BRUGGE? Gesloten 1 antwoord per rij Randomisatie: ja, stellingen
Ik heb het gevoel dat… Helemaal niet ak-koord
Eerder niet ak-koord
Neutraal Eerder akkoord
Helemaal akkoord
ik een stem heb in de beslissingen rond toeristische ontwikkelingen in Brugge
ik toegang heb tot het beslissingsproces over toe-risme in Brugge
mijn stem een verschil maakt hoe toerisme wordt ontwikkeld in Brugge
ik een klankbord heb waar ik mijn bezorgdheden over de toeristische ontwikkelingen in Brugge kan delen
VRAAG 45: ZOU U GRAAG MEER BETROKKEN WORDEN BIJ HET TOERISTISCHE BELEID IN DE STAD BRUGGE? Gesloten 1 antwoord mogelijk Randomisatie: nee
Ja, ik wil meer betrokken worden Het gebeurt nu zoals ik wil Nee het interesseert me niet
VRAAG 46: OP WELKE MANIER WENST U BETROKKEN TE WORDEN BIJ DE TOERISTISCHE PLANNING EN HET BELEID IN DE STAD
BRUGGE? Meerdere antwoorden mogelijk Indien niet ‘nee het interesseert met niet’ in de vorige vraag Gesloten Multiple Randomisatie: ja
Door rechtstreeks contact met Toerisme Brugge Door rechtstreeks contact met bevoegde beleidsverantwoordelijken
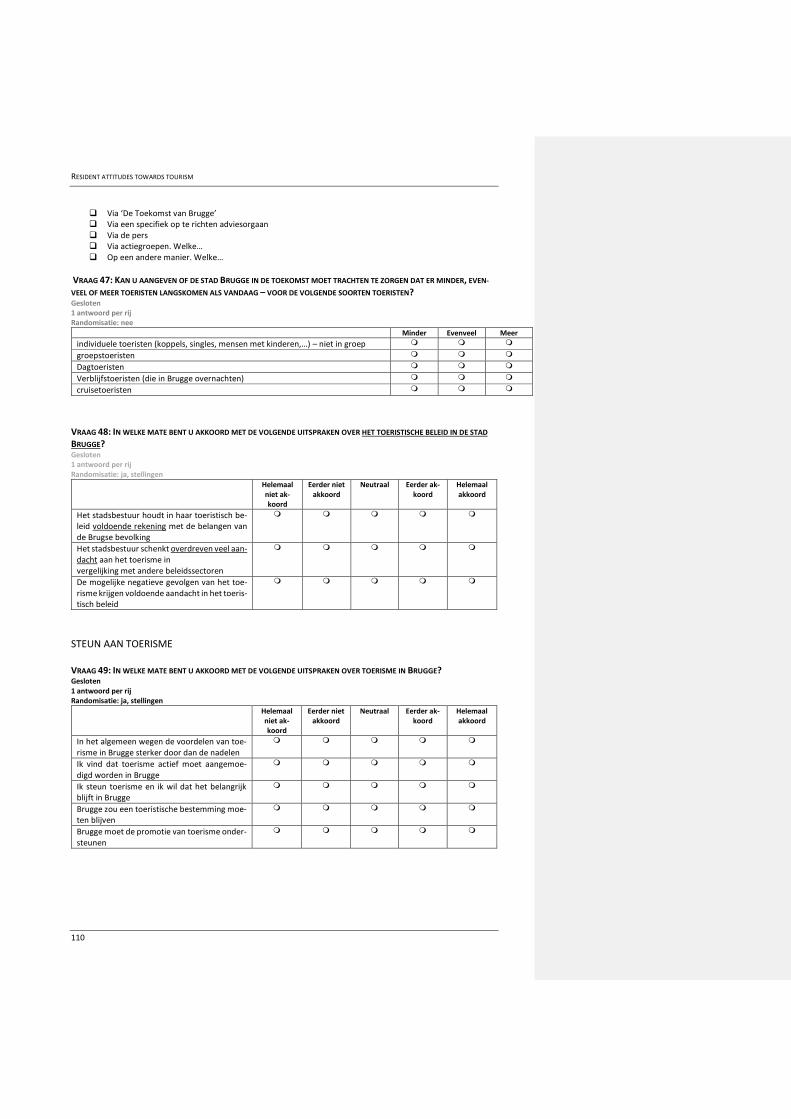
RESIDENT ATTITUDES TOWARDS TOURISM
110
Via ‘De Toekomst van Brugge’ Via een specifiek op te richten adviesorgaan Via de pers Via actiegroepen. Welke… Op een andere manier. Welke…
VRAAG 47: KAN U AANGEVEN OF DE STAD BRUGGE IN DE TOEKOMST MOET TRACHTEN TE ZORGEN DAT ER MINDER, EVEN-
VEEL OF MEER TOERISTEN LANGSKOMEN ALS VANDAAG – VOOR DE VOLGENDE SOORTEN TOERISTEN? Gesloten 1 antwoord per rij Randomisatie: nee
Minder Evenveel Meer
individuele toeristen (koppels, singles, mensen met kinderen,…) – niet in groep groepstoeristen Dagtoeristen Verblijfstoeristen (die in Brugge overnachten) cruisetoeristen
VRAAG 48: IN WELKE MATE BENT U AKKOORD MET DE VOLGENDE UITSPRAKEN OVER HET TOERISTISCHE BELEID IN DE STAD
BRUGGE? Gesloten 1 antwoord per rij Randomisatie: ja, stellingen
Helemaal niet ak-koord
Eerder niet akkoord
Neutraal Eerder ak-koord
Helemaal akkoord
Het stadsbestuur houdt in haar toeristisch be-leid voldoende rekening met de belangen van de Brugse bevolking
Het stadsbestuur schenkt overdreven veel aan-dacht aan het toerisme in vergelijking met andere beleidssectoren
De mogelijke negatieve gevolgen van het toe-risme krijgen voldoende aandacht in het toeris-tisch beleid
STEUN AAN TOERISME VRAAG 49: IN WELKE MATE BENT U AKKOORD MET DE VOLGENDE UITSPRAKEN OVER TOERISME IN BRUGGE? Gesloten 1 antwoord per rij Randomisatie: ja, stellingen
Helemaal niet ak-koord
Eerder niet akkoord
Neutraal Eerder ak-koord
Helemaal akkoord
In het algemeen wegen de voordelen van toe-risme in Brugge sterker door dan de nadelen
Ik vind dat toerisme actief moet aangemoe-digd worden in Brugge
Ik steun toerisme en ik wil dat het belangrijk blijft in Brugge
Brugge zou een toeristische bestemming moe-ten blijven
Brugge moet de promotie van toerisme onder-steunen
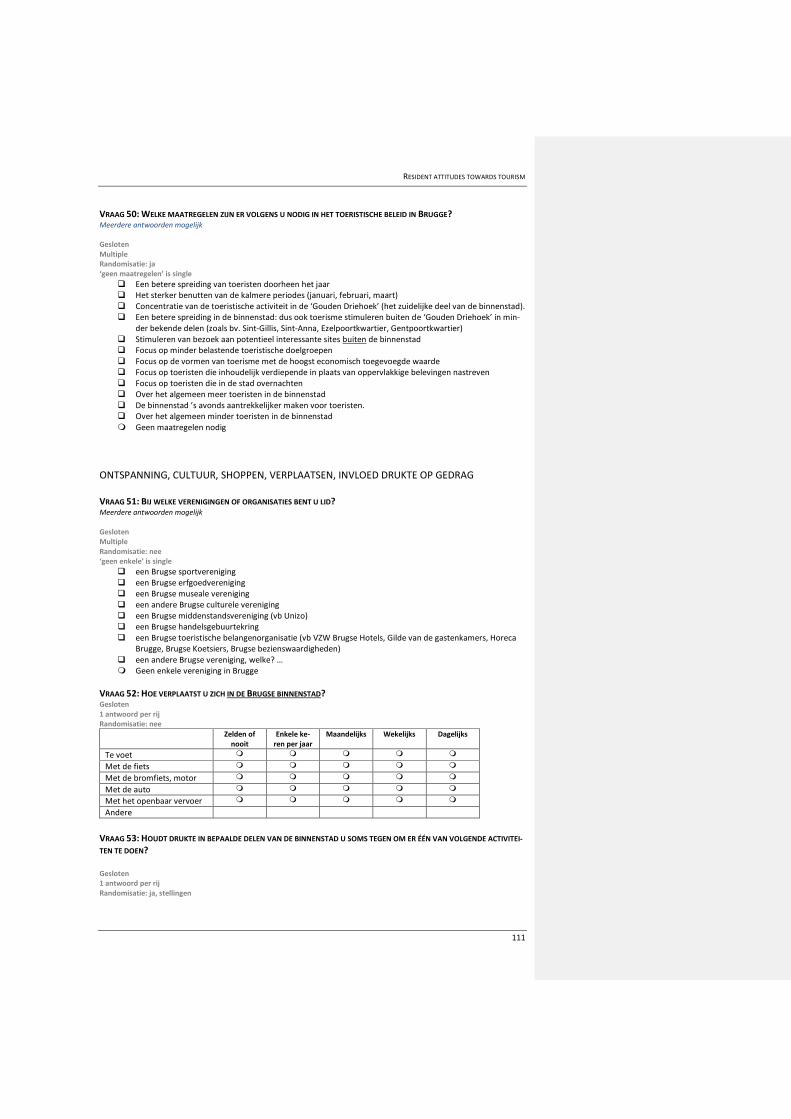
RESIDENT ATTITUDES TOWARDS TOURISM
111
VRAAG 50: WELKE MAATREGELEN ZIJN ER VOLGENS U NODIG IN HET TOERISTISCHE BELEID IN BRUGGE? Meerdere antwoorden mogelijk Gesloten Multiple Randomisatie: ja ‘geen maatregelen’ is single
Een betere spreiding van toeristen doorheen het jaar Het sterker benutten van de kalmere periodes (januari, februari, maart) Concentratie van de toeristische activiteit in de ‘Gouden Driehoek’ (het zuidelijke deel van de binnenstad). Een betere spreiding in de binnenstad: dus ook toerisme stimuleren buiten de ‘Gouden Driehoek’ in min-
der bekende delen (zoals bv. Sint-Gillis, Sint-Anna, Ezelpoortkwartier, Gentpoortkwartier) Stimuleren van bezoek aan potentieel interessante sites buiten de binnenstad Focus op minder belastende toeristische doelgroepen Focus op de vormen van toerisme met de hoogst economisch toegevoegde waarde Focus op toeristen die inhoudelijk verdiepende in plaats van oppervlakkige belevingen nastreven Focus op toeristen die in de stad overnachten Over het algemeen meer toeristen in de binnenstad De binnenstad ’s avonds aantrekkelijker maken voor toeristen. Over het algemeen minder toeristen in de binnenstad Geen maatregelen nodig
ONTSPANNING, CULTUUR, SHOPPEN, VERPLAATSEN, INVLOED DRUKTE OP GEDRAG VRAAG 51: BIJ WELKE VERENIGINGEN OF ORGANISATIES BENT U LID? Meerdere antwoorden mogelijk Gesloten Multiple Randomisatie: nee ‘geen enkele’ is single
een Brugse sportvereniging een Brugse erfgoedvereniging een Brugse museale vereniging een andere Brugse culturele vereniging een Brugse middenstandsvereniging (vb Unizo) een Brugse handelsgebuurtekring een Brugse toeristische belangenorganisatie (vb VZW Brugse Hotels, Gilde van de gastenkamers, Horeca
Brugge, Brugse Koetsiers, Brugse bezienswaardigheden) een andere Brugse vereniging, welke? … Geen enkele vereniging in Brugge
VRAAG 52: HOE VERPLAATST U ZICH IN DE BRUGSE BINNENSTAD? Gesloten 1 antwoord per rij Randomisatie: nee
Zelden of nooit
Enkele ke-ren per jaar
Maandelijks Wekelijks Dagelijks
Te voet
Met de fiets
Met de bromfiets, motor
Met de auto
Met het openbaar vervoer
Andere
VRAAG 53: HOUDT DRUKTE IN BEPAALDE DELEN VAN DE BINNENSTAD U SOMS TEGEN OM ER ÉÉN VAN VOLGENDE ACTIVITEI-
TEN TE DOEN? Gesloten 1 antwoord per rij Randomisatie: ja, stellingen
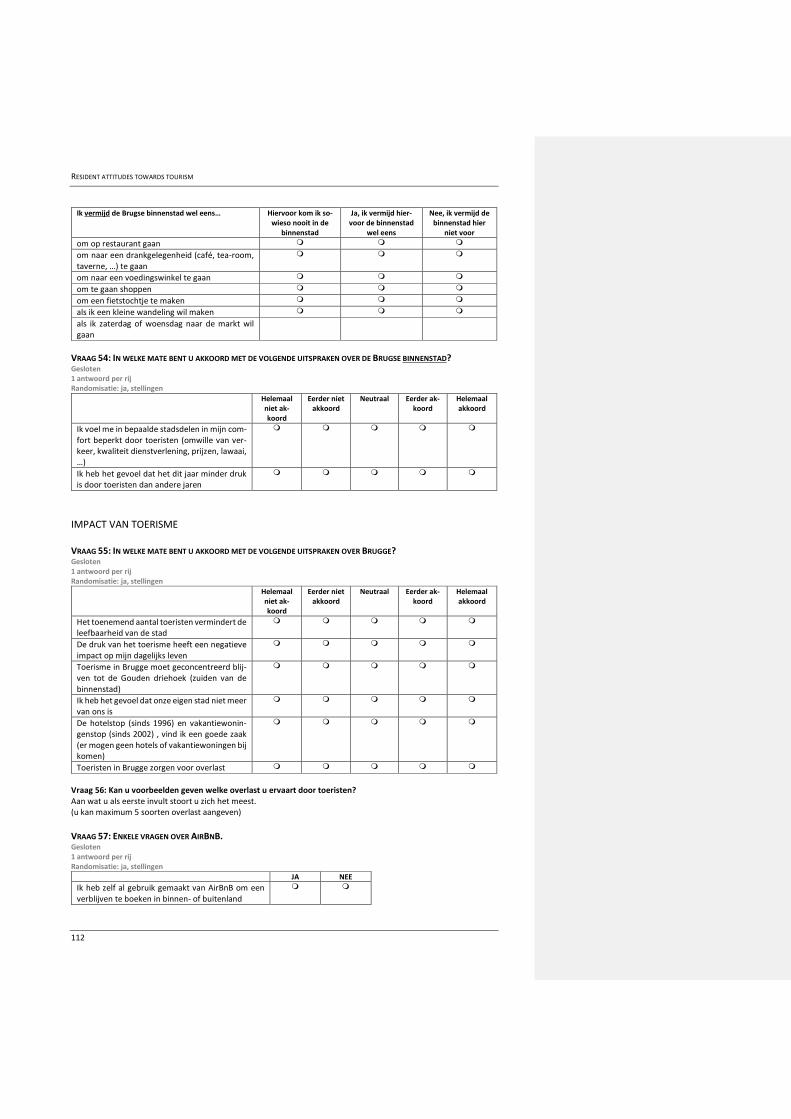
RESIDENT ATTITUDES TOWARDS TOURISM
112
Ik vermijd de Brugse binnenstad wel eens… Hiervoor kom ik so-wieso nooit in de
binnenstad
Ja, ik vermijd hier-voor de binnenstad
wel eens
Nee, ik vermijd de binnenstad hier
niet voor
om op restaurant gaan om naar een drankgelegenheid (café, tea-room, taverne, …) te gaan
om naar een voedingswinkel te gaan om te gaan shoppen om een fietstochtje te maken als ik een kleine wandeling wil maken als ik zaterdag of woensdag naar de markt wil gaan
VRAAG 54: IN WELKE MATE BENT U AKKOORD MET DE VOLGENDE UITSPRAKEN OVER DE BRUGSE BINNENSTAD? Gesloten 1 antwoord per rij Randomisatie: ja, stellingen
Helemaal niet ak-koord
Eerder niet akkoord
Neutraal Eerder ak-koord
Helemaal akkoord
Ik voel me in bepaalde stadsdelen in mijn com-fort beperkt door toeristen (omwille van ver-keer, kwaliteit dienstverlening, prijzen, lawaai, …)
Ik heb het gevoel dat het dit jaar minder druk is door toeristen dan andere jaren
IMPACT VAN TOERISME VRAAG 55: IN WELKE MATE BENT U AKKOORD MET DE VOLGENDE UITSPRAKEN OVER BRUGGE? Gesloten 1 antwoord per rij Randomisatie: ja, stellingen
Helemaal niet ak-koord
Eerder niet akkoord
Neutraal Eerder ak-koord
Helemaal akkoord
Het toenemend aantal toeristen vermindert de leefbaarheid van de stad
De druk van het toerisme heeft een negatieve impact op mijn dagelijks leven
Toerisme in Brugge moet geconcentreerd blij-ven tot de Gouden driehoek (zuiden van de binnenstad)
Ik heb het gevoel dat onze eigen stad niet meer van ons is
De hotelstop (sinds 1996) en vakantiewonin-genstop (sinds 2002) , vind ik een goede zaak (er mogen geen hotels of vakantiewoningen bij komen)
Toeristen in Brugge zorgen voor overlast
Vraag 56: Kan u voorbeelden geven welke overlast u ervaart door toeristen? Aan wat u als eerste invult stoort u zich het meest. (u kan maximum 5 soorten overlast aangeven)
VRAAG 57: ENKELE VRAGEN OVER AIRBNB. Gesloten 1 antwoord per rij Randomisatie: ja, stellingen
JA NEE
Ik heb zelf al gebruik gemaakt van AirBnB om een verblijven te boeken in binnen- of buitenland
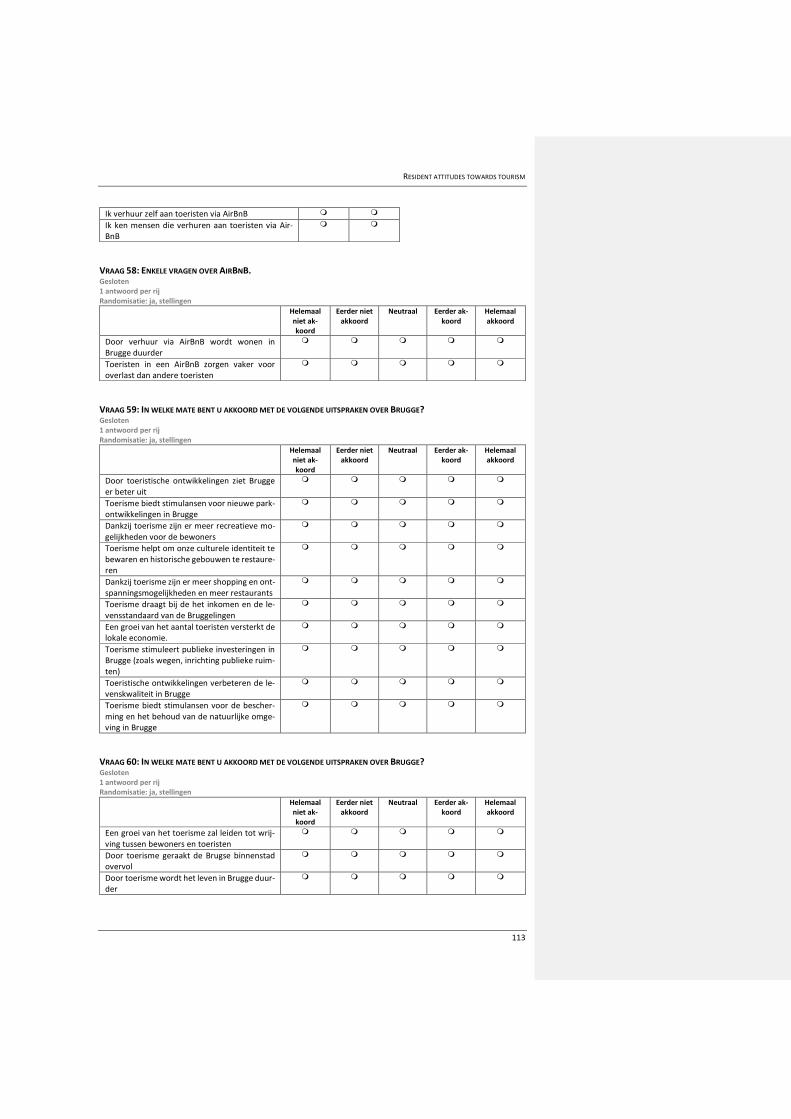
RESIDENT ATTITUDES TOWARDS TOURISM
113
Ik verhuur zelf aan toeristen via AirBnB Ik ken mensen die verhuren aan toeristen via Air-BnB
VRAAG 58: ENKELE VRAGEN OVER AIRBNB. Gesloten 1 antwoord per rij Randomisatie: ja, stellingen
Helemaal niet ak-koord
Eerder niet akkoord
Neutraal Eerder ak-koord
Helemaal akkoord
Door verhuur via AirBnB wordt wonen in Brugge duurder
Toeristen in een AirBnB zorgen vaker voor overlast dan andere toeristen
VRAAG 59: IN WELKE MATE BENT U AKKOORD MET DE VOLGENDE UITSPRAKEN OVER BRUGGE? Gesloten 1 antwoord per rij Randomisatie: ja, stellingen
Helemaal niet ak-koord
Eerder niet akkoord
Neutraal Eerder ak-koord
Helemaal akkoord
Door toeristische ontwikkelingen ziet Brugge er beter uit
Toerisme biedt stimulansen voor nieuwe park-ontwikkelingen in Brugge
Dankzij toerisme zijn er meer recreatieve mo-gelijkheden voor de bewoners
Toerisme helpt om onze culturele identiteit te bewaren en historische gebouwen te restaure-ren
Dankzij toerisme zijn er meer shopping en ont-spanningsmogelijkheden en meer restaurants
Toerisme draagt bij de het inkomen en de le-vensstandaard van de Bruggelingen
Een groei van het aantal toeristen versterkt de lokale economie.
Toerisme stimuleert publieke investeringen in Brugge (zoals wegen, inrichting publieke ruim-ten)
Toeristische ontwikkelingen verbeteren de le-venskwaliteit in Brugge
Toerisme biedt stimulansen voor de bescher-ming en het behoud van de natuurlijke omge-ving in Brugge
VRAAG 60: IN WELKE MATE BENT U AKKOORD MET DE VOLGENDE UITSPRAKEN OVER BRUGGE? Gesloten 1 antwoord per rij Randomisatie: ja, stellingen
Helemaal niet ak-koord
Eerder niet akkoord
Neutraal Eerder ak-koord
Helemaal akkoord
Een groei van het toerisme zal leiden tot wrij-ving tussen bewoners en toeristen
Door toerisme geraakt de Brugse binnenstad overvol
Door toerisme wordt het leven in Brugge duur-der

RESIDENT ATTITUDES TOWARDS TOURISM
114
De groei van het toerisme zal ertoe leiden dat minder mensen in de Brugse binnenstad willen wonen
SOCIO DEMO De gegevens worden uiteraard anoniem verwerkt!
VRAAG 61: GESLACHT? Gesloten 1 antwoord mogelijk Randomisatie: nee
Vrouw Man
VRAAG 62: WAT IS UW HOOGST BEHAALDE DIPLOMA? Meerdere antwoorden mogelijk Gesloten Randomisatie: nee
Geen diploma Lager onderwijs Lager secundair onderwijs Hoger secundair onderwijs Niet universitair hoger onderwijs Universiteit
VRAAG 63: UW BEROEPSSITUATIE? Meerdere antwoorden mogelijk Gesloten Multiple 1 antwoord mogelijk Randomisatie: nee
Werkzoekend Huisvrouw/man Gepensioneerd Student In loondienst Als zelfstandige Andere:…
VRAAG 64: HEEFT U NOG BIJKOMENDE OPMERKINGEN OVER TOERISME IN BRUGGE? Open tekstveld