Embed Size (px)
Citation preview
Final Report …helping organizations make better decisions since 1982
Submitted to the City of San Diego, CA by: ETC Institute 725 W. Frontier Lane, Olathe, Kansas 66061
February 2016
‘15 2015 City of San Diego Resident Survey
Contents
Executive Summary ................................................................................................ i
Section 1: Charts and Graphs ................................................................................ 1
Section 2: Importance-Satisfaction Analysis ...................................................... 15
Section 3: Tabular Data ....................................................................................... 21
Section 4: Survey Instrument.............................................................................. 44
2015 City of San Diego Resident Survey
ETC Institute (2015) i
Executive Su
mm
ary Rep
ort
2015 City of San Diego Resident Survey Executive Summary Report
Overview and Methodology
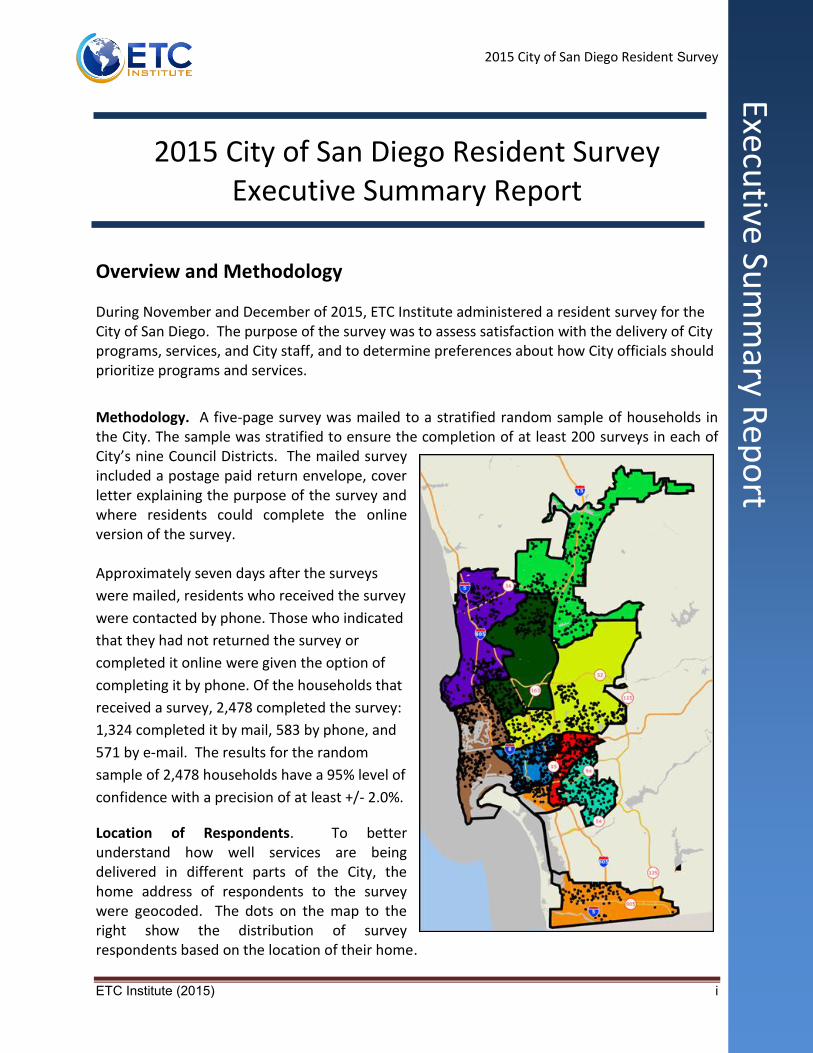
During November and December of 2015, ETC Institute administered a resident survey for the City of San Diego. The purpose of the survey was to assess satisfaction with the delivery of City programs, services, and City staff, and to determine preferences about how City officials should prioritize programs and services.
Methodology. A five-page survey was mailed to a stratified random sample of households in the City. The sample was stratified to ensure the completion of at least 200 surveys in each of City’s nine Council Districts. The mailed survey included a postage paid return envelope, cover letter explaining the purpose of the survey and where residents could complete the online version of the survey. Approximately seven days after the surveys
were mailed, residents who received the survey
were contacted by phone. Those who indicated
that they had not returned the survey or
completed it online were given the option of
completing it by phone. Of the households that
received a survey, 2,478 completed the survey:
1,324 completed it by mail, 583 by phone, and
571 by e-mail. The results for the random
sample of 2,478 households have a 95% level of
confidence with a precision of at least +/- 2.0%.
Location of Respondents. To better understand how well services are being delivered in different parts of the City, the home address of respondents to the survey were geocoded. The dots on the map to the right show the distribution of survey respondents based on the location of their home.
2015 City of San Diego Resident Survey
ETC Institute (2015) ii
Executive Su
mm
ary Rep
ort
Don’t Knows. The percentage of “don’t know” responses has been excluded from many of the graphs in this report to assess satisfaction with residents who had used City services. Since the number of “don’t know” responses often reflects the utilization and awareness of city services, the percentage of “don’t know” responses has been included in the tabular data in Section 3 of this report. When the “don’t know” responses have been excluded, the text of this report will indicate that the responses have been excluded with the phrase “who had an opinion.” This report contains the following:
a summary of the methodology for administering the survey and major findings
charts showing the overall results for most questions on the survey (Section 1)
importance-satisfaction analysis that identifies priorities for investment (Section 2)
tabular data showing the overall results for all questions on the survey (Section 3)
a copy of the cover letter and survey instrument (Section 4)
Overall Ratings of the City
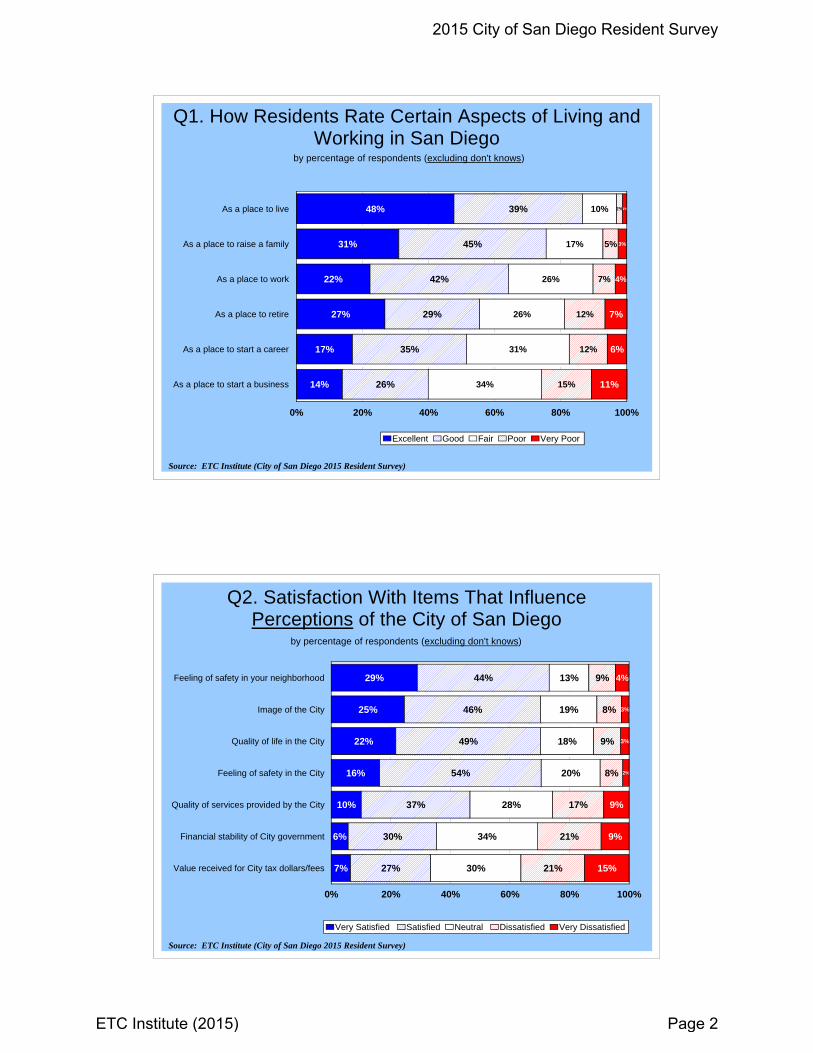
Eighty-seven percent (87%) of those surveyed, who had an opinion, gave positive ratings for San Diego as a place to live; 76% gave positive ratings for the City as a place raise a family, and 64% gave positive ratings for the City as a place to work.
Perceptions of the City
Residents were asked to rate several items that may influence their perceptions of the City. The items that had the highest levels of satisfaction, based upon the combined “very satisfied” and “satisfied” responses among residents who had an opinion, were: feeling of safety in neighborhoods (73%), image of the City (71%), quality of life in the City (71%), and feeling of safety in the City (70%).
Overall Satisfaction with City Services
Forty-seven percent (47%) of the residents surveyed, who had an opinion, were “very satisfied” or “satisfied” with the overall quality of services provided by the City of San Diego. The major categories of city services that had the highest levels of satisfaction, based upon the combined percentage of “very satisfied” and “satisfied” responses among residents who had an opinion, were: fire rescue safety services (78%), library programs and facilities (76%), lifeguard services (72%), emergency medical services (70%), and solid waste services (70%). Residents were least satisfied with the maintenance of streets, sidewalks, and infrastructure (24%).
2015 City of San Diego Resident Survey
ETC Institute (2015) iii
Executive Su
mm
ary Rep
ort
Satisfaction with Specific City Services
Police Services. The highest levels of satisfaction with police services, based upon the combined percentage of “very satisfied” and “satisfied” responses among residents who had an opinion, were: effectiveness of local police protection (66%), the visibility of police in the City (59%), and how quickly police respond (53%).
Fire Services. The highest levels of satisfaction with fire services, based upon the combined percentage of “very satisfied” and “satisfied” responses among residents who had an opinion, were: how quickly firefighters respond (83%), effectiveness of local fire protection (82%), and how quickly emergency medical personnel respond (79%).
City Streets, Sidewalks, and Infrastructure. The highest levels of satisfaction with City streets, sidewalks, and infrastructure, based upon the combined percentage of “very satisfied” and “satisfied” responses among residents who had an opinion, were: accessibility of streets, sidewalks and buildings for people with disabilities (57%), condition of City buildings (57%), availability of street lights in the neighborhood (52%), and efforts to keep streets clean in the neighborhood (50%).
Solid Waste. The highest levels of satisfaction with solid waste services, based upon the combined percentage of “very satisfied” and “satisfied” responses among residents who had an opinion, were: residential trash collection (81%) and residential recycling services (77%).
Parks and Recreation. The highest levels of satisfaction with the City’s parks and recreation services, based upon the combined percentage of “very satisfied” and “satisfied” responses among residents who had an opinion, were: availability of parks and recreation facilities (75%), maintenance of City beaches (73%), maintenance of City parks (69%), and hours of operation at City parks and recreation facilities (68%).
Library Services. The highest levels of satisfaction with the City’s library services, based upon the combined percentage of “very satisfied” and “satisfied” responses among residents who had an opinion, were: availability of library facilities (77%), the quality of services/libraries in the neighborhood (76%), and maintenance of City libraries (72%).
Community Engagement. The highest levels of satisfaction with community engagement, based upon the combined percentage of “very satisfied” and “satisfied” responses among residents who had an opinion, were: access to information about City programs and services (43%), overall usefulness of the City’s website (39%) and access to City officials (38%).
2015 City of San Diego Resident Survey
ETC Institute (2015) iv
Executive Su
mm
ary Rep
ort
Other Services. The highest levels of satisfaction with other City services, based upon the combined percentage of “very satisfied” and “satisfied” responses among residents who had an opinion, were: online services (58%), quality and variety of entertainment, expositions and sporting events (58%), music, dance, and theater performances (57%), and historic preservation efforts (50%).
Customer Service. The highest levels of satisfaction with customer service from City employees, based upon the combined percentage of “excellent” and “good” responses among residents who had an opinion, were: courtesy of employees (67%), knowledge of employees (64%), and overall customer service provided (62%).
Other Findings
Some of the other major findings from the survey are listed below:
How Residents Think the Overall Quality of Services Has Changed. Residents were asked how they think the overall quality of services provided by the City has changed compared to several years ago. Of those who had an opinion, 12% indicated it was “much better” than it was several years ago; 31% thought the quality was “a little better,” 35% answered “about the same,” 15% thought it was “a little worse,” and 8% felt it was “much worse.”
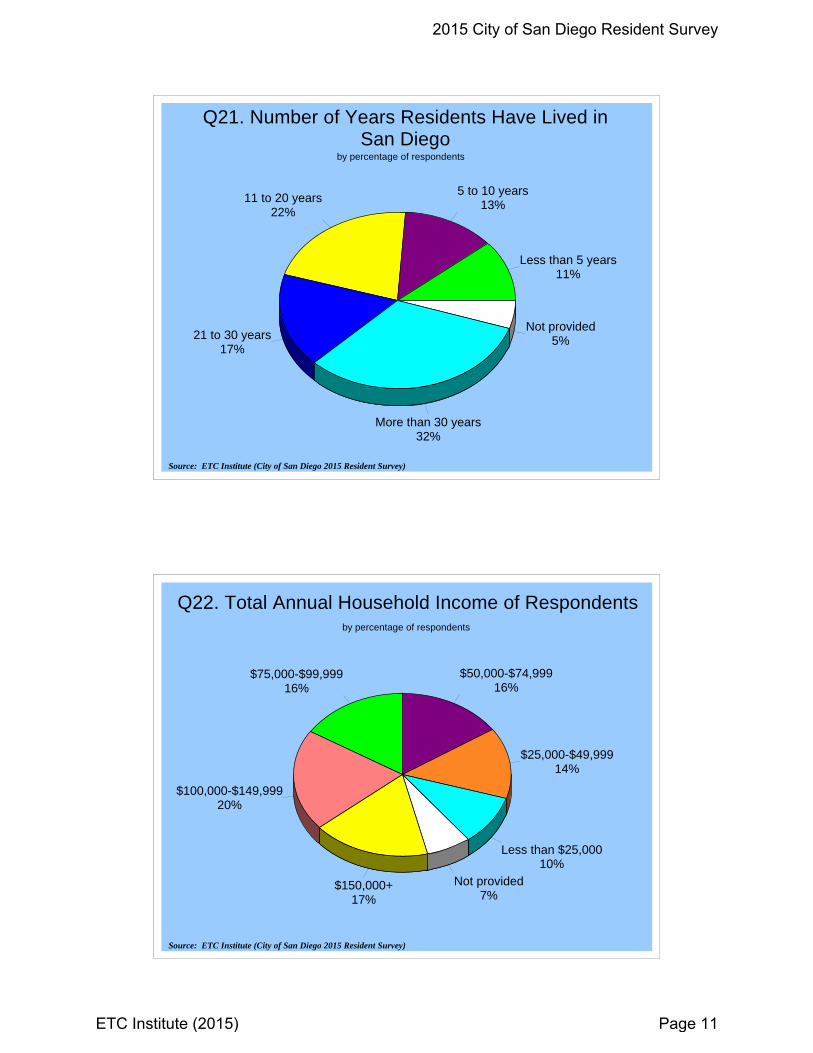
Preferred Method of Reporting Problems to the City. Half (50%) of residents indicated the City web site was their preferred method of reporting problems to the City. Twenty percent (20%) indicated they prefer a mobile application, 13% prefer cellular telephone, 9% prefer text message, 4% prefer social media, and 3% did not have an opinion.
Investment Priorities Recommended Priorities for the Next Two Years. In order to help the City identify investment priorities for the next two years, ETC Institute conducted an Importance-Satisfaction (I-S) analysis. This analysis examined the importance that residents placed on each City service and the level of satisfaction with each service.
By identifying services of high importance and low satisfaction, the analysis identified which services will have the most impact on overall satisfaction with City services over the next two years. If the City wants to improve its overall satisfaction rating, the City should prioritize investments in services with the highest Importance Satisfaction (I-S) ratings. Details regarding the methodology for the analysis are provided in Section 2 of this report.
2015 City of San Diego Resident Survey
ETC Institute (2015) v
Executive Su
mm
ary Rep
ort
Top Priority for Investment. Based on the results of the Importance-Satisfaction (I-S) Analysis, the major service category that is recommended as the top priority for investment over the next two years in order to raise the City’s overall satisfaction rating is the maintenance of streets, sidewalks, and infrastructure.
Section 1:
Charts and Graphs
2015 City of San Diego Resident Survey
ETC Institute (2015) Page 1
48%
31%
22%
27%
17%
14%
39%
45%
42%
29%
35%
26%
10%
17%
26%
26%
31%
34%
2%
5%
7%
12%
12%
15%
1%
3%
4%
7%
6%
11%
As a place to live
As a place to raise a family
As a place to work
As a place to retire
As a place to start a career
As a place to start a business
0% 20% 40% 60% 80% 100%
Excellent Good Fair Poor Very Poor
Q1. How Residents Rate Certain Aspects of Living and Working in San Diego
by percentage of respondents (excluding don't knows)
Source: ETC Institute (City of San Diego 2015 Resident Survey)
29%
25%
22%
16%
10%
6%
7%
44%
46%
49%
54%
37%
30%
27%
13%
19%
18%
20%
28%
34%
30%
9%
8%
9%
8%
17%
21%
21%
4%
3%
3%
2%
9%
9%
15%
Feeling of safety in your neighborhood
Image of the City
Quality of life in the City
Feeling of safety in the City
Quality of services provided by the City
Financial stability of City government
Value received for City tax dollars/fees
0% 20% 40% 60% 80% 100%
Very Satisfied Satisfied Neutral Dissatisfied Very Dissatisfied
Q2. Satisfaction With Items That Influence Perceptions of the City of San Diego
by percentage of respondents (excluding don't knows)
Source: ETC Institute (City of San Diego 2015 Resident Survey)
2015 City of San Diego Resident Survey
ETC Institute (2015) Page 2
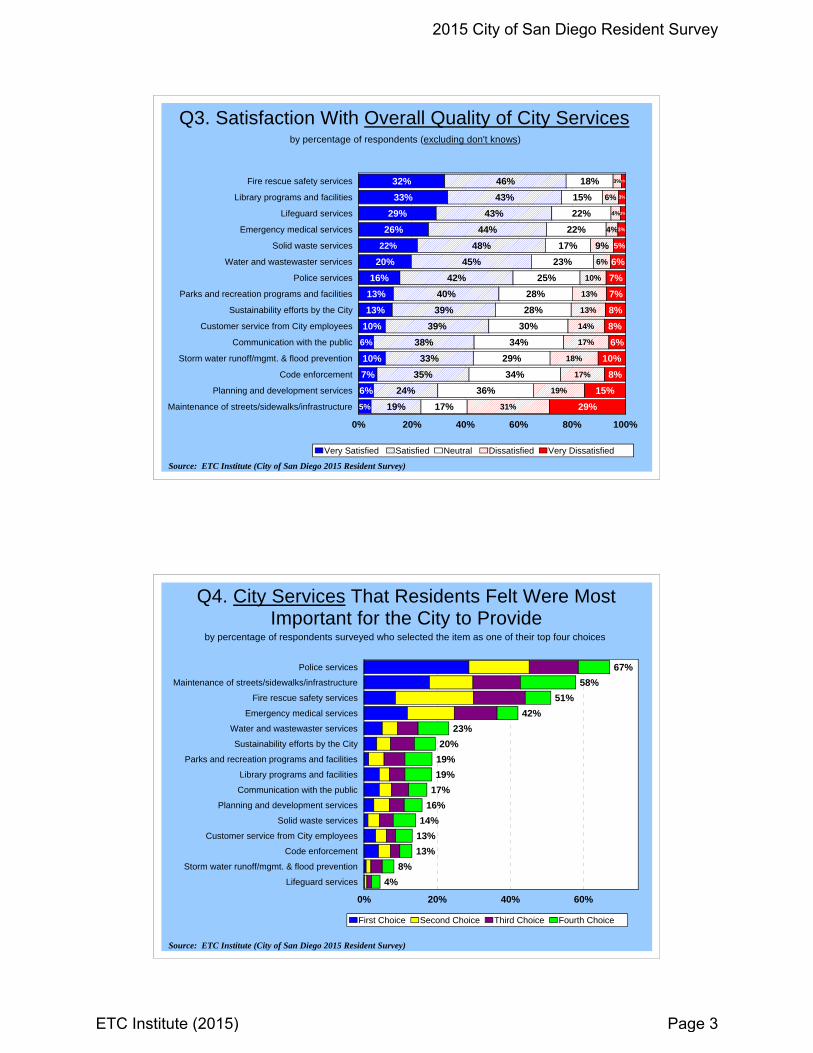
Q3. Satisfaction With Overall Quality of City Servicesby percentage of respondents (excluding don't knows)
Source: ETC Institute (City of San Diego 2015 Resident Survey)
32%
33%
29%
26%
22%
20%
16%
13%
13%
10%
6%
10%
7%
6%
5%
46%
43%
43%
44%
48%
45%
42%
40%
39%
39%
38%
33%
35%
24%
19%
18%
15%
22%
22%
17%
23%
25%
28%
28%
30%
34%
29%
34%
36%
17%
3%
6%
4%
4%
9%
6%
10%
13%
13%
14%
17%
18%
17%
19%
31%
1%
3%
2%
3%
5%
6%
7%
7%
8%
8%
6%
10%
8%
15%
29%
Fire rescue safety services
Library programs and facilities
Lifeguard services
Emergency medical services
Solid waste services
Water and wastewaster services
Police services
Parks and recreation programs and facilities
Sustainability efforts by the City
Customer service from City employees
Communication with the public
Storm water runoff/mgmt. & flood prevention
Code enforcement
Planning and development services
Maintenance of streets/sidewalks/infrastructure
0% 20% 40% 60% 80% 100%
Very Satisfied Satisfied Neutral Dissatisfied Very Dissatisfied
67%
58%
51%
42%
23%
20%
19%
19%
17%
16%
14%
13%
13%
8%
4%
Police services
Maintenance of streets/sidewalks/infrastructure
Fire rescue safety services
Emergency medical services
Water and wastewaster services
Sustainability efforts by the City
Parks and recreation programs and facilities
Library programs and facilities
Communication with the public
Planning and development services
Solid waste services
Customer service from City employees
Code enforcement
Storm water runoff/mgmt. & flood prevention
Lifeguard services
0% 20% 40% 60%
First Choice Second Choice Third Choice Fourth Choice
Q4. City Services That Residents Felt Were Most Important for the City to Provide
by percentage of respondents surveyed who selected the item as one of their top four choices
Source: ETC Institute (City of San Diego 2015 Resident Survey)
2015 City of San Diego Resident Survey
ETC Institute (2015) Page 3

Q5. How Residents Think the Overall Quality of Services Provided by the City Has Changed Compared
to Several Years Ago
Much better12%
A little better31%
About the same35%
A little worse15%
Much worse8%
Source: ETC Institute (City of San Diego 2015 Resident Survey)
by percentage of respondents (excluding don't knows)
Q6. Satisfaction with Police Servicesby percentage of respondents (excluding don't knows)
Source: ETC Institute (City of San Diego 2015 Resident Survey)
18%
15%
16%
15%
11%
48%
44%
37%
36%
40%
21%
26%
26%
25%
32%
8%
10%
14%
15%
12%
5%
5%
8%
9%
6%
Effectiveness of local police protection
The visibility of police in the City
How quickly police respond
The visibility of police in your neighborhood
The City's overall crime prevention efforts
0% 20% 40% 60% 80% 100%
Very Satisfied Satisfied Neutral Dissatisfied Very Dissatisfied
2015 City of San Diego Resident Survey
ETC Institute (2015) Page 4
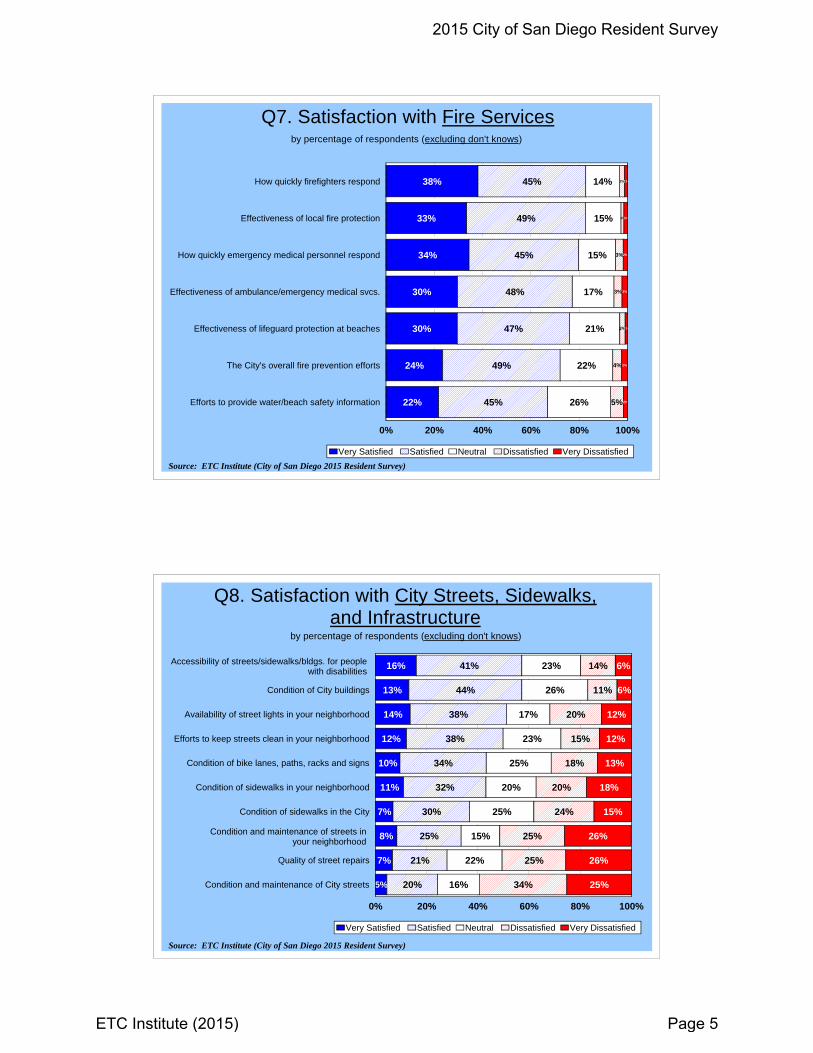
Q7. Satisfaction with Fire Servicesby percentage of respondents (excluding don't knows)
Source: ETC Institute (City of San Diego 2015 Resident Survey)
38%
33%
34%
30%
30%
24%
22%
45%
49%
45%
48%
47%
49%
45%
14%
15%
15%
17%
21%
22%
26%
2%
1%
3%
3%
2%
4%
5%
1%
1%
2%
2%
1%
2%
2%
How quickly firefighters respond
Effectiveness of local fire protection
How quickly emergency medical personnel respond
Effectiveness of ambulance/emergency medical svcs.
Effectiveness of lifeguard protection at beaches
The City's overall fire prevention efforts
Efforts to provide water/beach safety information
0% 20% 40% 60% 80% 100%
Very Satisfied Satisfied Neutral Dissatisfied Very Dissatisfied
Q8. Satisfaction with City Streets, Sidewalks, and Infrastructure
by percentage of respondents (excluding don't knows)
Source: ETC Institute (City of San Diego 2015 Resident Survey)
16%
13%
14%
12%
10%
11%
7%
8%
7%
5%
41%
44%
38%
38%
34%
32%
30%
25%
21%
20%
23%
26%
17%
23%
25%
20%
25%
15%
22%
16%
14%
11%
20%
15%
18%
20%
24%
25%
25%
34%
6%
6%
12%
12%
13%
18%
15%
26%
26%
25%
Condition of City buildings
Availability of street lights in your neighborhood
Efforts to keep streets clean in your neighborhood
Condition of bike lanes, paths, racks and signs
Condition of sidewalks in your neighborhood
Condition of sidewalks in the City
Quality of street repairs
Condition and maintenance of City streets
0% 20% 40% 60% 80% 100%
Very Satisfied Satisfied Neutral Dissatisfied Very Dissatisfied
Accessibility of streets/sidewalks/bldgs. for peoplewith disabilities
Condition and maintenance of streets inyour neighborhood
2015 City of San Diego Resident Survey
ETC Institute (2015) Page 5

Q9. Satisfaction with Solid Waste Servicesby percentage of respondents (excluding don't knows)
Source: ETC Institute (City of San Diego 2015 Resident Survey)
38%
35%
43%
42%
10%
11%
6%
8%
3%
4%
Residential trash collection
Residential recycling services
0% 20% 40% 60% 80% 100%
Very Satisfied Satisfied Neutral Dissatisfied Very Dissatisfied
Q10. Importance of Actions to Support Sustainabilityin the Community
by percentage of respondents (excluding don't knows)
Source: ETC Institute (City of San Diego 2015 Resident Survey)
52%
51%
47%
34%
31%
28%
13%
13%
17%
1%
3%
5%
1%
2%
3%
Preparing for more frequent storms, etc.
Providing opportunities to reduce energy use
Increasing walking, biking & transit use
0% 20% 40% 60% 80% 100%
Very Important Important Somewhat Important Not Important Not at All Important
2015 City of San Diego Resident Survey
ETC Institute (2015) Page 6
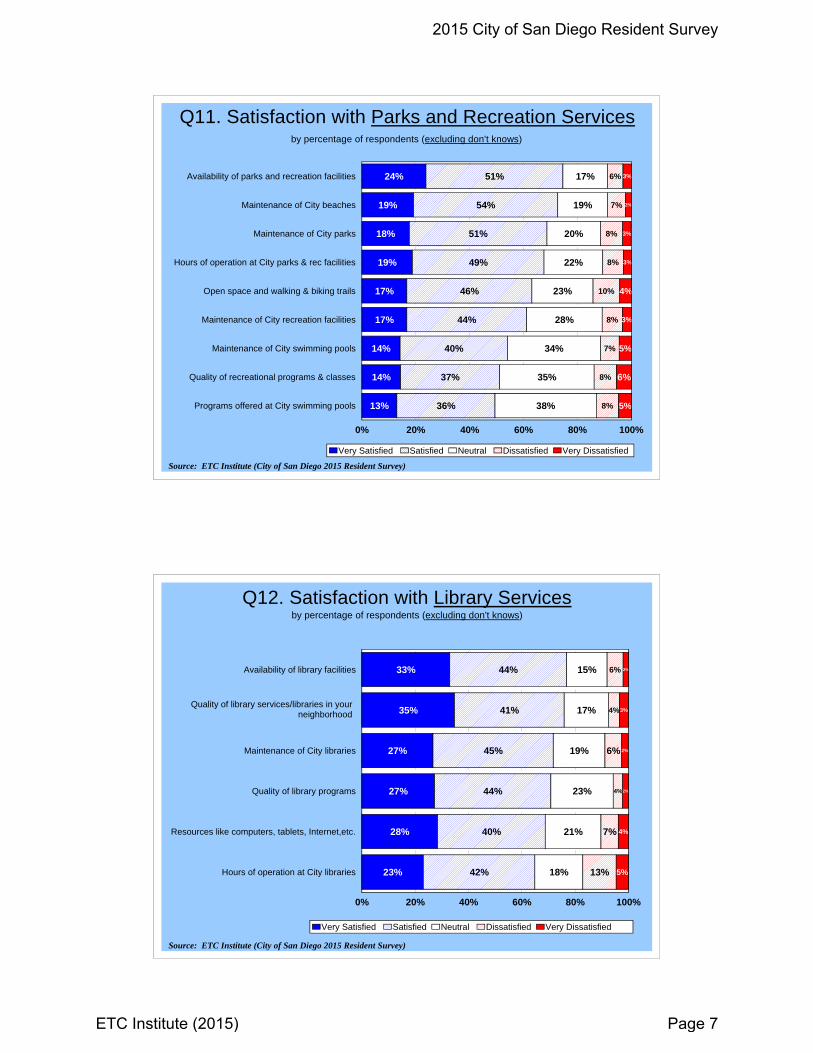
Q11. Satisfaction with Parks and Recreation Servicesby percentage of respondents (excluding don't knows)
Source: ETC Institute (City of San Diego 2015 Resident Survey)
24%
19%
18%
19%
17%
17%
14%
14%
13%
51%
54%
51%
49%
46%
44%
40%
37%
36%
17%
19%
20%
22%
23%
28%
34%
35%
38%
6%
7%
8%
8%
10%
8%
7%
8%
8%
3%
2%
3%
3%
4%
3%
5%
6%
5%
Availability of parks and recreation facilities
Maintenance of City beaches
Maintenance of City parks
Hours of operation at City parks & rec facilities
Open space and walking & biking trails
Maintenance of City recreation facilities
Maintenance of City swimming pools
Quality of recreational programs & classes
Programs offered at City swimming pools
0% 20% 40% 60% 80% 100%
Very Satisfied Satisfied Neutral Dissatisfied Very Dissatisfied
Q12. Satisfaction with Library Servicesby percentage of respondents (excluding don't knows)
Source: ETC Institute (City of San Diego 2015 Resident Survey)
33%
35%
27%
27%
28%
23%
44%
41%
45%
44%
40%
42%
15%
17%
19%
23%
21%
18%
6%
4%
6%
4%
7%
13%
2%
3%
2%
2%
4%
5%
Availability of library facilities
Maintenance of City libraries
Quality of library programs
Resources like computers, tablets, Internet,etc.
Hours of operation at City libraries
0% 20% 40% 60% 80% 100%
Very Satisfied Satisfied Neutral Dissatisfied Very Dissatisfied
Quality of library services/libraries in your neighborhood
2015 City of San Diego Resident Survey
ETC Institute (2015) Page 7

Q13. Satisfaction with Community Engagementby percentage of respondents (excluding don't knows)
Source: ETC Institute (City of San Diego 2015 Resident Survey)
8%
7%
8%
8%
6%
35%
32%
30%
23%
24%
33%
36%
35%
49%
32%
16%
16%
16%
11%
25%
8%
10%
12%
10%
13%
Overall usefulness of the City's website
Access to City officials
The City's televisiion channel (City 24)
0% 20% 40% 60% 80% 100%
Very Satisfied Satisfied Neutral Dissatisfied Very Dissatisfied
Access to information about City programs/services
Outreach efforts to keep public informed about capital projects
Q14. Satisfaction with Other Servicesby percentage of respondents (excluding don't knows)
Source: ETC Institute (City of San Diego 2015 Resident Survey)
16%
16%
14%
10%
12%
7%
5%
9%
4%
4%
4%
5%
5%
3%
42%
42%
43%
40%
34%
31%
25%
19%
21%
21%
20%
16%
16%
13%
28%
30%
31%
33%
37%
31%
37%
33%
30%
26%
35%
38%
31%
23%
7%
7%
7%
10%
9%
20%
19%
26%
27%
26%
25%
23%
29%
32%
6%
6%
5%
7%
8%
12%
14%
14%
18%
23%
17%
17%
19%
29%
Online services
Quality/variety of entertainment, expositions, etc
Music, dance, theater performances, etc.
Historic preservation efforts
Quality of services to people with disabilities
Graffiti removal
Gang prevention efforts
Blight
Efforts to plan for future growth
Traffic congestion on City streets
Efforts to support job creation
Ease of obtaining permits
Efforts to address homelessness
0% 20% 40% 60% 80% 100%
Very Satisfied Satisfied Neutral Dissatisfied Very Dissatisfied
Efforts to assist low to moderate-income residents/ communities
2015 City of San Diego Resident Survey
ETC Institute (2015) Page 8
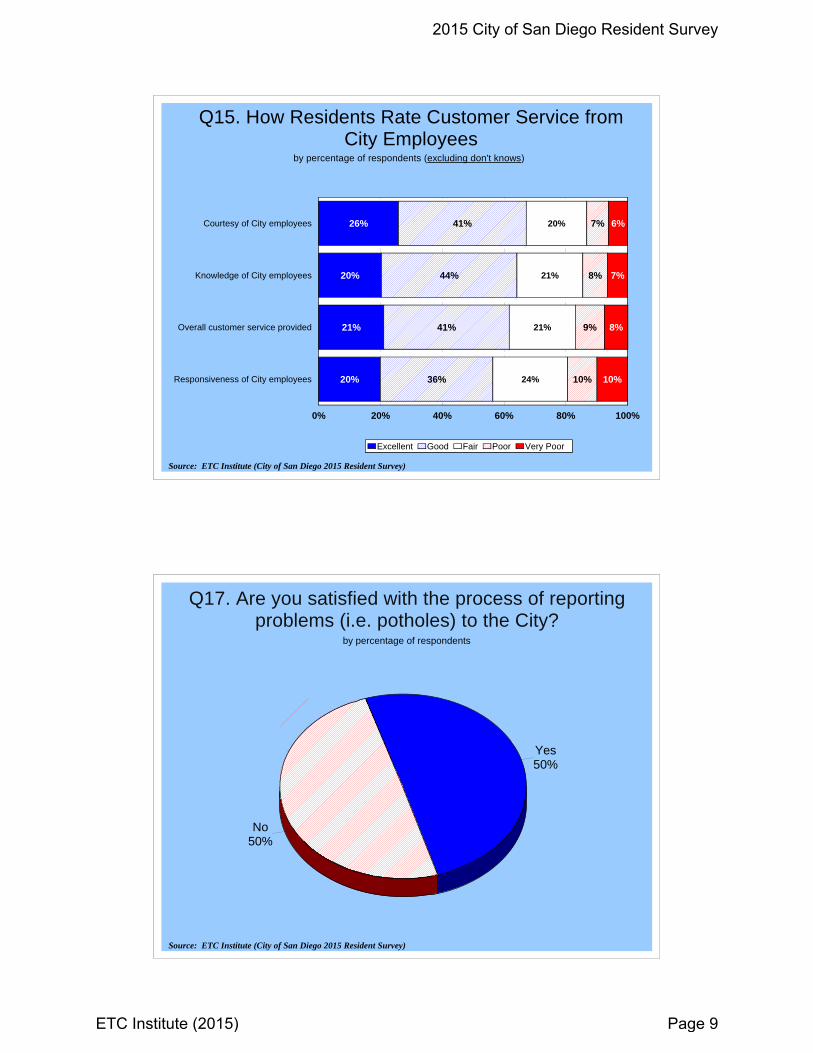
26%
20%
21%
20%
41%
44%
41%
36%
20%
21%
21%
24%
7%
8%
9%
10%
6%
7%
8%
10%
Courtesy of City employees
Knowledge of City employees
Overall customer service provided
Responsiveness of City employees
0% 20% 40% 60% 80% 100%
Excellent Good Fair Poor Very Poor
Q15. How Residents Rate Customer Service from City Employees
by percentage of respondents (excluding don't knows)
Source: ETC Institute (City of San Diego 2015 Resident Survey)
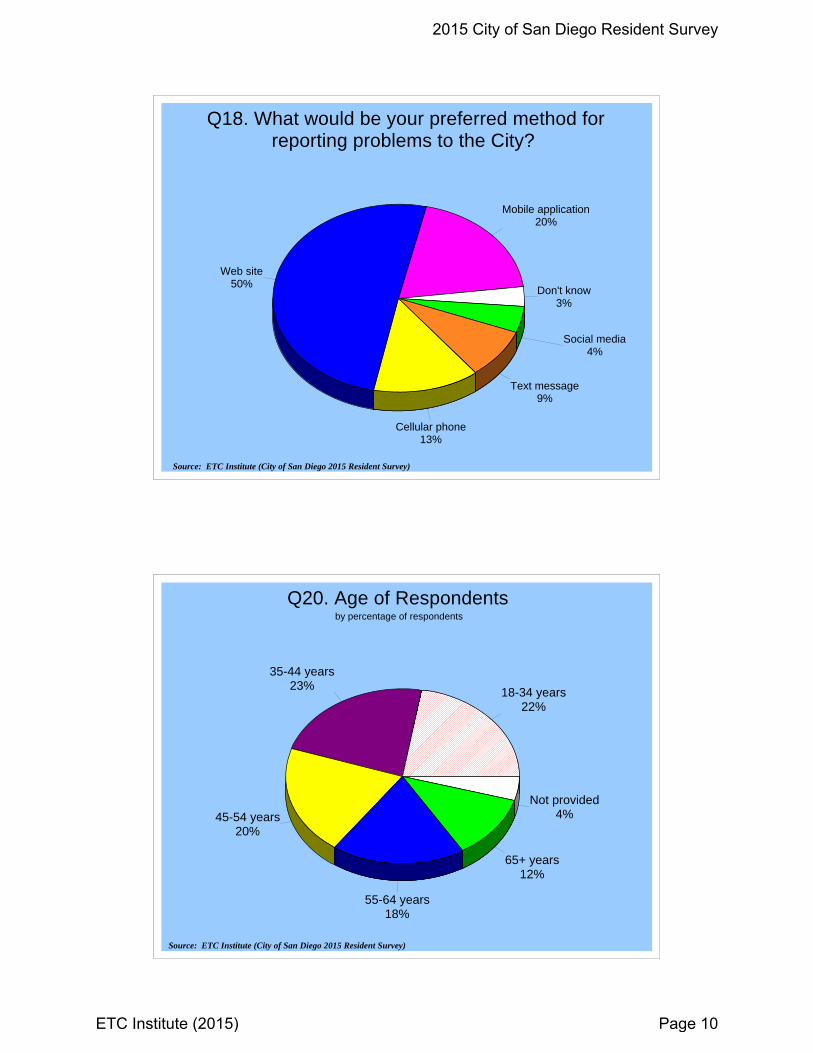
Q17. Are you satisfied with the process of reporting problems (i.e. potholes) to the City?
by percentage of respondents
Yes50%
No50%
Source: ETC Institute (City of San Diego 2015 Resident Survey)
2015 City of San Diego Resident Survey
ETC Institute (2015) Page 9
Q18. What would be your preferred method for reporting problems to the City?
Source: ETC Institute (City of San Diego 2015 Resident Survey)
Mobile application20%
Web site50%
Cellular phone13%
Text message9%
Social media4%
Don't know3%
18-34 years22%
35-44 years23%
45-54 years20%
55-64 years18%
65+ years12%
Not provided4%
Q20. Age of Respondentsby percentage of respondents
Source: ETC Institute (City of San Diego 2015 Resident Survey)
2015 City of San Diego Resident Survey
ETC Institute (2015) Page 10
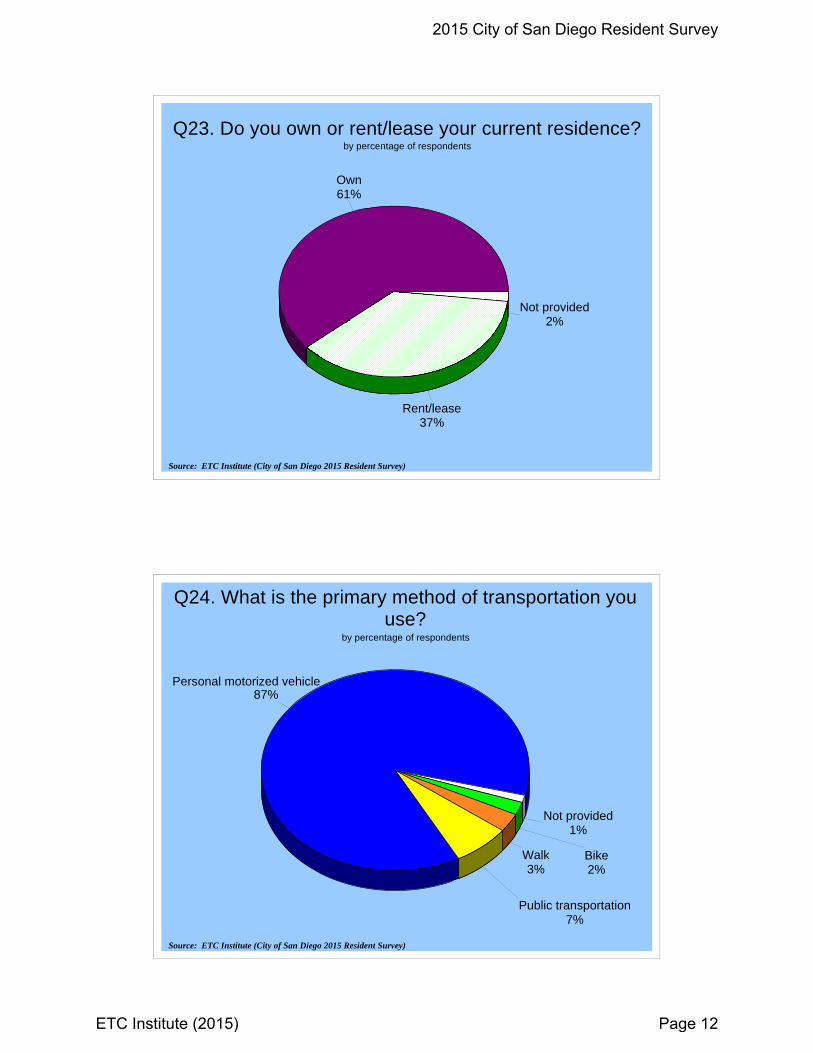
Less than 5 years11%
5 to 10 years13%
11 to 20 years22%
21 to 30 years17%
More than 30 years32%
Not provided5%
Q21. Number of Years Residents Have Lived in San Diego
by percentage of respondents
Source: ETC Institute (City of San Diego 2015 Resident Survey)
Q22. Total Annual Household Income of Respondents by percentage of respondents
Less than $25,00010%
$25,000-$49,99914%
$50,000-$74,99916%
$75,000-$99,99916%
$100,000-$149,99920%
$150,000+17%
Not provided7%
Source: ETC Institute (City of San Diego 2015 Resident Survey)
2015 City of San Diego Resident Survey
ETC Institute (2015) Page 11
Q23. Do you own or rent/lease your current residence?by percentage of respondents
Own61%
Rent/lease37%
Not provided2%
Source: ETC Institute (City of San Diego 2015 Resident Survey)
87%
Public transportation7%
Walk3%
Bike2%
Not provided1%
Q24. What is the primary method of transportation you use?
by percentage of respondents
Source: ETC Institute (City of San Diego 2015 Resident Survey)
Personal motorized vehicle
2015 City of San Diego Resident Survey
ETC Institute (2015) Page 12
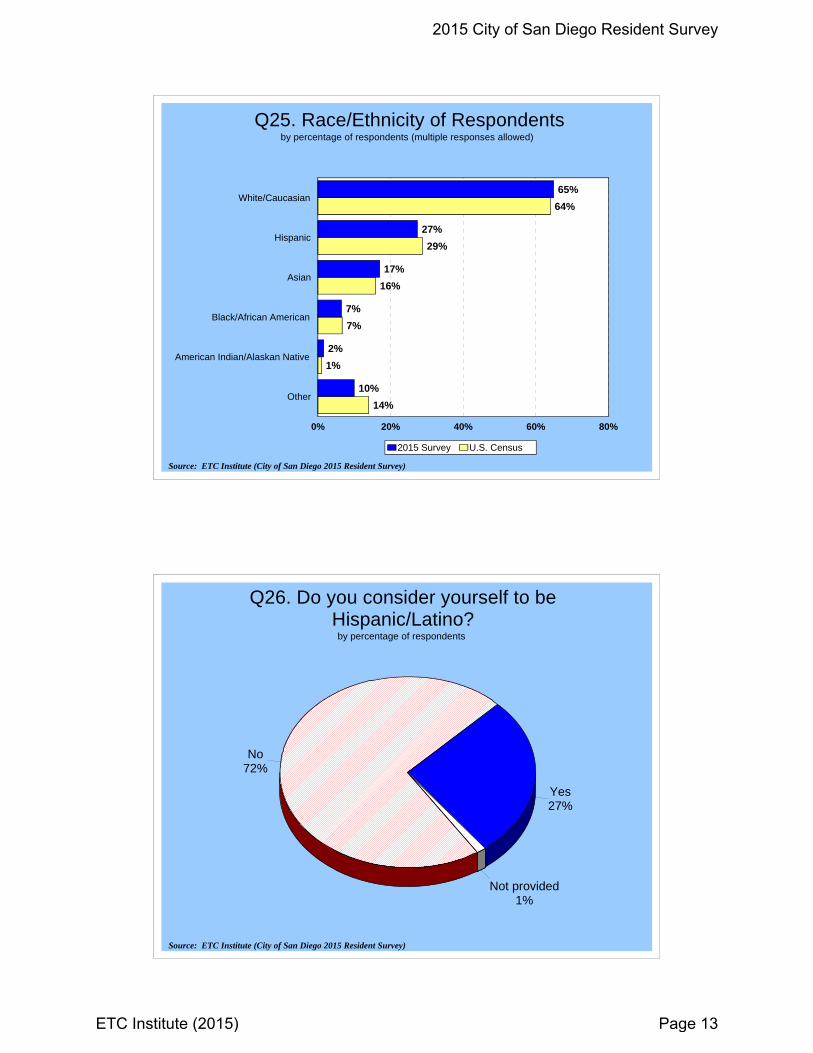
by percentage of respondents (multiple responses allowed)
Q25. Race/Ethnicity of Respondents
65%
27%
17%
7%
2%
10%
64%
29%
16%
7%
1%
14%
White/Caucasian
Hispanic
Asian
Black/African American
American Indian/Alaskan Native
Other
0% 20% 40% 60% 80%
2015 Survey U.S. Census
Source: ETC Institute (City of San Diego 2015 Resident Survey)
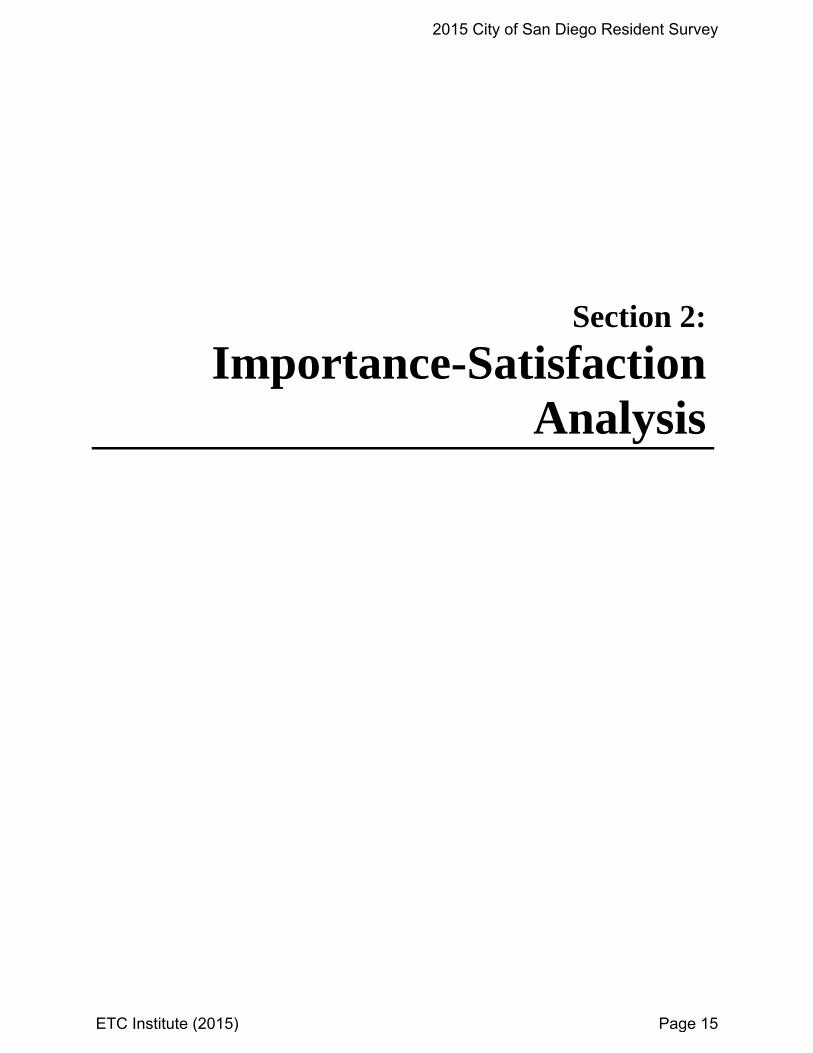
Q26. Do you consider yourself to be Hispanic/Latino?
Yes27%
No72%
Not provided1%
by percentage of respondents
Source: ETC Institute (City of San Diego 2015 Resident Survey)
2015 City of San Diego Resident Survey
ETC Institute (2015) Page 13

Q27. Gender of Respondentsby percentage of respondents
Male50.4%
Female48.7%
Other0.3%
Not provided0.6%
Source: ETC Institute (City of San Diego 2015 Resident Survey)
2015 City of San Diego Resident Survey
ETC Institute (2015) Page 14
Section 2:
Importance-Satisfaction Analysis
2015 City of San Diego Resident Survey
ETC Institute (2015) Page 15

Importan
ce‐Satisfaction Analysis
Importance‐Satisfaction Analysis 2015 City of San Diego Resident Survey
Overview Today, city officials have limited resources which need to be targeted to activities that are of the most benefit to their citizens. Two of the most important criteria for decision making are (1) to target resources toward services of the highest importance to citizens; and (2) to target resources toward those services where citizens are the least satisfied. The Importance‐Satisfaction (IS) rating is a unique tool that allows public officials to better understand both of these highly important decision making criteria for each of the services they are providing. The Importance‐Satisfaction rating is based on the concept that cities will maximize overall citizen satisfaction by emphasizing improvements in those service categories where the level of satisfaction is relatively low and the perceived importance of the service is relatively high.
Methodology The rating is calculated by summing the percentage of responses for items selected as the most important services for the City to emphasize over the next two years. This sum is then multiplied by 1 minus the percentage of respondents that indicated they were positively satisfied with the City's performance in the related area (the sum of the ratings of 4 and 5 on a 5‐point scale excluding “don't know” responses). “Don't know” responses are excluded from the calculation to ensure that the satisfaction ratings among service categories are comparable. [IS=Importance x (1‐Satisfaction)]. Example of the Calculation. Respondents were asked to identify the Major Categories of City services they thought were the most important for City leaders to emphasize over the next two years. Fifty‐eight percent (58%) selected “maintenance of streets, sidewalks and infrastructure” as one of the most important Major City services for the City to emphasize over the next two years.
2015 City of San Diego Resident Survey
ETC Institute (2015) Page 16
Importan
ce‐Satisfaction Analysis
With regard to satisfaction, 24% of the residents surveyed rated their overall satisfaction with “maintenance of streets, sidewalks and infrastructure” as a “4” or a “5” on a 5‐point scale (where “5” means “very satisfied”). The I‐S rating for “maintenance of streets, sidewalks and infrastructure” was calculated by multiplying the sum of the most important percentages by 1 minus the sum of the satisfaction percentages. In this example, 58% was multiplied by 76% (1‐0.24). This calculation yielded an I‐S rating of 0.4400, which ranked first out of fifteen Major City Services. The maximum rating is 1.00 and would be achieved when 100% of the respondents select an item as one of their top three choices to emphasize over the next two years and 0% indicate that they are positively satisfied with the delivery of the service. The lowest rating is 0.00 and could be achieved under either one of the following two situations:
if 100% of the respondents were positively satisfied with the delivery of the service
if none (0%) of the respondents selected the service as one of the three most important areas for the City to emphasize over the next two years.
Interpreting the Ratings Ratings that are greater than or equal to 0.20 identify areas that should receive significantly more emphasis over the next two years. Ratings from .10 to .20 identify service areas that should receive increased emphasis. Ratings less than .10 should continue to receive the current level of emphasis.
Definitely Increase Emphasis (IS>=0.20)
Increase Current Emphasis (0.10<=IS<0.20)
Maintain Current Emphasis (IS<0.10) The results for San Diego are provided on the following page.
2015 City of San Diego Resident Survey
ETC Institute (2015) Page 17
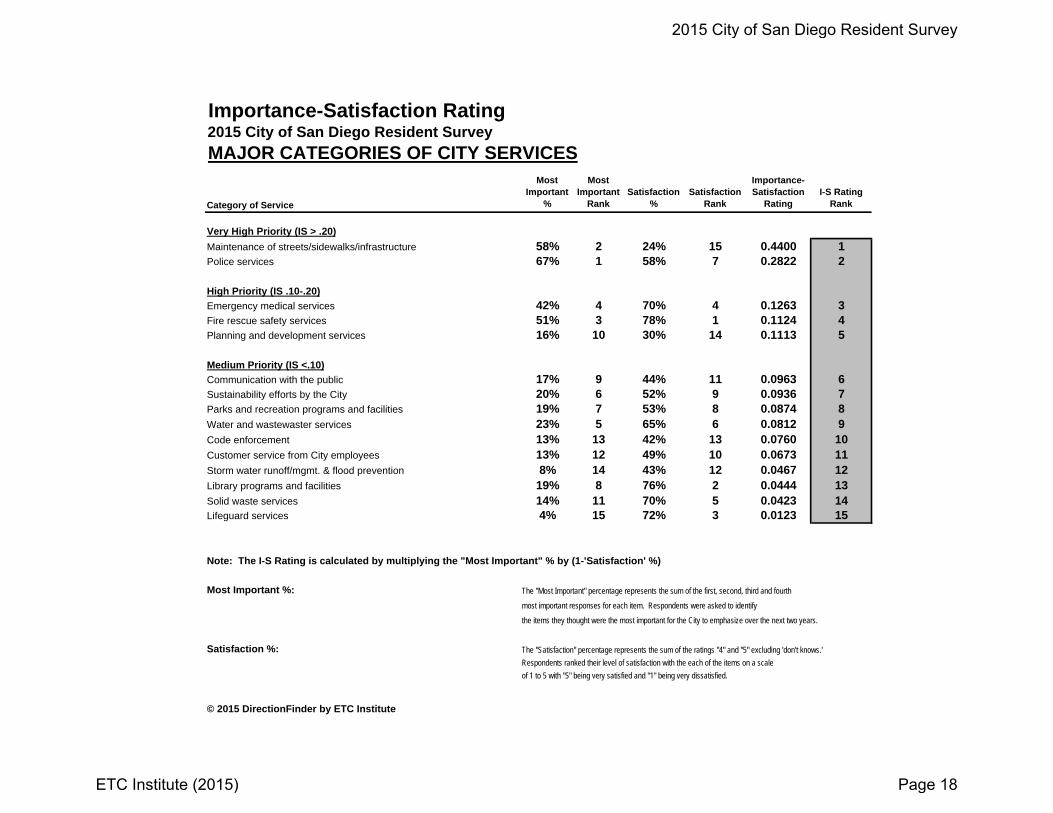
Importance-Satisfaction Rating2015 City of San Diego Resident Survey
MAJOR CATEGORIES OF CITY SERVICES
Category of Service
Most Important
%
Most Important
RankSatisfaction
%Satisfaction
Rank
Importance-Satisfaction
RatingI-S Rating
Rank
Very High Priority (IS > .20)
Maintenance of streets/sidewalks/infrastructure 58% 2 24% 15 0.4400 1Police services 67% 1 58% 7 0.2822 2
High Priority (IS .10-.20)
Emergency medical services 42% 4 70% 4 0.1263 3Fire rescue safety services 51% 3 78% 1 0.1124 4Planning and development services 16% 10 30% 14 0.1113 5
Medium Priority (IS <.10)
Communication with the public 17% 9 44% 11 0.0963 6Sustainability efforts by the City 20% 6 52% 9 0.0936 7Parks and recreation programs and facilities 19% 7 53% 8 0.0874 8Water and wastewaster services 23% 5 65% 6 0.0812 9Code enforcement 13% 13 42% 13 0.0760 10Customer service from City employees 13% 12 49% 10 0.0673 11Storm water runoff/mgmt. & flood prevention 8% 14 43% 12 0.0467 12Library programs and facilities 19% 8 76% 2 0.0444 13Solid waste services 14% 11 70% 5 0.0423 14Lifeguard services 4% 15 72% 3 0.0123 15
Note: The I-S Rating is calculated by multiplying the "Most Important" % by (1-'Satisfaction' %)
Most Important %: The "Most Important" percentage represents the sum of the first, second, third and fourth
most important responses for each item. Respondents were asked to identify
the items they thought were the most important for the City to emphasize over the next two years.
Satisfaction %: The "Satisfaction" percentage represents the sum of the ratings "4" and "5" excluding 'don't knows.'Respondents ranked their level of satisfaction with the each of the items on a scaleof 1 to 5 with "5" being very satisfied and "1" being very dissatisfied.
© 2015 DirectionFinder by ETC Institute
2015 City of San Diego Resident Survey
ETC Institute (2015) Page 18
Importan
ce‐Satisfaction Analysis
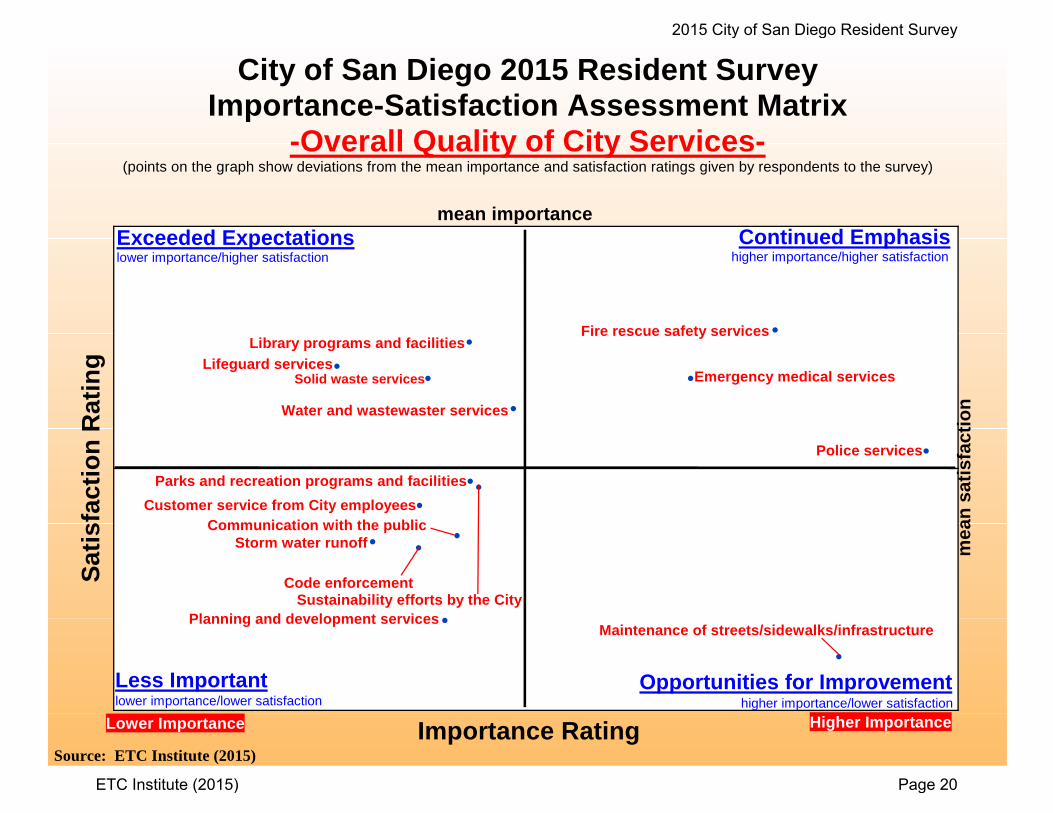
Importance‐Satisfaction Matrix Analysis The Importance‐Satisfaction rating is based on the concept that public agencies will maximize overall customer satisfaction by emphasizing improvements in those areas where the level of satisfaction is relatively low and the perceived importance of the service is relatively high. ETC Institute developed an Importance‐Satisfaction Matrix to display the perceived importance of major services that were assessed on the survey against the perceived quality of service delivery. The two axes on the matrix represent Satisfaction (vertical) and relative Importance (horizontal). The I‐S (Importance‐Satisfaction) matrix should be interpreted as follows.
Continued Emphasis (above average importance and above average satisfaction). This area shows where the City is meeting customer expectations. Items in this area have a significant impact on the customer’s overall level of satisfaction. The City should maintain (or slightly increase) emphasis on items in this area.
Exceeding Expectations (below average importance and above average
satisfaction). This area shows where the City is performing significantly better than customers expect the City to perform. Items in this area do not significantly affect the overall level of satisfaction that residents have with City services. The City should maintain (or slightly decrease) emphasis on items in this area.
Opportunities for Improvement (above average importance and below average
satisfaction). This area shows where the City is not performing as well as residents expect the City to perform. This area has a significant impact on customer satisfaction, and the City should DEFINITELY increase emphasis on items in this area.
Less Important (below average importance and below average satisfaction).
This area shows where the City is not performing well relative to the City’s performance in other areas; however, this area is generally considered to be less important to residents. This area does not significantly affect overall satisfaction with City services because the items are less important to residents. The agency should maintain current levels of emphasis on items in this area.
A matrix chart showing the results for San Diego is provided on the following page.
2015 City of San Diego Resident Survey
ETC Institute (2015) Page 19
Sa t
isf a
ctio
n R
atin
g
!
!
!
!
!
!!
!
!
!
!
!
!
!
!
me a
n s
a tis
fact
ion
Opportunities for Improvement
City of San Diego 2015 Resident Survey Importance-Satisfaction Assessment Matrix
-Overall Quality of City Services-(points on the graph show deviations from the mean importance and satisfaction ratings given by respondents to the survey)
mean importance
Importance RatingLower Importance Higher Importance
lower importance/higher satisfaction higher importance/higher satisfaction
lower importance/lower satisfaction higher importance/lower satisfaction
Exceeded Expectations
Less Important
Continued Emphasis
Source: ETC Institute (2015)
Code enforcement
Communication with the publicCustomer service from City employees
Emergency medical services
Fire rescue safety servicesLibrary programs and facilities
Lifeguard services
Maintenance of streets/sidewalks/infrastructure
Parks and recreation programs and facilities
Planning and development services
Police services
Solid waste services
Storm water runoff
Sustainability efforts by the City
Water and wastewaster services
2015 City of San Diego Resident Survey
ETC Institute (2015) Page 20
Section 3:
Tabular Data
2015 City of San Diego Resident Survey
ETC Institute (2015) Page 21
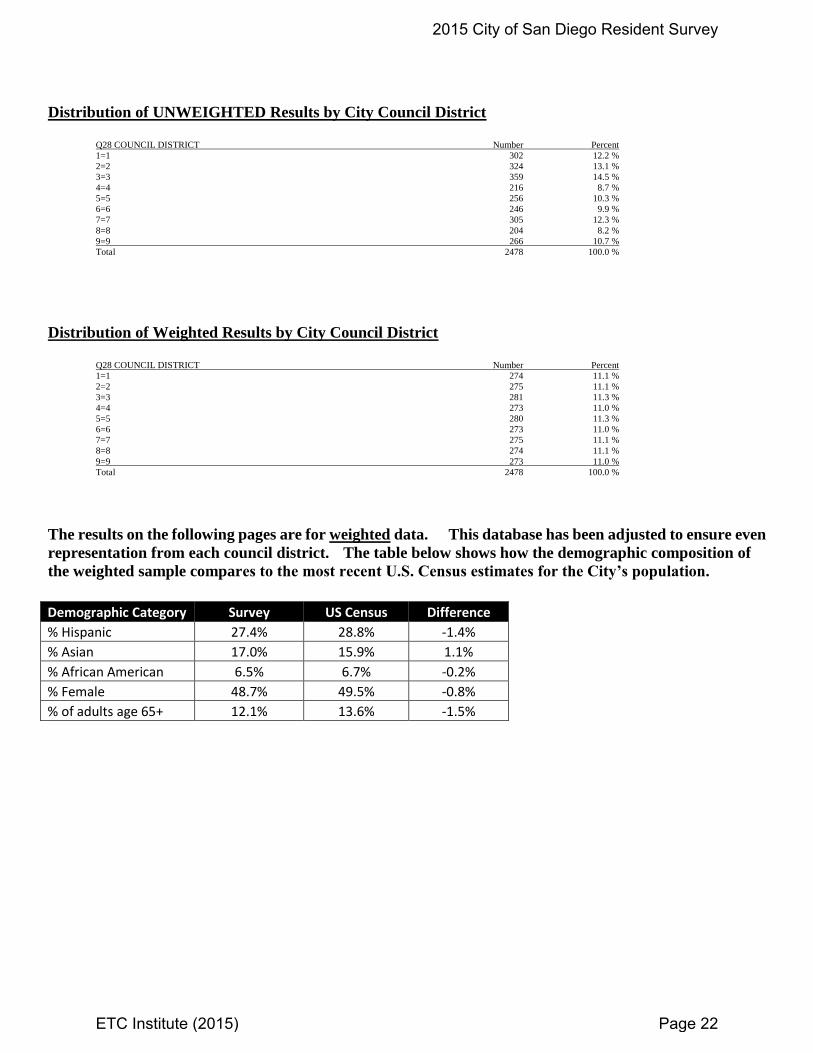
Distribution of UNWEIGHTED Results by City Council District
Q28 COUNCIL DISTRICT Number Percent
1=1 302 12.2 %
2=2 324 13.1 %
3=3 359 14.5 %
4=4 216 8.7 %
5=5 256 10.3 %
6=6 246 9.9 %
7=7 305 12.3 %
8=8 204 8.2 %
9=9 266 10.7 %
Total 2478 100.0 %
Distribution of Weighted Results by City Council District
Q28 COUNCIL DISTRICT Number Percent
1=1 274 11.1 %
2=2 275 11.1 %
3=3 281 11.3 %
4=4 273 11.0 %
5=5 280 11.3 %
6=6 273 11.0 %
7=7 275 11.1 %
8=8 274 11.1 %
9=9 273 11.0 %
Total 2478 100.0 %
The results on the following pages are for weighted data. This database has been adjusted to ensure even
representation from each council district. The table below shows how the demographic composition of
the weighted sample compares to the most recent U.S. Census estimates for the City’s population.
Demographic Category Survey US Census Difference
% Hispanic 27.4% 28.8% -1.4%
% Asian 17.0% 15.9% 1.1%
% African American 6.5% 6.7% -0.2%
% Female 48.7% 49.5% -0.8%
% of adults age 65+ 12.1% 13.6% -1.5%
2015 City of San Diego Resident Survey
ETC Institute (2015) Page 22

Q1. Living and Working in San Diego. Using a scale of 1 to 5, where 5 means "Excellent" and 1 means
"Poor", please rate the City of San Diego, California, with regard to each of the following:
(N=2478)
Excellent Good Fair Poor Very Poor Don't Know
Q1 RATINGS FOR THE CITY 1 As a place
to live 47.3% 38.6% 10.2% 1.7% 1.3% 0.8%
Q1 RATINGS FOR THE CITY 2 As a place
to raise a family 28.9% 41.6% 16.1% 4.3% 2.3% 6.8%
Q1 RATINGS FOR THE CITY 3 As a place
to retire 24.9% 26.5% 24.0% 11.3% 6.2% 7.1%
Q1 RATINGS FOR THE CITY 4 As a place
to start a business 10.9% 20.5% 27.0% 11.9% 8.5% 21.2%
Q1 RATINGS FOR THE CITY 5 As a place
to start a career 15.7% 31.9% 28.8% 10.7% 5.5% 7.5%
Q1 RATINGS FOR THE CITY 6 As a place
to work 21.6% 40.6% 24.8% 6.5% 3.4% 3.1%
EXCLUDING DON’T KNOWS
Q1. Living and Working in San Diego. Using a scale of 1 to 5, where 5 means "Excellent" and 1 means
"Poor", please rate the City of San Diego, California, with regard to each of the following: (EXCLUDING
DON'T KNOWS)
(N=2478)
Excellent Good Fair Poor Very Poor
Q1 RATINGS FOR THE CITY 1 As a place to live 47.7% 38.9% 10.3% 1.8% 1.3%
Q1 RATINGS FOR THE CITY 2 As a place to raise a family 31.0% 44.6% 17.2% 4.6% 2.5%
Q1 RATINGS FOR THE CITY 3 As a place to retire 26.8% 28.6% 25.8% 12.2% 6.7%
Q1 RATINGS FOR THE CITY 4 As a place to start a business 13.9% 26.0% 34.3% 15.1% 10.8%
Q1 RATINGS FOR THE CITY 5 As a place to start a career 17.0% 34.5% 31.1% 11.5% 5.9%
Q1 RATINGS FOR THE CITY 6 As a place to work 22.3% 41.9% 25.6% 6.7% 3.5%
2015 City of San Diego Resident Survey
ETC Institute (2015) Page 23

Q2. Perceptions of the Community. Please rate your satisfaction with the following items that may
influence your perceptions of the City of San Diego, California:
(N=2478)
Very Satisfied Satisfied Neutral Dissatisfied Very Dissatisfied Don't Know
Q2 PERCEPTIONS 1 Feeling of safety in
the City 16.2% 53.9% 19.7% 7.5% 2.1% 0.6%
Q2 PERCEPTIONS 2 Feeling of safety in
your neighborhood 28.7% 44.0% 13.2% 9.0% 4.4% 0.8%
Q2 PERCEPTIONS 3 Financial stability of
the City government 5.3% 27.6% 31.4% 19.9% 8.8% 6.9%
Q2 PERCEPTIONS 4 Quality of life in the
City 24.3% 45.2% 18.6% 8.1% 2.5% 1.3%
Q2 PERCEPTIONS 5 Quality of life in the
City 21.5% 48.3% 17.7% 9.0% 2.8% 0.6%
Q2 PERCEPTIONS 6 Quality of services
provided by the City 9.9% 35.9% 27.2% 16.9% 8.4% 1.7%
Q2 PERCEPTIONS 7 Value that you
receive for your City tax dollars and fees 6.3% 26.2% 29.5% 20.8% 14.5% 2.7%
EXCLUDING DON’T KNOWS
Q2. Perceptions of the Community. Please rate your satisfaction with the following items that may
influence your perceptions of the City of San Diego, California: (EXCLUDING DON'T KNOWS)
(N=2478)
Very Satisfied Satisfied Neutral Dissatisfied Very Dissatisfied
Q2 PERCEPTIONS 1 Feeling of safety in the City 16.3% 54.2% 19.8% 7.6% 2.1%
Q2 PERCEPTIONS 2 Feeling of safety in your neighborhood 28.9% 44.3% 13.3% 9.0% 4.4%
Q2 PERCEPTIONS 3 Financial stability of the City
government 5.7% 29.7% 33.8% 21.4% 9.4%
Q2 PERCEPTIONS 4 Quality of life in the City 24.6% 45.7% 18.9% 8.2% 2.5%
Q2 PERCEPTIONS 5 Quality of life in the City 21.7% 48.6% 17.8% 9.1% 2.8%
Q2 PERCEPTIONS 6 Quality of services provided by the
City 10.1% 36.5% 27.7% 17.2% 8.6%
Q2 PERCEPTIONS 7 Value that you receive for your City tax
dollars and fees 6.5% 26.9% 30.3% 21.4% 14.9%
2015 City of San Diego Resident Survey
ETC Institute (2015) Page 24

Q3. Satisfaction with the Overall Quality of City Services. Please rate your satisfaction with the overall
quality of the following MAJOR CATEGORIES of services provided by the City of San Diego:
(N=2478)
Very Satisfied Satisfied Neutral Dissatisfied Very Dissatisfied Don't Know
Q3 OVERALL RATINGS 1 Code
enforcement 5.6% 28.3% 28.2% 13.6% 6.5% 17.8%
Q3 OVERALL RATINGS 2
Communication with the public 5.2% 35.0% 31.2% 15.8% 5.8% 7.0%
Q3 OVERALL RATINGS 3 Customer
service from City employees 9.0% 34.9% 26.7% 12.2% 7.1% 10.1%
Q3 OVERALL RATINGS 4 Emergency
medical services 19.8% 33.4% 16.9% 3.3% 2.1% 24.5%
Q3 OVERALL RATINGS 5 Fire rescue
safety services 25.6% 36.1% 14.0% 2.5% 1.1% 20.8%
Q3 OVERALL RATINGS 6 Library
programs and facilities 31.4% 40.1% 14.5% 5.5% 2.5% 6.0%
Q3 OVERALL RATINGS 7 Lifeguard
services 21.9% 32.6% 16.7% 2.6% 1.5% 24.7%
Q3 OVERALL RATINGS 8 Maintenance of
City streets, sidewalks, and infrastructure 4.6% 18.4% 16.9% 30.2% 28.0% 1.8%
Q3 OVERALL RATINGS 9 Parks and
recreation programs and facilities 12.4% 37.4% 26.1% 12.1% 6.7% 5.2%
Q3 OVERALL RATINGS 10 Planning and
development services 4.5% 19.3% 28.7% 15.3% 12.2% 19.9%
Q3 OVERALL RATINGS 11 Police
services 14.5% 39.7% 23.5% 9.2% 6.8% 6.3%
Q3 OVERALL RATINGS 12 Solid waste
services (e.g., residential trash and recycling
services) 21.3% 46.2% 16.3% 8.4% 4.3% 3.6%
Q3 OVERALL RATINGS 13 Storm water
runoff/storm water management and flood
prevention services 9.0% 29.6% 25.8% 16.2% 9.2% 10.3%
Q3 OVERALL RATINGS 14
Sustainability efforts by the City to help
preserve and protect the environment (e.g.,
recycling, saving energy, protecting water/air
quality, promoting walking/biking/public
transit) 11.9% 36.5% 26.8% 12.1% 7.1% 5.7%
Q3 OVERALL RATINGS 15 Water and
wastewater services (e.g., reliability of
individual service at your home) 18.8% 42.8% 22.2% 6.0% 5.3% 4.9%
2015 City of San Diego Resident Survey
ETC Institute (2015) Page 25
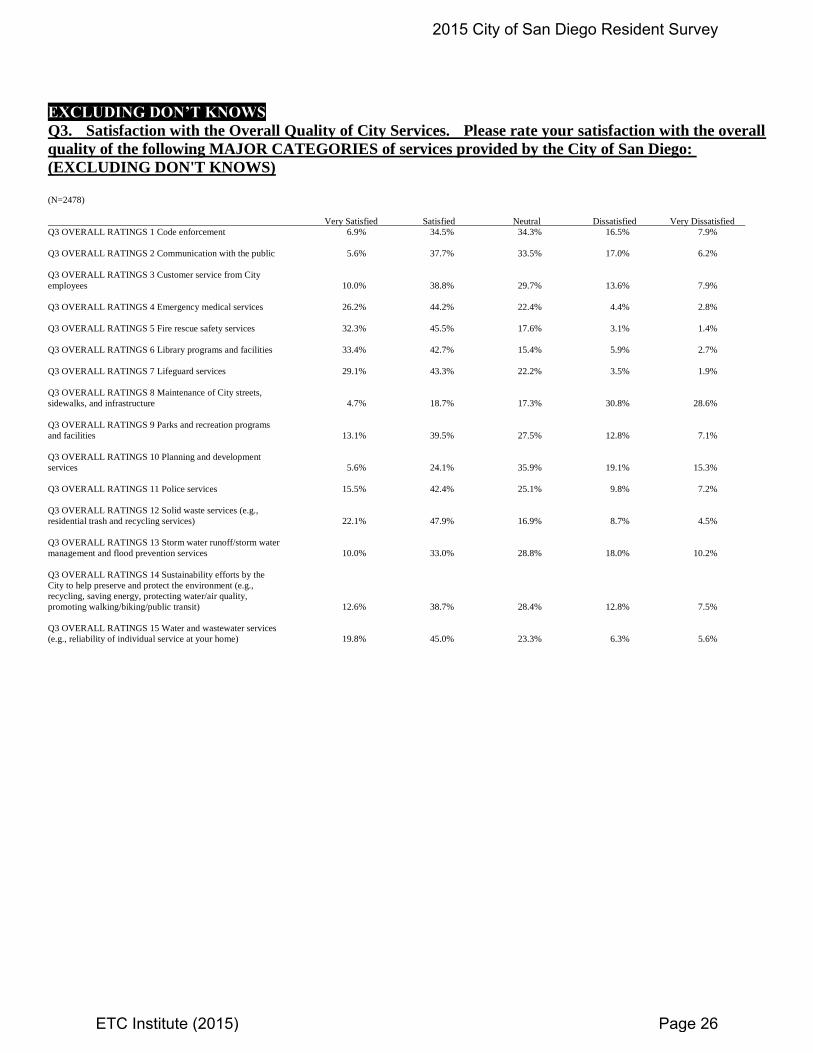
EXCLUDING DON’T KNOWS
Q3. Satisfaction with the Overall Quality of City Services. Please rate your satisfaction with the overall
quality of the following MAJOR CATEGORIES of services provided by the City of San Diego:
(EXCLUDING DON'T KNOWS)
(N=2478)
Very Satisfied Satisfied Neutral Dissatisfied Very Dissatisfied
Q3 OVERALL RATINGS 1 Code enforcement 6.9% 34.5% 34.3% 16.5% 7.9%
Q3 OVERALL RATINGS 2 Communication with the public 5.6% 37.7% 33.5% 17.0% 6.2%
Q3 OVERALL RATINGS 3 Customer service from City
employees 10.0% 38.8% 29.7% 13.6% 7.9%
Q3 OVERALL RATINGS 4 Emergency medical services 26.2% 44.2% 22.4% 4.4% 2.8%
Q3 OVERALL RATINGS 5 Fire rescue safety services 32.3% 45.5% 17.6% 3.1% 1.4%
Q3 OVERALL RATINGS 6 Library programs and facilities 33.4% 42.7% 15.4% 5.9% 2.7%
Q3 OVERALL RATINGS 7 Lifeguard services 29.1% 43.3% 22.2% 3.5% 1.9%
Q3 OVERALL RATINGS 8 Maintenance of City streets,
sidewalks, and infrastructure 4.7% 18.7% 17.3% 30.8% 28.6%
Q3 OVERALL RATINGS 9 Parks and recreation programs
and facilities 13.1% 39.5% 27.5% 12.8% 7.1%
Q3 OVERALL RATINGS 10 Planning and development
services 5.6% 24.1% 35.9% 19.1% 15.3%
Q3 OVERALL RATINGS 11 Police services 15.5% 42.4% 25.1% 9.8% 7.2%
Q3 OVERALL RATINGS 12 Solid waste services (e.g.,
residential trash and recycling services) 22.1% 47.9% 16.9% 8.7% 4.5%
Q3 OVERALL RATINGS 13 Storm water runoff/storm water
management and flood prevention services 10.0% 33.0% 28.8% 18.0% 10.2%
Q3 OVERALL RATINGS 14 Sustainability efforts by the
City to help preserve and protect the environment (e.g.,
recycling, saving energy, protecting water/air quality,
promoting walking/biking/public transit) 12.6% 38.7% 28.4% 12.8% 7.5%
Q3 OVERALL RATINGS 15 Water and wastewater services
(e.g., reliability of individual service at your home) 19.8% 45.0% 23.3% 6.3% 5.6%
2015 City of San Diego Resident Survey
ETC Institute (2015) Page 26
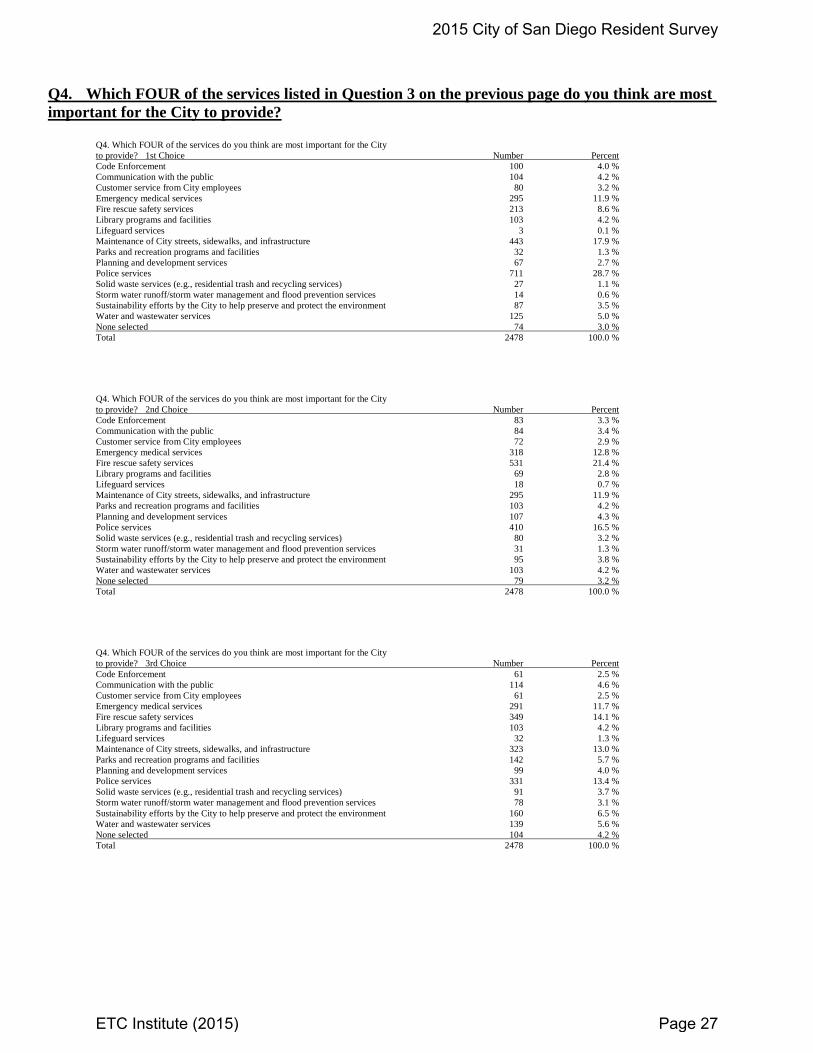
Q4. Which FOUR of the services listed in Question 3 on the previous page do you think are most
important for the City to provide?
Q4. Which FOUR of the services do you think are most important for the City
to provide? 1st Choice Number Percent
Code Enforcement 100 4.0 %
Communication with the public 104 4.2 %
Customer service from City employees 80 3.2 %
Emergency medical services 295 11.9 %
Fire rescue safety services 213 8.6 %
Library programs and facilities 103 4.2 %
Lifeguard services 3 0.1 %
Maintenance of City streets, sidewalks, and infrastructure 443 17.9 %
Parks and recreation programs and facilities 32 1.3 %
Planning and development services 67 2.7 %
Police services 711 28.7 %
Solid waste services (e.g., residential trash and recycling services) 27 1.1 %
Storm water runoff/storm water management and flood prevention services 14 0.6 %
Sustainability efforts by the City to help preserve and protect the environment 87 3.5 %
Water and wastewater services 125 5.0 %
None selected 74 3.0 %
Total 2478 100.0 %
Q4. Which FOUR of the services do you think are most important for the City
to provide? 2nd Choice Number Percent
Code Enforcement 83 3.3 %
Communication with the public 84 3.4 %
Customer service from City employees 72 2.9 %
Emergency medical services 318 12.8 %
Fire rescue safety services 531 21.4 %
Library programs and facilities 69 2.8 %
Lifeguard services 18 0.7 %
Maintenance of City streets, sidewalks, and infrastructure 295 11.9 %
Parks and recreation programs and facilities 103 4.2 %
Planning and development services 107 4.3 %
Police services 410 16.5 %
Solid waste services (e.g., residential trash and recycling services) 80 3.2 %
Storm water runoff/storm water management and flood prevention services 31 1.3 %
Sustainability efforts by the City to help preserve and protect the environment 95 3.8 %
Water and wastewater services 103 4.2 %
None selected 79 3.2 %
Total 2478 100.0 %
Q4. Which FOUR of the services do you think are most important for the City
to provide? 3rd Choice Number Percent
Code Enforcement 61 2.5 %
Communication with the public 114 4.6 %
Customer service from City employees 61 2.5 %
Emergency medical services 291 11.7 %
Fire rescue safety services 349 14.1 %
Library programs and facilities 103 4.2 %
Lifeguard services 32 1.3 %
Maintenance of City streets, sidewalks, and infrastructure 323 13.0 %
Parks and recreation programs and facilities 142 5.7 %
Planning and development services 99 4.0 %
Police services 331 13.4 %
Solid waste services (e.g., residential trash and recycling services) 91 3.7 %
Storm water runoff/storm water management and flood prevention services 78 3.1 %
Sustainability efforts by the City to help preserve and protect the environment 160 6.5 %
Water and wastewater services 139 5.6 %
None selected 104 4.2 %
Total 2478 100.0 %
2015 City of San Diego Resident Survey
ETC Institute (2015) Page 27
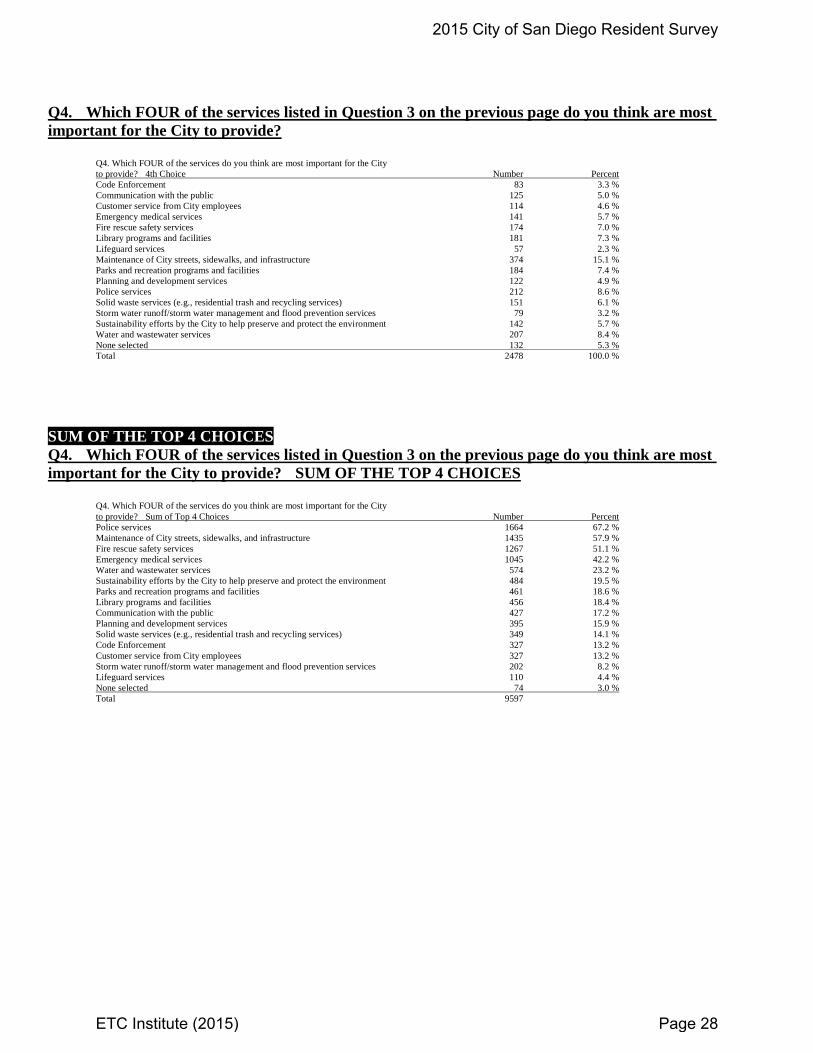
Q4. Which FOUR of the services listed in Question 3 on the previous page do you think are most
important for the City to provide?
Q4. Which FOUR of the services do you think are most important for the City
to provide? 4th Choice Number Percent
Code Enforcement 83 3.3 %
Communication with the public 125 5.0 %
Customer service from City employees 114 4.6 %
Emergency medical services 141 5.7 %
Fire rescue safety services 174 7.0 %
Library programs and facilities 181 7.3 %
Lifeguard services 57 2.3 %
Maintenance of City streets, sidewalks, and infrastructure 374 15.1 %
Parks and recreation programs and facilities 184 7.4 %
Planning and development services 122 4.9 %
Police services 212 8.6 %
Solid waste services (e.g., residential trash and recycling services) 151 6.1 %
Storm water runoff/storm water management and flood prevention services 79 3.2 %
Sustainability efforts by the City to help preserve and protect the environment 142 5.7 %
Water and wastewater services 207 8.4 %
None selected 132 5.3 %
Total 2478 100.0 %
SUM OF THE TOP 4 CHOICES
Q4. Which FOUR of the services listed in Question 3 on the previous page do you think are most
important for the City to provide? SUM OF THE TOP 4 CHOICES
Q4. Which FOUR of the services do you think are most important for the City
to provide? Sum of Top 4 Choices Number Percent
Police services 1664 67.2 %
Maintenance of City streets, sidewalks, and infrastructure 1435 57.9 %
Fire rescue safety services 1267 51.1 %
Emergency medical services 1045 42.2 %
Water and wastewater services 574 23.2 %
Sustainability efforts by the City to help preserve and protect the environment 484 19.5 %
Parks and recreation programs and facilities 461 18.6 %
Library programs and facilities 456 18.4 %
Communication with the public 427 17.2 %
Planning and development services 395 15.9 %
Solid waste services (e.g., residential trash and recycling services) 349 14.1 %
Code Enforcement 327 13.2 %
Customer service from City employees 327 13.2 %
Storm water runoff/storm water management and flood prevention services 202 8.2 %
Lifeguard services 110 4.4 %
None selected 74 3.0 %
Total 9597
2015 City of San Diego Resident Survey
ETC Institute (2015) Page 28

Q5. Compared to several years ago, how do you think the overall quality of services provided by the City
of San Diego has changed?
Q5. Compared to several years ago, how do you think the overall quality of
services provided by the City of San Diego has changed? Number Percent
Much worse 177 7.1 %
A little worse 328 13.2 %
About the same 769 31.0 %
A little better 680 27.4 %
Much better 269 10.9 %
Don't know 255 10.3 %
Total 2478 100.0 %
EXCLUDING DON’T KNOWS
Q5. Compared to several years ago, how do you think the overall quality of services provided by the City
of San Diego has changed? (EXCLUDING DON'T KNOWS)
Q5. Compared to several years ago, how do you think the overall quality of
services provided by the City of San Diego has changed? Number Percent
Much worse 177 8.0 %
A little worse 328 14.8 %
About the same 769 34.6 %
A little better 680 30.6 %
Much better 269 12.1 %
Total 2223 100.0 %
2015 City of San Diego Resident Survey
ETC Institute (2015) Page 29
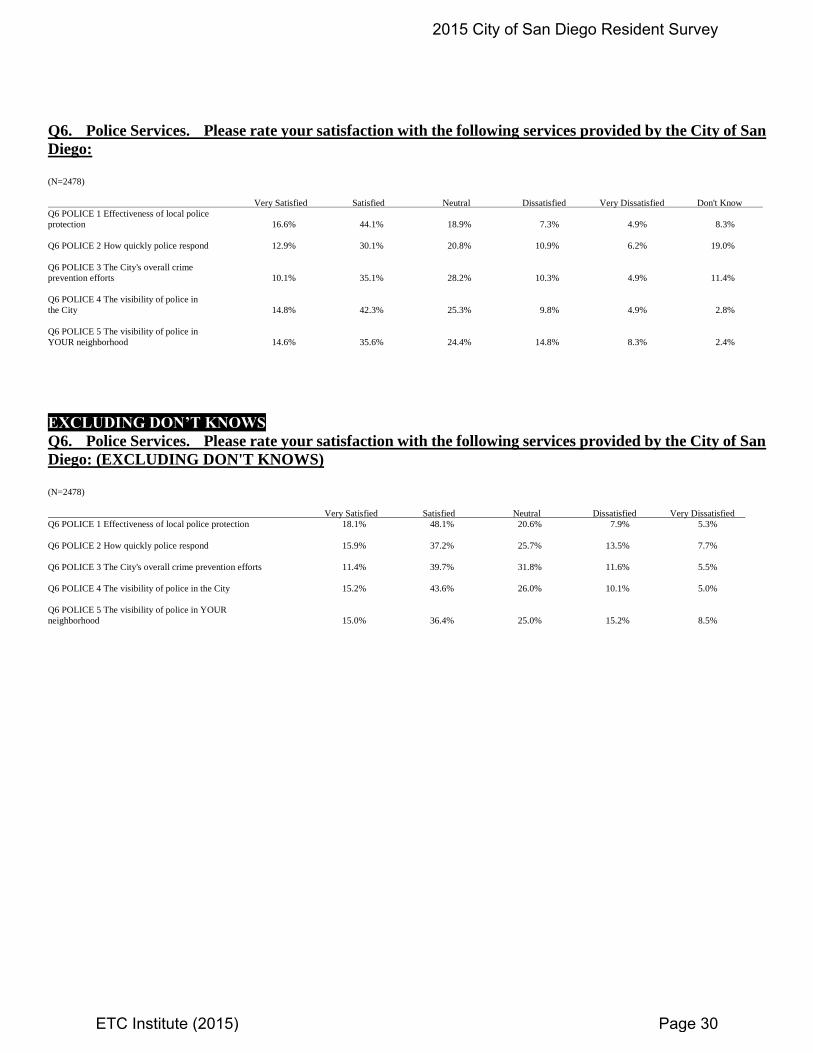
Q6. Police Services. Please rate your satisfaction with the following services provided by the City of San
Diego:
(N=2478)
Very Satisfied Satisfied Neutral Dissatisfied Very Dissatisfied Don't Know
Q6 POLICE 1 Effectiveness of local police
protection 16.6% 44.1% 18.9% 7.3% 4.9% 8.3%
Q6 POLICE 2 How quickly police respond 12.9% 30.1% 20.8% 10.9% 6.2% 19.0%
Q6 POLICE 3 The City's overall crime
prevention efforts 10.1% 35.1% 28.2% 10.3% 4.9% 11.4%
Q6 POLICE 4 The visibility of police in
the City 14.8% 42.3% 25.3% 9.8% 4.9% 2.8%
Q6 POLICE 5 The visibility of police in
YOUR neighborhood 14.6% 35.6% 24.4% 14.8% 8.3% 2.4%
EXCLUDING DON’T KNOWS
Q6. Police Services. Please rate your satisfaction with the following services provided by the City of San
Diego: (EXCLUDING DON'T KNOWS)
(N=2478)
Very Satisfied Satisfied Neutral Dissatisfied Very Dissatisfied
Q6 POLICE 1 Effectiveness of local police protection 18.1% 48.1% 20.6% 7.9% 5.3%
Q6 POLICE 2 How quickly police respond 15.9% 37.2% 25.7% 13.5% 7.7%
Q6 POLICE 3 The City's overall crime prevention efforts 11.4% 39.7% 31.8% 11.6% 5.5%
Q6 POLICE 4 The visibility of police in the City 15.2% 43.6% 26.0% 10.1% 5.0%
Q6 POLICE 5 The visibility of police in YOUR
neighborhood 15.0% 36.4% 25.0% 15.2% 8.5%
2015 City of San Diego Resident Survey
ETC Institute (2015) Page 30
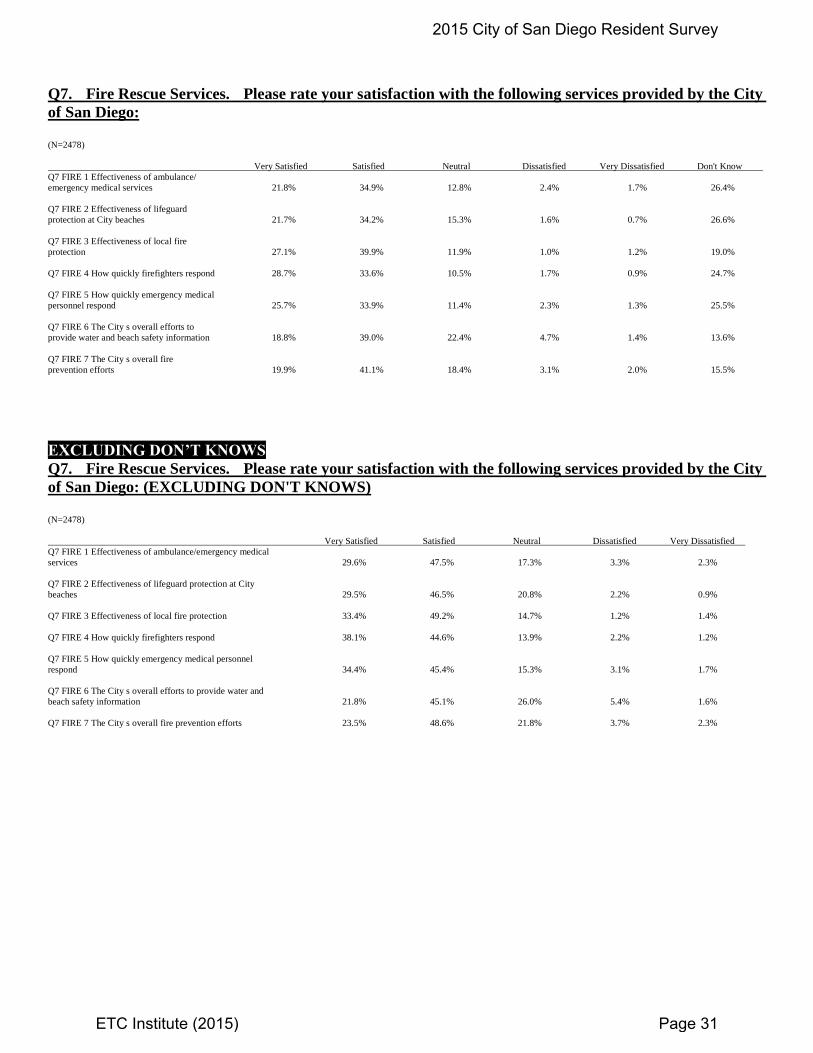
Q7. Fire Rescue Services. Please rate your satisfaction with the following services provided by the City
of San Diego:
(N=2478)
Very Satisfied Satisfied Neutral Dissatisfied Very Dissatisfied Don't Know
Q7 FIRE 1 Effectiveness of ambulance/
emergency medical services 21.8% 34.9% 12.8% 2.4% 1.7% 26.4%
Q7 FIRE 2 Effectiveness of lifeguard
protection at City beaches 21.7% 34.2% 15.3% 1.6% 0.7% 26.6%
Q7 FIRE 3 Effectiveness of local fire
protection 27.1% 39.9% 11.9% 1.0% 1.2% 19.0%
Q7 FIRE 4 How quickly firefighters respond 28.7% 33.6% 10.5% 1.7% 0.9% 24.7%
Q7 FIRE 5 How quickly emergency medical
personnel respond 25.7% 33.9% 11.4% 2.3% 1.3% 25.5%
Q7 FIRE 6 The City s overall efforts to
provide water and beach safety information 18.8% 39.0% 22.4% 4.7% 1.4% 13.6%
Q7 FIRE 7 The City s overall fire
prevention efforts 19.9% 41.1% 18.4% 3.1% 2.0% 15.5%
EXCLUDING DON’T KNOWS
Q7. Fire Rescue Services. Please rate your satisfaction with the following services provided by the City
of San Diego: (EXCLUDING DON'T KNOWS)
(N=2478)
Very Satisfied Satisfied Neutral Dissatisfied Very Dissatisfied
Q7 FIRE 1 Effectiveness of ambulance/emergency medical
services 29.6% 47.5% 17.3% 3.3% 2.3%
Q7 FIRE 2 Effectiveness of lifeguard protection at City
beaches 29.5% 46.5% 20.8% 2.2% 0.9%
Q7 FIRE 3 Effectiveness of local fire protection 33.4% 49.2% 14.7% 1.2% 1.4%
Q7 FIRE 4 How quickly firefighters respond 38.1% 44.6% 13.9% 2.2% 1.2%
Q7 FIRE 5 How quickly emergency medical personnel
respond 34.4% 45.4% 15.3% 3.1% 1.7%
Q7 FIRE 6 The City s overall efforts to provide water and
beach safety information 21.8% 45.1% 26.0% 5.4% 1.6%
Q7 FIRE 7 The City s overall fire prevention efforts 23.5% 48.6% 21.8% 3.7% 2.3%
2015 City of San Diego Resident Survey
ETC Institute (2015) Page 31
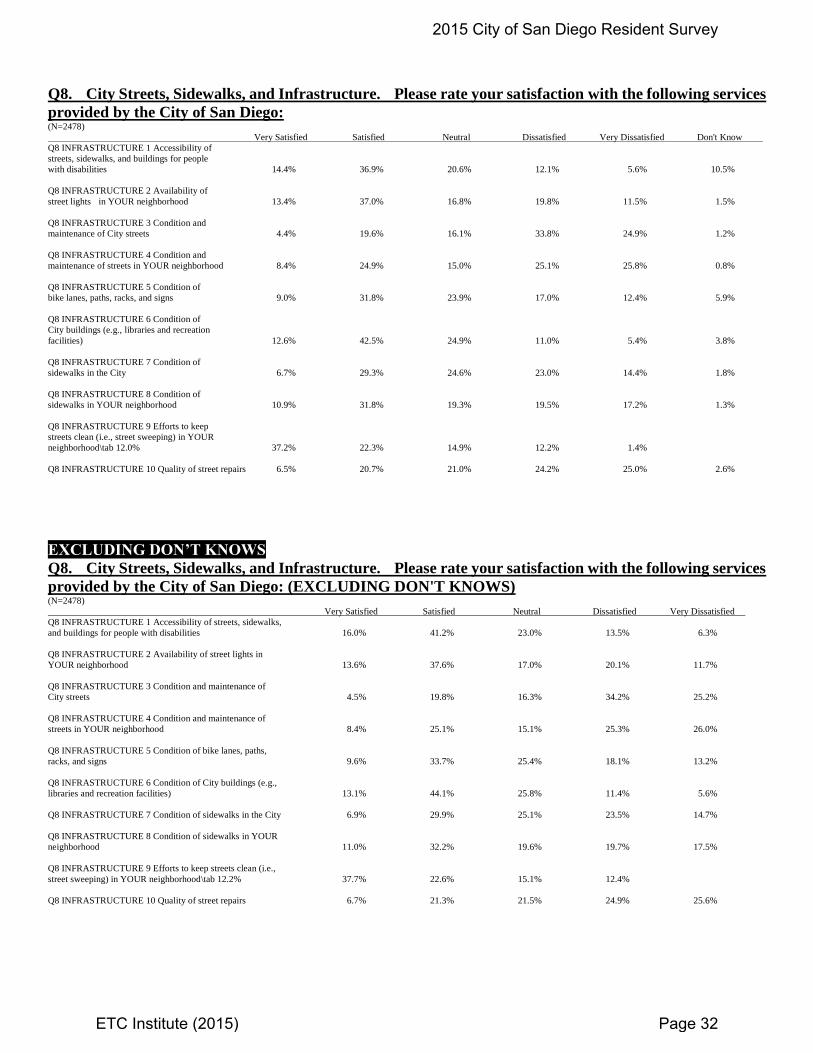
Q8. City Streets, Sidewalks, and Infrastructure. Please rate your satisfaction with the following services
provided by the City of San Diego: (N=2478)
Very Satisfied Satisfied Neutral Dissatisfied Very Dissatisfied Don't Know
Q8 INFRASTRUCTURE 1 Accessibility of
streets, sidewalks, and buildings for people
with disabilities 14.4% 36.9% 20.6% 12.1% 5.6% 10.5%
Q8 INFRASTRUCTURE 2 Availability of
street lights in YOUR neighborhood 13.4% 37.0% 16.8% 19.8% 11.5% 1.5%
Q8 INFRASTRUCTURE 3 Condition and
maintenance of City streets 4.4% 19.6% 16.1% 33.8% 24.9% 1.2%
Q8 INFRASTRUCTURE 4 Condition and
maintenance of streets in YOUR neighborhood 8.4% 24.9% 15.0% 25.1% 25.8% 0.8%
Q8 INFRASTRUCTURE 5 Condition of
bike lanes, paths, racks, and signs 9.0% 31.8% 23.9% 17.0% 12.4% 5.9%
Q8 INFRASTRUCTURE 6 Condition of
City buildings (e.g., libraries and recreation
facilities) 12.6% 42.5% 24.9% 11.0% 5.4% 3.8%
Q8 INFRASTRUCTURE 7 Condition of
sidewalks in the City 6.7% 29.3% 24.6% 23.0% 14.4% 1.8%
Q8 INFRASTRUCTURE 8 Condition of
sidewalks in YOUR neighborhood 10.9% 31.8% 19.3% 19.5% 17.2% 1.3%
Q8 INFRASTRUCTURE 9 Efforts to keep
streets clean (i.e., street sweeping) in YOUR
neighborhood\tab 12.0% 37.2% 22.3% 14.9% 12.2% 1.4%
Q8 INFRASTRUCTURE 10 Quality of street repairs 6.5% 20.7% 21.0% 24.2% 25.0% 2.6%
EXCLUDING DON’T KNOWS
Q8. City Streets, Sidewalks, and Infrastructure. Please rate your satisfaction with the following services
provided by the City of San Diego: (EXCLUDING DON'T KNOWS) (N=2478)
Very Satisfied Satisfied Neutral Dissatisfied Very Dissatisfied
Q8 INFRASTRUCTURE 1 Accessibility of streets, sidewalks,
and buildings for people with disabilities 16.0% 41.2% 23.0% 13.5% 6.3%
Q8 INFRASTRUCTURE 2 Availability of street lights in
YOUR neighborhood 13.6% 37.6% 17.0% 20.1% 11.7%
Q8 INFRASTRUCTURE 3 Condition and maintenance of
City streets 4.5% 19.8% 16.3% 34.2% 25.2%
Q8 INFRASTRUCTURE 4 Condition and maintenance of
streets in YOUR neighborhood 8.4% 25.1% 15.1% 25.3% 26.0%
Q8 INFRASTRUCTURE 5 Condition of bike lanes, paths,
racks, and signs 9.6% 33.7% 25.4% 18.1% 13.2%
Q8 INFRASTRUCTURE 6 Condition of City buildings (e.g.,
libraries and recreation facilities) 13.1% 44.1% 25.8% 11.4% 5.6%
Q8 INFRASTRUCTURE 7 Condition of sidewalks in the City 6.9% 29.9% 25.1% 23.5% 14.7%
Q8 INFRASTRUCTURE 8 Condition of sidewalks in YOUR
neighborhood 11.0% 32.2% 19.6% 19.7% 17.5%
Q8 INFRASTRUCTURE 9 Efforts to keep streets clean (i.e.,
street sweeping) in YOUR neighborhood\tab 12.2% 37.7% 22.6% 15.1% 12.4%
Q8 INFRASTRUCTURE 10 Quality of street repairs 6.7% 21.3% 21.5% 24.9% 25.6%
2015 City of San Diego Resident Survey
ETC Institute (2015) Page 32
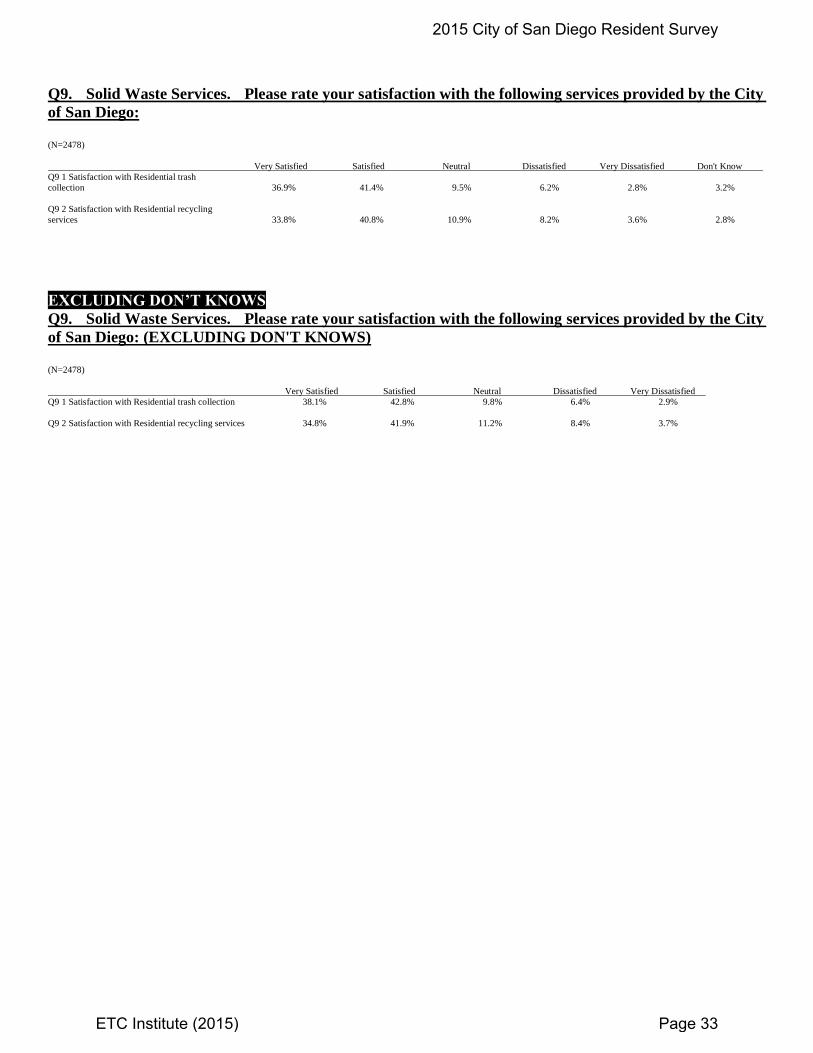
Q9. Solid Waste Services. Please rate your satisfaction with the following services provided by the City
of San Diego:
(N=2478)
Very Satisfied Satisfied Neutral Dissatisfied Very Dissatisfied Don't Know
Q9 1 Satisfaction with Residential trash
collection 36.9% 41.4% 9.5% 6.2% 2.8% 3.2%
Q9 2 Satisfaction with Residential recycling
services 33.8% 40.8% 10.9% 8.2% 3.6% 2.8%
EXCLUDING DON’T KNOWS
Q9. Solid Waste Services. Please rate your satisfaction with the following services provided by the City
of San Diego: (EXCLUDING DON'T KNOWS)
(N=2478)
Very Satisfied Satisfied Neutral Dissatisfied Very Dissatisfied
Q9 1 Satisfaction with Residential trash collection 38.1% 42.8% 9.8% 6.4% 2.9%
Q9 2 Satisfaction with Residential recycling services 34.8% 41.9% 11.2% 8.4% 3.7%
2015 City of San Diego Resident Survey
ETC Institute (2015) Page 33
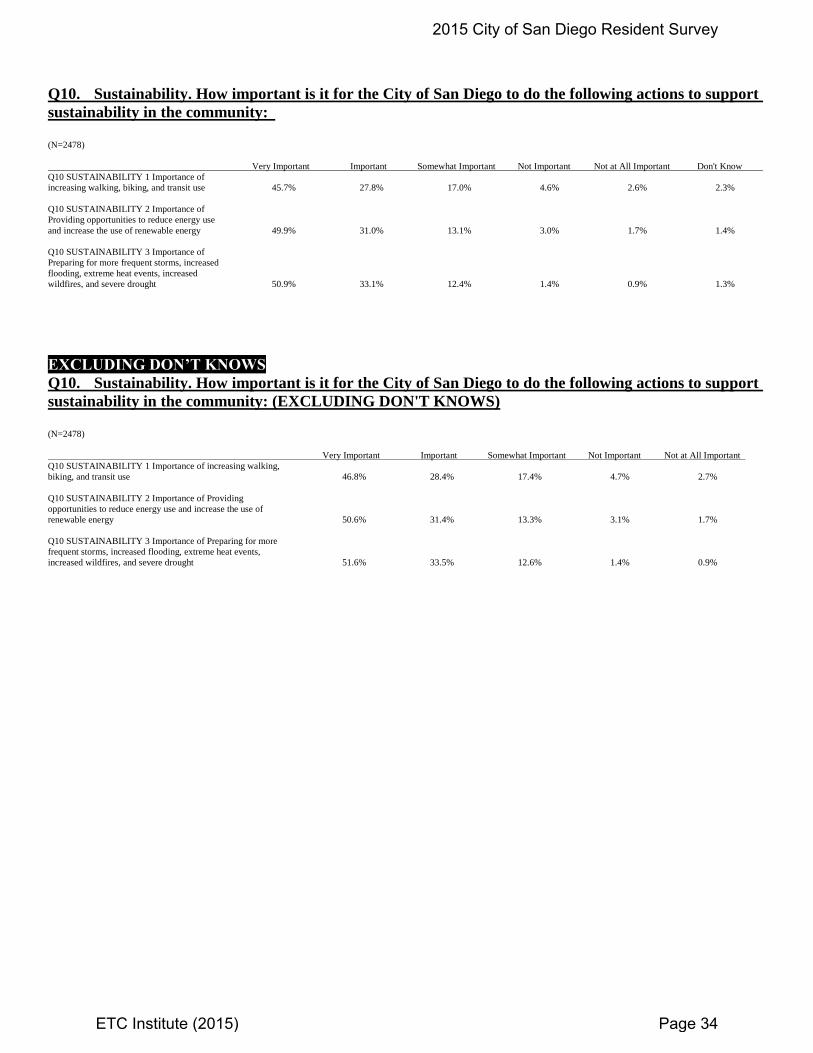
Q10. Sustainability. How important is it for the City of San Diego to do the following actions to support
sustainability in the community:
(N=2478)
Very Important Important Somewhat Important Not Important Not at All Important Don't Know
Q10 SUSTAINABILITY 1 Importance of
increasing walking, biking, and transit use 45.7% 27.8% 17.0% 4.6% 2.6% 2.3%
Q10 SUSTAINABILITY 2 Importance of
Providing opportunities to reduce energy use
and increase the use of renewable energy 49.9% 31.0% 13.1% 3.0% 1.7% 1.4%
Q10 SUSTAINABILITY 3 Importance of
Preparing for more frequent storms, increased
flooding, extreme heat events, increased
wildfires, and severe drought 50.9% 33.1% 12.4% 1.4% 0.9% 1.3%
EXCLUDING DON’T KNOWS
Q10. Sustainability. How important is it for the City of San Diego to do the following actions to support
sustainability in the community: (EXCLUDING DON'T KNOWS)
(N=2478)
Very Important Important Somewhat Important Not Important Not at All Important
Q10 SUSTAINABILITY 1 Importance of increasing walking,
biking, and transit use 46.8% 28.4% 17.4% 4.7% 2.7%
Q10 SUSTAINABILITY 2 Importance of Providing
opportunities to reduce energy use and increase the use of
renewable energy 50.6% 31.4% 13.3% 3.1% 1.7%
Q10 SUSTAINABILITY 3 Importance of Preparing for more
frequent storms, increased flooding, extreme heat events,
increased wildfires, and severe drought 51.6% 33.5% 12.6% 1.4% 0.9%
2015 City of San Diego Resident Survey
ETC Institute (2015) Page 34
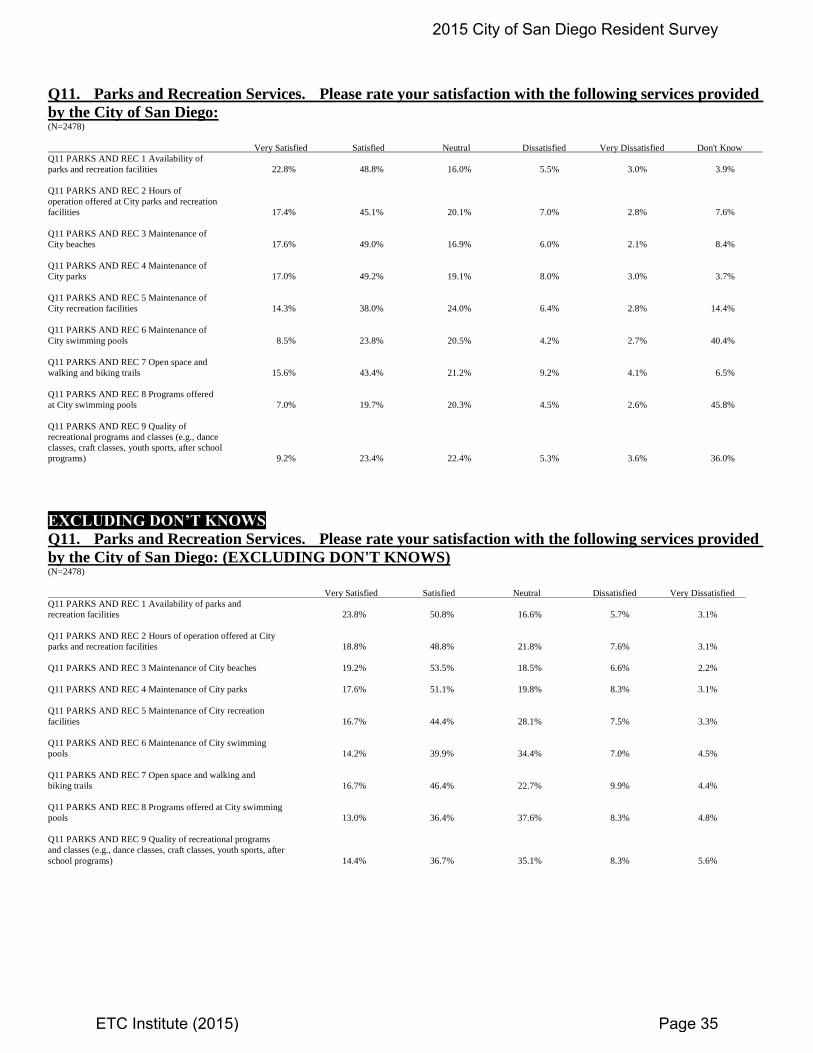
Q11. Parks and Recreation Services. Please rate your satisfaction with the following services provided
by the City of San Diego: (N=2478)
Very Satisfied Satisfied Neutral Dissatisfied Very Dissatisfied Don't Know
Q11 PARKS AND REC 1 Availability of
parks and recreation facilities 22.8% 48.8% 16.0% 5.5% 3.0% 3.9%
Q11 PARKS AND REC 2 Hours of
operation offered at City parks and recreation
facilities 17.4% 45.1% 20.1% 7.0% 2.8% 7.6%
Q11 PARKS AND REC 3 Maintenance of
City beaches 17.6% 49.0% 16.9% 6.0% 2.1% 8.4%
Q11 PARKS AND REC 4 Maintenance of
City parks 17.0% 49.2% 19.1% 8.0% 3.0% 3.7%
Q11 PARKS AND REC 5 Maintenance of
City recreation facilities 14.3% 38.0% 24.0% 6.4% 2.8% 14.4%
Q11 PARKS AND REC 6 Maintenance of
City swimming pools 8.5% 23.8% 20.5% 4.2% 2.7% 40.4%
Q11 PARKS AND REC 7 Open space and
walking and biking trails 15.6% 43.4% 21.2% 9.2% 4.1% 6.5%
Q11 PARKS AND REC 8 Programs offered
at City swimming pools 7.0% 19.7% 20.3% 4.5% 2.6% 45.8%
Q11 PARKS AND REC 9 Quality of
recreational programs and classes (e.g., dance
classes, craft classes, youth sports, after school
programs) 9.2% 23.4% 22.4% 5.3% 3.6% 36.0%
EXCLUDING DON’T KNOWS
Q11. Parks and Recreation Services. Please rate your satisfaction with the following services provided
by the City of San Diego: (EXCLUDING DON'T KNOWS) (N=2478)
Very Satisfied Satisfied Neutral Dissatisfied Very Dissatisfied
Q11 PARKS AND REC 1 Availability of parks and
recreation facilities 23.8% 50.8% 16.6% 5.7% 3.1%
Q11 PARKS AND REC 2 Hours of operation offered at City
parks and recreation facilities 18.8% 48.8% 21.8% 7.6% 3.1%
Q11 PARKS AND REC 3 Maintenance of City beaches 19.2% 53.5% 18.5% 6.6% 2.2%
Q11 PARKS AND REC 4 Maintenance of City parks 17.6% 51.1% 19.8% 8.3% 3.1%
Q11 PARKS AND REC 5 Maintenance of City recreation
facilities 16.7% 44.4% 28.1% 7.5% 3.3%
Q11 PARKS AND REC 6 Maintenance of City swimming
pools 14.2% 39.9% 34.4% 7.0% 4.5%
Q11 PARKS AND REC 7 Open space and walking and
biking trails 16.7% 46.4% 22.7% 9.9% 4.4%
Q11 PARKS AND REC 8 Programs offered at City swimming
pools 13.0% 36.4% 37.6% 8.3% 4.8%
Q11 PARKS AND REC 9 Quality of recreational programs
and classes (e.g., dance classes, craft classes, youth sports, after
school programs) 14.4% 36.7% 35.1% 8.3% 5.6%
2015 City of San Diego Resident Survey
ETC Institute (2015) Page 35
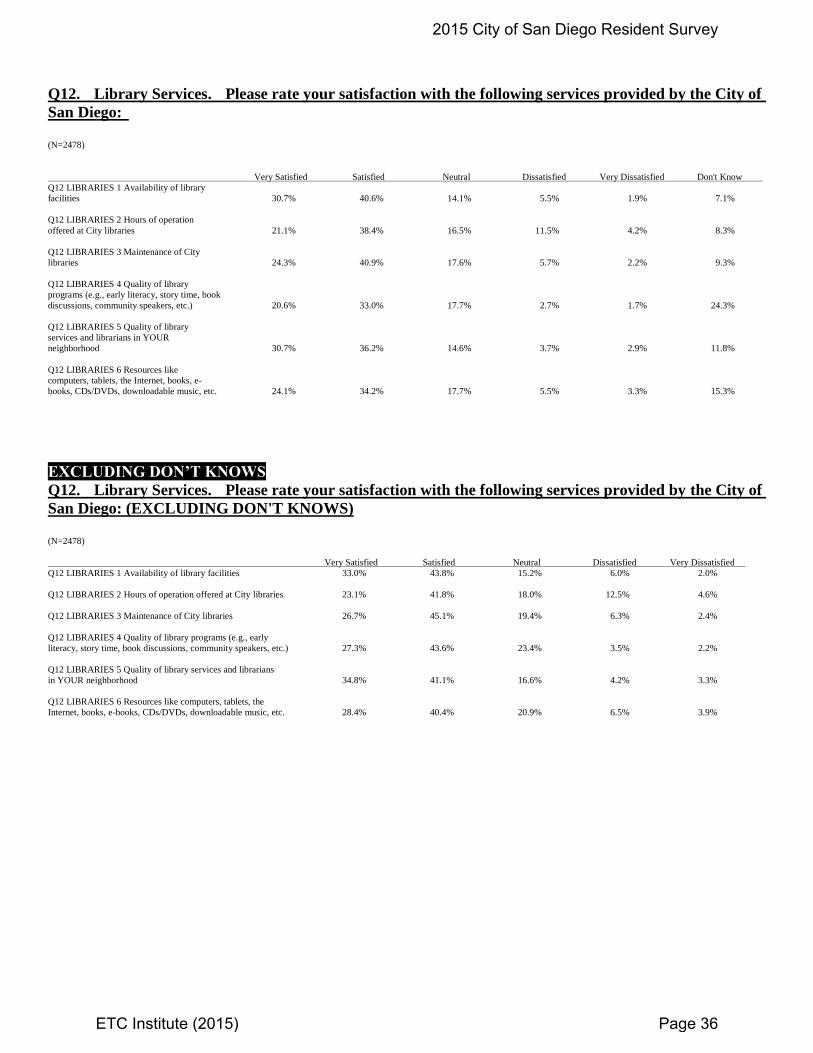
Q12. Library Services. Please rate your satisfaction with the following services provided by the City of
San Diego:
(N=2478)
Very Satisfied Satisfied Neutral Dissatisfied Very Dissatisfied Don't Know
Q12 LIBRARIES 1 Availability of library
facilities 30.7% 40.6% 14.1% 5.5% 1.9% 7.1%
Q12 LIBRARIES 2 Hours of operation
offered at City libraries 21.1% 38.4% 16.5% 11.5% 4.2% 8.3%
Q12 LIBRARIES 3 Maintenance of City
libraries 24.3% 40.9% 17.6% 5.7% 2.2% 9.3%
Q12 LIBRARIES 4 Quality of library
programs (e.g., early literacy, story time, book
discussions, community speakers, etc.) 20.6% 33.0% 17.7% 2.7% 1.7% 24.3%
Q12 LIBRARIES 5 Quality of library
services and librarians in YOUR
neighborhood 30.7% 36.2% 14.6% 3.7% 2.9% 11.8%
Q12 LIBRARIES 6 Resources like
computers, tablets, the Internet, books, e-
books, CDs/DVDs, downloadable music, etc. 24.1% 34.2% 17.7% 5.5% 3.3% 15.3%
EXCLUDING DON’T KNOWS
Q12. Library Services. Please rate your satisfaction with the following services provided by the City of
San Diego: (EXCLUDING DON'T KNOWS)
(N=2478)
Very Satisfied Satisfied Neutral Dissatisfied Very Dissatisfied
Q12 LIBRARIES 1 Availability of library facilities 33.0% 43.8% 15.2% 6.0% 2.0%
Q12 LIBRARIES 2 Hours of operation offered at City libraries 23.1% 41.8% 18.0% 12.5% 4.6%
Q12 LIBRARIES 3 Maintenance of City libraries 26.7% 45.1% 19.4% 6.3% 2.4%
Q12 LIBRARIES 4 Quality of library programs (e.g., early
literacy, story time, book discussions, community speakers, etc.) 27.3% 43.6% 23.4% 3.5% 2.2%
Q12 LIBRARIES 5 Quality of library services and librarians
in YOUR neighborhood 34.8% 41.1% 16.6% 4.2% 3.3%
Q12 LIBRARIES 6 Resources like computers, tablets, the
Internet, books, e-books, CDs/DVDs, downloadable music, etc. 28.4% 40.4% 20.9% 6.5% 3.9%
2015 City of San Diego Resident Survey
ETC Institute (2015) Page 36
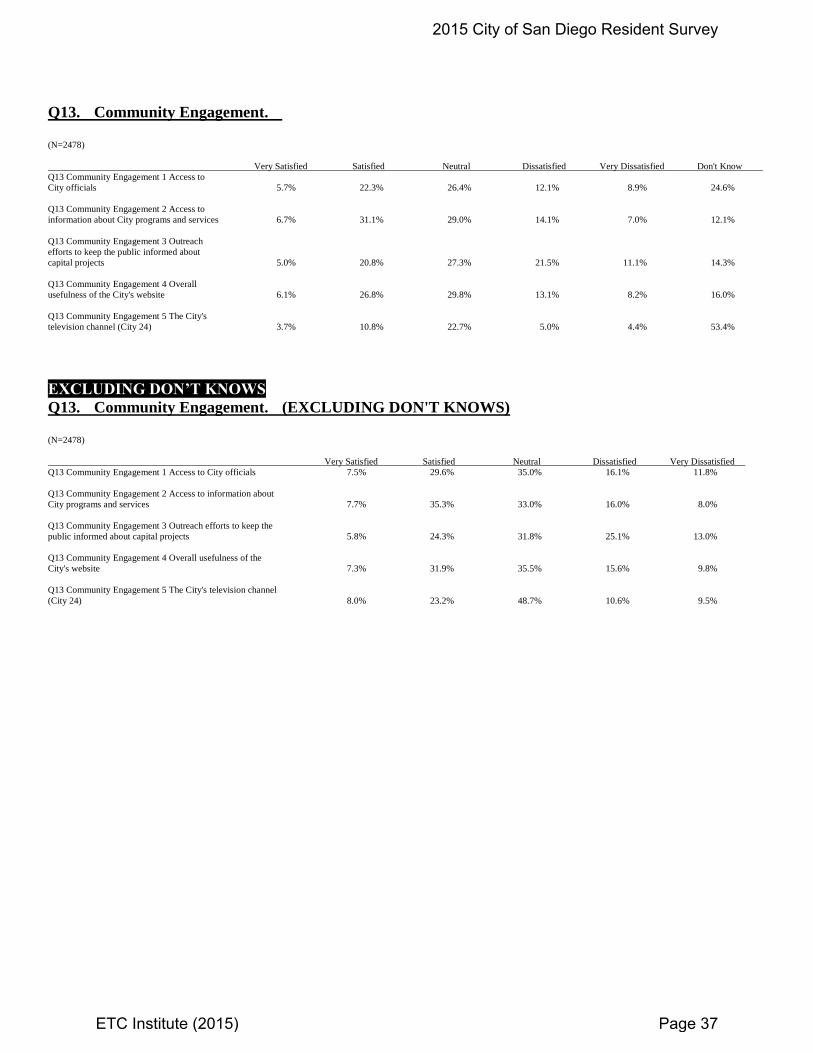
Q13. Community Engagement.
(N=2478)
Very Satisfied Satisfied Neutral Dissatisfied Very Dissatisfied Don't Know
Q13 Community Engagement 1 Access to
City officials 5.7% 22.3% 26.4% 12.1% 8.9% 24.6%
Q13 Community Engagement 2 Access to
information about City programs and services 6.7% 31.1% 29.0% 14.1% 7.0% 12.1%
Q13 Community Engagement 3 Outreach
efforts to keep the public informed about
capital projects 5.0% 20.8% 27.3% 21.5% 11.1% 14.3%
Q13 Community Engagement 4 Overall
usefulness of the City's website 6.1% 26.8% 29.8% 13.1% 8.2% 16.0%
Q13 Community Engagement 5 The City's
television channel (City 24) 3.7% 10.8% 22.7% 5.0% 4.4% 53.4%
EXCLUDING DON’T KNOWS
Q13. Community Engagement. (EXCLUDING DON'T KNOWS)
(N=2478)
Very Satisfied Satisfied Neutral Dissatisfied Very Dissatisfied
Q13 Community Engagement 1 Access to City officials 7.5% 29.6% 35.0% 16.1% 11.8%
Q13 Community Engagement 2 Access to information about
City programs and services 7.7% 35.3% 33.0% 16.0% 8.0%
Q13 Community Engagement 3 Outreach efforts to keep the
public informed about capital projects 5.8% 24.3% 31.8% 25.1% 13.0%
Q13 Community Engagement 4 Overall usefulness of the
City's website 7.3% 31.9% 35.5% 15.6% 9.8%
Q13 Community Engagement 5 The City's television channel
(City 24) 8.0% 23.2% 48.7% 10.6% 9.5%
2015 City of San Diego Resident Survey
ETC Institute (2015) Page 37

Q14. Other Services.
(N=2478)
Very Satisfied Satisfied Neutral Dissatisfied Very Dissatisfied Don't Know
Q14 1 Blight (rundown buildings, vacant
lots, and abandoned vehicles) 7.7% 15.6% 27.2% 21.5% 11.7% 16.3%
Q14 2 Ease of obtaining permits from
Development Services 2.8% 8.5% 19.8% 12.1% 8.6% 48.2%
Q14 3 Efforts to address homelessness 2.7% 11.3% 20.1% 27.5% 24.5% 13.8%
Q14 4 Efforts to assist low- to moderate-
income residents and communities 3.8% 12.4% 24.5% 23.0% 15.1% 21.2%
Q14 5 Efforts to plan for future growth 3.4% 16.7% 23.8% 21.8% 14.9% 19.5%
Q14 6 Efforts to support job creation and
investment by local businesses 3.1% 14.9% 26.2% 18.4% 12.8% 24.6%
Q14 7 Gang prevention efforts 3.4% 17.3% 25.4% 13.2% 9.6% 31.2%
Q14 8 Graffiti removal 5.5% 25.2% 25.3% 16.0% 10.0% 18.0%
Q14 9 Historic preservation efforts 8.0% 31.4% 25.7% 8.0% 5.6% 21.2%
Q14 10 Music, dance, and theater
performances; visual art and cultural
exhibitions; parades, festivals, art classes, and
public art 11.7% 36.0% 25.3% 5.9% 4.1% 16.9%
Q14 11 Online services (e.g., paying a bill,
getting a business license) 12.9% 34.6% 23.3% 6.1% 5.0% 18.0%
Q14 12 Quality of services provided to
people with disabilities 6.8% 19.5% 21.3% 5.0% 4.3% 43.1%
Q14 13 Quality/variety of entertainment,
expositions, and sporting events at the
Convention Center, Petco Park, and
QUALCOMM Stadium 13.5% 35.6% 25.5% 5.9% 5.2% 14.3%
Q14 14 Traffic congestion on City streets 3.7% 19.8% 24.4% 24.8% 21.8% 5.4%
2015 City of San Diego Resident Survey
ETC Institute (2015) Page 38
EXCLUDING DON’T KNOWS
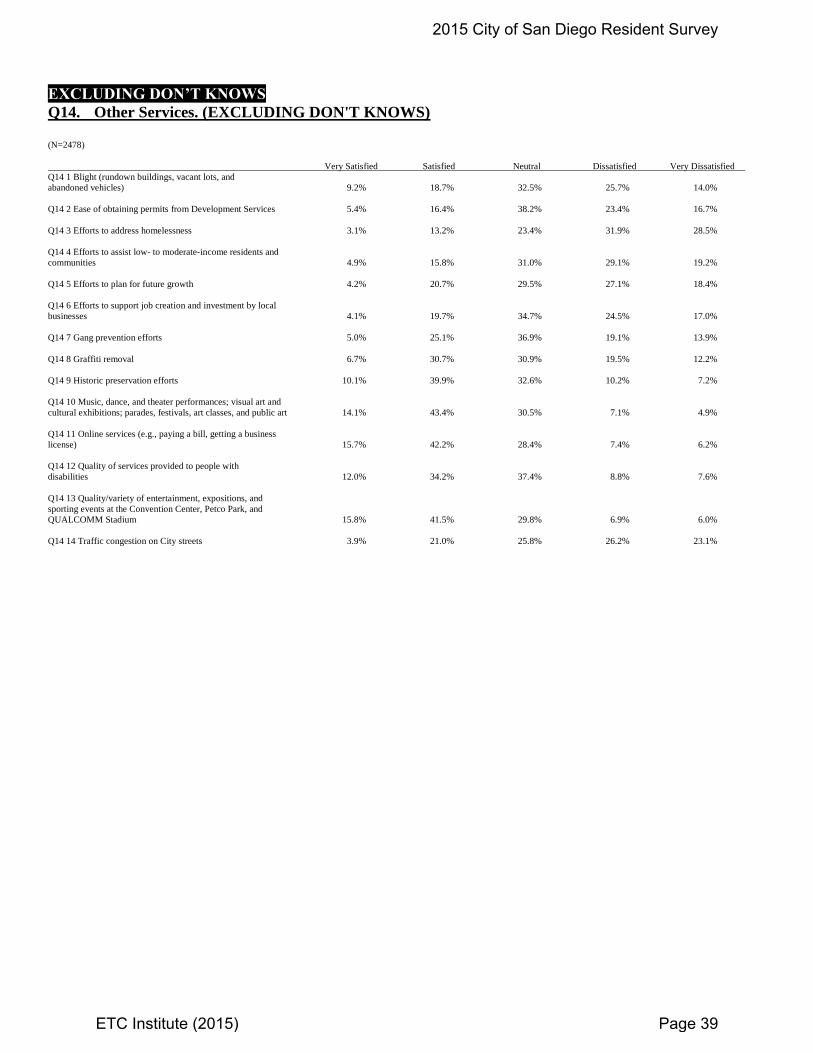
Q14. Other Services. (EXCLUDING DON'T KNOWS)
(N=2478)
Very Satisfied Satisfied Neutral Dissatisfied Very Dissatisfied
Q14 1 Blight (rundown buildings, vacant lots, and
abandoned vehicles) 9.2% 18.7% 32.5% 25.7% 14.0%
Q14 2 Ease of obtaining permits from Development Services 5.4% 16.4% 38.2% 23.4% 16.7%
Q14 3 Efforts to address homelessness 3.1% 13.2% 23.4% 31.9% 28.5%
Q14 4 Efforts to assist low- to moderate-income residents and
communities 4.9% 15.8% 31.0% 29.1% 19.2%
Q14 5 Efforts to plan for future growth 4.2% 20.7% 29.5% 27.1% 18.4%
Q14 6 Efforts to support job creation and investment by local
businesses 4.1% 19.7% 34.7% 24.5% 17.0%
Q14 7 Gang prevention efforts 5.0% 25.1% 36.9% 19.1% 13.9%
Q14 8 Graffiti removal 6.7% 30.7% 30.9% 19.5% 12.2%
Q14 9 Historic preservation efforts 10.1% 39.9% 32.6% 10.2% 7.2%
Q14 10 Music, dance, and theater performances; visual art and
cultural exhibitions; parades, festivals, art classes, and public art 14.1% 43.4% 30.5% 7.1% 4.9%
Q14 11 Online services (e.g., paying a bill, getting a business
license) 15.7% 42.2% 28.4% 7.4% 6.2%
Q14 12 Quality of services provided to people with
disabilities 12.0% 34.2% 37.4% 8.8% 7.6%
Q14 13 Quality/variety of entertainment, expositions, and
sporting events at the Convention Center, Petco Park, and
QUALCOMM Stadium 15.8% 41.5% 29.8% 6.9% 6.0%
Q14 14 Traffic congestion on City streets 3.9% 21.0% 25.8% 26.2% 23.1%
2015 City of San Diego Resident Survey
ETC Institute (2015) Page 39
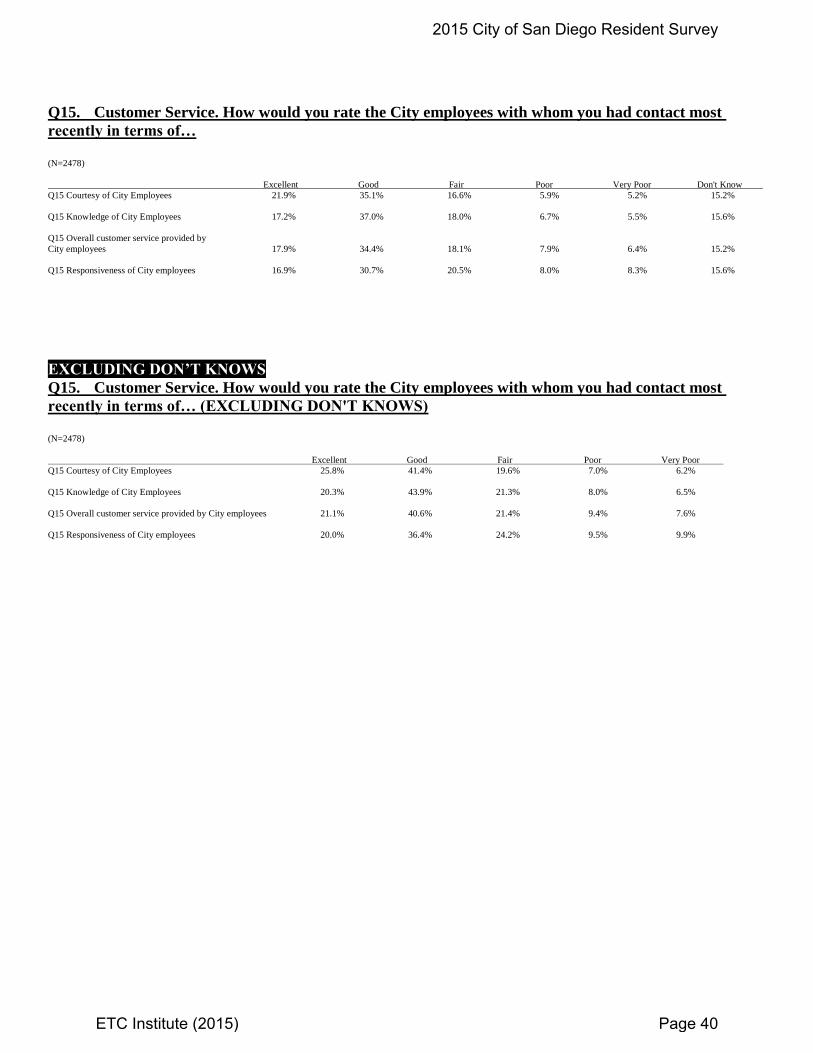
Q15. Customer Service. How would you rate the City employees with whom you had contact most
recently in terms of…
(N=2478)
Excellent Good Fair Poor Very Poor Don't Know
Q15 Courtesy of City Employees 21.9% 35.1% 16.6% 5.9% 5.2% 15.2%
Q15 Knowledge of City Employees 17.2% 37.0% 18.0% 6.7% 5.5% 15.6%
Q15 Overall customer service provided by
City employees 17.9% 34.4% 18.1% 7.9% 6.4% 15.2%
Q15 Responsiveness of City employees 16.9% 30.7% 20.5% 8.0% 8.3% 15.6%
EXCLUDING DON’T KNOWS
Q15. Customer Service. How would you rate the City employees with whom you had contact most
recently in terms of… (EXCLUDING DON'T KNOWS)
(N=2478)
Excellent Good Fair Poor Very Poor
Q15 Courtesy of City Employees 25.8% 41.4% 19.6% 7.0% 6.2%
Q15 Knowledge of City Employees 20.3% 43.9% 21.3% 8.0% 6.5%
Q15 Overall customer service provided by City employees 21.1% 40.6% 21.4% 9.4% 7.6%
Q15 Responsiveness of City employees 20.0% 36.4% 24.2% 9.5% 9.9%
2015 City of San Diego Resident Survey
ETC Institute (2015) Page 40
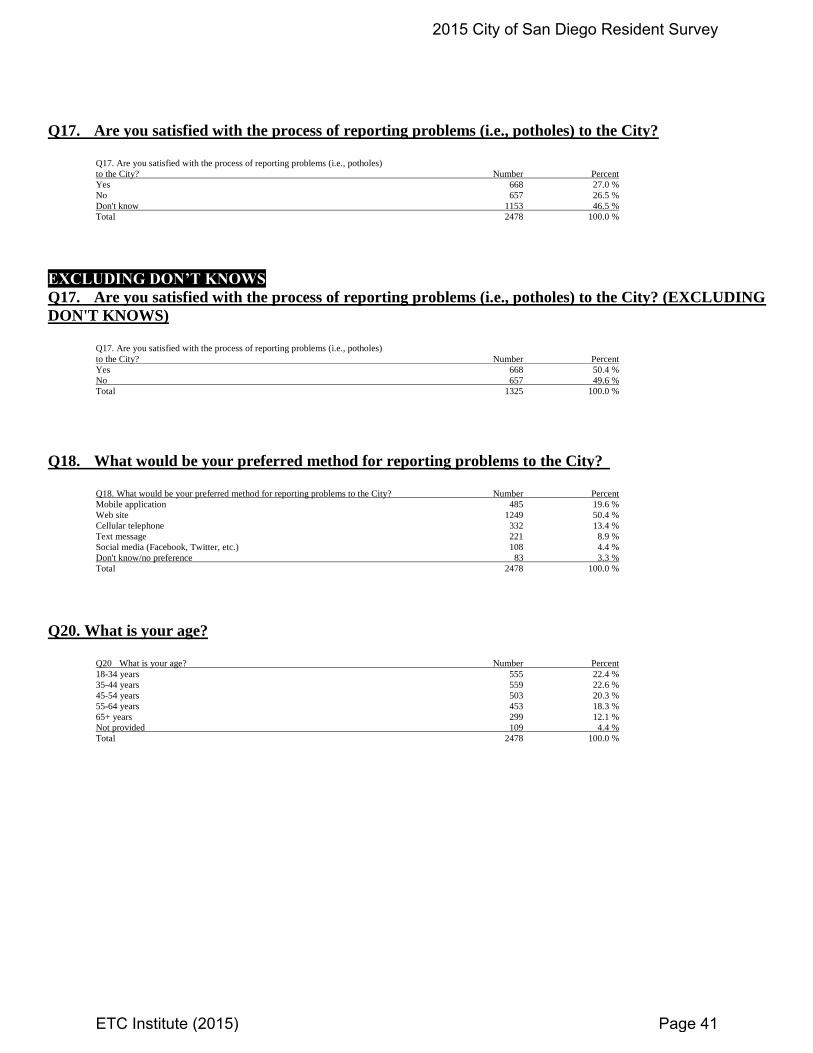
Q17. Are you satisfied with the process of reporting problems (i.e., potholes) to the City?
Q17. Are you satisfied with the process of reporting problems (i.e., potholes)
to the City? Number Percent
Yes 668 27.0 %
No 657 26.5 %
Don't know 1153 46.5 %
Total 2478 100.0 %
EXCLUDING DON’T KNOWS
Q17. Are you satisfied with the process of reporting problems (i.e., potholes) to the City? (EXCLUDING
DON'T KNOWS)
Q17. Are you satisfied with the process of reporting problems (i.e., potholes)
to the City? Number Percent
Yes 668 50.4 %
No 657 49.6 %
Total 1325 100.0 %
Q18. What would be your preferred method for reporting problems to the City?
Q18. What would be your preferred method for reporting problems to the City? Number Percent
Mobile application 485 19.6 %
Web site 1249 50.4 %
Cellular telephone 332 13.4 %
Text message 221 8.9 %
Social media (Facebook, Twitter, etc.) 108 4.4 %
Don't know/no preference 83 3.3 %
Total 2478 100.0 %
Q20. What is your age?
Q20 What is your age? Number Percent
18-34 years 555 22.4 %
35-44 years 559 22.6 %
45-54 years 503 20.3 %
55-64 years 453 18.3 %
65+ years 299 12.1 %
Not provided 109 4.4 %
Total 2478 100.0 %
2015 City of San Diego Resident Survey
ETC Institute (2015) Page 41
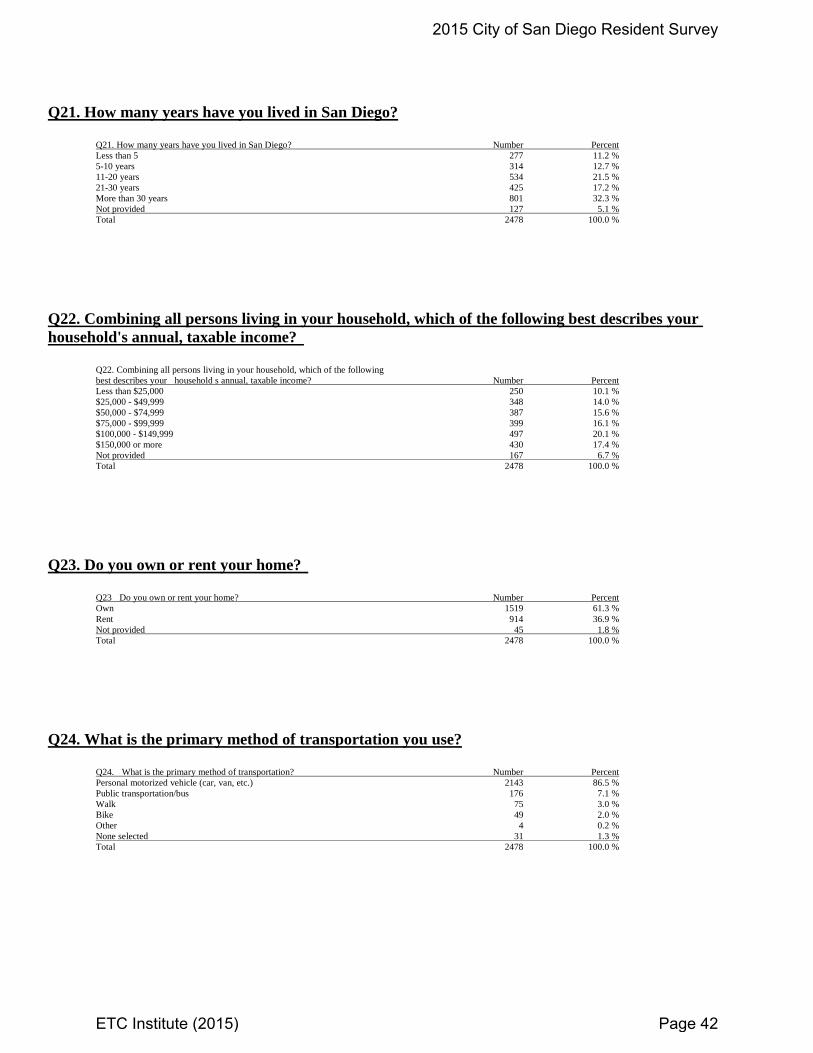
Q21. How many years have you lived in San Diego?
Q21. How many years have you lived in San Diego? Number Percent
Less than 5 277 11.2 %
5-10 years 314 12.7 %
11-20 years 534 21.5 %
21-30 years 425 17.2 %
More than 30 years 801 32.3 %
Not provided 127 5.1 %
Total 2478 100.0 %
Q22. Combining all persons living in your household, which of the following best describes your
household's annual, taxable income?
Q22. Combining all persons living in your household, which of the following
best describes your household s annual, taxable income? Number Percent
Less than $25,000 250 10.1 %
$25,000 - $49,999 348 14.0 %
$50,000 - $74,999 387 15.6 %
$75,000 - $99,999 399 16.1 %
$100,000 - $149,999 497 20.1 %
$150,000 or more 430 17.4 %
Not provided 167 6.7 %
Total 2478 100.0 %
Q23. Do you own or rent your home?
Q23 Do you own or rent your home? Number Percent
Own 1519 61.3 %
Rent 914 36.9 %
Not provided 45 1.8 %
Total 2478 100.0 %
Q24. What is the primary method of transportation you use?
Q24. What is the primary method of transportation? Number Percent
Personal motorized vehicle (car, van, etc.) 2143 86.5 %
Public transportation/bus 176 7.1 %
Walk 75 3.0 %
Bike 49 2.0 %
Other 4 0.2 %
None selected 31 1.3 %
Total 2478 100.0 %
2015 City of San Diego Resident Survey
ETC Institute (2015) Page 42
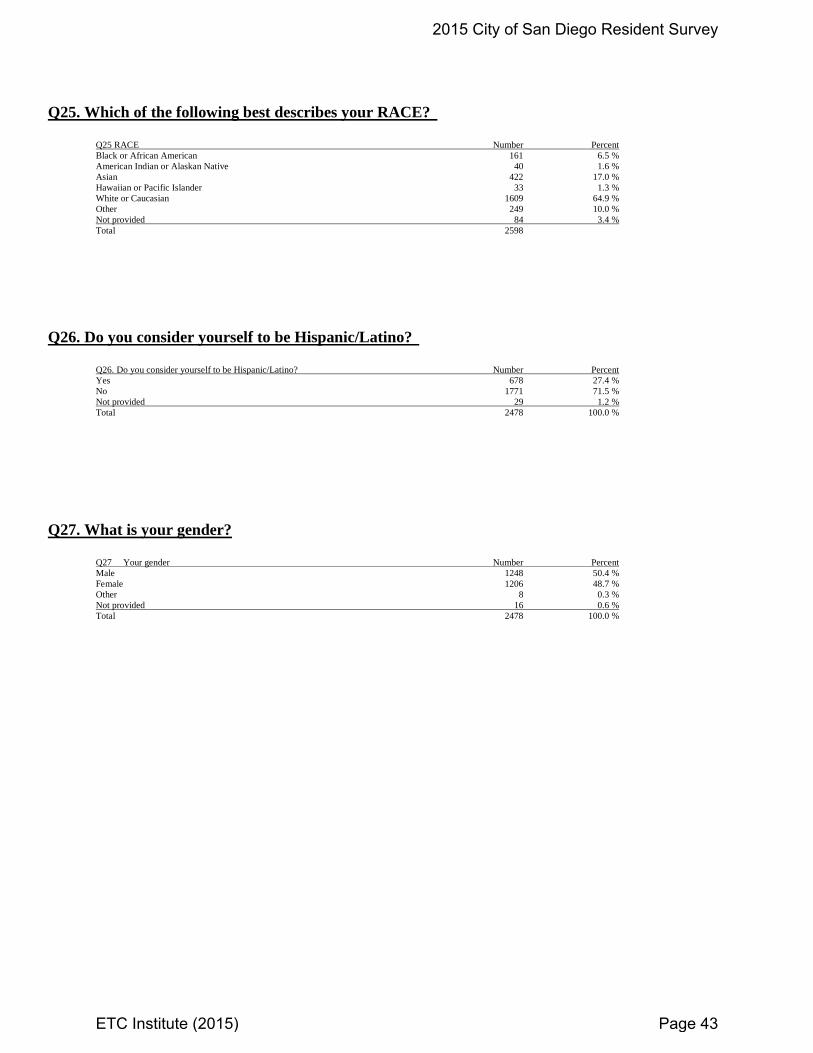
Q25. Which of the following best describes your RACE?
Q25 RACE Number Percent
Black or African American 161 6.5 %
American Indian or Alaskan Native 40 1.6 %
Asian 422 17.0 %
Hawaiian or Pacific Islander 33 1.3 %
White or Caucasian 1609 64.9 %
Other 249 10.0 %
Not provided 84 3.4 %
Total 2598
Q26. Do you consider yourself to be Hispanic/Latino?
Q26. Do you consider yourself to be Hispanic/Latino? Number Percent
Yes 678 27.4 %
No 1771 71.5 %
Not provided 29 1.2 %
Total 2478 100.0 %
Q27. What is your gender?
Q27 Your gender Number Percent
Male 1248 50.4 %
Female 1206 48.7 %
Other 8 0.3 %
Not provided 16 0.6 %
Total 2478 100.0 %
2015 City of San Diego Resident Survey
ETC Institute (2015) Page 43
Section 4:
Survey Instrument
2015 City of San Diego Resident Survey
ETC Institute (2015) Page 44
November 2015
Dear San Diego Resident,
In the City of San Diego, customer input helps us improve our services and meet our mission to effectively serve and support our communities. Please take this opportunity to tell your City government what you think of the services it provides.
Your household has been randomly selected to receive this survey; only a small percentage of San Diego residents received it. Your participation is important. All individual responses will be kept confidential.
Please take a few minutes and tell us about: Your opinions of City programs, services, and City staff, and Your preferences about how City officials should prioritize our programs and services.
Survey Methods and Results Please take some time to complete and return the survey in the enclosed postage-paid envelope addressed to ETC Institute. Those randomly selected to participate in the survey, but do not mail in or complete it online within two weeks of receiving this letter, may receive a follow-up phone call.
Any City of San Diego resident can complete the survey via telephone by calling (844) 811-0411 or complete it online by visiting www.SD2015Survey.org. All responses will be analyzed and compared against our peer cities. Once complete, the results will be presented to the public, and published on the City of San Diego’s website (www.sandiego.gov).
Questions If you have any questions, please call the City of San Diego’s Performance & Analytics Department at (619) 235-5252.
Your input is extremely important. Thank you very much for taking the time to share your thoughts with us. Help make San Diego a world-class city for all!
Scott Chadwick Chief Operating Officer
La ciudad de San Diego quiere saber que tan bien está proporcionando servicios a la comunidad, así que le está pidiendo su opinión. ¡Su opinión es importante! Sus respuestas individuales serán mantenidas de forma confidencial. Si usted prefiere hacer la encuesta en español, por favor llame gratis al (844) 811-0411. Necesitamos recibir sus respuestas en los próximos días. Muchas gracias.
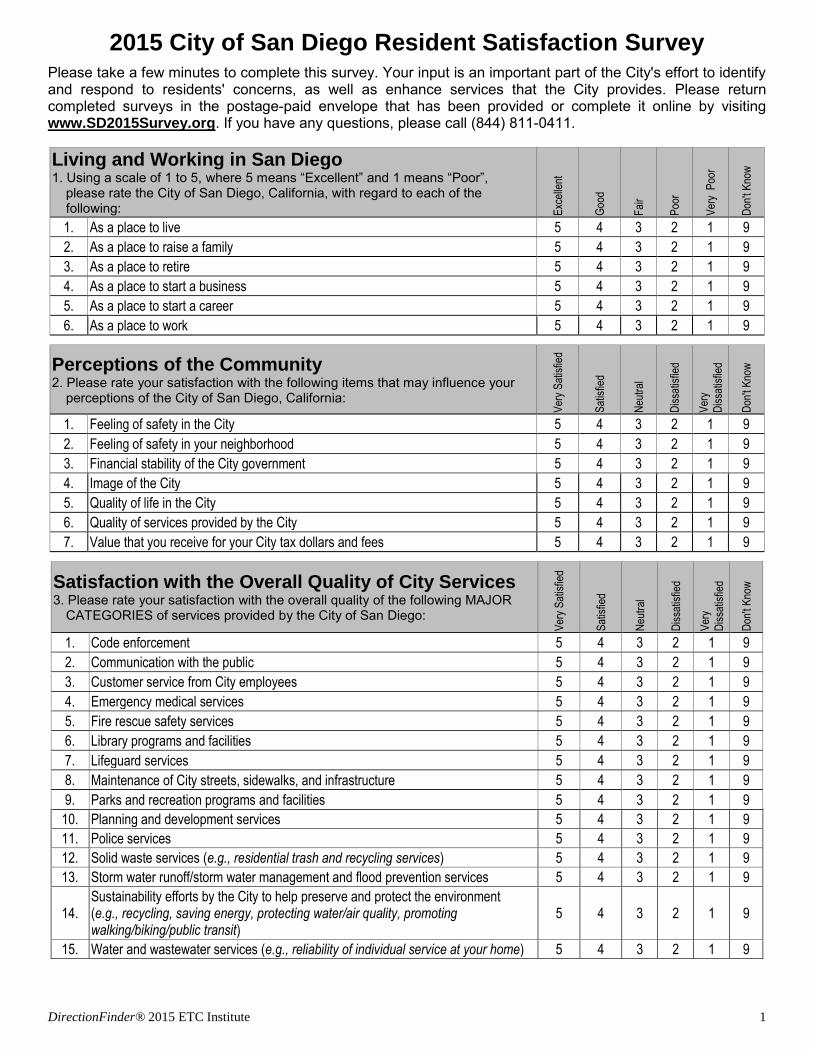
DirectionFinder® 2015 ETC Institute 1
2015 City of San Diego Resident Satisfaction Survey Please take a few minutes to complete this survey. Your input is an important part of the City's effort to identify and respond to residents' concerns, as well as enhance services that the City provides. Please return completed surveys in the postage-paid envelope that has been provided or complete it online by visiting www.SD2015Survey.org. If you have any questions, please call (844) 811-0411.
Living and Working in San Diego 1. Using a scale of 1 to 5, where 5 means “Excellent” and 1 means “Poor”,
please rate the City of San Diego, California, with regard to each of the following: E
xcel
lent
Goo
d
Fai
r
Poo
r
Ver
y P
oor
Don
't K
now
1. As a place to live 5 4 3 2 1 9
2. As a place to raise a family 5 4 3 2 1 9
3. As a place to retire 5 4 3 2 1 9
4. As a place to start a business 5 4 3 2 1 9
5. As a place to start a career 5 4 3 2 1 9
6. As a place to work 5 4 3 2 1 9
Perceptions of the Community 2. Please rate your satisfaction with the following items that may influence your
perceptions of the City of San Diego, California:
Ver
y S
atis
fied
Sat
isfie
d
Neu
tral
Dis
satis
fied
Ver
y
Dis
satis
fied
Don
't K
now
1. Feeling of safety in the City 5 4 3 2 1 9
2. Feeling of safety in your neighborhood 5 4 3 2 1 9
3. Financial stability of the City government 5 4 3 2 1 9
4. Image of the City 5 4 3 2 1 9
5. Quality of life in the City 5 4 3 2 1 9
6. Quality of services provided by the City 5 4 3 2 1 9
7. Value that you receive for your City tax dollars and fees 5 4 3 2 1 9
Satisfaction with the Overall Quality of City Services 3. Please rate your satisfaction with the overall quality of the following MAJOR
CATEGORIES of services provided by the City of San Diego:
Ver
y S
atis
fied
Sat
isfie
d
Neu
tral
Dis
satis
fied
Ver
y
Dis
satis
fied
Don
't K
now
1. Code enforcement 5 4 3 2 1 9
2. Communication with the public 5 4 3 2 1 9
3. Customer service from City employees 5 4 3 2 1 9
4. Emergency medical services 5 4 3 2 1 9
5. Fire rescue safety services 5 4 3 2 1 9
6. Library programs and facilities 5 4 3 2 1 9
7. Lifeguard services 5 4 3 2 1 9
8. Maintenance of City streets, sidewalks, and infrastructure 5 4 3 2 1 9
9. Parks and recreation programs and facilities 5 4 3 2 1 9
10. Planning and development services 5 4 3 2 1 9
11. Police services 5 4 3 2 1 9
12. Solid waste services (e.g., residential trash and recycling services) 5 4 3 2 1 9
13. Storm water runoff/storm water management and flood prevention services 5 4 3 2 1 9
14. Sustainability efforts by the City to help preserve and protect the environment (e.g., recycling, saving energy, protecting water/air quality, promoting walking/biking/public transit)
5 4 3 2 1 9
15. Water and wastewater services (e.g., reliability of individual service at your home) 5 4 3 2 1 9
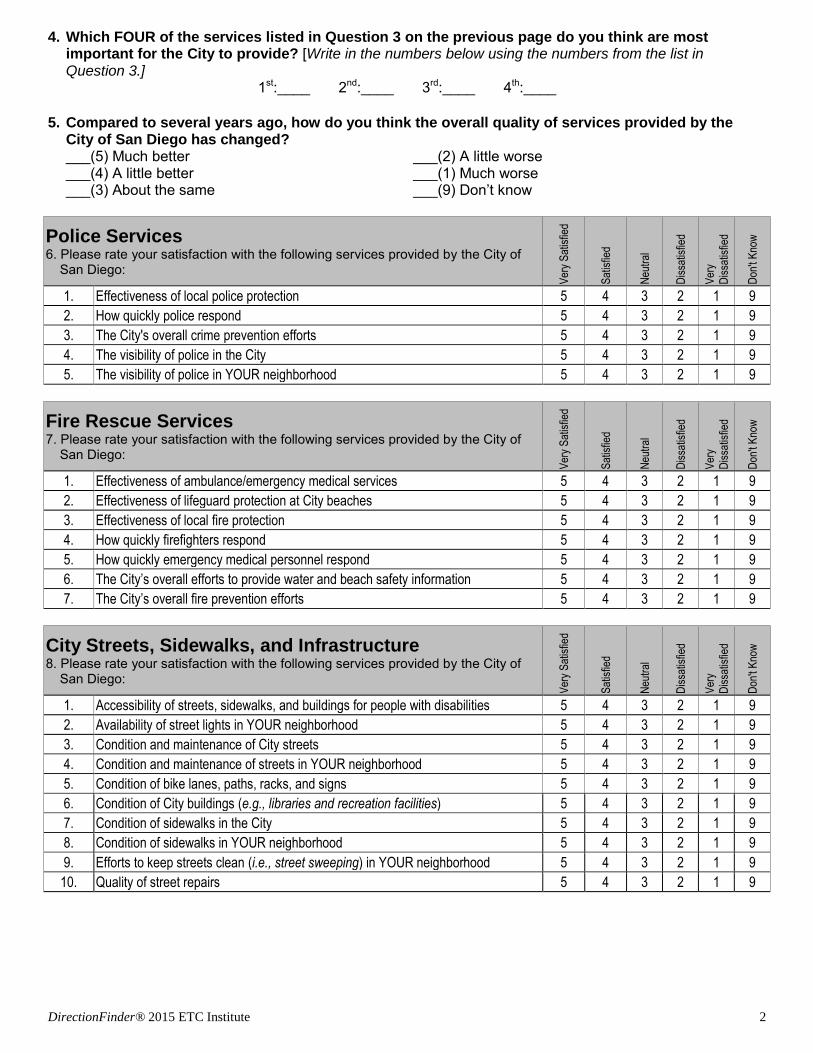
DirectionFinder® 2015 ETC Institute 2
4. Which FOUR of the services listed in Question 3 on the previous page do you think are most important for the City to provide? [Write in the numbers below using the numbers from the list in Question 3.]
1st:____ 2nd:____ 3rd:____ 4th:____
5. Compared to several years ago, how do you think the overall quality of services provided by the City of San Diego has changed? ___(5) Much better ___(4) A little better ___(3) About the same
___(2) A little worse ___(1) Much worse ___(9) Don’t know
Police Services 6. Please rate your satisfaction with the following services provided by the City of
San Diego:
Ver
y S
atis
fied
Sat
isfie
d
Neu
tral
Dis
satis
fied
Ver
y
Dis
satis
fied
Don
't K
now
1. Effectiveness of local police protection 5 4 3 2 1 9
2. How quickly police respond 5 4 3 2 1 9
3. The City's overall crime prevention efforts 5 4 3 2 1 9
4. The visibility of police in the City 5 4 3 2 1 9
5. The visibility of police in YOUR neighborhood 5 4 3 2 1 9
Fire Rescue Services 7. Please rate your satisfaction with the following services provided by the City of
San Diego:
Ver
y S
atis
fied
Sat
isfie
d
Neu
tral
Dis
satis
fied
Ver
y
Dis
satis
fied
Don
't K
now
1. Effectiveness of ambulance/emergency medical services 5 4 3 2 1 9
2. Effectiveness of lifeguard protection at City beaches 5 4 3 2 1 9
3. Effectiveness of local fire protection 5 4 3 2 1 9
4. How quickly firefighters respond 5 4 3 2 1 9
5. How quickly emergency medical personnel respond 5 4 3 2 1 9
6. The City’s overall efforts to provide water and beach safety information 5 4 3 2 1 9
7. The City’s overall fire prevention efforts 5 4 3 2 1 9
City Streets, Sidewalks, and Infrastructure 8. Please rate your satisfaction with the following services provided by the City of
San Diego:
Ver
y S
atis
fied
Sat
isfie
d
Neu
tral
Dis
satis
fied
Ver
y
Dis
satis
fied
Don
't K
now
1. Accessibility of streets, sidewalks, and buildings for people with disabilities 5 4 3 2 1 9
2. Availability of street lights in YOUR neighborhood 5 4 3 2 1 9
3. Condition and maintenance of City streets 5 4 3 2 1 9
4. Condition and maintenance of streets in YOUR neighborhood 5 4 3 2 1 9
5. Condition of bike lanes, paths, racks, and signs 5 4 3 2 1 9
6. Condition of City buildings (e.g., libraries and recreation facilities) 5 4 3 2 1 9
7. Condition of sidewalks in the City 5 4 3 2 1 9
8. Condition of sidewalks in YOUR neighborhood 5 4 3 2 1 9
9. Efforts to keep streets clean (i.e., street sweeping) in YOUR neighborhood 5 4 3 2 1 9
10. Quality of street repairs 5 4 3 2 1 9

DirectionFinder® 2015 ETC Institute 3
Solid Waste Services 9. Please rate your satisfaction with the following services provided by the City of
San Diego:
Ver
y S
atis
fied
Sat
isfie
d
Neu
tral
Dis
satis
fied
Ver
y
Dis
satis
fied
Don
't K
now
1. Residential trash collection 5 4 3 2 1 9
2. Residential recycling services 5 4 3 2 1 9
Sustainability 10. How important is it for the City of San Diego to do the following actions to
support sustainability in the community:
Ver
y Im
port
ant
Impo
rtan
t
Som
ewha
t
Impo
rtan
t
Not
Impo
rtan
t
Not
at A
ll
Impo
rtan
t
Don
't K
now
1. Increase walking, biking, and transit use 5 4 3 2 1 9
2. Provide opportunities to reduce energy use and increase the use of renewable energy
5 4 3 2 1 9
3. Prepare for more frequent storms, increased flooding, extreme heat events, increased wildfires, and severe drought
5 4 3 2 1 9
Parks and Recreation Services 11. Please rate your satisfaction with the following services provided by the City of
San Diego:
Ver
y S
atis
fied
Sat
isfie
d
Neu
tral
Dis
satis
fied
Ver
y D
issa
tisfie
d
Don
't K
now
1. Availability of parks and recreation facilities 5 4 3 2 1 9
2. Hours of operation offered at City parks and recreation facilities 5 4 3 2 1 9
3. Maintenance of City beaches 5 4 3 2 1 9
4. Maintenance of City parks 5 4 3 2 1 9
5. Maintenance of City recreation facilities 5 4 3 2 1 9
6. Maintenance of City swimming pools 5 4 3 2 1 9
7. Open space and walking and biking trails 5 4 3 2 1 9
8. Programs offered at City swimming pools 5 4 3 2 1 9
9. Quality of recreational programs and classes (e.g., dance classes, craft classes, youth sports, after school programs)
5 4 3 2 1 9
Library Services 12. Please rate your satisfaction with the following services provided by the City of
San Diego:
Ver
y S
atis
fied
Sat
isfie
d
Neu
tral
Dis
satis
fied
Ver
y
Dis
satis
fied
Don
't K
now
1. Availability of library facilities 5 4 3 2 1 9
2. Hours of operation offered at City libraries 5 4 3 2 1 9
3. Maintenance of City libraries 5 4 3 2 1 9
4. Quality of library programs (e.g., early literacy, story time, book discussions, community speakers, etc.)
5 4 3 2 1 9
5. Quality of library services and librarians in YOUR neighborhood 5 4 3 2 1 9
6. Resources like computers, tablets, the Internet, books, e-books, CDs/DVDs, downloadable music, etc.
5 4 3 2 1 9

DirectionFinder® 2015 ETC Institute 4
Community Engagement 13. Please rate your satisfaction with the following services provided by the City of
San Diego:
Ver
y S
atis
fied
Sat
isfie
d
Neu
tral
Dis
satis
fied
Ver
y
Dis
satis
fied
Don
't K
now
1. Access to City officials 5 4 3 2 1 9
2. Access to information about City programs and services 5 4 3 2 1 9
3. Outreach efforts to keep the public informed about capital projects 5 4 3 2 1 9
4. Overall usefulness of the City's website 5 4 3 2 1 9
5. The City's television channel (City 24) 5 4 3 2 1 9
Other Services 14. Please rate your satisfaction with the following:
Ver
y S
atis
fied
Sat
isfie
d
Neu
tral
Dis
satis
fied
Ver
y
Dis
satis
fied
Don
't K
now
1. Blight (rundown buildings, vacant lots, and abandoned vehicles) 5 4 3 2 1 9
2. Code enforcement 5 4 3 2 1 9
3. Ease of obtaining permits from Development Services 5 4 3 2 1 9
4. Efforts to address homelessness 5 4 3 2 1 9
5. Efforts to assist low- to moderate-income residents and communities 5 4 3 2 1 9
6. Efforts to plan for future growth 5 4 3 2 1 9
7. Efforts to support job creation and investment by local businesses 5 4 3 2 1 9
8. Gang prevention efforts 5 4 3 2 1 9
9. Graffiti removal 5 4 3 2 1 9
10. Historic preservation efforts 5 4 3 2 1 9
11. Music, dance, and theater performances; visual art and cultural exhibitions; parades, festivals, art classes, and public art
5 4 3 2 1 9
12. Online services (e.g., paying a bill, getting a business license) 5 4 3 2 1 9
13. Quality of services provided to people with disabilities 5 4 3 2 1 9
14. Quality/variety of entertainment, expositions, and sporting events at the Convention Center, Petco Park, and QUALCOMM Stadium
5 4 3 2 1 9
15. Traffic congestion on City streets 5 4 3 2 1 9
Customer Service 15. How would you rate the City employees with whom you had contact most
recently in terms of…
Exc
elle
nt
Goo
d
Fai
r
Poo
r
Ver
y P
oor
Don
't K
now
1. Courtesy 5 4 3 2 1 9
2. Knowledge 5 4 3 2 1 9
3. Overall customer service 5 4 3 2 1 9
4. Responsiveness 5 4 3 2 1 9
16. Is there anything that the City of San Diego has not asked about that you want us to ask about in future surveys?
___(1) Yes (If so, what? ____________________________________________________________) ___(2) No
17. Are you satisfied with the process of reporting problems (i.e., potholes) to the City? ___(1) Yes ___(2) No ___(9) Don’t know
18. What would be your preferred method for reporting problems to the City?
___(1) Mobile application ___(2) Web site ___(3) Cellular telephone
___(4) Text message ___(5) Social media (Facebook, Twitter, etc.)

DirectionFinder® 2015 ETC Institute 5
19. What do you feel that the City could do to make San Diego a better place to live?
________________________________________________________________________
________________________________________________________________________ Demographics
20. What is your age? _______ years old 21. How many years have you lived in San Diego? _______ years 22. Combining all persons living in your household, which of the following best describes your household’s annual, taxable income?
___(1) Less than $25,000 ___(2) $25,000 - $49,999 ___(3) $50,000 - $74,999
___(4) $75,000 - $99,999 ___(5) $100,000 - $149,999 ___(6) $150,000 or more
23. Do you own or rent your home? ___(1) Own ___(2) Rent 24. What is the primary method of transportation?
___(1) Personal motorized vehicle (car, van, etc.)
___(2) Public transportation/bus
___(3) Walk ___(4) Bike ___(5) Other:____________________
25. Which of the following best describes your RACE? (Check all that apply.) ___(1) Black or African American ___(2) American Indian or Alaskan Native ___(3) Asian
___(4) Hawaiian or Pacific Islander ___(5) White or Caucasian ___(6) Other:__________________
26. Do you consider yourself to be Hispanic/Latino? ___(1) Yes ___(2) No 27. Your gender: ___(1) Male ___(2) Female 28. If you prefer not to provide your address (which is captured below), and know which Council District you live in, please provide your Council District: Council District:______________
(If you DO NOT know which Council District you live in, please visit http://sdgo.io/cd-check and type in your address.)
This concludes the survey. Thank you for your time! Please return your completed survey to:
ETC Institute, 725 W. Frontier Circle, Olathe, KS 66061
Individual responses to the survey will remain confidential. The information printed to the right will ONLY be used by the City to understand differences in the experience based on geography. If your address is not correct, please provide the correct information.