Embed Size (px)
Citation preview

Huang, Y.W., Residential Cooking Behavior in the United States: Data Collected from a Web-Based Survey
LBNL- XXXXX
Page 1
Residential Cooking Behavior in the
United States: Data Collected from a
Web-Based Survey
Y.W. Huang, E.E. Andrew, T.C. Hu, B.C Singer, L. Ding, J.M. Logue1
Environmental Energy Technologies Division
August 2014
Funding was provided by the U.S. Dept. of Energy Building Technologies Program,
Office of Energy Efficiency and Renewable Energy under DOE Contract No. DE-AC02-
05CH11231; by the U.S. Dept. of Housing and Urban Development Office of Healthy
Homes and Lead Hazard Control through Interagency Agreement I-PHI-01070, and
by the California Energy Commission through Contract 500-08-061.
LBNL Report Number XXXX-X
1 Corresponding author: [email protected]
LBNL 175686

Huang, Y.W., Residential Cooking Behavior in the United States: Data Collected from a Web-Based Survey
LBNL- XXXXX
Page 2
Disclaimer
This document was prepared as an account of work sponsored by the United States Government. While
this document is believed to contain correct information, neither the United States Government nor any
agency thereof, nor The Regents of the University of California, nor any of their employees, makes any
warranty, express or implied, or assumes any legal responsibility for the accuracy, completeness, or
usefulness of any information, apparatus, product, or process disclosed, or represents that its use would
not infringe privately owned rights. Reference herein to any specific commercial product, process, or
service by its trade name, trademark, manufacturer, or otherwise, does not necessarily constitute or
imply its endorsement, recommendation, or favoring by the United States Government or any agency
thereof, or The Regents of the University of California. The views and opinions of authors expressed
herein do not necessarily state or reflect those of the United States Government or any agency thereof,
or The Regents of the University of California.
Ernest Orlando Lawrence Berkeley National Laboratory is an equal opportunity employer.

Huang, Y.W., Residential Cooking Behavior in the United States: Data Collected from a Web-Based Survey
LBNL- XXXXX
Page 3
Abstract Cooking has a significant impact on indoor air quality. When cooking occurs, how foods are cooked, and
the types of food that are cooked have all been shown to impact the rate at which occupants are
exposed to pollutants. Home occupancy characteristics impact how concentrations in the home
translate into exposures for the occupants. With the intent of expanding our understanding of cooking
behavior in the U.S., we developed and advertised an online survey to collect household cooking
behavior for the 24 hrs prior to taking the survey. The survey questions were designed to address gaps
in knowledge needed to predict the impact of cooking on indoor concentrations of PM2.5 and other
pollutants. The survey included the following questions: 1) which meals households ate at home; 2)
number of household members at home during cooking; 3) the type of oil used for cooking; 4) the type
of foods cooked at each meal; 5) the type of cooking devices used; and 6) the methods selected for food
preparation. We also collected information on household characteristics such as their location (zip
code), ethnicity, and ages of family members. We analyzed the variability in home cooking
characteristics for households in different climate zones and with four different types of family
compositions: 1 senior living alone, 1 adult living alone, 2 or more adults/seniors, and families with
children. We used simple statistical tests to determine if the probability of certain cooking behaviors
differed between these subgroups.
Contents
Abstract .................................................................................................................................................. 3
Introduction ............................................................................................................................................ 4
Methods .................................................................................................................................................. 4
Results and Discussion ............................................................................................................................. 5
Survey Response Characteristics .......................................................................................................... 5
Survey Response Demographics .......................................................................................................... 6
Frequency of meals cooked at home ................................................................................................. 10
Usage of different oils while cooking ................................................................................................. 14
Characteristics of meals eaten at home ............................................................................................. 20
Household occupants present at mealtimes ................................................................................... 21
Respondent cooking device selection ............................................................................................. 32
Respondent cooking method selection .......................................................................................... 42
Conclusion ............................................................................................................................................. 50
References ............................................................................................................................................ 50
Appendix: Administered cooking survey questionnaire .......................................................................... 51

Huang, Y.W., Residential Cooking Behavior in the United States: Data Collected from a Web-Based Survey
LBNL- XXXXX
Page 4
Introduction On average, Americans spend more than 65% of their time in residences (Klepeis et al. 2001). The air
that occupants breathe in homes has a substantial impact on occupant health and comfort (Edwards et
al. 2001; Weisel et al. 2005). The Lawrence Berkeley National Laboratory (LBNL) is in the process of
developing a data-driven, physics-based model to assess the energy and indoor air quality (IAQ) impacts
of ventilation and pollutant mitigation measures on the U.S. population for both new and retrofitted
homes. The modeling framework is designed to provide technical support to develop energy efficient,
health-based solutions to reduce the burden of indoor air pollutants. Specifically, the model is designed
to assess the population and sub-population impact of changes in policy, behavior, and technologies
used in homes on indoor concentrations and exposures. Including the health effects of cooking-related
pollutants in the model requires knowledge of cooking behavior in U.S. homes, an area where there is
limited data.
In order to determine nationwide cooking behavior in homes, we developed, posted, and advertised a
web-based survey to assess occupant cooking behavior. A previous study at LBNL focused on a specific
set of cooking behaviors in California homes (Klug et al. 2011). The purpose of this study is to expand the
number of survey respondents and to assess cooking related statistics for parameters that were
identified as important to assessing cooking impacts on PM2.5 concentrations, which has been identified
as a major health concern in homes (Logue et al. 2012).
The survey was distributed widely, and results presented here are for all U.S. respondents. We did not
provide incentives for completing the survey, and survey respondents do not cover all demographics
and geographical regions in a representative manner. Despite this, these results provide useful data on
national cooking behavior to advance the study of the impact of cooking on indoor concentrations and
exposures.
Methods This cooking survey was administered using the online survey tool Survey Monkey
(www.surveymonkey.com), with which users can create and post their own questionnaires and gather
responses. The survey was distributed though social media including air quality and home interest
groups on LinkedIn and Facebook, through list serves including the LBNL employee listserv, and through
online media including the blog BoingBoing.net. Responses were gathered from 7/15/2012 to
3/21/2013. The majority of responses coincided with the BoingBoing.net post, which may bias the
results toward households with a Caucasian male over 35, based on BoingBoing.net readership
demographics. The survey was approved and deemed exempt from annual review by the Human
Subjects Committee of LBNL.
The survey was designed to ask respondents about their home demographics and their in- home cooking
behavior in the past 24 hrs. Questions were asked about the past 24 hrs because this activity would be
easier to remember and report accurately. Specifically, questions included: whether breakfast, lunch or
dinner was cooked in the past 24 hrs; the number of occupants home during each meal over the past 24
hrs; the type of cooking devices used for each meal; the different kinds of oil used in the home; the
kinds of food cooked for each meal over the past 24 hours; and the cooking methods conducted over

Huang, Y.W., Residential Cooking Behavior in the United States: Data Collected from a Web-Based Survey
LBNL- XXXXX
Page 5
the past 24 hrs. Only those who reported cooking a specific meal (breakfast, lunch, dinner) in the past 24
hrs where asked further questions about meal preparation/characteristics. Demographic questions
included: number and age of home occupants, home zip code, ethnicities of occupants, gender of
primary cook, and type of home. Full details of the survey questionnaire can be found in the Appendix.
When analyzing the survey responses, we are assuming that only one person responded per household
or, in other words, each survey corresponds to the behavior of 1 distinct household.
In order to assess regional differences in cooking behavior, we separated the respondents into the
International Energy Conservation Code (IECC) U.S. climate zone and states. There was insufficient data
to compare between states, therefore only the comparison between climate zones is included in the
report. We also compared the differences between homes with different types of family compositions: 1
senior living alone, 1 adult living alone, 2 or more adults/seniors without kids, and 1 or more kids and
adults/seniors. These groupings correspond to the age groupings used by Klug, Lobscheid et al. (2011).
We use tables and graphs to get an intuitive sense of each parameter’s impact on the cooking behavior
and used statistical analysis to determine if differences seen between subgroups were statistically
significant. For each cooking parameter, we used the response results to determine the probability that
homes of a certain type or in a certain location would have occupants present for certain meals, use
certain cooking devices or if they would cook certain food types or not, etc. For each of these questions
we report the probability, p, and the uncertainty, σ, in the reported probability. The probability, p, is
determined as the percentage of occupants who responded that a specific condition occurred. We
define the uncertainty in p as the 95th
percentile confidence interval of p using the normal
approximation method for binomial confidence intervals since we do not have knowledge of the
underlying distribution of the data. The uncertainty, σ, in p for the values reported in this work is
defined as a function of p and the number of respondents for each question, n, as shown in Equations 1
and 2 (Navidi 2006).
� ± � (1)
� ± 1.96�(��)� (2)
One drawback of the normal approximation is that the farther p is from 1/2, the larger the sample size
needs to be for the normal approximation to be acceptable. We used the rule of thumb that the normal
approximation was only applied when n*p and n*(1-p) were either greater than or equal to 10 (Navidi
2006). When this was not the case, uncertainty could not be determined and was not included in the
presented results.
Results and Discussion
Survey Response Characteristics
Table 1 shows respondent characteristics based on the following factors: total number of respondents,
respondents that completed the entire survey, U.S. residents that completed the entire survey, and
those U.S. residents that completed the survey and reported valid zip codes. There were 2,821 total
Huang, Y.W., Residential Cooking Behavior in the United States: Data Collected from a Web-Based Survey
LBNL- XXXXX
Page 6
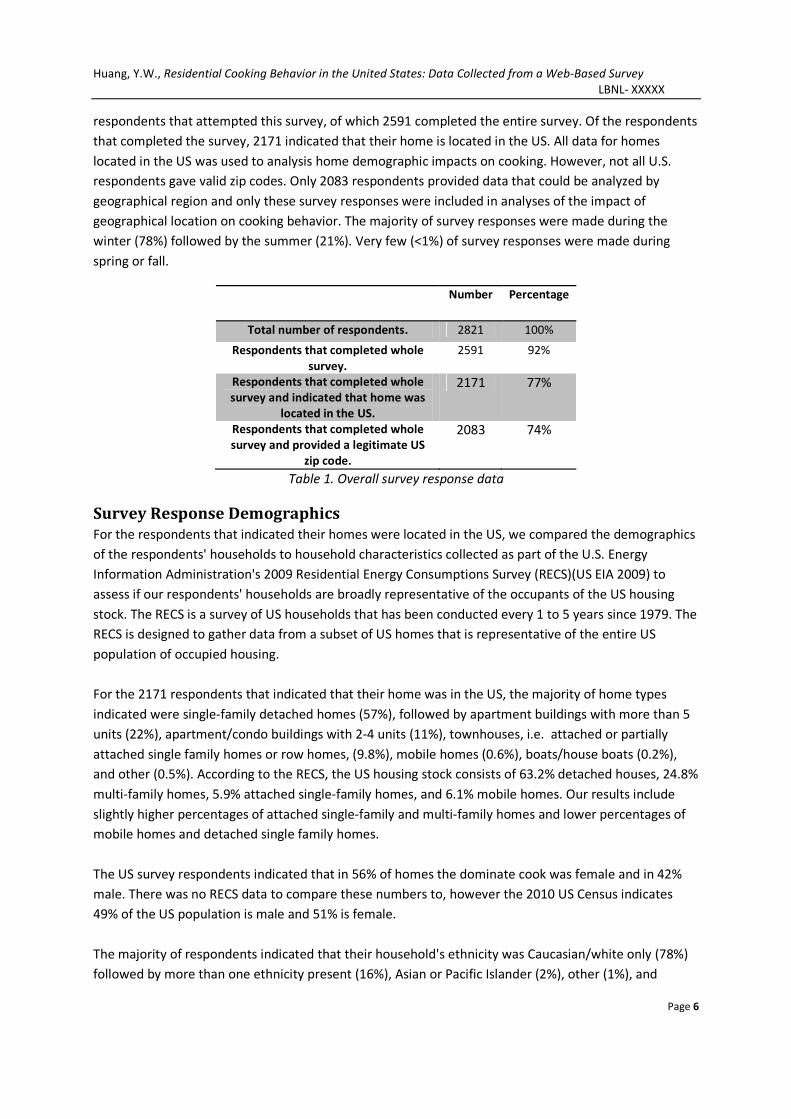
respondents that attempted this survey, of which 2591 completed the entire survey. Of the respondents
that completed the survey, 2171 indicated that their home is located in the US. All data for homes
located in the US was used to analysis home demographic impacts on cooking. However, not all U.S.
respondents gave valid zip codes. Only 2083 respondents provided data that could be analyzed by
geographical region and only these survey responses were included in analyses of the impact of
geographical location on cooking behavior. The majority of survey responses were made during the
winter (78%) followed by the summer (21%). Very few (<1%) of survey responses were made during
spring or fall.
Number Percentage
Total number of respondents. 2821 100%
Respondents that completed whole
survey.
2591 92%
Respondents that completed whole
survey and indicated that home was
located in the US.
2171 77%
Respondents that completed whole
survey and provided a legitimate US
zip code.
2083 74%
Table 1. Overall survey response data
Survey Response Demographics
For the respondents that indicated their homes were located in the US, we compared the demographics
of the respondents' households to household characteristics collected as part of the U.S. Energy
Information Administration's 2009 Residential Energy Consumptions Survey (RECS)(US EIA 2009) to
assess if our respondents' households are broadly representative of the occupants of the US housing
stock. The RECS is a survey of US households that has been conducted every 1 to 5 years since 1979. The
RECS is designed to gather data from a subset of US homes that is representative of the entire US
population of occupied housing.
For the 2171 respondents that indicated that their home was in the US, the majority of home types
indicated were single-family detached homes (57%), followed by apartment buildings with more than 5
units (22%), apartment/condo buildings with 2-4 units (11%), townhouses, i.e. attached or partially
attached single family homes or row homes, (9.8%), mobile homes (0.6%), boats/house boats (0.2%),
and other (0.5%). According to the RECS, the US housing stock consists of 63.2% detached houses, 24.8%
multi-family homes, 5.9% attached single-family homes, and 6.1% mobile homes. Our results include
slightly higher percentages of attached single-family and multi-family homes and lower percentages of
mobile homes and detached single family homes.
The US survey respondents indicated that in 56% of homes the dominate cook was female and in 42%
male. There was no RECS data to compare these numbers to, however the 2010 US Census indicates
49% of the US population is male and 51% is female.
The majority of respondents indicated that their household's ethnicity was Caucasian/white only (78%)
followed by more than one ethnicity present (16%), Asian or Pacific Islander (2%), other (1%), and

Huang, Y.W., Residential Cooking Behavior in the United States: Data Collected from a Web-Based Survey
LBNL- XXXXX
Page 7
American Indian/Alaskan Native (0.3%). The RECs determined that US households are 79%
Caucasian/white, 14% Black or African American, 3% Asian, 1% American Indian or Alaska Native, 2%
Other, and 1.32% more than one race. Our results have a much higher presence of household containing
more than one race that the US household demographics and under-represents single ethnicity
households other than White/Caucasian.
For our survey respondents, home occupancy ranged from 1 to 14 occupants. The majority of homes
had 2 occupants (42%), followed by 3 occupants (20%), 1 occupant (18%), 4 occupants (16%), and 5
occupants (3.4%). Less than 2% had more than 5 occupants. The RECs indicated that 32% of US
households contain 2 occupants, 28% contain 1 occupant, 16% 3 occupants, 14% 4 occupants, 7% have 5
occupants, and 4% have 6 or more occupants. Our results have higher number of households with 1 or 2
occupants and lower representation of higher occupancy households compared to the national data.
Figure 1. Number of respondents according to household demographics
Almost every survey respondent's house had a 18-64 year old present (99%), 20% had 1 or more seniors
(>65 years of age), 31% indicated the presence of a young child (0-5) and 31% indicated the presence of
an older child (6-17 years of age). According to the RECS, 89% of US homes contained a 18-64 year old,
22% contained 1 or more seniors, 36% have at least one young child, and 38% have one or more older
child (6-17).
We divided occupancy into 4 broad characteristics for the respondent homes based on demographics
used in previous cooking surveys (Klug et al. 2011). Figure 1 describes the occupancy characteristics of
the respondents' homes. The “2 or more adults/seniors without children” category was the most
common living situation selected and had almost twice the number of respondents than the “1 or more
children and adults/seniors” category. Residencies housing only one senior have the fewest
respondents. A senior was considered to be anyone age 65 and older, and a child was considered to be
anyone less than 18 years of age for this survey. Figure 1 also shows the prevalence of each home type
in the RECS. Compared to US demographics, our survey respondents over represent households with 2
or more adults/seniors without children and under represent households with children and with a single
senior.
0.6%17%
54%
28%
Survey Respondents
1 senior
1 adult
2+ adults/seniors and
no children
1+ children and adults/
seniors
10%
17%
22%
51%
RECS National Data

Huang, Y.W., Residential Cooking Behavior in the United States: Data Collected from a Web-Based Survey
LBNL- XXXXX
Page 8
Table 2. Number of respondents by climate zone (CZ)
The International Energy Conservation Code (IECC) subdivides the country into 15 climate zones based
on similar weather patterns (US DOE 2010), Figure 2. These designations are often used to identify
appropriate characteristics for buildings based on expected weather conditions for the area. Weather
and regional cultural variations may impact cooking behavior. Since we did not have enough data to
inter-compare between states, we chose to inter-compare between climate zones. Table 2 includes the
number of respondents in each IECC climate zone (Figure 2). Major representative cities and climate
descriptions are also included. For comparison, the percentage of US households in each climate zone
determined from US census data (US Census Bureau 2012) and the IECC assigned climate zone (US DOE
2010) for each county is also included. Climate zone (CZ) 4a and 5a (represented by the cities Baltimore
and Chicago, respectively) have over 400 respondents, whereas other climate zones have much fewer
Climate zones
Representative
City
Climate
Description
Number (percentage)
of respondents
Percentage of
US homes
(RECS)
CZ 1 Miami, Florida hot, humid 12 (0.6%) 1.7%
CZ 2a Houston, Texas hot, humid 103 (4.9%) 11%
CZ 2b Phoenix, Arizona hot, dry 20 (1.0%) 1.8%
CZ 3a Atlanta, Georgia hot, humid 114 (5.5%) 14%
CZ 3b Los Angeles,
California hot, dry 291 (14%) 9.4%
CZ 3c San Francisco,
California marine 369 (18%) 2.3%
CZ 4a Baltimore,
Maryland mild, humid 413 (20%) 21.4%
CZ 4b Albuquerque,
New Mexico mild, dry 17 (0.8%) 0.8%
CZ 4c Seattle,
Washington marine 103 (4.9%) 2.9%
CZ 5a Chicago, Illinois cold, humid 415 (20%) 23%
CZ 5b Denver, Colorado cold, dry 79 (3.8%) 3.7%
CZ 6a Minneapolis,
Minnesota cold, humid 129 (4.9%) 6.9%
CZ 6b Helena, Montana cold, dry 10 (0.5%) 0.9%
CZ 7 Duluth,
Minnesota very cold 5 (0.2%) 0.9%
CZ 8 Fairbanks, Alaska extreme cold 3 (0.1%) 0.1%
Total 2083

Huang, Y.W., Residential Cooking Behavior in the United States: Data Collected from a Web-Based Survey
LBNL- XXXXX
Page 9
survey responses (e.g. CZ 7 and CZ 8). Due to the small sample size of some of these climate zones, it is
less likely that the survey results from those areas are representative of the entire climate zone
compared to zones with more respondents. The majority of respondents are from humid or marine
climate zones, and California (CZ 3b and CZ 3c) has a large representation. This is likely because
California, the state where the survey originated, covers much of the area in CZ 3b and 3C. CZ 3b, CZ 3c,
CZ 4a, CZ 5a and CZ 6a have greatest representation, and will be used most often for inter-climate zone
comparisons. Figure 3 compares the percentage of survey respondents per climate zone and the
percentage of US homes located in each climate zone. Compared to US housing demographics, survey
responses most significantly under represent responses from CZ 2a and CZ 3a and most over represent
CZ 3b and 3c.
Figure 2. Map of IECC climate zones (CZs). Alaska (CZ 7 and CZ8) and Hawaii, Guam, Puerto Rico,
and the Virgins Island (all CZ 1) are not shown.
Figure 3. Percentage of survey respondents and US households in each climate zones
0%
5%
10%
15%
20%
25%
CZ 1 CZ 2a CZ 2b CZ 3a CZ 3b CZ 3c CZ 4a CZ 4b CZ 4c CZ 5a CZ 5b CZ 6a CZ 6b CZ 7 CZ 8
US Housing Demographics
Survey Respondents

Huang, Y.W., Residential Cooking Behavior in the United States: Data Collected from a Web-Based Survey
LBNL- XXXXX
Page 10
Frequency of meals cooked at home
This section presents the data on cooking frequency in homes by household occupancy type/location.
Figure 4 and Table 3 show the percentage of respondents that reported having specific meals at home
for each family composition. On average, the most commonly eaten meal at home was dinner, followed
by breakfast and lunch, respectively. There was no statistically significant difference between the rates
at which different family types without children reported eating meals at home. Families with at least
one child ate breakfast and dinner at home slightly more frequently than homes with 1 adult or 2 or
more adults/ seniors. Due to the low response rate of 1 senior households, we could not determine the
uncertainty in the probability of eating meals at home for that demographic. All and all, there does not
appear to be large variation in the frequency families eat different types of meals at home based on the
age groups present in that home.
Figure 4. Percentage of households having breakfast, lunch, and dinner at home (bars) and the 95th
percentile confidence intervals of the probability that different households occupancy types have
breakfast, lunch, and dinner at home (whiskers).
0%
10%
20%
30%
40%
50%
60%
70%
80%
90%
100%
Breakfast Lunch Dinner
1 senior
1 adult
2+ adults/seniors,
no children
1+ children and
adults/seniors

Huang, Y.W., Residential Cooking Behavior in the United States: Data Collected from a Web-Based Survey
LBNL- XXXXX
Page 11
Table 3. Probability, p, and uncertainty, σ, that different household demographics have breakfast, lunch,
or dinner at home. Values are in percentages (%). NA indicates that the uncertainty could not be
calculated. N indicates the number of respondents in each family type.
Figure 5. Percentage of households having breakfast home (bars) for all climate zones and the 95th
percentile confidence interval of the probability that different climate zones eat breakfast at home
(whiskers). The number of respondents (N) for each climate zone is included.
Figure 5 compares the percentage of respondents eating breakfast at home for all climate zones. Half or
more of all households for each climate zones ate breakfast at home. All respondents from CZ 8 ate
breakfast at home, but there is a small sample size (see Figure 3). CZ 1 has the smallest percentage of
individuals eating breakfast at home, also with a small sample size. CZ 5a has the greatest
representation of all climate zones, with 71% of respondents having eaten breakfast at home the day
before. The weighted average of these percentages for having breakfast at home is 73%. Table 4 shows
the uncertainty in the probabilities that households in each climate zone eat meals at home. Based on
0% 10% 20% 30% 40% 50% 60% 70% 80% 90% 100%
CZ 1
CZ 2a
CZ 2b
CZ 3a
CZ 3b
CZ 3c
CZ 4a
CZ 4b
CZ 4c
CZ 5a
CZ 5b
CZ 6a
CZ 6b
CZ 7
CZ 8
N= 12
N= 103
N= 20
N= 114
N= 291
N= 369
N= 413
N= 3
N= 5
N= 10
N= 129
N= 79
N= 415
N= 103
N= 17
Age groups Breakfast Lunch Dinner N
1 senior 69 ± NA 38 ± NA 85 ± NA 13
1 adult 68 ± 4.7 35 ± 4.9 81 ± 4.0 371
2 or more adults/seniors
without children 70 ± 2.6 38 ± 2.8 83 ± 2.2 1175
1 or more children and
adults/seniors 82 ± 3.1 40 ± 3.9 89 ± 2.5 614
Weighted average 73 ± 1.9 38 ± 2.0 84 ± 0.0 2173

Huang, Y.W., Residential Cooking Behavior in the United States: Data Collected from a Web-Based Survey
LBNL- XXXXX
Page 12
the available uncertainties, we cannot say any climate zone eats breakfast more or less than any other.
Figure 6. Percentage of households having lunch at home (bars) for all climate zones and the 95th
percentile confidence interval of the probability that different climate zones eat lunch at home
(whiskers). The number of respondents (N) for each climate zone is included.
Figure 6 compares the percentage of respondents eating lunch at home for all climate zones. Fewer than
half of households for each climate zone ate lunch at home. CZ 6a has the greatest percentage of
household reporting eating lunch at home, followed by CZ 5b. CZ 8 has the smallest percentage of
people reported eating lunch at home, although the sample size is quite small relative to CZ 6a and CZ
5b (see figure 3). The weighted average of these percentages for having lunch at home is 37%. There is
no statistically significant difference in the derived probabilities that households eat lunch at home
between the climate zones as shown in Table 4.
0% 10% 20% 30% 40% 50% 60% 70% 80% 90% 100%
CZ 1
CZ 2a
CZ 2b
CZ 3a
CZ 3b
CZ 3c
CZ 4a
CZ 4b
CZ 4c
CZ 5a
CZ 5b
CZ 6a
CZ 6b
CZ 7
CZ 8
N= 12
N= 103
N= 20
N= 114
N= 291
N= 369
N= 413
N= 3
N= 5
N= 10
N= 129
N= 79
N= 415
N= 103
N= 17

Huang, Y.W., Residential Cooking Behavior in the United States: Data Collected from a Web-Based Survey
LBNL- XXXXX
Page 13
Figure 7. Percentage of households having dinner at home (bars) for all climate zones and the 95th
percentile confidence interval of the probability that different climate zones eat dinner at home
(whiskers). The number of respondents (N) for each climate zone is included.
Figure 7 compares the percentage of respondents eating dinner at home (bars) for all climate zones and
the 95th percentile confidence interval of the probability that different climate zones eat dinner at home
(whiskers). Greater than half of all respondents ate dinner at home, and all respondents from CZ 6b, CZ
7, and CZ 8 reported being home for dinner. For CZ 1, 58% of respondents ate dinner at home, the
lowest value. There was no significant difference between calculated probabilities for the climate zones.
0% 10% 20% 30% 40% 50% 60% 70% 80% 90% 100%
CZ 1
CZ 2a
CZ 2b
CZ 3a
CZ 3b
CZ 3c
CZ 4a
CZ 4b
CZ 4c
CZ 5a
CZ 5b
CZ 6a
CZ 6b
CZ 7
CZ 8
N= 12
N= 103
N= 20
N= 114
N= 291
N= 369
N= 413
N= 3
N= 5
N= 10
N= 129
N= 79
N= 415
N= 103
N= 17

Huang, Y.W., Residential Cooking Behavior in the United States: Data Collected from a Web-Based Survey
LBNL- XXXXX
Page 14
Breakfast Lunch Dinner
CZ1 50 ± NA 25 ± NA 58 ± NA
CZ2a 72 ± 8.7 40 ± 9.5 83 ± 7.3
CZ2b 65 ± NA 30 ± NA 75 ± NA
CZ3a 68 ± 8.5 45 ± 9.1 85 ± 6.5
CZ3b 76 ± 4.9 42 ± 5.7 87 ± 3.9
CZ3c 78 ± 4.2 36 ± 4.9 83 ± 3.8
CZ4a 70 ± 4.4 33 ± 4.5 83 ± 3.6
CZ4b 53 ± NA 35 ± NA 76 ± NA
CZ4c 72 ± 8.7 40 ± 9.5 83 ± 7.3
CZ5a 71 ± 4.4 38 ± 4.7 85 ± 3.5
CZ5b 81 ± 8.6 41 ± 11 90 ± NA
CZ6a 71 ± 7.8 36 ± 8.3 85 ± 6.1
CZ6b 80 ± NA 30 ± NA 90 ± NA
CZ7 80 ± NA 40 ± NA 100 ± NA
CZ8 100 ± NA 33 ± NA 100 ± NA
Table 4. Probability and uncertainties of households having meals at home in each climate zones. Values
are in percentages (%).NA indicates that the uncertainty could not be calculated.
Usage of different oils while cooking
The following figures and tables were generated based on respondent usage of the following oils: canola
oil, vegetable oil, peanut oil, soybean oil, olive oil, and “other” oils. Household type and climate zones
are the variables considered with oil use. Respondents chose all applicable responses.
Figure 8. Percentage of household reporting cooking oil use according to household type (bars) and the
95th percentile confidence interval of the probability that different household types will use cooking oils
(whiskers).
0% 20% 40% 60% 80% 100%
1 senior
1 adult
2 or more adults/seniors without
children
1 or more children and
adults/seniors
other oil
canola oil
vegetable oil
peanut oil
soybean oil
olive oil

Huang, Y.W., Residential Cooking Behavior in the United States: Data Collected from a Web-Based Survey
LBNL- XXXXX
Page 15
Figure 8 compares types of oil used per household type. Across all household types, olive oil is the most
commonly used oil, followed by canola oil, then vegetable oil. Both “1 or more children and
adults/seniors” and “2 or more adults/seniors without children” have over 90% of respondents claiming
to have used olive oil within the past 24 hours. As shown in Table 5, there is no significant difference in
the use of any particular type of oil for the different family types except for slight differences in
percentages of households that use canola oil. There are large differences in the usage rates of different
types of oil in all homes with the vast majority of homes using olive oil at some point and relatively few
homes recorded using soybean oil. The top oils people indicated using in the "other" category were
coconut oil (107 respondents), sesame oil (96 respondents), and grapeseed oil (61 respondents). Eighty-
four of the respondents said they did not use oil but used butter.
Household type Olive oil Soybean oil Peanut oil Vegetable oil Canola oil Other oil
Num. of
respondents
1 senior
85 ± 20 15 ± NA 23 ± NA 23 ± NA 61 ± NA 23 ± NA 13
1 adult 90 ± NA 8.0 ± 2.8 24 ± 4.3 53 ± 5.1 58 ± 5.0 24 ± 4.3 371
2 + adults/seniors
without children 93 ± NA 9.2 ± 1.7 30 ± 2.6 62 ± 2.6 63 ± 2.8 23 ± 2.4 1175
1 + children and
adults/seniors 92 ± NA 10 ± 2.4 29 ± 3.6 62 ± 3.6 72 ± 3.8 20 ± 3.2 614
Weighted average 92 ± 1.1 9.3 ± 1.2 29 ± 1.9 60 ± 1.9 65 ± 2.0 22 ± 1.7 2173
Table 5. Probability and uncertainties of households using various oils for each home occupancy type.
Values are in percentages (%).
Figure 9. Percentage of households reporting using olive oil (bars) for all climate zones and the 95th
percentile confidence interval of the probability that different households will use olive oil (whiskers).
0%
10%
20%
30%
40%
50%
60%
70%
80%
90%
100%
CZ 1 CZ 2a CZ 2b CZ 3a CZ 3b CZ 3c CZ 4a CZ 4b CZ 4c CZ 5a CZ 5b CZ 6a CZ 6b CZ 7 CZ 8

Huang, Y.W., Residential Cooking Behavior in the United States: Data Collected from a Web-Based Survey
LBNL- XXXXX
Page 16
Figure 10. Percentage of household reporting using soybean oil (bars) for all climate zones and the 95th
percentile confidence interval of the probability that different households will use soybean oil (whiskers).
Figure 11. Percentage of households reporting using peanut oil (bars) for all climate zones and the 95th
percentile confidence interval of the probability that different households will use peanut oil (whiskers).
0%
10%
20%
30%
40%
50%
60%
70%
80%
90%
100%
CZ 1 CZ 2a CZ 2b CZ 3a CZ 3b CZ 3c CZ 4a CZ 4b CZ 4c CZ 5a CZ 5b CZ 6a CZ 6b CZ 7 CZ 8
0%
10%
20%
30%
40%
50%
60%
70%
80%
90%
100%
CZ 1 CZ 2a CZ 2b CZ 3a CZ 3b CZ 3c CZ 4a CZ 4b CZ 4c CZ 5a CZ 5b CZ 6a CZ 6b CZ 7 CZ 8

Huang, Y.W., Residential Cooking Behavior in the United States: Data Collected from a Web-Based Survey
LBNL- XXXXX
Page 17
Figure 12. Percentage of households reporting using vegetable oil (bars) for all climate zones and the
95th percentile confidence interval of the probability that different households will use vegetable oil
(whiskers).
Figure 13. Percentage of households reporting using canola oil (bars) for all climate zones and the 95th
percentile confidence interval of the probability that different households will use canola oil (whiskers).
0%
10%
20%
30%
40%
50%
60%
70%
80%
90%
100%
CZ 1 CZ 2a CZ 2b CZ 3a CZ 3b CZ 3c CZ 4a CZ 4b CZ 4c CZ 5a CZ 5b CZ 6a CZ 6b CZ 7 CZ 8
0%
10%
20%
30%
40%
50%
60%
70%
80%
90%
100%
CZ 1 CZ 2a CZ 2b CZ 3a CZ 3b CZ 3c CZ 4a CZ 4b CZ 4c CZ 5a CZ 5b CZ 6a CZ 6b CZ 7 CZ 8

Huang, Y.W., Residential Cooking Behavior in the United States: Data Collected from a Web-Based Survey
LBNL- XXXXX
Page 18
Figure 14. Percentage of households reporting using other oils (bars) for all climate zones and the 95th
percentile confidence interval of the probability that different households will use other oils (whiskers).
Figures 9-14 compare the use of the following oils for all meals according to climate zone: olive,
soybean, peanut, vegetable, canola, and other oils, respectively. Given the low number of respondents
for many climate zones, we could not determine the uncertainty in the calculated probability of oil use
in many CZs. For most of the oils, we could not say there was any statistically significant regional
variation in oil use. The only exception is for vegetable oil which seems to have slightly less use in CZ 3c
than in CZ 3a, 4a, or 5a.
0%
10%
20%
30%
40%
50%
60%
70%
80%
90%
100%
CZ 1 CZ 2a CZ 2b CZ 3a CZ 3b CZ 3c CZ 4a CZ 4b CZ 4c CZ 5a CZ 5b CZ 6a CZ 6b CZ 7 CZ 8

Huang, Y.W., Residential Cooking Behavior in the United States: Data Collected from a Web-Based Survey
LBNL- XXXXX
Page 19
Table 6. Probability and uncertainties of households using different cooking oil according to climate zone.
Values are in percentages (%).
Climate
Zones Olive oil Soybean oil Peanut oil
Vegetable
oil Canola oil Other oil
Num. of
respondents
CZ 1 42 ± NA 0.0 ± NA 17 ± NA 25 ± NA 25 ± NA 17± NA 12
CZ 2a 89 ± 6.0 11 ± 6.0 34 ± 9.1 66 ± 9.1 62 ± 9.4 26 ± 8.5 103
CZ 2b 85 ± NA 15 ± NA 25 ± NA 70 ± NA 75 ± NA 20 ± NA 20
CZ 3a 89 ± 5.6 11 ± 5.6 30 ± 8.4 73 ± 8.2 69 ± 8.2 21 ± 7.5 114
CZ 3b 93 ± 2.9 7.2 ± 3.0 28 ± 5.1 58 ± 5.7 62 ± 5.6 25 ± 5.0 291
CZ 3c 91 ± 2.9 6.5 ± 2.5 27 ± 4.5 53 ± 5.1 66 ± 4.8 21 ± 4.2 369
CZ 4a 92 ± 2.9 11 ± 3.0 27 ± 4.3 65 ± 4.6 64 ± 4.6 23 ± 4.0 413
CZ 4b 100 ± NA 12 ± NA 18 ± NA 53 ± NA 65 ± NA 12 ± NA 17
CZ 4c 89 ± 6.0 11 ± 6.0 34 ± 9.1 66 ± 9.1 62 ± 9.4 26 ± 8.5 103
CZ 5a 93 ± 2.4 11 ± 3.0 29 ± 4.4 63 ± 4.6 63 ± 4.6 19 ± 3.8 415
CZ 5b 94 ± NA 8.0 ± NA 33 ± 10 61 ± 11 68 ± 10 16 ± 8.2 79
CZ 6a 94 ± NA 10 ± 5.2 36 ± 8.6 57 ± 8.6 73 ± 7.7 26 ± 7.5 129
CZ 6b 90 ± NA 30 ± NA 20 ± NA 70 ± NA 80 ± NA 10 ± NA 10
CZ 7 100 ± NA 0.0 ± NA 60 ± NA 40 ± NA 60 ± NA 60 ± NA 5
CZ 8 100 ± NA 0.0 ± NA 0.0 ± NA 67 ± NA 0.0 ± NA 33 ± NA 3
Weighted
average 92 ± 1.2 9.4 ± 1.3 29 ± 2.1 61 ± 2.1 65 ± 2.1 22 ± 1.8

Huang, Y.W., Residential Cooking Behavior in the United States: Data Collected from a Web-Based Survey
LBNL- XXXXX
Page 20
Figure 15. Percentage of US households reporting using cooking oils (bars) for all climate zones and the
95th percentile confidence interval of the probability that US households will use cooking oils (whiskers).
Figure 15 compares the different types of oil used in the United States reported by all respondents.
Olive oil is the most commonly used oil on average, followed by canola and vegetable oil. Soybean oil is
the least frequently used oil of the options presented to the survey takers. There are statistically
significant differences in the types of oil used in US homes on average.
Characteristics of meals eaten at home
The following sections describe the characteristics of meals when they are eaten at home including the
number of occupants present, the type of device used, and the method of preparation. The results for
these sections represent just the respondents that indicated that a specific meal was consumed at home
in the 24 hours prior to responding to the survey. Respondents that indicated that a specific meal was
not had at home were not asked follow up questions about that meal.
Table 7 shows the number of respondents in each climate zone and for each occupancy type who
reported eating breakfast, lunch, or dinner at home. Some respondents who indicated that a meal was
eaten at home, did not answer all of the follow up questions.

Huang, Y.W., Residential Cooking Behavior in the United States: Data Collected from a Web-Based Survey
LBNL- XXXXX
Page 21
Climate
zones
Breakfast Lunch Dinner Household type Breakfast Lunch Dinner
CZ 1 6 3 7 1 senior 9 5 11
CZ 2a 74 41 85 1 adult 253 130 301
CZ 2b 13 6 15 2 + adults/seniors
without children
824 442 970
CZ 3a 78 51 97 1 + children and
adults/seniors
502 246 548
CZ 3b 222 121 253 Total 1588 823 1830
CZ 3c 287 132 307
CZ 4a 291 138 344
CZ 4b 9 6 13
CZ 4c 74 41 85
CZ 5a 295 157 352
CZ 5b 64 32 71
CZ 6a 92 47 110
CZ 6b 8 3 9
CZ 7 4 2 5
CZ 8 3 1 3
Total 1520 781 1756
Table 7. Number of respondents who reported eating breakfast, lunch, and dinner at home.
Household occupants present at mealtimes
Seven respondents indicated that a meal was eaten at home, but then said that no one was present for
that meal. We assumed that they had not included themselves in the number of people present for the
meal and adjusted the number of people present to 1. There is a possibility that for other respondents,
that they did not include themselves in the number of people present for a given meal.
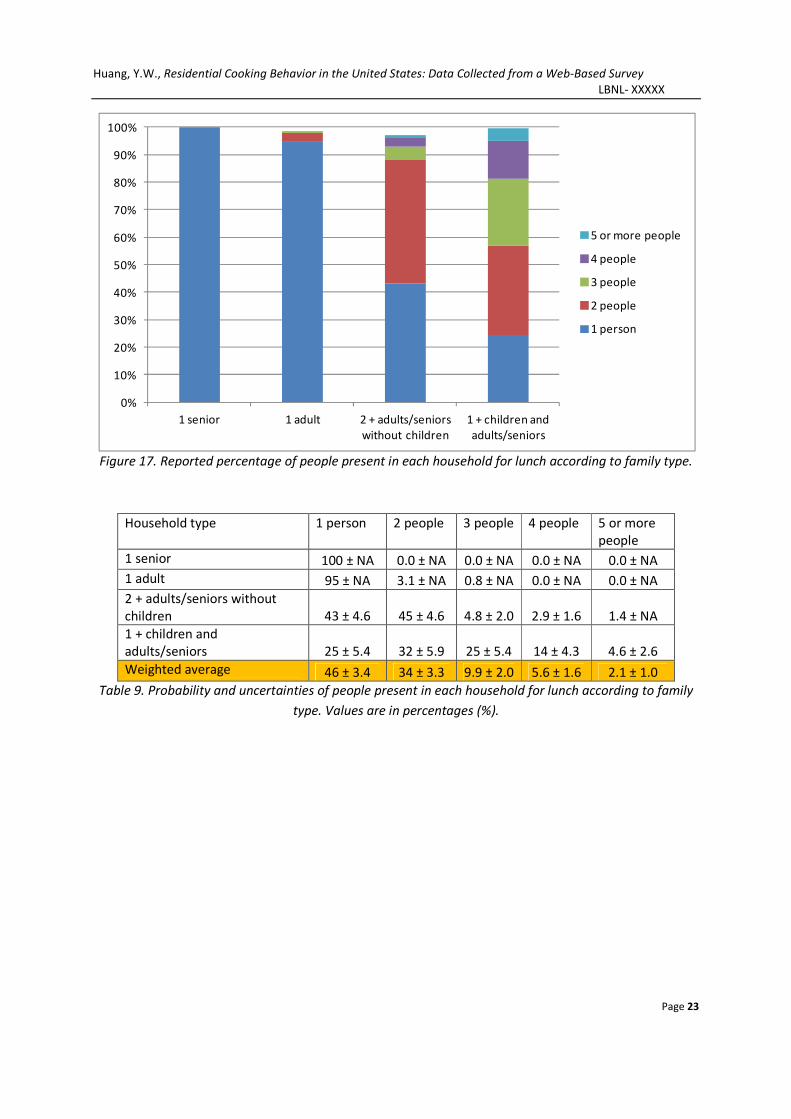
Figures 16-18 and Tables 8-10 show the number of people present for each meal according to family
type. For both the 1 senior and 1 adult household, for all meals, more than 80% of homes have 1 person
present. For homes with more than 1 person and no children, most homes have 2 people present for
breakfast and dinner and 1 or 2 people present for lunch. For homes with children, the majority of
homes had 2-4 people present for breakfast and dinner and 1-3 people present for lunch.

Huang, Y.W., Residential Cooking Behavior in the United States: Data Collected from a Web-Based Survey
LBNL- XXXXX
Page 22
Figure 16. Reported percentage of people present in each household for breakfast according to family
type.
Household type 1 person 2 people 3 people 4 people 5 or more
people
1 senior 100 ± NA 0.0 ± NA 0.0 ± NA 0.0 ± NA 0.0 ± NA
1 adult 92 ± 3.3 5.1 ± 2.7 0.4 ± NA 0.4 ± NA 0.0 ± NA
2 + adults/seniors without
children
24 ± 2.9 61 ± 3.3 9.6 ± 2.0 2.5 ± 1.1 2.1 ± 1.0
1 + children and
adults/seniors
6.4 ± 2.2 18 ± 3.3 38 ± 4.3 29 ± 4.0 10 ± 2.6
Weighted average 30 ± 2.3 38 ± 2.4 17 ± 1.8 10 ± 1.5 4.2 ± 1.0
Table 8. Probability and uncertainties of people present in each household for breakfast according to
family type. Values are in percentages (%).
0%
10%
20%
30%
40%
50%
60%
70%
80%
90%
100%
1 senior 1 adult 2 + adults/seniors
without children
1 + children and
adults/seniors
5 or more people
4 people
3 people
2 people
1 person
Huang, Y.W., Residential Cooking Behavior in the United States: Data Collected from a Web-Based Survey
LBNL- XXXXX
Page 23
Figure 17. Reported percentage of people present in each household for lunch according to family type.
Household type 1 person 2 people 3 people 4 people 5 or more
people
1 senior 100 ± NA 0.0 ± NA 0.0 ± NA 0.0 ± NA 0.0 ± NA
1 adult 95 ± NA 3.1 ± NA 0.8 ± NA 0.0 ± NA 0.0 ± NA
2 + adults/seniors without
children 43 ± 4.6 45 ± 4.6 4.8 ± 2.0 2.9 ± 1.6 1.4 ± NA
1 + children and
adults/seniors 25 ± 5.4 32 ± 5.9 25 ± 5.4 14 ± 4.3 4.6 ± 2.6
Weighted average 46 ± 3.4 34 ± 3.3 9.9 ± 2.0 5.6 ± 1.6 2.1 ± 1.0
Table 9. Probability and uncertainties of people present in each household for lunch according to family
type. Values are in percentages (%).
0%
10%
20%
30%
40%
50%
60%
70%
80%
90%
100%
1 senior 1 adult 2 + adults/seniors
without children
1 + children and
adults/seniors
5 or more people
4 people
3 people
2 people
1 person

Huang, Y.W., Residential Cooking Behavior in the United States: Data Collected from a Web-Based Survey
LBNL- XXXXX
Page 24
Figure 18. Reported percentage of people present in each household for dinner according to family type.
Household type 1 person 2 people 3 people 4 people 5 or more
people
1 senior 100 ± NA 0.0 ± NA 0.0 ± NA 0.0 ± NA 0.0 ± NA
1 adult 89 ± 3.6 8.3 ± 3.1 1.0 ± NA 0.0 ± NA 0.3 ± NA
2 + adults/seniors without
children 13 ± 2.1 67 ± 2.9 12 ± 2.0 4.4 ± 1.3 2.9 ± 1.1
1 + children and
adults/seniors 2.4 ± 1.3 11 ± 2.6 38 ± 4.1 35 ± 4.0 12 ± 2.8
Weighted average 23 ± 1.9 40 ± 2.2 18 ± 1.8 13 ± 1.5 5.3 ± 1.0
Table 10. Probability and uncertainties of people present in each household for dinner according to
family type. Values are in percentages (%).
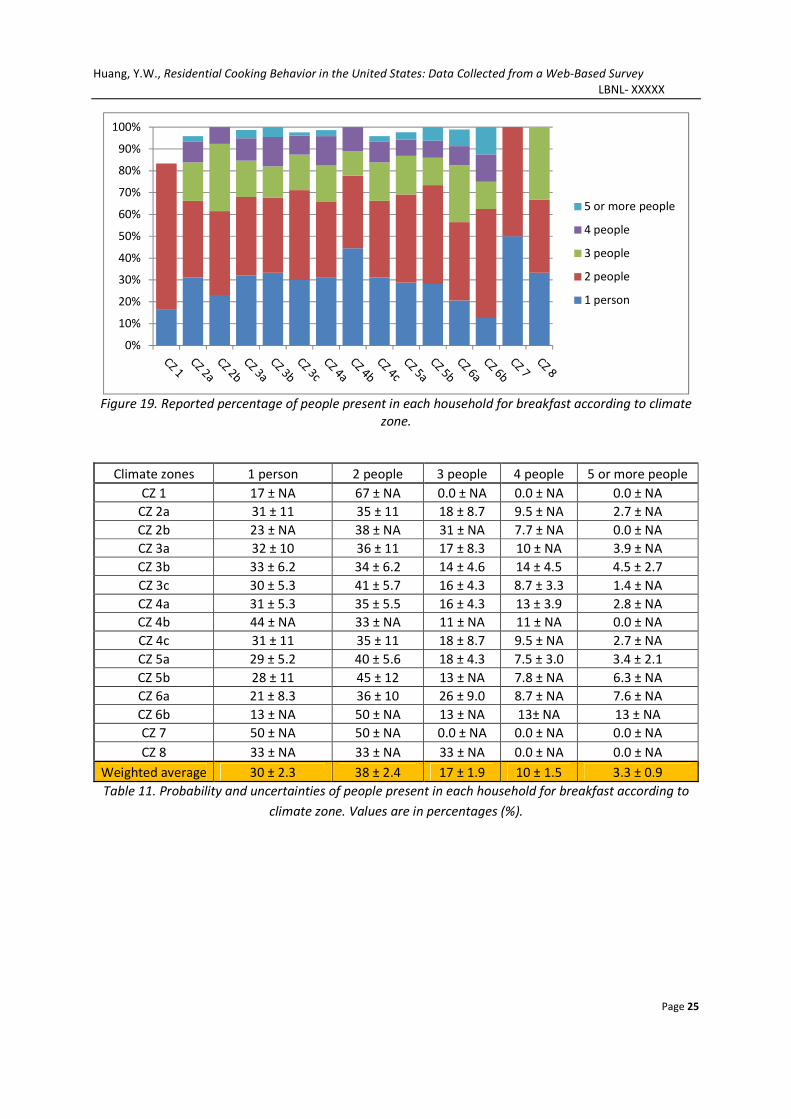
Figure 19 show the percentage of individuals present for breakfast for each climate zone and
Table 11 shows the probability and uncertainties of the number of people present in each
household for breakfast according to climate zone. According to the weighted average, the
presence of two people in the home during breakfast is the most common, followed by one
person. Five or more people in the home during breakfast is least common. There is no statistically
significant difference in the probabilities that a given number of people will be present for a meal
between climate zones. There is a significant difference in the likelihood that a certain number of people
will be present for all the respondents as indicated by the weighted averages in Table 11.
0%
10%
20%
30%
40%
50%
60%
70%
80%
90%
100%
1 senior 1 adult 2 + adults/seniors
without children
1 + children and
adults/seniors
5 or more people
4 people
3 people
2 people
1 person
Huang, Y.W., Residential Cooking Behavior in the United States: Data Collected from a Web-Based Survey
LBNL- XXXXX
Page 25
Figure 19. Reported percentage of people present in each household for breakfast according to climate
zone.
Climate zones 1 person 2 people 3 people 4 people 5 or more people
CZ 1 17 ± NA 67 ± NA 0.0 ± NA 0.0 ± NA 0.0 ± NA
CZ 2a 31 ± 11 35 ± 11 18 ± 8.7 9.5 ± NA 2.7 ± NA
CZ 2b 23 ± NA 38 ± NA 31 ± NA 7.7 ± NA 0.0 ± NA
CZ 3a 32 ± 10 36 ± 11 17 ± 8.3 10 ± NA 3.9 ± NA
CZ 3b 33 ± 6.2 34 ± 6.2 14 ± 4.6 14 ± 4.5 4.5 ± 2.7
CZ 3c 30 ± 5.3 41 ± 5.7 16 ± 4.3 8.7 ± 3.3 1.4 ± NA
CZ 4a 31 ± 5.3 35 ± 5.5 16 ± 4.3 13 ± 3.9 2.8 ± NA
CZ 4b 44 ± NA 33 ± NA 11 ± NA 11 ± NA 0.0 ± NA
CZ 4c 31 ± 11 35 ± 11 18 ± 8.7 9.5 ± NA 2.7 ± NA
CZ 5a 29 ± 5.2 40 ± 5.6 18 ± 4.3 7.5 ± 3.0 3.4 ± 2.1
CZ 5b 28 ± 11 45 ± 12 13 ± NA 7.8 ± NA 6.3 ± NA
CZ 6a 21 ± 8.3 36 ± 10 26 ± 9.0 8.7 ± NA 7.6 ± NA
CZ 6b 13 ± NA 50 ± NA 13 ± NA 13± NA 13 ± NA
CZ 7 50 ± NA 50 ± NA 0.0 ± NA 0.0 ± NA 0.0 ± NA
CZ 8 33 ± NA 33 ± NA 33 ± NA 0.0 ± NA 0.0 ± NA
Weighted average 30 ± 2.3 38 ± 2.4 17 ± 1.9 10 ± 1.5 3.3 ± 0.9
Table 11. Probability and uncertainties of people present in each household for breakfast according to
climate zone. Values are in percentages (%).
0%
10%
20%
30%
40%
50%
60%
70%
80%
90%
100%
5 or more people
4 people
3 people
2 people
1 person

Huang, Y.W., Residential Cooking Behavior in the United States: Data Collected from a Web-Based Survey
LBNL- XXXXX
Page 26
Figure 20. Percentage of people present in each household for lunch according to climate zone.
Climate zones 1 person 2 people 3 people 4 people 5 or more people
CZ 1 100 ± NA 0.0 ± NA 0.0 ± NA 0.0 ± NA 0.0 ± NA
CZ 2a 56 ± 15 22 ± NA 7.3 ± NA 10 ± NA 2.4 ± NA
CZ 2b 83 ± NA 17 ± NA 0.0 ± NA 0.0 ± NA 0.0 ± NA
CZ 3a 41 ± 14 37 ± 13 7.8 ± NA 10 ± NA 0.0 ± NA
CZ 3b 38 ± 8.6 40 ± 8.7 12 ± 5.7 5.0 ± NA 5.0 ± NA
CZ 3c 45 ± 8.5 37 ± 8.2 8.3 ± 4.7 6.8 ±NA 0.8 ± NA
CZ 4a 41 ± 8.2 36 ± 8.0 11 ± 5.2 5.8 ± NA 2.2 ± NA
CZ 4b 67 ± NA 33 ± NA 0.0 ± NA 0.0 ± NA 0.0 ± NA
CZ 4c 56 ± 15 22 ± NA 7.3 ± NA 10 ± NA 2.4 ± NA
CZ 5a 46 ± 7.8 36 ± 7.5 11 ± 4.9 3.8 ± NA 1.3 ± NA
CZ 5b 44 ± 17 38 ± 17 13 ± NA 3.1 ± NA 0.0 ± NA
CZ 6a 53 ± 14 19 ± NA 8.5 ± NA 6.4 ± NA 8.5 ± NA
CZ 6b 33 ± NA 33 ± NA 0.0 ± NA 33 ± NA 0.0 ± NA
CZ 7 50 ± NA 50 ± NA 0.0 ± NA 0.0 ± NA 0.0 ± NA
CZ 8 100 ± NA 0.0 ± NA 0.0 ± NA 0.0 ± NA 0.0 ± NA
Weighted average 46 ± 3.5 34 ± 3.3 10 ± 2.1 6.0 ± 1.7 2.3 ± 1.1
Table 12. Probability and uncertainties of people present in each household for lunch according to
climate zone. Values are in percentages (%).
Figure 20 and Table 12 show the number (displayed as percentages) of individuals present for lunch for
each climate zone and the probability and uncertainly that a certain number of people will be present
for lunch. Across all homes, the presence of one person in the home during lunch if lunch is prepared at
home is most common, followed by two people. All respondents in CZ 1 and CZ 8 reported one person
as present for lunch. Similar to the data for breakfast, there is no statistically significant difference in the
likelihood that a specific number of people will be present between climate zones.
0%
10%
20%
30%
40%
50%
60%
70%
80%
90%
100%
5 or more people
4 people
3 people
2 people
1 person

Huang, Y.W., Residential Cooking Behavior in the United States: Data Collected from a Web-Based Survey
LBNL- XXXXX
Page 27
Figure 21. Percentage of people present in each household for dinner according to climate zone.
Climate zones 1 person 2 people 3 people 4 people
5 or more
people
CZ 1 14 ± NA 43 ± NA 14 ± NA 0.0 ± NA 0.0 ± NA
CZ 2a 16 ± 7.9 46 ± 11 14 ± 7.4 15 ± 7.7 6.0 ± NA
CZ 2b 20 ± NA 33 ± NA 33 ± NA 13 ± NA 0.0 ± NA
CZ 3a 24 ± 8.5 36 ± 9.6 20 ± 7.9 11 ± 6.3 8.0 ± NA
CZ 3b 25 ± 5.3 35 ± 5.9 17 ± 4.6 14 ± 4.3 9.0 ± 3.5
CZ 3c 23 ± 4.7 44 ± 5.6 17 ± 4.2 12 ± 3.7 3.0 ± 2.0
CZ 4a 22 ± 4.4 36 ± 5.1 19 ± 4.1 16 ± 3.8 5.0 ± 2.4
CZ 4b 23 ± NA 46 ± NA 31 ± NA 0.0 ± NA 0.0 ± NA
CZ 4c 16 ± 7.9 46 ± 11 14 ± 7.4 15 ± 7.7 6.0 ± NA
CZ 5a 23 ± 4.4 45 ± 5.2 15 ± 3.7 13 ± 3.5 4.0 ± 2.0
CZ 5b 15 ± 8.4 54 ± 12 21 ± 9.5 5.6 ± NA 4.0 ± NA
CZ 6a 15 ± 6.8 38 ± 9.1 26 ± 8.2 11 ± 5.8 8.0 ± NA
CZ 6b 33 ± NA 33 ± NA 11 ± NA 11 ± NA 11 ± NA
CZ 7 20 ± NA 80 ± NA 0.0 ± NA 0.0 ± NA 0.0 ± NA
CZ 8 0.0 ± NA 33 ± NA 67 ± NA 0.0 ± NA 0.0 ± NA
Weighted average 22 ± 1.9 41 ± 2.3 18 ± 1.8 13± 1.6 5.4 ± 1.1
Table 13. Probability and uncertainties of people present in each household for dinner according to
climate zone. Values are in percentages (%).
Figure 21 and Table 13 shows the number (displayed as percentages) of individuals present for dinner
for each climate zone and the probability and uncertainly that a certain number of people will be
present for dinner. The majority of respondents have two people present in the home for dinner,
followed by one person.
Figures 22 shows the total percentage of respondents that report the number of people home for each
meal and the probability that a certain number of people will be home for each meal. The probabilities
all have uncertainty of 3% or less. Figure 19 shows that 2 people, followed 1 person are the typical
0%
10%
20%
30%
40%
50%
60%
70%
80%
90%
100%
CZ 1 CZ
2a
CZ
2b
CZ
3a
CZ
3b
CZ
3c
CZ
4a
CZ
4b
CZ
4c
CZ
5a
CZ
5b
CZ
6a
CZ
6b
CZ 7 CZ 8
5 or more people
4 people
3 people
2 people
1 person

Huang, Y.W., Residential Cooking Behavior in the United States: Data Collected from a Web-Based Survey
LBNL- XXXXX
Page 28
number of people home during cooking breakfast. The most probable situation is one person at home
for lunch, followed by two people. The most common situation is two people for dinner, followed by
one person, then three. The presence of three people during this mealtime occurs more often than
breakfast or lunch. The shape of the distribution is very similar for breakfast and lunch. For any meal, 5%
of homes or less reported having 5 or more people present. This is likely due to household sizes being
smaller than 5 people.
Figure 22. Percentage of individuals reported present for breakfast, lunch, and dinner (bars) and 95th
percentile confidence interval of the probability of a certain number of people being home for each meal
(whiskers).
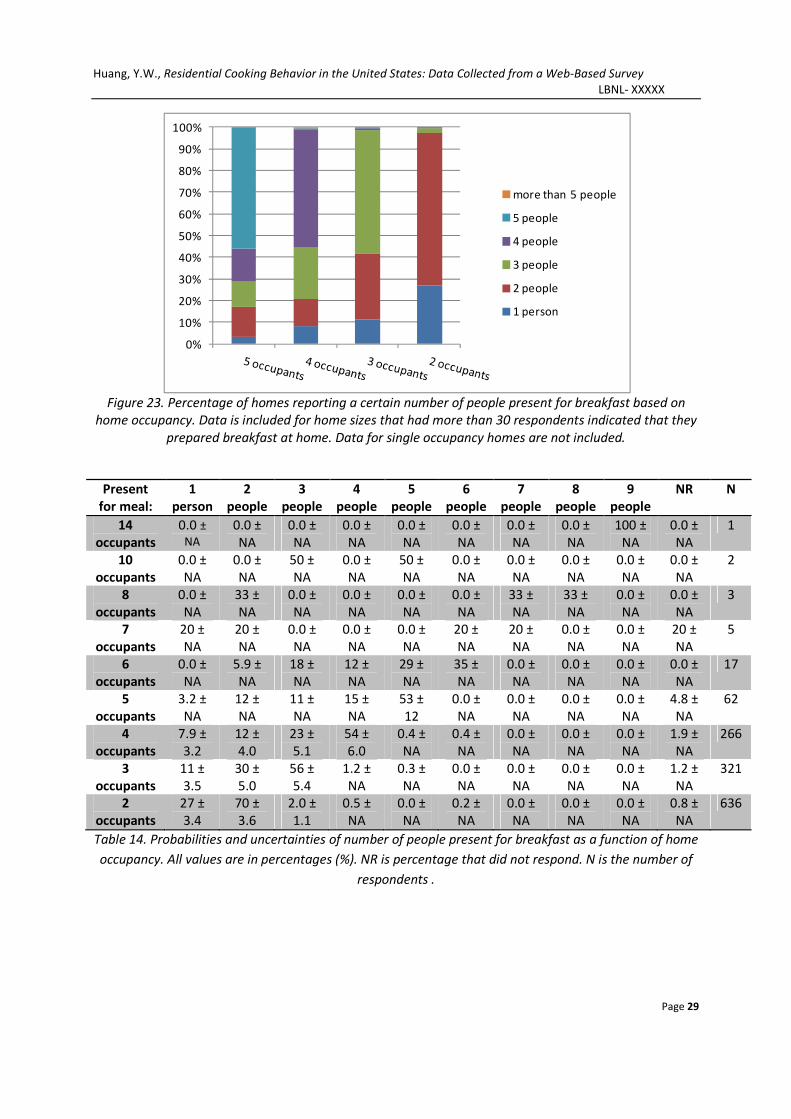
We also looked at the impact of the number of home occupants on how many people are present for
specific meals. Figures 23-25 and Tables 14-16 show the reported number of people present for
breakfast, lunch and dinner for homes with more than one occupant. The figures only show data for
occupancies that had 30 or more responses. For homes with 2-5 occupants, the most likely number of
people of present for breakfast and dinner is the number of home occupants followed by 1 less than the
number of occupants. For lunch, independent of home size, the most common number of people home
is 2 although there is large variability in the number of people home.
0% 10% 20% 30% 40% 50% 60%
1 person
2 people
3 people
4 people
>4 people
Breakfast
Lunch
Dinner
Huang, Y.W., Residential Cooking Behavior in the United States: Data Collected from a Web-Based Survey
LBNL- XXXXX
Page 29
Figure 23. Percentage of homes reporting a certain number of people present for breakfast based on
home occupancy. Data is included for home sizes that had more than 30 respondents indicated that they
prepared breakfast at home. Data for single occupancy homes are not included.
Present
for meal:
1
person
2
people
3
people
4
people
5
people
6
people
7
people
8
people
9
people
NR N
14
occupants
0.0 ±
NA
0.0 ±
NA
0.0 ±
NA
0.0 ±
NA
0.0 ±
NA
0.0 ±
NA
0.0 ±
NA
0.0 ±
NA
100 ±
NA
0.0 ±
NA
1
10
occupants
0.0 ±
NA
0.0 ±
NA
50 ±
NA
0.0 ±
NA
50 ±
NA
0.0 ±
NA
0.0 ±
NA
0.0 ±
NA
0.0 ±
NA
0.0 ±
NA
2
8
occupants
0.0 ±
NA
33 ±
NA
0.0 ±
NA
0.0 ±
NA
0.0 ±
NA
0.0 ±
NA
33 ±
NA
33 ±
NA
0.0 ±
NA
0.0 ±
NA
3
7
occupants
20 ±
NA
20 ±
NA
0.0 ±
NA
0.0 ±
NA
0.0 ±
NA
20 ±
NA
20 ±
NA
0.0 ±
NA
0.0 ±
NA
20 ±
NA
5
6
occupants
0.0 ±
NA
5.9 ±
NA
18 ±
NA
12 ±
NA
29 ±
NA
35 ±
NA
0.0 ±
NA
0.0 ±
NA
0.0 ±
NA
0.0 ±
NA
17
5
occupants
3.2 ±
NA
12 ±
NA
11 ±
NA
15 ±
NA
53 ±
12
0.0 ±
NA
0.0 ±
NA
0.0 ±
NA
0.0 ±
NA
4.8 ±
NA
62
4
occupants
7.9 ±
3.2
12 ±
4.0
23 ±
5.1
54 ±
6.0
0.4 ±
NA
0.4 ±
NA
0.0 ±
NA
0.0 ±
NA
0.0 ±
NA
1.9 ±
NA
266
3
occupants
11 ±
3.5
30 ±
5.0
56 ±
5.4
1.2 ±
NA
0.3 ±
NA
0.0 ±
NA
0.0 ±
NA
0.0 ±
NA
0.0 ±
NA
1.2 ±
NA
321
2
occupants
27 ±
3.4
70 ±
3.6
2.0 ±
1.1
0.5 ±
NA
0.0 ±
NA
0.2 ±
NA
0.0 ±
NA
0.0 ±
NA
0.0 ±
NA
0.8 ±
NA
636
Table 14. Probabilities and uncertainties of number of people present for breakfast as a function of home
occupancy. All values are in percentages (%). NR is percentage that did not respond. N is the number of
respondents .
0%
10%
20%
30%
40%
50%
60%
70%
80%
90%
100%
more than 5 people
5 people
4 people
3 people
2 people
1 person

Huang, Y.W., Residential Cooking Behavior in the United States: Data Collected from a Web-Based Survey
LBNL- XXXXX
Page 30
Figure 24. Percentage of homes reporting a certain number of people present for lunch based on home
occupancy. Data is included for home sizes that had more than 30 respondents indicated that they
prepared breakfast at home. Data for single occupancy homes are not included.
Present
for meal:
1
person
2
people
3
people
4
people
5
people
6
people
7
people
8
people
> 8
people
NR N
14
occupants
0.0 ±
NA
0.0 ±
NA
0.0 ±
NA
0.0 ±
NA
0.0 ±
NA
0.0 ±
NA
100 ±
NA
0.0 ±
NA
0.0 ±
NA
0.0 ±
NA
1
10
occupants
0.0 ±
NA
0.0 ±
NA
0.0 ±
NA
0.0 ±
NA
0.0 ±
NA
0.0 ±
NA
100 ±
NA
0.0 ±
NA
0.0 ±
NA
0.0 ±
NA
1
8
occupants
0.0 ±
NA
0.0 ±
NA
100 ±
NA
0.0 ±
NA
0.0 ±
NA
0.0 ±
NA
0.0 ±
NA
0.0 ±
NA
0.0 ±
NA
0.0 ±
NA
1
7
occupants
0.0 ±
NA
0.0 ±
NA
50 ±
NA
0.0 ±
NA
0.0 ±
NA
50 ±
NA
0.0 ±
NA
0.0 ±
NA
0.0 ±
NA
0.0 ±
NA
2
6
occupants
11 ±
NA
33 ±
NA
22 ±
NA
22 ±
NA
0.0 ±
NA
11 ±
NA
0.0 ±
NA
0.0 ±
NA
0.0 ±
NA
0.0 ±
NA
9
5
occupants
10 ±
NA
30 ±
NA
13 ±
NA
20 ±
NA
27 ±
NA
0.0 ±
NA
0.0 ±
NA
0.0 ±
NA
0.0 ±
NA
0.0 ±
NA
30
4
occupants
22 ±
5.0
31 ±
5.6
19 ±
4.7
24 ±
5.2
0.8 ±
NA
0.0 ±
NA
0.0 ±
NA
0.0 ±
NA
0.0 ±
NA
3.0 ±
NA
132
3
occupants
33 ±
5.2
37 ±
5.3
26 ±
4.8
1.3 ±
NA
1.3 ±
NA
0.0 ±
NA
0.0 ±
NA
0.0 ±
NA
0.0 ±
NA
0.6 ±
NA
159
2
occupants
47 ±
3.9
48 ±
3.9
1.5 ±
NA
0.9 ±
NA
0.0 ±
NA
0.3 ±
NA
0.0 ±
NA
0.0 ±
NA
0.3 ±
NA
2.9 ±
NA
342
Table 15. Probabilities and uncertainties of number of people present for lunch as a function of home
occupancy. All values are in percentages (%). NR is percentage that did not respond. N is the number of
respondents.
0%
10%
20%
30%
40%
50%
60%
70%
80%
90%
100%
more than 5 people
5 people
4 people
3 people
2 people
1 person

Huang, Y.W., Residential Cooking Behavior in the United States: Data Collected from a Web-Based Survey
LBNL- XXXXX
Page 31
Figure 25. Percentage of homes reporting a certain number of people present for dinner based on home
occupancy. Data is included for home sizes that had more than 30 respondents indicated that they
prepared breakfast at home. Data for single occupancy homes are not included.
Present
for meal:
1
person
2
people
3
people
4
people
5
people
6
people
7
people
8
people
> 8
people
NR N
14
occupants
0.0 ±
NA
0.0 ±
NA
0.0 ±
NA
0.0 ±
NA
0.0 ±
NA
0.0 ±
NA
0.0 ±
NA
0.0 ±
NA
100 ±
NA
0.0 ±
NA
1
10
occupants
0.0 ±
NA
0.0 ±
NA
0.0 ±
NA
33 ±
NA
0.0 ±
NA
0.0 ±
NA
0.0 ±
NA
0.0 ±
NA
67 ±
NA
0.0 ±
NA
3
8
occupants
0.0 ±
NA
0.0 ±
NA
0.0 ±
NA
0.0 ±
NA
33 ±
NA
33 ±
NA
0.0 ±
NA
33 ±
NA
0.0 ±
NA
0.0 ±
NA
3
7
occupants
0.0 ±
NA
0.0 ±
NA
0.0 ±
NA
0.0 ±
NA
40 ±
NA
20 ±
NA
40 ±
NA
0.0 ±
NA
0.0 ±
NA
0.0 ±
NA
5
6
occupants
5.3 ±
NA
5.3 ±
NA
5.3 ±
NA
16 ±
NA
11 ±
NA
47 ±
NA
0.0 ±
NA
5.3 ±
NA
0.0 ±
NA
5.3 ±
NA
19
5
occupants
0.0 ±
NA
3.2 ±
NA
8.1 ±
NA
16 ±
NA
68 ±
12
0.0 ±
NA
0.0 ±
NA
3.2 ±
NA
0.0 ±
NA
1.6 ±
NA
62
4
occupants
4.8 ±
2.5
7.2 ±
3.0
17 ±
4.3
67 ±
5.4
1.0 ±
NA
0.7 ±
NA
0.7 ±
NA
1.0 ±
NA
0.7 ±
NA
0.3 ±
NA
292
3
occupants
5.2 ±
2.3
23 ±
4.3
64 ±
4.9
4.1 ±
2.0
1.6 ±
NA
0.5 ±
NA
0.5 ±
NA
0.0 ±
NA
0.3 ±
NA
0.8 ±
NA
367
2
occupants
13 ±
2.4
80 ±
2.9
3.9 ±
2.9
0.8 ±
NA
0.0 ±
NA
0.4 ±
NA
0.3 ±
NA
0.0 ±
NA
0.3 ±
NA
0.8 ±
NA
745
Table 16. Probabilities and uncertainties of number of people present for dinner as a function of home
occupancy. All values are in percentages (%). NR is percentage that did not respond. N is the number of
respondents.
0%
10%
20%
30%
40%
50%
60%
70%
80%
90%
100%
more than 5 people
5 people
4 people
3 people
2 people
1 person

Huang, Y.W., Residential Cooking Behavior in the United States: Data Collected from a Web-Based Survey
LBNL- XXXXX
Page 32
Respondent cooking device selection
The following figures and tables were generated based on respondent usage of the following cooking
device at all meals: toaster, microwave, electric cooking devices (indicates either an electric wok, electric
grill, or electric crock-pot), propane grill indoors, outdoor devices (grill or other cooking device), no
devices, and other. Due to a survey error, cooking on the stove and cooking in the oven was referred to
differently for each meal. For breakfast we asked respondents if they used the oven and/or the stove.
For lunch we asked respondents if they used the cook top burners and/or the stove. For dinner we
asked if respondents used cook top burners and/ or the oven. Figures 26-32 and Tables 17-23 present
the data as it was reported by the survey respondents.
The respondents were also asked to report the type of cooking they did for each meal. Results of this
analysis are presented in the next section. The terms "oven" and "stove" can both be used to refer to a
cooking range containing both an oven and cooktop/stovetop burners. In order to determine whether
the meal was prepared in the oven or on the cooktop burners, we used the described cooking method
to subdivide respondent results that reported using the stove or oven into cooktop burner use and oven
use. If the respondents said they baked or broiled or specified that they used the oven in comments
under the "other" category, we assumed that cooking was done in the oven. If the respondents said
they pan fried/sautéed, stir fired, grilled or boiled or indicated they used the cooktop in the comments
under the "other" category, we assumed that cooking was done on the cooktop burners. The results of
this analysis are presented in Table 24.
Figure 26. Percentage of households reporting device use for breakfast (bars) and 95th percentile
confidence interval of the probability of households using particular devices (whiskers). Devices not
included in graphs were not reported used by any respondent. Results only reflect households that had
breakfast at home.
0%
10%
20%
30%
40%
50%
60%
70%
80%
90%
100%
Oven Stove Toaster Microwave Electric
cooking
devices
Propane
grill indoors
No devices Other
1 senior
1 adult
2 or more adults/seniors without kids
1 or more kids and adults/seniors
Huang, Y.W., Residential Cooking Behavior in the United States: Data Collected from a Web-Based Survey
LBNL- XXXXX
Page 33
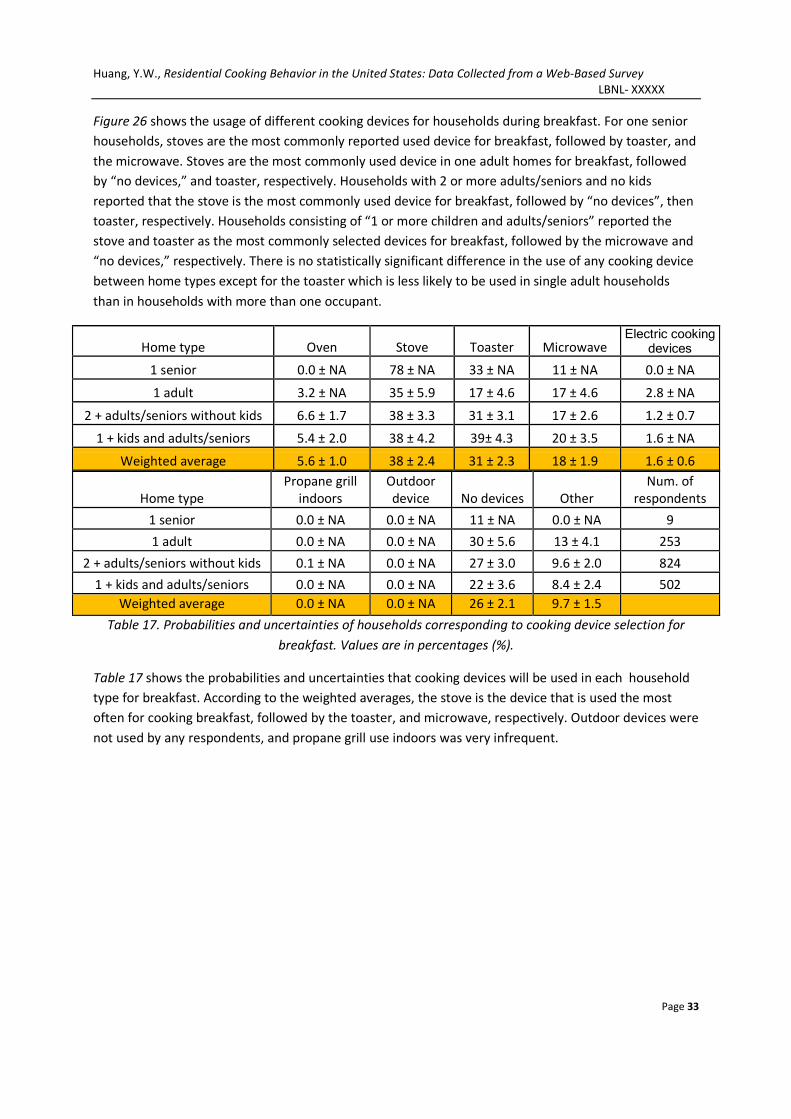
Figure 26 shows the usage of different cooking devices for households during breakfast. For one senior
households, stoves are the most commonly reported used device for breakfast, followed by toaster, and
the microwave. Stoves are the most commonly used device in one adult homes for breakfast, followed
by “no devices,” and toaster, respectively. Households with 2 or more adults/seniors and no kids
reported that the stove is the most commonly used device for breakfast, followed by “no devices”, then
toaster, respectively. Households consisting of “1 or more children and adults/seniors” reported the
stove and toaster as the most commonly selected devices for breakfast, followed by the microwave and
“no devices,” respectively. There is no statistically significant difference in the use of any cooking device
between home types except for the toaster which is less likely to be used in single adult households
than in households with more than one occupant.
Home type Oven Stove Toaster Microwave Electric cooking
devices
1 senior 0.0 ± NA 78 ± NA 33 ± NA 11 ± NA 0.0 ± NA
1 adult 3.2 ± NA 35 ± 5.9 17 ± 4.6 17 ± 4.6 2.8 ± NA
2 + adults/seniors without kids 6.6 ± 1.7 38 ± 3.3 31 ± 3.1 17 ± 2.6 1.2 ± 0.7
1 + kids and adults/seniors 5.4 ± 2.0 38 ± 4.2 39± 4.3 20 ± 3.5 1.6 ± NA
Weighted average 5.6 ± 1.0 38 ± 2.4 31 ± 2.3 18 ± 1.9 1.6 ± 0.6
Home type
Propane grill
indoors
Outdoor
device No devices Other
Num. of
respondents
1 senior 0.0 ± NA 0.0 ± NA 11 ± NA 0.0 ± NA 9
1 adult 0.0 ± NA 0.0 ± NA 30 ± 5.6 13 ± 4.1 253
2 + adults/seniors without kids 0.1 ± NA 0.0 ± NA 27 ± 3.0 9.6 ± 2.0 824
1 + kids and adults/seniors 0.0 ± NA 0.0 ± NA 22 ± 3.6 8.4 ± 2.4 502
Weighted average 0.0 ± NA 0.0 ± NA 26 ± 2.1 9.7 ± 1.5
Table 17. Probabilities and uncertainties of households corresponding to cooking device selection for
breakfast. Values are in percentages (%).
Table 17 shows the probabilities and uncertainties that cooking devices will be used in each household
type for breakfast. According to the weighted averages, the stove is the device that is used the most
often for cooking breakfast, followed by the toaster, and microwave, respectively. Outdoor devices were
not used by any respondents, and propane grill use indoors was very infrequent.

Huang, Y.W., Residential Cooking Behavior in the United States: Data Collected from a Web-Based Survey
LBNL- XXXXX
Page 34
Figure 27. Percentage of households reporting device use for lunch (bars) and 95th percentile confidence
interval of the probability of households using particular devices (whiskers). Devices not included in
graphs were not reported used by any respondent. Results only reflect households that had lunch at
home.
Figure 27 shows the usage of different cooking devices during lunch. Table 18 shows the cooking device
selection per household type for lunch. According to the weighted averages, the microwave is the device
that is used the most often for cooking lunch, followed by ”no devices” and stove. The propane grill for
indoor use was not used by any respondents, and the outdoor grill/cooking device was not used
frequently. There was no significant difference in device usage between home types.
0%
10%
20%
30%
40%
50%
60%
70%
80%
90%
100%
Stove Cooktop Toaster Microwave Electric
cooking
devices
Outdoor
device
No devices Other
1 senior
1 adult
2 or more adults/seniors without kids
1 or more kids and adults/seniors

Huang, Y.W., Residential Cooking Behavior in the United States: Data Collected from a Web-Based Survey
LBNL- XXXXX
Page 35
Home type Stove Cooktop Toaster Microwave
Electric cooking devices
1 senior 0.0 ± NA 20 ± NA 0.0 ± NA 20 ± NA 0.0 ± NA
1 adult 22 ± 7.1 21 ± 7.0 7.7 ± 4.6 28 ± 7.7 1.5 ± NA
2 + adults/seniors without
kids
18 ± 3.6
21 ± 3.8 9.1 ± 2.7 30 ± 4.3 2.7 ± 1.5
1 + kids and adults/seniors 15 ± 4.5 17 ± 4.7 9.8 ± 3.7 36 ± 6.0 2.9 ± NA
Weighted average 17 ± 2.6 20 ± 2.7 9.0 ± 2.0 31 ± 3.2 2.5 ± 1.1
Table 18. Probabilities and uncertainties of households corresponding to cooking device selection for
lunch. Values are in percentages (%).
Figure 28. Percentage of households reporting device use for dinner (bars) and 95th percentile
confidence interval of the probability of households using particular devices (whiskers). Devices not
included in graphs were not reported used by any respondent. Results only reflect households that had
dinner at home.
0%
10%
20%
30%
40%
50%
60%
70%
80%
90%
100%
Cooktop
Burners
Oven Toaster Microwave Electric
cooking
devices
Propane
grill indoors
Outdoor
device
No devices Other
1 senior
1 adult
2 or more adults/seniors without kids
1 or more kids and adults/seniors
Home type Propane grill
indoors Outdoor device No devices Other
Num. of
respondents
1 senior 0.0 ± NA 0.0 ± NA 60 ± NA 0.0 ± NA 5
1 adult 0.0 ± NA 0.0 ± NA 26 ± 7.6 7.7 ± 4.6 130
2 + adults/seniors without
kids 0.0 ± NA 1.4 ± NA 27 ± 4.1 7.2 ± 2.4 442
1 + kids and adults/seniors 0.0 ± NA 0.4 ± NA 30 ± 5.7 6.1 ± 3.0 246
Weighted average 0.0 ± NA 0.9 ± NA 28 ± 3.1 7.0 ± 1.7

Huang, Y.W., Residential Cooking Behavior in the United States: Data Collected from a Web-Based Survey
LBNL- XXXXX
Page 36
Figure 28 shows the usage of different cooking devices for households during dinner. No respondents in
1 senior households indicated using: toaster, outdoor device, “no devices,” or propane grill for indoor
use. The most commonly used device for 1 senior homes was the stove, followed by the microwave, and
oven, respectively. Households consisting of one adult reported using the stove most frequently,
followed by the microwave and oven, respectively. Households with “2 or more adults/seniors without
children” reported using stoves most frequently, followed by equal selection of the oven and
microwave. Households of “1 or more children and adults/seniors” reported using stoves the most
frequently, followed by ovens and microwaves. The majority of survey responses were from the winter,
which could result in reduced outdoor cooking or reduced indoor cooking using devices that would be
ventilated via windows or doors. Households that have 1 adult are less likely to use the oven than other
home types and homes with kids are slightly less likely to use "no device" compared to homes with just
one adult.
Age groups Cooktop Burners Oven Toaster Microwave Electric cooking
devices
1 senior 64 ± NA 18 ± NA 0.0 ± NA 36 ± NA 9.1 ± NA
1 adult 57 ± 5.6 19 ± 4.4 2.7 ± NA 33 ± 5.3 4.7 ± 2.4
2 or more adults/seniors
without kids 69 ± 2.9 29 ± 2.9 4.4 ± 1.3 28 ± 2.8 4.6 ± 1.3
1 or more kids and
adults/seniors 70 ± 3.8 38 ± 4.1 3.3 ± 1.5 32 ± 3.9 5.8 ± 2.2
weighted average 67 ± 2.2 30 ± 2.1 3.8 ± 0.9 30 ± 2.1 4.6 ± 1.0
Age groups Propane grill
indoors Outdoor device No devices Other
Num. of
respondents
1 senior 0.0 ± NA 0.0 ± NA 0.0 ± NA 9.1 ± NA 11
1 adult 0.3 ± NA 1.3 ± NA 9.0 ± 3.2 11 ± 3.5 301
2 or more adults/seniors
without kids 0.4 ± NA 4.3 ± 1.3 4.9 ± 1.4 6.6 ± 1.4 970
1 or more kids and
adults/seniors 0.4 ± NA 7.1 ± 2.2 3.1 ± 1.5 4.7 ± 1.5 548
Weighted average 0.4 ± NA 4.6 ± 1.0 5.0 ± 1.0 6.8 ± 1.0
Table 19. Probabilities and uncertainties of households corresponding to cooking device selection for
dinner. Values are in percentages (%).
Table 19 shows the cooking device selection per household type for dinner. According to the weighted
averages, the stove is the most frequently used device of all households, followed by equal oven and
microwave use. The propane grill was the least used device.

Huang, Y.W., Residential Cooking Behavior in the United States: Data Collected from a Web-Based Survey
LBNL- XXXXX
Page 37
Figure 29. Percentage of households reporting use of cooking devices for breakfast in climate zones with
more than 20 respondents (bars) and 95th percentile confidence interval of the probability of households
using particular devices (whiskers). Devices not included in graphs had low reported usage.
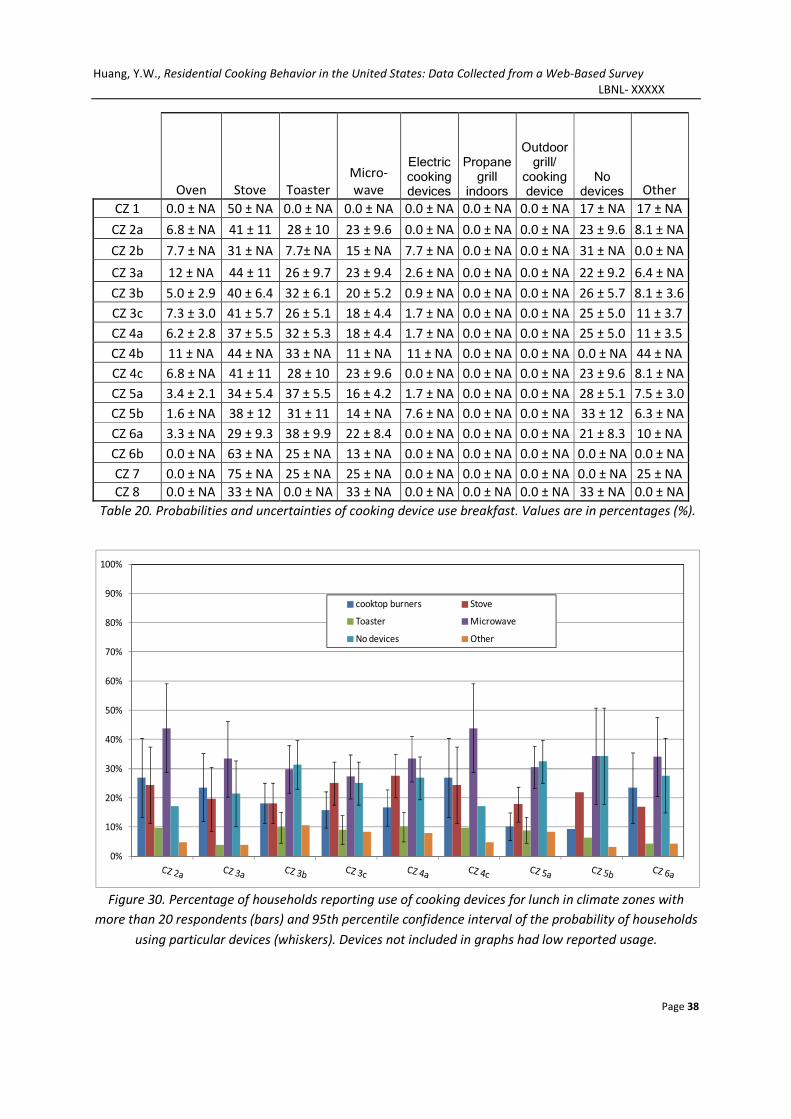
Figure 29 and table 20 show the percentage of cooking device use in the climate zones for breakfast
preparation. Respondents did not use an outdoor grill or propane grill indoors. The stove was used most
frequently, followed by toaster use, and microwave, respectively. There is a very slight statistically
significant difference in toaster use between CZs 3a and 5a, but there is no significant difference in
device usage between any other climate zones.
0%
10%
20%
30%
40%
50%
60%
70%
80%
90%
100%
Oven Stove
Toaster Microwave
No devices Other
Huang, Y.W., Residential Cooking Behavior in the United States: Data Collected from a Web-Based Survey
LBNL- XXXXX
Page 38
Oven Stove Toaster
Micro-
wave
Electric cooking devices
Propane grill
indoors
Outdoor grill/
cooking device
No devices Other
CZ 1 0.0 ± NA 50 ± NA 0.0 ± NA 0.0 ± NA 0.0 ± NA 0.0 ± NA 0.0 ± NA 17 ± NA 17 ± NA
CZ 2a 6.8 ± NA 41 ± 11 28 ± 10 23 ± 9.6 0.0 ± NA 0.0 ± NA 0.0 ± NA 23 ± 9.6 8.1 ± NA
CZ 2b 7.7 ± NA 31 ± NA 7.7± NA 15 ± NA 7.7 ± NA 0.0 ± NA 0.0 ± NA 31 ± NA 0.0 ± NA
CZ 3a 12 ± NA 44 ± 11 26 ± 9.7 23 ± 9.4 2.6 ± NA 0.0 ± NA 0.0 ± NA 22 ± 9.2 6.4 ± NA
CZ 3b 5.0 ± 2.9 40 ± 6.4 32 ± 6.1 20 ± 5.2 0.9 ± NA 0.0 ± NA 0.0 ± NA 26 ± 5.7 8.1 ± 3.6
CZ 3c 7.3 ± 3.0 41 ± 5.7 26 ± 5.1 18 ± 4.4 1.7 ± NA 0.0 ± NA 0.0 ± NA 25 ± 5.0 11 ± 3.7
CZ 4a 6.2 ± 2.8 37 ± 5.5 32 ± 5.3 18 ± 4.4 1.7 ± NA 0.0 ± NA 0.0 ± NA 25 ± 5.0 11 ± 3.5
CZ 4b 11 ± NA 44 ± NA 33 ± NA 11 ± NA 11 ± NA 0.0 ± NA 0.0 ± NA 0.0 ± NA 44 ± NA
CZ 4c 6.8 ± NA 41 ± 11 28 ± 10 23 ± 9.6 0.0 ± NA 0.0 ± NA 0.0 ± NA 23 ± 9.6 8.1 ± NA
CZ 5a 3.4 ± 2.1 34 ± 5.4 37 ± 5.5 16 ± 4.2 1.7 ± NA 0.0 ± NA 0.0 ± NA 28 ± 5.1 7.5 ± 3.0
CZ 5b 1.6 ± NA 38 ± 12 31 ± 11 14 ± NA 7.6 ± NA 0.0 ± NA 0.0 ± NA 33 ± 12 6.3 ± NA
CZ 6a 3.3 ± NA 29 ± 9.3 38 ± 9.9 22 ± 8.4 0.0 ± NA 0.0 ± NA 0.0 ± NA 21 ± 8.3 10 ± NA
CZ 6b 0.0 ± NA 63 ± NA 25 ± NA 13 ± NA 0.0 ± NA 0.0 ± NA 0.0 ± NA 0.0 ± NA 0.0 ± NA
CZ 7 0.0 ± NA 75 ± NA 25 ± NA 25 ± NA 0.0 ± NA 0.0 ± NA 0.0 ± NA 0.0 ± NA 25 ± NA
CZ 8 0.0 ± NA 33 ± NA 0.0 ± NA 33 ± NA 0.0 ± NA 0.0 ± NA 0.0 ± NA 33 ± NA 0.0 ± NA
Table 20. Probabilities and uncertainties of cooking device use breakfast. Values are in percentages (%).
Figure 30. Percentage of households reporting use of cooking devices for lunch in climate zones with
more than 20 respondents (bars) and 95th percentile confidence interval of the probability of households
using particular devices (whiskers). Devices not included in graphs had low reported usage.
0%
10%
20%
30%
40%
50%
60%
70%
80%
90%
100%
cooktop burners Stove
Toaster Microwave
No devices Other
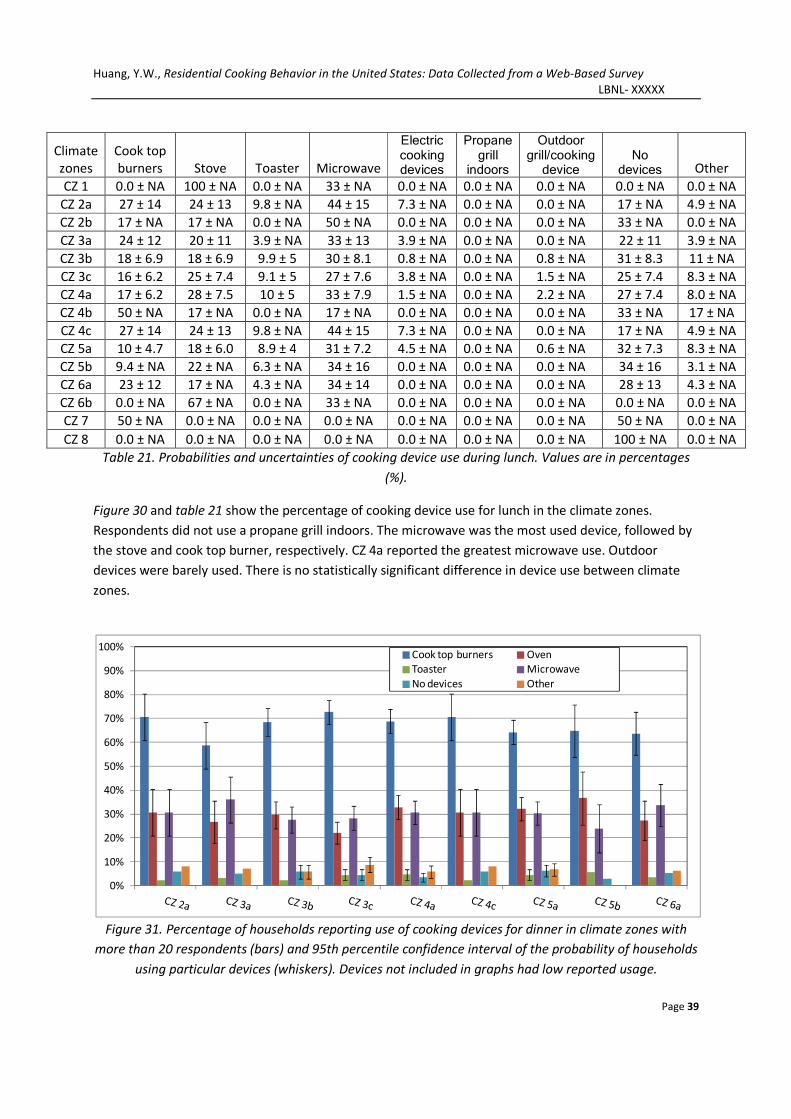
Huang, Y.W., Residential Cooking Behavior in the United States: Data Collected from a Web-Based Survey
LBNL- XXXXX
Page 39
Climate
zones
Cook top
burners Stove Toaster Microwave
Electric cooking devices
Propane grill
indoors
Outdoor grill/cooking
device No
devices Other
CZ 1 0.0 ± NA 100 ± NA 0.0 ± NA 33 ± NA 0.0 ± NA 0.0 ± NA 0.0 ± NA 0.0 ± NA 0.0 ± NA
CZ 2a 27 ± 14 24 ± 13 9.8 ± NA 44 ± 15 7.3 ± NA 0.0 ± NA 0.0 ± NA 17 ± NA 4.9 ± NA
CZ 2b 17 ± NA 17 ± NA 0.0 ± NA 50 ± NA 0.0 ± NA 0.0 ± NA 0.0 ± NA 33 ± NA 0.0 ± NA
CZ 3a 24 ± 12 20 ± 11 3.9 ± NA 33 ± 13 3.9 ± NA 0.0 ± NA 0.0 ± NA 22 ± 11 3.9 ± NA
CZ 3b 18 ± 6.9 18 ± 6.9 9.9 ± 5 30 ± 8.1 0.8 ± NA 0.0 ± NA 0.8 ± NA 31 ± 8.3 11 ± NA
CZ 3c 16 ± 6.2 25 ± 7.4 9.1 ± 5 27 ± 7.6 3.8 ± NA 0.0 ± NA 1.5 ± NA 25 ± 7.4 8.3 ± NA
CZ 4a 17 ± 6.2 28 ± 7.5 10 ± 5 33 ± 7.9 1.5 ± NA 0.0 ± NA 2.2 ± NA 27 ± 7.4 8.0 ± NA
CZ 4b 50 ± NA 17 ± NA 0.0 ± NA 17 ± NA 0.0 ± NA 0.0 ± NA 0.0 ± NA 33 ± NA 17 ± NA
CZ 4c 27 ± 14 24 ± 13 9.8 ± NA 44 ± 15 7.3 ± NA 0.0 ± NA 0.0 ± NA 17 ± NA 4.9 ± NA
CZ 5a 10 ± 4.7 18 ± 6.0 8.9 ± 4 31 ± 7.2 4.5 ± NA 0.0 ± NA 0.6 ± NA 32 ± 7.3 8.3 ± NA
CZ 5b 9.4 ± NA 22 ± NA 6.3 ± NA 34 ± 16 0.0 ± NA 0.0 ± NA 0.0 ± NA 34 ± 16 3.1 ± NA
CZ 6a 23 ± 12 17 ± NA 4.3 ± NA 34 ± 14 0.0 ± NA 0.0 ± NA 0.0 ± NA 28 ± 13 4.3 ± NA
CZ 6b 0.0 ± NA 67 ± NA 0.0 ± NA 33 ± NA 0.0 ± NA 0.0 ± NA 0.0 ± NA 0.0 ± NA 0.0 ± NA
CZ 7 50 ± NA 0.0 ± NA 0.0 ± NA 0.0 ± NA 0.0 ± NA 0.0 ± NA 0.0 ± NA 50 ± NA 0.0 ± NA
CZ 8 0.0 ± NA 0.0 ± NA 0.0 ± NA 0.0 ± NA 0.0 ± NA 0.0 ± NA 0.0 ± NA 100 ± NA 0.0 ± NA
Table 21. Probabilities and uncertainties of cooking device use during lunch. Values are in percentages
(%).
Figure 30 and table 21 show the percentage of cooking device use for lunch in the climate zones.
Respondents did not use a propane grill indoors. The microwave was the most used device, followed by
the stove and cook top burner, respectively. CZ 4a reported the greatest microwave use. Outdoor
devices were barely used. There is no statistically significant difference in device use between climate
zones.
Figure 31. Percentage of households reporting use of cooking devices for dinner in climate zones with
more than 20 respondents (bars) and 95th percentile confidence interval of the probability of households
using particular devices (whiskers). Devices not included in graphs had low reported usage.
0%
10%
20%
30%
40%
50%
60%
70%
80%
90%
100%Cook top burners Oven
Toaster Microwave
No devices Other

Huang, Y.W., Residential Cooking Behavior in the United States: Data Collected from a Web-Based Survey
LBNL- XXXXX
Page 40
Climate
zones
Cook top
burners Oven Toaster Microwave
Electric
cooking
devices
Propane
grill
indoors
Outdoor
grill/cooking
device No devices Other
CZ 1 43 ± NA 29 ± NA 14 ± NA 0.0 ± NA 0.0 ± NA 0.0 ± NA 0.0 ± NA 0.0 ± NA 0.0 ± NA
CZ 2a 71 ± 9.7 31 ± 9.8 2.4 ± NA 31 ± 9.8 4.7 ± NA 0.0 ± NA 3.5 ± NA 5.9± NA 8.2 ± NA
CZ 2b 53 ± NA 47 ± NA 0.0 ± NA 40 ± NA 0.0 ± NA 0.0 ± NA 6.7 ± NA 0.0 ± NA 0.0 ± NA
CZ 3a 59 ± 9.8 27 ± 8.8 3.1 ± NA 36 ± 9.6 3.1 ± NA 0.0 ± NA 5.2 ± NA 5.2 ± NA 7.2 ± NA
CZ 3b 68 ± 5.7 30 ± 5.6 2.4 ± NA 28 ± 5.5 6.3 ± 3.0 1.6 ± NA 8.7 ± 3.5 5.9 ± 2.9 5.9 ± 2.9
CZ 3c 73 ± 5.0 22 ± 4.6 4.6 ± 2.3 28 ± 5.0 5.2 ± 2.5 0.0 ± NA 5.9 ± 2.6 4.6 ± 2.3 8.8 ± 3.2
CZ 4a 69 ± 4.9 33 ± 5.0 4.7 ± 2.2 31 ± 4.9 5.8 ± 2.5 0.0 ± NA 4.7 ± 2.2 3.5 ± 1.9 5.8 ± 2.5
CZ 4b 62 ± NA 31 ± NA 0.0 ± NA 31 ± NA 15 ± NA 0.0 ± NA 0.0 ± NA 0.0 ± NA 7.7 ± NA
CZ 4c 71 ± 9.7 31 ± 9.8 2.4 ± NA 31 ± 9.8 4.7 ± NA 0.0 ± NA 3.5 ± NA 5.9 ± NA 8.2 ± NA
CZ 5a 64 ± 5.0 32 ± 4.9 4.6 ± 2.2 30 ± 4.8 4.3 ± 2.1 0.3 ± NA 3.7 ± 2.0 6.3 ± 2.5 6.8 ± 2.6
CZ 5b 65 ± 11 37 ± 11 5.6 ± NA 24 ± 9.9 11 ± NA 0.0 ± NA 4.2 ± NA 2.8 ± NA 0.0 ± NA
CZ 6a 64 ± 9.0 27 ± 8.3 3.6 ± NA 34 ± 8.8 5.5 ± NA 0.0 ± NA 1.8 ± NA 5.5 ± NA 6.4 ± NA
CZ 6b 44 ± NA 33 ± NA 22 ± NA 22 ± NA 0.0 ± NA 0.0 ± NA 0.0 ± NA 0.0 ± NA 0.0 ± NA
CZ 7 40 ± NA 40 ± NA 0.0 ± NA 20 ± NA 0.0 ± NA 20 ± NA 0.0 ± NA 0.0 ± NA 20 ± NA
CZ 8 100 ± NA 67 ± NA 0.0 ± NA 33 ± NA 0.0 ± NA 0 ± NA 0.0 ± NA 0.0 ± NA 0.0 ± NA
Table 22. Probabilities and uncertainties of cooking device use during dinner. Values are in percentages
(%).
Figure 31 and table 22 show use of different cooking devices during dinner. Respondents did not use
propane grills indoors. The most commonly used device was the cooktop burners, followed by
microwave and oven. CZ 3c reported the greatest stove use for dinner, and CZ 4c reported the most
microwave use. There is a very slight statistically significant difference in oven use between CZs 3c and
CZs 4a and 5a, but there is no significant difference in device usage between any other climate zones.

Huang, Y.W., Residential Cooking Behavior in the United States: Data Collected from a Web-Based Survey
LBNL- XXXXX
Page 41
Figure 32. Average percentage of cooking device use by all households for breakfast, lunch, and dinner
(bars) and 95th percentile confidence interval of the probability of households using particular devices
(whiskers).
Cook Top
Burners Stove Oven Toaster Microwave
Electric
cooking
devices No devices
Outdoor
device
Breakfast NA 38 ± 2.4 5.6± 1.2 31 ± 2.3 18 ± 2.0 1.4 ± NA 26 ± 2.2 0.0 ± NA
Lunch 17 ± 2.7 22 ± 2.9 NA 8.5 ± 2.0 32 ± 3.3 2.9 ± NA 28 ± 3.1 0.9 ± NA
Dinner 67 ± 2.2 NA 30 ± 2.1 4.0 ± 0.9 30 ± 2.1 5.4 ± NA 4.9 ± 1.0 4.9 ± 1.0
Table 23. Probabilities and uncertainties of cooking device use averages by all households for breakfast,
lunch, and dinner. Values are in percentages (%).
Figure 32 and Table 23 show the weighted average percentages of devices used for each meal. The
stove/cook top is the most used device for breakfast and dinner, and microwaves are most commonly
used for lunch. Dinnertime has the greatest percentage of device use overall, followed by breakfast and
lunch, respectively. Toaster use decreased with each meal from breakfast to dinner, and oven use
increased dramatically from breakfast to dinner.
Table 24 shows the estimated cooktop and oven use for each meal for each family type and the
weighted average based on the reported type of cooking. Many respondents selected the oven or stove
0%
20%
40%
60%
80%
100%
Breakfast Lunch Dinner
Cook top burners
Stove
Oven
Toaster
Microwave
Electric cooking devices
Outdoor griil/cooking device
No devices

Huang, Y.W., Residential Cooking Behavior in the United States: Data Collected from a Web-Based Survey
LBNL- XXXXX
Page 42
and indicated that they performed cooking that occurred in both the oven and on the cooktop burners.
For this reason the total respondents using the oven or the cooktop burner is higher than the total
respondents that reported using the stove or oven for breakfast, the cooktop burners or stove for lunch,
and the cooktop burners or oven for dinner. The data in Table 24 is likely a more accurate
representation of the frequency with which the oven and cooktop burners are used than the raw survey
responses presented in Table 23.
Breakfast Lunch Dinner
Age Groups Oven Cooktop Oven Cooktop Oven Cooktop
1 senior 0.0 ± NA 78 ± NA 0.0 ± NA 20 ± NA 18 ± NA 64 ± NA
1 adult 2.8 ± NA 35 ± 5.9 6.2 ± NA 35 ± 8.2 17 ± 4.2 57 ± 5.6
2 or more adults/seniors without kids 5.8 ± 1.6 38 ± 3.3 5.2 ± 2.1 35 ± 4.4 28 ± 2.8 68 ± 2.9
1 or more kids and adults/seniors 5.4 ± 2.0 39 ± 4.3 6.9 ± 3.2 27 ± 5.6 39 ± 4.1 69 ± 3.9
weighted average 5.2 ± 1.1 38 ± 2.4 5.8 ± 1.6 32 ± 3.2 30 ± 2.1 66 ± 2.2
Table 24. Probabilities and uncertainties of cooktop burner(s) and oven use averages by all households
for breakfast, lunch, and dinner. Values are in percentages (%).
Respondent cooking method selection
This section describes the different cooking methods used by the respondents. Variations in cooking
methods used are explored as a function of household type, climate zone, and meal type.
Figure 33. Percentage of households using different food preparation methods for breakfast (bars) and
95th percentile confidence interval of the probability of households using different food preparation
methods (whiskers).
0%
10%
20%
30%
40%
50%
60%
70%
80%
90%
100%
1 senior 1 adult 2 or more
adults/seniors
without kids
1 or more kids
and
adults/seniors
Bake
Saute
Grill/ cook on a
grill pan
Boil
Other

Huang, Y.W., Residential Cooking Behavior in the United States: Data Collected from a Web-Based Survey
LBNL- XXXXX
Page 43
Home type Bake Sauté Deep fry Grill Boil Other
Num. of
respondents
1 senior 0.0 ± NA 44 ± NA 0.0 ± NA 0.0 ± NA 44 ± NA 0.0 ± NA 9
1 adult 2.8 ± NA 21 ± 5.0 0.0 ± NA 1.2 ± NA 11 ± 4.3 3.2 ± NA 253
2 or more adults/
seniors without kids 4.5 ± 1.4 26 ± 3.0 0.0 ± NA 1.9 ± 0.9 12 ± 2.2 4.7 ± 1.4 824
1 or more kids and
adults/seniors 4.6 ± 4.8 23 ± 3.7 0.0 ± NA 2.6 ± 1.4 14 ± 3.0 5.4 ± 2.0 502
Weighted average 4.2 ± 1.0 24 ± 2.1 0.0 ± NA 2.0 ± 0.7 13 ± 1.7 4.6 ± 1.0
Table 25. Probabilities and uncertainties of households using different food preparation methods for
breakfast. Values are in percentages (%).
Figure 33 and Table 25 show the cooking method selections of households for breakfast. Not every
respondent indicated a cooking method, and some respondents indicated more than one. There was no
significant difference in usage of specific devices between home types, but there were significant
differences in usage between devices for both specific home types and on average. Sautéing was the
most common activity, followed by boiling and “other,” respectively.
Figure 34. Percentage of households using different food preparation methods for lunch (bars) and 95th
percentile confidence interval of the probability of households using different food preparation methods
(whiskers).
0%
10%
20%
30%
40%
50%
60%
70%
80%
90%
100%
1 senior 1 adult 2 or more
adults/seniors
without kids
1 or more kids
and
adults/seniors
Bake
Saute
Grill/ cook on a
grill pan
Boil
Other

Huang, Y.W., Residential Cooking Behavior in the United States: Data Collected from a Web-Based Survey
LBNL- XXXXX
Page 44
Home type Bake Sauté
Deep
Fry Grill Boil Other
Num. of
respondents
1 senior 0 ± NA 20 ± NA 0.0 ± NA 0.0 ± NA 0.0 ± NA 0.0 ± NA 5
1 adult 5.4 ± NA 19 ± 6.8 0.8 ± NA 2.3 ± NA 18 ± 6.7 6.2 ± NA 130
2 or more adults/
seniors without kids 4.5 ± 1.9 23 ± 3.9 0.9 ± NA 4.1 ± 1.8 16 ± 3.4 3.9 ± 1.8 442
1 or more kids and
adults/seniors 6.5± 3.1 15 ± 4.5 0.0 ± NA 2.0 ± NA 15 ± 4.4 3.7 ± NA 246
Weighted average 5.2± 1.5 20 ± 2.7
0.6 ± NA 3.2 ± 1.2 16 ± 2.5 4.2 ± 1.4
Table 26. Probabilities and uncertainties of households using different food preparation methods for
lunch. Values are in percentages (%).
Figure 34 and table 26 show the cooking method selections of households for lunch. Again, there was no
significant difference in usage of specific devices between home types, but there were significant
differences in usage between devices for both specific home types and on average. Sautéing has the
greatest likelihood. Boiling is the second most common activity for lunch.
Figure 35. Percentage of households using different food preparation methods for dinner (bars) and 95th
percentile confidence interval of the probability of households using different food preparation methods
(whiskers).
0%
10%
20%
30%
40%
50%
60%
70%
80%
90%
100%
1 senior 1 adult 2 or more
adults/seniors
without kids
1 or more kids
and
adults/seniors
Bake
Saute
Grill/ cook on a
grill pan
Boil
Other

Huang, Y.W., Residential Cooking Behavior in the United States: Data Collected from a Web-Based Survey
LBNL- XXXXX
Page 45
Age groups Bake Sauté Deep Fry Grill Boil Other
Num. of
respondents
1 senior 18 ± NA 45 ± NA 0.0% ± NA 9.1 ± NA 27 ± NA 9.1 ± NA 13
1 adult 16 ± 4.1 37 ± 5.5 2.0% ± NA 4.7 ± 2.4 32 ± 5.3 6.0 ± 2.7 301
2 or more adults/seniors
without kids 27 ± 2.8 49 ± 3.1 0.4% ± NA 8.1 ± 1.7 34 ± 3.0 8.8 ± 1.8 970
1 or more kids and
adults/seniors 38 ± 4.1 48 ± 4.2 0.2% ± NA 6.9 ± 2.1 40 ± 4.1 12 ± 2.7 548
Weighted average 28 ± 2.1 47 ± 2.3 0.6 ± NA 7.2 ± 1.2 36 ± 2.2 9.2 ± 1.3
Table 27. Probabilities and uncertainties of households using different food preparation methods for
dinner. Values are in percentages (%).
Figure 35 and table 27 show the cooking method selections of households for dinner. Dinner had the
greatest use of each method on average than breakfast or lunch. Sautéing and boiling were the dominate
cooking methods. For dinner there are significant differences in device usage between home types. Homes
with kids are more likely to bake than homes with more than one adult with no kids and homes with more
than one adult/senior and no kids are more likely to bake than homes with 1 adult. Homes with more than
one occupant are more likely to sauté than homes with 1 adult.
Figure 36. Percentage of households using different food preparation methods for breakfast for climate
zones with more than 20 respondents (bars) and 95th percentile confidence interval of the probability of
households using different food preparation methods (whiskers).
0%
10%
20%
30%
40%
50%
CZ 2a CZ 3a CZ 3b CZ 3c CZ 4a CZ 4c CZ 5a CZ 5b CZ 6a
Bake
Saute
Boil
Other

Huang, Y.W., Residential Cooking Behavior in the United States: Data Collected from a Web-Based Survey
LBNL- XXXXX
Page 46
Climate
zones Bake Sauté Deep Fry
Grill/ cook on grill plate Boil Other
CZ 1 0.0 ± NA 33 ± NA 0.0 ± NA 0.0 ± NA 17 ± NA 0 ± NA
CZ 2a 4.1 ± NA 28 ± 10 0.0 ± NA 0.0 ± NA 12 ± NA 1.4 ± NA
CZ 2b 7.7 ± NA 15 ± NA 0.0 ± NA 0.0 ± NA 15 ± NA 0.0 ± NA
CZ 3a 12 ± NA 31 ± 10 1.3 ± NA 5.1 ± NA 13 ± 7.4 2.6 ± NA
CZ 3b 3.2 ± NA 26 ± 5.8 0.5 ± NA 4.1 ± NA 9.5 ± 3.8 5.9 ± 3.1
CZ 3c 4.9 ± 2.5 25 ± 5.0 0.0 ± NA 2.4 ± NA 17 ± 4.4 5.6 ± 2.7
CZ 4a 4.5 ± 2.4 25 ± 5.0 0.0 ± NA 1.7 ± NA 13 ± 3.9 5.2 ± 2.5
CZ 4b 0.5 ± NA 11 ± NA 0.0 ± NA 0.0 ± NA 33 ± NA 22 ± NA
CZ 4c 4.5 ± NA 28 ± 10 0.0 ± NA 0.0 ± NA 12 ± NA 1.4 ± NA
CZ 5a 3.1 ± NA 22 ± 4.7 0.0 ± NA 1.0 ± NA 12 ± 3.8 3.7 ± 2.2
CZ 5b 0.0 ± NA 28 ± 11 0.0 ± NA 1.6 ± NA 9.4 ± NA 6.3 ± NA
CZ 6a 3.1 ± NA 16 ± 7.5 0.0 ± NA 1.1 ± NA 15 ± 7.3 3.3 ± NA
CZ 6b 0.0 ± NA 25 ± NA 0.0 ± NA 0.0 ± NA 37 ± NA 0.0 ± NA
CZ 7 0.0 ± NA 50 ± NA 0.0 ± NA 0.0 ± NA 25 ± NA 0.0 ± NA
CZ 8 0.0 ± NA 0 ± NA 0.0 ± NA 0.0 ± NA 33 ± NA 0.0 ± NA
Weighted
average 4.1 ± 1.0 25 ± 2.2 0.1 ± NA 2.0 ± 0.7 13 ± 1.7 4.5 ± 1.0
Table 28. Probabilities and uncertainties of households using different cooking methods for breakfast by
climate zone. Values are in percentages (%).
Figure 36 and table 28 show the reported percentage of homes using different cooking methods for
breakfast according to climate zone. There is no statistical difference in the likelihood of using a specific
cooking method between climate zones, however that are significant difference in the likelihood of
using a cooking method both in a given climate zone and on average. Sauté and boil occur most often
for breakfast preparation.

Huang, Y.W., Residential Cooking Behavior in the United States: Data Collected from a Web-Based Survey
LBNL- XXXXX
Page 47
Figure 37. Percentage of households using different food preparation methods for lunch for climate
zones with more than 20 respondents (bars) and 95th percentile confidence interval of the probability of
households using different food preparation methods (whiskers).
Climate
zones Bake Sauté Deep fry
Grill/ cook
on a grill
pan Boil Other
CZ 1 0.0 ± NA 67 ± NA 0.0 ± NA 0.0 ± NA 67 ± NA 0.0 ± NA
CZ 2a 7.3 ± NA 29 ± 14 0.0 ± NA 7.3 ± NA 15 ± NA 7.3 ± NA
CZ 2b 0.0 ± NA 0.0 ± NA 0.0 ± NA 0.0 ± NA 17 ± NA 0.0 ± NA
CZ 3a 5.9 ± NA 12 ± NA 0.0 ± NA 2.0 ± NA 25 ± 12 3.9 ± NA
CZ 3b 4.1 ± NA 21 ± 7.2 1.7± NA 3.3 ± NA 16 ± 6.5 5.0 ± NA
CZ 3c 3.8 ± NA 23 ± 7.1 0.8 ± NA 1.5 ± NA 19 ± 6.7 6.1 ± NA
CZ 4a 5.8 ± NA 25 ± 7.2 1.4 ± NA 5.1 ± NA 18 ± 6.4 3.6 ± NA
CZ 4b 0.0 ± NA 50 ± NA 0.0 ± NA 17 ± NA 17 ± NA 0.0 ± NA
CZ 4c 7.3 ± NA 29 ± 14 0.0 ± NA 7.3 ± NA 15 ± NA 7.3 ± NA
CZ 5a 3.2 ± NA 13 ± 5.3 0.0 ± NA 1.9 ± NA 13 ± 5.2 3.8 ± NA
CZ 5b 16 ± NA 13 ± NA 0.0 ± NA 0.0 ± NA 9.4 ± NA 0.0 ± NA
CZ 6a 2.1 ± NA 17 ± NA 0.0 ± NA 2.1 ± NA 19 ± NA 6.4 ± NA
CZ 6b 0.0 ± NA 33 ± NA 0.0 ± NA 33 ± NA 0.0 ± NA 0.0 ± NA
CZ 7 0.0 ± NA 0.0 ± NA 0.0 ± NA 0.0 ± NA 50 ± NA 0.0 ± NA
CZ 8 0.0 ± NA 0.0 ± NA 0.0 ± NA 0.0 ± NA 0.0± NA 0.0 ± NA
Weighted
average 4.9 ± 1.5 20 ± 2.8 0.6 ± NA 3.3 ± 1.3 17 ± 2.6 4.6 ± 1.5
Table 29. Probabilities and uncertainties of households using different cooking methods for lunch by
select climate zones. Values are in percentages (%).
Figure 37 and Table 29 show the reported percentage of cooking methods for lunch. Again, there is no
statistical difference in the likelihood of using a specific cooking method between climate zones, however
that are significant difference in the likelihood of using a cooking method both in a given climate zone and
on average. The most used method overall is sautéing, followed by boiling, and deep frying occurs least for
lunch.
0%
10%
20%
30%
40%
50%
CZ 2a CZ 3a CZ 3b CZ 3c CZ 4a CZ 4c CZ 5a CZ 5b CZ 6a
Bake
Saute
Boil
Other

Huang, Y.W., Residential Cooking Behavior in the United States: Data Collected from a Web-Based Survey
LBNL- XXXXX
Page 48
Figure 38. Percentage of households using different food preparation methods for dinner for climate
zones with more than 20 respondents (bars) and 95th percentile confidence interval of the probability of
households using different food preparation methods (whiskers).
Climate
zones Bake Sauté Deep fry
Grill/ cook
on a grill
pan Boil Other
CZ 1 29 ± NA 14 ± NA 0.0 ± NA 0.0 ± NA 29 ± NA 0.0 ± NA
CZ 2a 28 ± 9.6 49 ± 11 0.0 ± NA 8.2 ± NA 34 ± 10 11 ± NA
CZ 2b 47 ± NA 40 ± NA 0.0 ± NA 6.7 ± NA 13 ± NA 13 ± NA
CZ 3a 28 ± 8.9 40 ± 9.8 0.0 ± NA 9.3 ± NA 27 ± 8.8 5.2 ± NA
CZ 3b 27 ± 5.5 48 ± 6.2 1.6 ± NA 7.9 ± 3.3 34 ± 5.9 8.3 ± 3.4
CZ 3c 22 ± 4.6 48 ± 5.6 0.3 ± NA 7.2 ± 2.9 40 ± 5.5 10 ± 2.9
CZ 4a 29 ± 4.8 51 ± 5.3 0.9 ± NA 5.8 ± 2.5 37 ± 5.1 10 ± 3.1
CZ 4b 31 ± NA 31 ± NA 0.0 ± NA 0.0 ± NA 23 ± NA 8.3 ± NA
CZ 4c 28 ± 9.6 49 ± 11 0.0 ± NA 8.2 ± NA 34 ± 10 11 ± NA
CZ 5a 32 ± 4.9 43 ± 5.2 0.6 ± NA 7.4 ± 2.7 35 ± 5.0 9.6 ± 3.0
CZ 5b 34 ± 11 45 ± 12 0.0 ± NA 4.2 ± NA 39 ± 11 11 ± NA
CZ 6a 25 ± 8.1 50 ± 9.3 0.0 ± NA 5.2 ± NA 38 ± 9.1 7.7 ± NA
CZ 6b 11 ± NA 22 ± NA 0.0 ± NA 11 ± NA 33 ± NA 11 ± NA
CZ 7 40 ± NA 0 ± NA 0.0 ± NA 20 ± NA 40 ± NA 0.0 ± NA
CZ 8 67 ± NA 67 ± NA 0.0 ± NA 33 ± NA 33 ± NA 0.0 ± NA
Weighted
Average 28± 2.1 47± 2.3 0.6 ± NA 7.1 ± 1.2 36 ± 2.2 9 ± 1.4
Table 30. Probabilities and uncertainties of households using different cooking methods for dinner by
select climate zones. Values are in percentages (%).
Figure 38 and table 30 show the percentage of each cooking method reported for dinner according to
select climate zones and the uncertainty in the probability that each climate zone uses a specific type of
cooking at each meal. There are slight significant differences in the likelihood that occupants of CZ 3c
and 5a will bake, but for the remainder of cooking methods, there is no significant difference in
0%
20%
40%
60%
80%
100%
CZ 2a CZ 3a CZ 3b CZ 3c CZ 4a CZ 4c CZ 5a CZ 5b CZ 6a
Bake
Saute
Boil
Other

Huang, Y.W., Residential Cooking Behavior in the United States: Data Collected from a Web-Based Survey
LBNL- XXXXX
Page 49
likelihood between climate zones. There are significant differences between cooking methods for each
climate zone and for the weighted averages. Sautéing is the most commonly chosen method for dinner
preparation followed by boiling.
Figure 39. Percentage of households using different food preparation methods (bars) and 95th percentile
confidence interval of the probability of households using different food preparation methods (whiskers).
Meal Bake Sauté Deep fry Grill Boil Other
Breakfast 4.1 ± 1.0 25 ± 2.2 0.1 ± NA 2.0 ± 0.7 13 ± 1.7 4.5 ± 1.0
Lunch 4.9 ± 1.5 20 ± 2.8 0.6 ± NA 3.3 ± 1.3 17 ± 2.6 4.6 ± 1.5
Dinner 28 ± 2.1 47 ± 2.3 0.6 ± NA 7.1 ± 1.2 36 ± 2.2 9.3 ± 1.4
Table 31 Average percentage of households and selected cooking methods for breakfast, lunch, and
dinner. Values are in percentages (%).
Figure 39 and table 31 compare the weighted averages of each cooking method choice for each meal.
Respondents sauté most often at dinnertime then breakfast and lunch. Boiling occurs most often for
dinner preparation. Baking, boiling, and grilling frequency increase from breakfast to the dinner meal. In
sum, sautéing for all meals is the most used method, followed by boil, bake, “other,” grill and deep fry,
respectively.
0%
10%
20%
30%
40%
50%
60%
Breakfast Lunch Dinner
Bake
Saute
Deep fry
Grill/ cook on a
grill pan
Boil
Other

Huang, Y.W., Residential Cooking Behavior in the United States: Data Collected from a Web-Based Survey
LBNL- XXXXX
Page 50
Conclusion We conducted an online survey to determine cooking behaviors for occupants of the U.S. housing stock.
Over 2800 households responded to the survey on questions of meal preparation rates, type of cooking
behavior, and types of devices used. Respondents were predominately two or more adults or seniors
households without children. Climate zones 5a , 4a, and 3c (cold, humid; mild, humid; and marine,
respectively) had the greatest number of respondents of all the climate zones. We determined the
central estimate and 95th percentile confidence interval of the probability that homes with different
occupancy profiles and in different locations would cook certain meals and how they would prepare
them. The results indicated that, given the data that was available, we cannot differentiate between
cooking activity patterns in different climate zones, however different family types did have slightly
different behaviors for some of the parameters explored. When the entire dataset is considered, the
probability that meals will be cooked and how they will be prepared can be estimated with relatively
low uncertainty.
This paper provides the reader with an overview of cooking behavior in the United States based on data
collected from the survey in addition to information that can be used to model indoor pollution
generated through cooking. The cooking device usage data from this report will allow for more accurate
modeling of the impacts of cooking on indoor air quality.
References
Edwards, R. D., J. Jurvelin, K. Saarela and M. Jantunen (2001). "VOC concentrations measured in
personal samples and residential indoor, outdoor and workplace microenvironments in EXPOLIS-
Helsinki, Finland." Atmospheric Environment 35(27): 4531-4543.
Klepeis, N. E., W. C. Nelson, W. R. Ott, J. P. Robinson, A. M. Tsang, P. Switzer, J. V. Behar, S. C. Hern and
W. H. Engelmann (2001). "The National Human Activity Pattern Survey (NHAPS): a resource for
assessing exposure to environmental pollutants." Journal of Exposure Analysis and
Environmental Epidemiology 11(3): 231-252.
Klug, V. L., A. B. Lobscheid and B. C. Singer (2011). Cooking Appliance Use in California Homes – Data
Collected from a Web-Based Survey, LBNL-5028E. Berkeley, CA, Lawrence Berkeley National
Laboratory:LBNL-5028E.
Logue, J. M., P. N. Price, M. H. Sherman and B. C. Singer (2012). "A Method to Estimate the Chronic
Health Impact of Air Pollutants in US Residences." Environmental Health Perspectives 120(2):
216-222.
Navidi, W. (2006). 4.10 The Central Limit Theorem. Statistics for Engineers and Scientists. S. Jeans and D.
D. Matteson. New York, NY, McGraw-Hill: 270-280.
US Census Bureau. (2012). "County Housing Unit Estimates for States: 2010 to 2011." Retrieved
6/27/2012 from http://www.census.gov/popest/data/housing/totals/2011/HU-EST2011-3.html.
US DOE (2010). VOLUME 7.1 Building America Best Practices Series: High-Performance Home
Technologies, Guide to Determining Climate Regions by County. Washington DC, US Department
of Energy
US EIA (2009). Residential Buildings Energy Consumption Survey (RECs), U.S. Energy Information
Administration.
Weisel, C. P., J. Zhang, B. J. Turpin, M. Morandi, S. Colome, T. Stock and D. M. Spektor (2005).
Relationships of Indoor, Outdoor, and Personal Air (RIOPA) Part I. Collection Methods, Health
Effects Institute, Mickely Leland National Urban Air Toxics Research Center and Descriptive
Analysis:HEI Research Report 130 http://pubs.healtheffects.org/getfile.php?u=25
Huang, Y.W., Residential Cooking Behavior in the United States: Data Collected from a Web-Based Survey
LBNL- XXXXX
Page 51
Appendix: Administered cooking survey questionnaire

!"#$%&
'(()*+#%,-./$0'(()*+#%,-./$0'(()*+#%,-./$0'(()*+#%,-./$0
!"#$%&'%()#$(*$+",)$)&'-#.$,)$+($/(00#/+$12+2$(3$"(&)#"(01$/((4,35$2/+,-,+.6$!",)$'#)#2'/"$,)$7#,35$/(31&/+#1$7.$
829'#3/#$:#'4#0#.$;2+,(320$827('2+('.$231$,)$*&31#1$7.$+"#$<#%2'+=#3+$(*$#3#'5.6$>2'+,/,%2+,(3$,3-(0-#)$/(=%0#+,35$23$
(30,3#$)&'-#.$+"2+$9,00$+24#$?@AB$=,3&+#)6$C(&$/23$1,)/(3+,3&#$+24,35$+",)$)&'-#.$2+$23.+,=#$7.$0#2-,35$+"#$),+#6$
$
!"#$)&'-#.$+((0$92)$1#),53#1$+($7#$23(3.=(&)$231$/(3*,1#3+,206$!"#$'#)&0+)$(*$+",)$)+&1.$9,00$7#$&)#1$*('$)/,#3+,*,/$
'#)#2'/"$%&'%()#)$(30.6$$
$
D*$.(&$"2-#$23.$E&#)+,(3)$27(&+$+"#$'#)#2'/"$)+&1.F$%0#2)#$/(3+2/+$G#33,*#'$8(5&#$2+$?AB@HIJ@?KH?F$('$L=0(5&#M07065(-6$$
!"#$%$&'()*+&#&)*,$*'-#./0120#20/034#5678#396:30#;0/6<"#
#
&/:3=:>?#6>#490#@1?800@#;7446>#;0/6<#:>A:31402#4914-##
B#567#91C0#801A#490#1;6C0#:>D68E14:6>#
B#567#C6/7>418:/5#1?800#46#F184:3:F140#
B#567#180#14#/0124#!G#50182#6D#1?0"#
+D#567#A6#>64#<:29#46#F184:3:F140#:>#490#80201839#247A5H#F/0120#A03/:>0#F184:3:F14:6>#;5#
3/:3=:>?#6>#490#@A:21?800@#;7446>#68#/01C0#490#<0;F1?0"#
!
.184#!-#&6>20>4#46#.184:3:F140#:>#I672096/A#&66=:>?#J34:C:45#,78C05
!
N5'##$
!"#$%
<,)25'##$
!"#$%
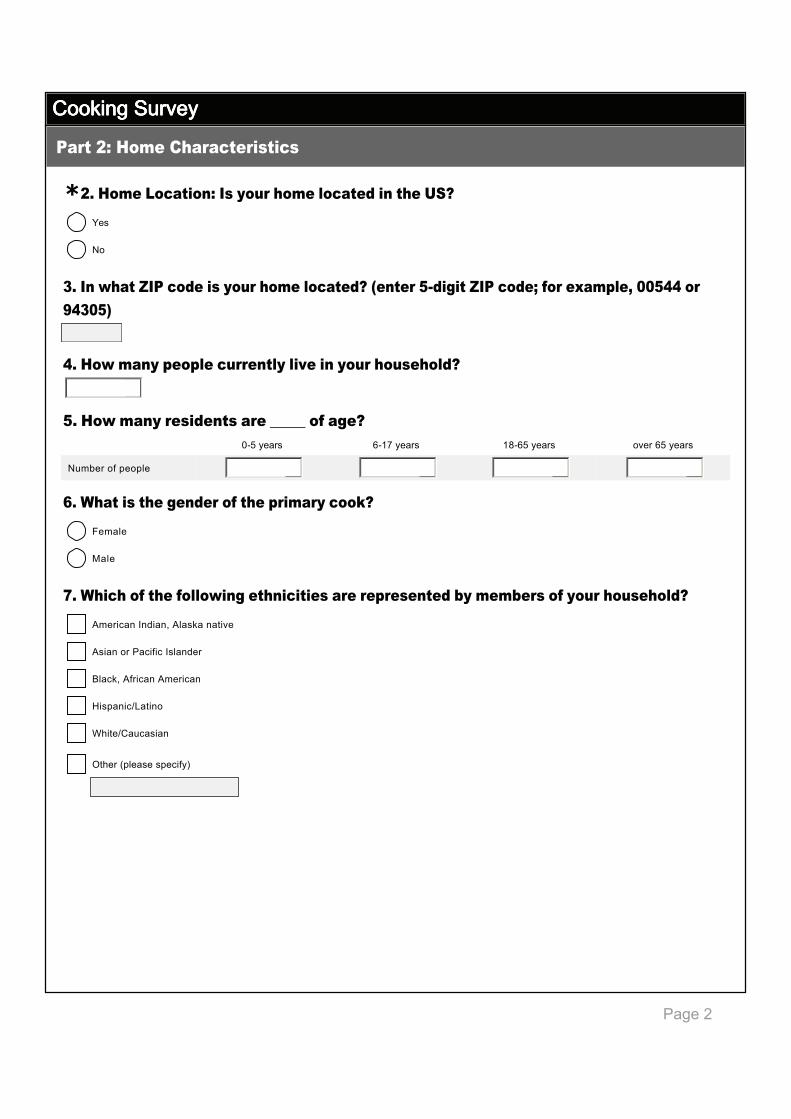
!"#$%1
'(()*+#%,-./$0'(()*+#%,-./$0'(()*+#%,-./$0'(()*+#%,-./$0
K"#I6E0#%6314:6>-#+2#5678#96E0#/63140A#:>#490#L,M
N"#+>#<914#O+.#36A0#:2#5678#96E0#/63140AM#P0>408#QRA:?:4#O+.#36A0S#D68#0T1EF/0H#UUQVV#68#
WVNUQX$
V"#I6<#E1>5#F06F/0#37880>4/5#/:C0#:>#5678#9672096/AM
$
Q"#I6<#E1>5#802:A0>42#180#YYYYY#6D#1?0M
Z"#[914#:2#490#?0>A08#6D#490#F8:E185#366=M
\"#[9:39#6D#490#D6//6<:>?#049>:3:4:02#180#80F8020>40A#;5#E0E;082#6D#5678#9672096/AM
!
.184#K-#I6E0#&91813408:24:32
!
&
B@?$.#2') J@AO$.#2') AI@J?$.#2') (-#'$J?$.#2')
;&=7#'$(*$%#(%0# & & & &
C#)$
!"#$%
;($
!"#$%
P#=20#$
!"#$%
Q20#$
!"#$%
N=#',/23$D31,23F$N02)42$32+,-#$
'()*+
N),23$('$>2/,*,/$D)0231#'$
'()*+
:02/4F$N*',/23$N=#',/23$
'()*+
R,)%23,/S82+,3($
'()*+
T",+#SU2&/2),23$
'()*+
V+"#'$W%0#2)#$)%#/,*.X$
$
'()*+

!"#$%2
'(()*+#%,-./$0'(()*+#%,-./$0'(()*+#%,-./$0'(()*+#%,-./$0
G"#[914#45F0#6D#;7:/A:>?#A6#567#/:C0#:>M
Y,350#$P2=,0.$1#+2/"#1$
!"#$%
!(93"(=#S1&%0#Z$
!"#$%
[@H$&3,+$/(31($('$2%2'+=#3+$
!"#$%
N%2'+=#3+S/(31($9,+"$=('#$+"23$?$&3,+#)$
!"#$%
Q(7,0#$"(=#$
!"#$%
V+"#'$W%0#2)#$)%#/,*.X$
$
!"#$%
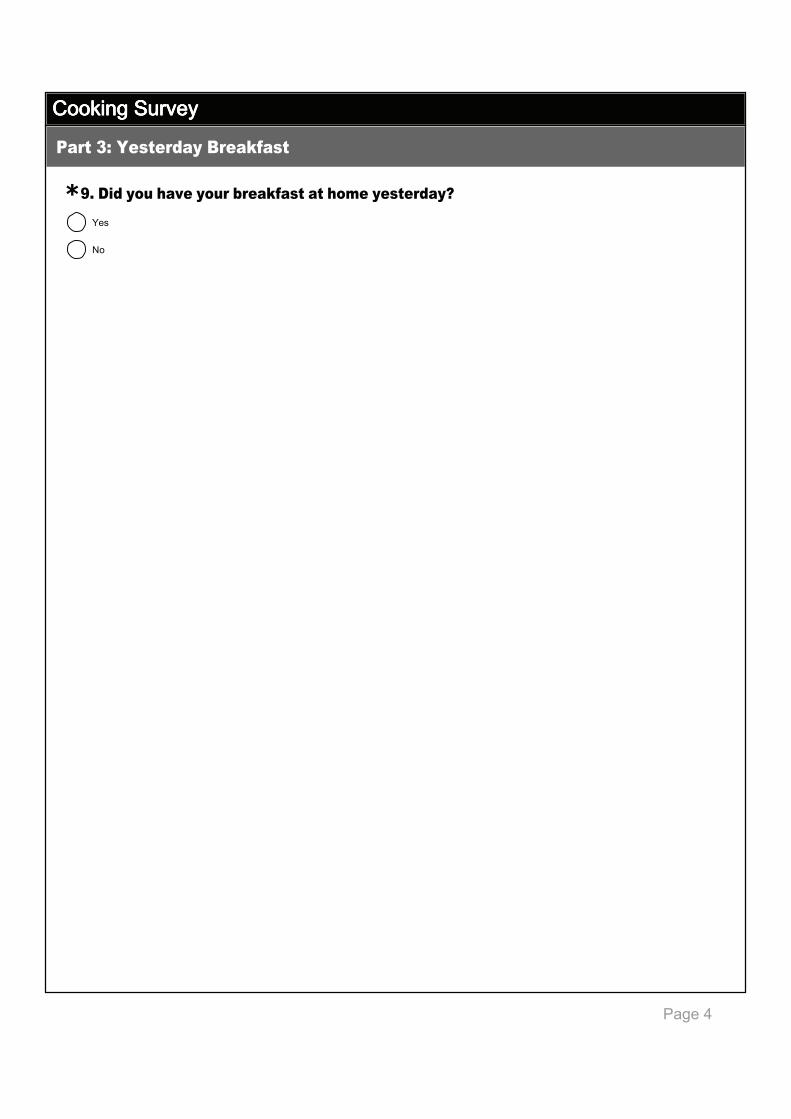
!"#$%3
'(()*+#%,-./$0'(()*+#%,-./$0'(()*+#%,-./$0'(()*+#%,-./$0
W"#]:A#567#91C0#5678#;801=D124#14#96E0#502408A15M
!
.184#N-#^02408A15#_801=D124
!
C#)$
!"#$%
;($
!"#$%

!"#$%4
'(()*+#%,-./$0'(()*+#%,-./$0'(()*+#%,-./$0'(()*+#%,-./$0
!U"#[914#D66A2#A:A#567#F80F180#D68#;801=D124M#
!!"#[9:39#6D#490#D6//6<:>?#A0C:302#A:A#567#720#46#366=#;801=D124#502408A15M
!
.184#N-#^02408A15`2#_801=D124
:(,0#1$#55)$
'()*+
P',#1$#55)$231$72/(3$
'()*+
!(2)+$
'()*+
:25#0$
'()*+
Q&**,3)F$%23/24#)$
'()*+
V+"#'$W%0#2)#$)%#/,*.X$
$
'()*+
V-#3$
'()*+
Y+(-#$
'()*+
!(2)+#'$
'()*+
Q,/'(92-#$
'()*+
\0#/+',/$9(4$
'()*+
\0#/+',/$5',00$
'()*+
\0#/+',/$/'(/4@%(+$
'()*+
>'(%23#$5',00$,31((')$
'()*+
V&+1(('$5',00$('$/((4,35$1#-,/#$
'()*+
;($/((4,35$1#-,/#$
'()*+
V+"#'$W%0#2)#$)%#/,*.X$
$
'()*+

!"#$%5
'(()*+#%,-./$0'(()*+#%,-./$0'(()*+#%,-./$0'(()*+#%,-./$0
!K"#]:A#567-
!
.184#N-#^02408A15`2#_801=D124
:24#$
'()*+
>23$*'.S)2&+]$
'()*+
<##%$*'.$
'()*+
Y+,'$*'.$
'()*+
^',00S$/((4$(3$2$5',00$%23$
'()*+
:(,0$
'()*+
V+"#'$W%0#2)#$)%#/,*.X$
$
'()*+

!"#$%6
'(()*+#%,-./$0'(()*+#%,-./$0'(()*+#%,-./$0'(()*+#%,-./$0
!N"#I6<#E1>5#F06F/0#140#;801=D124#14#96E0M
$
!
.184#N-#^02408A15`2#_801=D124
!&
!"#$%7
'(()*+#%,-./$0'(()*+#%,-./$0'(()*+#%,-./$0'(()*+#%,-./$0
!V"#]:A#567#91C0#5678#/7>39#14#96E0#502408A15M
!
.184#V-#^02408A15`2#%7>39
!
C#)$
!"#$%
;($
!"#$%

!"#$%8
'(()*+#%,-./$0'(()*+#%,-./$0'(()*+#%,-./$0'(()*+#%,-./$0
!Q"#[914#D66A2#A:A#567#F80F180#D68#/7>39M#
!Z"#[9:39#6D#490#D6//6<:>?#A0C:302#A:A#567#720#46#366=#/7>39#502408A15M
!
.184#V-#^02408A15`2#%7>39
_#1$=#2+$
'()*+
P,)"F$)"#00*,)"$('$(+"#'$)#2$*((1)$
'()*+
U",/4#3$('$+&'4#.$
'()*+
>(+2+(#)$
'()*+
>2)+2$
'()*+
`#5#+270#)$
'()*+
V+"#'$W%0#2)#$)%#/,*.X$
$
'()*+
U((4$+(%$7&'3#')$
'()*+
Y+(-#$
'()*+
!(2)+#'$
'()*+
Q,/'(92-#$
'()*+
\0#/+',/$9(4$
'()*+
\0#/+',/$5',00$
'()*+
\0#/+',/$/'(/4@%(+$
'()*+
>'(%23#$5',00$,31((')$
'()*+
V&+1(('$5',00$('$/((4,35$1#-,/#$
'()*+
;($/((4,35$1#-,/#$
'()*+
V+"#'$W%0#2)#$)%#/,*.X$
$
'()*+

!"#$%&9
'(()*+#%,-./$0'(()*+#%,-./$0'(()*+#%,-./$0'(()*+#%,-./$0
!\"#]:A#567-
!
.184#V-#^02408A15`2#%7>39
:24#$
'()*+
>23$*'.S)2&+]$
'()*+
<##%$*'.$
'()*+
Y+,'$*'.$
'()*+
^',00S$/((4$(3$2$5',00$%23$
'()*+
:(,0$
'()*+
V+"#'$W%0#2)#$)%#/,*.X$
$
'()*+

!"#$%&&
'(()*+#%,-./$0'(()*+#%,-./$0'(()*+#%,-./$0'(()*+#%,-./$0
!G"#I6<#E1>5#F06F/0#140#/7>39#14#96E0M
$
!
.184#V-#^02408A15`2#%7>39
!&

!"#$%&1
'(()*+#%,-./$0'(()*+#%,-./$0'(()*+#%,-./$0'(()*+#%,-./$0
!W"#]:A#567#91C0#5678#A:>>08#14#96E0#502408A15M
!
.184#Q-#^02408A15`2#]:>>08
!
C#)$
!"#$%
;($
!"#$%

!"#$%&2
'(()*+#%,-./$0'(()*+#%,-./$0'(()*+#%,-./$0'(()*+#%,-./$0
KU"#[914#D66A2#A:A#567#F80F180#D68#A:>>08M#
K!"#[9:39#6D#490#D6//6<:>?#A0C:302#A:A#567#720#46#366=#A:>>08#502408A15M
!
.184#Q-#^02408A15`2#]:>>08
_#1$=#2+$
'()*+
P,)"F$)"#00*,)"$('$(+"#'$)#2$*((1)$
'()*+
U",/4#3$('$+&'4#.$
'()*+
>(+2+(#)$
'()*+
>2)+2$
'()*+
`#5#+270#)$
'()*+
V+"#'$W%0#2)#$)%#/,*.X$
$
'()*+
U((4$+(%$7&'3#')$
'()*+
V-#3$
'()*+
!(2)+#'$
'()*+
Q,/'(92-#$
'()*+
\0#/+',/$9(4$
'()*+
\0#/+',/$5',00$
'()*+
\0#/+',/$/'(/4@%(+$
'()*+
>'(%23#$5',00$,31((')$
'()*+
V&+1(('$5',00$('$/((4,35$1#-,/#$
'()*+
;($/((4,35$1#-,/#$
'()*+
V+"#'$W%0#2)#$)%#/,*.X$
$
'()*+

!"#$%&3
'(()*+#%,-./$0'(()*+#%,-./$0'(()*+#%,-./$0'(()*+#%,-./$0
KK"#]:A#567-
!
.184#Q-#^02408A15`2#]:>>08
:24#$
'()*+
>23$*'.S)2&+]$
'()*+
<##%$*'.$
'()*+
Y+,'$*'.$
'()*+
^',00S$/((4$(3$2$5',00$%23$
'()*+
:(,0$
'()*+
V+"#'$W%0#2)#$)%#/,*.X$
$
'()*+

!"#$%&4
'(()*+#%,-./$0'(()*+#%,-./$0'(()*+#%,-./$0'(()*+#%,-./$0
KN"#I6<#E1>5#F06F/0#140#A:>>08#14#96E0M
$
!
.184#Q-#^02408A15`2#]:>>08
!&

!"#$%&5
'(()*+#%,-./$0'(()*+#%,-./$0'(()*+#%,-./$0'(()*+#%,-./$0
KV"#[914#=:>A#6D#6:/#A6#567#F80D08#46#366=#<:49M
!
.184#Z-#a0>081/#&66=:>?#b7024:6>2
;#-#' V//2)),(3200. P'#E+0.
V0,-#$(,0 !"#$% !"#$% !"#$%
Y(.7#23$(,0 !"#$% !"#$% !"#$%
>#23&+$(,0 !"#$% !"#$% !"#$%
`#5#+270#$(,0 !"#$% !"#$% !"#$%
U23(02$(,0 !"#$% !"#$% !"#$%
V+"#'$W%0#2)#$)%#/,*.X$