Embed Size (px)
Citation preview

Autumn/WIntER 2014

2 © Carter Jonas 2014

carterjonas.co.uk 3
There’s no doubt that the economy is improving but what does this mean for the national residential property market? Indeed, the next 12 months are going to be interesting with potential interest rate hikes and the General Election fast looming.
So in this issue, we consider the London market: Super Prime, Prime Central London and Outer Prime. Three markets where we are reporting differing house price and rental growth rates.
Outside London, we use our Farmhouse and Country Cottage Indices to show key trends and issues which are evident within the market and prove interesting reading if you own, or are thinking of buying, such a property in the next year.
Anyone who has missed the phenomenon of Airbnb might be interested to read our special feature about Short Let Regulation and how London is locked in a battle with Paris to become the world’s most popular overseas tourist destination.
We also look at the draw of Cathedral cities and market towns. The demand for living in these desirable locations has reached such heights, the transaction figures have now eclipsed even the previous peak market averages.
I hope you enjoy reading our research and features. Should you require any help with your property asset, please do get in touch, and we would be delighted to help.
HEllo And WElcomE to tHE sEcond EdItIon of REsIdEntIAl VIEW: youR IndIspEnsIblE guIdE to tHE uK’s REsIdEntIAl pRopERty mARKEt foR Autumn/WIntER 2014.
gregory besterman Partner, Head of Residential 020 7518 3216 | 07774 911981 [email protected]
4 © Carter Jonas 2014
EconomIc oVERVIEW
The UK economic outlook remains positive with the unemployment rate continuing to fall to 6.4%, GDP 3.2% higher in Q2 2014 than the same quarter in 2013 and CPI well below the Bank of England’s 2% target at 1.6%. Although recent weak inflation has relieved the pressure on the Bank of England to raise interest rates, the run of 36 unanimous ‘No’ votes by the Monetary Policy Committee (MPC) ended at August’s meeting. Two of the nine members voted to raise the rate by 0.75%. Although this change in the status quo does not indicate an imminent rise, it does signal a shift in feeling within the group.
nAtIonAl REsIdEntIAl mARKEt summARy
The national housing market remains in a transitional period with fluctuating data published by the Council of Mortgage Lenders (CML) and Land Registry regarding both lending volumes and national house prices. The Land Registry July release reported national house prices rising an average 7.2% in 12 months to July 2014, whilst also noting that a number of areas are still experiencing an overall trend of falling prices. Above average price rises in London continue to underpin the national increases, although our analysis highlights a number of desirable Cathedral cities and market towns outside the South East which are now either reaching, or have surpassed their 2007/2008 peak. National transaction figures for H1 2014 have improved from 2013
levels although remain 20-25% below the peak market (1998-2007) averages. Despite lower transactional levels, receipts from Stamp Duty Land Tax stand close to the peak recorded in 2007/2008, due primarily to the significant rise in values witnessed in London over the last four years.
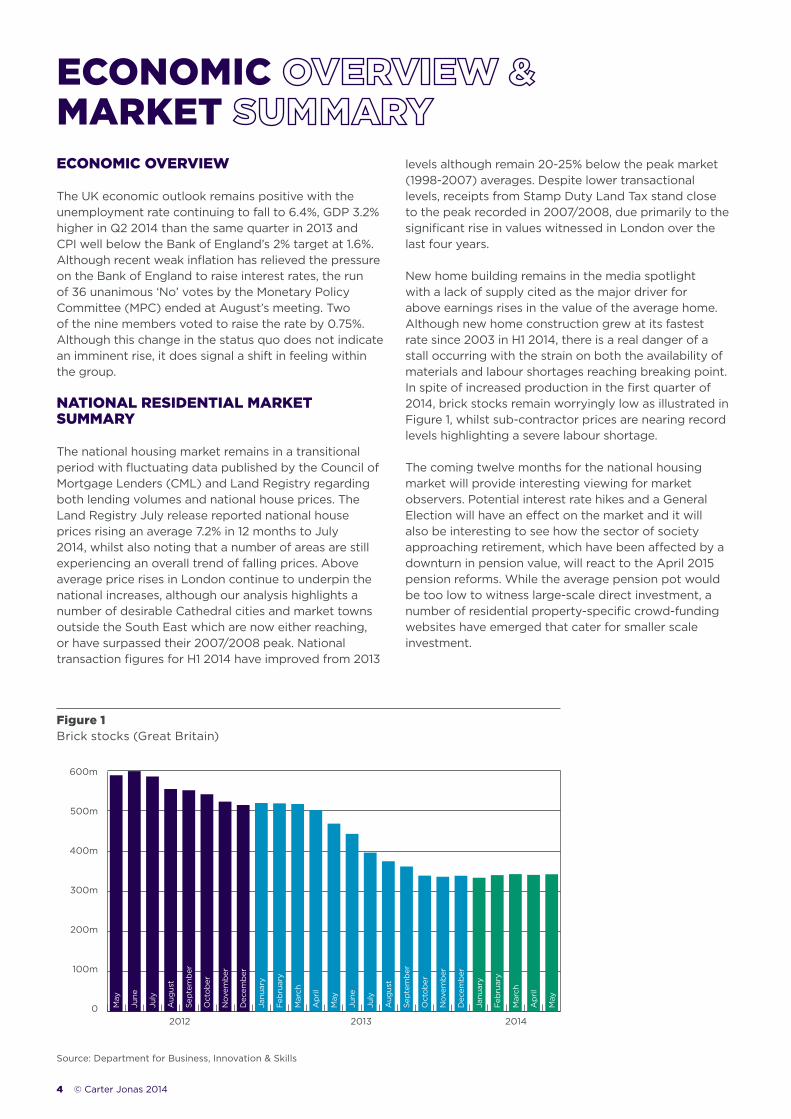
New home building remains in the media spotlight with a lack of supply cited as the major driver for above earnings rises in the value of the average home. Although new home construction grew at its fastest rate since 2003 in H1 2014, there is a real danger of a stall occurring with the strain on both the availability of materials and labour shortages reaching breaking point. In spite of increased production in the first quarter of 2014, brick stocks remain worryingly low as illustrated in Figure 1, whilst sub-contractor prices are nearing record levels highlighting a severe labour shortage.
The coming twelve months for the national housing market will provide interesting viewing for market observers. Potential interest rate hikes and a General Election will have an effect on the market and it will also be interesting to see how the sector of society approaching retirement, which have been affected by a downturn in pension value, will react to the April 2015 pension reforms. While the average pension pot would be too low to witness large-scale direct investment, a number of residential property-specific crowd-funding websites have emerged that cater for smaller scale investment.
figure 1 Brick stocks (Great Britain)
Source: Department for Business, Innovation & Skills
600m
500m
400m
300m
200m
100m
0 May
May
May
Janu
ary
Janu
ary
Feb
ruar
y
Feb
ruar
y
Mar
ch
Mar
ch
Ap
ril
Ap
ril
June
June
July
July
Aug
ust
Aug
ust
Sep
tem
ber
Sep
tem
ber
Oct
ob
er
Oct
ob
er
Nov
emb
er
Nov
emb
er
Dec
emb
er
Dec
emb
er
2012 2013 2014
EconomIcmARKEt
carterjonas.co.uk 5
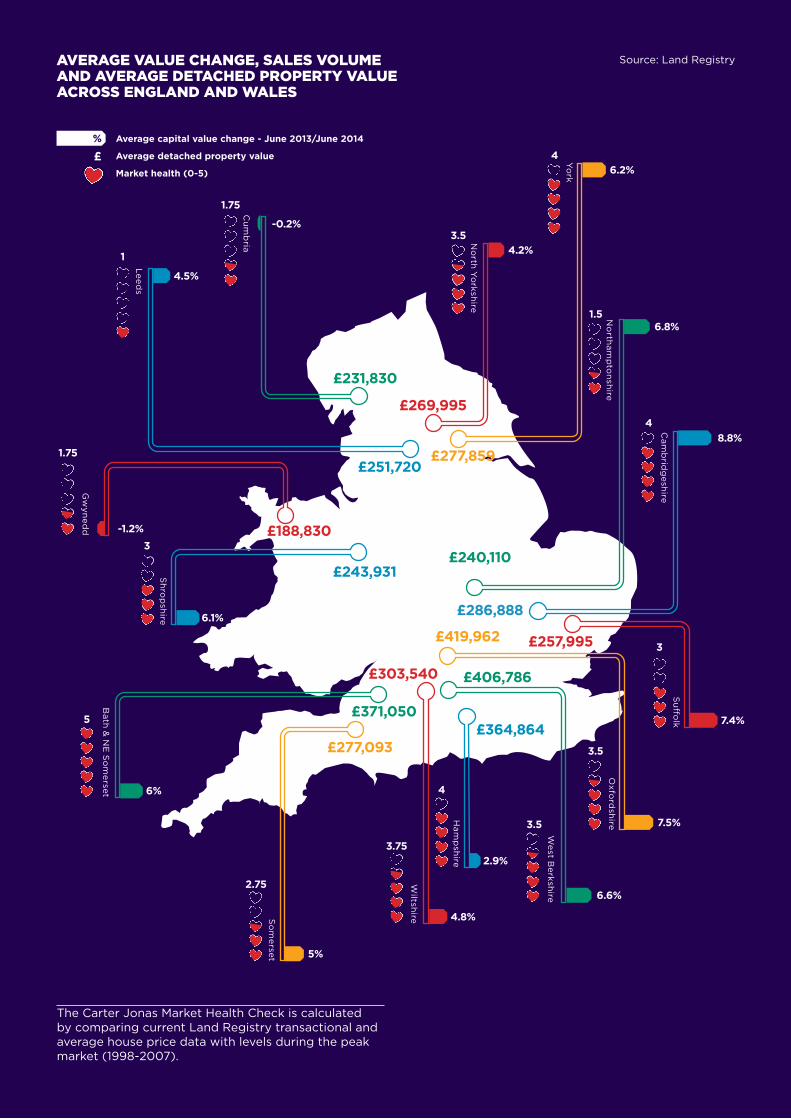
Average capital value change - June 2013/June 2014
Average detached property value
Market health (0-5)
AVERAgE VAluE cHAngE, sAlEs VolumE And AVERAgE dEtAcHEd pRopERty VAluE AcRoss EnglAnd And WAlEs
%
6.2%4
4
5
3
4
3
4.2%
6.8%
-0.2%
-1.2%
8.8%
2.9%
6.1%
4.5%
7.4%
4.8%
7.5%
5%
6.6%
6%
£
Source: Land Registry
Cu
mb
ria No
rth Yo
rkshire
Le
ed
s
Yo
rk
No
rtham
pto
nsh
ire
Sh
rop
shire
Cam
brid
gesh
ireS
uff
olk
Oxfo
rdsh
ireHam
psh
ire
West B
erksh
ire
Wiltsh
ireSo
me
rset
Bath &
NE
So
me
rset
Gw
yne
dd
£231,830
£188,830
£243,931£240,110
£286,888
£257,995£419,962
£406,786
£364,864£277,093
£371,050
£303,540
£269,995
£251,720£277,859
1.5
3.5
3.5
3.75
2.75
1.75
1
1.75
3.5
The Carter Jonas Market Health Check is calculated by comparing current Land Registry transactional and average house price data with levels during the peak market (1998-2007).

6 © Carter Jonas 2014
londonsAlEs
Despite a significant cooling in some Prime Central London (PCL) markets throughout 2013 and the early part of 2014, Q2 2014 witnessed a return to strong capital value appreciation for most PCL areas as shown in Figure 2. Relatively strong demand from domestic buyers boosted by a spring market led to this surprise upturn. Knightsbridge reinforced this trend, where a flat previous 18 months have been left behind with a 5.7% capital value growth witnessed in H1 2014. It is yet to be seen if this trend will continue, as falling new buyer enquiries have been recently cited in the press. The one exception to the growth witnessed in H1 2014 is the Super Prime market where quarterly capital values have been falling since spring 2013 with no sign of a trend reversal. Our data showed average falls of 11% in this market from June 2013 to June 2014.
Taking a longer term perspective, it is interesting to note that Wandsworth and Fulham have now matched and exceeded the more established PCL markets of Holland Park and prime W2. Due to a prolonged period of stagnation, capital value growth levels in Knightsbridge have been matched by the Mayfair and Marylebone markets, with all three markets recording a ten year capital value growth of between 160-180%.
Due to falling buyer enquiries across most markets, we expect capital value growth rates in PCL to slow significantly during H2 2014. We also expect Outer Prime growth rates to cool during this period, albeit not to the same degree as core PCL.
lEttIngs
Stock levels of rental product remained high within most Prime and Outer Prime London markets, with demand relatively static due to flat levels of recruitment in the City. As a consequence, poorer quality stock has tended to suffer, experiencing longer voids and sharper price reductions. This effect was highlighted in the recently published ‘Tenant Insight’ survey of our nationwide tenant base where 50% of respondents indicated they would be prepared to increase their budgets for a property with a modern kitchen and bathroom.
Rental values in the 12 months to June 2014 remained relatively flat with overall PCL rents dropping just over 1%. In the outer core market, a fractional fall of -0.1% was recorded in Wandsworth and an increase of 2.9% was recorded in Fulham.
A number of dominant trends have emerged across the London lettings market over the longer term. The most obvious is that, although volatile, the Knightsbridge and Mayfair markets have produced the strongest rental growth since 2006, as illustrated in Figure 3. In addition, Marylebone has proved the most stable market with its consistency and continuing out-performance of PCL rents as a whole. This clearly highlights the importance and positive influence of the Howard de Walden and Portman Estates. Strategic retail selection and active management of the area by the Estates have ensured that residential tenant demand has remained strong, resulting in the rental performance of Marylebone outstripping that of PCL as a whole for seven out of the last eight years.
For sale in Outer Prime Central London Gowan Avenue, Fulham SW6 Guide price £2,150,000
To let in Prime Central London Marylebone, Devonshire Place W1 £1,950 per week/£8,450 per month

carterjonas.co.uk 7
figure 2 Carter Jonas Capital Value Index
Mayfair
Chelsea
Holland Park
Marylebone
Hyde Park & Bayswater
Knightsbridge
Fulham
Wandsworth
300
250
200
150
100
50
Jan 2005 = 100 Source: Carter Jonas
Jan 05 Mar 14
Knightsbridge
Mayfair
Chelsea
Marylebone
Holland Park
Hyde Park & Bayswater
Fulham
Wandsworth
PCL as a whole
180
200
220
160
140
120
100
80
Source: Carter JonasJan 2006 = 100
Jun 06 Apr 14
figure 3 Carter Jonas Rent Value Index
Capital value performance H1 2013 - H1 2014
Gross rental yield
cApItAl VAluE pERfoRmAncE And REntAl yIEld In pRImE And outER pRImE london
%%
22.8%
10.4%
13.8%
11.1%
11.9%
8.9%
3.2%
3.6%
2.2%
19.6%
8.4%
4%
2.9%
2.8%
2.7%
4.4%
Hyde Park & Bayswater
Marylebone
Mayfair
Knightsbridge
Chelsea
Wandsworth
Fulham
Holland Park & Notting Hill
REnt And cApItAl VAluE IndIcEs Our indices track the performance of both capital value movements and rental prices within our key markets.
They are created using data taken from achieved sales and rental values and exclude anomalies such as the sales of properties with short leases and ‘one-off’ sales such as One Hyde Park.
8 © Carter Jonas 2014
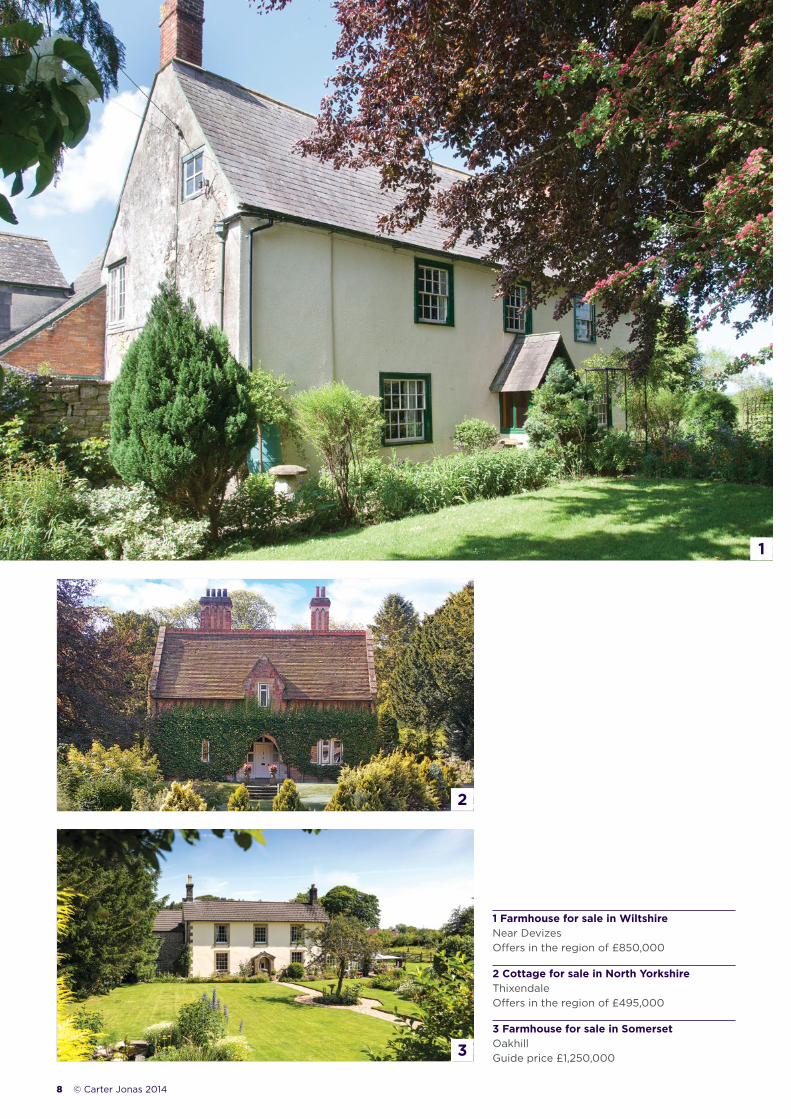
1 Farmhouse for sale in Wiltshire Near Devizes Offers in the region of £850,000
2 Cottage for sale in North Yorkshire Thixendale Offers in the region of £495,000
3 Farmhouse for sale in Somerset Oakhill Guide price £1,250,000
1
2
3
carterjonas.co.uk 9
countRy
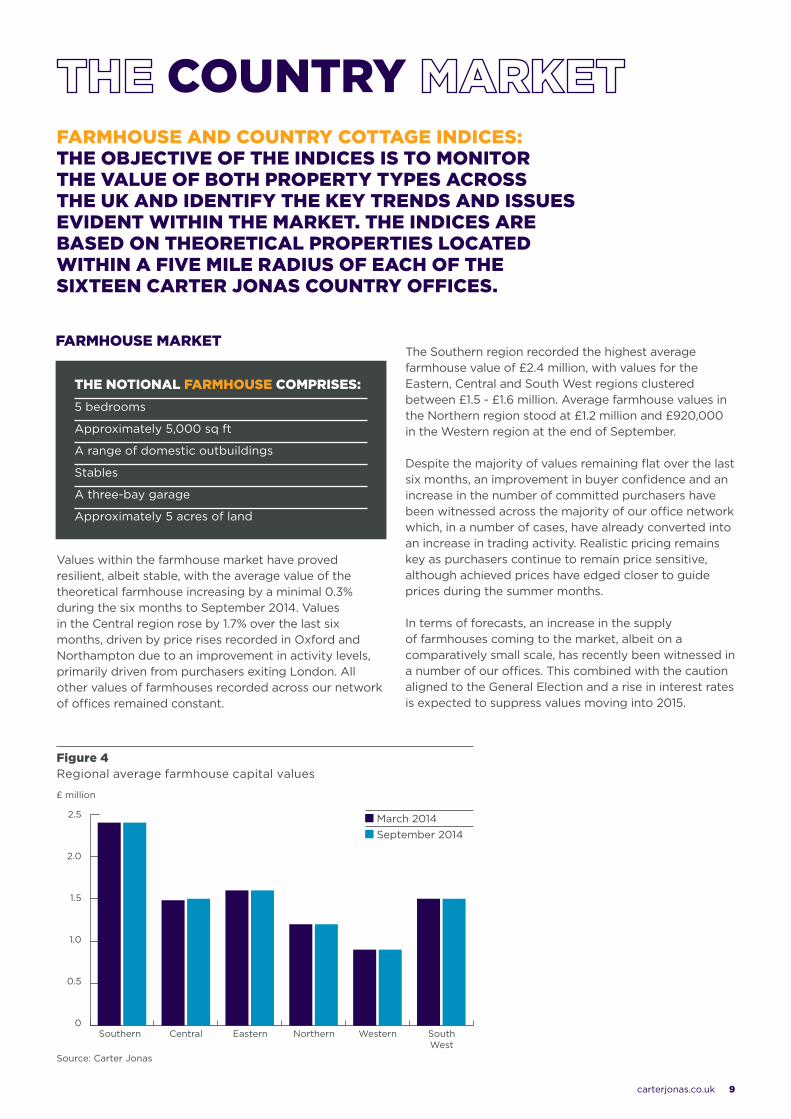
Values within the farmhouse market have proved resilient, albeit stable, with the average value of the theoretical farmhouse increasing by a minimal 0.3% during the six months to September 2014. Values in the Central region rose by 1.7% over the last six months, driven by price rises recorded in Oxford and Northampton due to an improvement in activity levels, primarily driven from purchasers exiting London. All other values of farmhouses recorded across our network of offices remained constant.
fARmHousE And countRy cottAgE IndIcEs: tHE objEctIVE of tHE IndIcEs Is to monItoR tHE VAluE of botH pRopERty typEs AcRoss tHE uK And IdEntIfy tHE KEy tREnds And IssuEs EVIdEnt WItHIn tHE mARKEt. tHE IndIcEs ARE bAsEd on tHEoREtIcAl pRopERtIEs locAtEd WItHIn A fIVE mIlE RAdIus of EAcH of tHE sIxtEEn cARtER jonAs countRy offIcEs.
figure 4 Regional average farmhouse capital values
The Southern region recorded the highest average farmhouse value of £2.4 million, with values for the Eastern, Central and South West regions clustered between £1.5 - £1.6 million. Average farmhouse values in the Northern region stood at £1.2 million and £920,000 in the Western region at the end of September.
Despite the majority of values remaining flat over the last six months, an improvement in buyer confidence and an increase in the number of committed purchasers have been witnessed across the majority of our office network which, in a number of cases, have already converted into an increase in trading activity. Realistic pricing remains key as purchasers continue to remain price sensitive, although achieved prices have edged closer to guide prices during the summer months.
In terms of forecasts, an increase in the supply of farmhouses coming to the market, albeit on a comparatively small scale, has recently been witnessed in a number of our offices. This combined with the caution aligned to the General Election and a rise in interest rates is expected to suppress values moving into 2015.
fARmHousE mARKEt
tHE notIonAl fARmHousE compRIsEs: 5 bedrooms
Approximately 5,000 sq ft
A range of domestic outbuildings
Stables
A three-bay garage
Approximately 5 acres of land
Source: Carter Jonas
0
0.5
1.0
1.5
2.0
2.5
£ million
Southern Central Northern Western South West
Eastern
March 2014 September 2014

10 © Carter Jonas 2014
figure 5 Regional average country cottage capital values
The average value of a country cottage rose by 0.4% in the six months to September 2014, with increases evident in Oxford, Cambridge and Northampton. Values in all other markets across the Carter Jonas network held firm across the same time frame.
The country cottage market remained marginally ahead of the farmhouse market in terms of its position in the market cycle. This was largely due to a lower price bracket and therefore improved relative affordability.
A notable increase in the demand for cottages with a value of £500,000 or less has been evident over the last six months, illustrating the significance of the Stamp Duty Land Tax threshold, which effectively acts as a ceiling in value increases.
Only five of our network of sixteen offices recorded a value over £500,000 for the notional cottage, comprising Oxford (£745,000), Basingstoke (£695,000), Kendal (£650,000) and Cambridge and Winchester (£615,000). Both Oxford and Cambridge witnessed value increases of 2.8% and 1.7% respectively over the last six months, reinforcing the strengthening in demand within prime markets.
Values are forecast to continue to improve in the higher value markets moving into 2015, although are anticipated to stick to the £500,000 ceiling across the other markets. However, prime product will increasingly command premium values, as demand for the country cottage will continue to rise moving into 2015.
tHE notIonAl cottAgE compRIsEs:3 bedrooms
Detached
Approximately 1,750 sq ft
Private parking
Small garden
countRy cottAgE sAlEs mARKEt
Source: Carter Jonas
0
300
400
200
100
500
600
700
Southern Central Northern WesternSouth Westerm
Eastern
£ thousand
Country cottage for sale Marlborough, Wiltshire Guide price £350,000
March 2014 September 2014

carterjonas.co.uk 11
REgIonAl lEttIngs mARKEt
The regional lettings market continued to remain strong, as increasing numbers of young people having to wait longer to become homeowners ensured high levels of demand. Southern England continued to witness the highest rental growth, with average annual increases of just over 2.5% for the previous three years. Although these figures fall some way short of the anecdotal rises discussed in the media, they do still represent a growing affordability issue as real wage growth lags well behind. When figures for Q3 2014 are released later in the year, we expect average all-residential property rents to have continued to rise in most areas, breaching the £700 per calendar month mark in both the Eastern and South Western regions.
figure 6 Average monthly rents (all residential property types)
tHE countRy cottAgE mARKEt REmAInEd mARgInAlly AHEAd of tHE fARmHousE mARKEt In tERms of Its posItIon In tHE mARKEt cyclE
Source: VOA
0
300
400
200
100
500
600
700
800
900
1,000
North East
North West
East Midlands
West Midlands
East South West
South East
Yorkshire & The
Humber
Q3 2011 Q1 2012 Q3 2012 Q1 2013 Q3 2013 Q1 2014
Hampshire, Near Nether Wallop £2,850 per month
Berkshire, Newbury £1,550 per month

12 © Carter Jonas 2014
focus
The almost inevitable relaxation of regulation regarding the ‘short’ (sub 90 day) letting of property in London has the potential to change the landscape of housing in certain areas of the Capital. Currently, any London landlord wishing to rent out their property for a period less than 90 days is required to submit a planning application, with potential fines of up to £20,000 for failure to do so. In reality, the enforcement of this rule varies between London boroughs. On the one hand the boroughs of Westminster, Kensington and Chelsea, Islington, Camden, Tower Hamlets and Southwark are vehemently opposed to the proposed changes, whilst the other more outlying boroughs appear to show little appetite for enforcement of current legislation.
Below we look at the advantages and disadvantages of this proposed policy change and Figure 7 compares the short-let policies of some key global cities to London.
polIcy
London is currently locked in a tussle with Paris to become the world’s most popular overseas tourist destination with the latest data from the ONS showing that London has recently edged into the lead. The key area in the race of leading world tourist destinations is the increased provision of short-stay accommodation. In Figure 7 we take a look at how the leading players approach short-letting as a way of meeting this increasing demand.
As we can clearly see from Figure 7, the political will of London differs markedly from that of other major world tourist cities. Should plans to de-regulate the short-let market progress, London’s position as the leading foreign tourist destination should be secure for the foreseeable future.
sHoRt lEt REgulAtIon
There is a well-documented shortage of hotel space in London. With each London hotel room generating over £100,000 per annum in foreign tourist spend, the benefits of increasing short-stay capacity in the Capital could have a huge impact on local economies
An opportunity to gather additional tax from short lettings. Alongside a crackdown on unlicensed short-let landlords, the Parisian authorities are also looking to introduce a tax on the licensed market
Popularity will be concentrated in micro markets surrounding areas such as retail/leisure hubs and private hospitals. The resulting transient population may lead to a hotel-like atmosphere in some buildings, along with increased domestic waste and unsociable behaviour that may impact on the quality of life of nearby established residents
A negative impact on the stock of housing available for long-term lettings. Landlords focusing on long-term letting may choose to move to the short-let market in search of higher yields. This would work against the Government’s drive to increase stock levels and choice in the London private rented sector (PRS)
Current legislation protecting tenants may become impossible to police and routinely ignored in less affluent areas of London. What was intended as a way of delivering more tourist beds may result in some of the more vulnerable citizens of London having little-to-no security of tenure

carterjonas.co.uk 13
oVERVIEW of AIRbnb Market leading online only short/holiday let company
Not long after the company’s sixth birthday it was valued at $10bn
Fees are between 6-12% and paid by the guest, but hosts (the landlord) are also charged a service fee of 3%
figure 7 Comparison of short-let policies in global cities
City Number of foreign tourists (annual)
Number of hotel rooms (approx)
Current regulation Policy/approach to short letting
London 16.8m 100,000 Planning permission required for sub 90 day letting
Eric Pickles and ex-housing minister Kris Hopkins both referred to the relaxation of legislation as “allowing Londoners to earn some extra cash”, whilst Airbnb founder Nathan Blecharczyk was invited to Downing Street to discuss short-let reforms
Paris 15.5m 80,000 Lettings of less than a year are prohibited unless the property is classified as commercial
Have employed a 20-strong team of enforcement officers to police short-let violations. In the first six months of 2014 they handed out €250,000 worth of fines with potential further fines of €325,000 waiting for landlords currently under investigation
New York 11.4m 100,000 Permission required for lettings under 30 days
Conducted a probe into Airbnb, ending with the company agreeing to provide host (landlord) data to the state
Barcelona 5.8m Unknown Licence from Town Hall required – varies from region to region
Fined Airbnb in July for breaking short-let regulations. City Hall have also announced that they are in the process of creating a door-to-door short-let inspection team
14 © Carter Jonas 2014
In this section we look specifically at the strength of the markets in desirable city/towns outside of the major urban hubs and the possible reasons for the increasing trend towards town and city living.
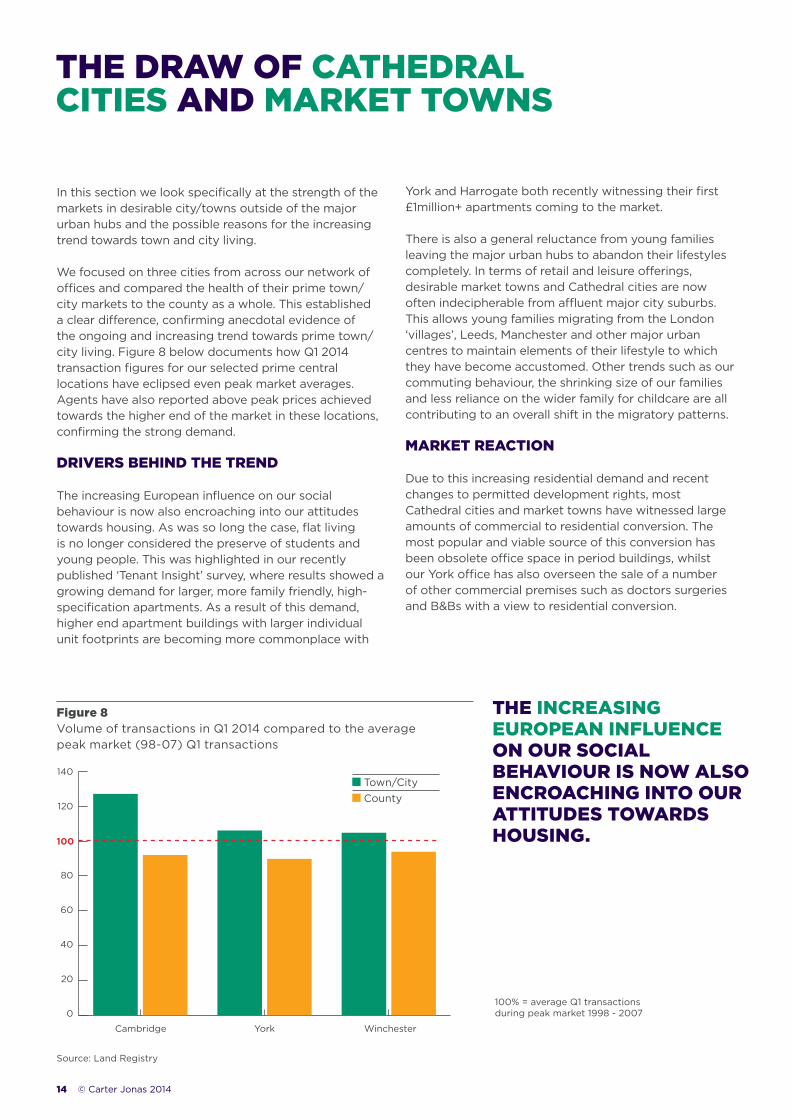
We focused on three cities from across our network of offices and compared the health of their prime town/city markets to the county as a whole. This established a clear difference, confirming anecdotal evidence of the ongoing and increasing trend towards prime town/city living. Figure 8 below documents how Q1 2014 transaction figures for our selected prime central locations have eclipsed even peak market averages. Agents have also reported above peak prices achieved towards the higher end of the market in these locations, confirming the strong demand.
dRIVERs bEHInd tHE tREnd
The increasing European influence on our social behaviour is now also encroaching into our attitudes towards housing. As was so long the case, flat living is no longer considered the preserve of students and young people. This was highlighted in our recently published ‘Tenant Insight’ survey, where results showed a growing demand for larger, more family friendly, high-specification apartments. As a result of this demand, higher end apartment buildings with larger individual unit footprints are becoming more commonplace with
tHE dRAW of cAtHEdRAl cItIEs And mARKEt toWns
York and Harrogate both recently witnessing their first £1million+ apartments coming to the market.
There is also a general reluctance from young families leaving the major urban hubs to abandon their lifestyles completely. In terms of retail and leisure offerings, desirable market towns and Cathedral cities are now often indecipherable from affluent major city suburbs. This allows young families migrating from the London ‘villages’, Leeds, Manchester and other major urban centres to maintain elements of their lifestyle to which they have become accustomed. Other trends such as our commuting behaviour, the shrinking size of our families and less reliance on the wider family for childcare are all contributing to an overall shift in the migratory patterns.
mARKEt REActIon
Due to this increasing residential demand and recent changes to permitted development rights, most Cathedral cities and market towns have witnessed large amounts of commercial to residential conversion. The most popular and viable source of this conversion has been obsolete office space in period buildings, whilst our York office has also overseen the sale of a number of other commercial premises such as doctors surgeries and B&Bs with a view to residential conversion.
figure 8 Volume of transactions in Q1 2014 compared to the average peak market (98-07) Q1 transactions
Town/City County
Source: Land Registry
0
20
40
60
80
100
120
140
Cambridge York Winchester
tHE IncREAsIng EuRopEAn InfluEncE on ouR socIAl bEHAVIouR Is noW Also EncRoAcHIng Into ouR AttItudEs toWARds HousIng.
100% = average Q1 transactions during peak market 1998 - 2007

carterjonas.co.uk 15

© Carter Jonas 2014. The information given in this publication is believed to be correct at the time of going to press. We do not however accept any liability for any decisions taken following this newsletter. We recommend that professional advice is taken. Carter Jonas LLP uses the information it holds about you for marketing purposes and to administer, support, improve and develop our business. We may send them by post, telephone or fax, email or SMS. If you would rather NOT receive further information by any particular format, or at all, or if your details need updating, please contact [email protected]. We will not disclose personal information to any third parties without your permission to do so, unless we believe that we should do so to comply with the law.
to find out how carter jonas can help you with the sale or letting of your property, or to book a complimentary market appraisal, please get in touch.
020 7518 3200one chapel place, london W1g 0bgcarterjonas.co.uk
dAy In dAy out, ouR ExpERts usE tHEIR mARKEt KnoWlEdgE, ExpERtIsE And complEtE loVE of pRopERty to dRIVE tHEm to gIVE tHEIR clIEnts tHE VERy bEst possIblE AdVIcE.From selling your house or letting it, to conducting valuations or simply giving you professional advice based around your circumstances, we can help you.
29 offIcEs AcRoss tHE countRy, IncludIng nInE In cEntRAl london
Bangor
Basingstoke
Bath
Boroughbridge
Cambridge
Edinburgh
Harrogate
Kendal
Leeds
Marlborough
Newbury
Newbury - Sutton Griffin
Northampton
Oxford
Peterborough
Shrewsbury
Suffolk
Wells
Winchester
York
National HQ One Chapel Place
Fulham
Holland Park & Notting Hill
Hyde Park & Bayswater
Knightsbridge & Chelsea
Marylebone & Regent’s Park
Mayfair & St James’s
Parsons Green
Wandsworth
Londonoffices
lisa simon, Partner, Head of Lettings 020 7518 3200 | 07976 761721 [email protected]
catherine penman, Head of Research 01604 608203 | 07799 347200 [email protected]
gregory besterman, Partner, Head of Residential 020 7518 3200 | 07774 911981 [email protected]
lee layton, Research Analyst 01604 608212 | 07768 308737 [email protected]