Embed Size (px)
Citation preview
“Residentiekaarten”: the contents of the 19th century topographic maps of Java
Ferjan Ormeling Utrecht University, [email protected]
Introduction
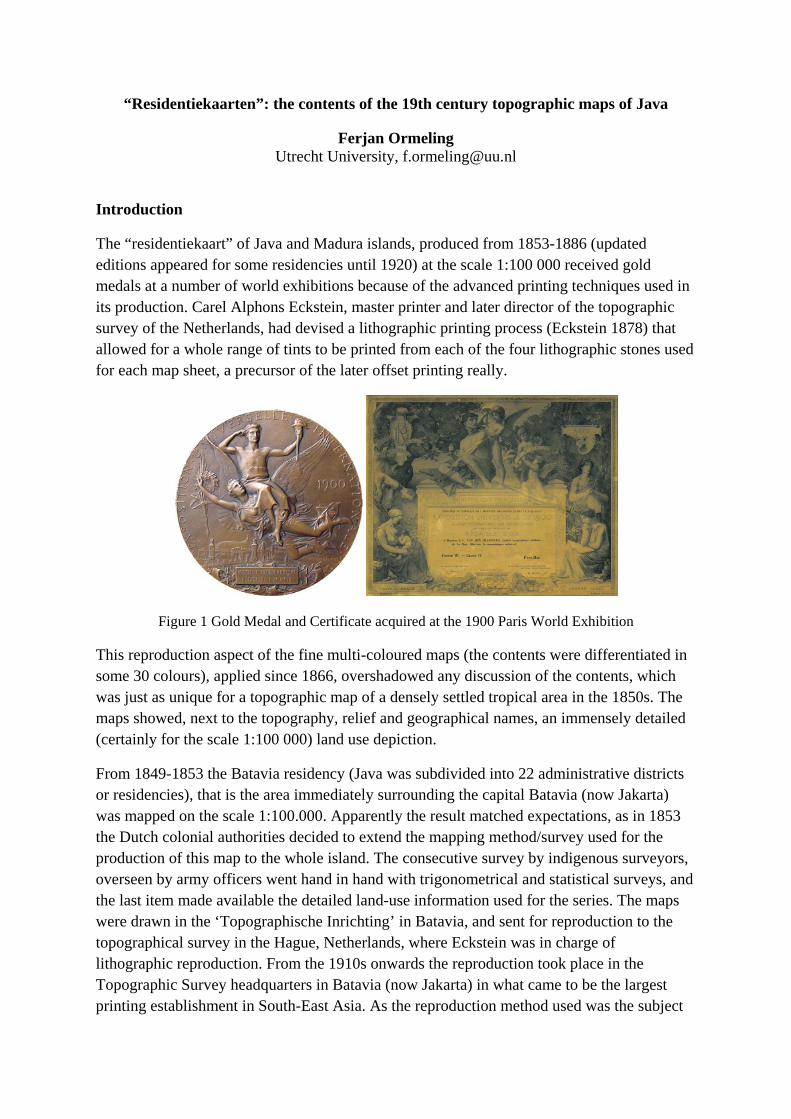
The “residentiekaart” of Java and Madura islands, produced from 1853-1886 (updated editions appeared for some residencies until 1920) at the scale 1:100 000 received gold medals at a number of world exhibitions because of the advanced printing techniques used in its production. Carel Alphons Eckstein, master printer and later director of the topographic survey of the Netherlands, had devised a lithographic printing process (Eckstein 1878) that allowed for a whole range of tints to be printed from each of the four lithographic stones used for each map sheet, a precursor of the later offset printing really.
Figure 1 Gold Medal and Certificate acquired at the 1900 Paris World Exhibition
This reproduction aspect of the fine multi-coloured maps (the contents were differentiated in some 30 colours), applied since 1866, overshadowed any discussion of the contents, which was just as unique for a topographic map of a densely settled tropical area in the 1850s. The maps showed, next to the topography, relief and geographical names, an immensely detailed (certainly for the scale 1:100 000) land use depiction.
From 1849-1853 the Batavia residency (Java was subdivided into 22 administrative districts or residencies), that is the area immediately surrounding the capital Batavia (now Jakarta) was mapped on the scale 1:100.000. Apparently the result matched expectations, as in 1853 the Dutch colonial authorities decided to extend the mapping method/survey used for the production of this map to the whole island. The consecutive survey by indigenous surveyors, overseen by army officers went hand in hand with trigonometrical and statistical surveys, and the last item made available the detailed land-use information used for the series. The maps were drawn in the ‘Topographische Inrichting’ in Batavia, and sent for reproduction to the topographical survey in the Hague, Netherlands, where Eckstein was in charge of lithographic reproduction. From the 1910s onwards the reproduction took place in the Topographic Survey headquarters in Batavia (now Jakarta) in what came to be the largest printing establishment in South-East Asia. As the reproduction method used was the subject
of extensive descriptions in foreign geographical and geodetic journals at the time (e.g. Von Sydow 1870, 1872), and the map contents was not, this paper will concentrate on the latter, and on the possibilities it presented for map use.
Surveying and mapping
According to plan, a triangulation of Java and Madura Island was to precede the surveys, but for one third of the residencies, the triangulation results were not available in time, so that later extensive re-working of the survey results became necessary. Surveys were done at the scales 1:10 000 or 1:20 000 (Overzicht etc., 1901), the resulting ‘brouillons’ were redrawn at the survey operational headquarters by native draughtsmen. Name lists were drawn up, corrected by local administration and linguists and subsequently maps and lists were sent to Batavia, together with a topographical description of the residency, lists of distances along the road network, descriptions of the ‘mapping history ‘of its survey, a list of the map sheets that together covered the residency, a map with the boundaries of the minor administrative divisions and lists of coordinates of triangulation points in the residency. In Batavia the material was prepared for reproduction at the final scale in the Netherlands.
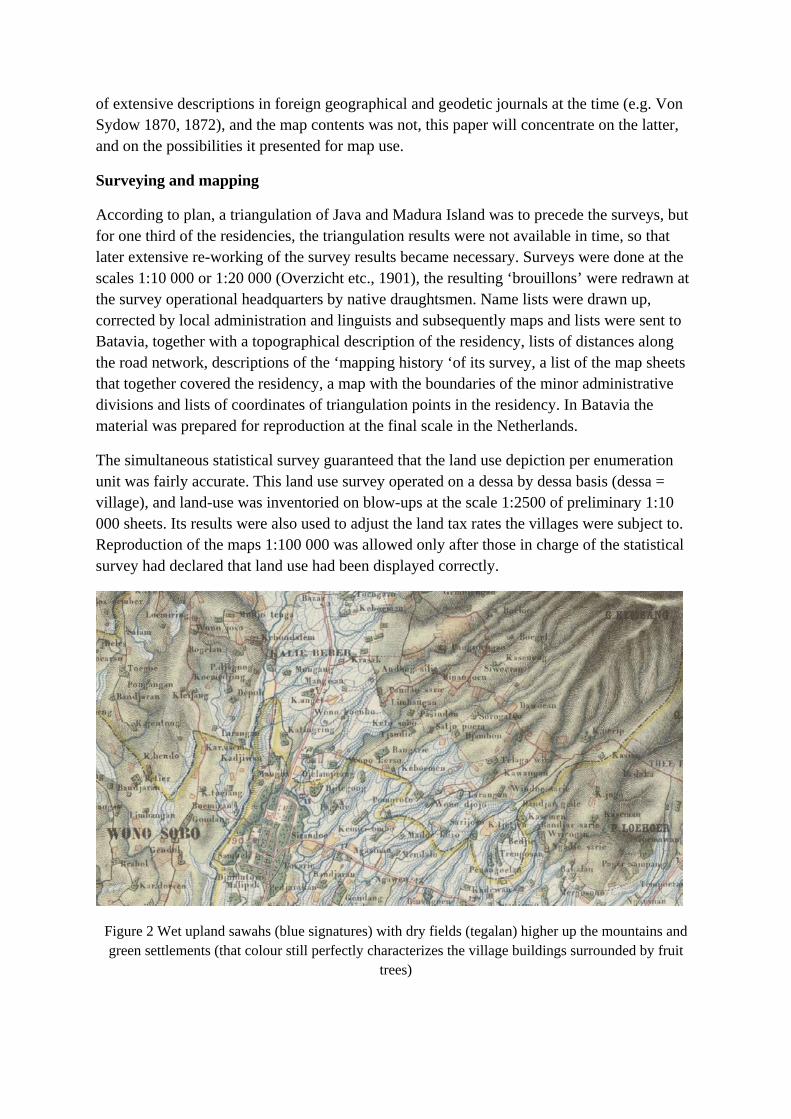
The simultaneous statistical survey guaranteed that the land use depiction per enumeration unit was fairly accurate. This land use survey operated on a dessa by dessa basis (dessa = village), and land-use was inventoried on blow-ups at the scale 1:2500 of preliminary 1:10 000 sheets. Its results were also used to adjust the land tax rates the villages were subject to. Reproduction of the maps 1:100 000 was allowed only after those in charge of the statistical survey had declared that land use had been displayed correctly.
Figure 2 Wet upland sawahs (blue signatures) with dry fields (tegalan) higher up the mountains and green settlements (that colour still perfectly characterizes the village buildings surrounded by fruit
trees)
A characteristic of this map series is its high degree of reliance on coloured instead of black and white symbols and signatures (see figure 2).
Contents of the map series
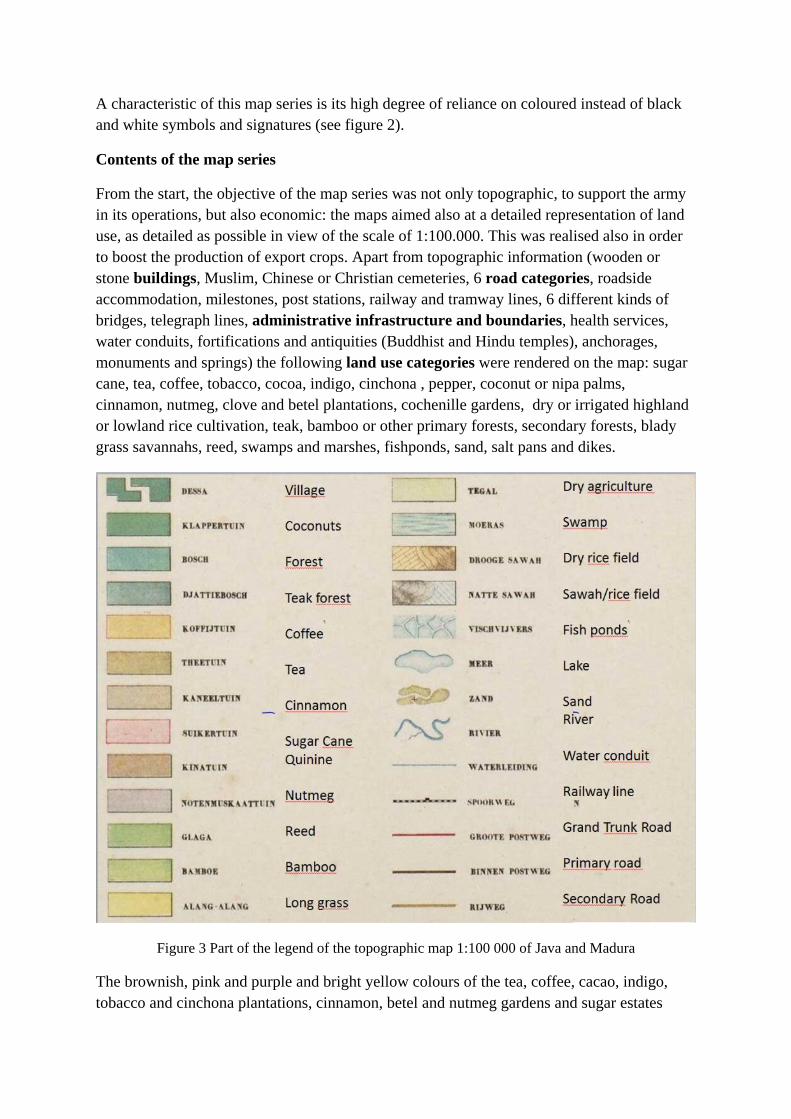
From the start, the objective of the map series was not only topographic, to support the army in its operations, but also economic: the maps aimed also at a detailed representation of land use, as detailed as possible in view of the scale of 1:100.000. This was realised also in order to boost the production of export crops. Apart from topographic information (wooden or stone buildings, Muslim, Chinese or Christian cemeteries, 6 road categories, roadside accommodation, milestones, post stations, railway and tramway lines, 6 different kinds of bridges, telegraph lines, administrative infrastructure and boundaries, health services, water conduits, fortifications and antiquities (Buddhist and Hindu temples), anchorages, monuments and springs) the following land use categories were rendered on the map: sugar cane, tea, coffee, tobacco, cocoa, indigo, cinchona , pepper, coconut or nipa palms, cinnamon, nutmeg, clove and betel plantations, cochenille gardens, dry or irrigated highland or lowland rice cultivation, teak, bamboo or other primary forests, secondary forests, blady grass savannahs, reed, swamps and marshes, fishponds, sand, salt pans and dikes.
Figure 3 Part of the legend of the topographic map 1:100 000 of Java and Madura
The brownish, pink and purple and bright yellow colours of the tea, coffee, cacao, indigo, tobacco and cinchona plantations, cinnamon, betel and nutmeg gardens and sugar estates
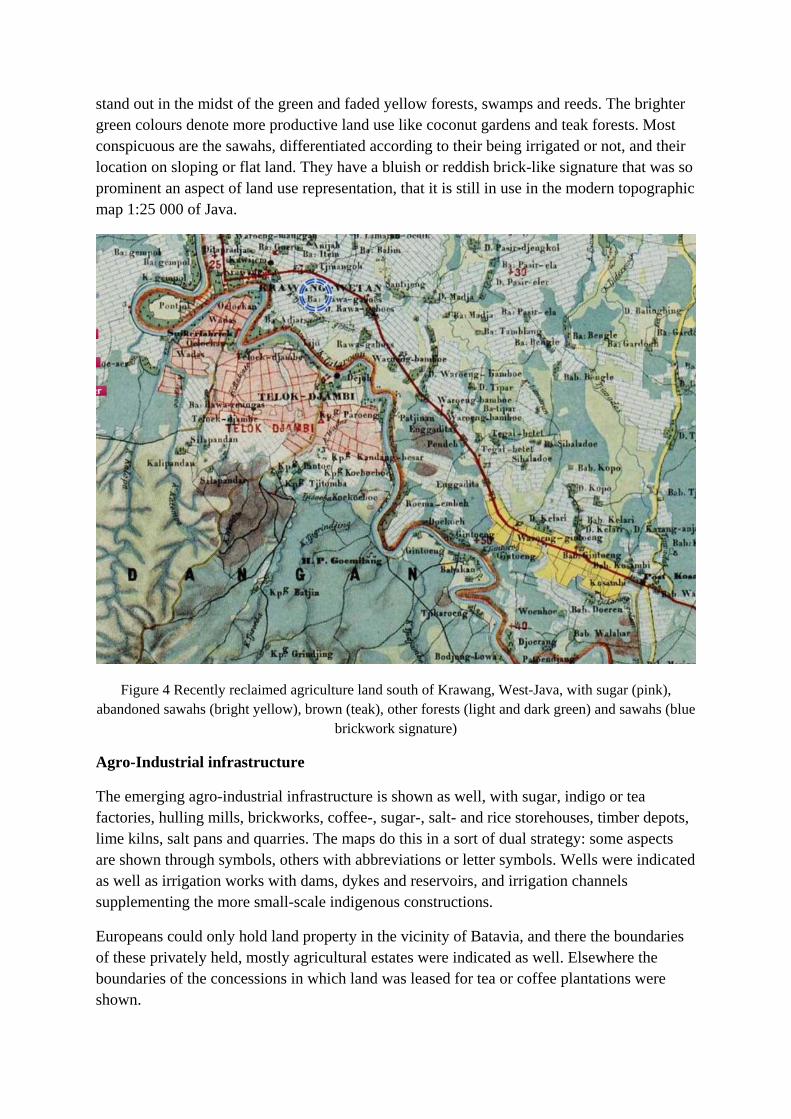
stand out in the midst of the green and faded yellow forests, swamps and reeds. The brighter green colours denote more productive land use like coconut gardens and teak forests. Most conspicuous are the sawahs, differentiated according to their being irrigated or not, and their location on sloping or flat land. They have a bluish or reddish brick-like signature that was so prominent an aspect of land use representation, that it is still in use in the modern topographic map 1:25 000 of Java.
Figure 4 Recently reclaimed agriculture land south of Krawang, West-Java, with sugar (pink), abandoned sawahs (bright yellow), brown (teak), other forests (light and dark green) and sawahs (blue
brickwork signature)
Agro-Industrial infrastructure
The emerging agro-industrial infrastructure is shown as well, with sugar, indigo or tea factories, hulling mills, brickworks, coffee-, sugar-, salt- and rice storehouses, timber depots, lime kilns, salt pans and quarries. The maps do this in a sort of dual strategy: some aspects are shown through symbols, others with abbreviations or letter symbols. Wells were indicated as well as irrigation works with dams, dykes and reservoirs, and irrigation channels supplementing the more small-scale indigenous constructions.
Europeans could only hold land property in the vicinity of Batavia, and there the boundaries of these privately held, mostly agricultural estates were indicated as well. Elsewhere the boundaries of the concessions in which land was leased for tea or coffee plantations were shown.
Along the whole north coast of Java an extensive band of fish ponds is located, which from the air looks as if the island is trimmed with lace. Before the advent of aerial photography these fish ponds must have been quite exerting to survey. The rocky south coast is dotted with red dots denoting birds nest cliffs, swallow nests that were collected and fetched high prices at Chinese restaurants.
On the later sheets the emerging narrow gauge Decauville rail system that opened up the countryside for transporting export crops was indicated.
Other infrastructural aspects
The elaborate administrative infrastructure was rendered with boundary systems for residencies, regencies and districts, together with the locations where the dual administrators (both indigenous and Dutch) had their abodes: the residencies of Dutch commissioners (‘residents’), Javanese regents, Dutch assistant-commissioners, indigenous district heads (wedono’s) or sub-district-heads (assistant-wedono’s) and Dutch controllers were indicated on the map by a system of flag symbols, dressing the maps quite nicely. So the map series clearly also had an administrative function.
As during the wet season only surfaced roads would be passable for carts, as would be the case for some unsurfaced roads that would not even be passable for horses, this was reflected in the road classification, with the surfaced grand trunk road, as the primary category. Ferries also were symbolized. After 1865 railways and tramways with iron bridges, stations and stops would be added. The grand trunk road was a post road, but also lesser postal roads with post stations, milestones and post sheds would be indicated, as were pasangrahans, the stopping-off places for travelling civil servants. Anchorages and symbols for navigable rivers were used, although riverine transport never amounted to much on Java Island. Lighthouses were included, and after the destruction of many due to the Krakatoa eruption in 1883, those were quickly rebuilt and again represented on the map.
The sensibilities of the local population were increasingly taken account of: on the first editions mosques were rendered in the legend by a symbol denoted “Mahomedan church”, later to be rendered by the indigenous word Messigit. Both Muslim, Chinese and Christian cemeteries would be shown.
Primary, secondary and tertiary triangulation points, as well as fourth order so-called geographical signals were indicated. The military infrastructure was rendered by the depiction of forts and guardhouses. Some areas were literally dotted with guard houses, such as south-eastern Madura. The reason has not been found out yet. Whether villages were surrounded by ‘living’ thorny embrasures or by wooden fences would also be mapped initially. Stone and wooden or bamboo buildings were differentiated; the former being rendered red and the latter black. This had a military reason, as stone buildings are more artillery-resistant. Inadvertently, it came also to differentiate between indigenous and European residential quarters, as colonizers preferred to live in the cooler stone buildings. It was only with the new topographic maps published after 1949 that this difference was cancelled.
Right from the beginning, antiquities, that is Buddhist or Hindu temples, would be shown on the map.
Physical landscape
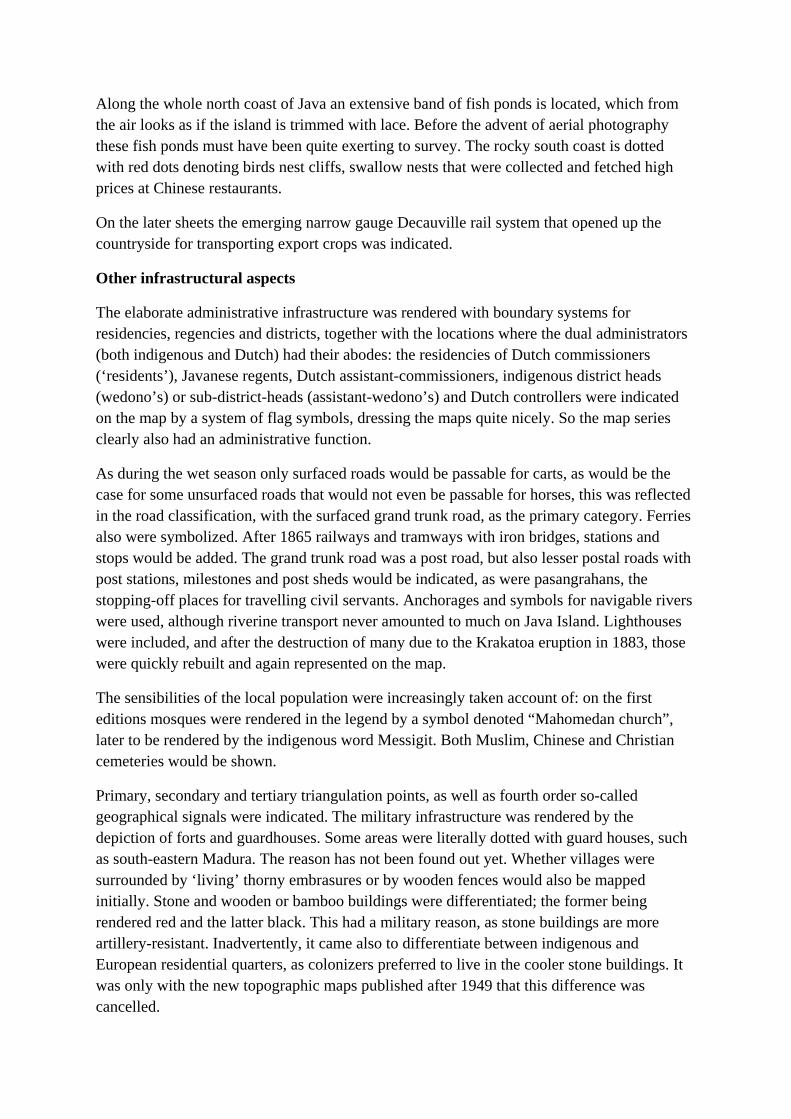
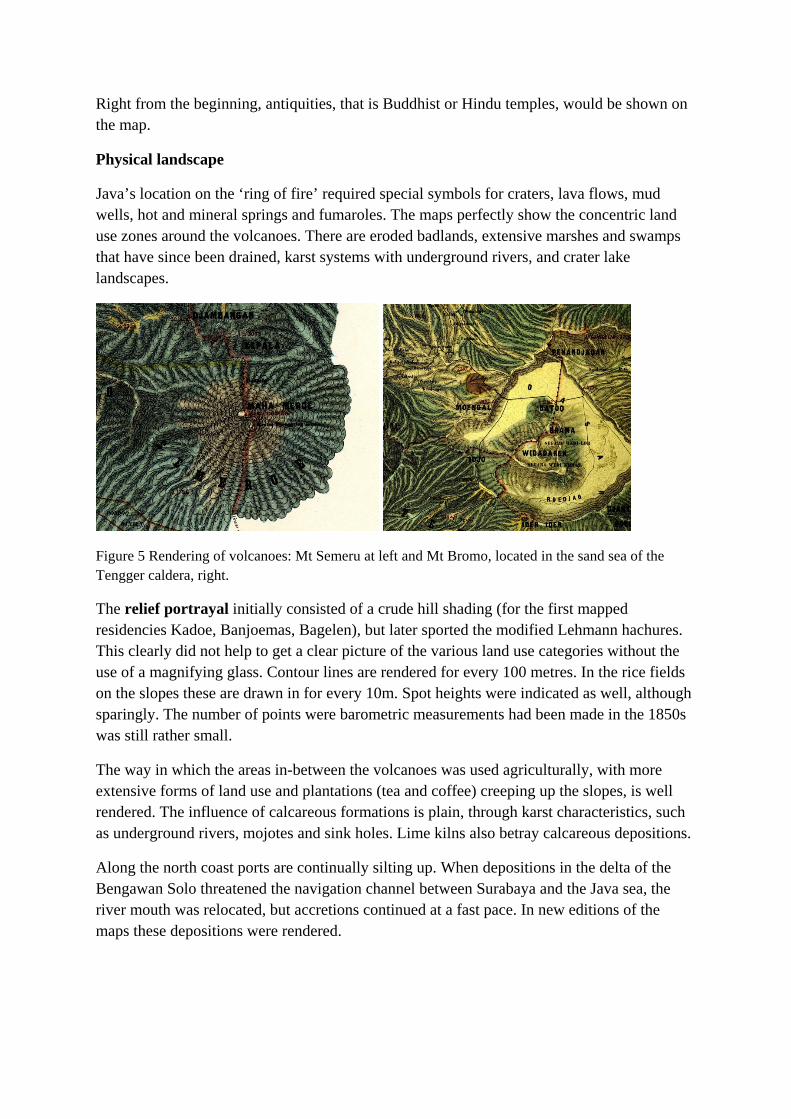
Java’s location on the ‘ring of fire’ required special symbols for craters, lava flows, mud wells, hot and mineral springs and fumaroles. The maps perfectly show the concentric land use zones around the volcanoes. There are eroded badlands, extensive marshes and swamps that have since been drained, karst systems with underground rivers, and crater lake landscapes.
Figure 5 Rendering of volcanoes: Mt Semeru at left and Mt Bromo, located in the sand sea of the Tengger caldera, right.
The relief portrayal initially consisted of a crude hill shading (for the first mapped residencies Kadoe, Banjoemas, Bagelen), but later sported the modified Lehmann hachures. This clearly did not help to get a clear picture of the various land use categories without the use of a magnifying glass. Contour lines are rendered for every 100 metres. In the rice fields on the slopes these are drawn in for every 10m. Spot heights were indicated as well, although sparingly. The number of points were barometric measurements had been made in the 1850s was still rather small.
The way in which the areas in-between the volcanoes was used agriculturally, with more extensive forms of land use and plantations (tea and coffee) creeping up the slopes, is well rendered. The influence of calcareous formations is plain, through karst characteristics, such as underground rivers, mojotes and sink holes. Lime kilns also betray calcareous depositions.
Along the north coast ports are continually silting up. When depositions in the delta of the Bengawan Solo threatened the navigation channel between Surabaya and the Java sea, the river mouth was relocated, but accretions continued at a fast pace. In new editions of the maps these depositions were rendered.
Figure 6 concentric zones of land use categories around volcanoes: Mt Merapi.
Legibility
To render all this information on a map 1:100 000 is a major feat; with surveys at the scale 1:10 000 and 1:20 000, the information collected was then generalized to fit the 1:100 000 scale. Extracting this information from the map sometimes is a major feat as well! The rendering of land use with different colours instead of black and white symbols certainly helped legibility, but lettering was rather too bold, including the rather crude letter symbols.
The combination of hachures and land use colours did not really work well, and no good solution was found. When later the hachures were printed in lighter brown, land use came out better, but the relief portrayal suffered instead and became less vivid. Lettering was sometimes impossible to read in mountainous areas, where the hachures blocked legibility. This also improved in later editions when the brown of the hachures was lightened.
Unfortunately, the base maps 1:20 000 for this map series are lost, and it is now impossible to assess the accuracy of the land use depiction.
Updating the series
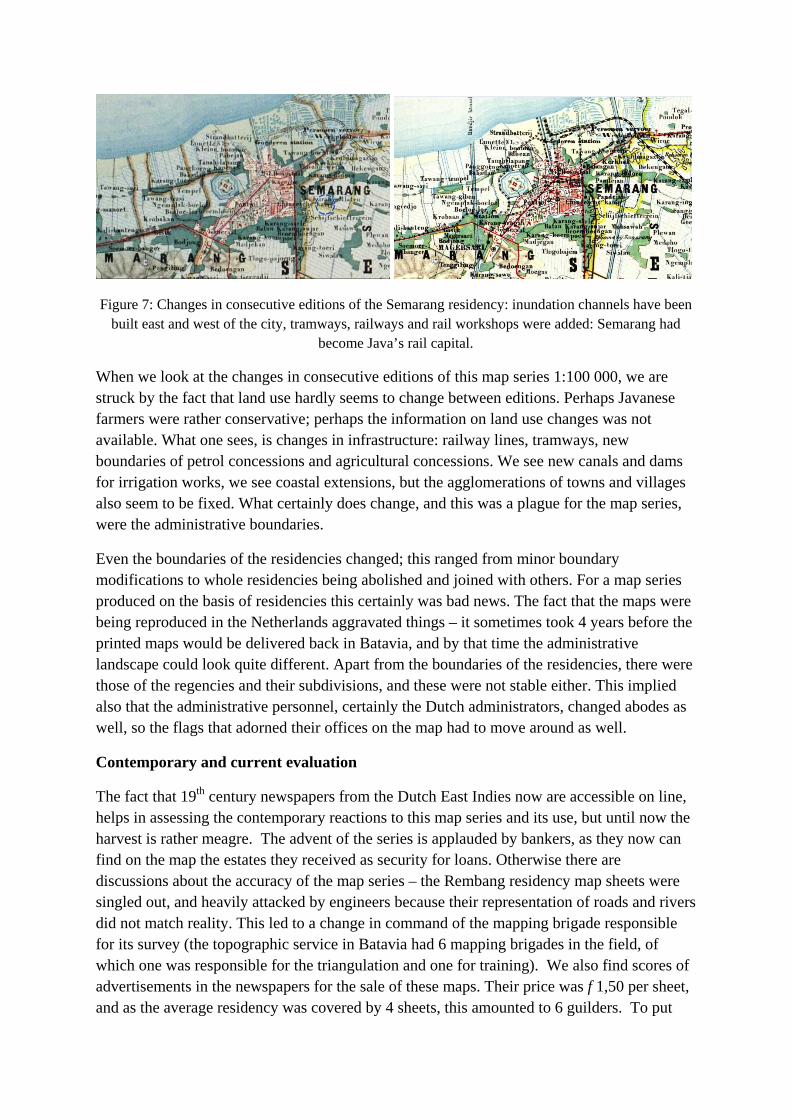
Figure 7: Changes in consecutive editions of the Semarang residency: inundation channels have been built east and west of the city, tramways, railways and rail workshops were added: Semarang had
become Java’s rail capital.
When we look at the changes in consecutive editions of this map series 1:100 000, we are struck by the fact that land use hardly seems to change between editions. Perhaps Javanese farmers were rather conservative; perhaps the information on land use changes was not available. What one sees, is changes in infrastructure: railway lines, tramways, new boundaries of petrol concessions and agricultural concessions. We see new canals and dams for irrigation works, we see coastal extensions, but the agglomerations of towns and villages also seem to be fixed. What certainly does change, and this was a plague for the map series, were the administrative boundaries.
Even the boundaries of the residencies changed; this ranged from minor boundary modifications to whole residencies being abolished and joined with others. For a map series produced on the basis of residencies this certainly was bad news. The fact that the maps were being reproduced in the Netherlands aggravated things – it sometimes took 4 years before the printed maps would be delivered back in Batavia, and by that time the administrative landscape could look quite different. Apart from the boundaries of the residencies, there were those of the regencies and their subdivisions, and these were not stable either. This implied also that the administrative personnel, certainly the Dutch administrators, changed abodes as well, so the flags that adorned their offices on the map had to move around as well.
Contemporary and current evaluation
The fact that 19th century newspapers from the Dutch East Indies now are accessible on line, helps in assessing the contemporary reactions to this map series and its use, but until now the harvest is rather meagre. The advent of the series is applauded by bankers, as they now can find on the map the estates they received as security for loans. Otherwise there are discussions about the accuracy of the map series – the Rembang residency map sheets were singled out, and heavily attacked by engineers because their representation of roads and rivers did not match reality. This led to a change in command of the mapping brigade responsible for its survey (the topographic service in Batavia had 6 mapping brigades in the field, of which one was responsible for the triangulation and one for training). We also find scores of advertisements in the newspapers for the sale of these maps. Their price was f 1,50 per sheet, and as the average residency was covered by 4 sheets, this amounted to 6 guilders. To put
this in perspective, the monthly salary of a European surveyor in the East Indies was f 200 at the time, and that of an indigenous clerk f 25. No information about the numbers of copies printed could be found as yet, but reprints became necessary within a year of the publication of the first sheets, as a number of residency series got out of print.
Most critics complained about the fact that the map series was published per residency. For some areas on the edge of several residencies, it took up to 20 years before the map of all the relevant residencies had been printed. The change of residential boundaries has already been refered to, so the main reason for publication per residency also was undermined. Van Roon (1907) lists 2½ pages with changes in the boundaries of the residencies. Added to that the military users had big problems to derive terrain slopes from the map, overcrowded as it is with land use information. As every residency was mapped on the basis of its own coordinate system in the Bonne projection, the maps of adjacent residencies did not automatically fit together. Already in 1881 the decision was made to avoid that situation for the other islands, and have a sheet division system applicable for the whole island instead of for single administrative units only. From 1896 onwards a mapping of Central Java was under way, aimed at a full systematic coverage for the whole area, without land use tints, and only sawahs and impenetrable forests coloured in. The military reason for the latter decision was that now the slopes could be better derived from the maps. In 1907 it was finally decided to discontinue the mapping of single residencies for the whole island.
Literature Bas, F. de (1876) De Residentiekaarten van Java en Madoera. Amsterdam: C.F.Stemler
Eckstein, Carel Alphons (1878) De methode van kleuren- en plaatdruk door het etsen van tinten op steen en de typo-autographie, in toepassing aan de Topographische Inrichting te ’s Gravenhage. The Hague: Departement van Oorlog, 1878 Eckstein, Charles A. ( 1876 ) New method for reproducing maps and drawings. The Hague: Giunta d’Albani.
Enthoven, J.J.K. (1899) Notice sur les cartes, livres et objets composés et recueillis par le service topographique des Indes Orientales Néerlandaises et destinés a l'exposition universelle de Paris de 1900. Batavia : Imprimerie de l'etat: Indes Orientales Néerlandaises. Bureau Topographique à Batavia ( 20 p)
Jaarverslag van den Topografischen Dienst in Nederlandsch-Indië. Batavia: Topografische Dienst, 1905-1939.
Ormeling Sr., F.J. (2000) De residentiekaarten van Java en Madoera. Caert-Thresoor vol 19-2, 2000, pp 45-49.
Ormeling, F.J. (2003) Een korte geschiedenis van de kartografie van Nederlandsch-Indië. pp 6 -13 in: [red.] J.R. van Diessen en F.J. Ormeling – Grote Atlas van Nederlandsch Oost-Indië. Zierikzee: Asia Maior; Utrecht: Koninklijk Nederlands Aardrijkskundig Genootschap,

2003.
Overzicht van de organisatie en werkwijze van den Topographischen Dienst in Nederlandsch-Indië. Samengesteld bij het Topographisch Bureau te Batavia. Batavia: Landsdrukkerij 1901.
Roon, J. van (1908) Is het handhaven der Residentiekaarten van Java en Madoera nuttig en wenschelijk? Jaarverslag van den Topografischen Dienst in Nederlandsch-Indië over 1907. Batavia: Topografische Dienst. Sydow, Emil von (1870) Der kartographische Standpunkt Europas vom Jahre 1866 bis 1869. Mittheilungen aus Justus Perthes’Geographischer Anstalt 1870, Heft II and III Sydow, Emil von (1872) Der kartographische Standpunkt Europas vom Jahre 1869 bis 1871. Mittheilungen aus Justus Perthes’Geographischer Anstalt 1872, Heft VII and VIII. Vijfenzeventig jaren Topografie in Nederlands-Indië. (1939) Jubileumuitgave met inleiding door M.T. van Staveren. Batavia: Topografische Dienst 1939. (75 years jubilee of the Topographical Survey)


![스타트업코리아 라운드테이블-[nipa] 160125 디캠프 라운드테이블_발표자료(nipa)_수정본](https://img.pdfslide.net/doc/110x75/588026d31a28ab9f0f8b48b1/-nipa-160125-nipa.jpg)