Embed Size (px)
Citation preview
Tropical Agricultural Research Vol. 29 (4): 242 – 257 (2018)
Resilience of Farmers at Water Shortage Situations in Minor Irrigation
Systems: A Case Study in Kurunegala District, Sri Lanka
W.M.S.M. Wijekoon*, E.R.N. Gunawardena
1, M.M.M. Aheeyar
2 and W.P.R.P. De Silva
1
Postgraduate Institute of Agriculture
University of Peradeniya
Sri Lanka
ABSTRACT: Farmers in Minor Irrigation Systems (MIS) experience many difficulties
due to severe seasonal or year-round absolute water scarcity that affects their livelihoods. In
order to address this problem, the resilience of the vulnerable communities needs to be
enhanced through smart investments and appropriate adaptation strategies. Since there is no
well-established method for assessing the resilience of the farmers in MIS, this study was
aimed to develop a framework and prospective methodology to assess resilience and factors
determining the resilience to shocks and stresses of MIS. A structured questionnaire survey
was carried out among 188 households belong to eight farmer organizations under 16 MIS
located in three Agrarian Service Divisions in the IL3 agro-ecological region in Kurunegala
District. The resilience of farming was measured using adaptive capacity or the risk
management strategies used at household levels related to farming practices using 20
indicators. Analysis of factors was performed with the principle component method and
rotated (from Varimax with Kaiser Normalization technique) factor loadings were extracted
to compute resilience index. Using the empirical equation derived from the study, the
resilience of MIS was quantitatively determined. The results showed that there is an
adequate space to enhance the resilience of farming in MIS by introducing and adapting
various risk management strategies. It appears that capacity of the tank, accessibility of
services and the trust of farmers both on farmer organizations and the agency officials are
some of the key factors which govern the resilience of farming in MIS.
Keywords: Livelihood, minor irrigation system, resilience, risk management, water scarcity
INTRODUCTION
Village tanks, which provide irrigation water to command areas of less than 80 ha are
classified as Minor Irrigation Systems (MIS) and have historically been built to fulfill food
security needs of successive generations under water shortage conditions mainly in the Dry
and Intermediate zones of Sri Lanka (Siriweera, 2002). The role of the irrigation sector has
now become more important than ever before, because of the increasing population, high
proportion of people living in rural areas and the large numbers of people dependent on
agriculture for their livelihoods (IWMI, 2006). About two million farmer families or 65% of
rural households are engaging in irrigated paddy farming as their main occupation (Shantha
and Asan, 2014). Paddy, the main irrigated crop, is grown on nearly 730,000 ha of land of
1 Department of Agricultural Engineering, Faculty of Agriculture, University of Peradeniya, Sri Lanka 2 International Water Management Institute, Colombo, Sri Lanka
* Corresponding author: [email protected]
Resilience of Farmers at Water Shortage Situations
243
which 170,000 ha is grown under medium and MIS (Shantha and Asan, 2014). Many factors,
which include technical, social and economic and governance issues currently challenge
sustainability of the MIS (Thilakasiri, 2015; Wijekoon et al., 2016; Kumara et al., 2017).
Sustainability of agriculture is centered on concepts of both resilience (the capacity of
systems to buffer the shocks and stresses) and persistence (the capacity of systems to
continue over long periods) and addresses many wider economic, social and environmental
outcomes (Pretty, 2008). The Intergovernmental Panel on Climate Change (IPCC) defines
resilience as, “the ability of a system and its component parts to anticipate, absorb,
accommodate or recover from the effects of a hazardous event in a timely and efficient
manner, through ensuring the preservation, restoration or improvement of its essential basic
structures and functions” (IPCC, 2012).
The water sector, including irrigated agriculture is by nature prone to risks and uncertainties
of various aspects such as biophysical, abiotic, climatic, environmental, biotic (pests,
diseases), economic and price-related risks, and political instability. Many of these risks have
a climatic component and most of them will be affected by climate change (CC), either in
intensity, scope or frequency. Depending on household or system vulnerability, the system
will be more or less affected by the same shock. Recovery from shocks and stresses of a
system depend on its level of resilience (Gitz and Meybeck, 2012).
A resilient agriculture is one that meets both food and development needs over both short
and long-terms, from local to global scales, without destabilizing the earth system. The goal
of the resilient agriculture is to enable a system to respond to changing conditions, so that,
there are minimal losses to the system and maintain socio-ecological system stability. A
more resilient agriculture will need to be persistent, adaptive, and transformative at the
shocks and stresses in time with a broader set of mechanisms, such as the social networks,
governance, and leaderships to meet the immediate needs of people (Vallée, 2008).
Problem identification and justification
Increasing water scarcity is one of the major global challenges today (Jacobson et al., 2013).
It is estimated that by 2025, most of the districts in the Dry and Intermediate zones of Sri
Lanka will face severe seasonal or year-round absolute water scarcity at the current level of
irrigation efficiency (Amarasinghe et al., 1999). In Yala or minor season, 60% of lands under
MIS are not cultivated due to water scarcity or shortage. It is known that rain fed agriculture
followed by minor irrigation would likely be the most vulnerable and first casualty of
impacts of CC in the agriculture sector (Aheeyar, 2015). With the changes in the eco-system
and socio-economic conditions, farmers in MIS experience many difficulties that affect their
livelihood. In order to address this problem in Sri Lanka, it is recommended to concentrate
on smart investments and adaptation interventions (Bronzoni, 2015), to create “resilience” to
water scarcity as well as CC among vulnerable groups while addressing “current
development goals”. However, the limitation is that there is no proper and well- established
performance evaluation method for assessing the resilience of irrigated agricultural systems.
Therefore, this study was conducted to provide a framework and prospective methodology
for assessing resilience and determine the outcomes of institutions aimed at enhancing
resilience to shocks and stresses of MIS. In an effort to ground the conceptual and technical
discussions of resilience, the study has also aimed to identify key challenges to achieve
resilience and describes necessary steps for moving the resilience agenda forward in the MIS.
Wijekoon et al.
244
MATERIALS AND METHODS
Study area
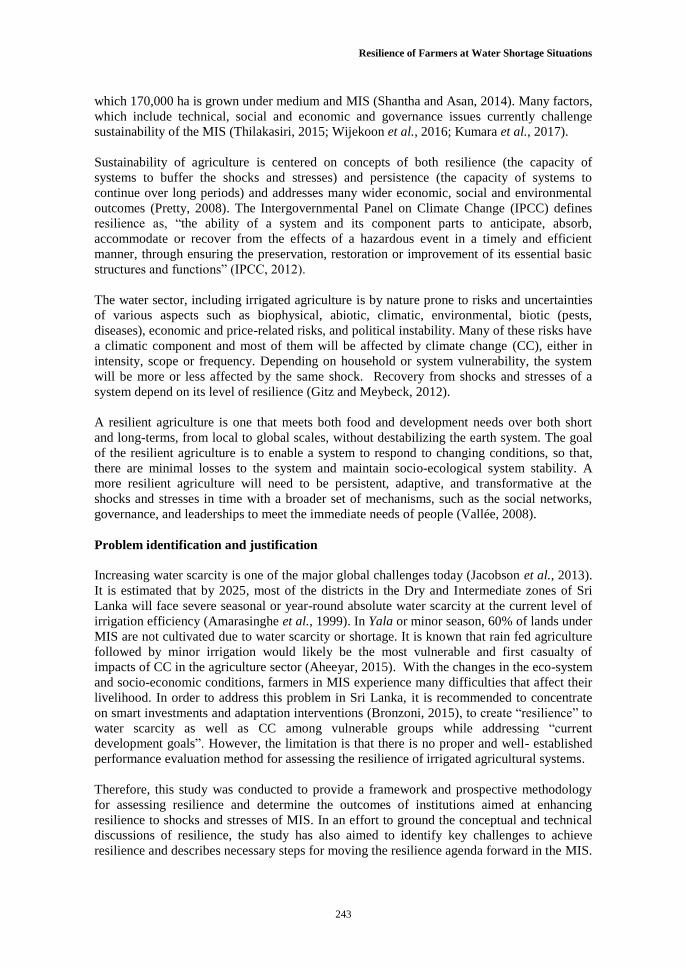
This study was conducted in three ASDs, namely Kumbukgate, Kobeigane and
Rasnayakapura in IL3 agro-ecological region in Kurunegala district (7°45′N 80°15′E) in
North Western Province of Sri Lanka (Figure 1). This agro-ecological region lies in the
western half of the island and has mild drought conditions during Maha season due to the
relatively low contribution of rains from the northeast monsoon. When rainfall during March
is ineffective, it falls under the category of an area prone to severe drought conditions during
Yala season (Chithranayana and Punyawardena, 2008).
Figure 1. Study areas
Framework to assess resilience to farming in MIS
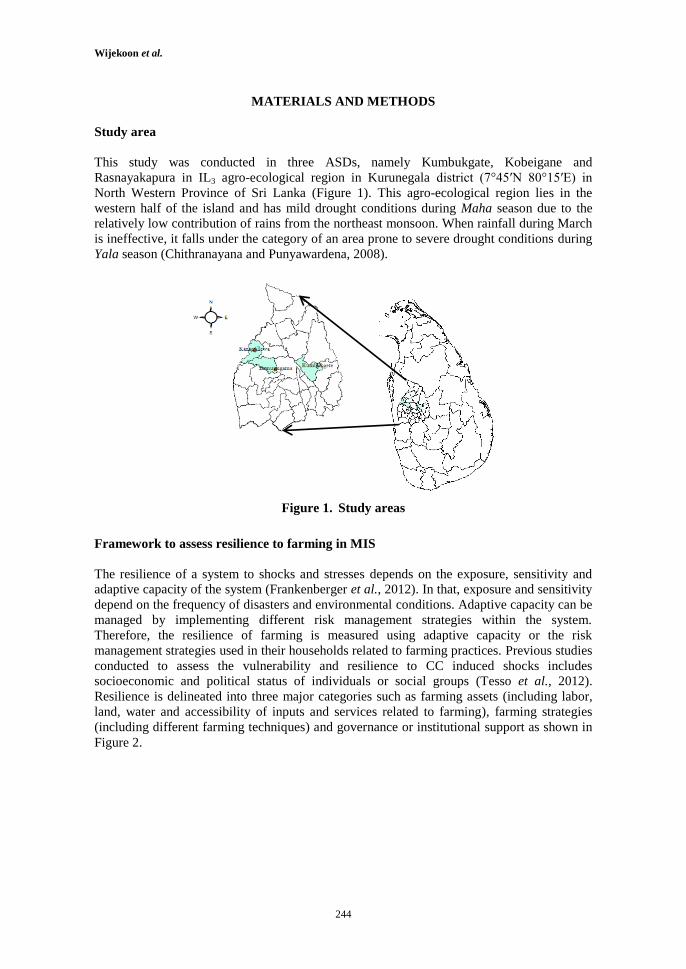
The resilience of a system to shocks and stresses depends on the exposure, sensitivity and
adaptive capacity of the system (Frankenberger et al., 2012). In that, exposure and sensitivity
depend on the frequency of disasters and environmental conditions. Adaptive capacity can be
managed by implementing different risk management strategies within the system.
Therefore, the resilience of farming is measured using adaptive capacity or the risk
management strategies used in their households related to farming practices. Previous studies
conducted to assess the vulnerability and resilience to CC induced shocks includes
socioeconomic and political status of individuals or social groups (Tesso et al., 2012).
Resilience is delineated into three major categories such as farming assets (including labor,
land, water and accessibility of inputs and services related to farming), farming strategies
(including different farming techniques) and governance or institutional support as shown in
Figure 2.
Resilience of Farmers at Water Shortage Situations
245
Figure 2. Framework to assess the resilience to farming in MIS
Among those identified possible risks management strategies, 20 strategies were filtered as
most relevant aspects to be used as indicators to predict farmers’ resilience in different
irrigation systems in the study area (Table 1).
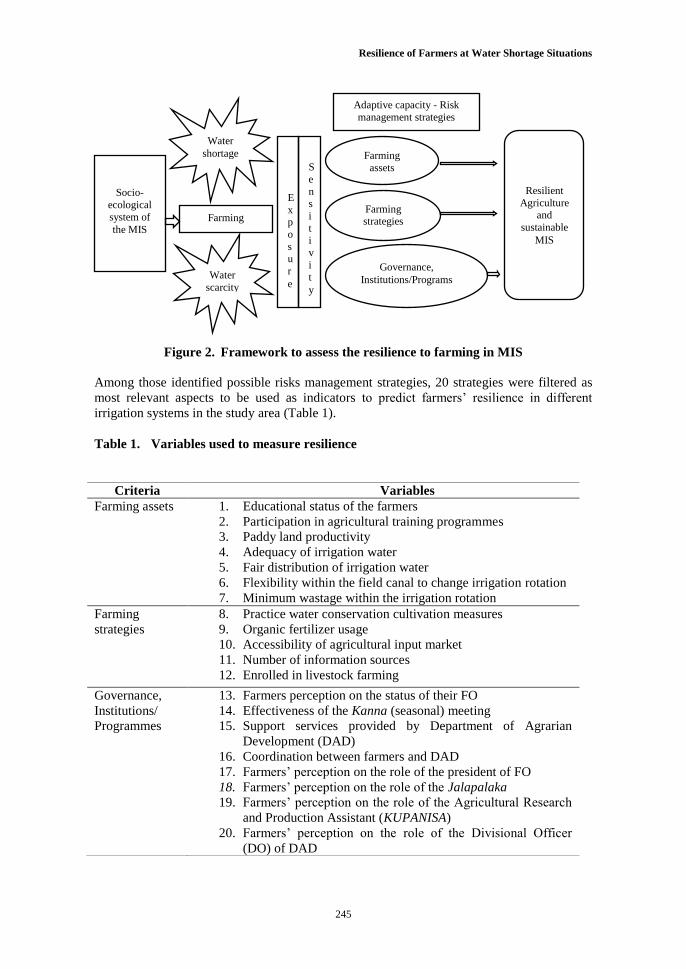
Table 1. Variables used to measure resilience
Criteria Variables
Farming assets 1. Educational status of the farmers
2. Participation in agricultural training programmes
3. Paddy land productivity
4. Adequacy of irrigation water
5. Fair distribution of irrigation water
6. Flexibility within the field canal to change irrigation rotation
7. Minimum wastage within the irrigation rotation
Farming
strategies
8. Practice water conservation cultivation measures
9. Organic fertilizer usage
10. Accessibility of agricultural input market
11. Number of information sources
12. Enrolled in livestock farming
Governance,
Institutions/
Programmes
13. Farmers perception on the status of their FO
14. Effectiveness of the Kanna (seasonal) meeting
15. Support services provided by Department of Agrarian
Development (DAD)
16. Coordination between farmers and DAD
17. Farmers’ perception on the role of the president of FO
18. Farmers’ perception on the role of the Jalapalaka
19. Farmers’ perception on the role of the Agricultural Research
and Production Assistant (KUPANISA)
20. Farmers’ perception on the role of the Divisional Officer
(DO) of DAD
Socio-
ecological
system of
the MIS
Water
shortage
E
xp
o
su
r
e
S
e
ns
i
ti
v
i
t
y
Farming
assets
Governance,
Institutions/Programs
Farming strategies
Resilient
Agriculture and
sustainable
MIS
Adaptive capacity - Risk
management strategies
Farming
Water
scarcity
Wijekoon et al.
246
Data collection
Primary information was collected through structured questionnaire survey, which was
carried out at 188 households belonging to eight FOs under the 16 MIS in Kumbukgate,
Bamunugama and Kanagullawa Grama Niladari (GN) divisions in Kumbukgate, Kobeigane
and Rasnayakapura ASDs, respectively. Stratified random sampling was applied based on
FO level. Sample was calculated as 30 percent propotion to the number of members in each
FO. But, altogether 188 households were surveyed (Table 2).
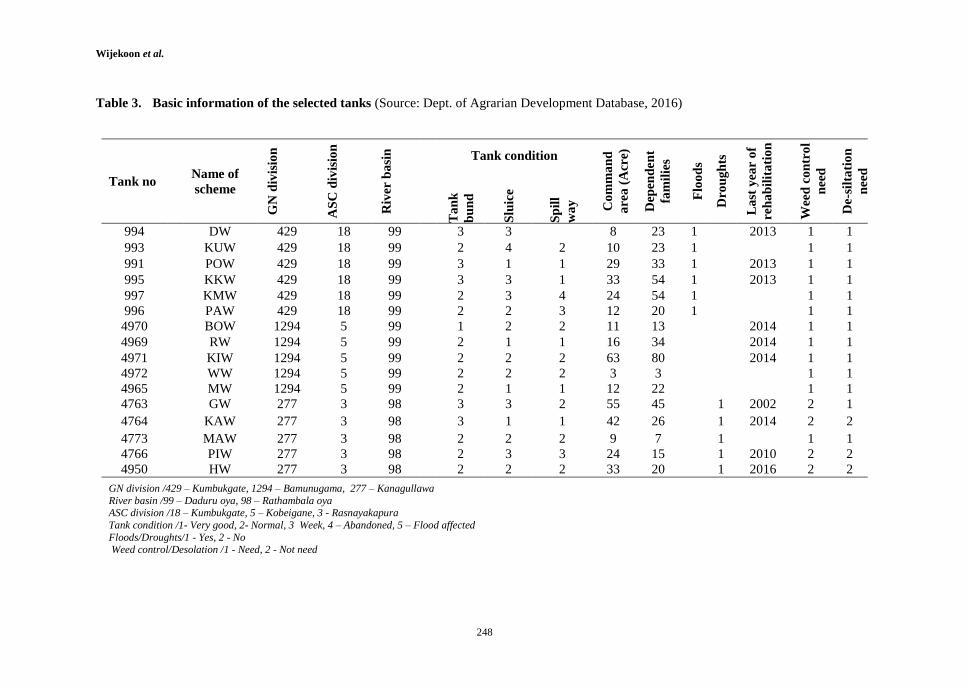
Basic information regarding tank condition on the selected village tanks (Table 3) was
collected from DAD and observations were made during field visits with regard to the
present situation of the selected tanks.
Data analyses
After obtaining individual information, collected information was clustered into each tank
using frequency of farmer responses within each variable. Weightages were given allowing
the positive side of the variable representing the highest resilience of maximum 100, and a
minimum of 0 to represent the lowest resilience situation within the variable. Therefore,
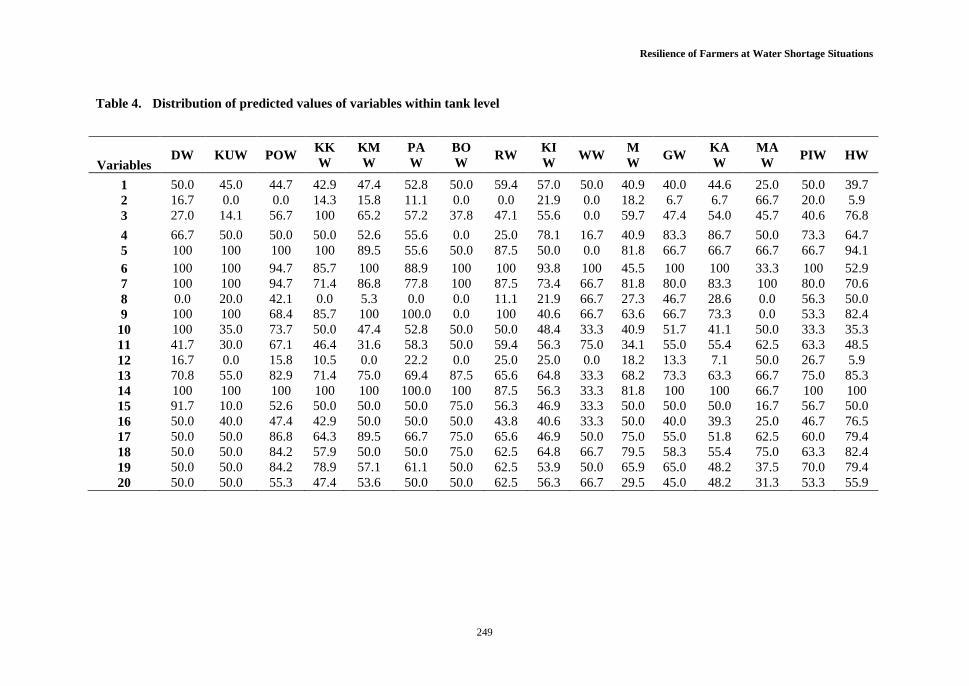
entire data set was converted into the percentage (0% to 100%) scale for the analysis. Table 4
represents the predicted values of variables for each tank. Statistical analyses were performed
using Statistical Package for the Social Sciences (SPSS). Clustered information or the
processed values of variables were used to analyze the resilience component. For that factor
analysis was performed with the principle component method and rotated (from Varimax
with Kaiser Normalization technique) factor loadings were extracted to compute resilience
index.
Resilience of Farmers at Water Shortage Situations
247
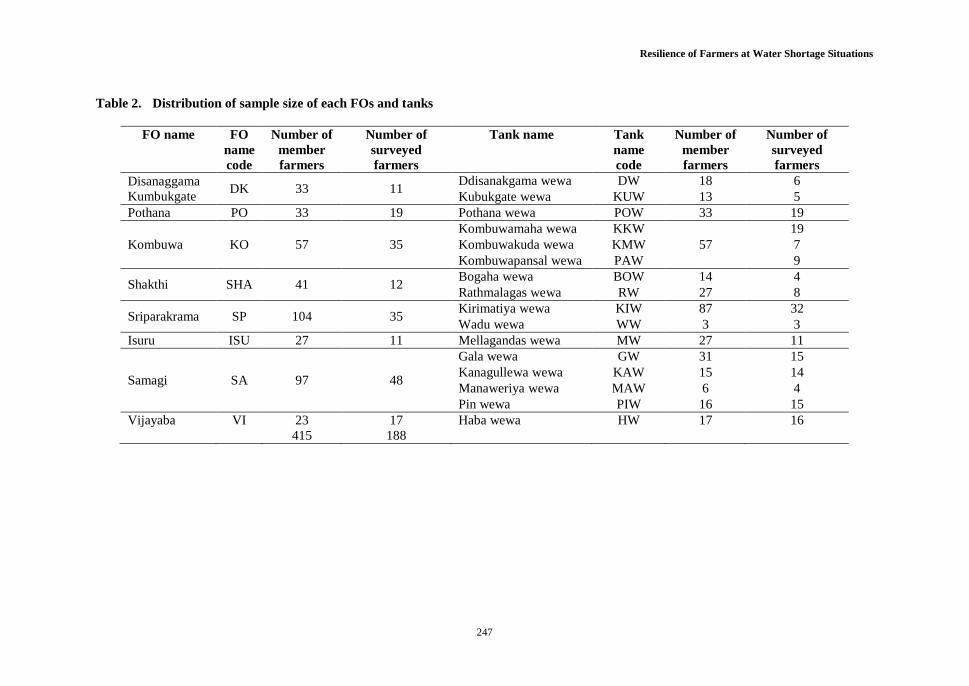
Table 2. Distribution of sample size of each FOs and tanks
FO name FO
name
code
Number of
member
farmers
Number of
surveyed
farmers
Tank name Tank
name
code
Number of
member
farmers
Number of
surveyed
farmers
Disanaggama
Kumbukgate DK 33 11
Ddisanakgama wewa DW 18 6
Kubukgate wewa KUW 13 5
Pothana PO 33 19 Pothana wewa POW 33 19
Kombuwa KO 57 35
Kombuwamaha wewa KKW
57
19
Kombuwakuda wewa KMW 7
Kombuwapansal wewa PAW 9
Shakthi SHA 41 12 Bogaha wewa BOW 14 4
Rathmalagas wewa RW 27 8
Sriparakrama SP 104 35 Kirimatiya wewa KIW 87 32
Wadu wewa WW 3 3
Isuru ISU 27 11 Mellagandas wewa MW 27 11
Samagi SA 97 48
Gala wewa GW 31 15
Kanagullewa wewa KAW 15 14
Manaweriya wewa MAW 6 4
Pin wewa PIW 16 15
Vijayaba VI 23 17 Haba wewa HW 17 16
415 188
Wijekoon et al.
248
Table 3. Basic information of the selected tanks (Source: Dept. of Agrarian Development Database, 2016)
Tank no Name of
scheme
GN
div
isio
n
AS
C d
ivis
ion
Riv
er b
asi
n
Tank condition
Co
mm
an
d
are
a (
Acr
e)
Dep
end
en
t
fam
ilie
s
Flo
od
s
Dro
ug
hts
La
st y
ear
of
reh
ab
ilit
ati
on
Wee
d c
on
tro
l
nee
d
De-s
ilta
tio
n
nee
d
Ta
nk
bu
nd
Slu
ice
Sp
ill
wa
y
994 DW 429 18 99 3 3
8 23 1
2013 1 1
993 KUW 429 18 99 2 4 2 10 23 1
1 1
991 POW 429 18 99 3 1 1 29 33 1
2013 1 1
995 KKW 429 18 99 3 3 1 33 54 1
2013 1 1
997 KMW 429 18 99 2 3 4 24 54 1
1 1
996 PAW 429 18 99 2 2 3 12 20 1
1 1
4970 BOW 1294 5 99 1 2 2 11 13
2014 1 1
4969 RW 1294 5 99 2 1 1 16 34
2014 1 1
4971 KIW 1294 5 99 2 2 2 63 80
2014 1 1
4972 WW 1294 5 99 2 2 2 3 3
1 1
4965 MW 1294 5 99 2 1 1 12 22
1 1
4763 GW 277 3 98 3 3 2 55 45
1 2002 2 1
4764 KAW 277 3 98 3 1 1 42 26
1 2014 2 2
4773 MAW 277 3 98 2 2 2 9 7
1
1 1
4766 PIW 277 3 98 2 3 3 24 15
1 2010 2 2
4950 HW 277 3 98 2 2 2 33 20
1 2016 2 2
GN division /429 – Kumbukgate, 1294 – Bamunugama, 277 – Kanagullawa
River basin /99 – Daduru oya, 98 – Rathambala oya ASC division /18 – Kumbukgate, 5 – Kobeigane, 3 - Rasnayakapura
Tank condition /1- Very good, 2- Normal, 3 Week, 4 – Abandoned, 5 – Flood affected
Floods/Droughts/1 - Yes, 2 - No Weed control/Desolation /1 - Need, 2 - Not need
Resilience of Farmers at Water Shortage Situations
249
Table 4. Distribution of predicted values of variables within tank level
Variables DW KUW POW
KK
W
KM
W
PA
W
BO
W RW
KI
W WW
M
W GW
KA
W
MA
W PIW HW
1 50.0 45.0 44.7 42.9 47.4 52.8 50.0 59.4 57.0 50.0 40.9 40.0 44.6 25.0 50.0 39.7
2 16.7 0.0 0.0 14.3 15.8 11.1 0.0 0.0 21.9 0.0 18.2 6.7 6.7 66.7 20.0 5.9
3 27.0 14.1 56.7 100 65.2 57.2 37.8 47.1 55.6 0.0 59.7 47.4 54.0 45.7 40.6 76.8
4 66.7 50.0 50.0 50.0 52.6 55.6 0.0 25.0 78.1 16.7 40.9 83.3 86.7 50.0 73.3 64.7
5 100 100 100 100 89.5 55.6 50.0 87.5 50.0 0.0 81.8 66.7 66.7 66.7 66.7 94.1
6 100 100 94.7 85.7 100 88.9 100 100 93.8 100 45.5 100 100 33.3 100 52.9
7 100 100 94.7 71.4 86.8 77.8 100 87.5 73.4 66.7 81.8 80.0 83.3 100 80.0 70.6
8 0.0 20.0 42.1 0.0 5.3 0.0 0.0 11.1 21.9 66.7 27.3 46.7 28.6 0.0 56.3 50.0
9 100 100 68.4 85.7 100 100.0 0.0 100 40.6 66.7 63.6 66.7 73.3 0.0 53.3 82.4
10 100 35.0 73.7 50.0 47.4 52.8 50.0 50.0 48.4 33.3 40.9 51.7 41.1 50.0 33.3 35.3
11 41.7 30.0 67.1 46.4 31.6 58.3 50.0 59.4 56.3 75.0 34.1 55.0 55.4 62.5 63.3 48.5
12 16.7 0.0 15.8 10.5 0.0 22.2 0.0 25.0 25.0 0.0 18.2 13.3 7.1 50.0 26.7 5.9
13 70.8 55.0 82.9 71.4 75.0 69.4 87.5 65.6 64.8 33.3 68.2 73.3 63.3 66.7 75.0 85.3
14 100 100 100 100 100 100.0 100 87.5 56.3 33.3 81.8 100 100 66.7 100 100
15 91.7 10.0 52.6 50.0 50.0 50.0 75.0 56.3 46.9 33.3 50.0 50.0 50.0 16.7 56.7 50.0
16 50.0 40.0 47.4 42.9 50.0 50.0 50.0 43.8 40.6 33.3 50.0 40.0 39.3 25.0 46.7 76.5
17 50.0 50.0 86.8 64.3 89.5 66.7 75.0 65.6 46.9 50.0 75.0 55.0 51.8 62.5 60.0 79.4
18 50.0 50.0 84.2 57.9 50.0 50.0 75.0 62.5 64.8 66.7 79.5 58.3 55.4 75.0 63.3 82.4
19 50.0 50.0 84.2 78.9 57.1 61.1 50.0 62.5 53.9 50.0 65.9 65.0 48.2 37.5 70.0 79.4
20 50.0 50.0 55.3 47.4 53.6 50.0 50.0 62.5 56.3 66.7 29.5 45.0 48.2 31.3 53.3 55.9
Wijekoon et al.
250
RESULTS AND DISCUSSION
Socio economic background of the study area
According to survey data, 72 percent of households are engaged in irrigated agriculture or
paddy farming as their major occupation. All the sampled households, who cultivate paddy,
are abstracting water from village tanks. About 68 percent of surveyed farmers had
cultivated both seasons, whilst 32 percent cultivated only during Maha season. This
information suggests that many farming communities of MIS across the region are at
significant risk, if agriculture systems are stressed by events such as droughts due to water
scarcity.
Among the responded farmers, the majority of them (about 93 percent) are above 49 years of
age, indicating the less involvement of youth in farming activities. Only 6 percent of the
total farmers represents the youths under 35 years of age. These findings reveal that a
segment of the young population is either in employment seeking category or employed in
outside of the agriculture sector. The statistics of the education of the respondent farmers
show that the majority of them (67 percent) have received formal education from grade six
to G.C.E (O/L) and 19 percent have received only primary education. Educational
background of the farmers implied that the irrigated farming community in the study area
has sufficient educational background to capture the irrigation system management
programmes, new technological innovations and new knowledge from climate awareness
programmes. Therefore, empowerment of farmers could be handled conveniently to
implement necessary adaptation measures.
Paddy land distribution in the study areas showed that average lowland extent of 0.47 ha per
household. The majority of farmers (71 percent) are having low land extent below 0.405 ha
(1 ac). The maximum and minimum extent of low land recorded was 2.03 ha (5 ac) and 0.10
ha (0.25 ac), respectively.
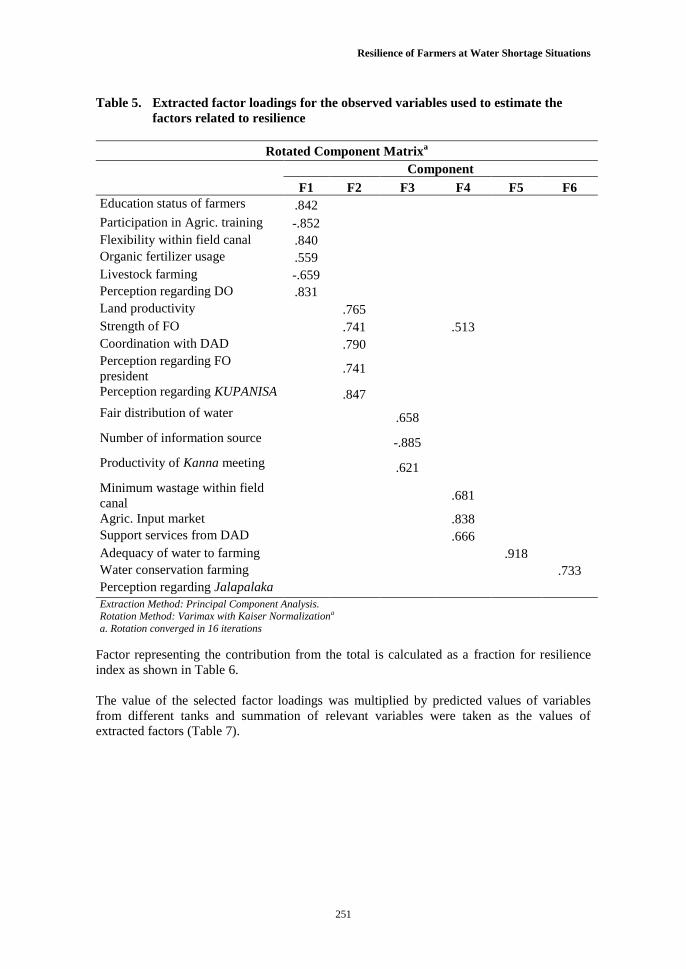
Farmer’s resilience to farming in MIS
The estimates obtained from the resilience analysis are reported in the flowing sections. The
high correlation among variables can produce latent variables or factors considered to
measure resilience. Extracted factor loadings (value >0.5 (+ or -)) to measure different
factors are shown in Table 5.
Resilience of Farmers at Water Shortage Situations
251
Table 5. Extracted factor loadings for the observed variables used to estimate the
factors related to resilience
Rotated Component Matrixa
Component
F1 F2 F3 F4 F5 F6
Education status of farmers .842
Participation in Agric. training -.852
Flexibility within field canal .840
Organic fertilizer usage .559
Livestock farming -.659
Perception regarding DO .831
Land productivity .765
Strength of FO .741 .513
Coordination with DAD .790
Perception regarding FO
president .741
Perception regarding KUPANISA .847
Fair distribution of water .658
Number of information source -.885
Productivity of Kanna meeting .621
Minimum wastage within field
canal .681
Agric. Input market .838
Support services from DAD .666
Adequacy of water to farming .918
Water conservation farming .733
Perception regarding Jalapalaka Extraction Method: Principal Component Analysis. Rotation Method: Varimax with Kaiser Normalizationa
a. Rotation converged in 16 iterations
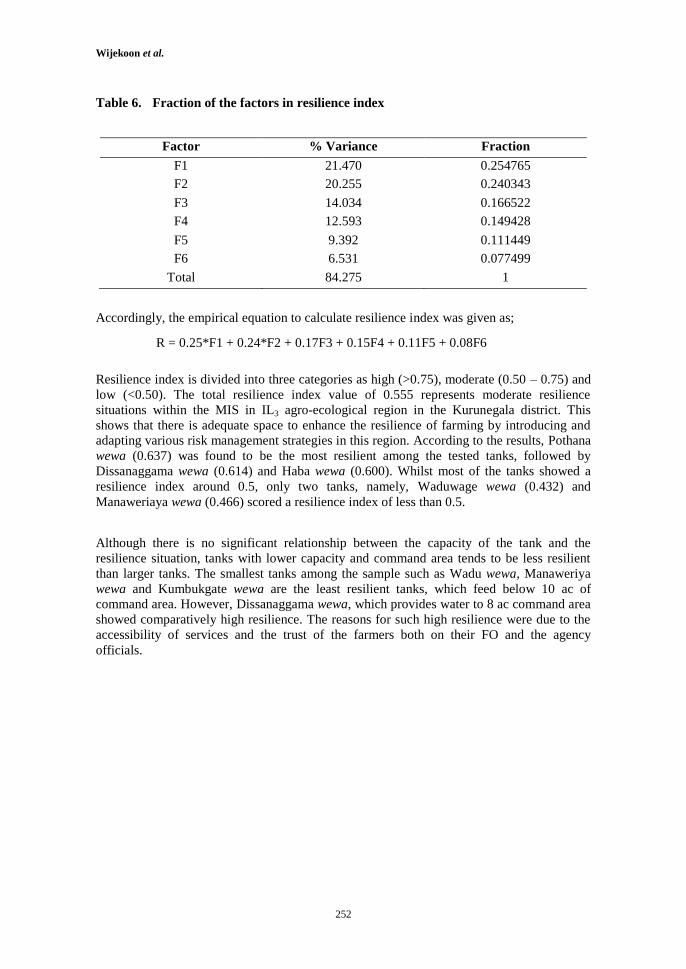
Factor representing the contribution from the total is calculated as a fraction for resilience
index as shown in Table 6.
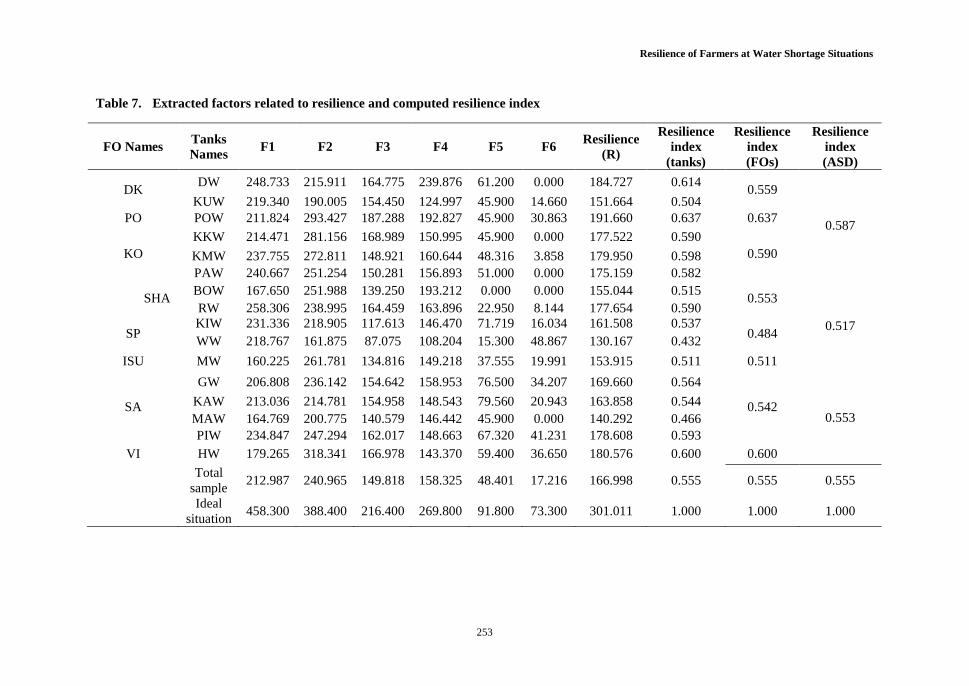
The value of the selected factor loadings was multiplied by predicted values of variables
from different tanks and summation of relevant variables were taken as the values of
extracted factors (Table 7).
Wijekoon et al.
252
Table 6. Fraction of the factors in resilience index
Factor % Variance Fraction
F1 21.470 0.254765
F2 20.255 0.240343
F3 14.034 0.166522
F4 12.593 0.149428
F5 9.392 0.111449
F6 6.531 0.077499
Total 84.275 1
Accordingly, the empirical equation to calculate resilience index was given as;
Resilience index is divided into three categories as high (>0.75), moderate (0.50 – 0.75) and
low (<0.50). The total resilience index value of 0.555 represents moderate resilience
situations within the MIS in IL3 agro-ecological region in the Kurunegala district. This
shows that there is adequate space to enhance the resilience of farming by introducing and
adapting various risk management strategies in this region. According to the results, Pothana
wewa (0.637) was found to be the most resilient among the tested tanks, followed by
Dissanaggama wewa (0.614) and Haba wewa (0.600). Whilst most of the tanks showed a
resilience index around 0.5, only two tanks, namely, Waduwage wewa (0.432) and
Manaweriaya wewa (0.466) scored a resilience index of less than 0.5.
Although there is no significant relationship between the capacity of the tank and the
resilience situation, tanks with lower capacity and command area tends to be less resilient
than larger tanks. The smallest tanks among the sample such as Wadu wewa, Manaweriya
wewa and Kumbukgate wewa are the least resilient tanks, which feed below 10 ac of
command area. However, Dissanaggama wewa, which provides water to 8 ac command area
showed comparatively high resilience. The reasons for such high resilience were due to the
accessibility of services and the trust of the farmers both on their FO and the agency
officials.
R = 0.25*F1 + 0.24*F2 + 0.17F3 + 0.15F4 + 0.11F5 + 0.08F6
Resilience of Farmers at Water Shortage Situations
253
Table 7. Extracted factors related to resilience and computed resilience index
FO Names Tanks
Names F1 F2 F3 F4 F5 F6
Resilience
(R)
Resilience
index
(tanks)
Resilience
index
(FOs)
Resilience
index
(ASD)
DK DW 248.733 215.911 164.775 239.876 61.200 0.000 184.727 0.614
0.559
0.587
KUW 219.340 190.005 154.450 124.997 45.900 14.660 151.664 0.504
PO POW 211.824 293.427 187.288 192.827 45.900 30.863 191.660 0.637 0.637
KO
KKW 214.471 281.156 168.989 150.995 45.900 0.000 177.522 0.590
0.590 KMW 237.755 272.811 148.921 160.644 48.316 3.858 179.950 0.598
PAW 240.667 251.254 150.281 156.893 51.000 0.000 175.159 0.582
SHA BOW 167.650 251.988 139.250 193.212 0.000 0.000 155.044 0.515
0.553
0.517
RW 258.306 238.995 164.459 163.896 22.950 8.144 177.654 0.590
SP KIW 231.336 218.905 117.613 146.470 71.719 16.034 161.508 0.537
0.484 WW 218.767 161.875 87.075 108.204 15.300 48.867 130.167 0.432
ISU MW 160.225 261.781 134.816 149.218 37.555 19.991 153.915 0.511 0.511
SA
GW 206.808 236.142 154.642 158.953 76.500 34.207 169.660 0.564
0.542 0.553
KAW 213.036 214.781 154.958 148.543 79.560 20.943 163.858 0.544
MAW 164.769 200.775 140.579 146.442 45.900 0.000 140.292 0.466
PIW 234.847 247.294 162.017 148.663 67.320 41.231 178.608 0.593
VI HW 179.265 318.341 166.978 143.370 59.400 36.650 180.576 0.600 0.600
Total
sample 212.987 240.965 149.818 158.325 48.401 17.216 166.998 0.555 0.555 0.555
Ideal
situation 458.300 388.400 216.400 269.800 91.800 73.300 301.011 1.000 1.000 1.000
Wijekoon et al.
254
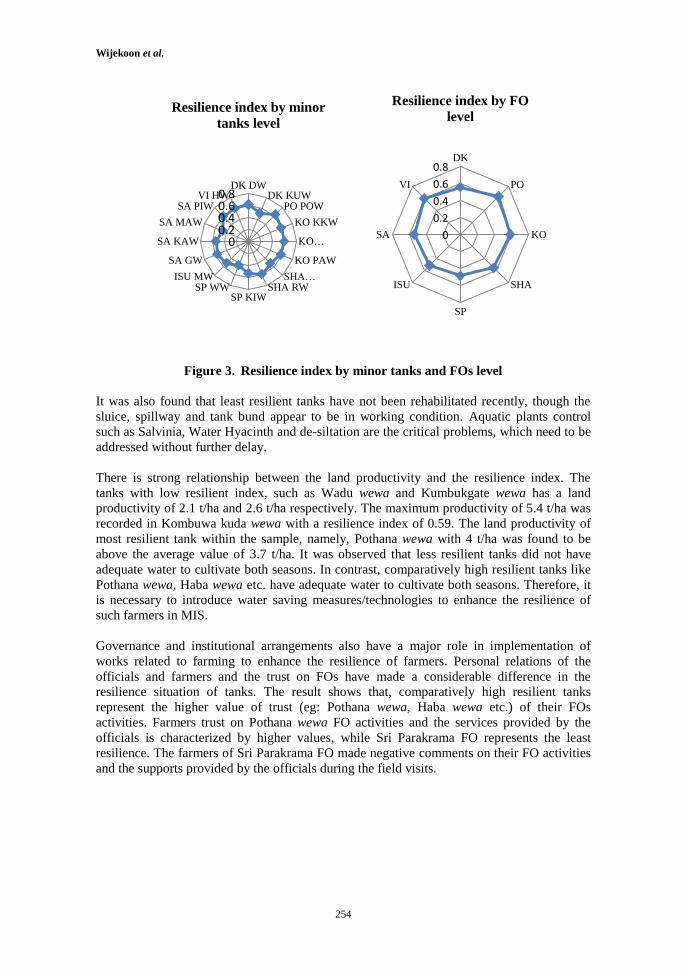
Figure 3. Resilience index by minor tanks and FOs level
It was also found that least resilient tanks have not been rehabilitated recently, though the
sluice, spillway and tank bund appear to be in working condition. Aquatic plants control
such as Salvinia, Water Hyacinth and de-siltation are the critical problems, which need to be
addressed without further delay.
There is strong relationship between the land productivity and the resilience index. The
tanks with low resilient index, such as Wadu wewa and Kumbukgate wewa has a land
productivity of 2.1 t/ha and 2.6 t/ha respectively. The maximum productivity of 5.4 t/ha was
recorded in Kombuwa kuda wewa with a resilience index of 0.59. The land productivity of
most resilient tank within the sample, namely, Pothana wewa with 4 t/ha was found to be
above the average value of 3.7 t/ha. It was observed that less resilient tanks did not have
adequate water to cultivate both seasons. In contrast, comparatively high resilient tanks like
Pothana wewa, Haba wewa etc. have adequate water to cultivate both seasons. Therefore, it
is necessary to introduce water saving measures/technologies to enhance the resilience of
such farmers in MIS.
Governance and institutional arrangements also have a major role in implementation of
works related to farming to enhance the resilience of farmers. Personal relations of the
officials and farmers and the trust on FOs have made a considerable difference in the
resilience situation of tanks. The result shows that, comparatively high resilient tanks
represent the higher value of trust (eg: Pothana wewa, Haba wewa etc.) of their FOs
activities. Farmers trust on Pothana wewa FO activities and the services provided by the
officials is characterized by higher values, while Sri Parakrama FO represents the least
resilience. The farmers of Sri Parakrama FO made negative comments on their FO activities
and the supports provided by the officials during the field visits.
00.20.40.60.8
DK DWDK KUW
PO POW
KO KKW
KO…
KO PAW
SHA…SHA RW
SP KIWSP WW
ISU MW
SA GW
SA KAW
SA MAW
SA PIWVI HW
Resilience index by minor
tanks level
0
0.2
0.4
0.6
0.8DK
PO
KO
SHA
SP
ISU
SA
VI
Resilience index by FO
level
Resilience of Farmers at Water Shortage Situations
255
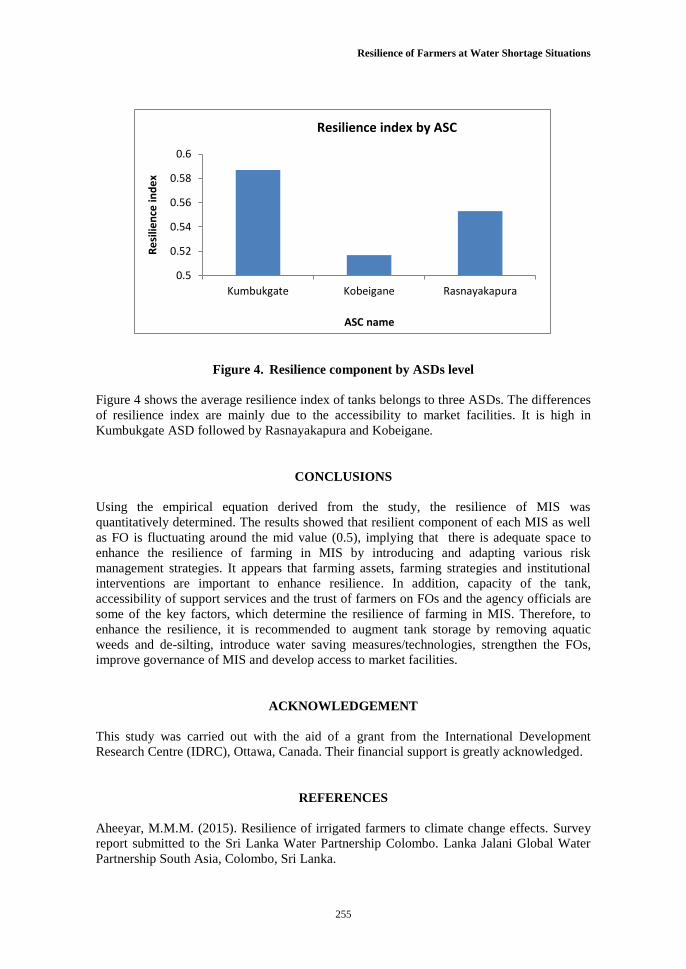
Figure 4. Resilience component by ASDs level
Figure 4 shows the average resilience index of tanks belongs to three ASDs. The differences
of resilience index are mainly due to the accessibility to market facilities. It is high in
Kumbukgate ASD followed by Rasnayakapura and Kobeigane.
CONCLUSIONS
Using the empirical equation derived from the study, the resilience of MIS was
quantitatively determined. The results showed that resilient component of each MIS as well
as FO is fluctuating around the mid value (0.5), implying that there is adequate space to
enhance the resilience of farming in MIS by introducing and adapting various risk
management strategies. It appears that farming assets, farming strategies and institutional
interventions are important to enhance resilience. In addition, capacity of the tank,
accessibility of support services and the trust of farmers on FOs and the agency officials are
some of the key factors, which determine the resilience of farming in MIS. Therefore, to
enhance the resilience, it is recommended to augment tank storage by removing aquatic
weeds and de-silting, introduce water saving measures/technologies, strengthen the FOs,
improve governance of MIS and develop access to market facilities.
ACKNOWLEDGEMENT
This study was carried out with the aid of a grant from the International Development
Research Centre (IDRC), Ottawa, Canada. Their financial support is greatly acknowledged.
REFERENCES
Aheeyar, M.M.M. (2015). Resilience of irrigated farmers to climate change effects. Survey
report submitted to the Sri Lanka Water Partnership Colombo. Lanka Jalani Global Water
Partnership South Asia, Colombo, Sri Lanka.
0.5
0.52
0.54
0.56
0.58
0.6
Kumbukgate Kobeigane Rasnayakapura
Re
silie
nce
ind
ex
ASC name
Resilience index by ASC
Wijekoon et al.
256
Amarasinghe, U.A., Mutuwatta, L., Sakthivadivel, R. (1999). Water scarcity variations
within a country: a case study of Sri Lanka. Colombo, Sri Lanka: International Water
Management Institute (IWMI). vi, p.28. (IWMI Research Report 032) doi:
http://dx.doi.org/10.3910/2009.038.
Bronzoni, G. (2015). Operation and maintenance of minor irrigation tanks [on line].
[Accessed on 17.05.2016]. Available at http://www.fao.org/srilanka/news/detail-
events/en/c/343804/
Chithranayana, R.D. and Punyawardena, B.V.R. (2008). Identification of drought prone
agro-ecological regions in Sri Lanka. Journal of National Science Foundation of Sri Lanka,
36(2), 117-123.
Department of Agrarian Development (2016). Updated Database, Water Management
Division, Department of Agrarian Development, Sri Lanka. Available at http://agrariandept.gov.lk:8008/agrarian/home.jsp#
Frankenberger, T., Spangler, T., Nelson, S. and Langworthy, M. (2012). Enhancing
Resilience to Food Security Shocks in Africa [on line]. [Accessed on 20.03.16]. Available at
http://www.fsnnetwork.org/sites/default/files/discussion_paper_usaid_dfid_wb_nov._8_201
2.pdf
Gitz, V. and Meybeck, A. (2012). Risks, vulnerabilities and resilience in a context of climate
change. Building resilience for adaptation to climate change in the agriculture sector 23, p.
19.
International Water Management Institute (IWMI), (2006). Development strategy for the
irrigation sector of Sri Lanka 2006-2016. International Water Management Institute,
Colombo, Sri Lanka.
IPCC (2012). Managing the risks of extreme events and disasters to advance climate change
adaptation. A special report of working groups I and II of theIntergovernmental Panel on
Climate Change [Field, C.B., V. Barros, T.F. Stocker,D. Qin, D.J. Dokken, K.L. Ebi, M.D.
Mastrandrea, K.J. Mach, G.-K. Plattner, S.K. Allen,
M. Tignor, and P.M. Midgley (Eds.)]. Cambridge University Press, Cambridge, UK,
and New York, NY, USA, 582 pp.
Jacobson, M., Meyer, F., Oia, I., Reddy, P. and Tropp, H. (2013). User's guide on assessing
water governance. United Nations Development Program, UNDP Governance Centre,
Denmark.
Kumara, G.M.P., Samarakon, S.M.L.D., Wijewardana, Y.G.D.P., Mowjood, M.I.M. and
Galagedara, L.W. (2017). Evaluation of paddy fields system layout for other field crops in a
minor irrigation system. Trop. Agric. Res. 28(4), 364-374.
Pretty, J. (2008). Agricultural sustainability: concepts, principles and evidence.
Philosophical transactions of the royal society of London B, Biol. Sci. 363(1491), 447-465.
Resilience of Farmers at Water Shortage Situations
257
Shantha, A.A. and Ali, B.A. (2014). Economic value of irrigation water: a case of major
irrigation scheme in Sri Lanka. J. Agric. Sci. 9(1), 44-57.
Siriweera, W.I. (2002). History of Sri Lanka from Earliest Times up to the Sixteenth
Century. Dayawansa Jayakody & Company, Colombo, Sri Lanka.
Tesso, G., Emana, B. and Ketema, M. (2012). Analysis of vulnerability and resilience to
climate change induced shocks in North Shewa, Ethiopia. Agric. Sci. 3(6), 871-888.
Thilakasiri, K.R., Kumara, G.M.P., Galagedara, L.W. and Mowjood, M.I.M. (2015).
Strategies to improve water productivity in small tank system: A case study from
Kurunegala District in Sri Lanka. Trop. Agric. Res. 26(4), 684-692.
Vallée, J.C.L. (2008). CIELAP’s 4th
partnering for sustainability workshop achieving
resilient agricultural systems: Innovation, people and partnerships. The workshop of
foreshadow and feed into the United Nation’s Commission for Sustainable Development
(CSD), Ottawa, Canada.
WIjekoon, W.M.S.M., Gunawardena, E.R.N. and Aheeyar, M.M.M. (2016). Need for
institutional reforms for governance of minor irrigation systems in Sri Lanka. In proceedings
of the water professionals’ day-2016, Cap-Net Lanka, Postgraduate Institute of Agriculture
& Geo-Informatics Society of Sri Lanka, pp. 35-48.


![Water shortage[1]](https://img.pdfslide.net/doc/110x75/556132e4d8b42a263b8b46da/water-shortage1.jpg)