Embed Size (px)
Citation preview

Resiliency of Power SystemsEarthquake, Wind, Ice, Fire
John EidingerG&E Engineering Systems Inc.

What will be the duration of Power Outage?
• Where are we today?
• Earthquake: 1 Day in M 6.0 (good seismic design); 3 Days (no seismic design). 14+ Days in CSZ M 9.0; 60+ Days in Rural areas
• Wind: Weeks in Cities, Months in Rural
• Ice: Days in Cities, Months in Rural
• Fire: Months in Rural
These outages are based on ~1,000 year events, that happen “someplace” every couple of decades

SERA
System Earthquake (Wind, Ice, Fire)Risk Assessment
Nearly every 500 kV and most 230 kV substations, from British Columbia to the Mexico Border
More than 100,000 high voltage components
These outage durations apply to many of the areas
within the black oval, from the
Mexico Border in the South to the
Peace River in the North
Peace River
Imperial Valley

1948
1950
1952
1954
1956
1958
1960
1962
1964
1966
1968
1970
1972
1974
1976
1978
1980
1982
1984
1986
1988
1990
1992
1994
1996
1998
2000
2002
2004
2006
2008
0
10
20
30
40
50
60
70BP
A To
wer
Fai
lure
s Pe
r Yea
r
Year
Wind Failures
Ice Failures
BPA Tower Failures per Year, 1948 - 2010

500 kV Transmission LineDesign Basis: 100 MPH Wind (45 m/sec)
Failure

Leg 1 Bent by dragging of tower
during failure
Both tension legs had square shaped
pullout holes
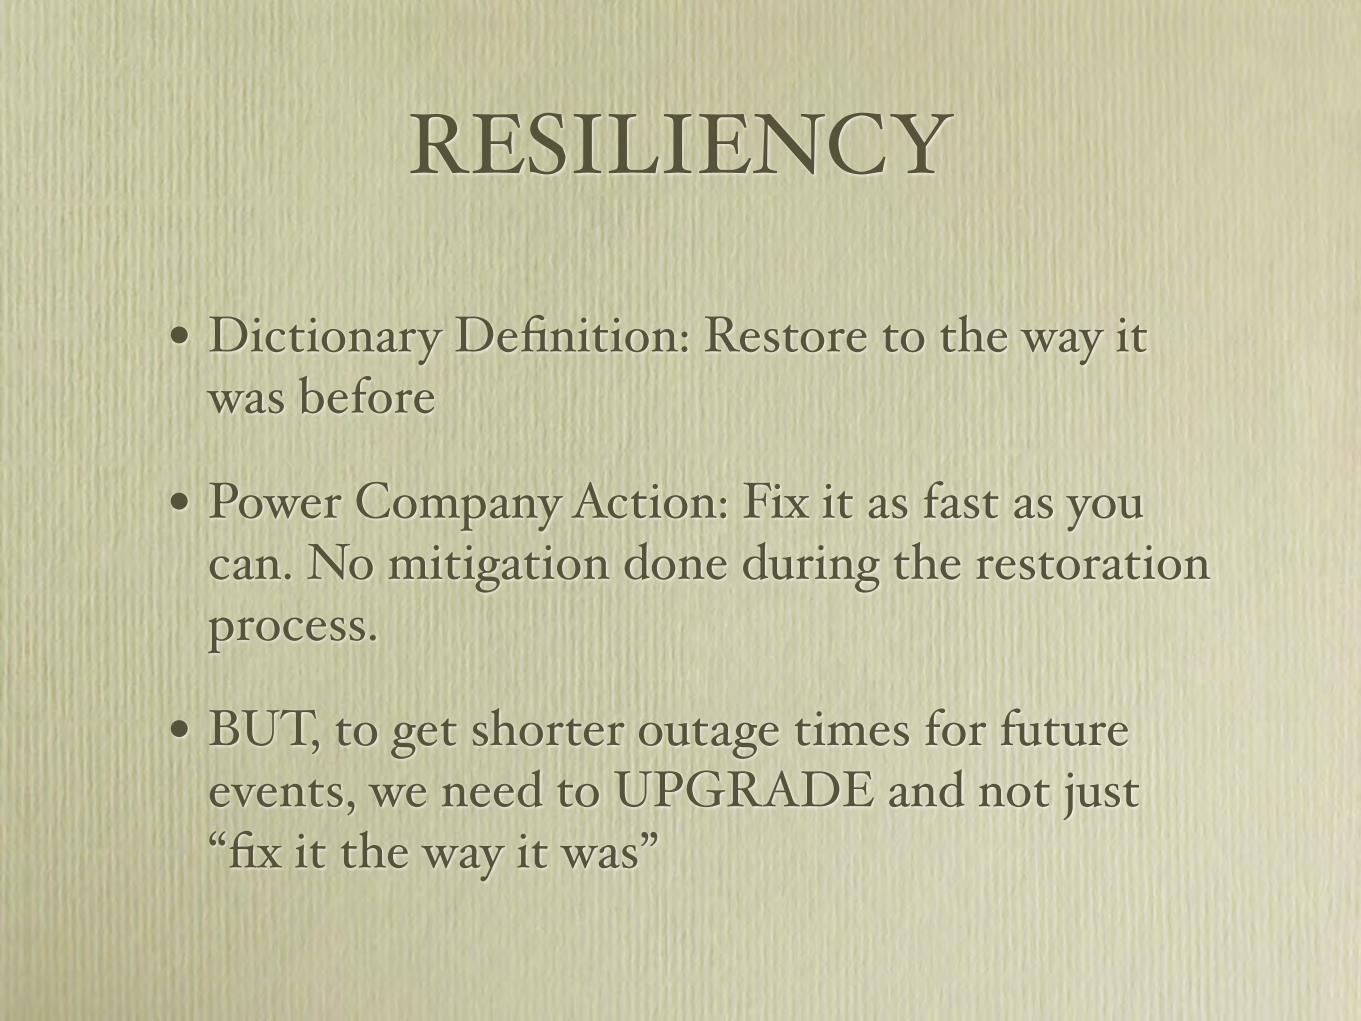
RESILIENCY
• Dictionary Definition: Restore to the way it was before
• Power Company Action: Fix it as fast as you can. No mitigation done during the restoration process.
• BUT, to get shorter outage times for future events, we need to UPGRADE and not just “fix it the way it was”


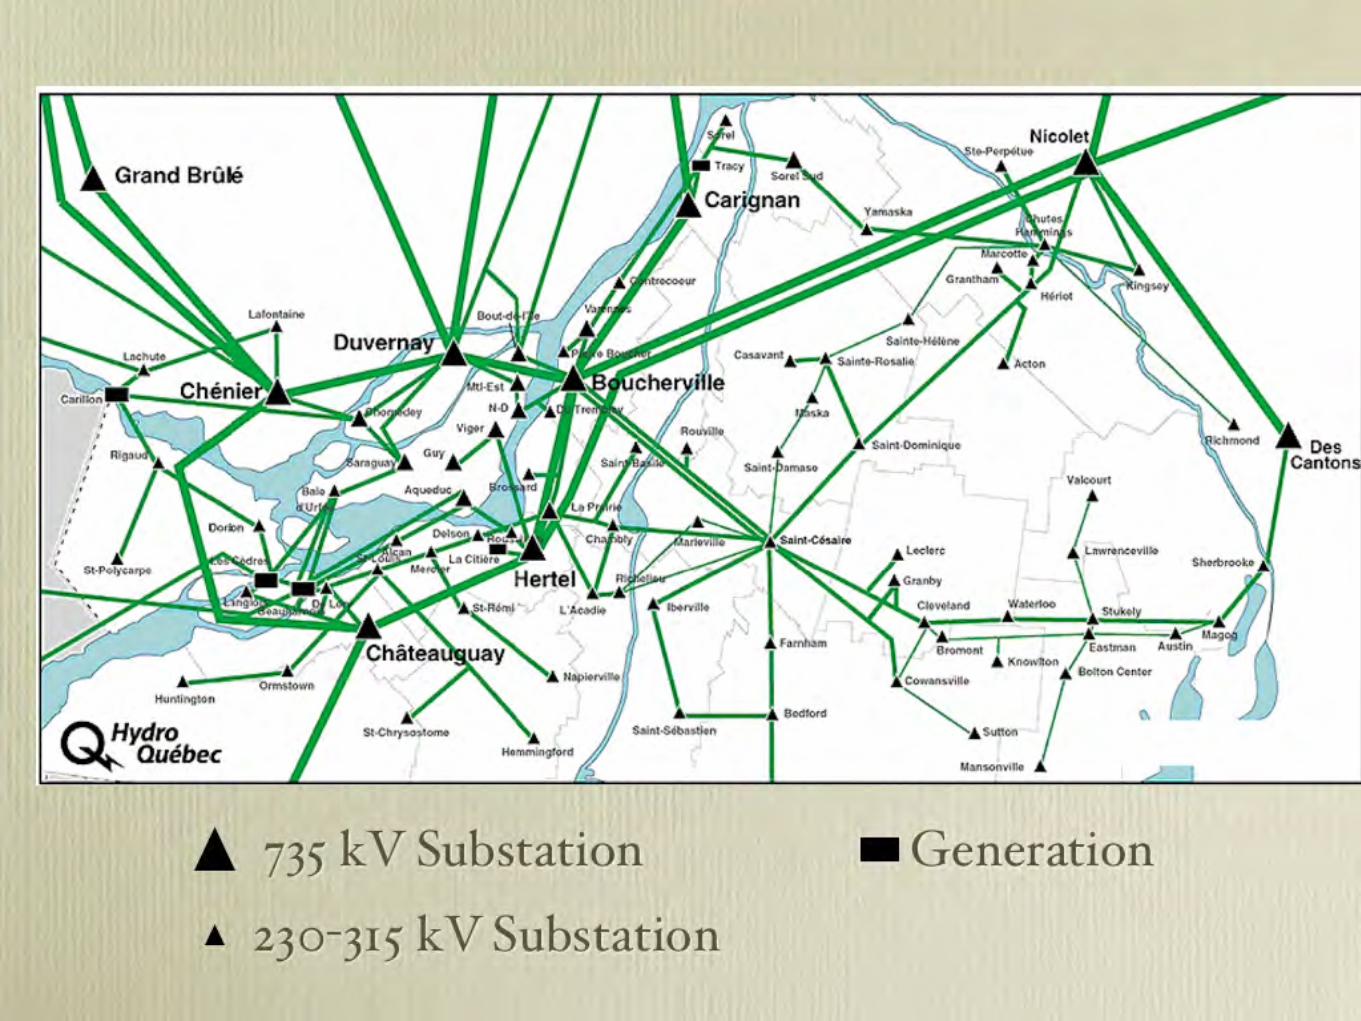
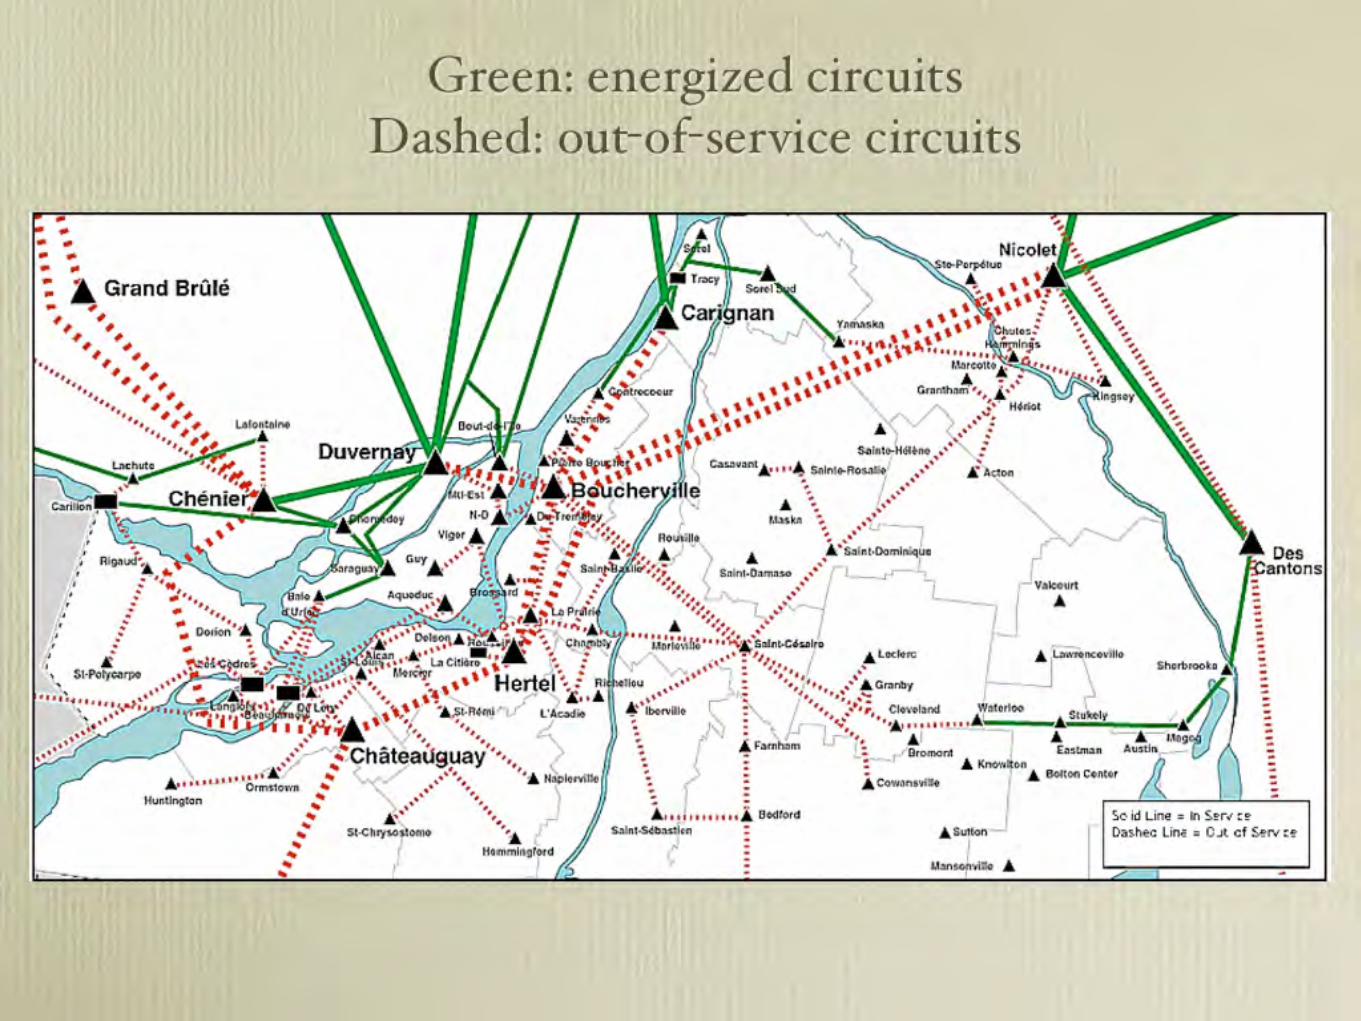
Hydro Quebec, Montreal, Canada, January 5-9, 1998
PLUS
30,000 distribution wood pole failures
EQUALS
6 month outage in some rural areas


Why did the towers fail?
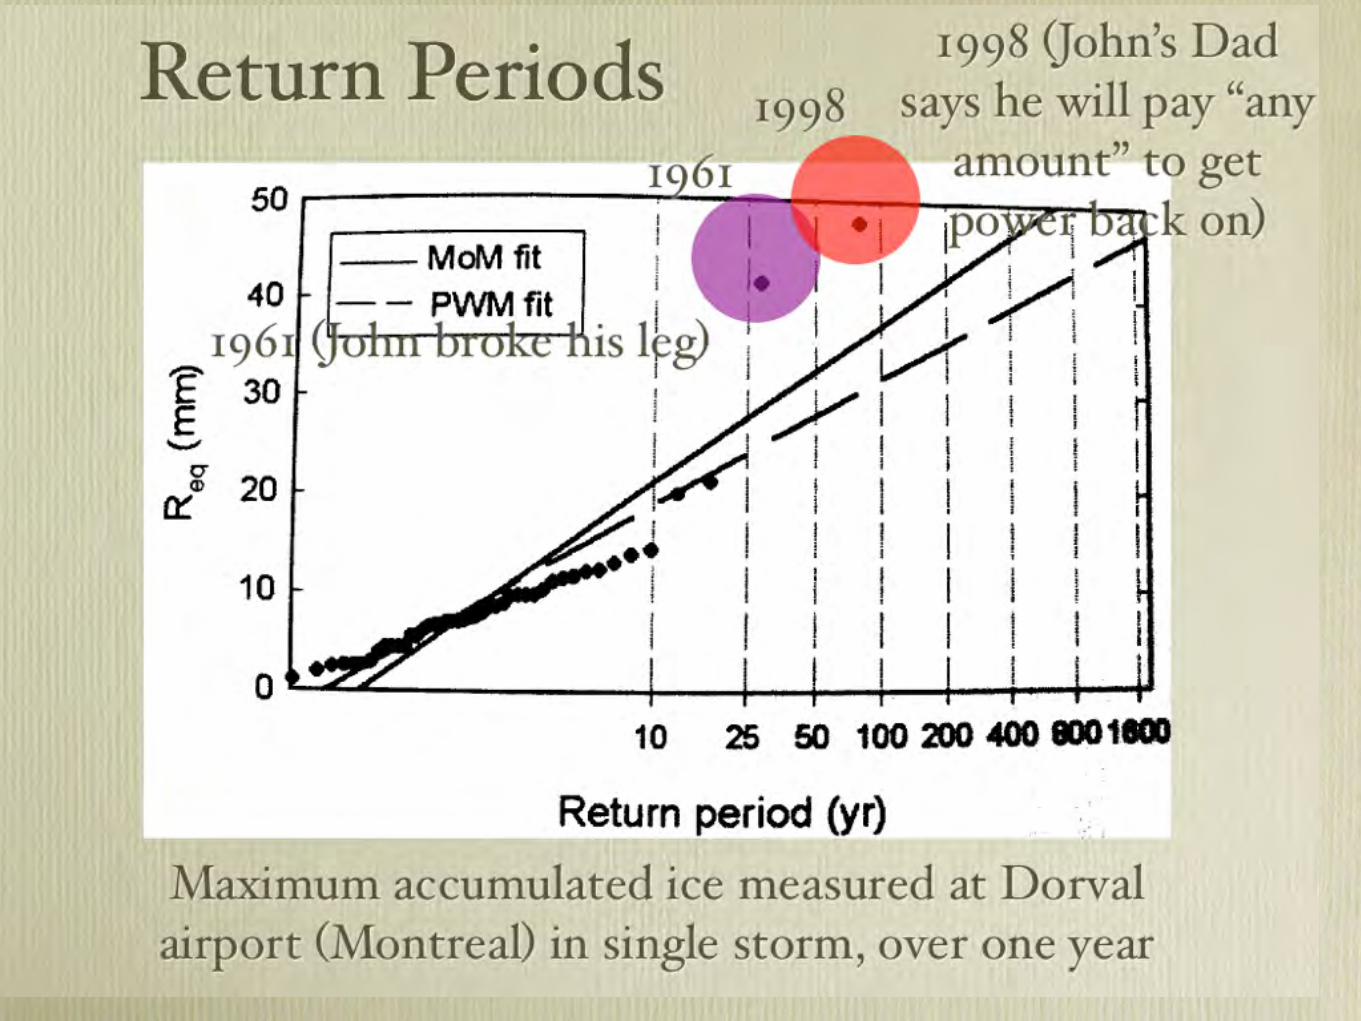
• Type II Gumbel, Lognormal, etc. are all fiction. But, we use them all the time. Worse, we use 50 years of real data to project to 1,000 to 10,000 year time frames. Superstations cannot be used to reliably predict rare events.

SERA 8.4.3.3 Third Shakemap, PGA (g), Max of NS, EW
Napa (76,915)SonomaValley (42,296)
Urban Areas (est. population as of June 2014, or latest data)
Petaluma (57,941)Fairfield (109,320)
Vallejo (118,837)
Vacaville (94,275)
San Rafael (57,713) Martinez (36,673)
Berkeley (116,768)
San Francisco (825,863)
Napa County (139,045)SonomaCounty (491,829)
Oakland (400,740)
Santa Rosa (170,685)
Rohnert Park (41,232)
Richmond (106,516)
Yountville (2,933)
St Helena (5,814)
Place Names and Populations
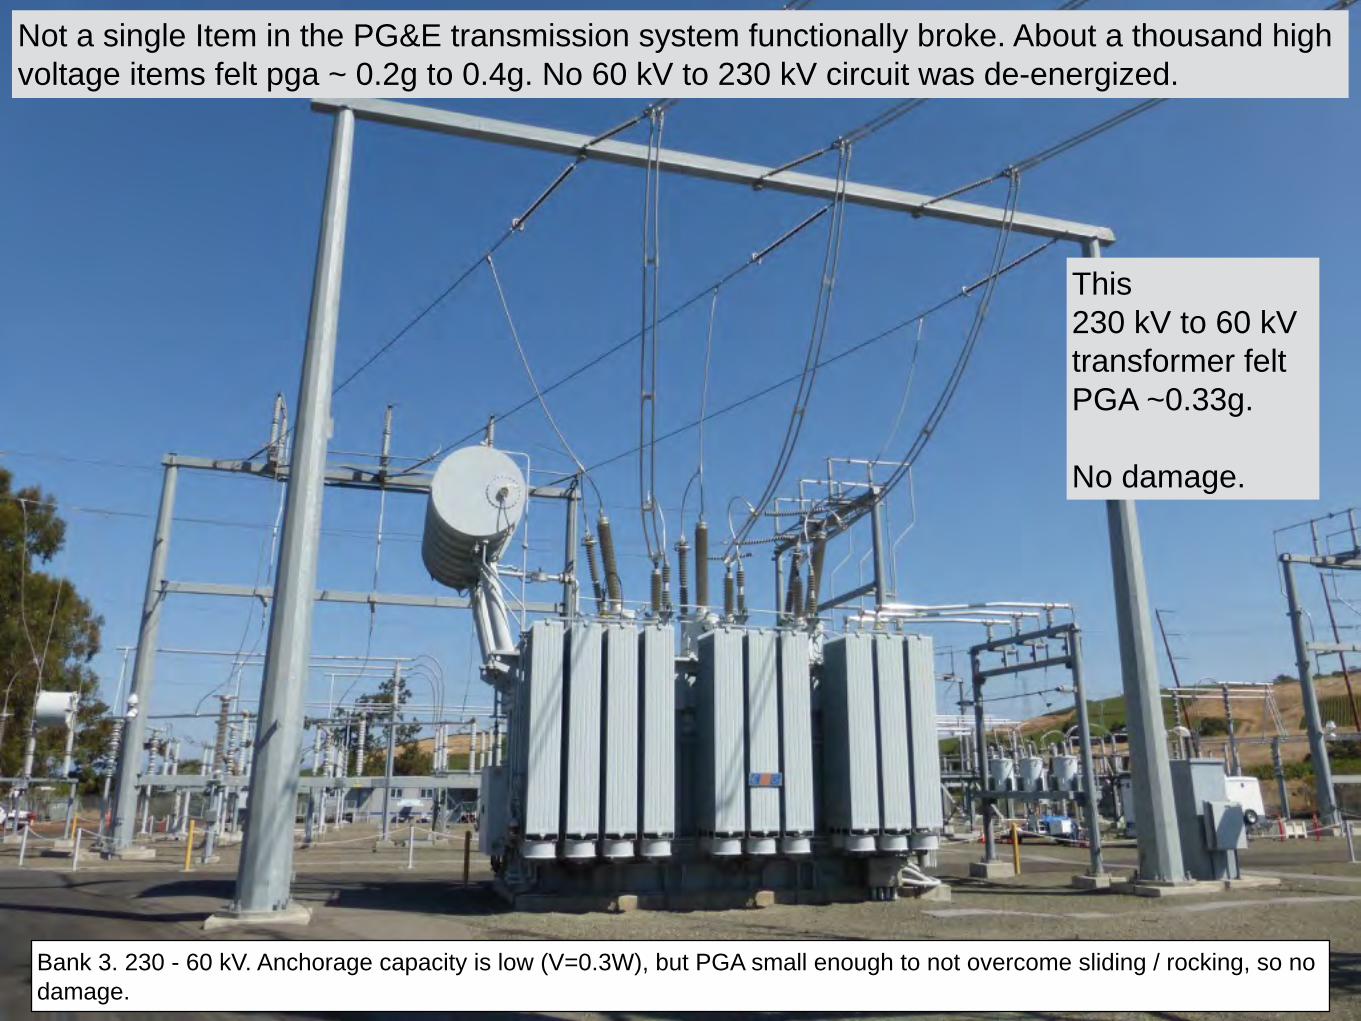
Bank 3. 230 - 60 kV. Anchorage capacity is low (V=0.3W), but PGA small enough to not overcome sliding / rocking, so no damage.
Not a single Item in the PG&E transmission system functionally broke. About a thousand high voltage items felt pga ~ 0.2g to 0.4g. No 60 kV to 230 kV circuit was de-energized.
This 230 kV to 60 kV transformer felt PGA ~0.33g.
No damage.

Power Outages - M 6.0 Napa Earthquake Aug 23 2014
NAPA 0.3g
SONOMA .15g
SANTA ROSA .05g
SAINT HELENA .05g
VALLEJO .15g
NAPA PGA = .3g
SAINT HELENA PGA < 0.05g
SANTA ROSA PGA < 0.05g
SONOMA PGA = 0.15g
VALLEJO PGA = 0.15g

Key Findings
• PG&E has ZERO damage to high voltage equipment
• Still, 70,000 customers lost power. Why?
• Distribution system. Mostly overhead. Damage is correlated to SA (T = 3.0 seconds), NOT PGA. Why? Wire slapping causes “easy to fix” short circuits.
• CAVEAT: No liquefaction in this event. Buried cables will have a different story.

Prof Anshel Schiff
He has spearheadedpower system seismicissues for 40 years.
Today, every power company in the worlduses his insights
IEEE 693Ed MatsudaDennis OstromRon TognaziniLeon Kempner
2014: more than 50engineers from dozens of companies are involved
Photo taken September 25, 2014

BushingSurge Arrestor
Cable
Brace


Map of Wildland Fires, California, 10 Acres or
More1878 - 2013
18,712 Fires
Excludes Urban Fires
Unreported FiresSmall Fires

Total Acres Burned, San Diego, 1910-2013
Is there a trend that fires are getting larger?

Trend in Number of Fires per Year, SD County
Linear regression trend line: increasing with population growth.
Governor Jerry Brown’s statements that the May 2014 fires in San Diego were a
result of Climate Change is not supported.
We need science, not political dogma!


230 kV lattice towers. No damage.Substantial burned fuel under and within ten
feet. No charring, no smoke on steel
Nearby 138 kV wood poles. More damage.

3 wood poles in fire. 1 no damage.
1 minor damage. 1 extensive damage.
Nearby house burned.
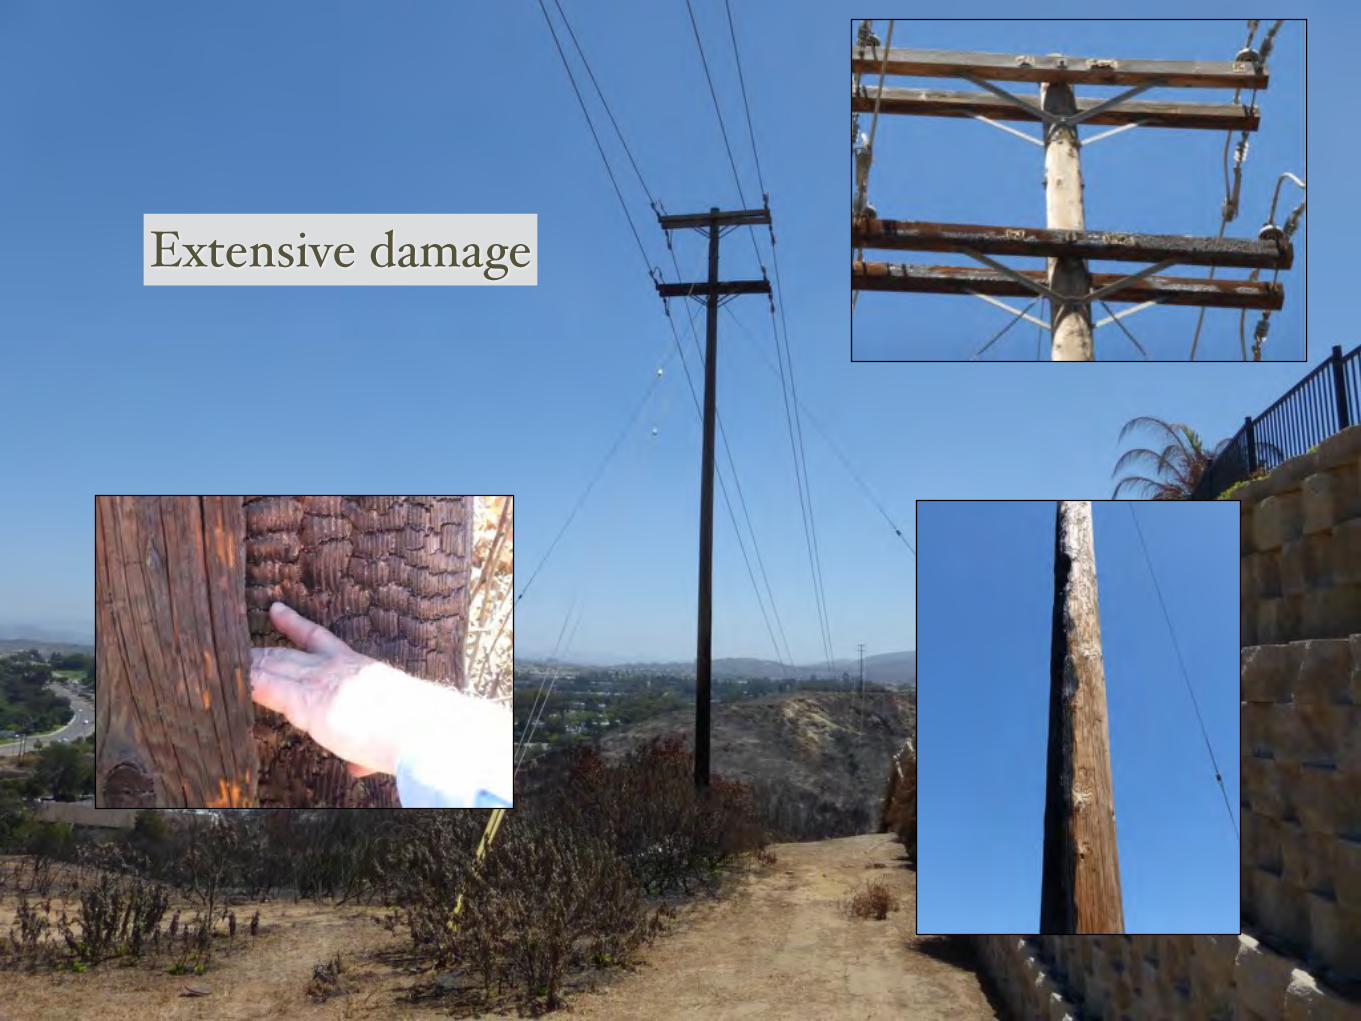
Extensive damage

Wood pole replaced

67.6$
72.4$
83.3$
88.1$
y$=$6.8164ln(x)$+$40.964$R²$=$0.90577$
25$
30$
35$
40$
45$
50$
55$
60$
65$
70$
75$
80$
85$
90$
1$ 10$ 100$ 1000$ 10000$
Maxim
um'Gust'S
peed
'(mph
)'
Median'Recurrence'Interval'(years)'
Maximum'Gust'Recurrence'at'Lindbergh'Field'Data'From'1969'C'2013'
Historical$Data$
Postulated$Based$On$Best$Fit$Line$
Log.$(Historical$Data)$
Wind Gust Data Regression Analysis - Lindbergh Field
50-year wind gust prediction: 67.6 mphNote: SDGE 50-year gust at Lindbergh = 55 mph max
100-year wind gust prediction: 72.4 mph
500-year wind gust prediction: 83.3 mph
1000-year wind gust prediction: 88.1 mph

Bay 1 Looking south

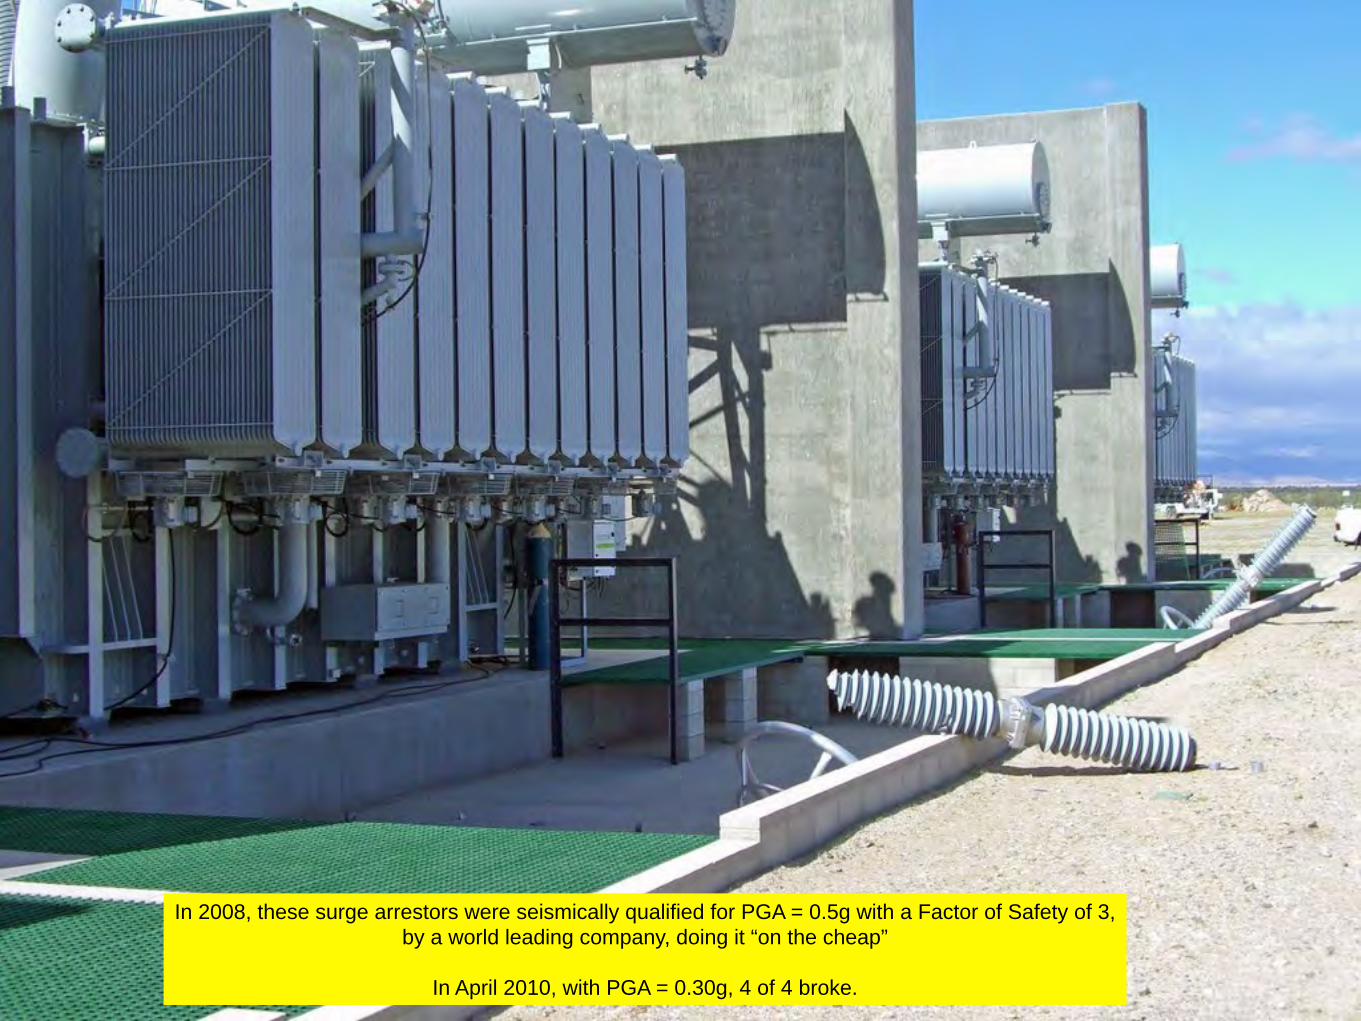
In 2008, these surge arrestors were seismically qualified for PGA = 0.5g with a Factor of Safety of 3, by a world leading company, doing it “on the cheap”
In April 2010, with PGA = 0.30g, 4 of 4 broke.

Bay 1 Phase C


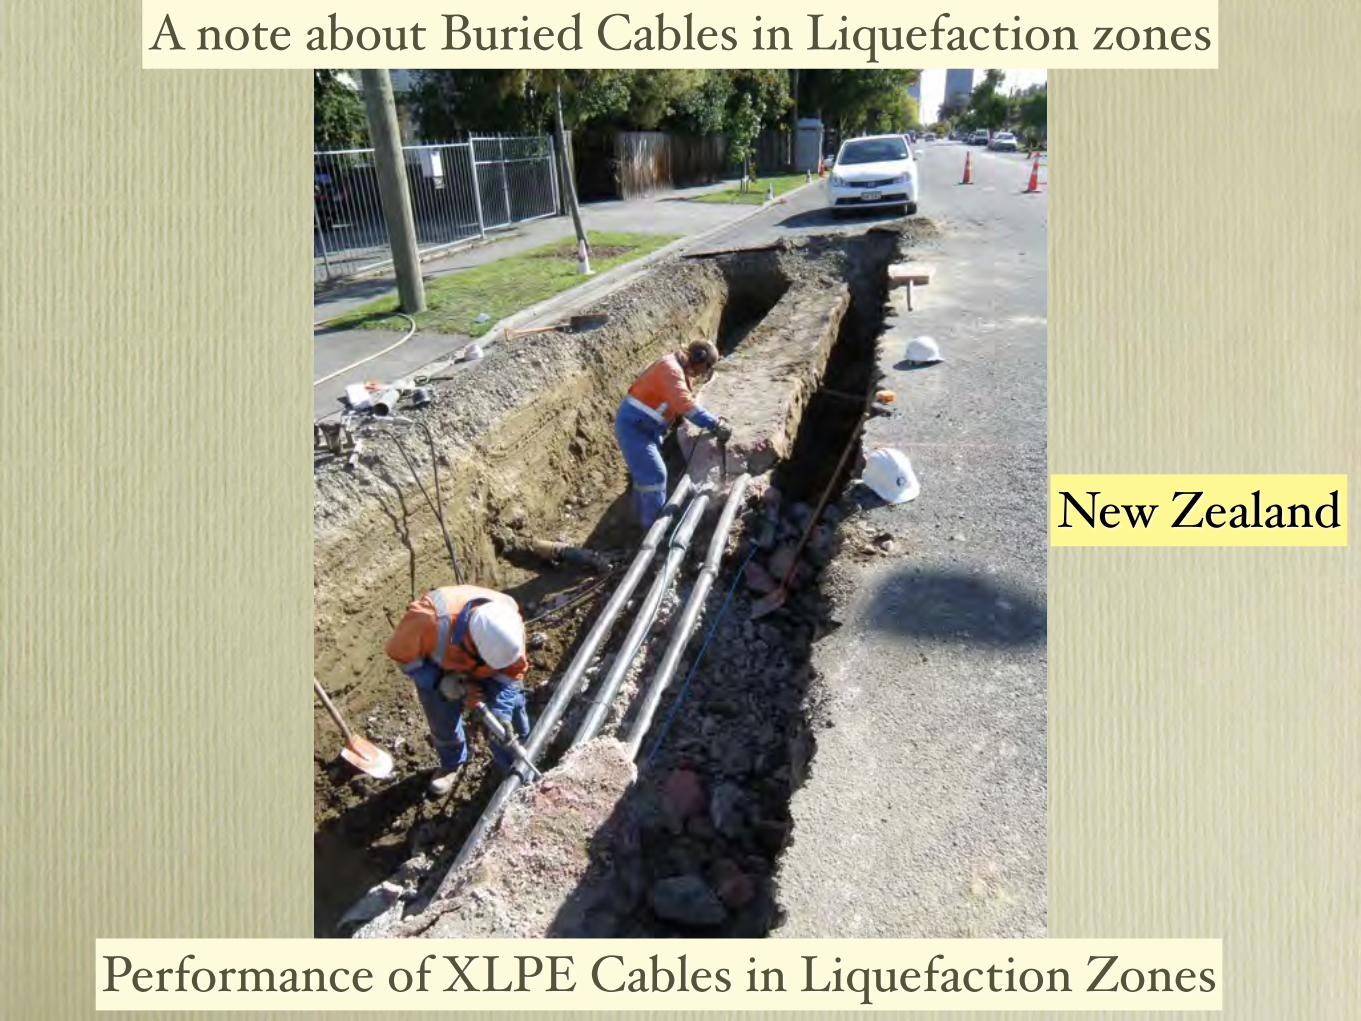
Performance of XLPE Cables in Liquefaction Zones
New Zealand
A note about Buried Cables in Liquefaction zones
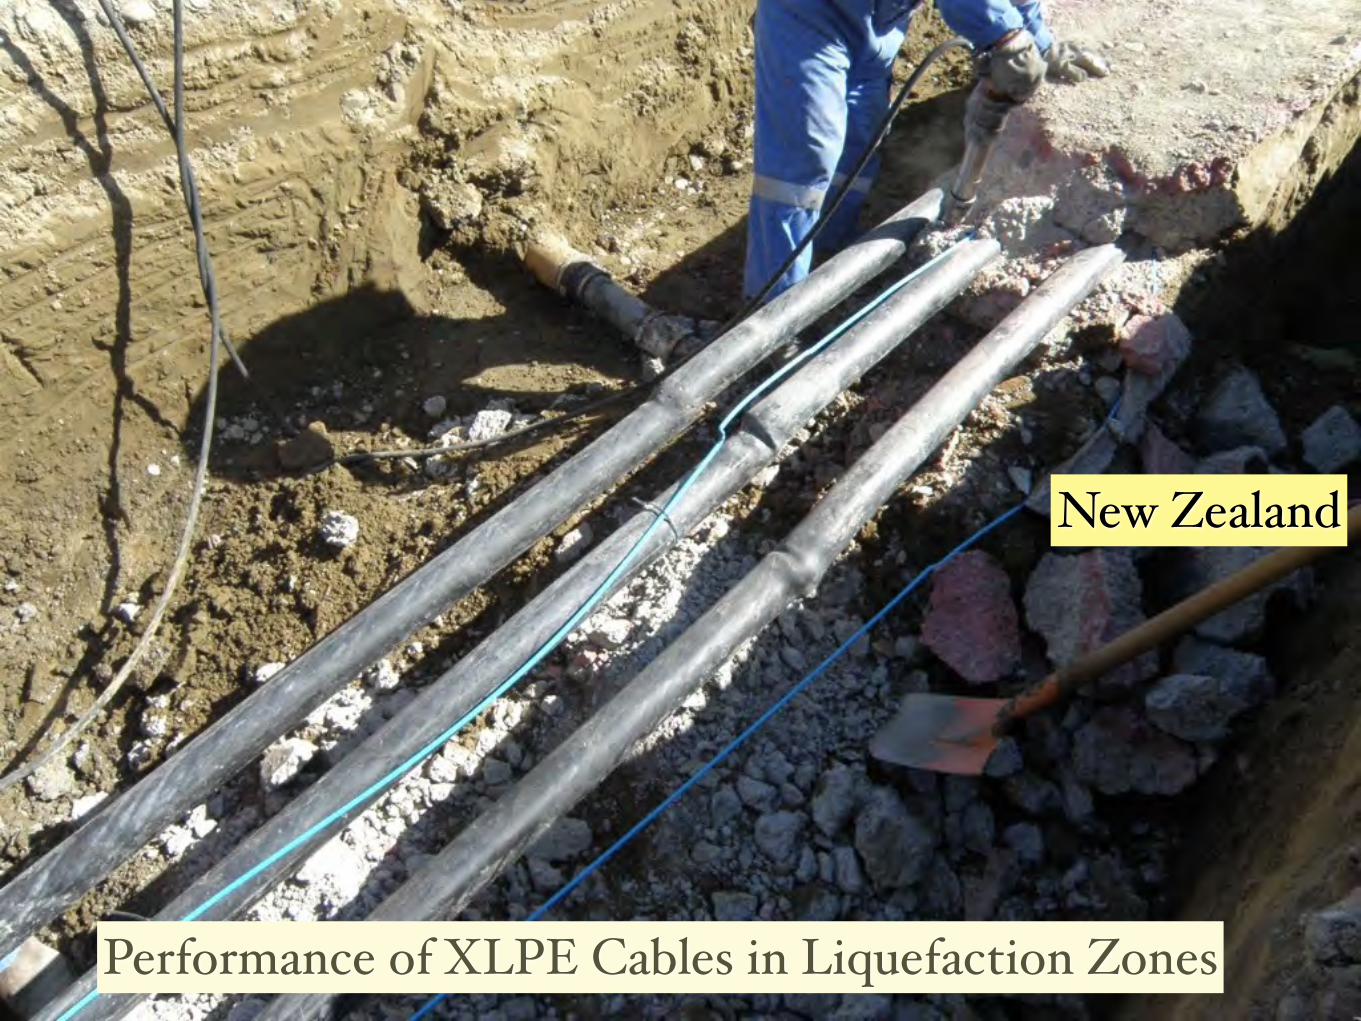
Performance of XLPE Cables in Liquefaction Zones
New Zealand

XLPE 66 kV Cable


500 kV
Unanchored

What have we learned?

What Can We do to Shorten These Outages?
• Earthquake. IEEE 693. After 20 years, look what it got PG&E in NAPA. Still, nothing for distribution, buried cables. If we want 1+ day, the cost is about $4 per month increase in electric rates, forever.
• Wind: GO 95. V = 56 mph for design in California. If we want 1,000+ wind design, Add $2 per month
• Ice: Choice 1, like Hydro Quebec. Choice 2. Design for 3 inches of radial ice. Add $1 per month.
• Fire: Months in Rural. Underground? Add $20 per month for rural customers…. won’t happen….

How can we pay to reduce power outages?
• Growing Economy. Rate Making. For $1 Billion per year to expand the network for increasing power demand, we can solve substations in <40 years.
• No Growth Economy. For long-lived items (towers, buried cables), there will be no mitigation…. unless….
• GUIDELINES are written by the industry, and the industry self-regulates, and we have 40 years. Example: IEEE 693.
• or…. the GOVERNMENT imposes requirements, and the GOVERNMENT allows 25% rate increases.

s