Embed Size (px)
Citation preview
Acta Polytechnica Hungarica Vol. 12, No. 2, 2015
– 213 –
Resistivity-induced Polarization
Receiver/Transmitter Design and PC-assisted
Data Analysis
Abdülkadir Çakır1, Seyit Akpancar
2
1Department of Electrical and Electronics Engineering, Faculty of Technology,
Suleyman Demirel University, Isparta, Turkey
E-mail: [email protected]
2Department of Computer Programming, Atabey Vocational School, Suleyman
Demirel University, Isparta, Turkey
E-mail: [email protected]
Abstract: Resistivity-induced polarization is a method that is used to identify underground
layers by resistivity. In this study, a resistivity induced polarization receiver/transmitter
device was designed using the CCS C programming language and tested. The most
outstanding feature of the implemented system is that the connection between the receiver
and the transmitter were enabled by wireless bluetooth. The data obtained by this system
were sent to a PC via wireless bluetooth connection and the data were analyzed after being
processed by a program in C# language. The system has 55 volt, 110 volt, 220 volt output
amplitudes, as direct or alternating current. The frequency of the current used in the system
is 0.1 Hz, 0.3 Hz, 1 Hz, and 3 Hz, and the signals follow the square wave amplitude form.
The system was designed to be user-friendly by LCD monitors, which were used to detect
the amplitude and frequency of the current sent to the underground.
Keywords: Resistivity IP; geological structure; resistivity; bluetooth
1 Introduction
Even today, many countries in the world intensively experience geological
formations. This dynamic structure of the underground causes landslides and
underground clearance. It is crucial for today’s technological world to forsee these
geological formations in order to identify the locations that are suitable for
residential areas.
Underground research is not conducted solely for predicting earthquakes. For
instance, in agriculture, which plays a vital role in many economies around the
world, watering is critically important. Considering that surface water agricultural
opportunities are limited in many countries around the world, this surface water
A. Çakır et al. Resistivity-induced Polarization Receiver/Transmitter Design and PC-assisted Data Analysis
– 214 –
shortage necessitates utilizing underground water supplies. Accordingly,
identifying the water supplies and productive location underground is extremely
significant regarding economics and labour force.
2 Underground Research Systems
Geophysics engineering, which studies the issues of identifying and examining the
locations of mines, minerals, fuel, natural gas, or water underground has specific
research and measuring methods. The methods used in this engineering area are
seismic, gravity, electrical-electro-magnetic, magnetic, thermal, radioactive, and
remote sensing. In the research of underground mineral resources, geophysical
methods research practices on the differences between the physical features of
minerals and the physical features of the location where these minerals are located
(density, wave velocity, electrical conductivity, and magnetic sensitivity).
The method or methods to be used in underground research is crucial for the
reliability of the results. Considering the theoretical application capacity, field
condition adeptness, and expenditure of the methods, the geoelectrical resistivity
method appears to be the most appropriate method.
Every substance in the world has specific parameters such as resistivity, density,
and specific heat. Resistivity maps of the mineral layers underground are drawn
via the electrical resistivity method, which calculates the resistivity of the
substances, which are located as layers underground, to an electric current. These
maps illustrate water resources, fuel, or various metal reservoirs underground [1].
Today, the developments in electrical resistivity systems require employing
computational methods in the phase of the evaluation of the data. In particular, the
basic algorithms, in which forward and inversion modelling are used in the
evaluation of geophysical data, require computational assessment. A direct
formula is the basic evaluation approach of geophysics, which is described as the
assessment of the reaction caused by a model, starting from an underground model
with known parameters [2].
Finite differences and elements methods are becoming the most popular
computational methods in forward modelling. These developments in
computational assessments enable point and two-dimensional electronic data
assessments to be realized to facilitate electrode permutation.
2.1 Electrical Resistivity
Underground geological substances have characteristic features such as resistivity,
acoustical impedance, magnetic sensitivity, and density. In the chemical structure
of the substance, resistivity differs according to the types and strength of the
Acta Polytechnica Hungarica Vol. 12, No. 2, 2015
– 215 –
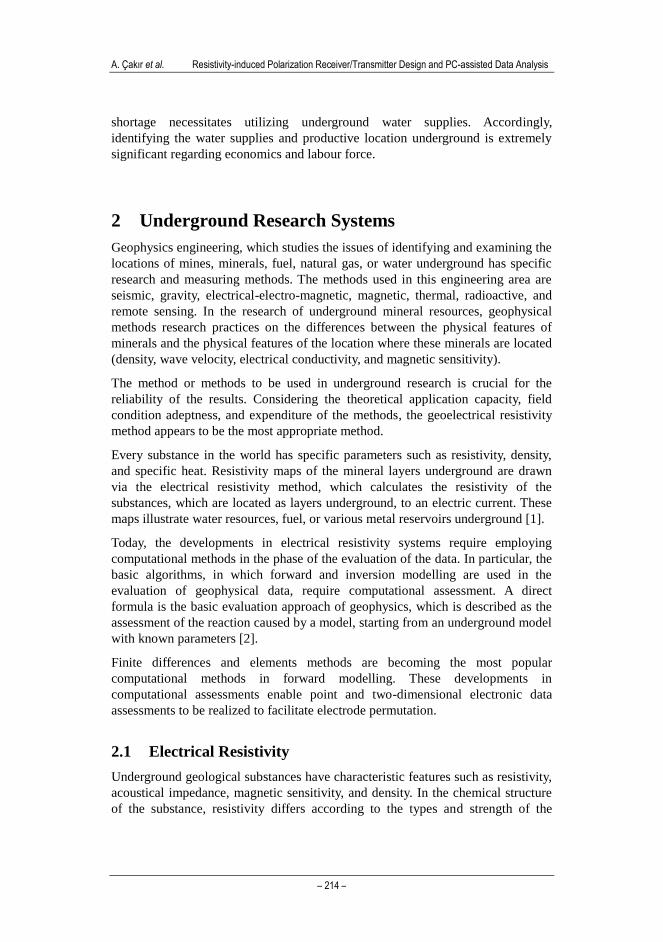
fastening points of atomic bonds. The bonding strength of the atomic bonds reveal
electrical resistivity, which is specific to the substance, according to the reactive
resistivity that the substance shows towards the current [3]. Table 1 shows the
electrical resistivity of some substances in the ground.
Table 1
Electrical resistivity of some of the substances
Element Resistivity (Ωm) Element Resistivity (Ωm)
Chalcopyrite 1,5x10⁻⁵ - 3x10⁻¹ Soil (Top) 250 - 1700
Pyrite 2,9x10⁻⁵ - 1,5 Dry Sandy Soil 80 - 1050
Hematite 3,5x10⁻³ - 107 Sand and Gravel 30 - 225
Limonite 103-107 Silt (Dry) 1400
Ilmenite 10-3 - 5x10 Silt (Saturated) 100
Rock Salt 3x10² - 1013 Marble 102 - 2,5x10⁸
Hard Coal 10-3 - 2x10⁵ Sandstone 1 - 7,4x10⁸
Granite 3x10² - 106 Limestone 5x10 - 107
Sand(40%shale) 8 Dolomite 3,5x10² - 5x10³
Sea Water 3x10⁻¹ Alluvium and Sand 10 - 8x10²
Lignite 9 - 2x10² Pure Ground Water 10 - 100
3 Geoelectrical Methods Used in Underground
Research
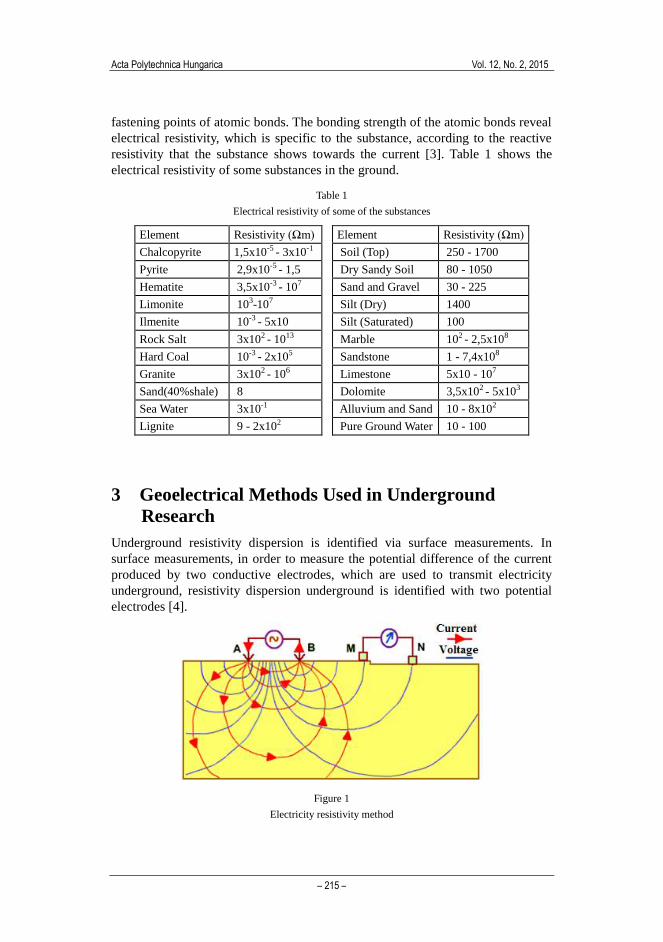
Underground resistivity dispersion is identified via surface measurements. In
surface measurements, in order to measure the potential difference of the current
produced by two conductive electrodes, which are used to transmit electricity
underground, resistivity dispersion underground is identified with two potential
electrodes [4].
Figure 1
Electricity resistivity method
A. Çakır et al. Resistivity-induced Polarization Receiver/Transmitter Design and PC-assisted Data Analysis
– 216 –
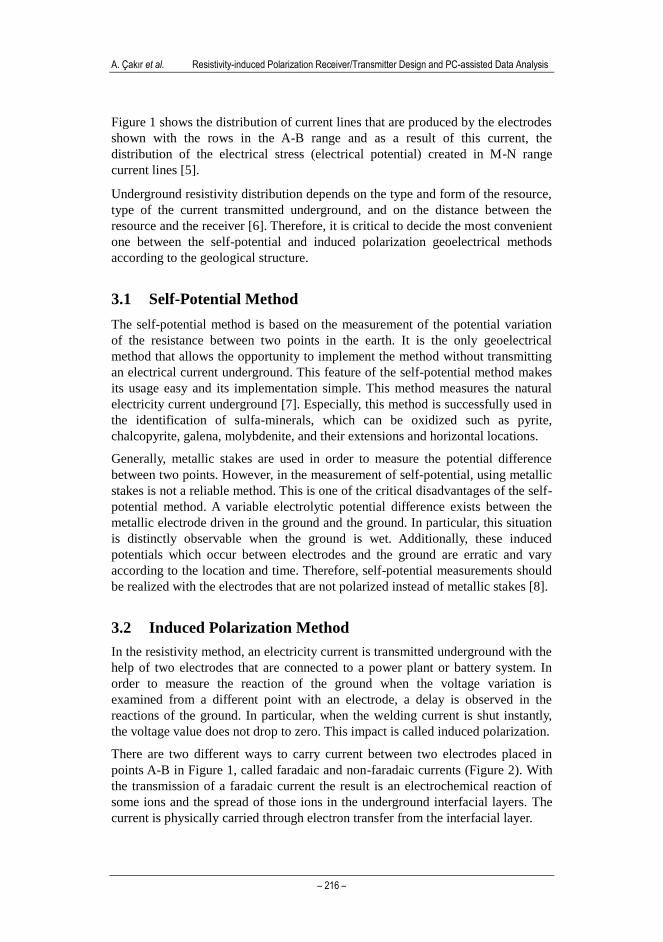
Figure 1 shows the distribution of current lines that are produced by the electrodes
shown with the rows in the A-B range and as a result of this current, the
distribution of the electrical stress (electrical potential) created in M-N range
current lines [5].
Underground resistivity distribution depends on the type and form of the resource,
type of the current transmitted underground, and on the distance between the
resource and the receiver [6]. Therefore, it is critical to decide the most convenient
one between the self-potential and induced polarization geoelectrical methods
according to the geological structure.
3.1 Self-Potential Method
The self-potential method is based on the measurement of the potential variation
of the resistance between two points in the earth. It is the only geoelectrical
method that allows the opportunity to implement the method without transmitting
an electrical current underground. This feature of the self-potential method makes
its usage easy and its implementation simple. This method measures the natural
electricity current underground [7]. Especially, this method is successfully used in
the identification of sulfa-minerals, which can be oxidized such as pyrite,
chalcopyrite, galena, molybdenite, and their extensions and horizontal locations.
Generally, metallic stakes are used in order to measure the potential difference
between two points. However, in the measurement of self-potential, using metallic
stakes is not a reliable method. This is one of the critical disadvantages of the self-
potential method. A variable electrolytic potential difference exists between the
metallic electrode driven in the ground and the ground. In particular, this situation
is distinctly observable when the ground is wet. Additionally, these induced
potentials which occur between electrodes and the ground are erratic and vary
according to the location and time. Therefore, self-potential measurements should
be realized with the electrodes that are not polarized instead of metallic stakes [8].
3.2 Induced Polarization Method
In the resistivity method, an electricity current is transmitted underground with the
help of two electrodes that are connected to a power plant or battery system. In
order to measure the reaction of the ground when the voltage variation is
examined from a different point with an electrode, a delay is observed in the
reactions of the ground. In particular, when the welding current is shut instantly,
the voltage value does not drop to zero. This impact is called induced polarization.
There are two different ways to carry current between two electrodes placed in
points A-B in Figure 1, called faradaic and non-faradaic currents (Figure 2). With
the transmission of a faradaic current the result is an electrochemical reaction of
some ions and the spread of those ions in the underground interfacial layers. The
current is physically carried through electron transfer from the interfacial layer.
Acta Polytechnica Hungarica Vol. 12, No. 2, 2015
– 217 –
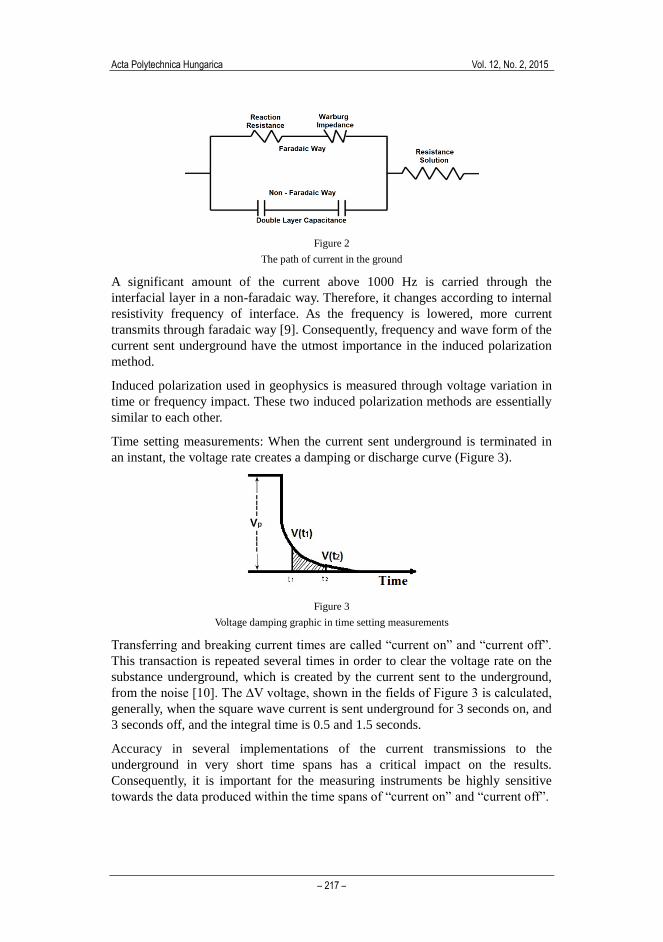
Figure 2
The path of current in the ground
A significant amount of the current above 1000 Hz is carried through the
interfacial layer in a non-faradaic way. Therefore, it changes according to internal
resistivity frequency of interface. As the frequency is lowered, more current
transmits through faradaic way [9]. Consequently, frequency and wave form of the
current sent underground have the utmost importance in the induced polarization
method.
Induced polarization used in geophysics is measured through voltage variation in
time or frequency impact. These two induced polarization methods are essentially
similar to each other.
Time setting measurements: When the current sent underground is terminated in
an instant, the voltage rate creates a damping or discharge curve (Figure 3).
Figure 3
Voltage damping graphic in time setting measurements
Transferring and breaking current times are called “current on” and “current off”.
This transaction is repeated several times in order to clear the voltage rate on the
substance underground, which is created by the current sent to the underground,
from the noise [10]. The ∆V voltage, shown in the fields of Figure 3 is calculated,
generally, when the square wave current is sent underground for 3 seconds on, and
3 seconds off, and the integral time is 0.5 and 1.5 seconds.
Accuracy in several implementations of the current transmissions to the
underground in very short time spans has a critical impact on the results.
Consequently, it is important for the measuring instruments be highly sensitive
towards the data produced within the time spans of “current on” and “current off”.
A. Çakır et al. Resistivity-induced Polarization Receiver/Transmitter Design and PC-assisted Data Analysis
– 218 –
This method is fully accomplished by the identification of sulphuric mineral strata,
and underground water, and ground studies.
Frequency environment measurement: Induced polarization impacts are observed
in frequency environments as well. By and large, measurements realized in the
frequency environment are below 10 Hz. The current is transmitted underground
at two different frequencies. The frequency of the first current should be rather
low (close to direct current). The visible resistance values in these two frequencies
are called frequency effect (FE). Frequency effect is calculated with equation 1.
𝐹𝐸 =[𝜌𝐷𝐶−𝜌𝐴𝐶]
𝜌𝐴𝐶
(1)
𝐹𝐸: Frequency effect
𝜌𝐴𝐶 : Visible resistivity value at high frequency
𝜌𝐷𝐶 : Visible resistivity value at low frequency
In practice, the value of one frequency is ten times higher than the value of other
frequency, such as f1=0.1 Hz, f2=1.
Frequency effect is also called frequency effect percentage (FEP) as in equation 2.
𝐹𝐸𝑃 = 100 × 𝐹𝐸 (2)
FEP: Frequency effect percentage
FE: Frequency effect
Another parameter used in the frequency setting method is metallic factor. The
metallic factor is proposed in order to minimize the effects of the parameters, such
as, electrolyte, heat, and pore size. The metallic factor is calculated through
equation3 [10].
𝑀𝐹 =𝐹𝐸𝑃
𝜌𝐷𝐶
× 2𝜋 × 103 (3)
𝑀𝐹: Metallic factor
FEP: Frequency effect percentage
𝜌𝐷𝐶: Visible resistivity value at lower frequencies
In frequency setting measurements, by examining the changes of the values of
visible resistivity and the metallic factor, the location of the mineral stratum is
ascertained. This process usually depends on the principle that as the frequency of
the current sent underground increases, the resistance of the rocks underground
decreases. The induced polarization effect is mostly seen between the frequencies
of 0.1 and 20 Hz [9]. Higher frequencies are not preferred because of their high
electromagnetic induction effect.
Acta Polytechnica Hungarica Vol. 12, No. 2, 2015
– 219 –
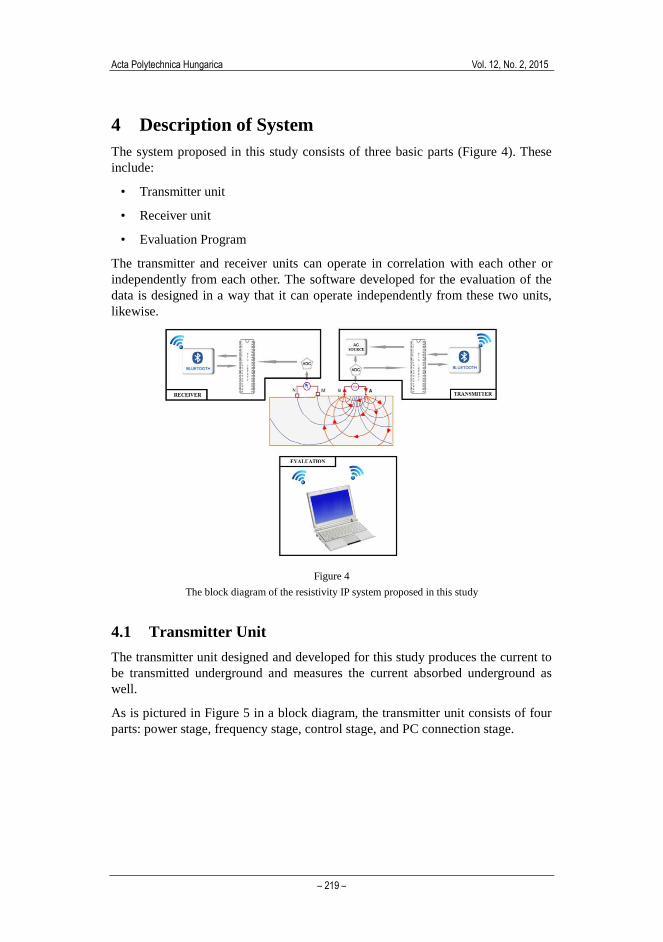
4 Description of System
The system proposed in this study consists of three basic parts (Figure 4). These
include:
• Transmitter unit
• Receiver unit
• Evaluation Program
The transmitter and receiver units can operate in correlation with each other or
independently from each other. The software developed for the evaluation of the
data is designed in a way that it can operate independently from these two units,
likewise.
Figure 4
The block diagram of the resistivity IP system proposed in this study
4.1 Transmitter Unit
The transmitter unit designed and developed for this study produces the current to
be transmitted underground and measures the current absorbed underground as
well.
As is pictured in Figure 5 in a block diagram, the transmitter unit consists of four
parts: power stage, frequency stage, control stage, and PC connection stage.
A. Çakır et al. Resistivity-induced Polarization Receiver/Transmitter Design and PC-assisted Data Analysis
– 220 –
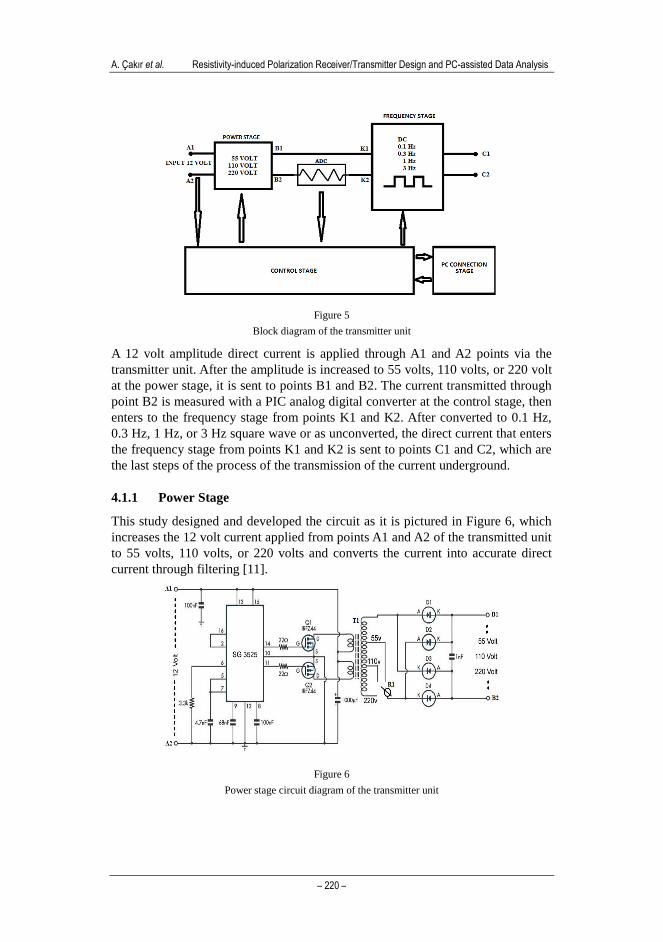
Figure 5
Block diagram of the transmitter unit
A 12 volt amplitude direct current is applied through A1 and A2 points via the
transmitter unit. After the amplitude is increased to 55 volts, 110 volts, or 220 volt
at the power stage, it is sent to points B1 and B2. The current transmitted through
point B2 is measured with a PIC analog digital converter at the control stage, then
enters to the frequency stage from points K1 and K2. After converted to 0.1 Hz,
0.3 Hz, 1 Hz, or 3 Hz square wave or as unconverted, the direct current that enters
the frequency stage from points K1 and K2 is sent to points C1 and C2, which are
the last steps of the process of the transmission of the current underground.
4.1.1 Power Stage
This study designed and developed the circuit as it is pictured in Figure 6, which
increases the 12 volt current applied from points A1 and A2 of the transmitted unit
to 55 volts, 110 volts, or 220 volts and converts the current into accurate direct
current through filtering [11].
Figure 6
Power stage circuit diagram of the transmitter unit

Acta Polytechnica Hungarica Vol. 12, No. 2, 2015
– 221 –
In the circuit, a 100 Hz square wave signal, which is produced through a SG3525
integrated unit, is applied to the primary windings of the T1 transformator through
Q1 and Q2 power MOSFETs (metal oxide semiconductor field effect transistors).
The MOSFETs used in the circuit are resistant up to a 50 ampere current [12].In
order to prevent the MOSFETs from being destroyed in the case that they overheat
when a high current is drawn, MOSFETs are looped to heatsinks.
A 12 volt voltage applied from the primary winding of the T1 transformator is
converted to 55 volt, 110 volt, and 220 volt at the secondary winding. The R1
relay is responsible for selecting the transformed voltages. A 100 Hz voltage
alternating current chosen by the R1 relay is transformed into a direct current
through diodes D1, D2, D3, and D4 and sent to points B1 and B2.
4.1.2 Frequency Stage
DC current in the power stage is used to convert 0.1 Hz, 0.3 Hz, 1 Hz or 3 Hz
square wave by the circuit in Figure 7.
Figure 7
Frequency stage circuit diagram of the transmitter unit
The 0.1 Hz, 0.3 Hz, 1 Hz, or 3 Hz frequency signal is generated by using the CCS
C programming language in the PIC16F877 microcontroller and inverter circuit,
as shown in Figure 7.
When point F1 of the inverter circuit is logic-1, the Q3 and Q6 MOSFETs are
switched; when point F2 is logic-1, the Q4 and Q5 MOSFETs are switched. The
direct current derived from the power stage, which is looped to points K1 and K2,
is transformed into the square wave form at the C1 and C2 collector points
through the double cross switching of the MOSFETs. The waveforms in Figure 8
are the square wave forms, which are observed through the oscilloscope at the
C1and C2 collector points.
A. Çakır et al. Resistivity-induced Polarization Receiver/Transmitter Design and PC-assisted Data Analysis
– 222 –
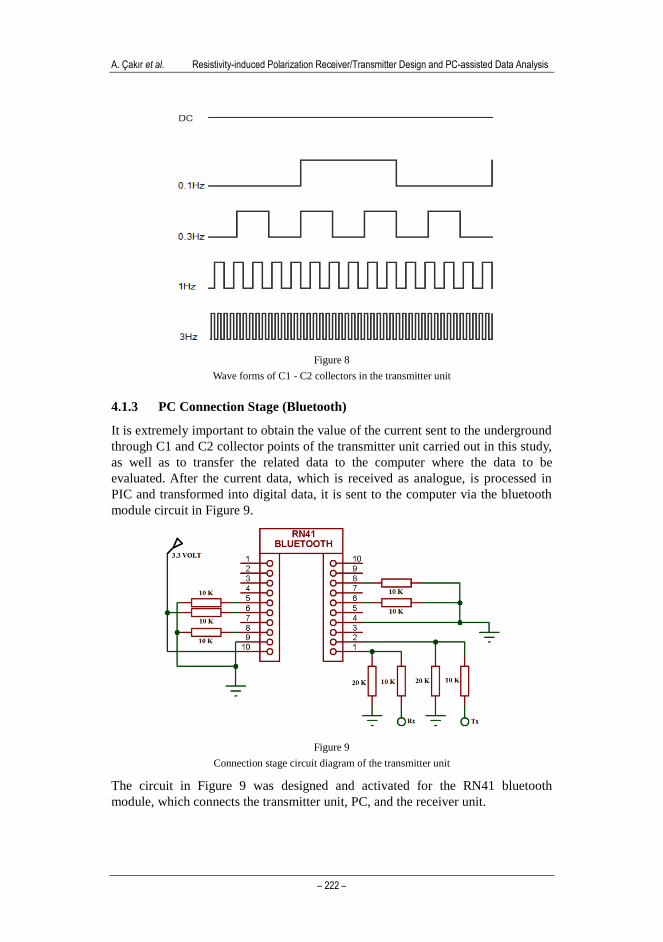
Figure 8
Wave forms of C1 - C2 collectors in the transmitter unit
4.1.3 PC Connection Stage (Bluetooth)
It is extremely important to obtain the value of the current sent to the underground
through C1 and C2 collector points of the transmitter unit carried out in this study,
as well as to transfer the related data to the computer where the data to be
evaluated. After the current data, which is received as analogue, is processed in
PIC and transformed into digital data, it is sent to the computer via the bluetooth
module circuit in Figure 9.
Figure 9
Connection stage circuit diagram of the transmitter unit
The circuit in Figure 9 was designed and activated for the RN41 bluetooth
module, which connects the transmitter unit, PC, and the receiver unit.
Acta Polytechnica Hungarica Vol. 12, No. 2, 2015
– 223 –
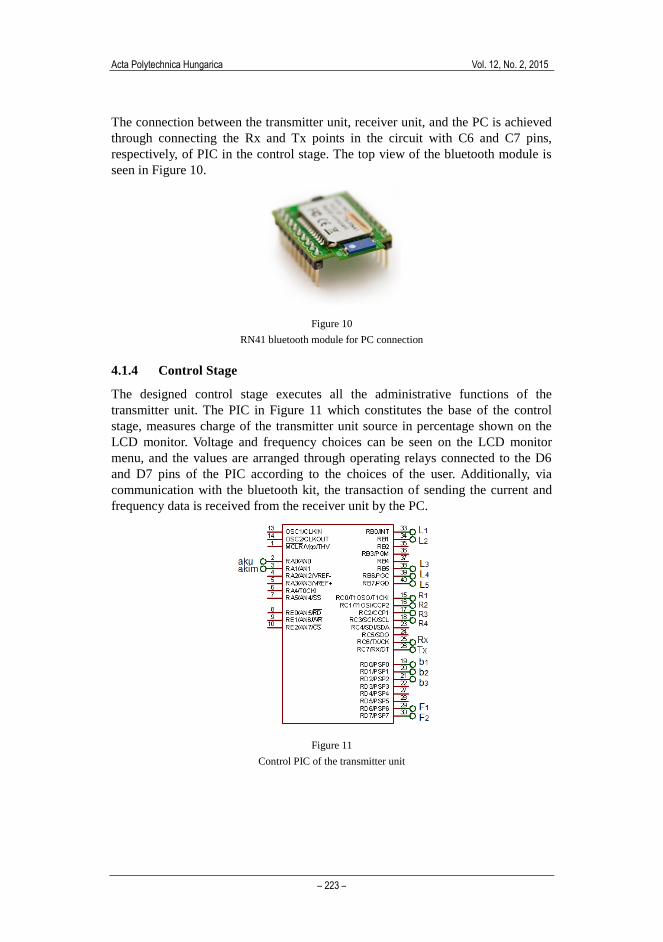
The connection between the transmitter unit, receiver unit, and the PC is achieved
through connecting the Rx and Tx points in the circuit with C6 and C7 pins,
respectively, of PIC in the control stage. The top view of the bluetooth module is
seen in Figure 10.
Figure 10
RN41 bluetooth module for PC connection
4.1.4 Control Stage
The designed control stage executes all the administrative functions of the
transmitter unit. The PIC in Figure 11 which constitutes the base of the control
stage, measures charge of the transmitter unit source in percentage shown on the
LCD monitor. Voltage and frequency choices can be seen on the LCD monitor
menu, and the values are arranged through operating relays connected to the D6
and D7 pins of the PIC according to the choices of the user. Additionally, via
communication with the bluetooth kit, the transaction of sending the current and
frequency data is received from the receiver unit by the PC.
Figure 11
Control PIC of the transmitter unit
A. Çakır et al. Resistivity-induced Polarization Receiver/Transmitter Design and PC-assisted Data Analysis
– 224 –
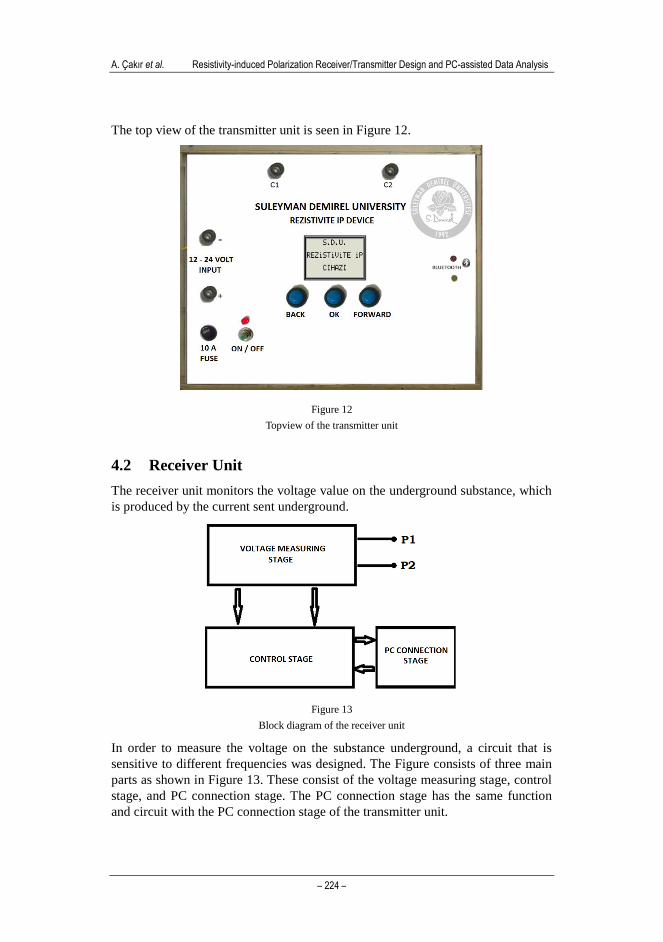
The top view of the transmitter unit is seen in Figure 12.
Figure 12
Topview of the transmitter unit
4.2 Receiver Unit
The receiver unit monitors the voltage value on the underground substance, which
is produced by the current sent underground.
Figure 13
Block diagram of the receiver unit
In order to measure the voltage on the substance underground, a circuit that is
sensitive to different frequencies was designed. The Figure consists of three main
parts as shown in Figure 13. These consist of the voltage measuring stage, control
stage, and PC connection stage. The PC connection stage has the same function
and circuit with the PC connection stage of the transmitter unit.

Acta Polytechnica Hungarica Vol. 12, No. 2, 2015
– 225 –
Figure 14
Circuit diagram of the voltage measuring stage of the receiver unit
The A1 and A2 ADC input of the PIC16F877 microcontroller used in the receiver
unit circuit, which is pictured in Figure 14, is designed in a way that it receives
voltage data in an analogue format from underground. The voltage value received
from underground is sent to a PC via the PC connection stage, which is connected
to the PIC.
A topview of the receiver unit is seen in Figure 15.
Figure 15
Topview of the receiver unit
4.3 Computer Software
Visual Studio editor software was used to evaluate the data received from the
transmitter and receiver units.
A. Çakır et al. Resistivity-induced Polarization Receiver/Transmitter Design and PC-assisted Data Analysis
– 226 –
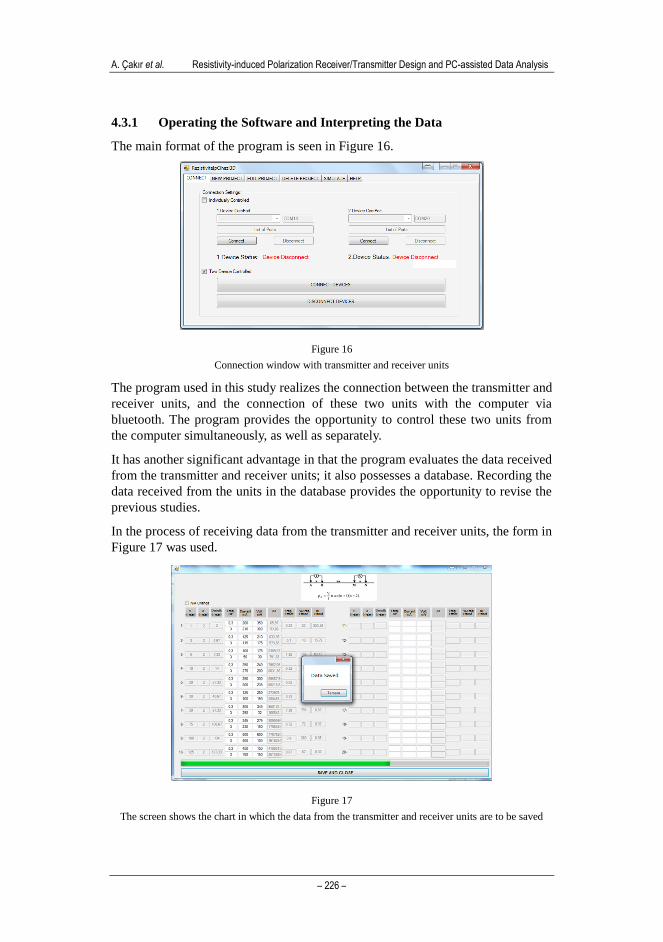
4.3.1 Operating the Software and Interpreting the Data
The main format of the program is seen in Figure 16.
Figure 16
Connection window with transmitter and receiver units
The program used in this study realizes the connection between the transmitter and
receiver units, and the connection of these two units with the computer via
bluetooth. The program provides the opportunity to control these two units from
the computer simultaneously, as well as separately.
It has another significant advantage in that the program evaluates the data received
from the transmitter and receiver units; it also possesses a database. Recording the
data received from the units in the database provides the opportunity to revise the
previous studies.
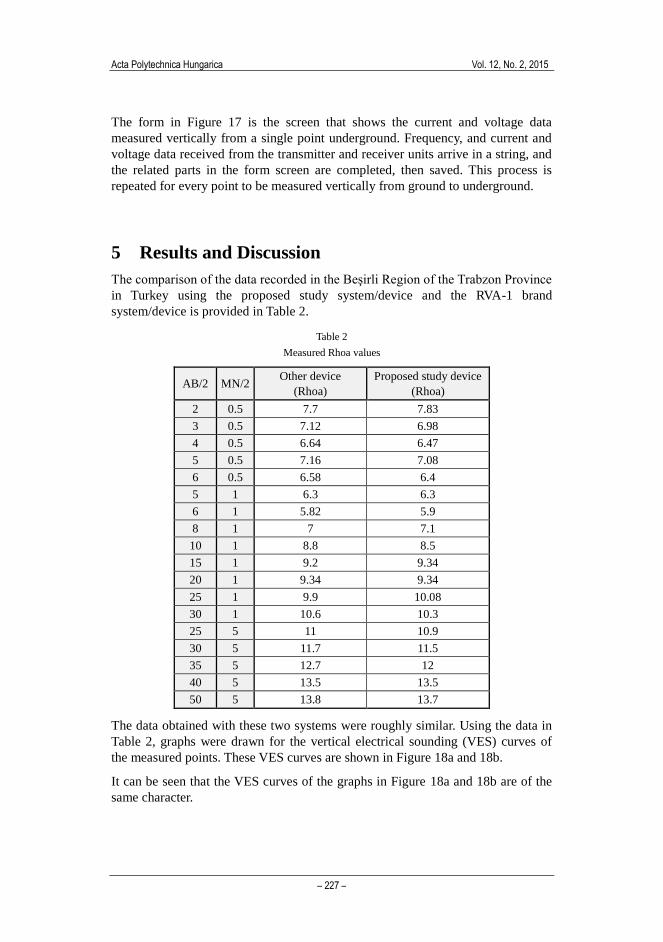
In the process of receiving data from the transmitter and receiver units, the form in
Figure 17 was used.
Figure 17
The screen shows the chart in which the data from the transmitter and receiver units are to be saved
Acta Polytechnica Hungarica Vol. 12, No. 2, 2015
– 227 –
The form in Figure 17 is the screen that shows the current and voltage data
measured vertically from a single point underground. Frequency, and current and
voltage data received from the transmitter and receiver units arrive in a string, and
the related parts in the form screen are completed, then saved. This process is
repeated for every point to be measured vertically from ground to underground.
5 Results and Discussion
The comparison of the data recorded in the Beşirli Region of the Trabzon Province
in Turkey using the proposed study system/device and the RVA-1 brand
system/device is provided in Table 2.
Table 2
Measured Rhoa values
AB/2 MN/2 Other device
(Rhoa)
Proposed study device
(Rhoa)
2 0.5 7.7 7.83
3 0.5 7.12 6.98
4 0.5 6.64 6.47
5 0.5 7.16 7.08
6 0.5 6.58 6.4
5 1 6.3 6.3
6 1 5.82 5.9
8 1 7 7.1
10 1 8.8 8.5
15 1 9.2 9.34
20 1 9.34 9.34
25 1 9.9 10.08
30 1 10.6 10.3
25 5 11 10.9
30 5 11.7 11.5
35 5 12.7 12
40 5 13.5 13.5
50 5 13.8 13.7
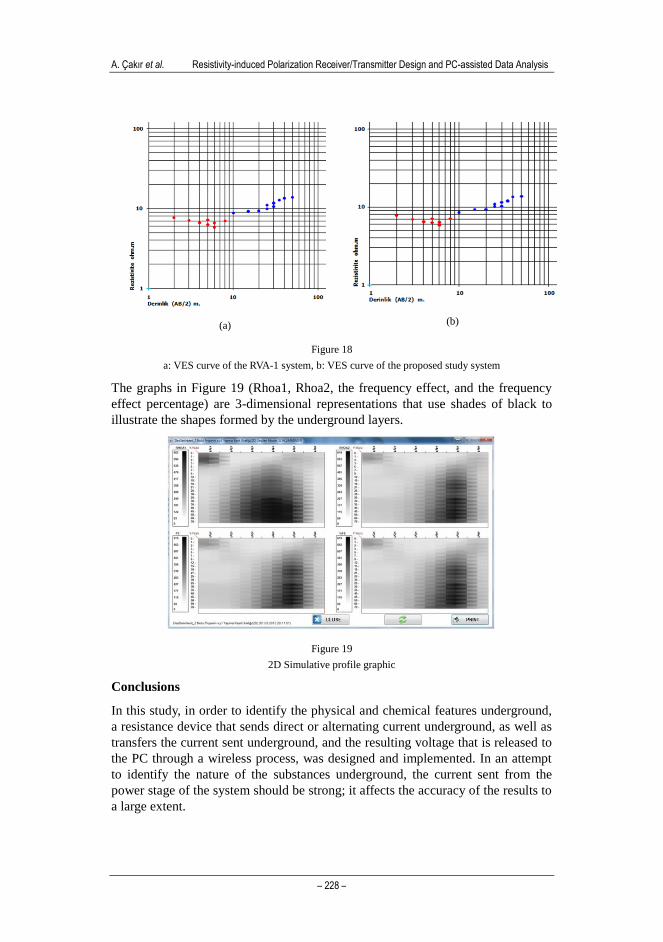
The data obtained with these two systems were roughly similar. Using the data in
Table 2, graphs were drawn for the vertical electrical sounding (VES) curves of
the measured points. These VES curves are shown in Figure 18a and 18b.
It can be seen that the VES curves of the graphs in Figure 18a and 18b are of the
same character.
A. Çakır et al. Resistivity-induced Polarization Receiver/Transmitter Design and PC-assisted Data Analysis
– 228 –
(a)
(b)
Figure 18
a: VES curve of the RVA-1 system, b: VES curve of the proposed study system
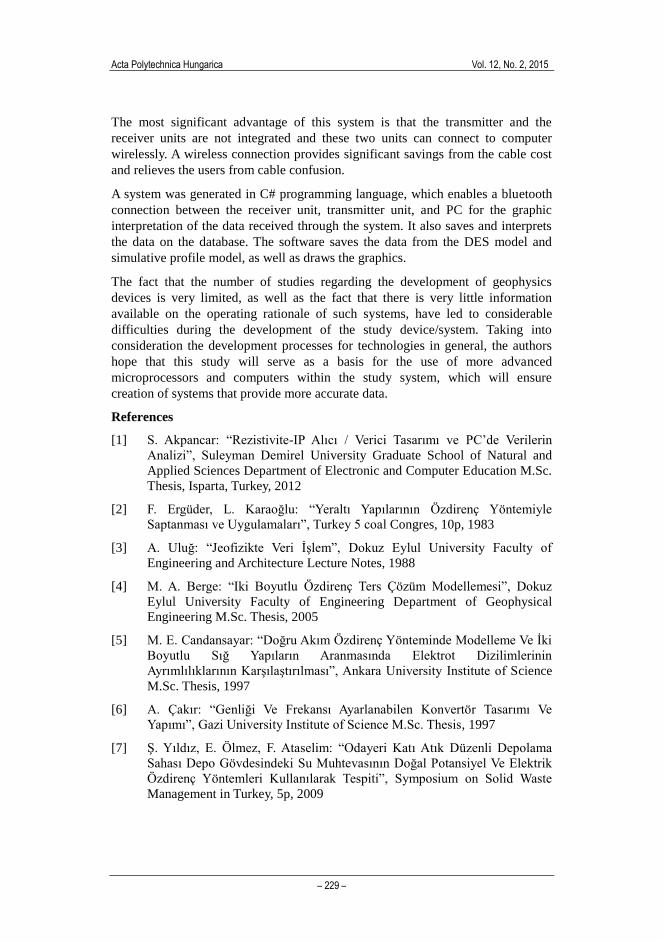
The graphs in Figure 19 (Rhoa1, Rhoa2, the frequency effect, and the frequency
effect percentage) are 3-dimensional representations that use shades of black to
illustrate the shapes formed by the underground layers.
Figure 19
2D Simulative profile graphic
Conclusions
In this study, in order to identify the physical and chemical features underground,
a resistance device that sends direct or alternating current underground, as well as
transfers the current sent underground, and the resulting voltage that is released to
the PC through a wireless process, was designed and implemented. In an attempt
to identify the nature of the substances underground, the current sent from the
power stage of the system should be strong; it affects the accuracy of the results to
a large extent.
Acta Polytechnica Hungarica Vol. 12, No. 2, 2015
– 229 –
The most significant advantage of this system is that the transmitter and the
receiver units are not integrated and these two units can connect to computer
wirelessly. A wireless connection provides significant savings from the cable cost
and relieves the users from cable confusion.
A system was generated in C# programming language, which enables a bluetooth
connection between the receiver unit, transmitter unit, and PC for the graphic
interpretation of the data received through the system. It also saves and interprets
the data on the database. The software saves the data from the DES model and
simulative profile model, as well as draws the graphics.
The fact that the number of studies regarding the development of geophysics
devices is very limited, as well as the fact that there is very little information
available on the operating rationale of such systems, have led to considerable
difficulties during the development of the study device/system. Taking into
consideration the development processes for technologies in general, the authors
hope that this study will serve as a basis for the use of more advanced
microprocessors and computers within the study system, which will ensure
creation of systems that provide more accurate data.
References
[1] S. Akpancar: “Rezistivite-IP Alıcı / Verici Tasarımı ve PC’de Verilerin
Analizi”, Suleyman Demirel University Graduate School of Natural and
Applied Sciences Department of Electronic and Computer Education M.Sc.
Thesis, Isparta, Turkey, 2012
[2] F. Ergüder, L. Karaoğlu: “Yeraltı Yapılarının Özdirenç Yöntemiyle
Saptanması ve Uygulamaları”, Turkey 5 coal Congres, 10p, 1983
[3] A. Uluğ: “Jeofizikte Veri İşlem”, Dokuz Eylul University Faculty of
Engineering and Architecture Lecture Notes, 1988
[4] M. A. Berge: “Iki Boyutlu Özdirenç Ters Çözüm Modellemesi”, Dokuz
Eylul University Faculty of Engineering Department of Geophysical
Engineering M.Sc. Thesis, 2005
[5] M. E. Candansayar: “Doğru Akım Özdirenç Yönteminde Modelleme Ve İki
Boyutlu Sığ Yapıların Aranmasında Elektrot Dizilimlerinin
Ayrımlılıklarının Karşılaştırılması”, Ankara University Institute of Science
M.Sc. Thesis, 1997
[6] A. Çakır: “Genliği Ve Frekansı Ayarlanabilen Konvertör Tasarımı Ve
Yapımı”, Gazi University Institute of Science M.Sc. Thesis, 1997
[7] Ş. Yıldız, E. Ölmez, F. Ataselim: “Odayeri Katı Atık Düzenli Depolama
Sahası Depo Gövdesindeki Su Muhtevasının Doğal Potansiyel Ve Elektrik
Özdirenç Yöntemleri Kullanılarak Tespiti”, Symposium on Solid Waste
Management in Turkey, 5p, 2009
A. Çakır et al. Resistivity-induced Polarization Receiver/Transmitter Design and PC-assisted Data Analysis
– 230 –
[8] A. Kara: “Genel Jeofiziğe Giriş”, Suleyman Demirel University Faculty of
Engineering and Architecture Lecture Notes, 36p, 2010
[9] N. Coşkun: “Yer Elektrik Yöntemleri III: İndüksiyon Polarizasyonu (IP)
Yöntemi”, Karadeniz Technical University Faculty of Engineering Lecture
Notes, 2009
[10] A. T. Başokur: Maden Aramalarında Elektrik ve Elektromanyetik
Yöntemler, Ankara University Faculty of Engineering Department of
Geophysical Engineering, 43p, 2003
[11] J. Dudrik, J. Oetter, High-Frequency Soft-Switching DC-DC Converters for
Voltage and Current DC Power Sources, Acta Polytechnica Hungarica, Vol.
4, No. 2, 2007, pp. 29-46
[12] Datasheetcatalog: [Online]. Available: http://www.datasheetcatalog.org/
datasheets/166/373875_DS.pdf, 2012