Embed Size (px)
Citation preview
Resnick Neuropsychiatric HospitalCommunity Health Needs Assessment
2016
Resnick Neuropsychiatric Hospital at UCLA Page 1
Table of Contents
Executive Summary ....................................................................................................................4
Introduction ...............................................................................................................................14
Background and Purpose ...................................................................................................14
Service Area ......................................................................................................................15
Project Oversight ...............................................................................................................16
Consultant..........................................................................................................................16
Methods ....................................................................................................................................17
Secondary Data Collection .................................................................................................17
Primary Data Collection .....................................................................................................17
Information Gaps ...............................................................................................................19
Public Comment.................................................................................................................19
Identification of Significant Health Needs ..................................................................................20
Review of Primary and Secondary Data .............................................................................20
Significant Health Needs ....................................................................................................20
Resources to Address Significant Needs ...........................................................................20
Priority Health Needs ................................................................................................................21
Impact Evaluation ..............................................................................................................22
Community Demographics ........................................................................................................23
Population ..........................................................................................................................23
Race/Ethnicity ....................................................................................................................25
Language ...........................................................................................................................25
Social and Economic Factors ....................................................................................................28
Social and Economic Factors Ranking ...............................................................................28
Poverty ..............................................................................................................................28
Households ........................................................................................................................29
Households by Type ..........................................................................................................30
Free or Reduced Price Meals.............................................................................................31
Public Program Participation ..............................................................................................31
Unemployment ...................................................................................................................32
Educational Attainment ......................................................................................................32
Community Input – Social and Economic Factors ..............................................................33
Resnick Neuropsychiatric Hospital at UCLA Page 2
Homelessness ...................................................................................................................34
Community Input – Housing and Homelessness ................................................................35
Crime and Violence ............................................................................................................36
Community Input – Community Safety ...............................................................................37
Health Care Access ..................................................................................................................38
Health Insurance Coverage ...............................................................................................38
Sources of Care .................................................................................................................40
Barriers to Care..................................................................................................................41
Access to Primary Care Community Health Centers ..........................................................41
Delayed Care .....................................................................................................................42
Community Input – Access to Care ....................................................................................42
Dental Care........................................................................................................................44
Community Input – Dental Care .........................................................................................44
Mortality/Leading Causes of Death ...........................................................................................46
Leading Causes of Premature Death .................................................................................46
Death Rate.........................................................................................................................46
Leading Causes of Death ...................................................................................................46
Heart Disease Mortality ......................................................................................................48
Cancer Mortality .................................................................................................................49
Stroke Mortality ..................................................................................................................50
Lung Disease Mortality.......................................................................................................51
Alzheimer's Disease Mortality ............................................................................................52
Pneumonia and Influenza Mortality ....................................................................................53
Health Behaviors .......................................................................................................................54
Health Behaviors Ranking ..................................................................................................54
Overweight and Obese ......................................................................................................54
Fast Food...........................................................................................................................55
Soda Consumption ............................................................................................................56
Fruit Consumption ..............................................................................................................56
Access to Fresh Produce ...................................................................................................56
Physical Activity .................................................................................................................56
Community Input – Overweight and Obesity ......................................................................57
HIV/AIDS ...........................................................................................................................57
Resnick Neuropsychiatric Hospital at UCLA Page 3
Sexually Transmitted Diseases ..........................................................................................57
Teen Sexual History ...........................................................................................................58
Mental Health and Substance Abuse ........................................................................................59
Mental Health, Adults .........................................................................................................59
Mental Health, Teens .........................................................................................................63
Community Input – Mental Health ......................................................................................64
Tobacco/Alcohol/Drug Use ................................................................................................65
Cigarette Smoking .............................................................................................................65
Alcohol and Drug Use ........................................................................................................66
Community Input – Substance Abuse ................................................................................68
Community Input .......................................................................................................................69
Additional Comments or Concerns .....................................................................................69
Attachment 1. Community Stakeholder Interviewees ................................................................71
Attachment 2. Community Resources .......................................................................................72
Attachment 3. Impact Evaluation ...............................................................................................74
Resnick Neuropsychiatric Hospital at UCLA Page 4
Executive Summary
Resnick Neuropsychiatric Hospital at UCLA is a part of UCLA Health, a world-
renowned, nonprofit academic medical center located in Los Angeles, California. UCLA
Health has undertaken a Community Health Needs Assessment (CHNA) as required by
state and federal law. California Senate Bill 697 and the Patient Protection and
Affordable Care Act and IRS section 501(r) (3) direct tax-exempt hospitals to conduct a
Community Health Needs Assessment and develop an Implementation Strategy every
three years.
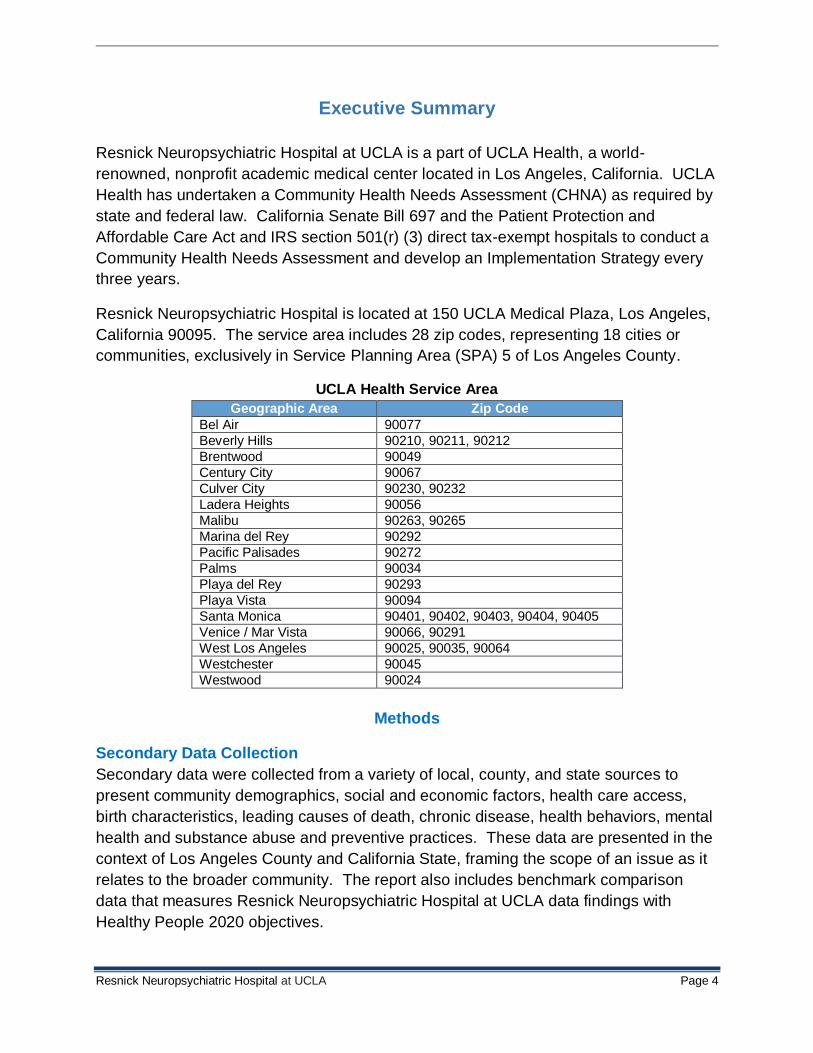
Resnick Neuropsychiatric Hospital is located at 150 UCLA Medical Plaza, Los Angeles,
California 90095. The service area includes 28 zip codes, representing 18 cities or
communities, exclusively in Service Planning Area (SPA) 5 of Los Angeles County.
UCLA Health Service Area
Geographic Area Zip Code
Bel Air 90077
Beverly Hills 90210, 90211, 90212
Brentwood 90049
Century City 90067
Culver City 90230, 90232
Ladera Heights 90056
Malibu 90263, 90265
Marina del Rey 90292
Pacific Palisades 90272
Palms 90034
Playa del Rey 90293
Playa Vista 90094
Santa Monica 90401, 90402, 90403, 90404, 90405
Venice / Mar Vista 90066, 90291
West Los Angeles 90025, 90035, 90064
Westchester 90045
Westwood 90024
Methods
Secondary Data Collection
Secondary data were collected from a variety of local, county, and state sources to
present community demographics, social and economic factors, health care access,
birth characteristics, leading causes of death, chronic disease, health behaviors, mental
health and substance abuse and preventive practices. These data are presented in the
context of Los Angeles County and California State, framing the scope of an issue as it
relates to the broader community. The report also includes benchmark comparison
data that measures Resnick Neuropsychiatric Hospital at UCLA data findings with
Healthy People 2020 objectives.
Resnick Neuropsychiatric Hospital at UCLA Page 5
Primary Data Collection
Targeted interviews were used to gather information and opinions from persons who
represent the broad interests of the community served by the hospital. Given shared
service areas, UCLA Health partnered with Cedars-Sinai Medical Center, Kaiser
Foundation Hospital – West Los Angeles and Providence St. John’s Health Center to
conduct the interviews. Twenty-five (25) interviews were completed from September
through November 2015.
Public Comment
In compliance with IRS regulations 501(r) for charitable hospitals, the previous
Community Health Needs Assessment was made widely available to the public on the
website and public comment was requested on the assessment report. To date, no
written comments have been received.
Overview of Key Findings
This overview summarizes significant findings drawn from an analysis of the data from
each section of the report. Full data descriptions, findings, and data sources follow.
Community Demographics
The population of the Resnick Neuropsychiatric Hospital at UCLA service area is
656,039.
Children and youth, ages 0-17, make up 16% of the population; 69.7% are
adults, ages 18-64; and 14.3% of the population are seniors, ages 65 and over.
The median age in the service area is 37.9.
60.2% of the service area population is White; 16.5% of residents are
Hispanic/Latino; 13% are Asian; 6.2% are African American; and 4.1% are
American Indian/Alaskan Native, multiple, or other race/ethnicity.
English is spoken in the home among 64.4% of the service area population.
Spanish is spoken at home among 13.3% of the population; 8.1% of the
population speak an Asian language; and 11.8% of the population speaks an
Indo-European language at home.
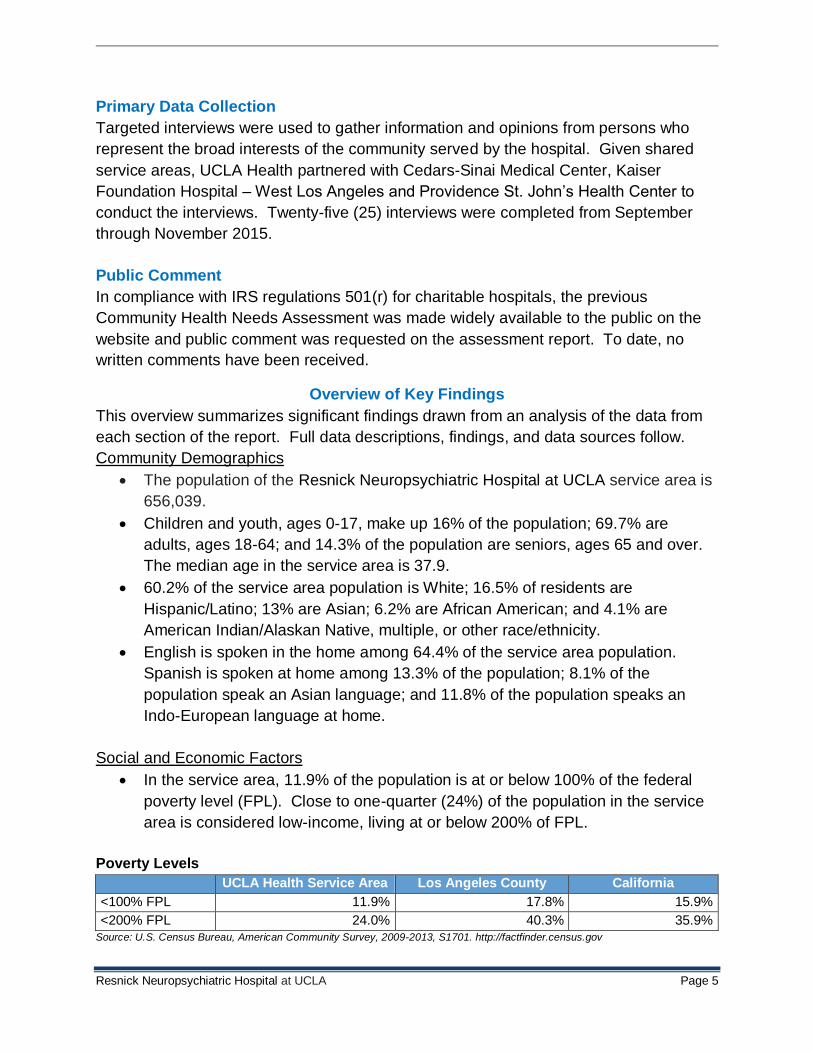
Social and Economic Factors
In the service area, 11.9% of the population is at or below 100% of the federal
poverty level (FPL). Close to one-quarter (24%) of the population in the service
area is considered low-income, living at or below 200% of FPL.
Poverty Levels
UCLA Health Service Area Los Angeles County California
<100% FPL 11.9% 17.8% 15.9%
<200% FPL 24.0% 40.3% 35.9%
Source: U.S. Census Bureau, American Community Survey, 2009-2013, S1701. http://factfinder.census.gov
Resnick Neuropsychiatric Hospital at UCLA Page 6
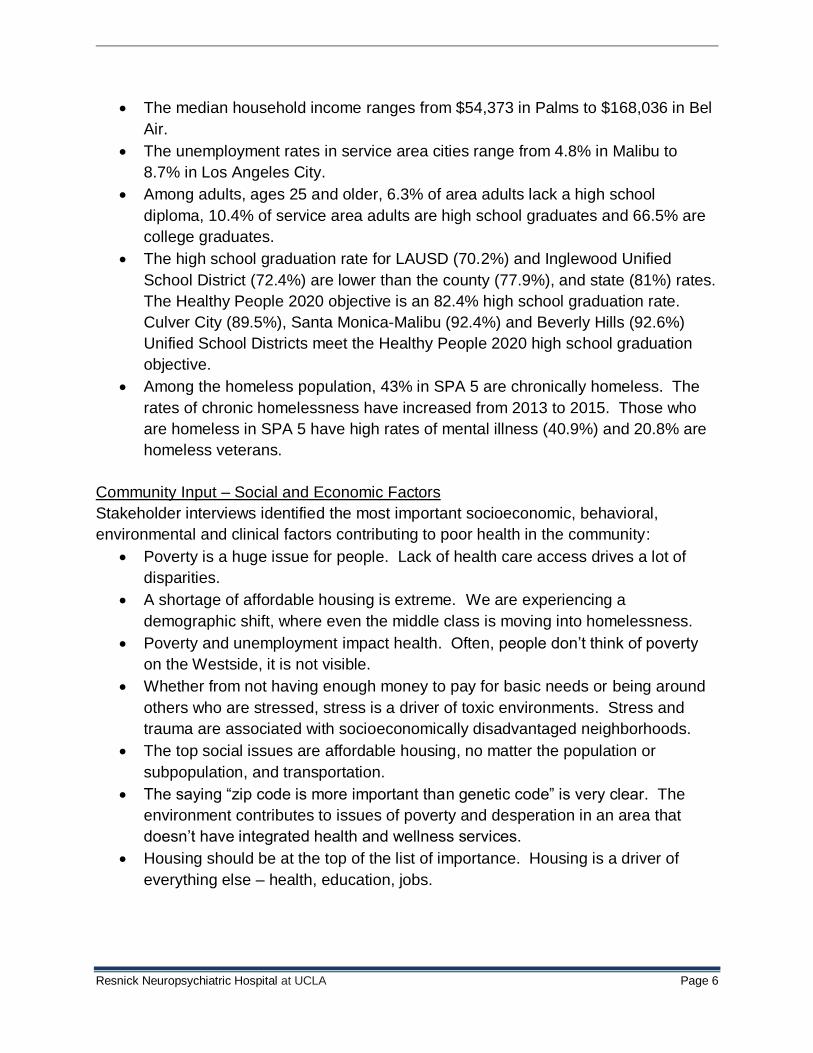
The median household income ranges from $54,373 in Palms to $168,036 in Bel
Air.
The unemployment rates in service area cities range from 4.8% in Malibu to
8.7% in Los Angeles City.
Among adults, ages 25 and older, 6.3% of area adults lack a high school
diploma, 10.4% of service area adults are high school graduates and 66.5% are
college graduates.
The high school graduation rate for LAUSD (70.2%) and Inglewood Unified
School District (72.4%) are lower than the county (77.9%), and state (81%) rates.
The Healthy People 2020 objective is an 82.4% high school graduation rate.
Culver City (89.5%), Santa Monica-Malibu (92.4%) and Beverly Hills (92.6%)
Unified School Districts meet the Healthy People 2020 high school graduation
objective.
Among the homeless population, 43% in SPA 5 are chronically homeless. The
rates of chronic homelessness have increased from 2013 to 2015. Those who
are homeless in SPA 5 have high rates of mental illness (40.9%) and 20.8% are
homeless veterans.
Community Input – Social and Economic Factors
Stakeholder interviews identified the most important socioeconomic, behavioral,
environmental and clinical factors contributing to poor health in the community:
Poverty is a huge issue for people. Lack of health care access drives a lot of
disparities.
A shortage of affordable housing is extreme. We are experiencing a
demographic shift, where even the middle class is moving into homelessness.
Poverty and unemployment impact health. Often, people don’t think of poverty
on the Westside, it is not visible.
Whether from not having enough money to pay for basic needs or being around
others who are stressed, stress is a driver of toxic environments. Stress and
trauma are associated with socioeconomically disadvantaged neighborhoods.
The top social issues are affordable housing, no matter the population or
subpopulation, and transportation.
The saying “zip code is more important than genetic code” is very clear. The
environment contributes to issues of poverty and desperation in an area that
doesn’t have integrated health and wellness services.
Housing should be at the top of the list of importance. Housing is a driver of
everything else – health, education, jobs.
Resnick Neuropsychiatric Hospital at UCLA Page 7
Health Care Access
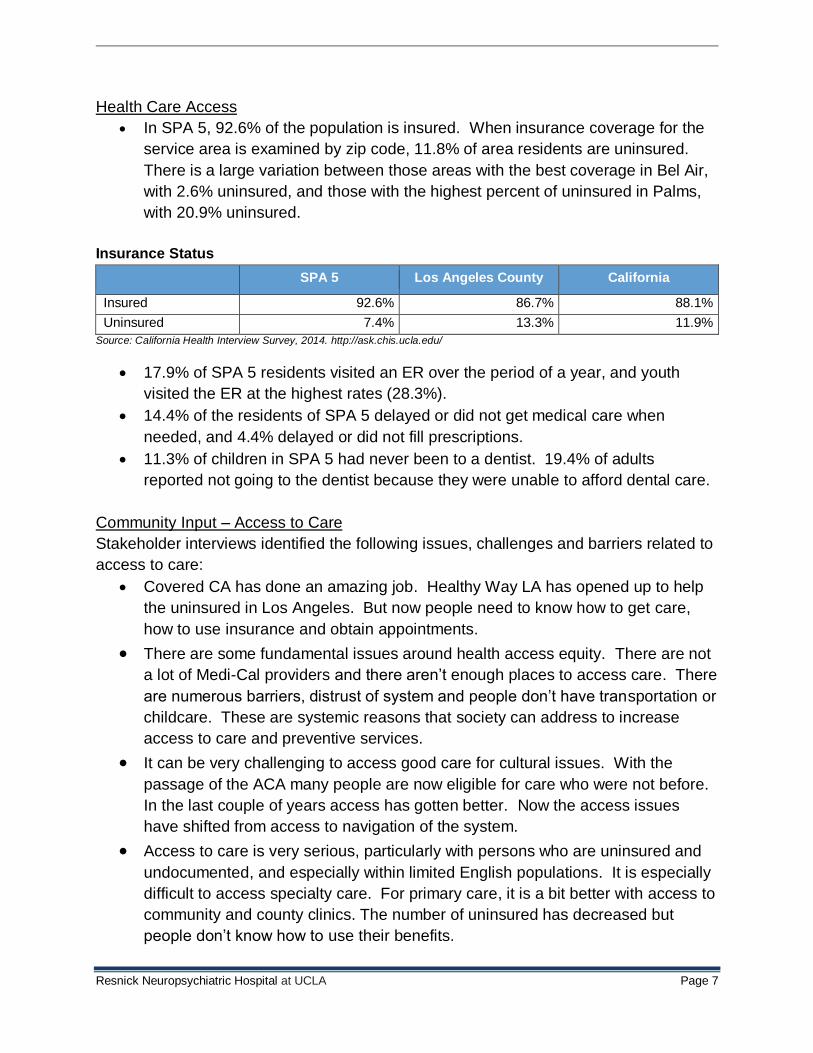
In SPA 5, 92.6% of the population is insured. When insurance coverage for the
service area is examined by zip code, 11.8% of area residents are uninsured.
There is a large variation between those areas with the best coverage in Bel Air,
with 2.6% uninsured, and those with the highest percent of uninsured in Palms,
with 20.9% uninsured.
Insurance Status
SPA 5 Los Angeles County California
Insured 92.6% 86.7% 88.1%
Uninsured 7.4% 13.3% 11.9%
Source: California Health Interview Survey, 2014. http://ask.chis.ucla.edu/
17.9% of SPA 5 residents visited an ER over the period of a year, and youth
visited the ER at the highest rates (28.3%).
14.4% of the residents of SPA 5 delayed or did not get medical care when
needed, and 4.4% delayed or did not fill prescriptions.
11.3% of children in SPA 5 had never been to a dentist. 19.4% of adults
reported not going to the dentist because they were unable to afford dental care.
Community Input – Access to Care
Stakeholder interviews identified the following issues, challenges and barriers related to
access to care:
Covered CA has done an amazing job. Healthy Way LA has opened up to help
the uninsured in Los Angeles. But now people need to know how to get care,
how to use insurance and obtain appointments.
There are some fundamental issues around health access equity. There are not
a lot of Medi-Cal providers and there aren’t enough places to access care. There
are numerous barriers, distrust of system and people don’t have transportation or
childcare. These are systemic reasons that society can address to increase
access to care and preventive services.
It can be very challenging to access good care for cultural issues. With the
passage of the ACA many people are now eligible for care who were not before.
In the last couple of years access has gotten better. Now the access issues
have shifted from access to navigation of the system.
Access to care is very serious, particularly with persons who are uninsured and
undocumented, and especially within limited English populations. It is especially
difficult to access specialty care. For primary care, it is a bit better with access to
community and county clinics. The number of uninsured has decreased but
people don’t know how to use their benefits.
Resnick Neuropsychiatric Hospital at UCLA Page 8
Dental care is one of the top community health needs. Dentists who take Medi-
Cal rates are needed. There are too few dentists caring for the underserved
because reimbursement rates are so low.
Leading Causes of Death
Heart disease, cancer, and stroke are the top three leading causes of death in
the service area. When compared to the county and state, the service area has
higher death rates for the top three causes of death.
In SPA 5, coronary heart disease was the leading cause of premature death,
followed by suicide, drug overdose, motor vehicle crashes, and liver disease.
Health Behaviors
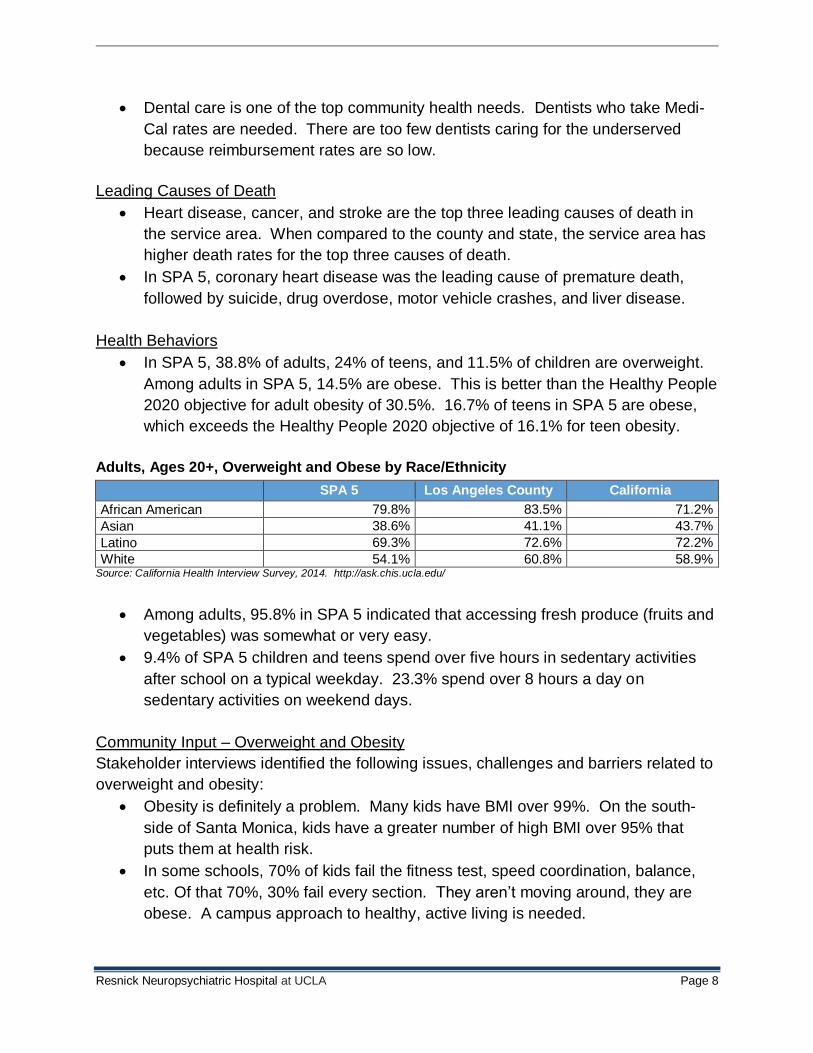
In SPA 5, 38.8% of adults, 24% of teens, and 11.5% of children are overweight.
Among adults in SPA 5, 14.5% are obese. This is better than the Healthy People
2020 objective for adult obesity of 30.5%. 16.7% of teens in SPA 5 are obese,
which exceeds the Healthy People 2020 objective of 16.1% for teen obesity.
Adults, Ages 20+, Overweight and Obese by Race/Ethnicity
SPA 5 Los Angeles County California
African American 79.8% 83.5% 71.2%
Asian 38.6% 41.1% 43.7%
Latino 69.3% 72.6% 72.2%
White 54.1% 60.8% 58.9% Source: California Health Interview Survey, 2014. http://ask.chis.ucla.edu/
Among adults, 95.8% in SPA 5 indicated that accessing fresh produce (fruits and
vegetables) was somewhat or very easy.
9.4% of SPA 5 children and teens spend over five hours in sedentary activities
after school on a typical weekday. 23.3% spend over 8 hours a day on
sedentary activities on weekend days.
Community Input – Overweight and Obesity
Stakeholder interviews identified the following issues, challenges and barriers related to
overweight and obesity:
Obesity is definitely a problem. Many kids have BMI over 99%. On the south-
side of Santa Monica, kids have a greater number of high BMI over 95% that
puts them at health risk.
In some schools, 70% of kids fail the fitness test, speed coordination, balance,
etc. Of that 70%, 30% fail every section. They aren’t moving around, they are
obese. A campus approach to healthy, active living is needed.
Resnick Neuropsychiatric Hospital at UCLA Page 9
Overweight/obesity is one of the biggest challenges for school districts. Obesity
prevention programs exist right and left, some are more effective than others.
Even though there are a lot of groups working on it, obesity has gotten worse in
the past few years.
Mental Health and Substance Abuse
Among SPA 5 adults, 8.7% experienced serious psychological distress in the
past year, with higher percentages seen among lower-income, female, Latino,
and LGBT respondents.
8.2% of SPA 5 adults have thought seriously about suicide. This is higher than
county levels, and is more prevalent among poor, female, working-age, LGBT,
and Black and Latino residents in the area.
Among adults in SPA 5, 21.6% needed help for mental health and/or alcohol and
problems in the past year, and 18.5% of adults saw a health care provider for
their mental health and/or alcohol and drug issues in the past year. Of those who
sought help, 36.4% did not receive treatment.
Among SPA 5 teens, 2.5% experienced frequent mental distress during the past
month. 23.3% of teens in SPA 5 who need counseling were likely to receive
counseling.
7.8% of adults in SPA 5 are current smokers, lower than the Healthy People
2020 objective for cigarette smoking among adults (12%). Among teens in SPA
5, 4.4% have smoked an electronic (vaporizer) cigarette.
Among adults in SPA 5, 41.4% had engaged in binge drinking in the past year,
which is a higher level than found in the county and state.
Teens in SPA 5 reported having tried alcohol (20.6%) and illegal drugs (14.3%).
More teens had used marijuana in the past year (14.3%).
Community Input – Mental Health and Substance Abuse
Stakeholder interviews identified the following issues, challenges and barriers related to
mental health:
Mental health is the hardest service for anyone to access, even for people with
good insurance; all psychiatrists on the West side are cash only. As income
goes down, the county jail is filled with homeless that are seriously mentally ill. It
is a very challenging problem.
Determining where to send kids in crisis is a continuous struggle as is where to
obtain regular care. Mental health is a top priority. More crisis intervention and
beds are needed.
There are two issues with mental health. One is stigma, which is different among
cultures; people need help learning how to talk about mental illness and seek
Resnick Neuropsychiatric Hospital at UCLA Page 10
treatment. The second issue is workforce. If more people started seeking care,
will there be care resources available for them?
Substance abuse is a big issue right next to mental health. There are major
impacts in secondary and even middle school students. There is a lack of
providers on the treatment side.
There is not enough funding for substance abuse and not enough integration with
mental health.
In SPA 5 prescription drug overdose and managing medications is a huge issue,
especially among higher income individuals and white males. There are
significant rates of overdoses and suicide in this middle to upper class group.
Identification of Significant Health Needs
Significant health needs were identified from secondary data using the size of the
problem (relative portion of population afflicted by the problem) and the seriousness of
the problem (impact at individual, family, and community levels). To determine size or
seriousness of the problem, the health need indicators identified in the secondary data
were measured against benchmark data, specifically county rates, state rates and/or
Healthy People 2020 objectives. Indicators related to the health needs that performed
poorly against one or more of these benchmarks met this criterion to be considered a
health need.
The analysis of secondary data yielded a preliminary list of significant health needs,
which then informed primary data collection. The primary data collection process was
designed to validate secondary data findings, identify additional community issues,
solicit information on disparities among subpopulations, ascertain community assets to
address needs and discover gaps in resources.
Significant Health Needs
The following significant health needs
were determined:
Access to care
Asthma
Cancer
Community safety
Dental care
Diabetes
Heart disease
HIV/AIDS
Homelessness/housing
Mental health
Overweight and obesity
Preventive practices
Substance abuse
Resnick Neuropsychiatric Hospital at UCLA Page 13
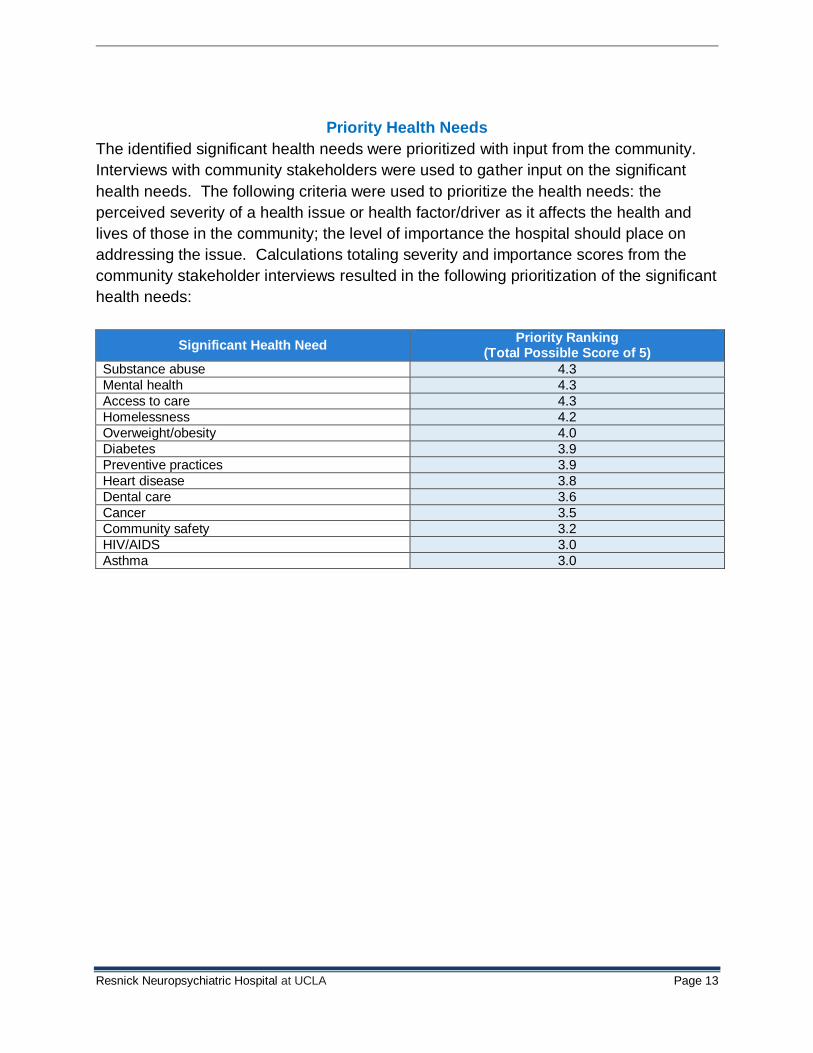
Priority Health Needs
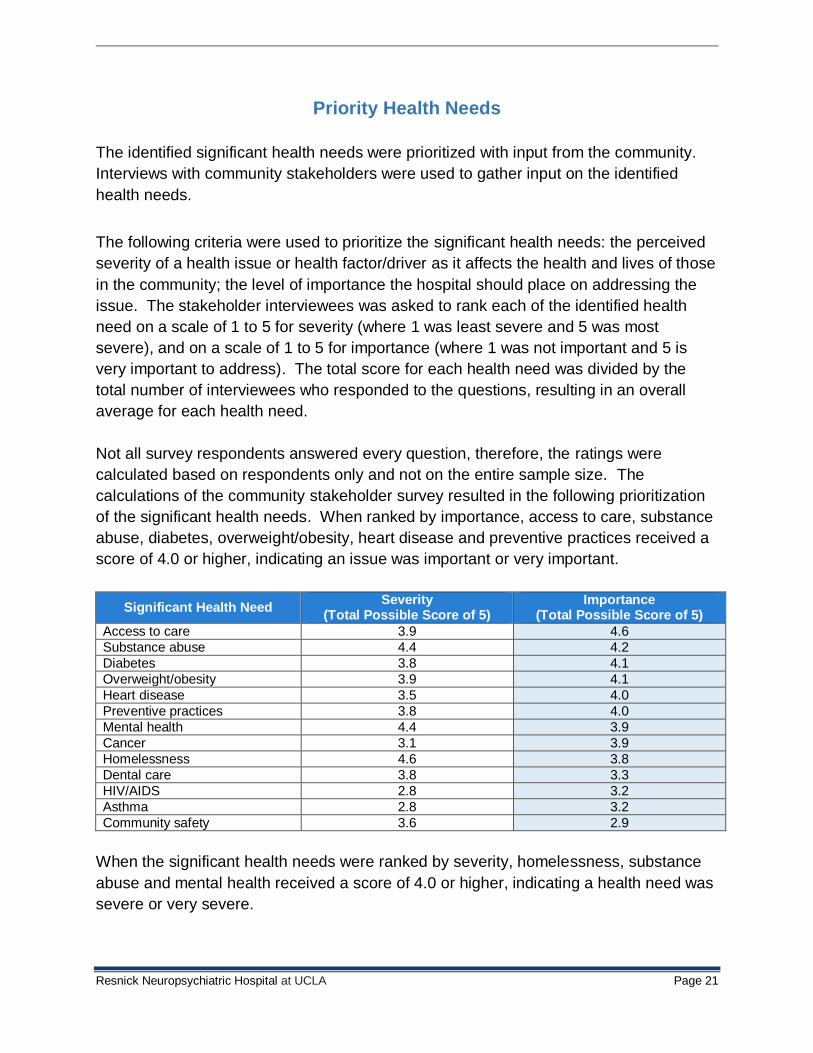
The identified significant health needs were prioritized with input from the community.
Interviews with community stakeholders were used to gather input on the significant
health needs. The following criteria were used to prioritize the health needs: the
perceived severity of a health issue or health factor/driver as it affects the health and
lives of those in the community; the level of importance the hospital should place on
addressing the issue. Calculations totaling severity and importance scores from the
community stakeholder interviews resulted in the following prioritization of the significant
health needs:
Significant Health Need Priority Ranking
(Total Possible Score of 5)
Substance abuse 4.3
Mental health 4.3
Access to care 4.3
Homelessness 4.2
Overweight/obesity 4.0
Diabetes 3.9
Preventive practices 3.9
Heart disease 3.8
Dental care 3.6
Cancer 3.5
Community safety 3.2
HIV/AIDS 3.0
Asthma 3.0
Resnick Neuropsychiatric Hospital at UCLA Page 14
Introduction
Background and Purpose
Resnick Neuropsychiatric Hospital at UCLA is a part of UCLA Health, a world-
renowned, nonprofit academic medical center located in Los Angeles, California. UCLA
Health is comprised of Ronald Reagan UCLA Medical Center, UCLA Medical Center,
Santa Monica, Resnick Neuropsychiatric Hospital at UCLA, Mattel Children's Hospital
UCLA, and the UCLA Medical Group, which has a wide-reaching system of primary-
care and specialty-care offices throughout the region. Our mission is to deliver leading-
edge patient care, research, and education. Our vision is to heal humankind, one
patient at a time, by improving health, alleviating suffering and delivering acts of
kindness.
The Stewart and Lynda Resnick Neuropsychiatric Hospital at UCLA is among the
leading centers in the world for comprehensive patient care, research and education in
the fields of mental health, developmental disabilities and neurology. It is the major
psychiatry teaching facility of the David Geffen School of Medicine at UCLA and Ronald
Reagan UCLA Medical Center, one of the nation’s top-ranked medical centers. The
Resnick Neuropsychiatric Hospital is an independently accredited and licensed hospital
located on the fourth floor of the Ronald Reagan UCLA Medical Center, with its own
entrance and address.
The Resnick Neuropsychiatric Hospital’s vision is to serve the health care needs of the
community, its patients and their families through excellence in research, education and
the delivery of neuropsychiatric and behavioral health services.
Patients of all ages with psychiatric illnesses and developmental disabilities receive
innovative treatment and compassionate care. Team members include specialists in
psychiatry, neurology, medicine and pediatrics, as well as nursing, psychology,
occupational therapy, recreational therapy, speech pathology, social work and special
education.
UCLA Health has undertaken a Community Health Needs Assessment (CHNA) as
required by state and federal law. California Senate Bill 697 and the Patient Protection
and Affordable Care Act and IRS section 501(r) (3) direct tax-exempt hospitals to
conduct a Community Health Needs Assessment and develop an Implementation
Strategy every three years.
The Community Health Needs Assessment is a primary tool used by UCLA Health to
determine its community benefit plan, which outlines how it will give back to the
community in the form of health care and other community services to address unmet
community health needs. This assessment incorporates components of primary data
Resnick Neuropsychiatric Hospital at UCLA Page 15
collection and secondary data analysis that focus on the health and social needs of the
UCLA Health service area.
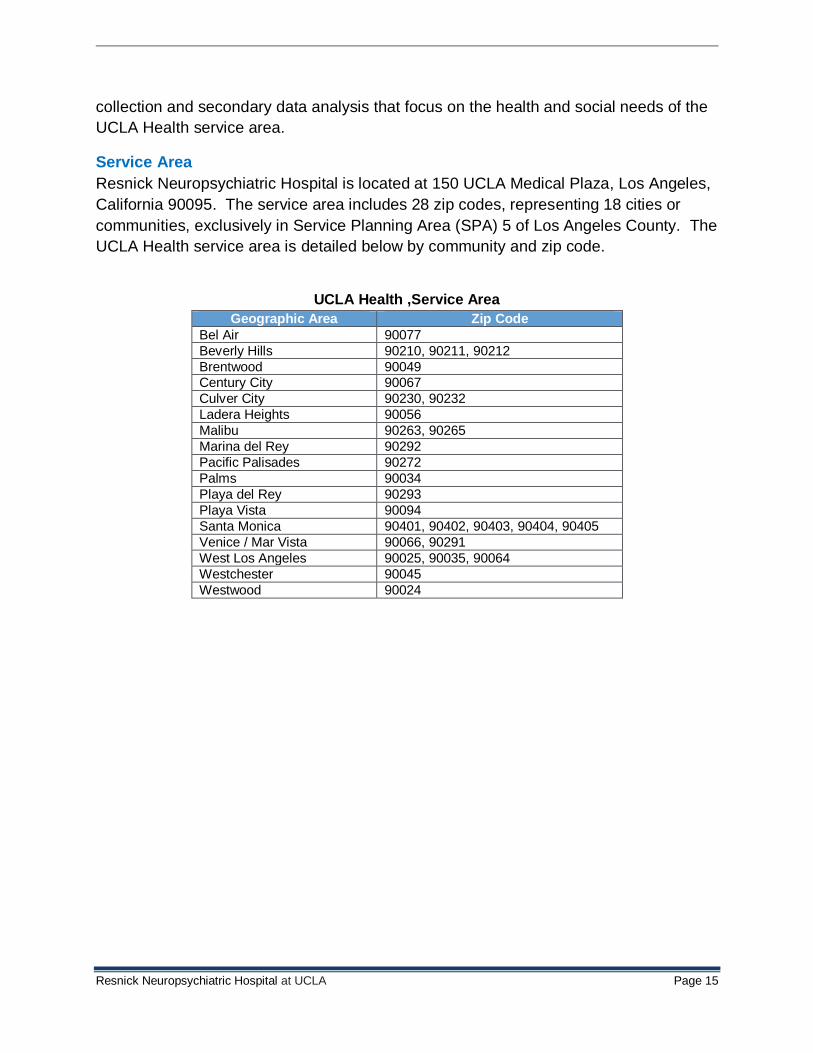
Service Area
Resnick Neuropsychiatric Hospital is located at 150 UCLA Medical Plaza, Los Angeles,
California 90095. The service area includes 28 zip codes, representing 18 cities or
communities, exclusively in Service Planning Area (SPA) 5 of Los Angeles County. The
UCLA Health service area is detailed below by community and zip code.
UCLA Health ,Service Area
Geographic Area Zip Code
Bel Air 90077
Beverly Hills 90210, 90211, 90212
Brentwood 90049 Century City 90067
Culver City 90230, 90232
Ladera Heights 90056
Malibu 90263, 90265
Marina del Rey 90292
Pacific Palisades 90272
Palms 90034
Playa del Rey 90293
Playa Vista 90094
Santa Monica 90401, 90402, 90403, 90404, 90405
Venice / Mar Vista 90066, 90291
West Los Angeles 90025, 90035, 90064
Westchester 90045
Westwood 90024
Resnick Neuropsychiatric Hospital at UCLA Page 16
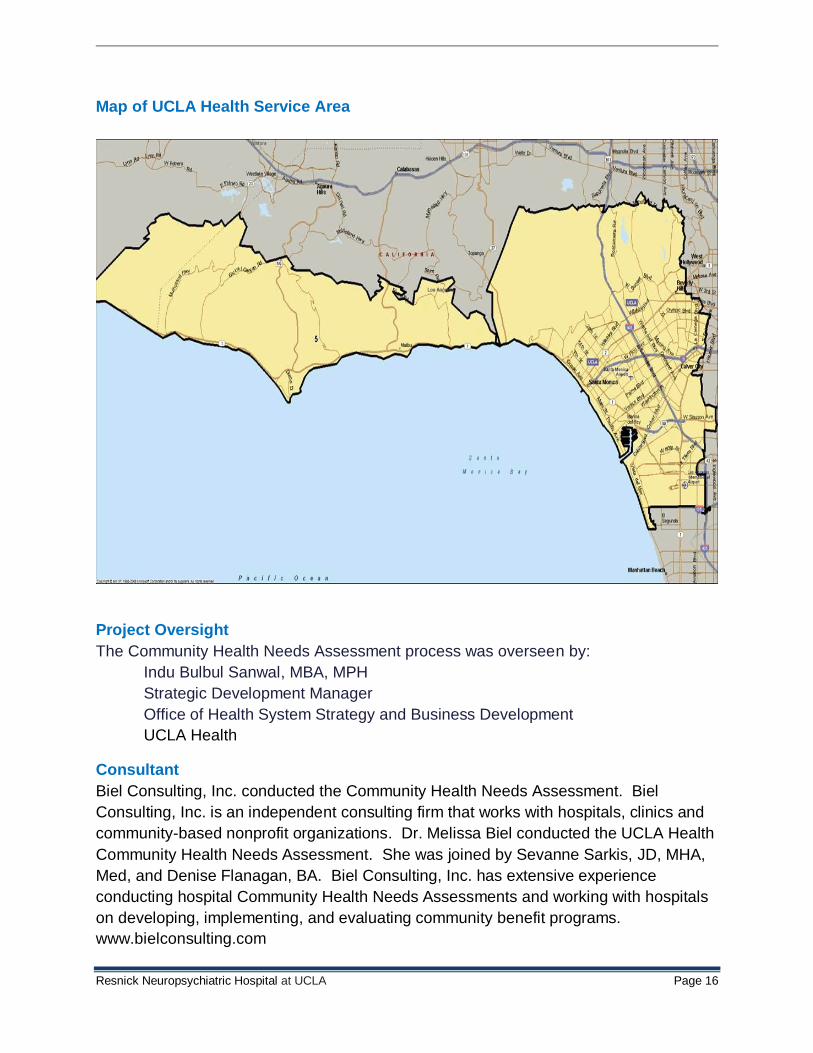
Map of UCLA Health Service Area
Project Oversight
The Community Health Needs Assessment process was overseen by:
Indu Bulbul Sanwal, MBA, MPH
Strategic Development Manager
Office of Health System Strategy and Business Development
UCLA Health
Consultant
Biel Consulting, Inc. conducted the Community Health Needs Assessment. Biel
Consulting, Inc. is an independent consulting firm that works with hospitals, clinics and
community-based nonprofit organizations. Dr. Melissa Biel conducted the UCLA Health
Community Health Needs Assessment. She was joined by Sevanne Sarkis, JD, MHA,
Med, and Denise Flanagan, BA. Biel Consulting, Inc. has extensive experience
conducting hospital Community Health Needs Assessments and working with hospitals
on developing, implementing, and evaluating community benefit programs.
www.bielconsulting.com
Resnick Neuropsychiatric Hospital at UCLA Page 17
Methods
Secondary Data Collection
Secondary data were collected from a variety of local, county, and state sources to
present community demographics, social and economic factors, health care access,
birth characteristics, leading causes of death, chronic disease, health behaviors, mental
health and substance abuse and preventive practices.
Analyses were conducted at the most local level possible for the hospital primary
service area, given the availability of the data. For example, demographic data, birth
and death data are based on zip codes. Housing and economic indicators are available
by city. Other data are only available by SPA (Service Planning Area) or county. For
the purposes of this needs assessment, when examining data by SPA, the SPA 5
geographic area is presented.
Sources of data include Nielsen/Claritas from the Healthy Communities Institute
database, U.S. Census American Community Survey, California Health Interview
Survey, California Department of Public Health, California Employment Development
Department, Los Angeles County Health Survey, Los Angeles Homeless Services
Authority, Uniform Data System, National Cancer Institute, California Department of
Education, and others. When pertinent, these data sets are presented in the context of
Los Angeles County and California State, framing the scope of an issue as it relates to
the broader community.
The secondary data for the hospital service area were collected and documented in
data tables with narrative explanation. The tables present the data indicator, the
geographic area represented, the data measurement (e.g. rate, number, and/or
percent), county and state comparisons (when available), the data source, data year
and an electronic link to the data source. Analysis of secondary data included an
examination and reporting of health disparities for some health indicators. The report
includes benchmark comparison data that measures UCLA Medical Center, Santa
Monica data findings with Healthy People 2020 objectives. Healthy People 2020
objectives are a national initiative to improve the public’s health by providing
measurable objectives and goals that are applicable at national, state, and local levels.
Primary Data Collection
Targeted interviews were used to gather information and opinions from persons who
represent the broad interests of the community served by the hospital. Given shared
service areas, UCLA Health partnered with Cedars-Sinai Medical Center, Kaiser
Foundation Hospital – West Los Angeles and Providence St. John’s Health Center to
conduct the interviews. Twenty-five (25) interviews were completed from September
Resnick Neuropsychiatric Hospital at UCLA Page 18
through November 2015.
For the interviews, community stakeholders identified by UCLA Health, in partnership
with Cedars-Sinai Medical Center, Kaiser Foundation Hospital – West Los Angeles and
Providence St. John’s Health Center, were contacted and asked to participate in the
needs assessment. Interviewees included individuals who are leaders and
representatives of medically underserved, low-income, and minority populations, or
local health or other departments or agencies that have “current data or other
information relevant to the health needs of the community served by the hospital
facility.” Input was obtained from Los Angeles County Department of Public Health
officials.
The identified stakeholders were invited by email to participate in a one hour phone
interview. Appointments for the interviews were made on dates and times convenient to
the stakeholders. At the beginning of each interview, the purpose of the interview in the
context of the assessment was explained, the stakeholders were assured their
responses would remain confidential, and consent to proceed was given. A list of the
stakeholder interview respondents, their titles and organizations can be found in
Attachment 1.
Initially, significant health needs were identified through a review of the secondary
health data collected and analyzed prior to the interviews. These data were then used
to help guide the interviews. The needs assessment interviews were structured to
obtain greater depth and richness of information and build on the secondary data
review. During the interviews, participants were asked to identify the major health
issues in the community, and socioeconomic, behavioral, environmental or clinical
factors contributing to poor health. They were asked to share their perspectives on the
issues, challenges and barriers relative to the identified health needs, and identify
resources to address these health needs, such as services, programs and/or
community efforts. The interviews focused on these identified health needs:
Access to care
Asthma
Cancer
Community safety
Dental care
Diabetes
Heart disease
HIV/AIDS
Homelessness/housing
Resnick Neuropsychiatric Hospital at UCLA Page 19
Mental health
Overweight and obesity
Preventive practices
Substance abuse
Interview participants were asked to provide additional comments to share with UCLA
Health. Analysis of the primary data occurred through a process that compared and
combined responses to identify themes. All responses to each question were examined
together and concepts and themes were then summarized to reflect the respondents’
experiences and opinions. The results of the primary data collection were reviewed in
conjunction with the secondary data. Primary data findings were used to corroborate
the secondary data-defined health needs, serving as a confirming data source. The
responses are included in the following Community Health Needs Assessment
chapters.
Information Gaps
Information gaps that impact the ability to assess health needs were identified.
Specifically, cancer incidence rates are not available at a rate more local than Los
Angeles County. Some of the secondary data are not always collected on a regular
basis, meaning that some data are several years old. Specifically, the results of the
2015 Los Angeles County Health Survey (a population based telephone survey that
provides information concerning the health of Los Angeles County residents) were not
yet available during the conduct of this CHNA.
Public Comment
In compliance with IRS regulations 501(r) for charitable hospitals, a hospital Community
Health Needs Assessment (CHNA) is to be made widely available to the public and
public comment on the CHNA is to be invited. In compliance with these regulations, the
previous Resnick Neuropsychiatric Hospital CHNA was made widely available to the
public on the website https://www.uclahealth.org/Pages/about/community/community-
health.aspx. Public comment was requested on the assessment report. To date, no
written comments have been received.
Resnick Neuropsychiatric Hospital at UCLA Page 20
Identification of Significant Health Needs
Review of Primary and Secondary Data
Health needs were identified from secondary data using the size of the problem (relative
portion of population afflicted by the problem) and the seriousness of the problem
(impact at individual, family, and community levels). To determine size or seriousness
of the problem, the health need indicators identified in the secondary data were
measured against benchmark data, specifically county rates, state rates and/or Healthy
People 2020 objectives. Indicators related to the health needs that performed poorly
against these benchmarks met this criterion to be considered a health need.
The analysis of secondary data yielded a preliminary list of significant health needs,
which then informed primary data collection. The primary data collection process was
designed to validate secondary data findings, identify additional community issues,
solicit information on disparities among subpopulations, ascertain community assets to
address needs and discover gaps in resources.
Significant Health Needs
The following significant health needs were determined:
Access to care
Asthma
Cancer
Community safety
Dental care
Diabetes
Heart disease
HIV/AIDS
Homelessness/housing
Mental health
Overweight and obesity
Preventive practices
Substance abuse
Resources to Address Significant Needs
Through the interview process, community stakeholders identified community resources
to address the identified health needs. The identified community resources are
presented in Attachment 2.
Resnick Neuropsychiatric Hospital at UCLA Page 21
Priority Health Needs
The identified significant health needs were prioritized with input from the community.
Interviews with community stakeholders were used to gather input on the identified
health needs.
The following criteria were used to prioritize the significant health needs: the perceived
severity of a health issue or health factor/driver as it affects the health and lives of those
in the community; the level of importance the hospital should place on addressing the
issue. The stakeholder interviewees was asked to rank each of the identified health
need on a scale of 1 to 5 for severity (where 1 was least severe and 5 was most
severe), and on a scale of 1 to 5 for importance (where 1 was not important and 5 is
very important to address). The total score for each health need was divided by the
total number of interviewees who responded to the questions, resulting in an overall
average for each health need.
Not all survey respondents answered every question, therefore, the ratings were
calculated based on respondents only and not on the entire sample size. The
calculations of the community stakeholder survey resulted in the following prioritization
of the significant health needs. When ranked by importance, access to care, substance
abuse, diabetes, overweight/obesity, heart disease and preventive practices received a
score of 4.0 or higher, indicating an issue was important or very important.
Significant Health Need Severity
(Total Possible Score of 5) Importance
(Total Possible Score of 5)
Access to care 3.9 4.6
Substance abuse 4.4 4.2
Diabetes 3.8 4.1
Overweight/obesity 3.9 4.1
Heart disease 3.5 4.0
Preventive practices 3.8 4.0
Mental health 4.4 3.9
Cancer 3.1 3.9
Homelessness 4.6 3.8
Dental care 3.8 3.3
HIV/AIDS 2.8 3.2
Asthma 2.8 3.2
Community safety 3.6 2.9
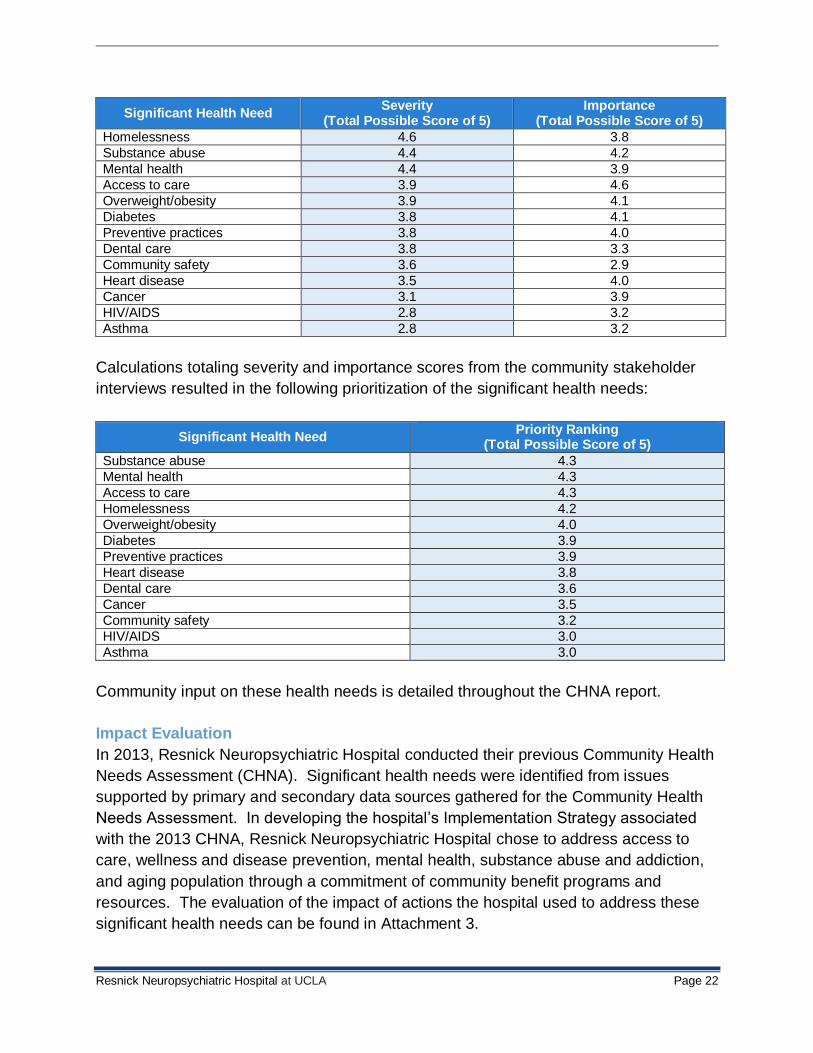
When the significant health needs were ranked by severity, homelessness, substance
abuse and mental health received a score of 4.0 or higher, indicating a health need was
severe or very severe.
Resnick Neuropsychiatric Hospital at UCLA Page 22
Significant Health Need Severity
(Total Possible Score of 5) Importance
(Total Possible Score of 5)
Homelessness 4.6 3.8
Substance abuse 4.4 4.2
Mental health 4.4 3.9
Access to care 3.9 4.6
Overweight/obesity 3.9 4.1
Diabetes 3.8 4.1
Preventive practices 3.8 4.0
Dental care 3.8 3.3
Community safety 3.6 2.9
Heart disease 3.5 4.0
Cancer 3.1 3.9
HIV/AIDS 2.8 3.2
Asthma 2.8 3.2
Calculations totaling severity and importance scores from the community stakeholder
interviews resulted in the following prioritization of the significant health needs:
Significant Health Need Priority Ranking
(Total Possible Score of 5)
Substance abuse 4.3
Mental health 4.3
Access to care 4.3
Homelessness 4.2
Overweight/obesity 4.0
Diabetes 3.9
Preventive practices 3.9
Heart disease 3.8
Dental care 3.6
Cancer 3.5
Community safety 3.2
HIV/AIDS 3.0
Asthma 3.0
Community input on these health needs is detailed throughout the CHNA report.
Impact Evaluation
In 2013, Resnick Neuropsychiatric Hospital conducted their previous Community Health
Needs Assessment (CHNA). Significant health needs were identified from issues
supported by primary and secondary data sources gathered for the Community Health
Needs Assessment. In developing the hospital’s Implementation Strategy associated
with the 2013 CHNA, Resnick Neuropsychiatric Hospital chose to address access to
care, wellness and disease prevention, mental health, substance abuse and addiction,
and aging population through a commitment of community benefit programs and
resources. The evaluation of the impact of actions the hospital used to address these
significant health needs can be found in Attachment 3.
Resnick Neuropsychiatric Hospital at UCLA Page 23
Community Demographics
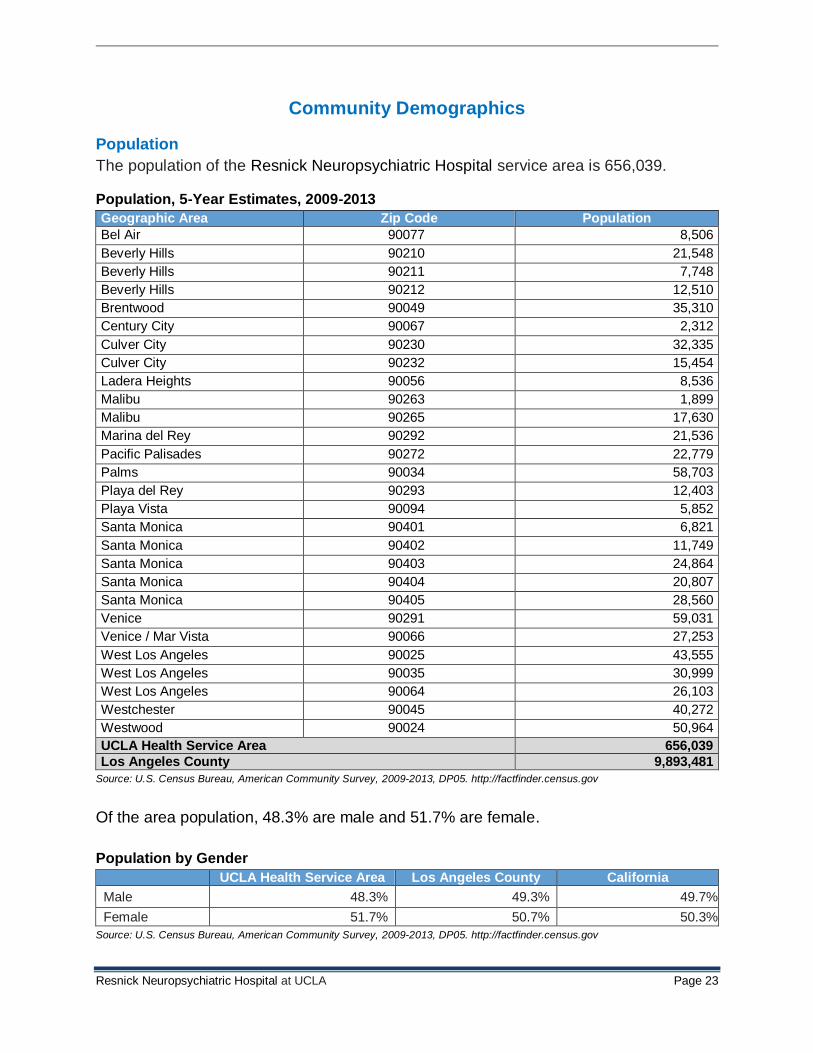
Population
The population of the Resnick Neuropsychiatric Hospital service area is 656,039.
Population, 5-Year Estimates, 2009-2013
Geographic Area Zip Code Population
Bel Air 90077 8,506
Beverly Hills 90210 21,548
Beverly Hills 90211 7,748
Beverly Hills 90212 12,510
Brentwood 90049 35,310
Century City 90067 2,312
Culver City 90230 32,335
Culver City 90232 15,454
Ladera Heights 90056 8,536
Malibu 90263 1,899
Malibu 90265 17,630
Marina del Rey 90292 21,536
Pacific Palisades 90272 22,779
Palms 90034 58,703
Playa del Rey 90293 12,403
Playa Vista 90094 5,852
Santa Monica 90401 6,821
Santa Monica 90402 11,749
Santa Monica 90403 24,864
Santa Monica 90404 20,807
Santa Monica 90405 28,560
Venice 90291 59,031
Venice / Mar Vista 90066 27,253
West Los Angeles 90025 43,555
West Los Angeles 90035 30,999
West Los Angeles 90064 26,103
Westchester 90045 40,272
Westwood 90024 50,964
UCLA Health Service Area 656,039
Los Angeles County 9,893,481
Source: U.S. Census Bureau, American Community Survey, 2009-2013, DP05. http://factfinder.census.gov
Of the area population, 48.3% are male and 51.7% are female.
Population by Gender
UCLA Health Service Area Los Angeles County California
Male 48.3% 49.3% 49.7%
Female 51.7% 50.7% 50.3%
Source: U.S. Census Bureau, American Community Survey, 2009-2013, DP05. http://factfinder.census.gov
Resnick Neuropsychiatric Hospital at UCLA Page 24
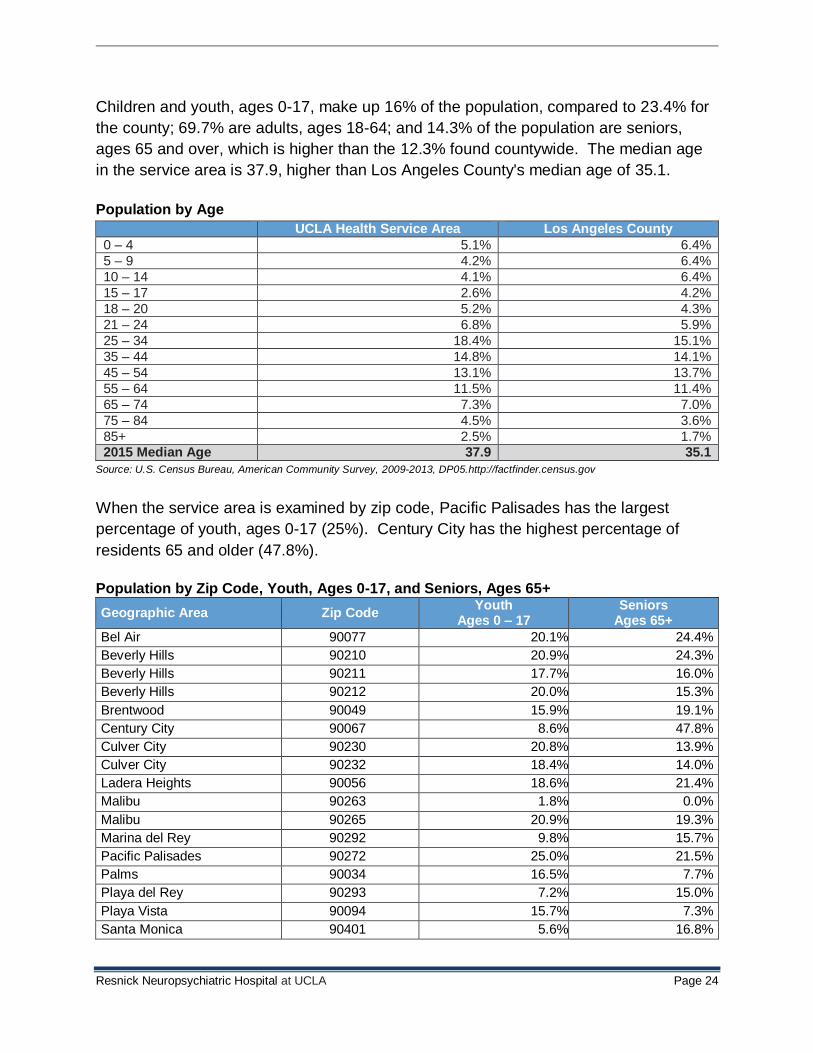
Children and youth, ages 0-17, make up 16% of the population, compared to 23.4% for
the county; 69.7% are adults, ages 18-64; and 14.3% of the population are seniors,
ages 65 and over, which is higher than the 12.3% found countywide. The median age
in the service area is 37.9, higher than Los Angeles County's median age of 35.1.
Population by Age
UCLA Health Service Area Los Angeles County
0 – 4 5.1% 6.4%
5 – 9 4.2% 6.4%
10 – 14 4.1% 6.4%
15 – 17 2.6% 4.2%
18 – 20 5.2% 4.3%
21 – 24 6.8% 5.9%
25 – 34 18.4% 15.1%
35 – 44 14.8% 14.1%
45 – 54 13.1% 13.7%
55 – 64 11.5% 11.4%
65 – 74 7.3% 7.0%
75 – 84 4.5% 3.6%
85+ 2.5% 1.7% 2015 Median Age 37.9 35.1
Source: U.S. Census Bureau, American Community Survey, 2009-2013, DP05.http://factfinder.census.gov
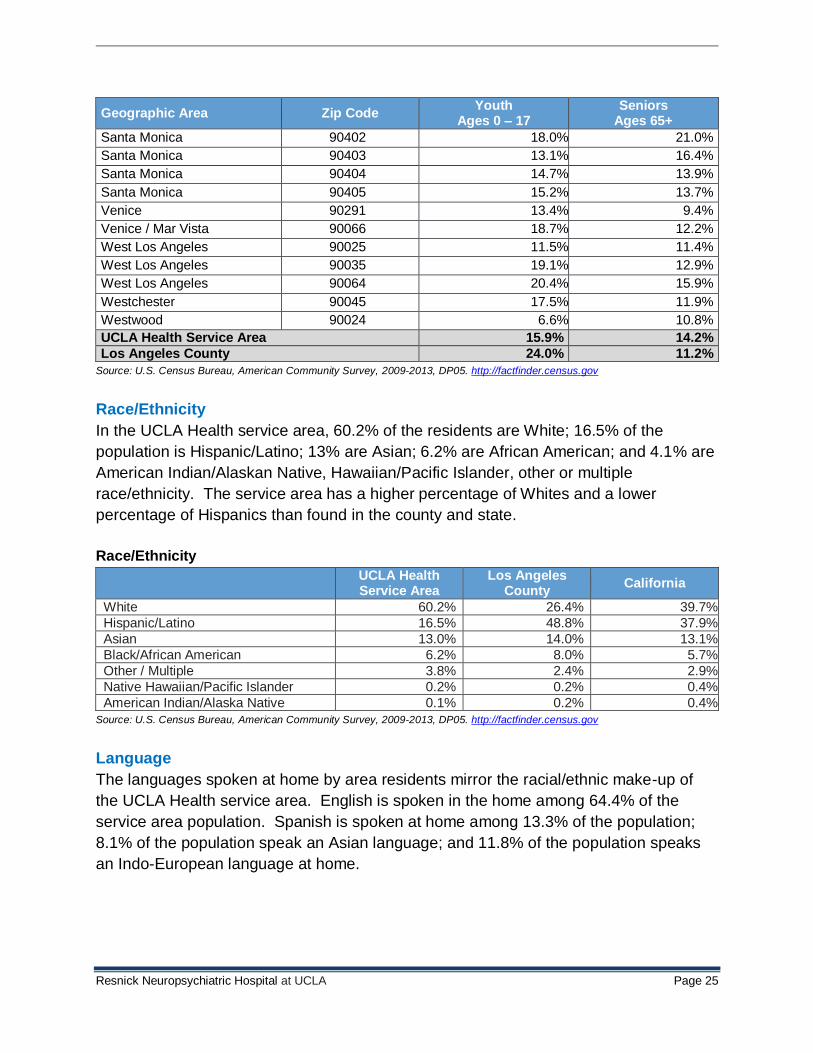
When the service area is examined by zip code, Pacific Palisades has the largest
percentage of youth, ages 0-17 (25%). Century City has the highest percentage of
residents 65 and older (47.8%).
Population by Zip Code, Youth, Ages 0-17, and Seniors, Ages 65+
Geographic Area Zip Code Youth
Ages 0 – 17 Seniors
Ages 65+
Bel Air 90077 20.1% 24.4%
Beverly Hills 90210 20.9% 24.3%
Beverly Hills 90211 17.7% 16.0%
Beverly Hills 90212 20.0% 15.3%
Brentwood 90049 15.9% 19.1%
Century City 90067 8.6% 47.8%
Culver City 90230 20.8% 13.9%
Culver City 90232 18.4% 14.0%
Ladera Heights 90056 18.6% 21.4%
Malibu 90263 1.8% 0.0%
Malibu 90265 20.9% 19.3%
Marina del Rey 90292 9.8% 15.7%
Pacific Palisades 90272 25.0% 21.5%
Palms 90034 16.5% 7.7%
Playa del Rey 90293 7.2% 15.0%
Playa Vista 90094 15.7% 7.3%
Santa Monica 90401 5.6% 16.8%
Resnick Neuropsychiatric Hospital at UCLA Page 25
Geographic Area Zip Code Youth
Ages 0 – 17 Seniors
Ages 65+
Santa Monica 90402 18.0% 21.0%
Santa Monica 90403 13.1% 16.4%
Santa Monica 90404 14.7% 13.9%
Santa Monica 90405 15.2% 13.7%
Venice 90291 13.4% 9.4%
Venice / Mar Vista 90066 18.7% 12.2%
West Los Angeles 90025 11.5% 11.4%
West Los Angeles 90035 19.1% 12.9%
West Los Angeles 90064 20.4% 15.9%
Westchester 90045 17.5% 11.9%
Westwood 90024 6.6% 10.8%
UCLA Health Service Area 15.9% 14.2%
Los Angeles County 24.0% 11.2%
Source: U.S. Census Bureau, American Community Survey, 2009-2013, DP05. http://factfinder.census.gov
Race/Ethnicity
In the UCLA Health service area, 60.2% of the residents are White; 16.5% of the
population is Hispanic/Latino; 13% are Asian; 6.2% are African American; and 4.1% are
American Indian/Alaskan Native, Hawaiian/Pacific Islander, other or multiple
race/ethnicity. The service area has a higher percentage of Whites and a lower
percentage of Hispanics than found in the county and state.
Race/Ethnicity
UCLA Health Service Area
Los Angeles County
California
White 60.2% 26.4% 39.7%
Hispanic/Latino 16.5% 48.8% 37.9%
Asian 13.0% 14.0% 13.1%
Black/African American 6.2% 8.0% 5.7%
Other / Multiple 3.8% 2.4% 2.9%
Native Hawaiian/Pacific Islander 0.2% 0.2% 0.4%
American Indian/Alaska Native 0.1% 0.2% 0.4%
Source: U.S. Census Bureau, American Community Survey, 2009-2013, DP05. http://factfinder.census.gov
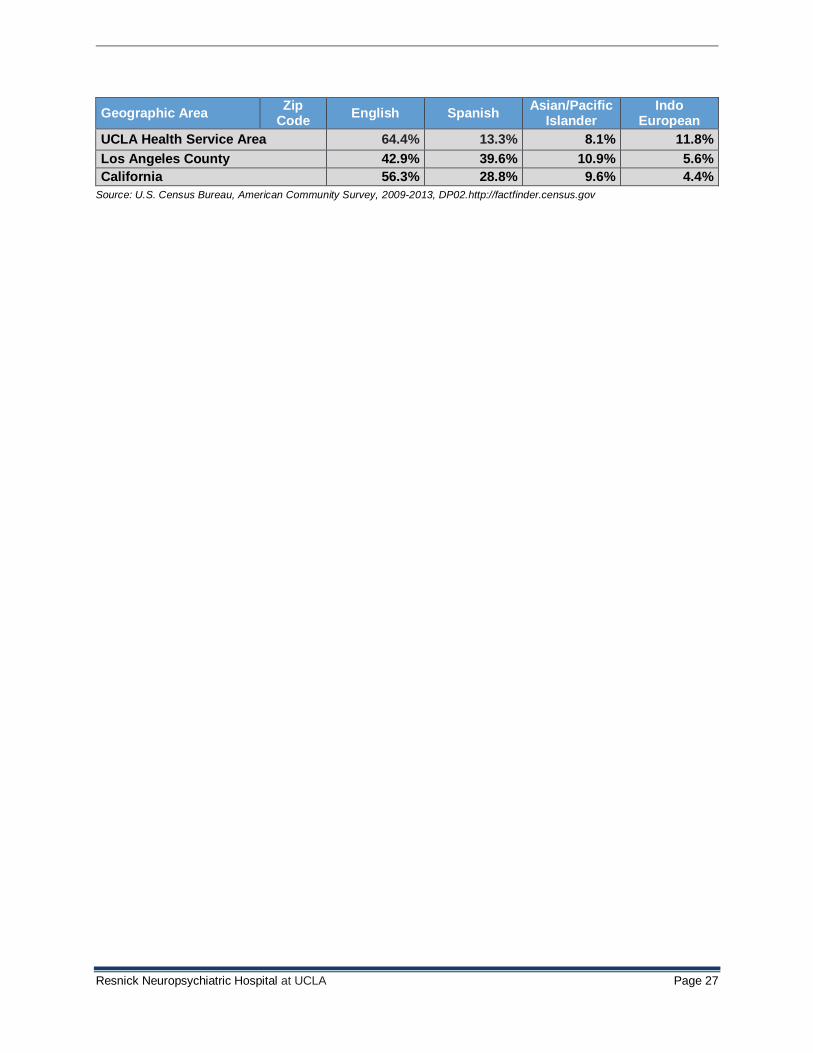
Language
The languages spoken at home by area residents mirror the racial/ethnic make-up of
the UCLA Health service area. English is spoken in the home among 64.4% of the
service area population. Spanish is spoken at home among 13.3% of the population;
8.1% of the population speak an Asian language; and 11.8% of the population speaks
an Indo-European language at home.

Resnick Neuropsychiatric Hospital at UCLA Page 26
Language Spoken at Home, Population 5 Years and Older
UCLA Health Service Area
Los Angeles County
California
Speaks only English 64.4% 42.9% 56.3%
Speaks Spanish 13.3% 39.6% 28.8%
Speak Indo-European language 11.8% 5.6% 4.4%
Speaks Asian/Pacific Islander language 8.1% 10.9% 9.6%
Speaks other language 2.4% 1.1% 0.9%
Source: U.S. Census Bureau, American Community Survey, 2009-2013, DP02.http://factfinder.census.gov
When communities in SPA 5 are examined by zip code and the language spoken in the
home, several communities have higher percentages of Spanish speakers, including
Culver City, Palms, and Venice/Mar Vista. Areas with a high percentage of Asian
language speakers include Westwood, Malibu 90263 and Playa Vista. Beverly Hills has
higher rates of residents who speak Indo-European languages at home.
Language Spoken at Home by Zip Code
Geographic Area Zip
Code English Spanish
Asian/Pacific Islander
Indo European
Bel Air 90077 71.8% 5.3% 3.3% 18.3%
Beverly Hills 90210 50.6% 7.0% 3.3% 35.7%
Beverly Hills 90211 43.7% 5.9% 9.7% 33.2%
Beverly Hills 90212 56.2% 5.7% 7.6% 27.8%
Brentwood 90049 71.1% 5.0% 4.8% 17.9%
Century City 90067 66.0% 2.6% 10.4% 18.1%
Culver City 90230 55.2% 28.6% 8.2% 5.7%
Culver City 90232 57.6% 26.9% 7.5% 5.4%
Ladera Heights 90056 88.5% 6.1% 0.4% 0.5%
Malibu 90263 61.5% 14.4% 16.3% 5.8%
Malibu 90265 84.9% 3.7% 2.9% 8.0%
Marina del Rey 90292 73.1% 6.8% 6.5% 10.1%
Pacific Palisades 90272 82.1% 4.5% 2.3% 9.7%
Palms 90034 49.6% 24.7% 12.4% 10.0%
Playa del Rey 90293 77.7% 6.7% 6.2% 8.9%
Playa Vista 90094 70.9% 2.8% 15.3% 11.0%
Santa Monica 90401 65.4% 11.1% 7.9% 13.4%
Santa Monica 90402 75.7% 6.2% 4.4% 10.9%
Santa Monica 90403 78.3% 4.1% 4.8% 11.9%
Santa Monica 90404 61.8% 20.0% 8.7% 9.2%
Santa Monica 90405 75.5% 10.0% 6.7% 6.5%
Venice 90291 77.3% 14.1% 2.2% 5.9%
Venice / Mar Vista 90066 59.2% 24.3% 8.7% 6.1%
West Los Angeles 90025 57.3% 14.2% 11.7% 15.7%
West Los Angeles 90035 60.0% 9.8% 5.2% 15.7%
West Los Angeles 90064 62.6% 13.5% 12.4% 9.7%
Westchester 90045 72.1% 12.3% 6.0% 6.4%
Westwood 90024 54.9% 8.5% 17.8% 16.2%
Resnick Neuropsychiatric Hospital at UCLA Page 27
Geographic Area Zip
Code English Spanish
Asian/Pacific Islander
Indo European
UCLA Health Service Area 64.4% 13.3% 8.1% 11.8%
Los Angeles County 42.9% 39.6% 10.9% 5.6%
California 56.3% 28.8% 9.6% 4.4%
Source: U.S. Census Bureau, American Community Survey, 2009-2013, DP02.http://factfinder.census.gov
Resnick Neuropsychiatric Hospital at UCLA Page 28
Social and Economic Factors
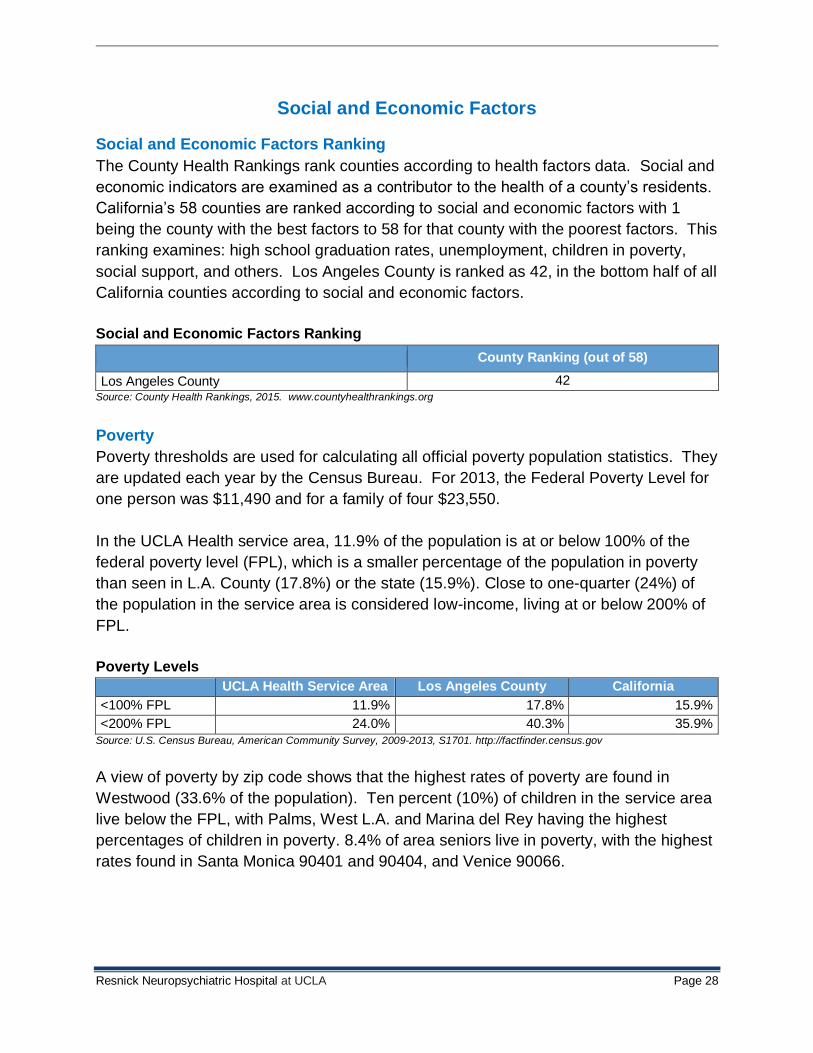
Social and Economic Factors Ranking
The County Health Rankings rank counties according to health factors data. Social and
economic indicators are examined as a contributor to the health of a county’s residents.
California’s 58 counties are ranked according to social and economic factors with 1
being the county with the best factors to 58 for that county with the poorest factors. This
ranking examines: high school graduation rates, unemployment, children in poverty,
social support, and others. Los Angeles County is ranked as 42, in the bottom half of all
California counties according to social and economic factors.
Social and Economic Factors Ranking
County Ranking (out of 58)
Los Angeles County 42 Source: County Health Rankings, 2015. www.countyhealthrankings.org
Poverty
Poverty thresholds are used for calculating all official poverty population statistics. They
are updated each year by the Census Bureau. For 2013, the Federal Poverty Level for
one person was $11,490 and for a family of four $23,550.
In the UCLA Health service area, 11.9% of the population is at or below 100% of the
federal poverty level (FPL), which is a smaller percentage of the population in poverty
than seen in L.A. County (17.8%) or the state (15.9%). Close to one-quarter (24%) of
the population in the service area is considered low-income, living at or below 200% of
FPL.
Poverty Levels
UCLA Health Service Area Los Angeles County California
<100% FPL 11.9% 17.8% 15.9%
<200% FPL 24.0% 40.3% 35.9%
Source: U.S. Census Bureau, American Community Survey, 2009-2013, S1701. http://factfinder.census.gov
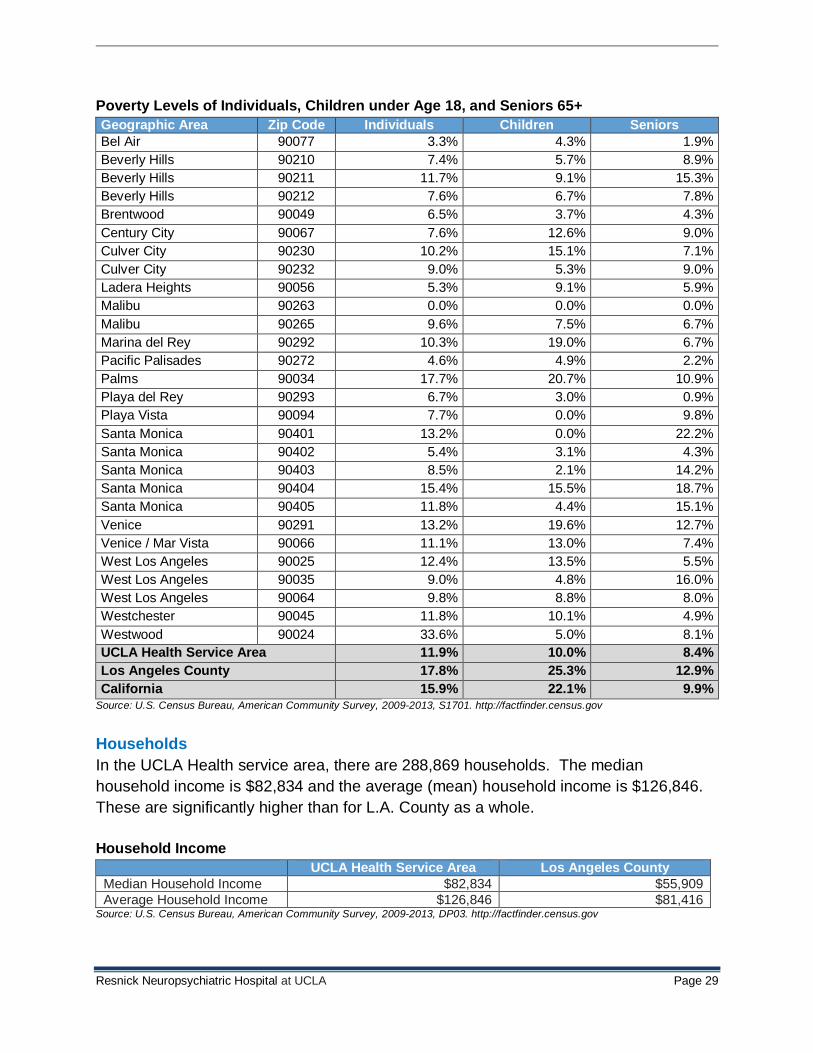
A view of poverty by zip code shows that the highest rates of poverty are found in
Westwood (33.6% of the population). Ten percent (10%) of children in the service area
live below the FPL, with Palms, West L.A. and Marina del Rey having the highest
percentages of children in poverty. 8.4% of area seniors live in poverty, with the highest
rates found in Santa Monica 90401 and 90404, and Venice 90066.
Resnick Neuropsychiatric Hospital at UCLA Page 29
Poverty Levels of Individuals, Children under Age 18, and Seniors 65+
Geographic Area Zip Code Individuals Children Seniors
Bel Air 90077 3.3% 4.3% 1.9%
Beverly Hills 90210 7.4% 5.7% 8.9%
Beverly Hills 90211 11.7% 9.1% 15.3%
Beverly Hills 90212 7.6% 6.7% 7.8%
Brentwood 90049 6.5% 3.7% 4.3%
Century City 90067 7.6% 12.6% 9.0%
Culver City 90230 10.2% 15.1% 7.1%
Culver City 90232 9.0% 5.3% 9.0%
Ladera Heights 90056 5.3% 9.1% 5.9%
Malibu 90263 0.0% 0.0% 0.0%
Malibu 90265 9.6% 7.5% 6.7%
Marina del Rey 90292 10.3% 19.0% 6.7%
Pacific Palisades 90272 4.6% 4.9% 2.2%
Palms 90034 17.7% 20.7% 10.9%
Playa del Rey 90293 6.7% 3.0% 0.9%
Playa Vista 90094 7.7% 0.0% 9.8%
Santa Monica 90401 13.2% 0.0% 22.2%
Santa Monica 90402 5.4% 3.1% 4.3%
Santa Monica 90403 8.5% 2.1% 14.2%
Santa Monica 90404 15.4% 15.5% 18.7%
Santa Monica 90405 11.8% 4.4% 15.1%
Venice 90291 13.2% 19.6% 12.7%
Venice / Mar Vista 90066 11.1% 13.0% 7.4%
West Los Angeles 90025 12.4% 13.5% 5.5%
West Los Angeles 90035 9.0% 4.8% 16.0%
West Los Angeles 90064 9.8% 8.8% 8.0%
Westchester 90045 11.8% 10.1% 4.9%
Westwood 90024 33.6% 5.0% 8.1%
UCLA Health Service Area 11.9% 10.0% 8.4%
Los Angeles County 17.8% 25.3% 12.9%
California 15.9% 22.1% 9.9% Source: U.S. Census Bureau, American Community Survey, 2009-2013, S1701. http://factfinder.census.gov
Households
In the UCLA Health service area, there are 288,869 households. The median
household income is $82,834 and the average (mean) household income is $126,846.
These are significantly higher than for L.A. County as a whole.
Household Income
UCLA Health Service Area Los Angeles County
Median Household Income $82,834 $55,909
Average Household Income $126,846 $81,416 Source: U.S. Census Bureau, American Community Survey, 2009-2013, DP03. http://factfinder.census.gov
Resnick Neuropsychiatric Hospital at UCLA Page 30
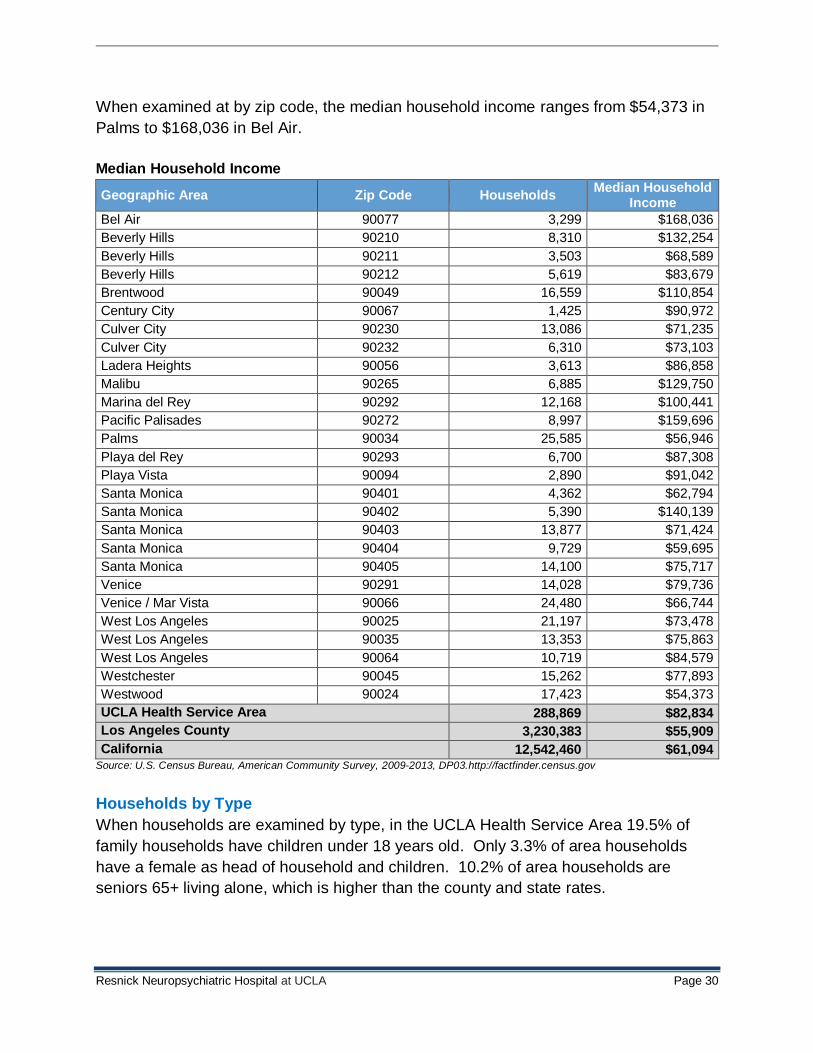
When examined at by zip code, the median household income ranges from $54,373 in
Palms to $168,036 in Bel Air.
Median Household Income
Geographic Area Zip Code Households Median Household
Income
Bel Air 90077 3,299 $168,036
Beverly Hills 90210 8,310 $132,254
Beverly Hills 90211 3,503 $68,589
Beverly Hills 90212 5,619 $83,679
Brentwood 90049 16,559 $110,854
Century City 90067 1,425 $90,972
Culver City 90230 13,086 $71,235
Culver City 90232 6,310 $73,103
Ladera Heights 90056 3,613 $86,858
Malibu 90265 6,885 $129,750
Marina del Rey 90292 12,168 $100,441
Pacific Palisades 90272 8,997 $159,696
Palms 90034 25,585 $56,946
Playa del Rey 90293 6,700 $87,308
Playa Vista 90094 2,890 $91,042
Santa Monica 90401 4,362 $62,794
Santa Monica 90402 5,390 $140,139
Santa Monica 90403 13,877 $71,424
Santa Monica 90404 9,729 $59,695
Santa Monica 90405 14,100 $75,717
Venice 90291 14,028 $79,736
Venice / Mar Vista 90066 24,480 $66,744
West Los Angeles 90025 21,197 $73,478
West Los Angeles 90035 13,353 $75,863
West Los Angeles 90064 10,719 $84,579
Westchester 90045 15,262 $77,893
Westwood 90024 17,423 $54,373
UCLA Health Service Area 288,869 $82,834
Los Angeles County 3,230,383 $55,909
California 12,542,460 $61,094 Source: U.S. Census Bureau, American Community Survey, 2009-2013, DP03.http://factfinder.census.gov
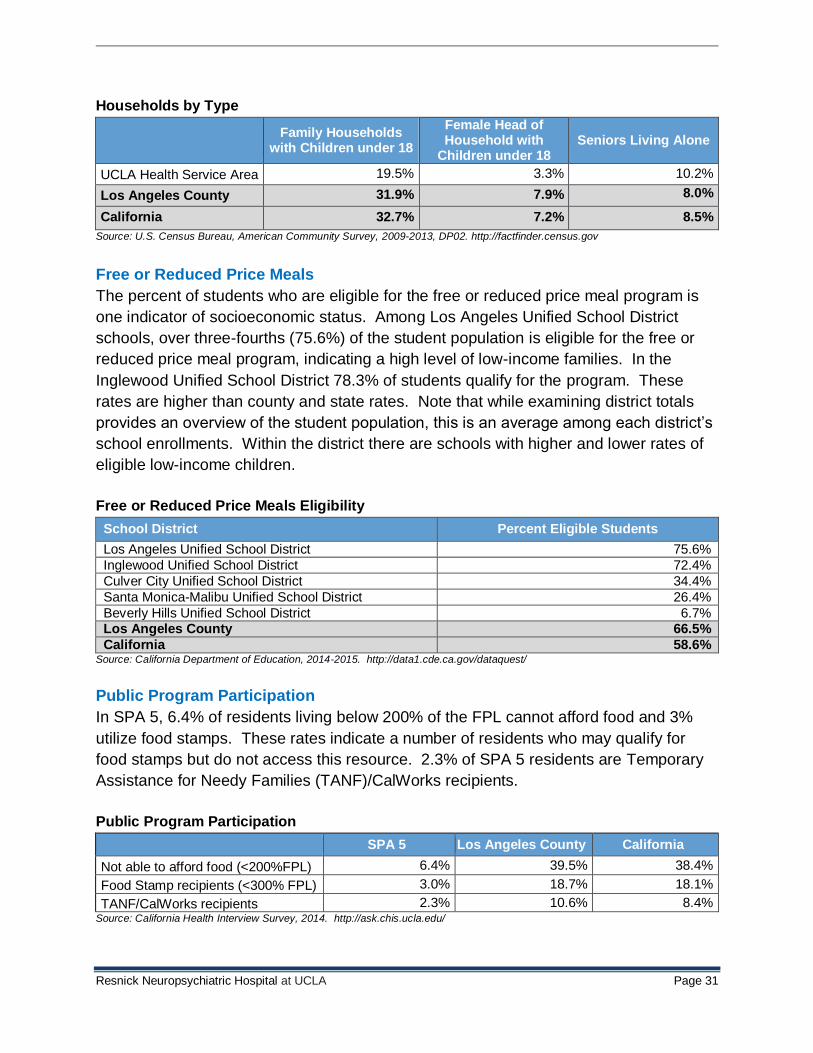
Households by Type
When households are examined by type, in the UCLA Health Service Area 19.5% of
family households have children under 18 years old. Only 3.3% of area households
have a female as head of household and children. 10.2% of area households are
seniors 65+ living alone, which is higher than the county and state rates.
Resnick Neuropsychiatric Hospital at UCLA Page 31
Households by Type
Family Households
with Children under 18
Female Head of Household with
Children under 18 Seniors Living Alone
UCLA Health Service Area 19.5% 3.3% 10.2%
Los Angeles County 31.9% 7.9% 8.0%
California 32.7% 7.2% 8.5%
Source: U.S. Census Bureau, American Community Survey, 2009-2013, DP02. http://factfinder.census.gov
Free or Reduced Price Meals
The percent of students who are eligible for the free or reduced price meal program is
one indicator of socioeconomic status. Among Los Angeles Unified School District
schools, over three-fourths (75.6%) of the student population is eligible for the free or
reduced price meal program, indicating a high level of low-income families. In the
Inglewood Unified School District 78.3% of students qualify for the program. These
rates are higher than county and state rates. Note that while examining district totals
provides an overview of the student population, this is an average among each district’s
school enrollments. Within the district there are schools with higher and lower rates of
eligible low-income children.
Free or Reduced Price Meals Eligibility
School District Percent Eligible Students
Los Angeles Unified School District 75.6%
Inglewood Unified School District 72.4%
Culver City Unified School District 34.4%
Santa Monica-Malibu Unified School District 26.4%
Beverly Hills Unified School District 6.7% Los Angeles County 66.5%
California 58.6% Source: California Department of Education, 2014-2015. http://data1.cde.ca.gov/dataquest/
Public Program Participation
In SPA 5, 6.4% of residents living below 200% of the FPL cannot afford food and 3%
utilize food stamps. These rates indicate a number of residents who may qualify for
food stamps but do not access this resource. 2.3% of SPA 5 residents are Temporary
Assistance for Needy Families (TANF)/CalWorks recipients.
Public Program Participation
SPA 5 Los Angeles County California
Not able to afford food (<200%FPL) 6.4% 39.5% 38.4%
Food Stamp recipients (<300% FPL) 3.0% 18.7% 18.1%
TANF/CalWorks recipients 2.3% 10.6% 8.4% Source: California Health Interview Survey, 2014. http://ask.chis.ucla.edu/
Resnick Neuropsychiatric Hospital at UCLA Page 32
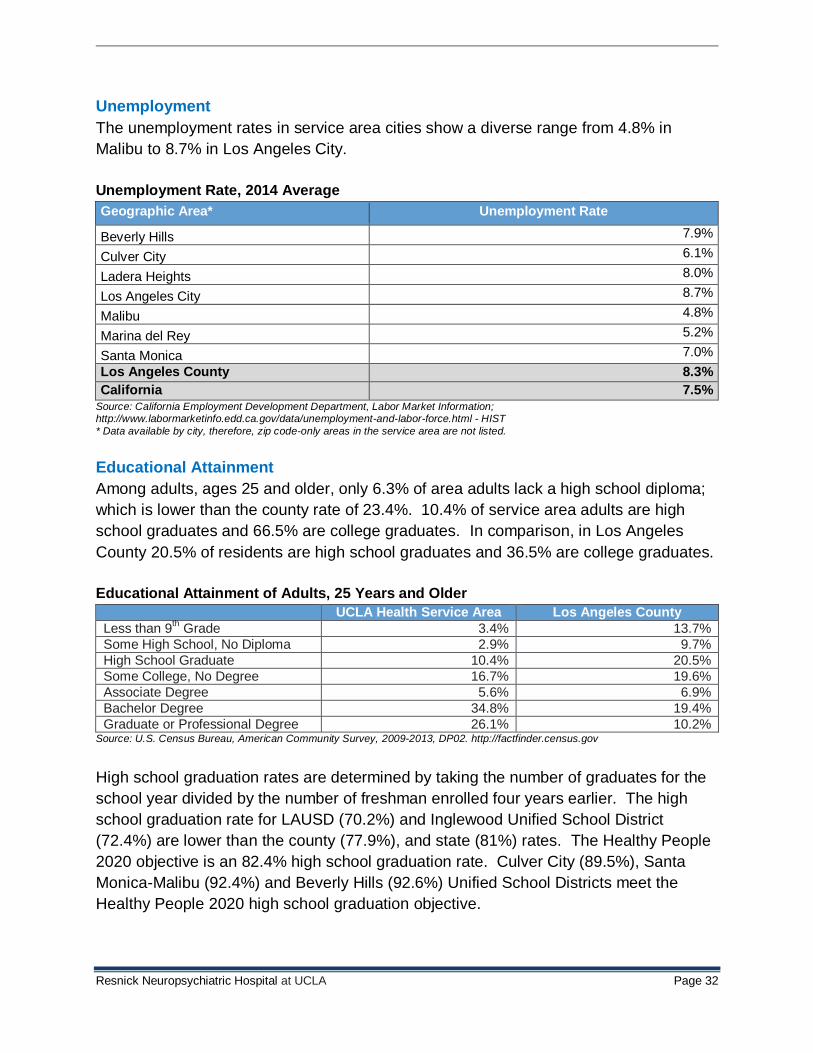
Unemployment
The unemployment rates in service area cities show a diverse range from 4.8% in
Malibu to 8.7% in Los Angeles City.
Unemployment Rate, 2014 Average
Geographic Area* Unemployment Rate
Beverly Hills 7.9%
Culver City 6.1%
Ladera Heights 8.0%
Los Angeles City 8.7%
Malibu 4.8%
Marina del Rey 5.2%
Santa Monica 7.0%
Los Angeles County 8.3%
California 7.5% Source: California Employment Development Department, Labor Market Information; http://www.labormarketinfo.edd.ca.gov/data/unemployment-and-labor-force.html - HIST * Data available by city, therefore, zip code-only areas in the service area are not listed.
Educational Attainment
Among adults, ages 25 and older, only 6.3% of area adults lack a high school diploma;
which is lower than the county rate of 23.4%. 10.4% of service area adults are high
school graduates and 66.5% are college graduates. In comparison, in Los Angeles
County 20.5% of residents are high school graduates and 36.5% are college graduates.
Educational Attainment of Adults, 25 Years and Older
UCLA Health Service Area Los Angeles County
Less than 9th Grade 3.4% 13.7%
Some High School, No Diploma 2.9% 9.7%
High School Graduate 10.4% 20.5%
Some College, No Degree 16.7% 19.6%
Associate Degree 5.6% 6.9%
Bachelor Degree 34.8% 19.4%
Graduate or Professional Degree 26.1% 10.2% Source: U.S. Census Bureau, American Community Survey, 2009-2013, DP02. http://factfinder.census.gov
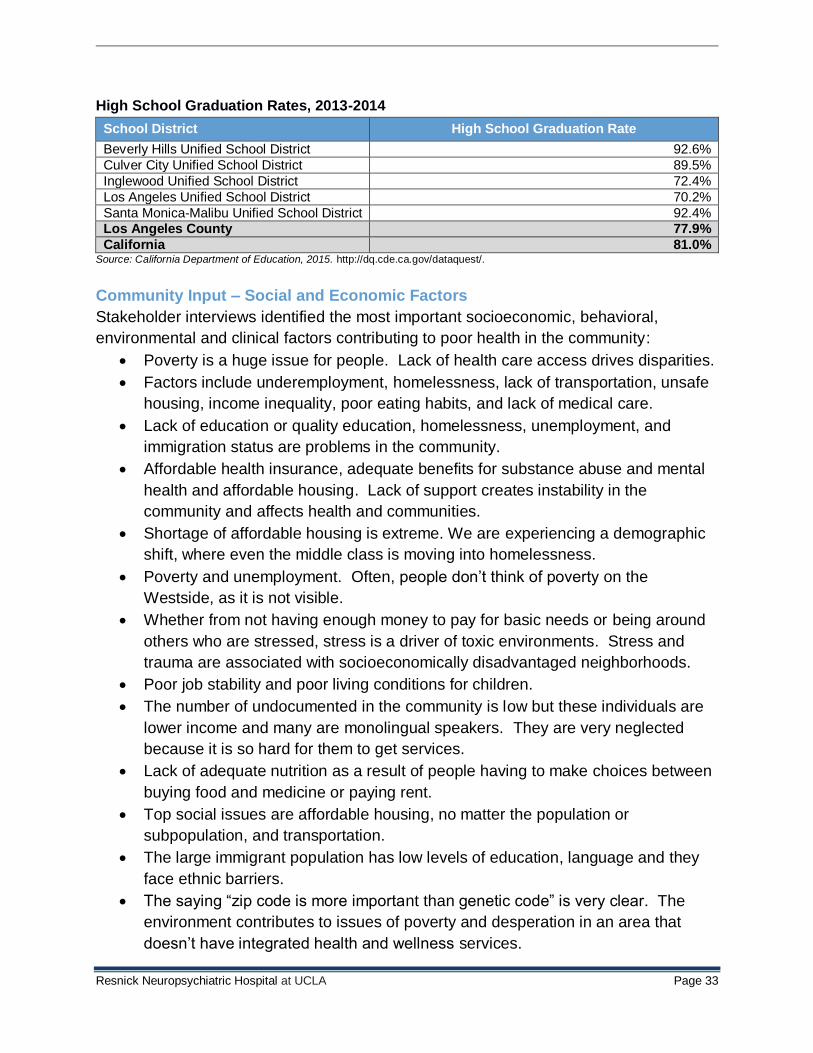
High school graduation rates are determined by taking the number of graduates for the
school year divided by the number of freshman enrolled four years earlier. The high
school graduation rate for LAUSD (70.2%) and Inglewood Unified School District
(72.4%) are lower than the county (77.9%), and state (81%) rates. The Healthy People
2020 objective is an 82.4% high school graduation rate. Culver City (89.5%), Santa
Monica-Malibu (92.4%) and Beverly Hills (92.6%) Unified School Districts meet the
Healthy People 2020 high school graduation objective.
Resnick Neuropsychiatric Hospital at UCLA Page 33
High School Graduation Rates, 2013-2014
School District High School Graduation Rate
Beverly Hills Unified School District 92.6%
Culver City Unified School District 89.5%
Inglewood Unified School District 72.4%
Los Angeles Unified School District 70.2%
Santa Monica-Malibu Unified School District 92.4% Los Angeles County 77.9%
California 81.0% Source: California Department of Education, 2015. http://dq.cde.ca.gov/dataquest/.
Community Input – Social and Economic Factors
Stakeholder interviews identified the most important socioeconomic, behavioral,
environmental and clinical factors contributing to poor health in the community:
Poverty is a huge issue for people. Lack of health care access drives disparities.
Factors include underemployment, homelessness, lack of transportation, unsafe
housing, income inequality, poor eating habits, and lack of medical care.
Lack of education or quality education, homelessness, unemployment, and
immigration status are problems in the community.
Affordable health insurance, adequate benefits for substance abuse and mental
health and affordable housing. Lack of support creates instability in the
community and affects health and communities.
Shortage of affordable housing is extreme. We are experiencing a demographic
shift, where even the middle class is moving into homelessness.
Poverty and unemployment. Often, people don’t think of poverty on the
Westside, as it is not visible.
Whether from not having enough money to pay for basic needs or being around
others who are stressed, stress is a driver of toxic environments. Stress and
trauma are associated with socioeconomically disadvantaged neighborhoods.
Poor job stability and poor living conditions for children.
The number of undocumented in the community is low but these individuals are
lower income and many are monolingual speakers. They are very neglected
because it is so hard for them to get services.
Lack of adequate nutrition as a result of people having to make choices between
buying food and medicine or paying rent.
Top social issues are affordable housing, no matter the population or
subpopulation, and transportation.
The large immigrant population has low levels of education, language and they
face ethnic barriers.
The saying “zip code is more important than genetic code” is very clear. The
environment contributes to issues of poverty and desperation in an area that
doesn’t have integrated health and wellness services.
Resnick Neuropsychiatric Hospital at UCLA Page 34
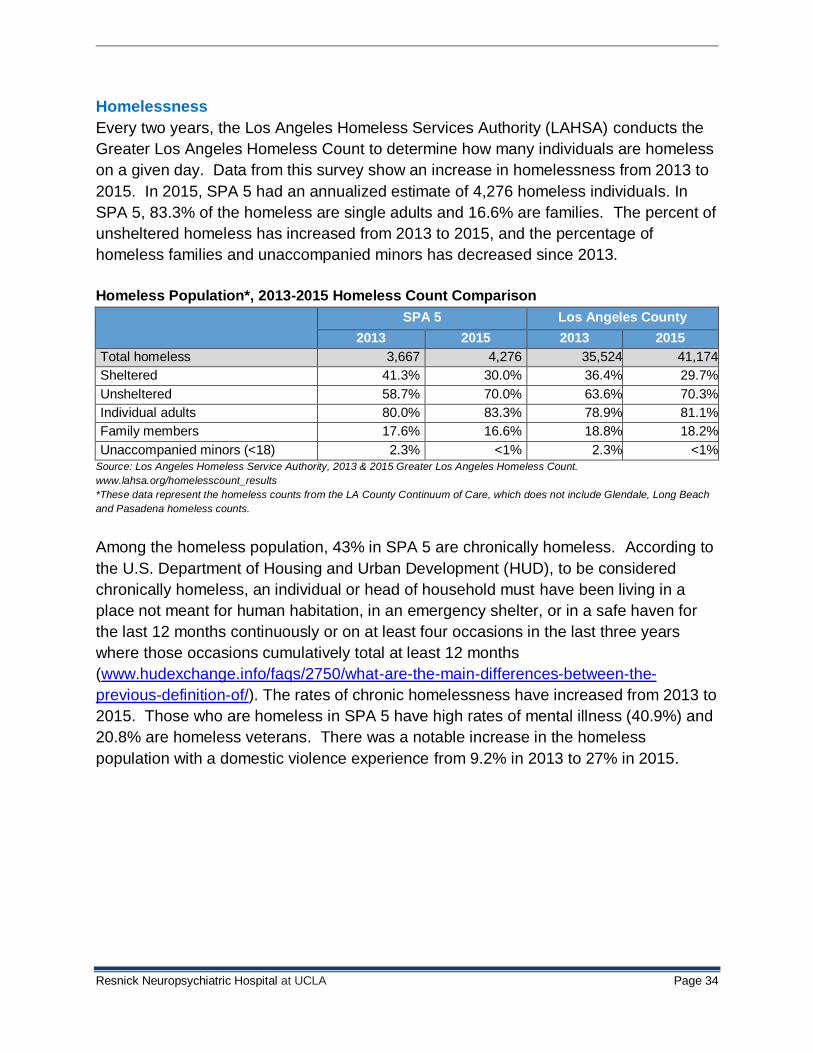
Homelessness
Every two years, the Los Angeles Homeless Services Authority (LAHSA) conducts the
Greater Los Angeles Homeless Count to determine how many individuals are homeless
on a given day. Data from this survey show an increase in homelessness from 2013 to
2015. In 2015, SPA 5 had an annualized estimate of 4,276 homeless individuals. In
SPA 5, 83.3% of the homeless are single adults and 16.6% are families. The percent of
unsheltered homeless has increased from 2013 to 2015, and the percentage of
homeless families and unaccompanied minors has decreased since 2013.
Homeless Population*, 2013-2015 Homeless Count Comparison
SPA 5 Los Angeles County
2013 2015 2013 2015
Total homeless 3,667 4,276 35,524 41,174
Sheltered 41.3% 30.0% 36.4% 29.7%
Unsheltered 58.7% 70.0% 63.6% 70.3%
Individual adults 80.0% 83.3% 78.9% 81.1%
Family members 17.6% 16.6% 18.8% 18.2%
Unaccompanied minors (<18) 2.3% <1% 2.3% <1% Source: Los Angeles Homeless Service Authority, 2013 & 2015 Greater Los Angeles Homeless Count.
www.lahsa.org/homelesscount_results *These data represent the homeless counts from the LA County Continuum of Care, which does not include Glendale, Long Beach
and Pasadena homeless counts.
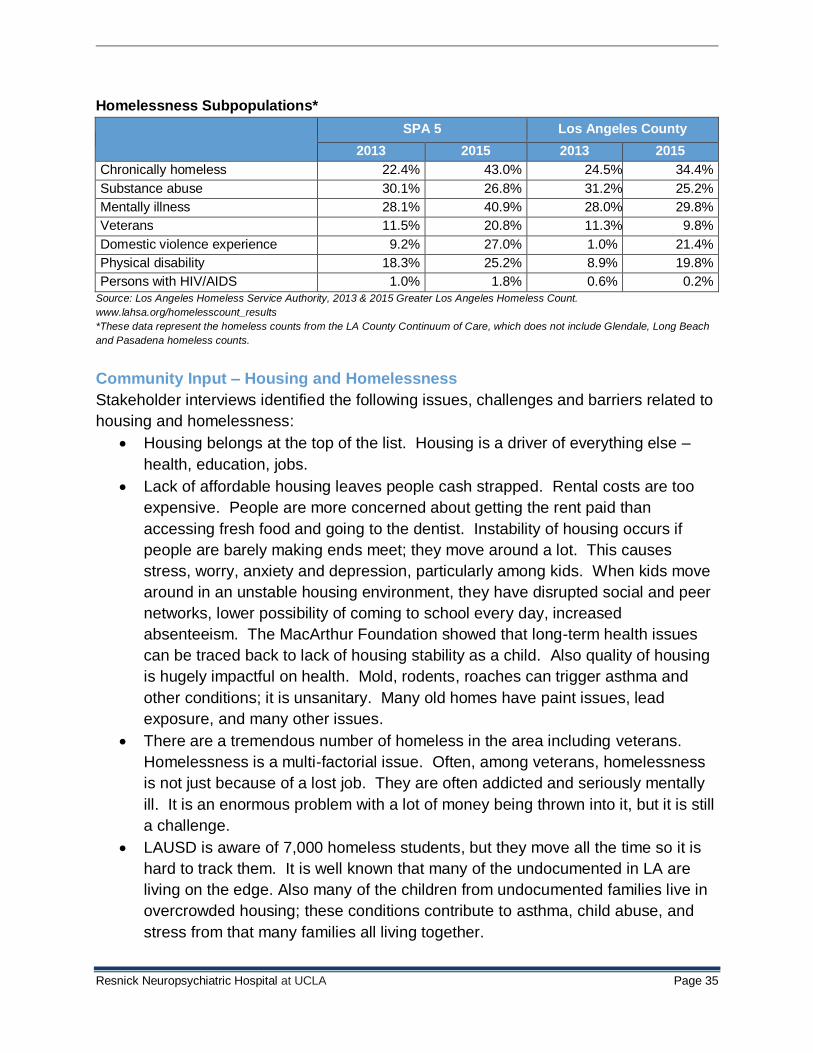
Among the homeless population, 43% in SPA 5 are chronically homeless. According to
the U.S. Department of Housing and Urban Development (HUD), to be considered
chronically homeless, an individual or head of household must have been living in a
place not meant for human habitation, in an emergency shelter, or in a safe haven for
the last 12 months continuously or on at least four occasions in the last three years
where those occasions cumulatively total at least 12 months
(www.hudexchange.info/faqs/2750/what-are-the-main-differences-between-the-
previous-definition-of/). The rates of chronic homelessness have increased from 2013 to
2015. Those who are homeless in SPA 5 have high rates of mental illness (40.9%) and
20.8% are homeless veterans. There was a notable increase in the homeless
population with a domestic violence experience from 9.2% in 2013 to 27% in 2015.
Resnick Neuropsychiatric Hospital at UCLA Page 35
Homelessness Subpopulations*
SPA 5 Los Angeles County
2013 2015 2013 2015
Chronically homeless 22.4% 43.0% 24.5% 34.4%
Substance abuse 30.1% 26.8% 31.2% 25.2%
Mentally illness 28.1% 40.9% 28.0% 29.8%
Veterans 11.5% 20.8% 11.3% 9.8%
Domestic violence experience 9.2% 27.0% 1.0% 21.4%
Physical disability 18.3% 25.2% 8.9% 19.8%
Persons with HIV/AIDS 1.0% 1.8% 0.6% 0.2%
Source: Los Angeles Homeless Service Authority, 2013 & 2015 Greater Los Angeles Homeless Count.
www.lahsa.org/homelesscount_results *These data represent the homeless counts from the LA County Continuum of Care, which does not include Glendale, Long Beach
and Pasadena homeless counts.
Community Input – Housing and Homelessness
Stakeholder interviews identified the following issues, challenges and barriers related to
housing and homelessness:
Housing belongs at the top of the list. Housing is a driver of everything else –
health, education, jobs.
Lack of affordable housing leaves people cash strapped. Rental costs are too
expensive. People are more concerned about getting the rent paid than
accessing fresh food and going to the dentist. Instability of housing occurs if
people are barely making ends meet; they move around a lot. This causes
stress, worry, anxiety and depression, particularly among kids. When kids move
around in an unstable housing environment, they have disrupted social and peer
networks, lower possibility of coming to school every day, increased
absenteeism. The MacArthur Foundation showed that long-term health issues
can be traced back to lack of housing stability as a child. Also quality of housing
is hugely impactful on health. Mold, rodents, roaches can trigger asthma and
other conditions; it is unsanitary. Many old homes have paint issues, lead
exposure, and many other issues.
There are a tremendous number of homeless in the area including veterans.
Homelessness is a multi-factorial issue. Often, among veterans, homelessness
is not just because of a lost job. They are often addicted and seriously mentally
ill. It is an enormous problem with a lot of money being thrown into it, but it is still
a challenge.
LAUSD is aware of 7,000 homeless students, but they move all the time so it is
hard to track them. It is well known that many of the undocumented in LA are
living on the edge. Also many of the children from undocumented families live in
overcrowded housing; these conditions contribute to asthma, child abuse, and
stress from that many families all living together.
Resnick Neuropsychiatric Hospital at UCLA Page 36
Housing is the number one issue that people identify. For the chronically
mentally ill, it is very difficult to get them to accept services. There are huge
movements in LA and nationally to place the homeless in a livable situation and
then provide supportive wraparound services. This model has helped, but there
are more homeless than services and resources. People who have lost jobs now
live in cars or couch surf. They would be amenable to support if they could get it.
This is a systemic issue.
Homelessness is getting worse because of a lack of affordable housing. It is so
hard to maintain stable housing so they can’t even get off the streets. There are
some really good health efforts with the departments of Housing and Mental
Health. And there is a coordinated entry system with the LA Housing Services
Authority working to consolidate services so a person can go to one place for
eligibility of services. There is better coordination of services but it is still
insufficient to meet the need.
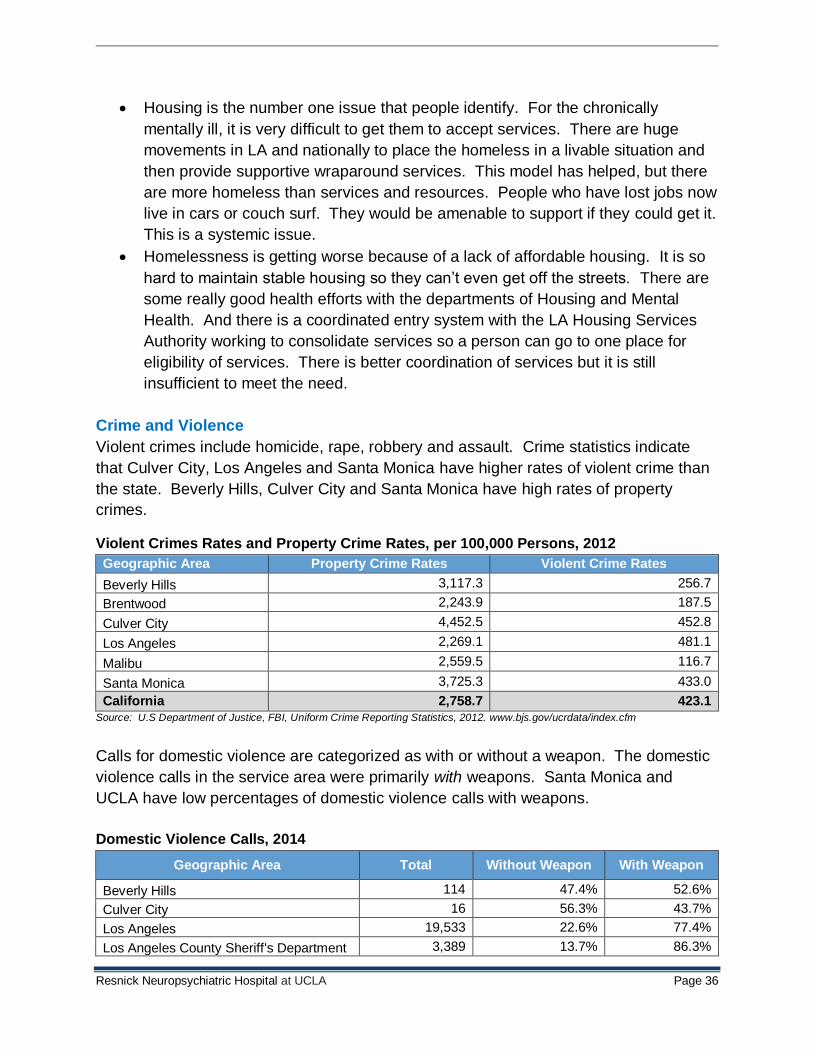
Crime and Violence
Violent crimes include homicide, rape, robbery and assault. Crime statistics indicate
that Culver City, Los Angeles and Santa Monica have higher rates of violent crime than
the state. Beverly Hills, Culver City and Santa Monica have high rates of property
crimes.
Violent Crimes Rates and Property Crime Rates, per 100,000 Persons, 2012
Geographic Area Property Crime Rates Violent Crime Rates
Beverly Hills 3,117.3 256.7
Brentwood 2,243.9 187.5
Culver City 4,452.5 452.8
Los Angeles 2,269.1 481.1
Malibu 2,559.5 116.7
Santa Monica 3,725.3 433.0
California 2,758.7 423.1 Source: U.S Department of Justice, FBI, Uniform Crime Reporting Statistics, 2012. www.bjs.gov/ucrdata/index.cfm
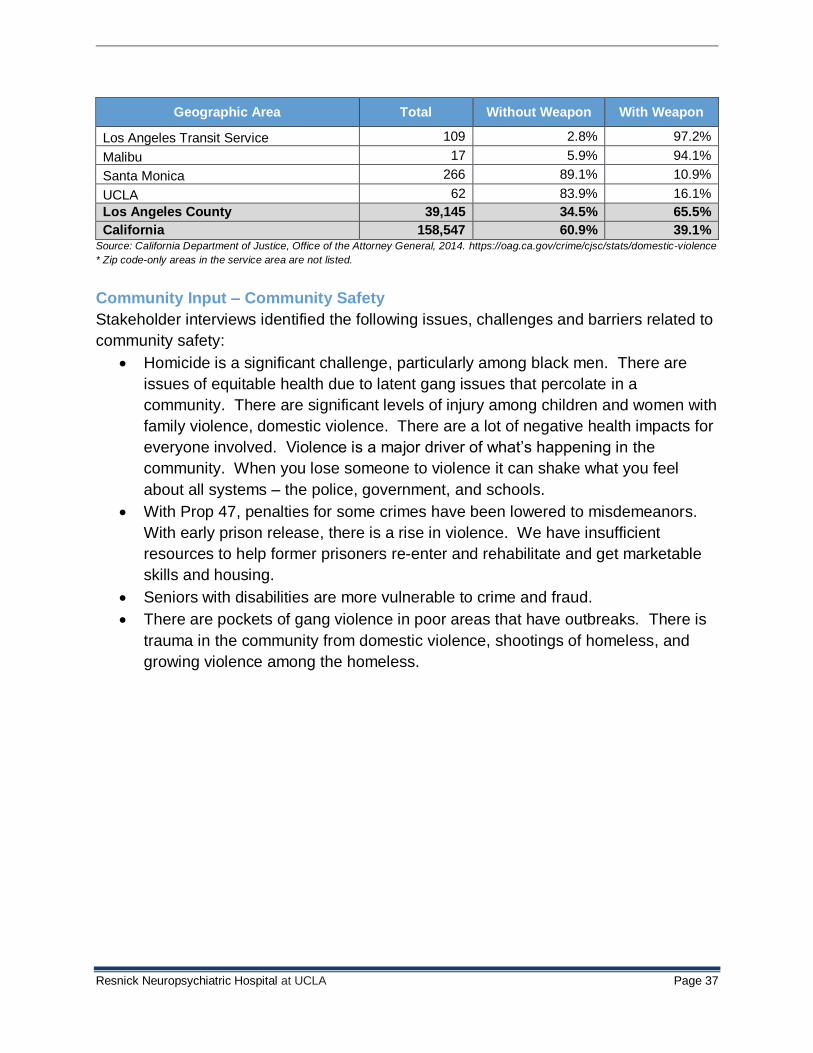
Calls for domestic violence are categorized as with or without a weapon. The domestic
violence calls in the service area were primarily with weapons. Santa Monica and
UCLA have low percentages of domestic violence calls with weapons.
Domestic Violence Calls, 2014
Geographic Area Total Without Weapon With Weapon
Beverly Hills 114 47.4% 52.6%
Culver City 16 56.3% 43.7%
Los Angeles 19,533 22.6% 77.4%
Los Angeles County Sheriff's Department 3,389 13.7% 86.3%
Resnick Neuropsychiatric Hospital at UCLA Page 37
Geographic Area Total Without Weapon With Weapon
Los Angeles Transit Service 109 2.8% 97.2%
Malibu 17 5.9% 94.1%
Santa Monica 266 89.1% 10.9%
UCLA 62 83.9% 16.1%
Los Angeles County 39,145 34.5% 65.5%
California 158,547 60.9% 39.1% Source: California Department of Justice, Office of the Attorney General, 2014. https://oag.ca.gov/crime/cjsc/stats/domestic-violence * Zip code-only areas in the service area are not listed.
Community Input – Community Safety
Stakeholder interviews identified the following issues, challenges and barriers related to
community safety:
Homicide is a significant challenge, particularly among black men. There are
issues of equitable health due to latent gang issues that percolate in a
community. There are significant levels of injury among children and women with
family violence, domestic violence. There are a lot of negative health impacts for
everyone involved. Violence is a major driver of what’s happening in the
community. When you lose someone to violence it can shake what you feel
about all systems – the police, government, and schools.
With Prop 47, penalties for some crimes have been lowered to misdemeanors.
With early prison release, there is a rise in violence. We have insufficient
resources to help former prisoners re-enter and rehabilitate and get marketable
skills and housing.
Seniors with disabilities are more vulnerable to crime and fraud.
There are pockets of gang violence in poor areas that have outbreaks. There is
trauma in the community from domestic violence, shootings of homeless, and
growing violence among the homeless.
Resnick Neuropsychiatric Hospital at UCLA Page 38
Health Care Access
Health Insurance Coverage
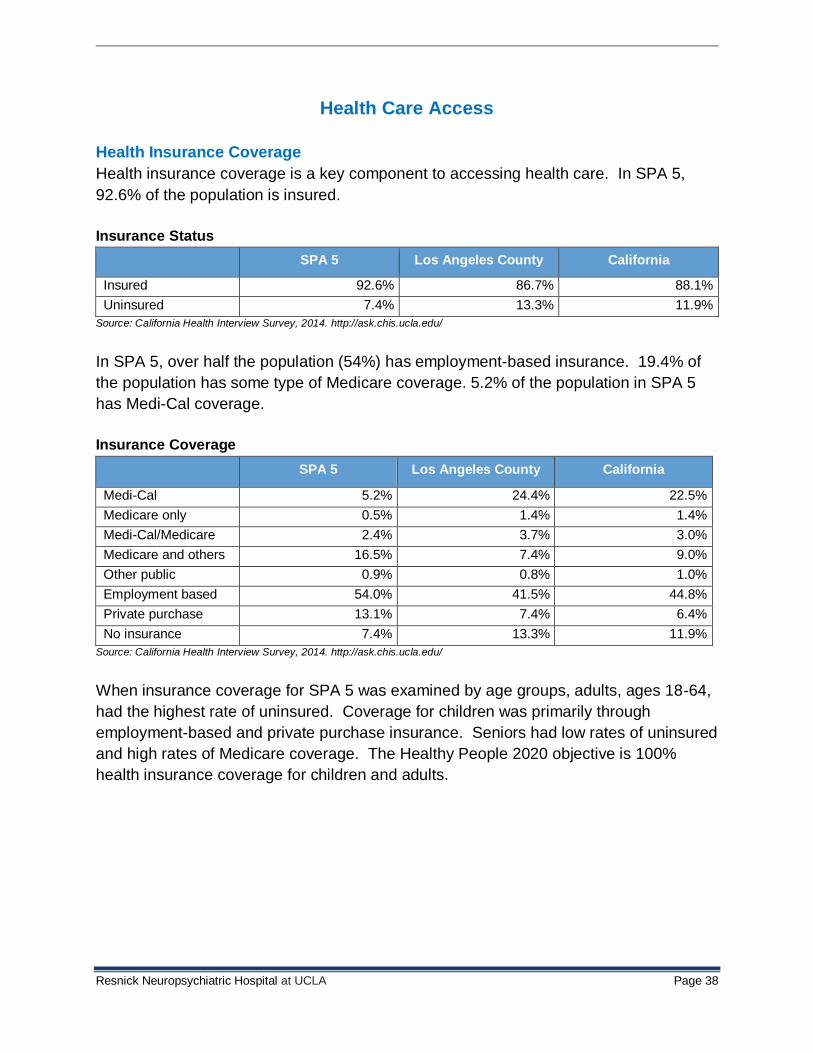
Health insurance coverage is a key component to accessing health care. In SPA 5,
92.6% of the population is insured.
Insurance Status
SPA 5 Los Angeles County California
Insured 92.6% 86.7% 88.1%
Uninsured 7.4% 13.3% 11.9%
Source: California Health Interview Survey, 2014. http://ask.chis.ucla.edu/
In SPA 5, over half the population (54%) has employment-based insurance. 19.4% of
the population has some type of Medicare coverage. 5.2% of the population in SPA 5
has Medi-Cal coverage.
Insurance Coverage
SPA 5 Los Angeles County California
Medi-Cal 5.2% 24.4% 22.5%
Medicare only 0.5% 1.4% 1.4%
Medi-Cal/Medicare 2.4% 3.7% 3.0%
Medicare and others 16.5% 7.4% 9.0%
Other public 0.9% 0.8% 1.0%
Employment based 54.0% 41.5% 44.8%
Private purchase 13.1% 7.4% 6.4%
No insurance 7.4% 13.3% 11.9%
Source: California Health Interview Survey, 2014. http://ask.chis.ucla.edu/
When insurance coverage for SPA 5 was examined by age groups, adults, ages 18-64,
had the highest rate of uninsured. Coverage for children was primarily through
employment-based and private purchase insurance. Seniors had low rates of uninsured
and high rates of Medicare coverage. The Healthy People 2020 objective is 100%
health insurance coverage for children and adults.
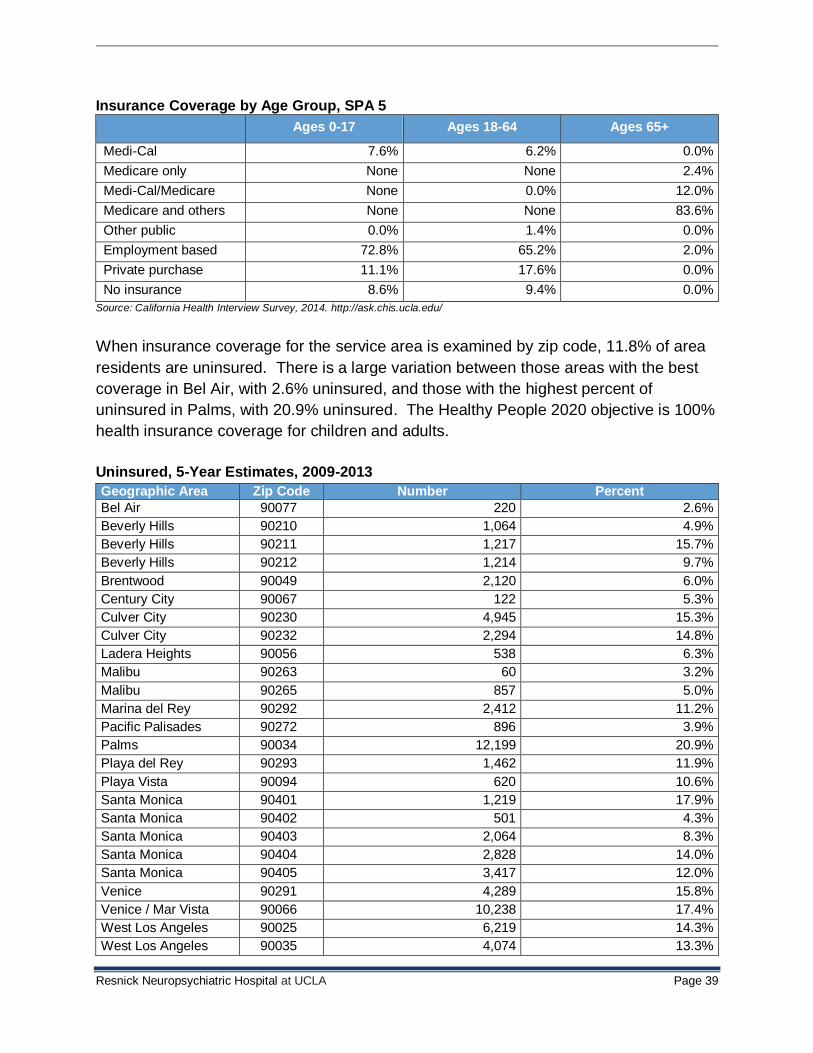
Resnick Neuropsychiatric Hospital at UCLA Page 39
Insurance Coverage by Age Group, SPA 5
Ages 0-17 Ages 18-64 Ages 65+
Medi-Cal 7.6% 6.2% 0.0%
Medicare only None None 2.4%
Medi-Cal/Medicare None 0.0% 12.0%
Medicare and others None None 83.6%
Other public 0.0% 1.4% 0.0%
Employment based 72.8% 65.2% 2.0%
Private purchase 11.1% 17.6% 0.0%
No insurance 8.6% 9.4% 0.0%
Source: California Health Interview Survey, 2014. http://ask.chis.ucla.edu/
When insurance coverage for the service area is examined by zip code, 11.8% of area
residents are uninsured. There is a large variation between those areas with the best
coverage in Bel Air, with 2.6% uninsured, and those with the highest percent of
uninsured in Palms, with 20.9% uninsured. The Healthy People 2020 objective is 100%
health insurance coverage for children and adults.
Uninsured, 5-Year Estimates, 2009-2013
Geographic Area Zip Code Number Percent
Bel Air 90077 220 2.6%
Beverly Hills 90210 1,064 4.9%
Beverly Hills 90211 1,217 15.7%
Beverly Hills 90212 1,214 9.7%
Brentwood 90049 2,120 6.0%
Century City 90067 122 5.3%
Culver City 90230 4,945 15.3%
Culver City 90232 2,294 14.8%
Ladera Heights 90056 538 6.3%
Malibu 90263 60 3.2%
Malibu 90265 857 5.0%
Marina del Rey 90292 2,412 11.2%
Pacific Palisades 90272 896 3.9%
Palms 90034 12,199 20.9%
Playa del Rey 90293 1,462 11.9%
Playa Vista 90094 620 10.6%
Santa Monica 90401 1,219 17.9%
Santa Monica 90402 501 4.3%
Santa Monica 90403 2,064 8.3%
Santa Monica 90404 2,828 14.0%
Santa Monica 90405 3,417 12.0%
Venice 90291 4,289 15.8%
Venice / Mar Vista 90066 10,238 17.4%
West Los Angeles 90025 6,219 14.3%
West Los Angeles 90035 4,074 13.3%
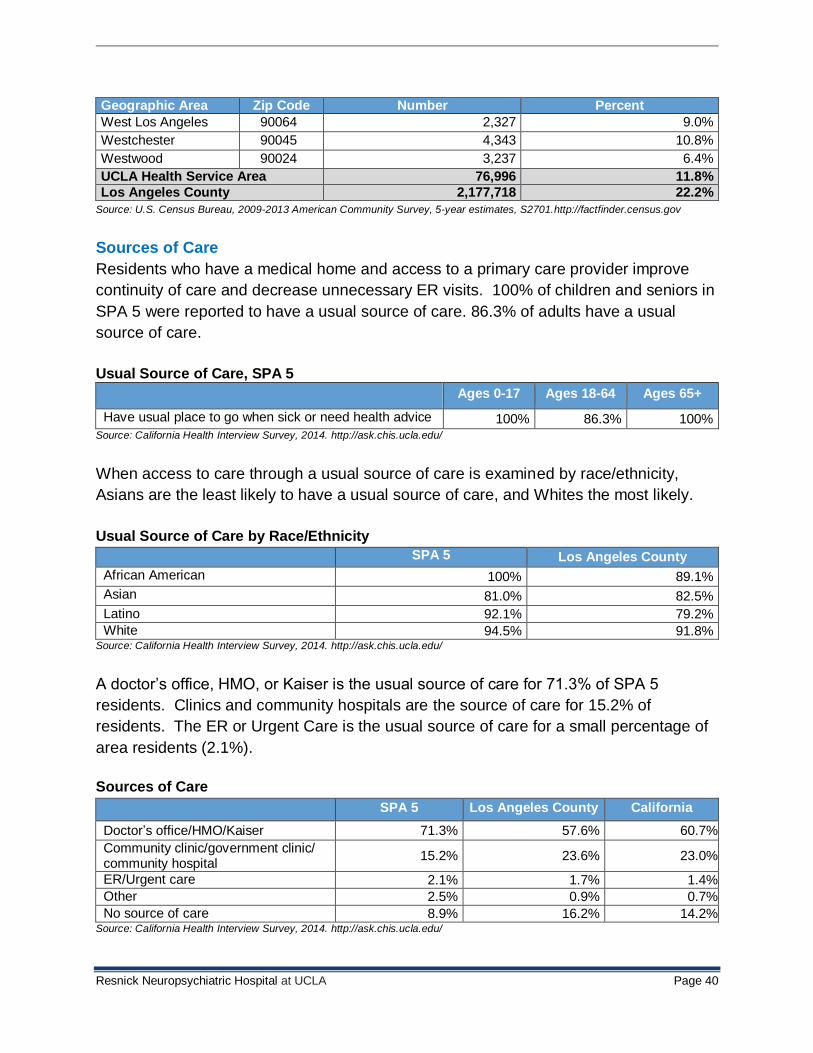
Resnick Neuropsychiatric Hospital at UCLA Page 40
Geographic Area Zip Code Number Percent
West Los Angeles 90064 2,327 9.0%
Westchester 90045 4,343 10.8%
Westwood 90024 3,237 6.4%
UCLA Health Service Area 76,996 11.8%
Los Angeles County 2,177,718 22.2%
Source: U.S. Census Bureau, 2009-2013 American Community Survey, 5-year estimates, S2701.http://factfinder.census.gov
Sources of Care
Residents who have a medical home and access to a primary care provider improve
continuity of care and decrease unnecessary ER visits. 100% of children and seniors in
SPA 5 were reported to have a usual source of care. 86.3% of adults have a usual
source of care.
Usual Source of Care, SPA 5
Ages 0-17 Ages 18-64 Ages 65+
Have usual place to go when sick or need health advice 100% 86.3% 100% Source: California Health Interview Survey, 2014. http://ask.chis.ucla.edu/
When access to care through a usual source of care is examined by race/ethnicity,
Asians are the least likely to have a usual source of care, and Whites the most likely.
Usual Source of Care by Race/Ethnicity
SPA 5 Los Angeles County
African American 100% 89.1%
Asian 81.0% 82.5%
Latino 92.1% 79.2%
White 94.5% 91.8% Source: California Health Interview Survey, 2014. http://ask.chis.ucla.edu/
A doctor’s office, HMO, or Kaiser is the usual source of care for 71.3% of SPA 5
residents. Clinics and community hospitals are the source of care for 15.2% of
residents. The ER or Urgent Care is the usual source of care for a small percentage of
area residents (2.1%).
Sources of Care
SPA 5 Los Angeles County California
Doctor’s office/HMO/Kaiser 71.3% 57.6% 60.7%
Community clinic/government clinic/ community hospital
15.2% 23.6% 23.0%
ER/Urgent care 2.1% 1.7% 1.4%
Other 2.5% 0.9% 0.7%
No source of care 8.9% 16.2% 14.2% Source: California Health Interview Survey, 2014. http://ask.chis.ucla.edu/

Resnick Neuropsychiatric Hospital at UCLA Page 41
17.9% of SPA 5 residents visited an ER over the period of a year, and youth visited the
ER at the highest rates (28.3%); these were higher than the rates seen county-wide.
SPA 5 residents living in poverty visit the ER at lower rates than seen in the county and
the state.
Use of Emergency Room
SPA 5 Los Angeles County California
Visited ER in last 12 months 17.9% 16.6% 17.4%
0-17 years old 28.3% 19.7% 19.3%
18-64 years old 17.3% 15.7% 16.5%
65 and older 11.5% 15.5% 18.4%
<100% of poverty level 7.7% 17.7% 20.6%
<200% of poverty level 9.6% 16.7% 19.8% Source: California Health Interview Survey, 2014. http://ask.chis.ucla.edu/
Barriers to Care
Adults in the service area experience a number of barriers to accessing care, including
cost of care and lack of a medical home.
Barriers to Accessing Health Care
SPA 5 Los Angeles
County
Adults unable to afford dental care in the past year 19.4% 30.3%
Adults unable to afford medical care in the past year 12.2% 16.0%
Adults unable to afford mental health care in the past year 6.5% 6.1%
Adults unable to afford prescription medication in the past year 9.8% 15.4%
Adults who reported difficulty accessing medical care 17.0% 31.7% Source: Los Angeles County Department of Public Health, Office of Health Assessment and Epidemiology, Los Angeles County
Health Survey 2011. http://www.publichealth.lacounty.gov/ha/LACHSDataTopics2011.htm
Access to Primary Care Community Health Centers
Community Health Centers provide primary care (including medical, dental and mental
health services) for uninsured and medically underserved populations. Using Zip Code
data for the service area and information from the Uniform Data System (UDS)1, 24.0%
of the population in the service area is categorized as low-income (200% of Federal
Poverty Level) and 11.9% of the population are living in poverty.
There are several Section 330 funded grantees (Federally Qualified Health Centers –
FQHCs and FQHC Look-Alikes) located in the service area, including: Westside Family
Health Center, Venice Family Clinic, Saban Community Clinic, Korean Health Education
Information and Research Center, and the Los Angeles LGBT Center.
1The UDS is an annual reporting requirement for grantees of HRSA primary care programs:
• Community Health Center, Section 330 • Migrant Health Center, Section 330 • Health Care for the Homeless, Section 330 •
Public Housing Primary Care, Section 330
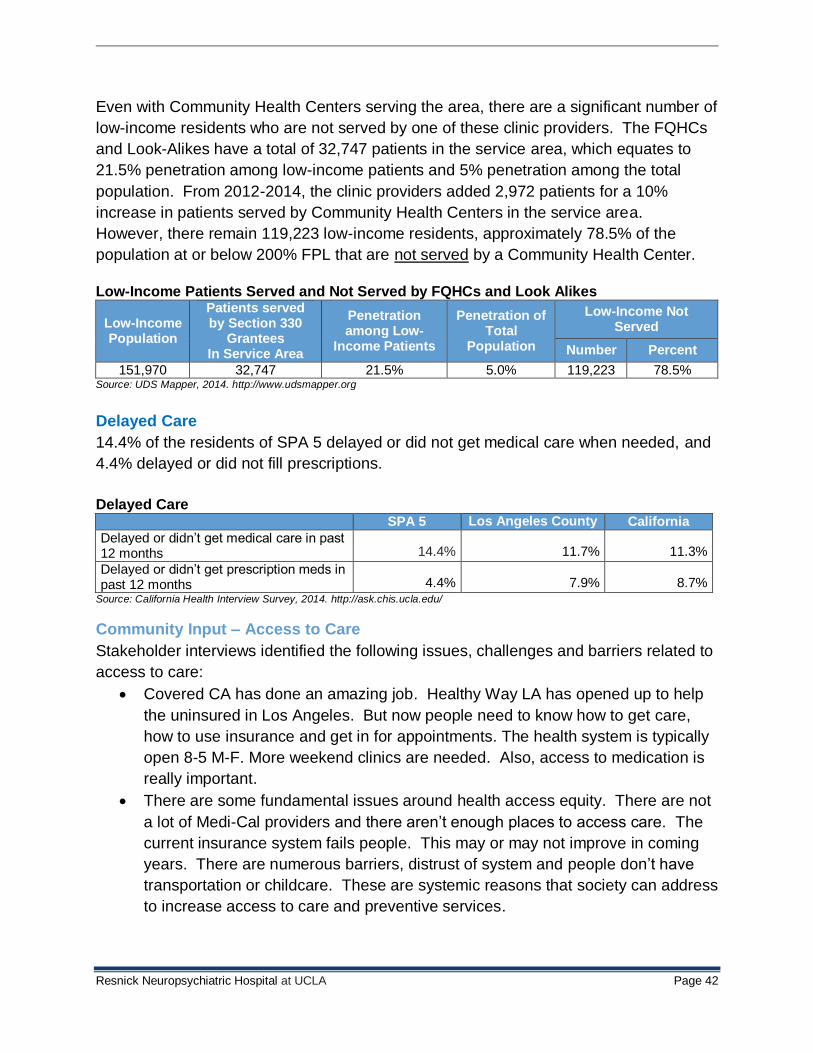
Resnick Neuropsychiatric Hospital at UCLA Page 42
Even with Community Health Centers serving the area, there are a significant number of
low-income residents who are not served by one of these clinic providers. The FQHCs
and Look-Alikes have a total of 32,747 patients in the service area, which equates to
21.5% penetration among low-income patients and 5% penetration among the total
population. From 2012-2014, the clinic providers added 2,972 patients for a 10%
increase in patients served by Community Health Centers in the service area.
However, there remain 119,223 low-income residents, approximately 78.5% of the
population at or below 200% FPL that are not served by a Community Health Center.
Low-Income Patients Served and Not Served by FQHCs and Look Alikes
Low-Income Population
Patients served by Section 330
Grantees In Service Area
Penetration among Low-
Income Patients
Penetration of Total
Population
Low-Income Not Served
Number Percent
151,970 32,747 21.5% 5.0% 119,223 78.5% Source: UDS Mapper, 2014. http://www.udsmapper.org
Delayed Care
14.4% of the residents of SPA 5 delayed or did not get medical care when needed, and
4.4% delayed or did not fill prescriptions.
Delayed Care SPA 5 Los Angeles County California
Delayed or didn’t get medical care in past 12 months 14.4% 11.7% 11.3%
Delayed or didn’t get prescription meds in past 12 months 4.4% 7.9% 8.7%
Source: California Health Interview Survey, 2014. http://ask.chis.ucla.edu/
Community Input – Access to Care
Stakeholder interviews identified the following issues, challenges and barriers related to
access to care:
Covered CA has done an amazing job. Healthy Way LA has opened up to help
the uninsured in Los Angeles. But now people need to know how to get care,
how to use insurance and get in for appointments. The health system is typically
open 8-5 M-F. More weekend clinics are needed. Also, access to medication is
really important.
There are some fundamental issues around health access equity. There are not
a lot of Medi-Cal providers and there aren’t enough places to access care. The
current insurance system fails people. This may or may not improve in coming
years. There are numerous barriers, distrust of system and people don’t have
transportation or childcare. These are systemic reasons that society can address
to increase access to care and preventive services.
Resnick Neuropsychiatric Hospital at UCLA Page 43
There is a lot of confusion with the Affordable Care Act (ACA) and access to
easy immunizations because kids now need to go to their assigned doctor and
not the local clinic. In Malibu, they don’t have doctors who take Medi-Cal. There
are many undocumented people in the community and to get care they need to
get to Santa Monica or go to Agoura Hills.
It can be very challenging to access good care for cultural issues. With the
passage of the ACA, many people are now eligible for care who were not before.
In the last couple of years, access has gotten better. Now the access issues
have shifted from access to navigation of the system. We have a lot of people
who need complete support in getting enrolled, and staying in the system. Case
managers and navigators are critical to the process.
Low-income African American and Hispanic families cannot afford the health
insurance copayments. There are a number of people not eligible for Medi-Cal
or Covered CA because they are undocumented or homeless. Other populations
that have trouble accessing care are seniors, veterans, young parents and youth.
Language is a big issue, access to insurance has helped, but there are still
barriers to care because there so many languages spoken and the
undocumented still have access to care issues. There are large and increasing
numbers of people seen in community clinics and FQHCs.
An available health care work force for mental health, primary care and
preventive care for newly insured individuals is lacking. There has been a
challenge to get care for the newly insured, but other than that, we are seeing
some improvements to accessing care.
Access to care is very serious, particularly with persons who are uninsured and
undocumented, and especially within limited English populations. It is especially
difficult to access specialty care. For primary care, it is a bit better with
community and county clinics. The number of uninsured has decreased but
people don’t know how to use their benefits. Even though they have My Health
LA, there is fear and lack of knowledge on how to access care. But accessing
specialty care is really tough, and it has gotten worse in the past couple of years
for multiple reasons. The low reimbursement rates are unattractive to those who
serve that population and possibly not feasible. Also, the need to address
cultural and linguistic issues to engage people in specialty care makes it even
harder.
Access to care will improve. It seems to be on the initial tip of starting to improve
with the ACA. More people have access as they enroll in insurance and those
access challenges will start to be addressed with more people insured. Will
people know how to use it, maximize it? That is yet to be seen. Improved levels
of literacy around health benefits are needed.
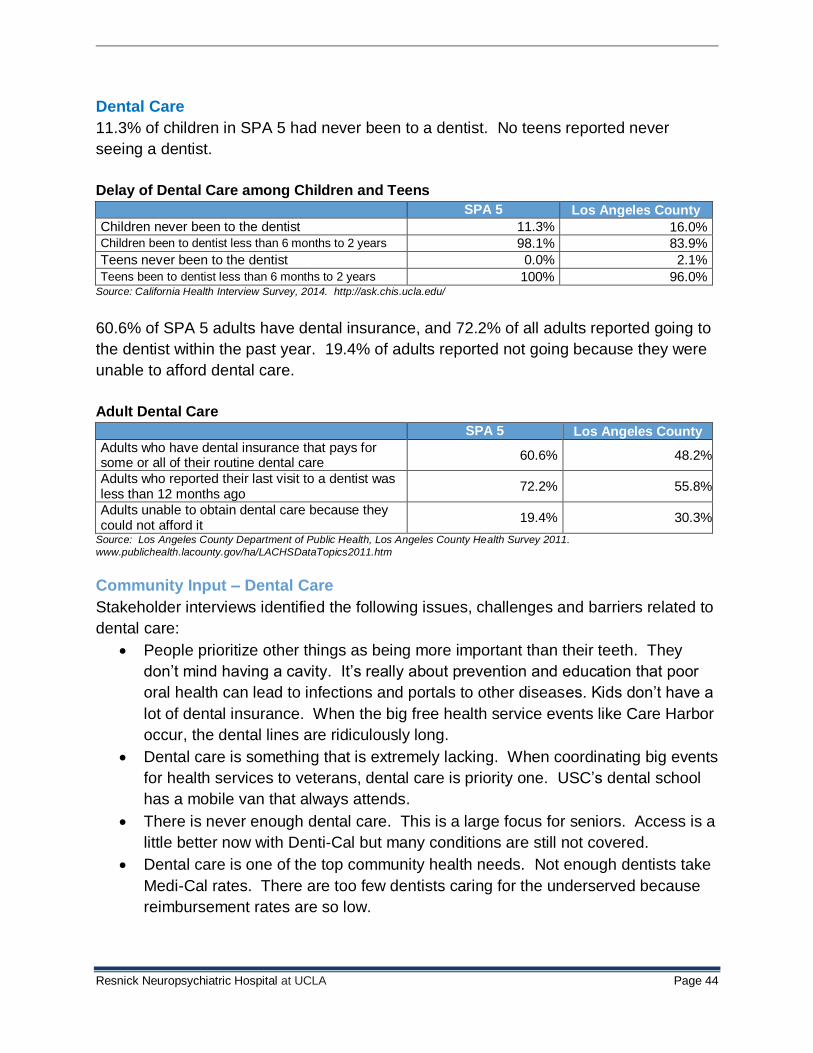
Resnick Neuropsychiatric Hospital at UCLA Page 44
Dental Care
11.3% of children in SPA 5 had never been to a dentist. No teens reported never
seeing a dentist.
Delay of Dental Care among Children and Teens
SPA 5 Los Angeles County
Children never been to the dentist 11.3% 16.0% Children been to dentist less than 6 months to 2 years 98.1% 83.9%
Teens never been to the dentist 0.0% 2.1%
Teens been to dentist less than 6 months to 2 years 100% 96.0% Source: California Health Interview Survey, 2014. http://ask.chis.ucla.edu/
60.6% of SPA 5 adults have dental insurance, and 72.2% of all adults reported going to
the dentist within the past year. 19.4% of adults reported not going because they were
unable to afford dental care.
Adult Dental Care
SPA 5 Los Angeles County
Adults who have dental insurance that pays for some or all of their routine dental care
60.6% 48.2%
Adults who reported their last visit to a dentist was less than 12 months ago
72.2% 55.8%
Adults unable to obtain dental care because they could not afford it
19.4% 30.3%
Source: Los Angeles County Department of Public Health, Los Angeles County Health Survey 2011.
www.publichealth.lacounty.gov/ha/LACHSDataTopics2011.htm
Community Input – Dental Care
Stakeholder interviews identified the following issues, challenges and barriers related to
dental care:
People prioritize other things as being more important than their teeth. They
don’t mind having a cavity. It’s really about prevention and education that poor
oral health can lead to infections and portals to other diseases. Kids don’t have a
lot of dental insurance. When the big free health service events like Care Harbor
occur, the dental lines are ridiculously long.
Dental care is something that is extremely lacking. When coordinating big events
for health services to veterans, dental care is priority one. USC’s dental school
has a mobile van that always attends.
There is never enough dental care. This is a large focus for seniors. Access is a
little better now with Denti-Cal but many conditions are still not covered.
Dental care is one of the top community health needs. Not enough dentists take
Medi-Cal rates. There are too few dentists caring for the underserved because
reimbursement rates are so low.
Resnick Neuropsychiatric Hospital at UCLA Page 45
Populations impacted and needing dental care are low-income adults, chronically
homeless, substance abusers, veterans, and kids.
Oral health screening is a huge issue. When conducting free screenings at the
high schools, extraordinary amounts of oral disease are discovered each year:
7% of students have abscesses and 50% need to see a dentist.
Dental problems affect kids and cause them to miss school days. They have
subclinical diseases that result in pain and suffering that gets in the way of their
ability to learn. Lack of dental care is a low level issue that is so prevalent that it
is a major issue. But it doesn’t rise to the level of awareness of other issues like
asthma. Dental disease goes undetected until it is a very big problem. There are
not enough dentists who will care for low-income populations.
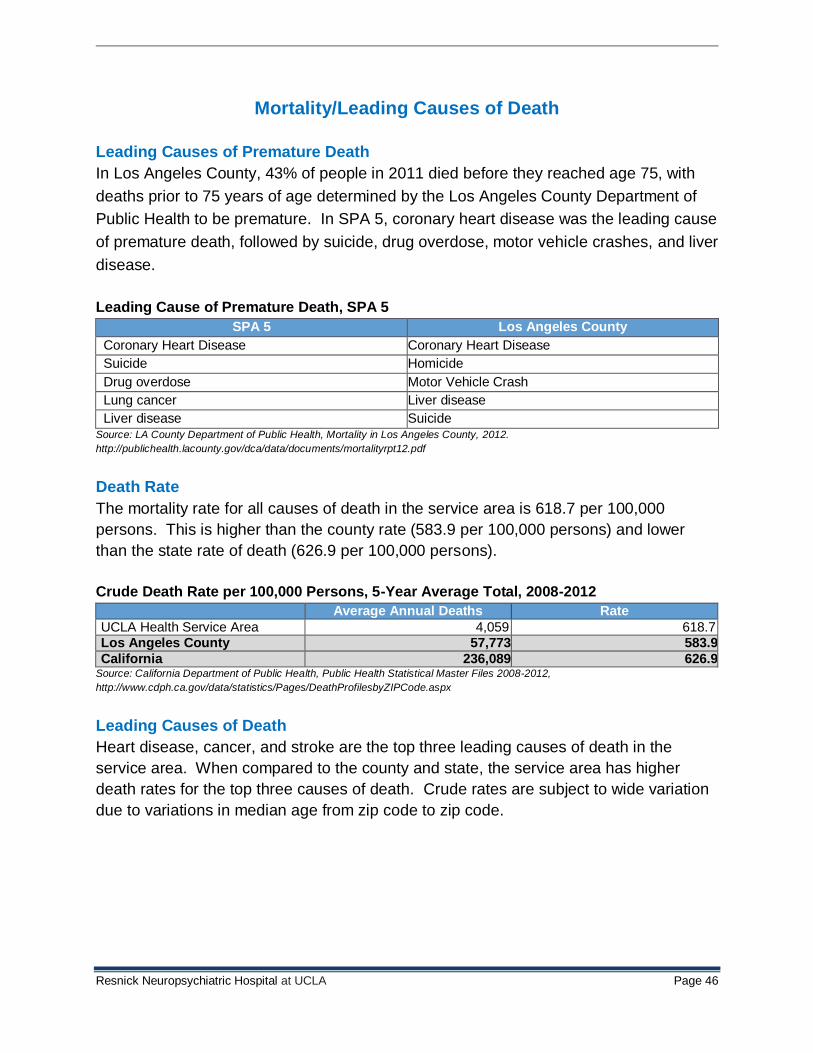
Resnick Neuropsychiatric Hospital at UCLA Page 46
Mortality/Leading Causes of Death
Leading Causes of Premature Death
In Los Angeles County, 43% of people in 2011 died before they reached age 75, with
deaths prior to 75 years of age determined by the Los Angeles County Department of
Public Health to be premature. In SPA 5, coronary heart disease was the leading cause
of premature death, followed by suicide, drug overdose, motor vehicle crashes, and liver
disease.
Leading Cause of Premature Death, SPA 5
SPA 5 Los Angeles County
Coronary Heart Disease Coronary Heart Disease
Suicide Homicide
Drug overdose Motor Vehicle Crash
Lung cancer Liver disease
Liver disease Suicide Source: LA County Department of Public Health, Mortality in Los Angeles County, 2012.
http://publichealth.lacounty.gov/dca/data/documents/mortalityrpt12.pdf
Death Rate
The mortality rate for all causes of death in the service area is 618.7 per 100,000
persons. This is higher than the county rate (583.9 per 100,000 persons) and lower
than the state rate of death (626.9 per 100,000 persons).
Crude Death Rate per 100,000 Persons, 5-Year Average Total, 2008-2012
Average Annual Deaths Rate
UCLA Health Service Area 4,059 618.7 Los Angeles County 57,773 583.9
California 236,089 626.9 Source: California Department of Public Health, Public Health Statistical Master Files 2008-2012,
http://www.cdph.ca.gov/data/statistics/Pages/DeathProfilesbyZIPCode.aspx
Leading Causes of Death
Heart disease, cancer, and stroke are the top three leading causes of death in the
service area. When compared to the county and state, the service area has higher
death rates for the top three causes of death. Crude rates are subject to wide variation
due to variations in median age from zip code to zip code.
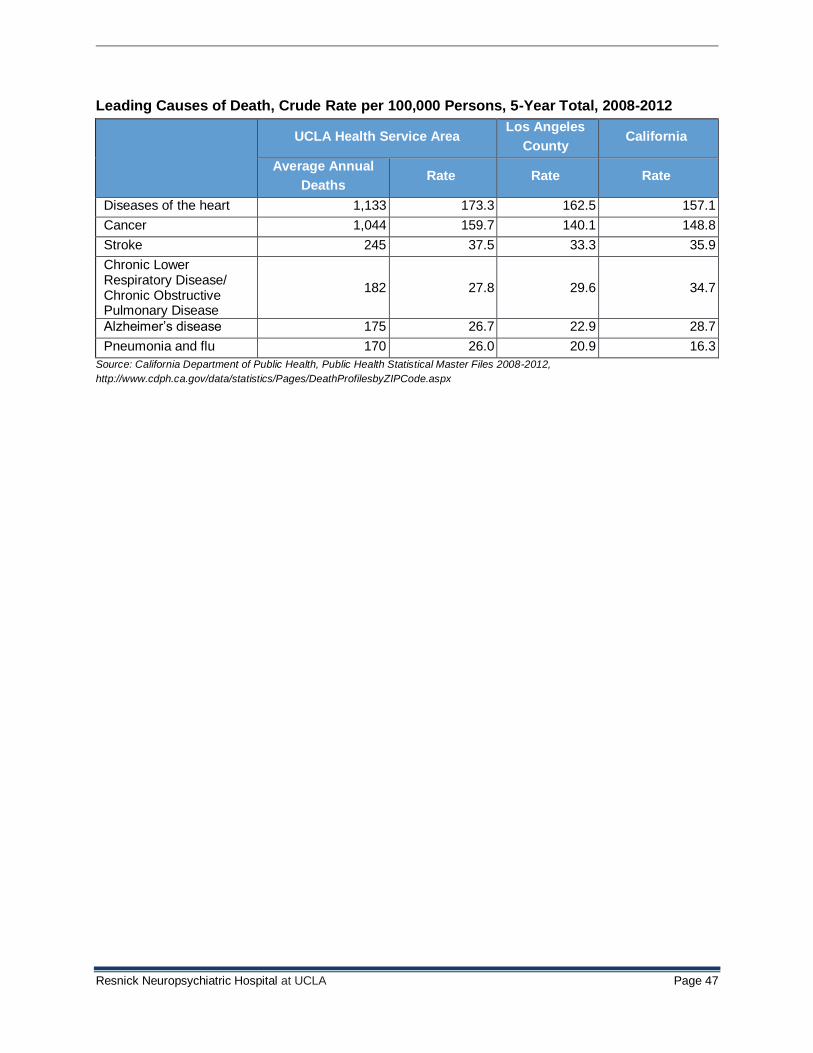
Resnick Neuropsychiatric Hospital at UCLA Page 47
Leading Causes of Death, Crude Rate per 100,000 Persons, 5-Year Total, 2008-2012
UCLA Health Service Area Los Angeles
County California
Average Annual
Deaths Rate Rate Rate
Diseases of the heart 1,133 173.3 162.5 157.1
Cancer 1,044 159.7 140.1 148.8
Stroke 245 37.5 33.3 35.9
Chronic Lower Respiratory Disease/ Chronic Obstructive Pulmonary Disease
182 27.8 29.6 34.7
Alzheimer’s disease 175 26.7 22.9 28.7
Pneumonia and flu 170 26.0 20.9 16.3
Source: California Department of Public Health, Public Health Statistical Master Files 2008-2012,
http://www.cdph.ca.gov/data/statistics/Pages/DeathProfilesbyZIPCode.aspx
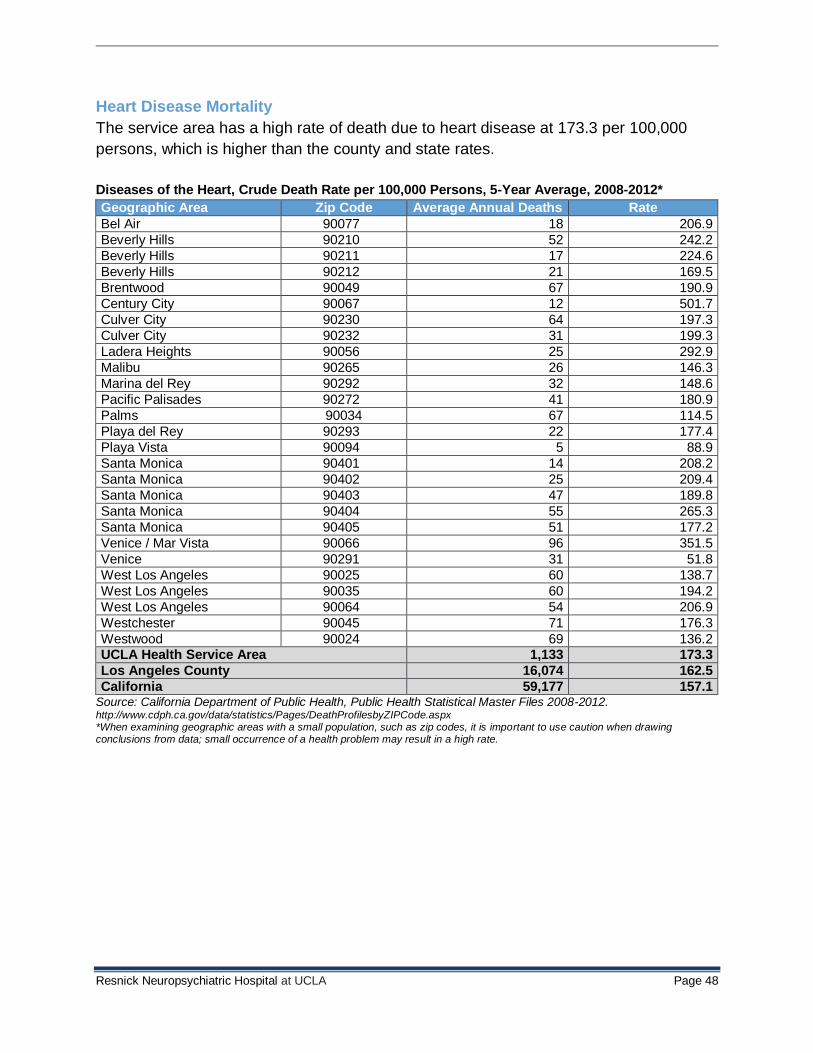
Resnick Neuropsychiatric Hospital at UCLA Page 48
Heart Disease Mortality
The service area has a high rate of death due to heart disease at 173.3 per 100,000
persons, which is higher than the county and state rates.
Diseases of the Heart, Crude Death Rate per 100,000 Persons, 5-Year Average, 2008-2012*
Geographic Area Zip Code Average Annual Deaths Rate
Bel Air 90077 18 206.9
Beverly Hills 90210 52 242.2
Beverly Hills 90211 17 224.6
Beverly Hills 90212 21 169.5
Brentwood 90049 67 190.9
Century City 90067 12 501.7
Culver City 90230 64 197.3
Culver City 90232 31 199.3
Ladera Heights 90056 25 292.9
Malibu 90265 26 146.3
Marina del Rey 90292 32 148.6
Pacific Palisades 90272 41 180.9
Palms 90034 67 114.5
Playa del Rey 90293 22 177.4
Playa Vista 90094 5 88.9
Santa Monica 90401 14 208.2
Santa Monica 90402 25 209.4
Santa Monica 90403 47 189.8
Santa Monica 90404 55 265.3
Santa Monica 90405 51 177.2
Venice / Mar Vista 90066 96 351.5
Venice 90291 31 51.8
West Los Angeles 90025 60 138.7
West Los Angeles 90035 60 194.2
West Los Angeles 90064 54 206.9
Westchester 90045 71 176.3
Westwood 90024 69 136.2 UCLA Health Service Area 1,133 173.3
Los Angeles County 16,074 162.5
California 59,177 157.1 Source: California Department of Public Health, Public Health Statistical Master Files 2008-2012. http://www.cdph.ca.gov/data/statistics/Pages/DeathProfilesbyZIPCode.aspx *When examining geographic areas with a small population, such as zip codes, it is important to use caution when drawing conclusions from data; small occurrence of a health problem may result in a high rate.
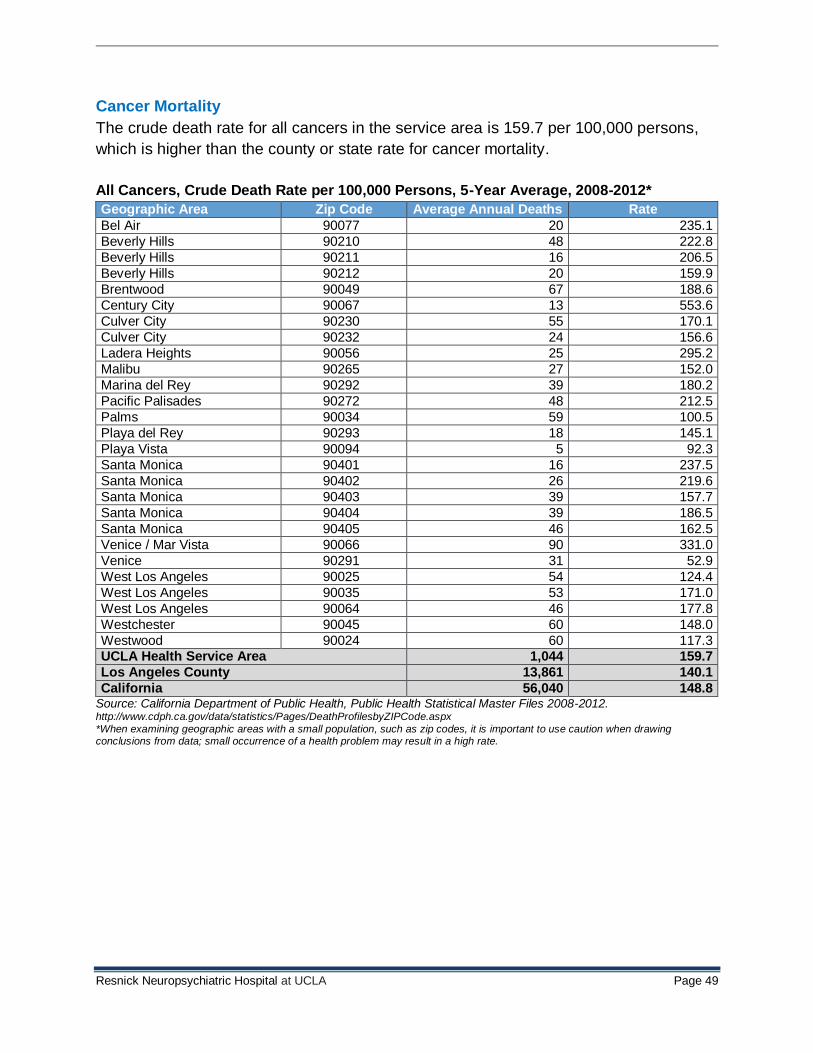
Resnick Neuropsychiatric Hospital at UCLA Page 49
Cancer Mortality
The crude death rate for all cancers in the service area is 159.7 per 100,000 persons,
which is higher than the county or state rate for cancer mortality.
All Cancers, Crude Death Rate per 100,000 Persons, 5-Year Average, 2008-2012*
Geographic Area Zip Code Average Annual Deaths Rate
Bel Air 90077 20 235.1
Beverly Hills 90210 48 222.8
Beverly Hills 90211 16 206.5
Beverly Hills 90212 20 159.9
Brentwood 90049 67 188.6
Century City 90067 13 553.6
Culver City 90230 55 170.1
Culver City 90232 24 156.6
Ladera Heights 90056 25 295.2
Malibu 90265 27 152.0
Marina del Rey 90292 39 180.2
Pacific Palisades 90272 48 212.5
Palms 90034 59 100.5
Playa del Rey 90293 18 145.1
Playa Vista 90094 5 92.3
Santa Monica 90401 16 237.5
Santa Monica 90402 26 219.6
Santa Monica 90403 39 157.7
Santa Monica 90404 39 186.5
Santa Monica 90405 46 162.5
Venice / Mar Vista 90066 90 331.0
Venice 90291 31 52.9
West Los Angeles 90025 54 124.4
West Los Angeles 90035 53 171.0
West Los Angeles 90064 46 177.8
Westchester 90045 60 148.0
Westwood 90024 60 117.3 UCLA Health Service Area 1,044 159.7
Los Angeles County 13,861 140.1
California 56,040 148.8 Source: California Department of Public Health, Public Health Statistical Master Files 2008-2012. http://www.cdph.ca.gov/data/statistics/Pages/DeathProfilesbyZIPCode.aspx *When examining geographic areas with a small population, such as zip codes, it is important to use caution when drawing conclusions from data; small occurrence of a health problem may result in a high rate.
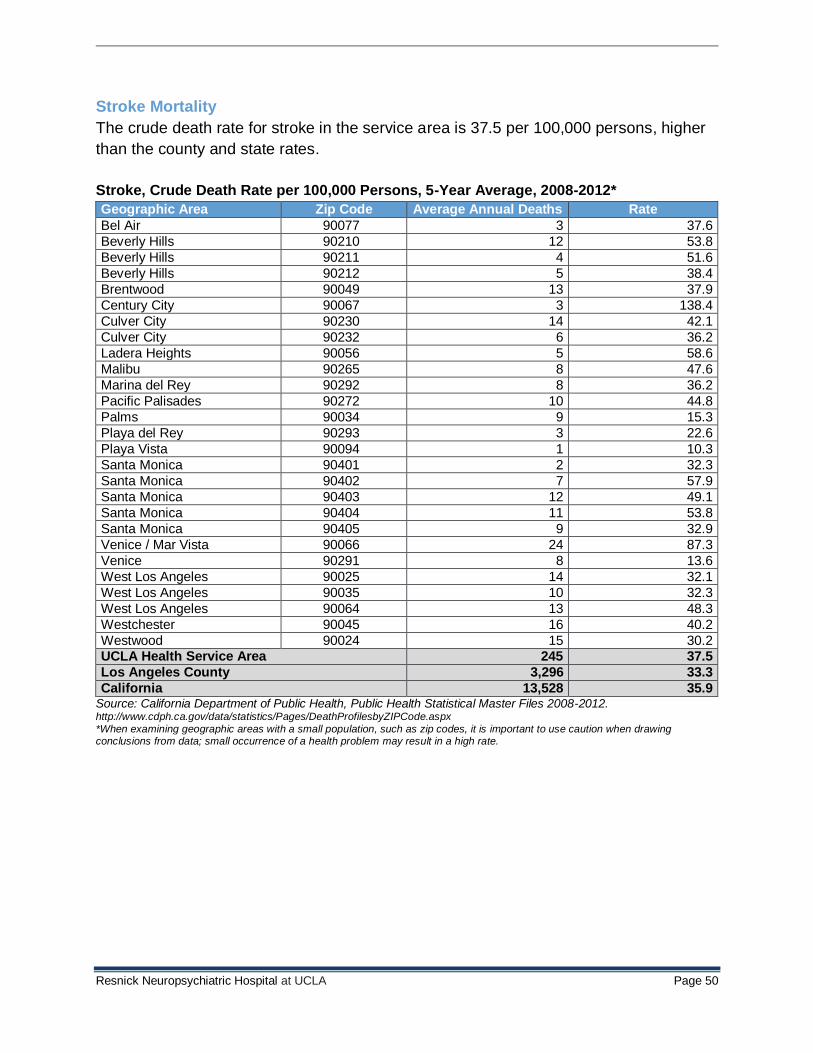
Resnick Neuropsychiatric Hospital at UCLA Page 50
Stroke Mortality
The crude death rate for stroke in the service area is 37.5 per 100,000 persons, higher
than the county and state rates.
Stroke, Crude Death Rate per 100,000 Persons, 5-Year Average, 2008-2012*
Geographic Area Zip Code Average Annual Deaths Rate
Bel Air 90077 3 37.6
Beverly Hills 90210 12 53.8
Beverly Hills 90211 4 51.6
Beverly Hills 90212 5 38.4
Brentwood 90049 13 37.9
Century City 90067 3 138.4
Culver City 90230 14 42.1
Culver City 90232 6 36.2
Ladera Heights 90056 5 58.6
Malibu 90265 8 47.6
Marina del Rey 90292 8 36.2
Pacific Palisades 90272 10 44.8
Palms 90034 9 15.3
Playa del Rey 90293 3 22.6
Playa Vista 90094 1 10.3
Santa Monica 90401 2 32.3
Santa Monica 90402 7 57.9
Santa Monica 90403 12 49.1
Santa Monica 90404 11 53.8
Santa Monica 90405 9 32.9
Venice / Mar Vista 90066 24 87.3
Venice 90291 8 13.6
West Los Angeles 90025 14 32.1
West Los Angeles 90035 10 32.3
West Los Angeles 90064 13 48.3
Westchester 90045 16 40.2
Westwood 90024 15 30.2 UCLA Health Service Area 245 37.5
Los Angeles County 3,296 33.3
California 13,528 35.9 Source: California Department of Public Health, Public Health Statistical Master Files 2008-2012. http://www.cdph.ca.gov/data/statistics/Pages/DeathProfilesbyZIPCode.aspx *When examining geographic areas with a small population, such as zip codes, it is important to use caution when drawing conclusions from data; small occurrence of a health problem may result in a high rate.
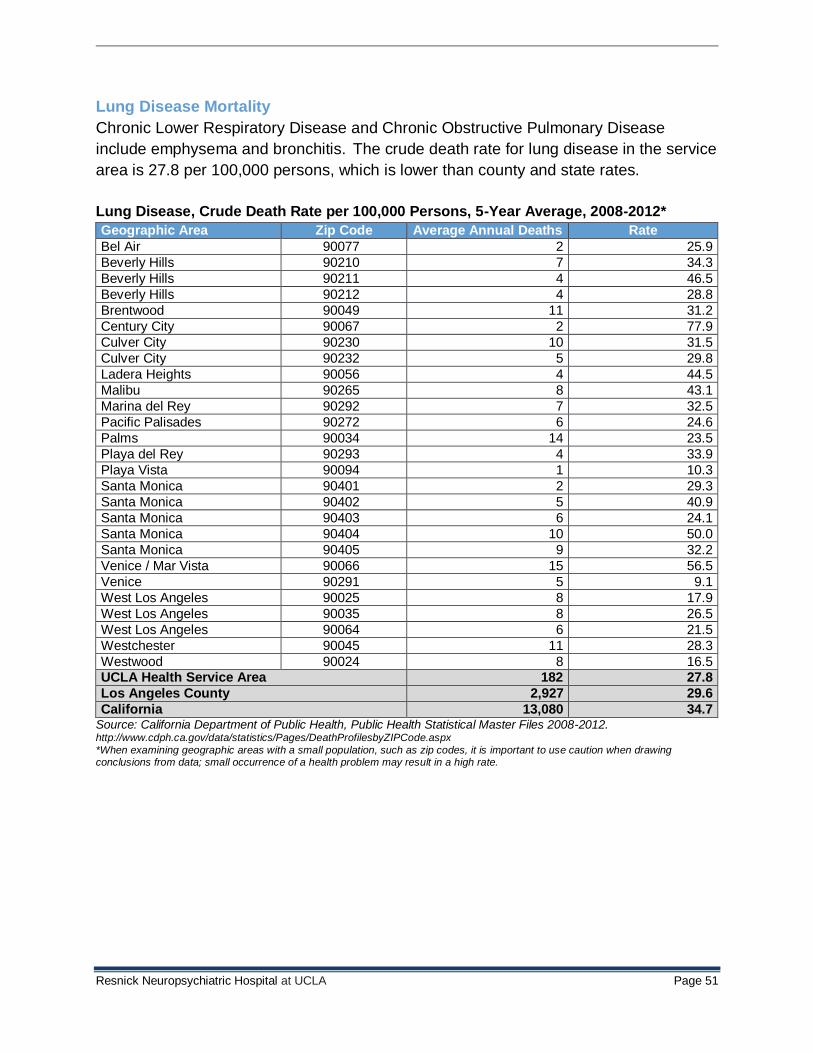
Resnick Neuropsychiatric Hospital at UCLA Page 51
Lung Disease Mortality
Chronic Lower Respiratory Disease and Chronic Obstructive Pulmonary Disease
include emphysema and bronchitis. The crude death rate for lung disease in the service
area is 27.8 per 100,000 persons, which is lower than county and state rates.
Lung Disease, Crude Death Rate per 100,000 Persons, 5-Year Average, 2008-2012*
Geographic Area Zip Code Average Annual Deaths Rate
Bel Air 90077 2 25.9
Beverly Hills 90210 7 34.3
Beverly Hills 90211 4 46.5
Beverly Hills 90212 4 28.8
Brentwood 90049 11 31.2
Century City 90067 2 77.9
Culver City 90230 10 31.5
Culver City 90232 5 29.8
Ladera Heights 90056 4 44.5
Malibu 90265 8 43.1
Marina del Rey 90292 7 32.5
Pacific Palisades 90272 6 24.6
Palms 90034 14 23.5
Playa del Rey 90293 4 33.9
Playa Vista 90094 1 10.3
Santa Monica 90401 2 29.3
Santa Monica 90402 5 40.9
Santa Monica 90403 6 24.1
Santa Monica 90404 10 50.0
Santa Monica 90405 9 32.2
Venice / Mar Vista 90066 15 56.5
Venice 90291 5 9.1
West Los Angeles 90025 8 17.9
West Los Angeles 90035 8 26.5
West Los Angeles 90064 6 21.5
Westchester 90045 11 28.3
Westwood 90024 8 16.5 UCLA Health Service Area 182 27.8
Los Angeles County 2,927 29.6
California 13,080 34.7 Source: California Department of Public Health, Public Health Statistical Master Files 2008-2012. http://www.cdph.ca.gov/data/statistics/Pages/DeathProfilesbyZIPCode.aspx *When examining geographic areas with a small population, such as zip codes, it is important to use caution when drawing conclusions from data; small occurrence of a health problem may result in a high rate.
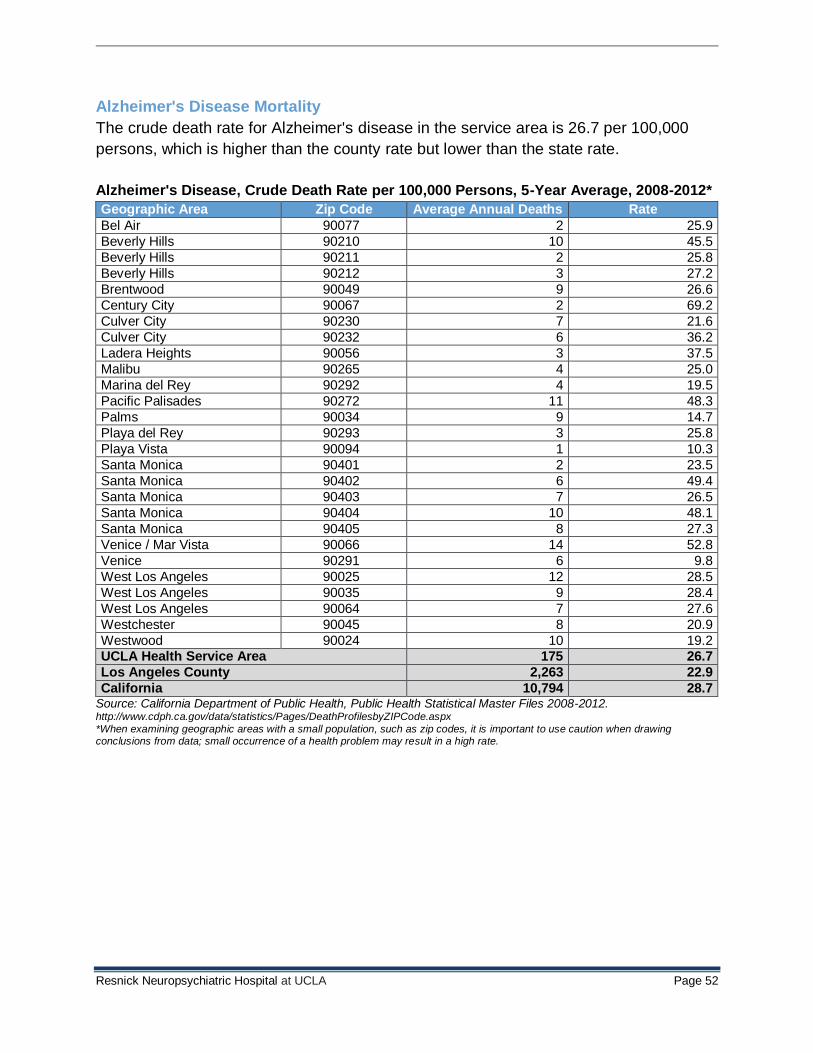
Resnick Neuropsychiatric Hospital at UCLA Page 52
Alzheimer's Disease Mortality
The crude death rate for Alzheimer's disease in the service area is 26.7 per 100,000
persons, which is higher than the county rate but lower than the state rate.
Alzheimer's Disease, Crude Death Rate per 100,000 Persons, 5-Year Average, 2008-2012*
Geographic Area Zip Code Average Annual Deaths Rate
Bel Air 90077 2 25.9
Beverly Hills 90210 10 45.5
Beverly Hills 90211 2 25.8
Beverly Hills 90212 3 27.2
Brentwood 90049 9 26.6
Century City 90067 2 69.2
Culver City 90230 7 21.6
Culver City 90232 6 36.2
Ladera Heights 90056 3 37.5
Malibu 90265 4 25.0
Marina del Rey 90292 4 19.5
Pacific Palisades 90272 11 48.3
Palms 90034 9 14.7
Playa del Rey 90293 3 25.8
Playa Vista 90094 1 10.3
Santa Monica 90401 2 23.5
Santa Monica 90402 6 49.4
Santa Monica 90403 7 26.5
Santa Monica 90404 10 48.1
Santa Monica 90405 8 27.3
Venice / Mar Vista 90066 14 52.8
Venice 90291 6 9.8
West Los Angeles 90025 12 28.5
West Los Angeles 90035 9 28.4
West Los Angeles 90064 7 27.6
Westchester 90045 8 20.9
Westwood 90024 10 19.2 UCLA Health Service Area 175 26.7
Los Angeles County 2,263 22.9
California 10,794 28.7 Source: California Department of Public Health, Public Health Statistical Master Files 2008-2012. http://www.cdph.ca.gov/data/statistics/Pages/DeathProfilesbyZIPCode.aspx *When examining geographic areas with a small population, such as zip codes, it is important to use caution when drawing conclusions from data; small occurrence of a health problem may result in a high rate.
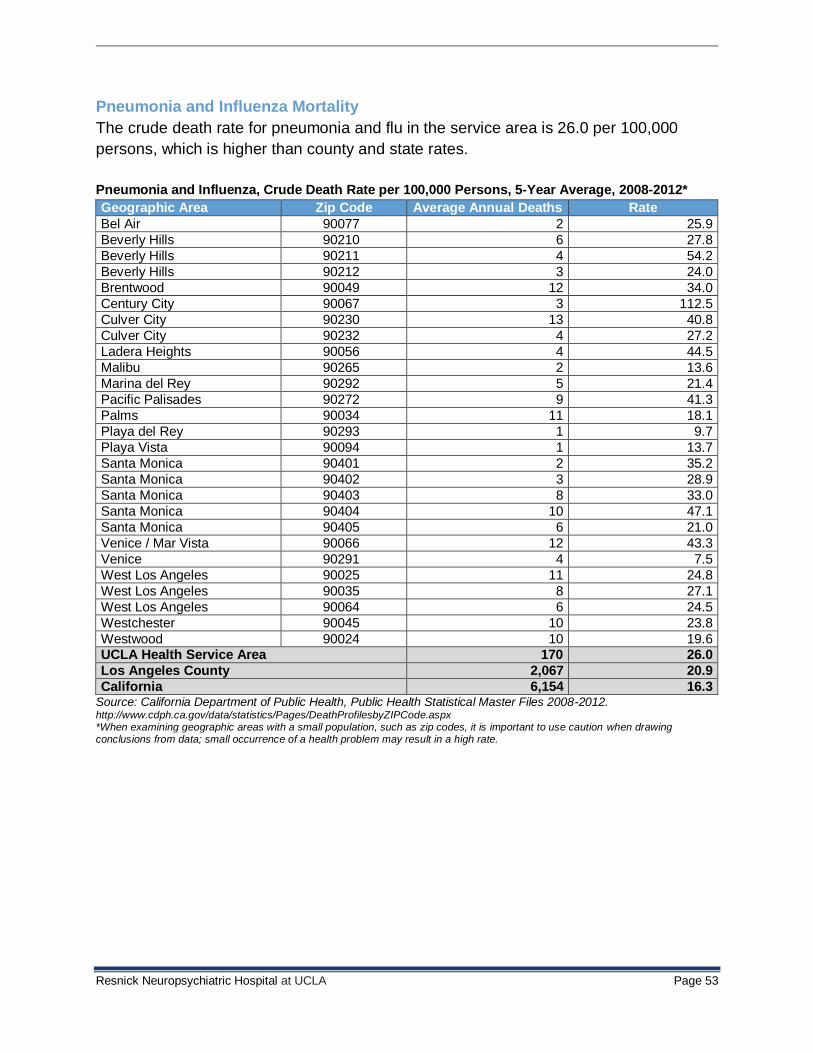
Resnick Neuropsychiatric Hospital at UCLA Page 53
Pneumonia and Influenza Mortality
The crude death rate for pneumonia and flu in the service area is 26.0 per 100,000
persons, which is higher than county and state rates.
Pneumonia and Influenza, Crude Death Rate per 100,000 Persons, 5-Year Average, 2008-2012*
Geographic Area Zip Code Average Annual Deaths Rate
Bel Air 90077 2 25.9
Beverly Hills 90210 6 27.8
Beverly Hills 90211 4 54.2
Beverly Hills 90212 3 24.0
Brentwood 90049 12 34.0
Century City 90067 3 112.5
Culver City 90230 13 40.8
Culver City 90232 4 27.2
Ladera Heights 90056 4 44.5
Malibu 90265 2 13.6
Marina del Rey 90292 5 21.4
Pacific Palisades 90272 9 41.3
Palms 90034 11 18.1
Playa del Rey 90293 1 9.7
Playa Vista 90094 1 13.7
Santa Monica 90401 2 35.2
Santa Monica 90402 3 28.9
Santa Monica 90403 8 33.0
Santa Monica 90404 10 47.1
Santa Monica 90405 6 21.0
Venice / Mar Vista 90066 12 43.3
Venice 90291 4 7.5
West Los Angeles 90025 11 24.8
West Los Angeles 90035 8 27.1
West Los Angeles 90064 6 24.5
Westchester 90045 10 23.8
Westwood 90024 10 19.6 UCLA Health Service Area 170 26.0
Los Angeles County 2,067 20.9
California 6,154 16.3 Source: California Department of Public Health, Public Health Statistical Master Files 2008-2012. http://www.cdph.ca.gov/data/statistics/Pages/DeathProfilesbyZIPCode.aspx *When examining geographic areas with a small population, such as zip codes, it is important to use caution when drawing conclusions from data; small occurrence of a health problem may result in a high rate.
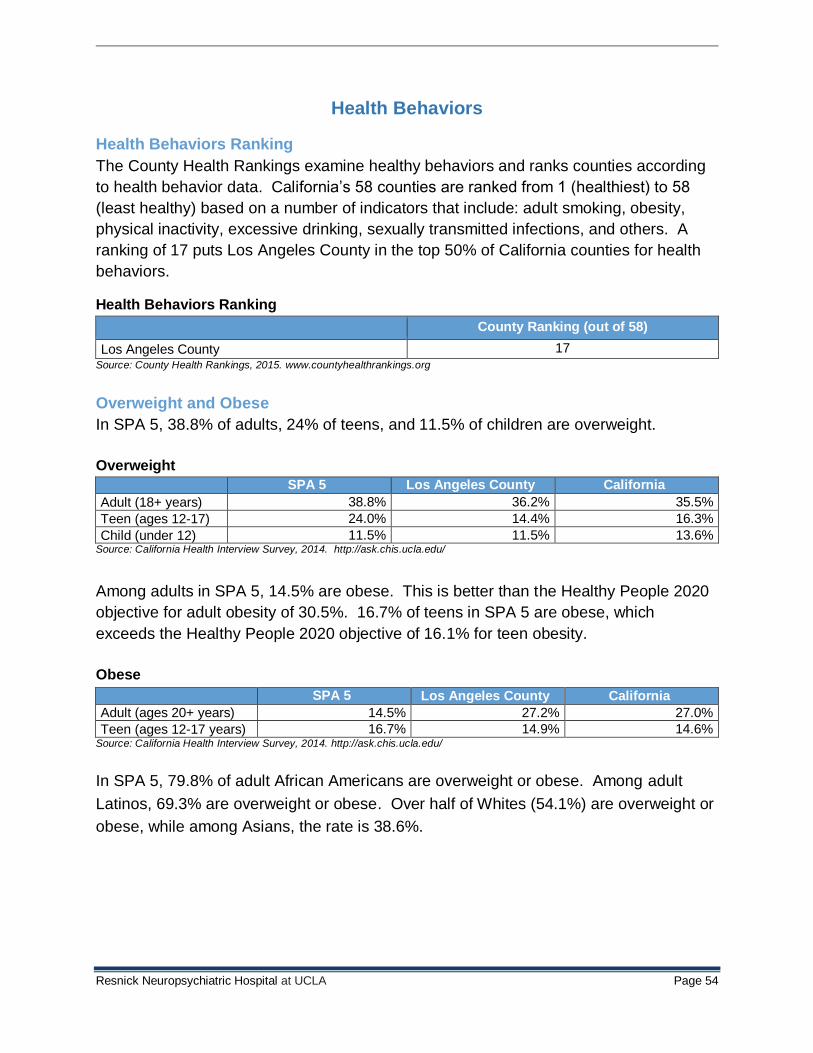
Resnick Neuropsychiatric Hospital at UCLA Page 54
Health Behaviors
Health Behaviors Ranking
The County Health Rankings examine healthy behaviors and ranks counties according
to health behavior data. California’s 58 counties are ranked from 1 (healthiest) to 58
(least healthy) based on a number of indicators that include: adult smoking, obesity,
physical inactivity, excessive drinking, sexually transmitted infections, and others. A
ranking of 17 puts Los Angeles County in the top 50% of California counties for health
behaviors.
Health Behaviors Ranking
County Ranking (out of 58)
Los Angeles County 17
Source: County Health Rankings, 2015. www.countyhealthrankings.org
Overweight and Obese
In SPA 5, 38.8% of adults, 24% of teens, and 11.5% of children are overweight.
Overweight
SPA 5 Los Angeles County California
Adult (18+ years) 38.8% 36.2% 35.5%
Teen (ages 12-17) 24.0% 14.4% 16.3%
Child (under 12) 11.5% 11.5% 13.6% Source: California Health Interview Survey, 2014. http://ask.chis.ucla.edu/
Among adults in SPA 5, 14.5% are obese. This is better than the Healthy People 2020
objective for adult obesity of 30.5%. 16.7% of teens in SPA 5 are obese, which
exceeds the Healthy People 2020 objective of 16.1% for teen obesity.
Obese
SPA 5 Los Angeles County California
Adult (ages 20+ years) 14.5% 27.2% 27.0%
Teen (ages 12-17 years) 16.7% 14.9% 14.6% Source: California Health Interview Survey, 2014. http://ask.chis.ucla.edu/
In SPA 5, 79.8% of adult African Americans are overweight or obese. Among adult
Latinos, 69.3% are overweight or obese. Over half of Whites (54.1%) are overweight or
obese, while among Asians, the rate is 38.6%.
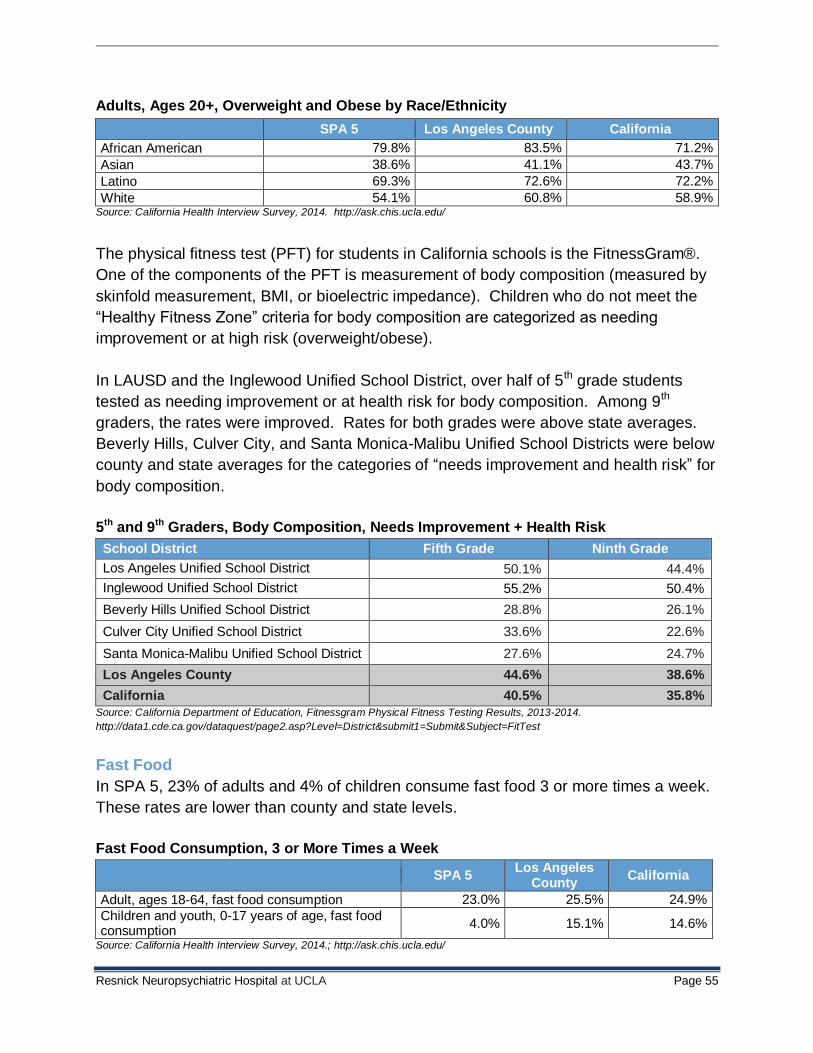
Resnick Neuropsychiatric Hospital at UCLA Page 55
Adults, Ages 20+, Overweight and Obese by Race/Ethnicity
SPA 5 Los Angeles County California
African American 79.8% 83.5% 71.2%
Asian 38.6% 41.1% 43.7%
Latino 69.3% 72.6% 72.2%
White 54.1% 60.8% 58.9% Source: California Health Interview Survey, 2014. http://ask.chis.ucla.edu/
The physical fitness test (PFT) for students in California schools is the FitnessGram®.
One of the components of the PFT is measurement of body composition (measured by
skinfold measurement, BMI, or bioelectric impedance). Children who do not meet the
“Healthy Fitness Zone” criteria for body composition are categorized as needing
improvement or at high risk (overweight/obese).
In LAUSD and the Inglewood Unified School District, over half of 5th grade students
tested as needing improvement or at health risk for body composition. Among 9th
graders, the rates were improved. Rates for both grades were above state averages.
Beverly Hills, Culver City, and Santa Monica-Malibu Unified School Districts were below
county and state averages for the categories of “needs improvement and health risk” for
body composition.
5th and 9th Graders, Body Composition, Needs Improvement + Health Risk
School District Fifth Grade Ninth Grade
Los Angeles Unified School District 50.1% 44.4%
Inglewood Unified School District 55.2% 50.4%
Beverly Hills Unified School District 28.8% 26.1%
Culver City Unified School District 33.6% 22.6%
Santa Monica-Malibu Unified School District 27.6% 24.7%
Los Angeles County 44.6% 38.6%
California 40.5% 35.8%
Source: California Department of Education, Fitnessgram Physical Fitness Testing Results, 2013-2014.
http://data1.cde.ca.gov/dataquest/page2.asp?Level=District&submit1=Submit&Subject=FitTest
Fast Food
In SPA 5, 23% of adults and 4% of children consume fast food 3 or more times a week.
These rates are lower than county and state levels.
Fast Food Consumption, 3 or More Times a Week
SPA 5 Los Angeles
County California
Adult, ages 18-64, fast food consumption 23.0% 25.5% 24.9%
Children and youth, 0-17 years of age, fast food consumption
4.0% 15.1% 14.6%
Source: California Health Interview Survey, 2014.; http://ask.chis.ucla.edu/
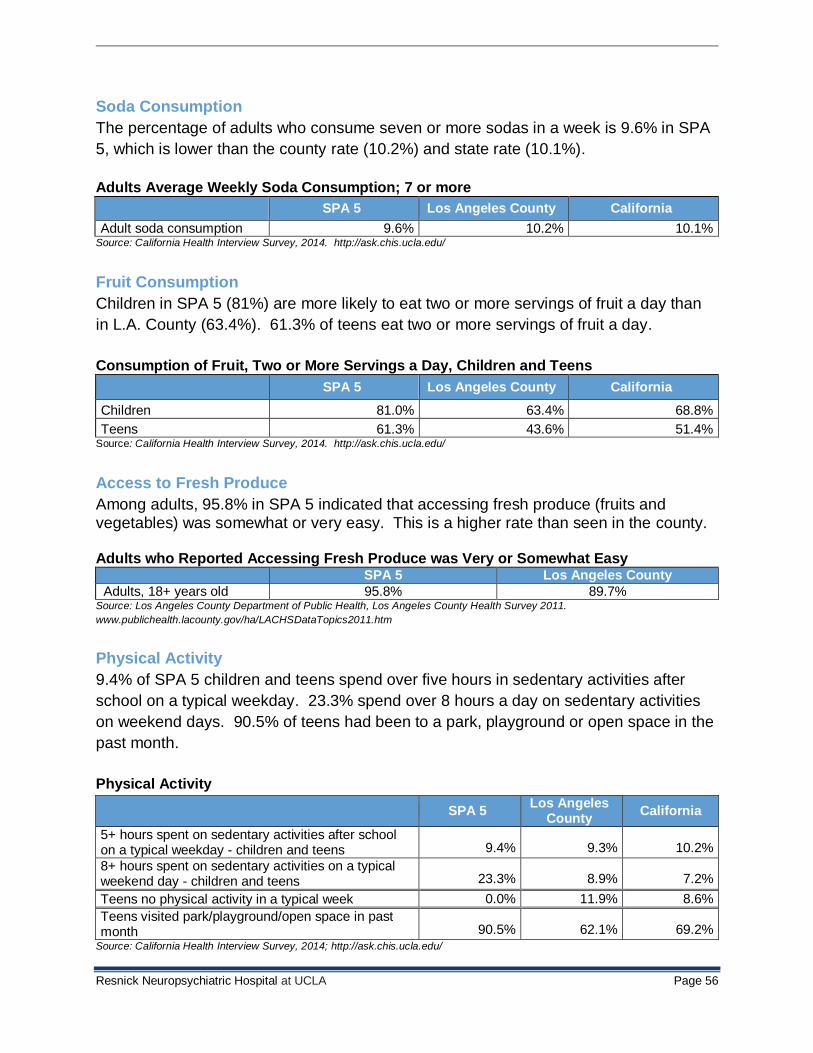
Resnick Neuropsychiatric Hospital at UCLA Page 56
Soda Consumption
The percentage of adults who consume seven or more sodas in a week is 9.6% in SPA
5, which is lower than the county rate (10.2%) and state rate (10.1%).
Adults Average Weekly Soda Consumption; 7 or more
SPA 5 Los Angeles County California
Adult soda consumption 9.6% 10.2% 10.1% Source: California Health Interview Survey, 2014. http://ask.chis.ucla.edu/
Fruit Consumption
Children in SPA 5 (81%) are more likely to eat two or more servings of fruit a day than
in L.A. County (63.4%). 61.3% of teens eat two or more servings of fruit a day.
Consumption of Fruit, Two or More Servings a Day, Children and Teens
SPA 5 Los Angeles County California
Children 81.0% 63.4% 68.8%
Teens 61.3% 43.6% 51.4% Source: California Health Interview Survey, 2014. http://ask.chis.ucla.edu/
Access to Fresh Produce
Among adults, 95.8% in SPA 5 indicated that accessing fresh produce (fruits and vegetables) was somewhat or very easy. This is a higher rate than seen in the county. Adults who Reported Accessing Fresh Produce was Very or Somewhat Easy
SPA 5 Los Angeles County
Adults, 18+ years old 95.8% 89.7% Source: Los Angeles County Department of Public Health, Los Angeles County Health Survey 2011.
www.publichealth.lacounty.gov/ha/LACHSDataTopics2011.htm
Physical Activity
9.4% of SPA 5 children and teens spend over five hours in sedentary activities after
school on a typical weekday. 23.3% spend over 8 hours a day on sedentary activities
on weekend days. 90.5% of teens had been to a park, playground or open space in the
past month.
Physical Activity
SPA 5 Los Angeles
County California
5+ hours spent on sedentary activities after school on a typical weekday - children and teens 9.4% 9.3% 10.2%
8+ hours spent on sedentary activities on a typical weekend day - children and teens 23.3% 8.9% 7.2%
Teens no physical activity in a typical week 0.0% 11.9% 8.6%
Teens visited park/playground/open space in past month 90.5% 62.1% 69.2%
Source: California Health Interview Survey, 2014; http://ask.chis.ucla.edu/
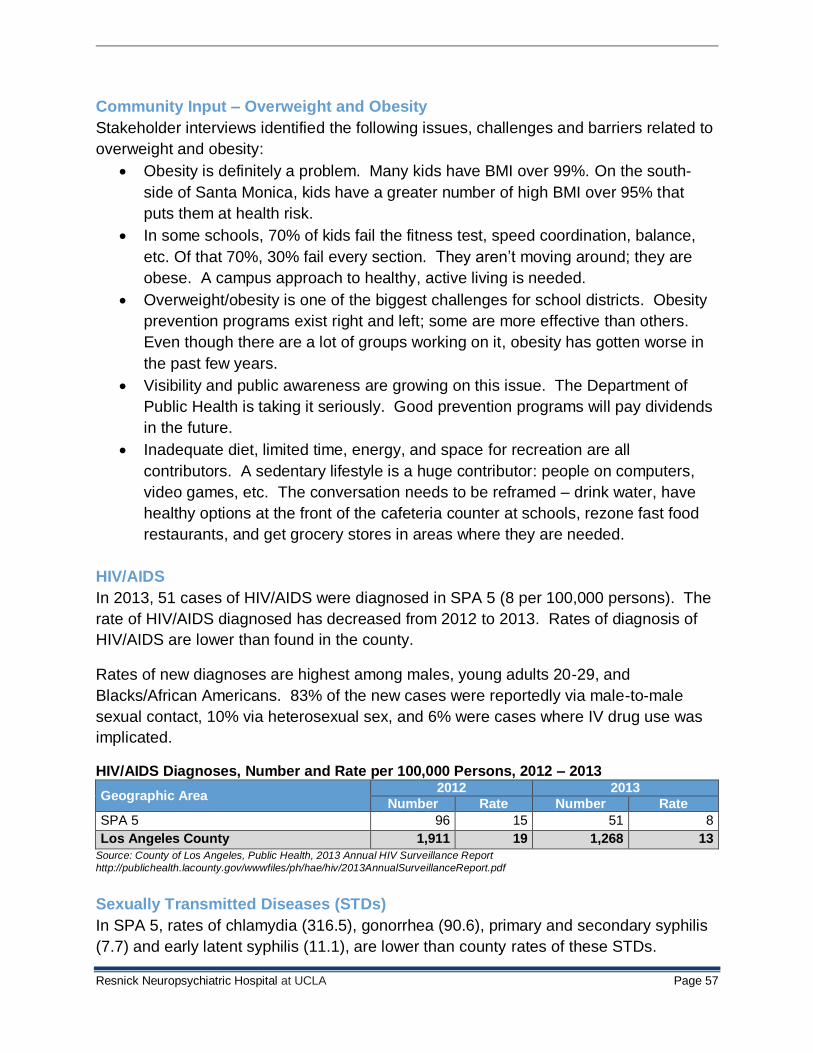
Resnick Neuropsychiatric Hospital at UCLA Page 57
Community Input – Overweight and Obesity
Stakeholder interviews identified the following issues, challenges and barriers related to
overweight and obesity:
Obesity is definitely a problem. Many kids have BMI over 99%. On the south-
side of Santa Monica, kids have a greater number of high BMI over 95% that
puts them at health risk.
In some schools, 70% of kids fail the fitness test, speed coordination, balance,
etc. Of that 70%, 30% fail every section. They aren’t moving around; they are
obese. A campus approach to healthy, active living is needed.
Overweight/obesity is one of the biggest challenges for school districts. Obesity
prevention programs exist right and left; some are more effective than others.
Even though there are a lot of groups working on it, obesity has gotten worse in
the past few years.
Visibility and public awareness are growing on this issue. The Department of
Public Health is taking it seriously. Good prevention programs will pay dividends
in the future.
Inadequate diet, limited time, energy, and space for recreation are all
contributors. A sedentary lifestyle is a huge contributor: people on computers,
video games, etc. The conversation needs to be reframed – drink water, have
healthy options at the front of the cafeteria counter at schools, rezone fast food
restaurants, and get grocery stores in areas where they are needed.
HIV/AIDS
In 2013, 51 cases of HIV/AIDS were diagnosed in SPA 5 (8 per 100,000 persons). The
rate of HIV/AIDS diagnosed has decreased from 2012 to 2013. Rates of diagnosis of
HIV/AIDS are lower than found in the county.
Rates of new diagnoses are highest among males, young adults 20-29, and
Blacks/African Americans. 83% of the new cases were reportedly via male-to-male
sexual contact, 10% via heterosexual sex, and 6% were cases where IV drug use was
implicated.
HIV/AIDS Diagnoses, Number and Rate per 100,000 Persons, 2012 – 2013
Geographic Area 2012 2013
Number Rate Number Rate
SPA 5 96 15 51 8
Los Angeles County 1,911 19 1,268 13
Source: County of Los Angeles, Public Health, 2013 Annual HIV Surveillance Report
http://publichealth.lacounty.gov/wwwfiles/ph/hae/hiv/2013AnnualSurveillanceReport.pdf
Sexually Transmitted Diseases (STDs)
In SPA 5, rates of chlamydia (316.5), gonorrhea (90.6), primary and secondary syphilis
(7.7) and early latent syphilis (11.1), are lower than county rates of these STDs.
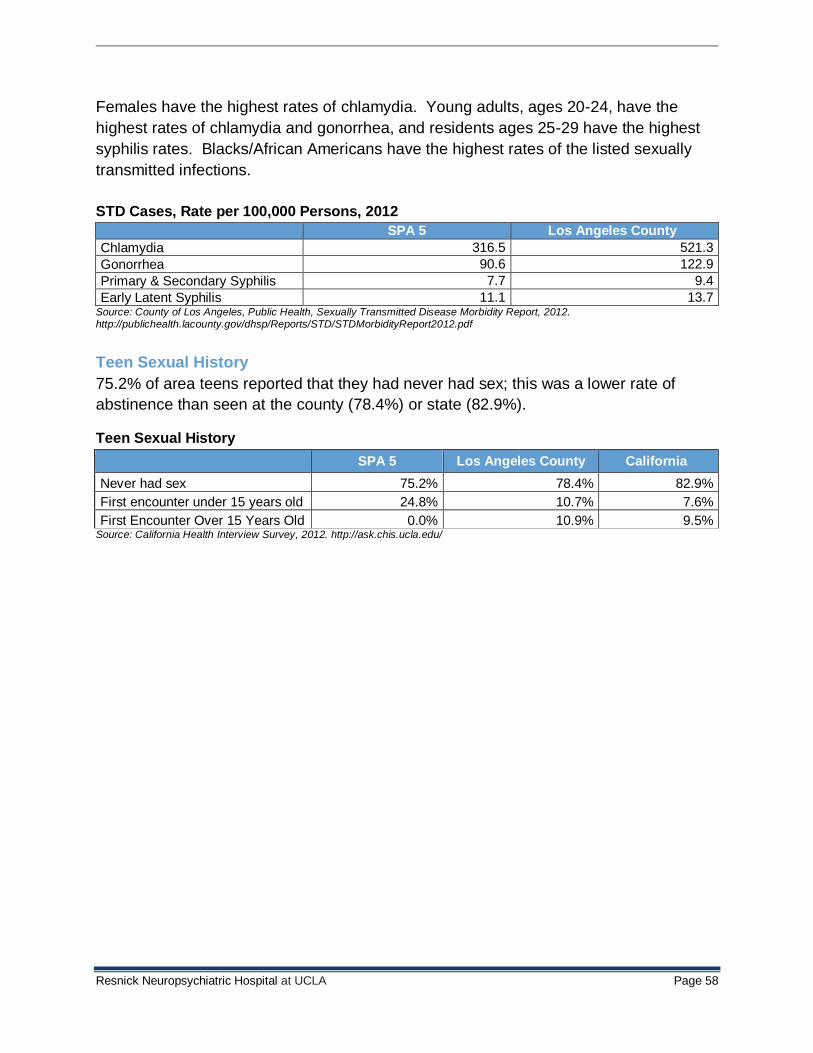
Resnick Neuropsychiatric Hospital at UCLA Page 58
Females have the highest rates of chlamydia. Young adults, ages 20-24, have the
highest rates of chlamydia and gonorrhea, and residents ages 25-29 have the highest
syphilis rates. Blacks/African Americans have the highest rates of the listed sexually
transmitted infections.
STD Cases, Rate per 100,000 Persons, 2012
SPA 5 Los Angeles County
Chlamydia 316.5 521.3
Gonorrhea 90.6 122.9
Primary & Secondary Syphilis 7.7 9.4
Early Latent Syphilis 11.1 13.7 Source: County of Los Angeles, Public Health, Sexually Transmitted Disease Morbidity Report, 2012. http://publichealth.lacounty.gov/dhsp/Reports/STD/STDMorbidityReport2012.pdf
Teen Sexual History
75.2% of area teens reported that they had never had sex; this was a lower rate of
abstinence than seen at the county (78.4%) or state (82.9%).
Teen Sexual History
SPA 5 Los Angeles County California
Never had sex 75.2% 78.4% 82.9%
First encounter under 15 years old 24.8% 10.7% 7.6%
First Encounter Over 15 Years Old 0.0% 10.9% 9.5% Source: California Health Interview Survey, 2012. http://ask.chis.ucla.edu/
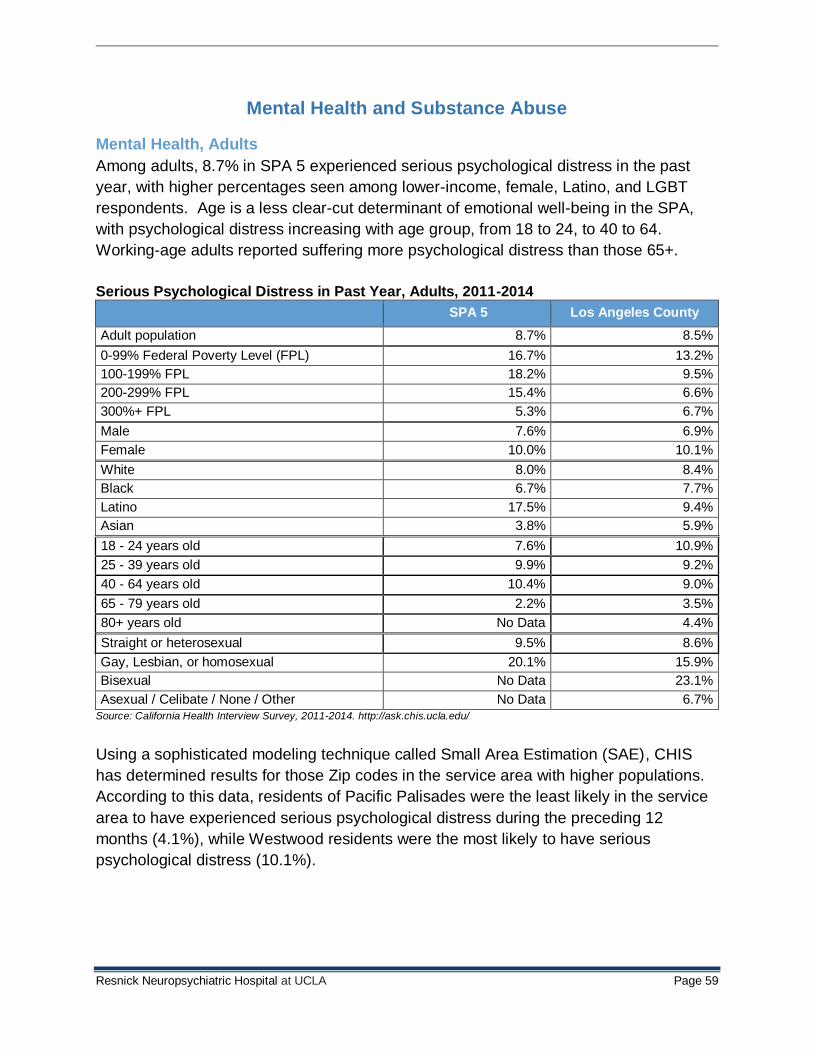
Resnick Neuropsychiatric Hospital at UCLA Page 59
Mental Health and Substance Abuse
Mental Health, Adults
Among adults, 8.7% in SPA 5 experienced serious psychological distress in the past
year, with higher percentages seen among lower-income, female, Latino, and LGBT
respondents. Age is a less clear-cut determinant of emotional well-being in the SPA,
with psychological distress increasing with age group, from 18 to 24, to 40 to 64.
Working-age adults reported suffering more psychological distress than those 65+.
Serious Psychological Distress in Past Year, Adults, 2011-2014
SPA 5 Los Angeles County
Adult population 8.7% 8.5%
0-99% Federal Poverty Level (FPL) 16.7% 13.2%
100-199% FPL 18.2% 9.5%
200-299% FPL 15.4% 6.6%
300%+ FPL 5.3% 6.7%
Male 7.6% 6.9%
Female 10.0% 10.1%
White 8.0% 8.4%
Black 6.7% 7.7%
Latino 17.5% 9.4%
Asian 3.8% 5.9%
18 - 24 years old 7.6% 10.9%
25 - 39 years old 9.9% 9.2%
40 - 64 years old 10.4% 9.0%
65 - 79 years old 2.2% 3.5%
80+ years old No Data 4.4%
Straight or heterosexual 9.5% 8.6%
Gay, Lesbian, or homosexual 20.1% 15.9%
Bisexual No Data 23.1%
Asexual / Celibate / None / Other No Data 6.7% Source: California Health Interview Survey, 2011-2014. http://ask.chis.ucla.edu/
Using a sophisticated modeling technique called Small Area Estimation (SAE), CHIS
has determined results for those Zip codes in the service area with higher populations.
According to this data, residents of Pacific Palisades were the least likely in the service
area to have experienced serious psychological distress during the preceding 12
months (4.1%), while Westwood residents were the most likely to have serious
psychological distress (10.1%).
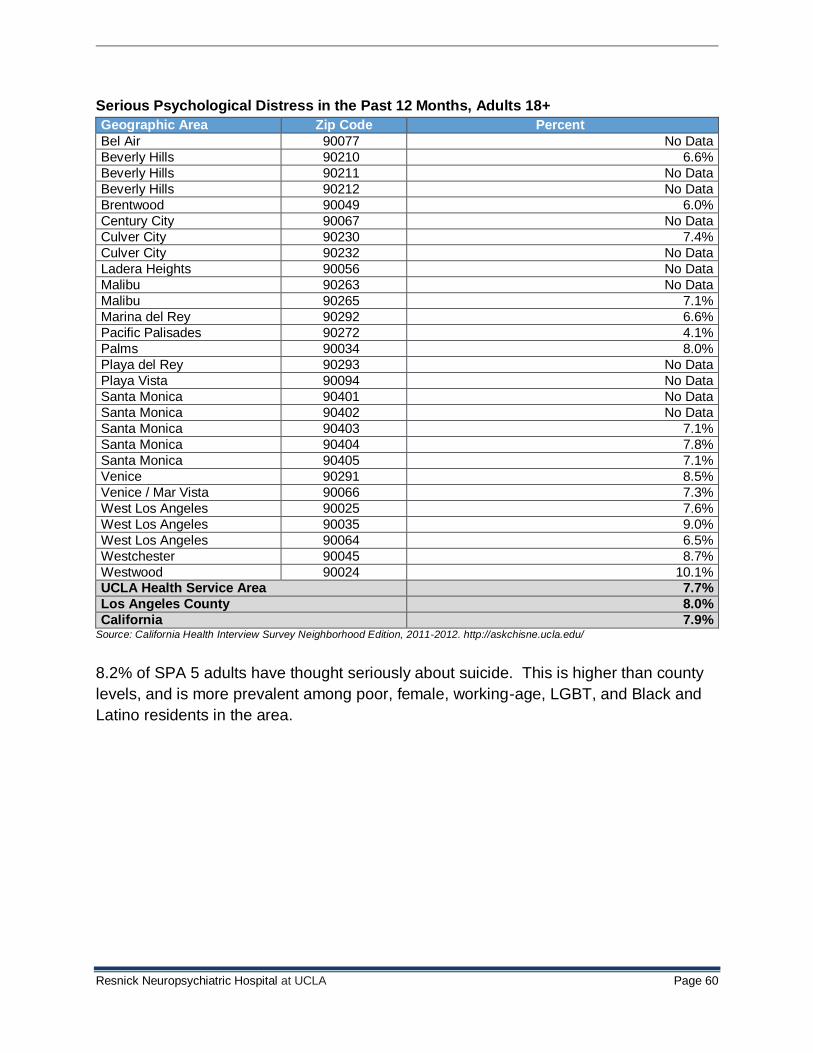
Resnick Neuropsychiatric Hospital at UCLA Page 60
Serious Psychological Distress in the Past 12 Months, Adults 18+
Geographic Area Zip Code Percent
Bel Air 90077 No Data
Beverly Hills 90210 6.6%
Beverly Hills 90211 No Data
Beverly Hills 90212 No Data
Brentwood 90049 6.0%
Century City 90067 No Data
Culver City 90230 7.4%
Culver City 90232 No Data
Ladera Heights 90056 No Data
Malibu 90263 No Data
Malibu 90265 7.1%
Marina del Rey 90292 6.6%
Pacific Palisades 90272 4.1%
Palms 90034 8.0%
Playa del Rey 90293 No Data
Playa Vista 90094 No Data
Santa Monica 90401 No Data
Santa Monica 90402 No Data
Santa Monica 90403 7.1%
Santa Monica 90404 7.8%
Santa Monica 90405 7.1%
Venice 90291 8.5%
Venice / Mar Vista 90066 7.3%
West Los Angeles 90025 7.6%
West Los Angeles 90035 9.0%
West Los Angeles 90064 6.5%
Westchester 90045 8.7%
Westwood 90024 10.1% UCLA Health Service Area 7.7%
Los Angeles County 8.0%
California 7.9% Source: California Health Interview Survey Neighborhood Edition, 2011-2012. http://askchisne.ucla.edu/
8.2% of SPA 5 adults have thought seriously about suicide. This is higher than county
levels, and is more prevalent among poor, female, working-age, LGBT, and Black and
Latino residents in the area.
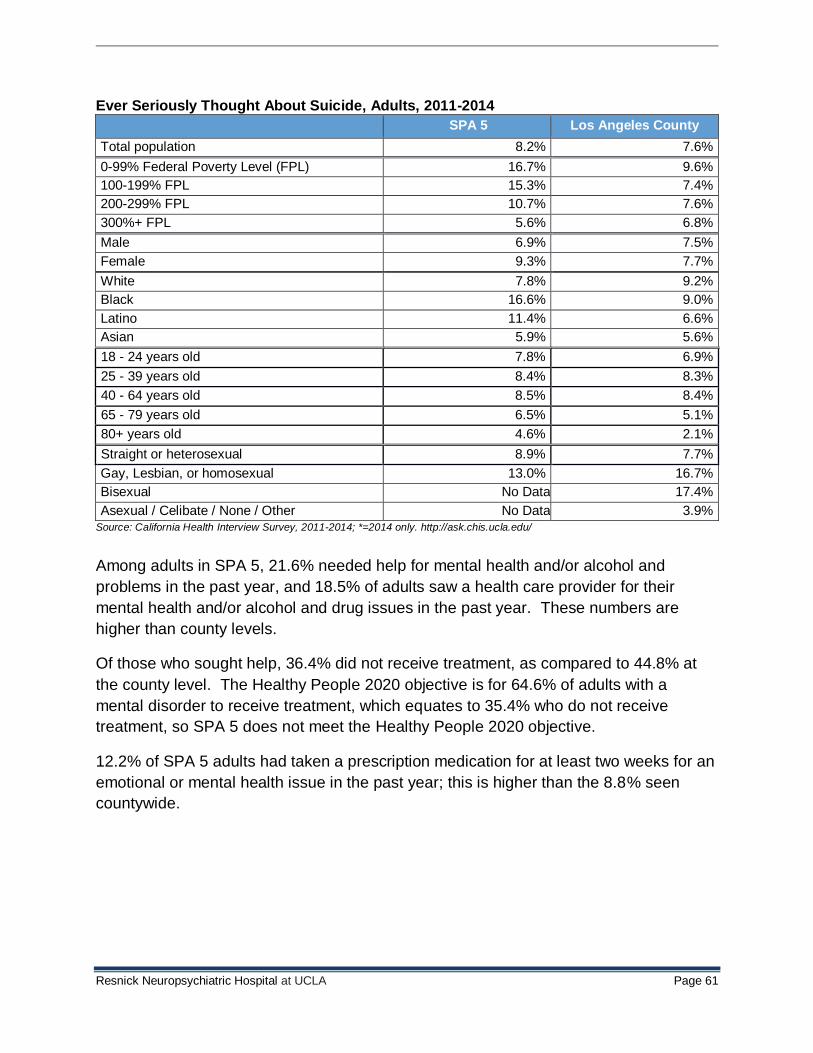
Resnick Neuropsychiatric Hospital at UCLA Page 61
Ever Seriously Thought About Suicide, Adults, 2011-2014
SPA 5 Los Angeles County
Total population 8.2% 7.6%
0-99% Federal Poverty Level (FPL) 16.7% 9.6%
100-199% FPL 15.3% 7.4%
200-299% FPL 10.7% 7.6%
300%+ FPL 5.6% 6.8%
Male 6.9% 7.5%
Female 9.3% 7.7%
White 7.8% 9.2%
Black 16.6% 9.0%
Latino 11.4% 6.6%
Asian 5.9% 5.6%
18 - 24 years old 7.8% 6.9%
25 - 39 years old 8.4% 8.3%
40 - 64 years old 8.5% 8.4%
65 - 79 years old 6.5% 5.1%
80+ years old 4.6% 2.1%
Straight or heterosexual 8.9% 7.7%
Gay, Lesbian, or homosexual 13.0% 16.7%
Bisexual No Data 17.4%
Asexual / Celibate / None / Other No Data 3.9% Source: California Health Interview Survey, 2011-2014; *=2014 only. http://ask.chis.ucla.edu/
Among adults in SPA 5, 21.6% needed help for mental health and/or alcohol and
problems in the past year, and 18.5% of adults saw a health care provider for their
mental health and/or alcohol and drug issues in the past year. These numbers are
higher than county levels.
Of those who sought help, 36.4% did not receive treatment, as compared to 44.8% at
the county level. The Healthy People 2020 objective is for 64.6% of adults with a
mental disorder to receive treatment, which equates to 35.4% who do not receive
treatment, so SPA 5 does not meet the Healthy People 2020 objective.
12.2% of SPA 5 adults had taken a prescription medication for at least two weeks for an
emotional or mental health issue in the past year; this is higher than the 8.8% seen
countywide.
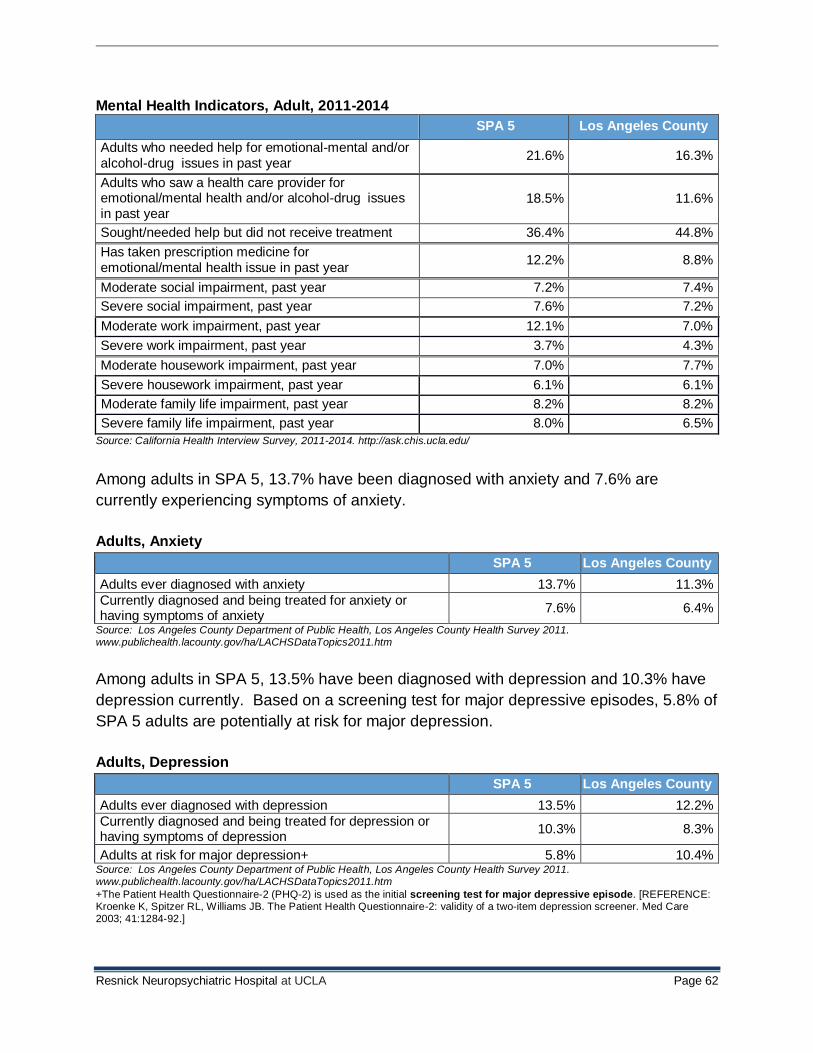
Resnick Neuropsychiatric Hospital at UCLA Page 62
Mental Health Indicators, Adult, 2011-2014
SPA 5 Los Angeles County
Adults who needed help for emotional-mental and/or alcohol-drug issues in past year
21.6% 16.3%
Adults who saw a health care provider for emotional/mental health and/or alcohol-drug issues in past year
18.5% 11.6%
Sought/needed help but did not receive treatment 36.4% 44.8%
Has taken prescription medicine for emotional/mental health issue in past year
12.2% 8.8%
Moderate social impairment, past year 7.2% 7.4%
Severe social impairment, past year 7.6% 7.2%
Moderate work impairment, past year 12.1% 7.0%
Severe work impairment, past year 3.7% 4.3%
Moderate housework impairment, past year 7.0% 7.7%
Severe housework impairment, past year 6.1% 6.1%
Moderate family life impairment, past year 8.2% 8.2%
Severe family life impairment, past year 8.0% 6.5%
Source: California Health Interview Survey, 2011-2014. http://ask.chis.ucla.edu/
Among adults in SPA 5, 13.7% have been diagnosed with anxiety and 7.6% are
currently experiencing symptoms of anxiety.
Adults, Anxiety
SPA 5 Los Angeles County
Adults ever diagnosed with anxiety 13.7% 11.3%
Currently diagnosed and being treated for anxiety or having symptoms of anxiety
7.6% 6.4%
Source: Los Angeles County Department of Public Health, Los Angeles County Health Survey 2011. www.publichealth.lacounty.gov/ha/LACHSDataTopics2011.htm
Among adults in SPA 5, 13.5% have been diagnosed with depression and 10.3% have
depression currently. Based on a screening test for major depressive episodes, 5.8% of
SPA 5 adults are potentially at risk for major depression.
Adults, Depression
SPA 5 Los Angeles County
Adults ever diagnosed with depression 13.5% 12.2%
Currently diagnosed and being treated for depression or having symptoms of depression
10.3% 8.3%
Adults at risk for major depression+ 5.8% 10.4% Source: Los Angeles County Department of Public Health, Los Angeles County Health Survey 2011. www.publichealth.lacounty.gov/ha/LACHSDataTopics2011.htm
+The Patient Health Questionnaire-2 (PHQ-2) is used as the initial screening test for major depressive episode. [REFERENCE: Kroenke K, Spitzer RL, Williams JB. The Patient Health Questionnaire-2: validity of a two-item depression screener. Med Care 2003; 41:1284-92.]
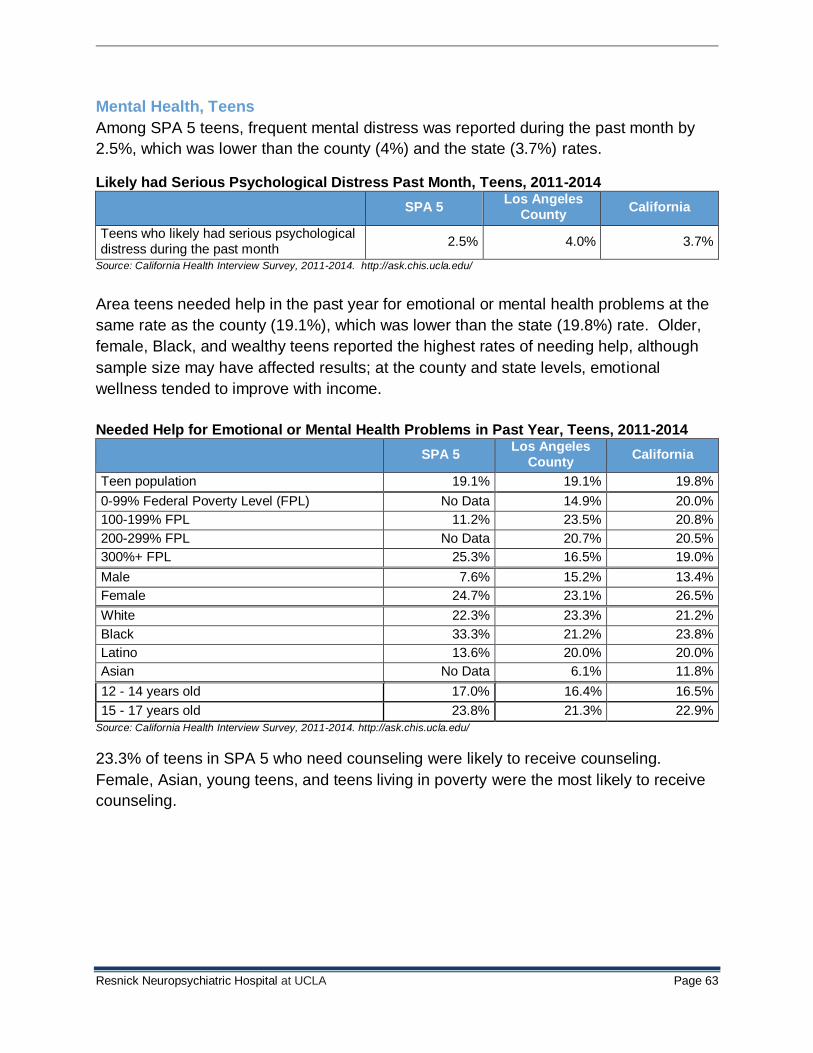
Resnick Neuropsychiatric Hospital at UCLA Page 63
Mental Health, Teens
Among SPA 5 teens, frequent mental distress was reported during the past month by
2.5%, which was lower than the county (4%) and the state (3.7%) rates.
Likely had Serious Psychological Distress Past Month, Teens, 2011-2014
SPA 5 Los Angeles
County California
Teens who likely had serious psychological distress during the past month
2.5% 4.0% 3.7%
Source: California Health Interview Survey, 2011-2014. http://ask.chis.ucla.edu/
Area teens needed help in the past year for emotional or mental health problems at the
same rate as the county (19.1%), which was lower than the state (19.8%) rate. Older,
female, Black, and wealthy teens reported the highest rates of needing help, although
sample size may have affected results; at the county and state levels, emotional
wellness tended to improve with income.
Needed Help for Emotional or Mental Health Problems in Past Year, Teens, 2011-2014
SPA 5 Los Angeles
County California
Teen population 19.1% 19.1% 19.8%
0-99% Federal Poverty Level (FPL) No Data 14.9% 20.0%
100-199% FPL 11.2% 23.5% 20.8%
200-299% FPL No Data 20.7% 20.5%
300%+ FPL 25.3% 16.5% 19.0%
Male 7.6% 15.2% 13.4%
Female 24.7% 23.1% 26.5%
White 22.3% 23.3% 21.2%
Black 33.3% 21.2% 23.8%
Latino 13.6% 20.0% 20.0%
Asian No Data 6.1% 11.8%
12 - 14 years old 17.0% 16.4% 16.5%
15 - 17 years old 23.8% 21.3% 22.9%
Source: California Health Interview Survey, 2011-2014. http://ask.chis.ucla.edu/
23.3% of teens in SPA 5 who need counseling were likely to receive counseling.
Female, Asian, young teens, and teens living in poverty were the most likely to receive
counseling.
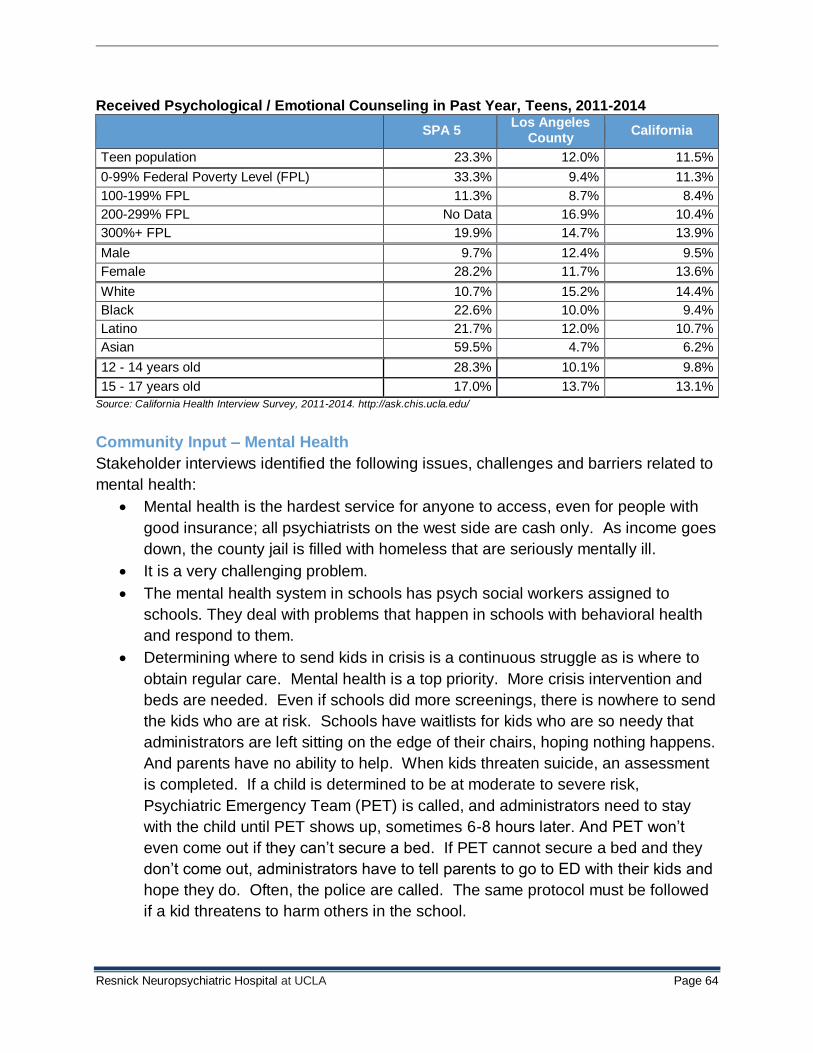
Resnick Neuropsychiatric Hospital at UCLA Page 64
Received Psychological / Emotional Counseling in Past Year, Teens, 2011-2014
SPA 5 Los Angeles
County California
Teen population 23.3% 12.0% 11.5%
0-99% Federal Poverty Level (FPL) 33.3% 9.4% 11.3%
100-199% FPL 11.3% 8.7% 8.4%
200-299% FPL No Data 16.9% 10.4%
300%+ FPL 19.9% 14.7% 13.9%
Male 9.7% 12.4% 9.5%
Female 28.2% 11.7% 13.6%
White 10.7% 15.2% 14.4%
Black 22.6% 10.0% 9.4%
Latino 21.7% 12.0% 10.7%
Asian 59.5% 4.7% 6.2%
12 - 14 years old 28.3% 10.1% 9.8%
15 - 17 years old 17.0% 13.7% 13.1%
Source: California Health Interview Survey, 2011-2014. http://ask.chis.ucla.edu/
Community Input – Mental Health
Stakeholder interviews identified the following issues, challenges and barriers related to
mental health:
Mental health is the hardest service for anyone to access, even for people with
good insurance; all psychiatrists on the west side are cash only. As income goes
down, the county jail is filled with homeless that are seriously mentally ill.
It is a very challenging problem.
The mental health system in schools has psych social workers assigned to
schools. They deal with problems that happen in schools with behavioral health
and respond to them.
Determining where to send kids in crisis is a continuous struggle as is where to
obtain regular care. Mental health is a top priority. More crisis intervention and
beds are needed. Even if schools did more screenings, there is nowhere to send
the kids who are at risk. Schools have waitlists for kids who are so needy that
administrators are left sitting on the edge of their chairs, hoping nothing happens.
And parents have no ability to help. When kids threaten suicide, an assessment
is completed. If a child is determined to be at moderate to severe risk,
Psychiatric Emergency Team (PET) is called, and administrators need to stay
with the child until PET shows up, sometimes 6-8 hours later. And PET won’t
even come out if they can’t secure a bed. If PET cannot secure a bed and they
don’t come out, administrators have to tell parents to go to ED with their kids and
hope they do. Often, the police are called. The same protocol must be followed
if a kid threatens to harm others in the school.
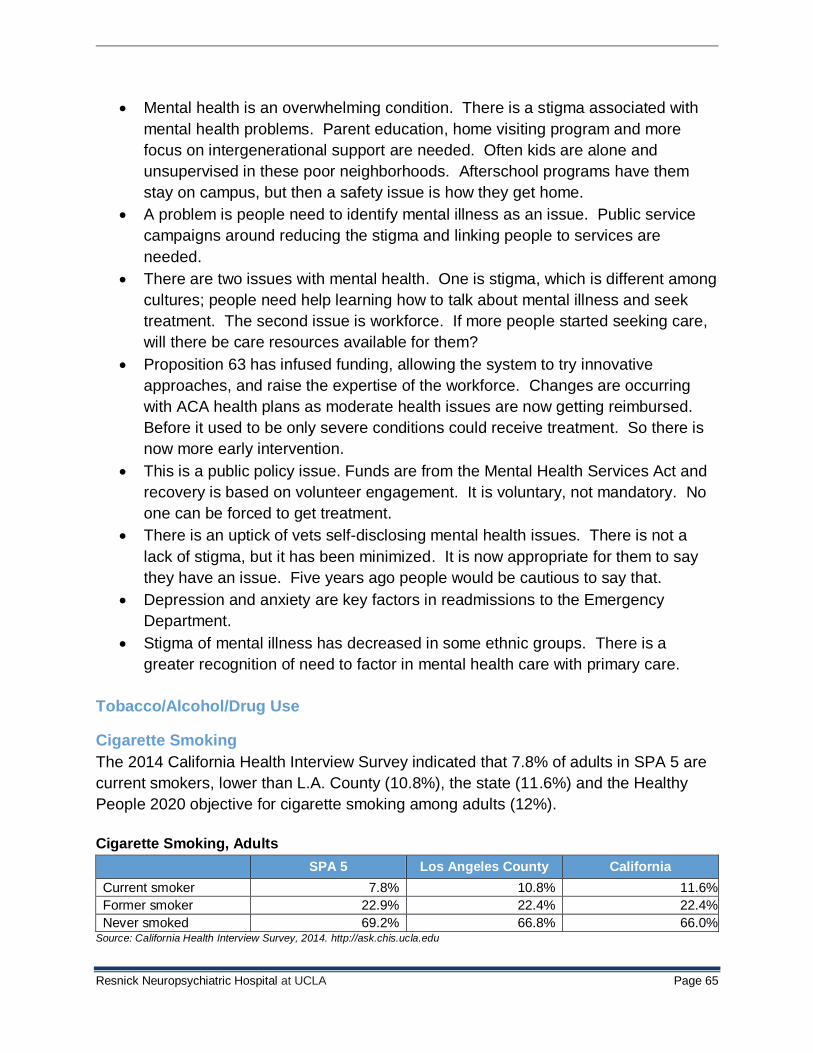
Resnick Neuropsychiatric Hospital at UCLA Page 65
Mental health is an overwhelming condition. There is a stigma associated with
mental health problems. Parent education, home visiting program and more
focus on intergenerational support are needed. Often kids are alone and
unsupervised in these poor neighborhoods. Afterschool programs have them
stay on campus, but then a safety issue is how they get home.
A problem is people need to identify mental illness as an issue. Public service
campaigns around reducing the stigma and linking people to services are
needed.
There are two issues with mental health. One is stigma, which is different among
cultures; people need help learning how to talk about mental illness and seek
treatment. The second issue is workforce. If more people started seeking care,
will there be care resources available for them?
Proposition 63 has infused funding, allowing the system to try innovative
approaches, and raise the expertise of the workforce. Changes are occurring
with ACA health plans as moderate health issues are now getting reimbursed.
Before it used to be only severe conditions could receive treatment. So there is
now more early intervention.
This is a public policy issue. Funds are from the Mental Health Services Act and
recovery is based on volunteer engagement. It is voluntary, not mandatory. No
one can be forced to get treatment.
There is an uptick of vets self-disclosing mental health issues. There is not a
lack of stigma, but it has been minimized. It is now appropriate for them to say
they have an issue. Five years ago people would be cautious to say that.
Depression and anxiety are key factors in readmissions to the Emergency
Department.
Stigma of mental illness has decreased in some ethnic groups. There is a
greater recognition of need to factor in mental health care with primary care.
Tobacco/Alcohol/Drug Use
Cigarette Smoking
The 2014 California Health Interview Survey indicated that 7.8% of adults in SPA 5 are
current smokers, lower than L.A. County (10.8%), the state (11.6%) and the Healthy
People 2020 objective for cigarette smoking among adults (12%).
Cigarette Smoking, Adults
SPA 5 Los Angeles County California
Current smoker 7.8% 10.8% 11.6%
Former smoker 22.9% 22.4% 22.4%
Never smoked 69.2% 66.8% 66.0% Source: California Health Interview Survey, 2014. http://ask.chis.ucla.edu
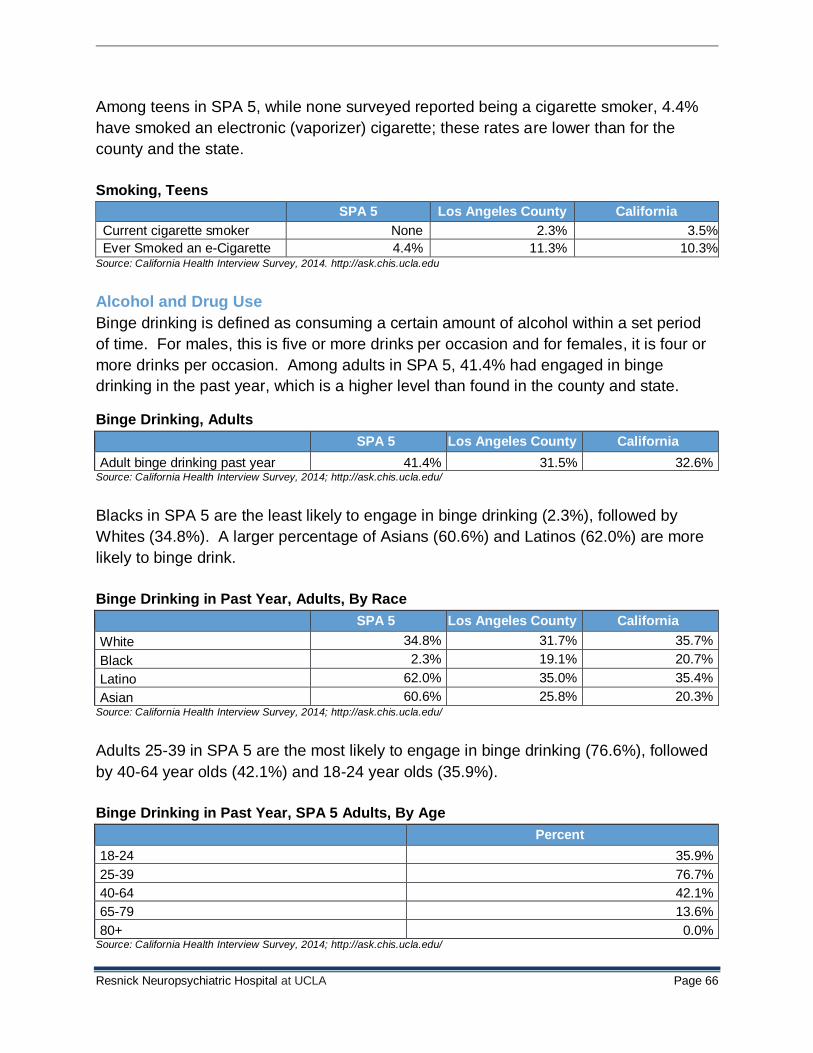
Resnick Neuropsychiatric Hospital at UCLA Page 66
Among teens in SPA 5, while none surveyed reported being a cigarette smoker, 4.4%
have smoked an electronic (vaporizer) cigarette; these rates are lower than for the
county and the state.
Smoking, Teens
SPA 5 Los Angeles County California
Current cigarette smoker None 2.3% 3.5%
Ever Smoked an e-Cigarette 4.4% 11.3% 10.3% Source: California Health Interview Survey, 2014. http://ask.chis.ucla.edu
Alcohol and Drug Use
Binge drinking is defined as consuming a certain amount of alcohol within a set period
of time. For males, this is five or more drinks per occasion and for females, it is four or
more drinks per occasion. Among adults in SPA 5, 41.4% had engaged in binge
drinking in the past year, which is a higher level than found in the county and state.
Binge Drinking, Adults
SPA 5 Los Angeles County California
Adult binge drinking past year 41.4% 31.5% 32.6% Source: California Health Interview Survey, 2014; http://ask.chis.ucla.edu/
Blacks in SPA 5 are the least likely to engage in binge drinking (2.3%), followed by
Whites (34.8%). A larger percentage of Asians (60.6%) and Latinos (62.0%) are more
likely to binge drink.
Binge Drinking in Past Year, Adults, By Race
SPA 5 Los Angeles County California
White 34.8% 31.7% 35.7%
Black 2.3% 19.1% 20.7%
Latino 62.0% 35.0% 35.4%
Asian 60.6% 25.8% 20.3% Source: California Health Interview Survey, 2014; http://ask.chis.ucla.edu/
Adults 25-39 in SPA 5 are the most likely to engage in binge drinking (76.6%), followed
by 40-64 year olds (42.1%) and 18-24 year olds (35.9%).
Binge Drinking in Past Year, SPA 5 Adults, By Age
Percent
18-24 35.9%
25-39 76.7%
40-64 42.1%
65-79 13.6%
80+ 0.0% Source: California Health Interview Survey, 2014; http://ask.chis.ucla.edu/
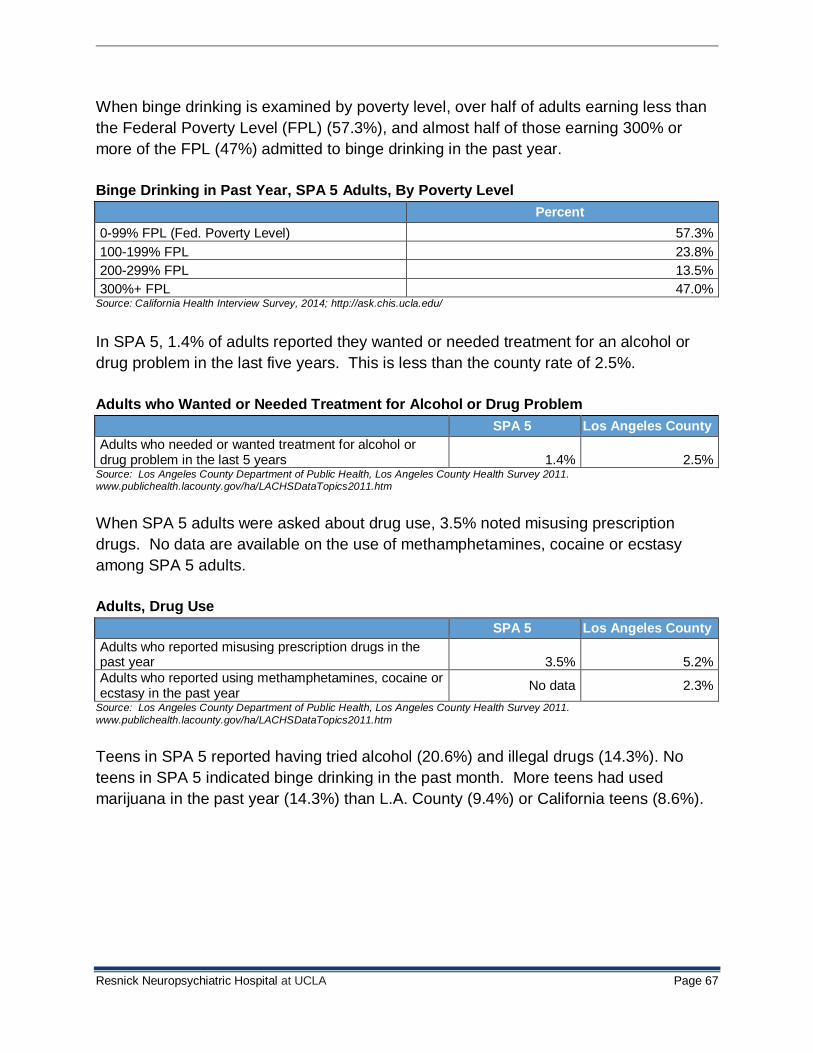
Resnick Neuropsychiatric Hospital at UCLA Page 67
When binge drinking is examined by poverty level, over half of adults earning less than
the Federal Poverty Level (FPL) (57.3%), and almost half of those earning 300% or
more of the FPL (47%) admitted to binge drinking in the past year.
Binge Drinking in Past Year, SPA 5 Adults, By Poverty Level
Percent
0-99% FPL (Fed. Poverty Level) 57.3%
100-199% FPL 23.8%
200-299% FPL 13.5%
300%+ FPL 47.0% Source: California Health Interview Survey, 2014; http://ask.chis.ucla.edu/
In SPA 5, 1.4% of adults reported they wanted or needed treatment for an alcohol or
drug problem in the last five years. This is less than the county rate of 2.5%.
Adults who Wanted or Needed Treatment for Alcohol or Drug Problem
SPA 5 Los Angeles County
Adults who needed or wanted treatment for alcohol or drug problem in the last 5 years 1.4% 2.5%
Source: Los Angeles County Department of Public Health, Los Angeles County Health Survey 2011. www.publichealth.lacounty.gov/ha/LACHSDataTopics2011.htm
When SPA 5 adults were asked about drug use, 3.5% noted misusing prescription
drugs. No data are available on the use of methamphetamines, cocaine or ecstasy
among SPA 5 adults.
Adults, Drug Use
SPA 5 Los Angeles County
Adults who reported misusing prescription drugs in the past year 3.5% 5.2%
Adults who reported using methamphetamines, cocaine or ecstasy in the past year
No data 2.3%
Source: Los Angeles County Department of Public Health, Los Angeles County Health Survey 2011.
www.publichealth.lacounty.gov/ha/LACHSDataTopics2011.htm
Teens in SPA 5 reported having tried alcohol (20.6%) and illegal drugs (14.3%). No
teens in SPA 5 indicated binge drinking in the past month. More teens had used
marijuana in the past year (14.3%) than L.A. County (9.4%) or California teens (8.6%).
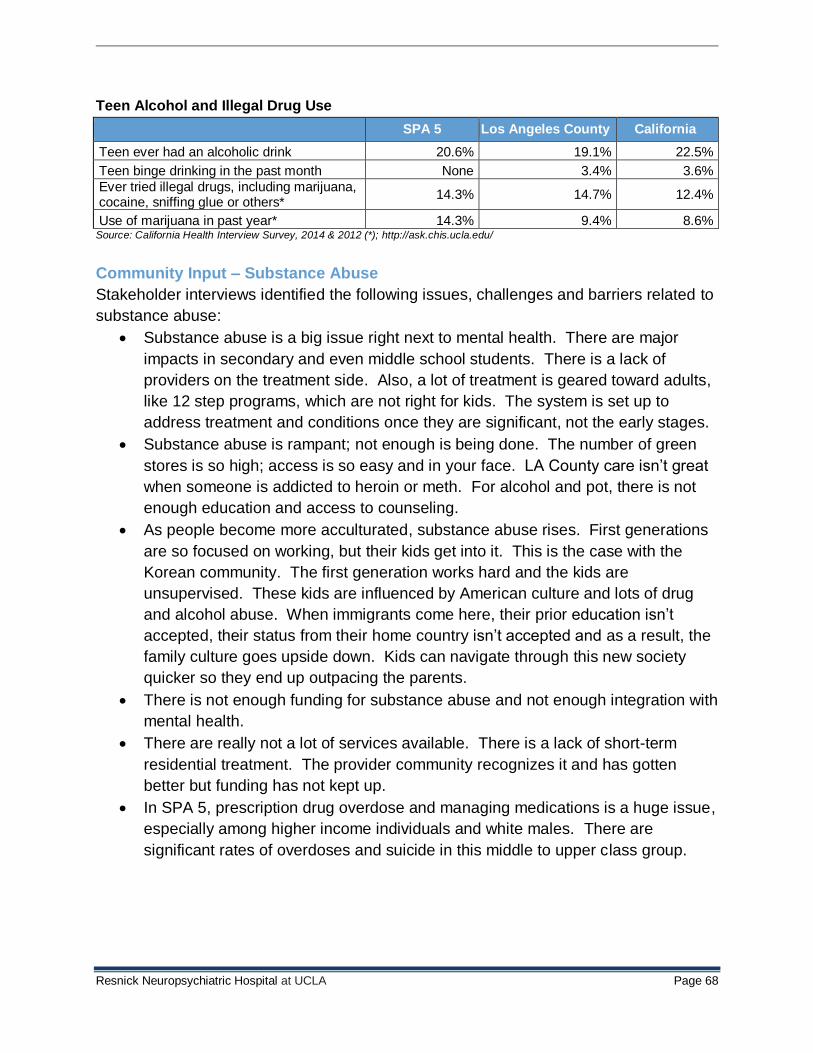
Resnick Neuropsychiatric Hospital at UCLA Page 68
Teen Alcohol and Illegal Drug Use
SPA 5 Los Angeles County California
Teen ever had an alcoholic drink 20.6% 19.1% 22.5%
Teen binge drinking in the past month None 3.4% 3.6%
Ever tried illegal drugs, including marijuana, cocaine, sniffing glue or others*
14.3% 14.7% 12.4%
Use of marijuana in past year* 14.3% 9.4% 8.6% Source: California Health Interview Survey, 2014 & 2012 (*); http://ask.chis.ucla.edu/
Community Input – Substance Abuse
Stakeholder interviews identified the following issues, challenges and barriers related to
substance abuse:
Substance abuse is a big issue right next to mental health. There are major
impacts in secondary and even middle school students. There is a lack of
providers on the treatment side. Also, a lot of treatment is geared toward adults,
like 12 step programs, which are not right for kids. The system is set up to
address treatment and conditions once they are significant, not the early stages.
Substance abuse is rampant; not enough is being done. The number of green
stores is so high; access is so easy and in your face. LA County care isn’t great
when someone is addicted to heroin or meth. For alcohol and pot, there is not
enough education and access to counseling.
As people become more acculturated, substance abuse rises. First generations
are so focused on working, but their kids get into it. This is the case with the
Korean community. The first generation works hard and the kids are
unsupervised. These kids are influenced by American culture and lots of drug
and alcohol abuse. When immigrants come here, their prior education isn’t
accepted, their status from their home country isn’t accepted and as a result, the
family culture goes upside down. Kids can navigate through this new society
quicker so they end up outpacing the parents.
There is not enough funding for substance abuse and not enough integration with
mental health.
There are really not a lot of services available. There is a lack of short-term
residential treatment. The provider community recognizes it and has gotten
better but funding has not kept up.
In SPA 5, prescription drug overdose and managing medications is a huge issue,
especially among higher income individuals and white males. There are
significant rates of overdoses and suicide in this middle to upper class group.

Resnick Neuropsychiatric Hospital at UCLA Page 69
Community Input
In addition to offering input on the significant health needs in the communities served by
UCLA Health, the community stakeholders were asked what health or social services
were most difficult to access or are missing in the community. Their responses
included:
Dental services
Mental health services
Access to care (insurance coverage, homeless care, culturally competent,
linguistically accessible)
Substance abuse services (counseling, treatment, residential treatment, LGBT
competent)
Specialty care (orthopedics, gastroenterology, cardiology, oncology, psychiatry
and dermatology)
Transportation
Permanent supportive housing
Vision care (low-cost glasses)
Legal services
Additional Comments or Concerns
Finally, interview participants were asked if they had any other comments or concerns
they wanted to share with UCLA Health. Their responses included:
Hospitals play a pivotal role in capturing patients at their sickest. It's important
for hospitals to collaborate with health plans to help coordinate transitions.
It is important for organizations to work together on policy issues to address
priority needs and work on implementing or changing policy to address issues.
UCLA Health is really respected in the community. So anything they do toward
communication of health and preventive care, and improving health behaviors
and increasing resources is really important and worthwhile.
Encourage partnerships between hospitals and community-based providers to
provide health services at community-based organizations to avoid coming to the
ER. Make rooms available at the hospital so that community-based partners can
use the space to serve their clients.
Hospitals need to collaborate on health information. Create a universal health
information exchange so that primary care providers and specialists can share
information and coordinate care. There is no shared health information so
medical records have to be re-created each time patients see a new doctor or
specialist. A lot of the patient portals are on different data platforms, but if there
is a way to make it universal so that health information can be shared among
providers, it will make health care more coordinated.
Resnick Neuropsychiatric Hospital at UCLA Page 70
There is still a lack of coordination between systems as many organizations are
seeing the same patients for various reasons and they don’t coordinate care.
Organizations can work together to address needs and change policy on issues
of housing and poverty. Hospitals can work together on issues of how the
physical environment affects asthma. Also, provide training for youth for an entry
point into health care workforce.
Hospitals can support community-based efforts though grants and collaboratives.
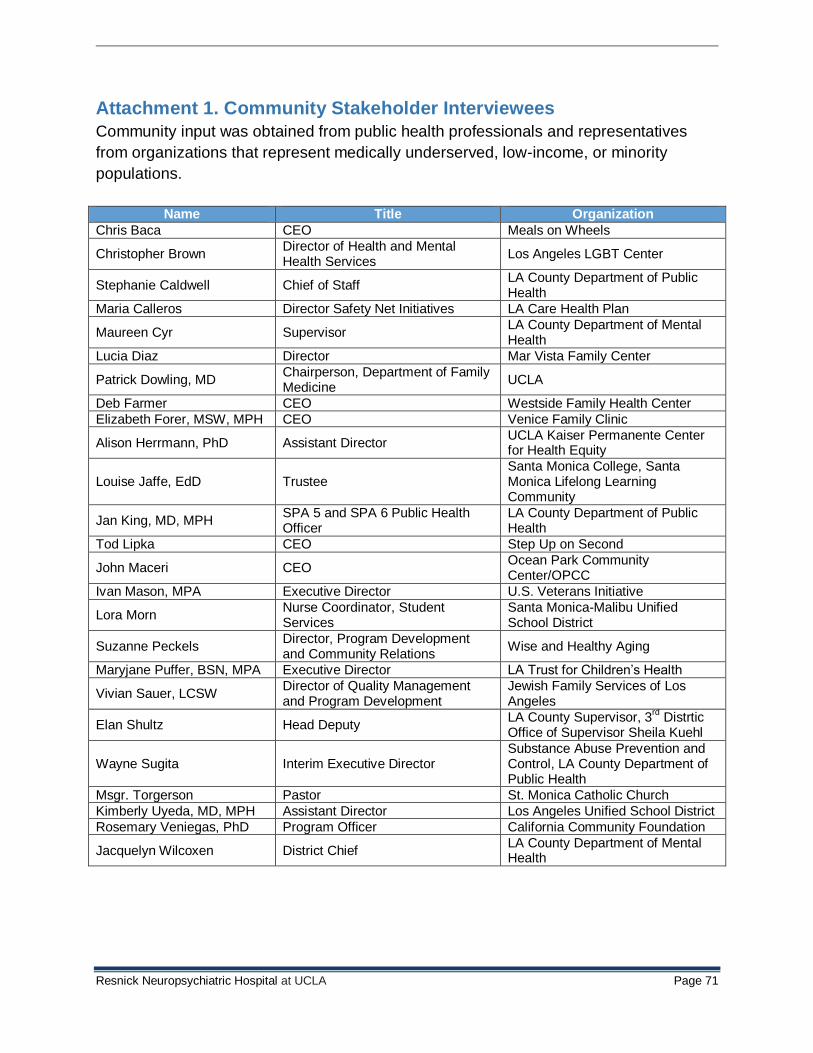
Resnick Neuropsychiatric Hospital at UCLA Page 71
Attachment 1. Community Stakeholder Interviewees
Community input was obtained from public health professionals and representatives
from organizations that represent medically underserved, low-income, or minority
populations.
Name Title Organization
Chris Baca CEO Meals on Wheels
Christopher Brown Director of Health and Mental Health Services
Los Angeles LGBT Center
Stephanie Caldwell Chief of Staff LA County Department of Public Health
Maria Calleros Director Safety Net Initiatives LA Care Health Plan
Maureen Cyr Supervisor LA County Department of Mental Health
Lucia Diaz Director Mar Vista Family Center
Patrick Dowling, MD Chairperson, Department of Family Medicine
UCLA
Deb Farmer CEO Westside Family Health Center
Elizabeth Forer, MSW, MPH CEO Venice Family Clinic
Alison Herrmann, PhD Assistant Director UCLA Kaiser Permanente Center for Health Equity
Louise Jaffe, EdD Trustee Santa Monica College, Santa Monica Lifelong Learning Community
Jan King, MD, MPH SPA 5 and SPA 6 Public Health Officer
LA County Department of Public Health
Tod Lipka CEO Step Up on Second
John Maceri CEO Ocean Park Community Center/OPCC
Ivan Mason, MPA Executive Director U.S. Veterans Initiative
Lora Morn Nurse Coordinator, Student Services
Santa Monica-Malibu Unified School District
Suzanne Peckels Director, Program Development and Community Relations
Wise and Healthy Aging
Maryjane Puffer, BSN, MPA Executive Director LA Trust for Children’s Health
Vivian Sauer, LCSW Director of Quality Management and Program Development
Jewish Family Services of Los Angeles
Elan Shultz Head Deputy LA County Supervisor, 3
rd Distrtic
Office of Supervisor Sheila Kuehl
Wayne Sugita Interim Executive Director Substance Abuse Prevention and Control, LA County Department of Public Health
Msgr. Torgerson Pastor St. Monica Catholic Church
Kimberly Uyeda, MD, MPH Assistant Director Los Angeles Unified School District
Rosemary Veniegas, PhD Program Officer California Community Foundation
Jacquelyn Wilcoxen District Chief LA County Department of Mental Health
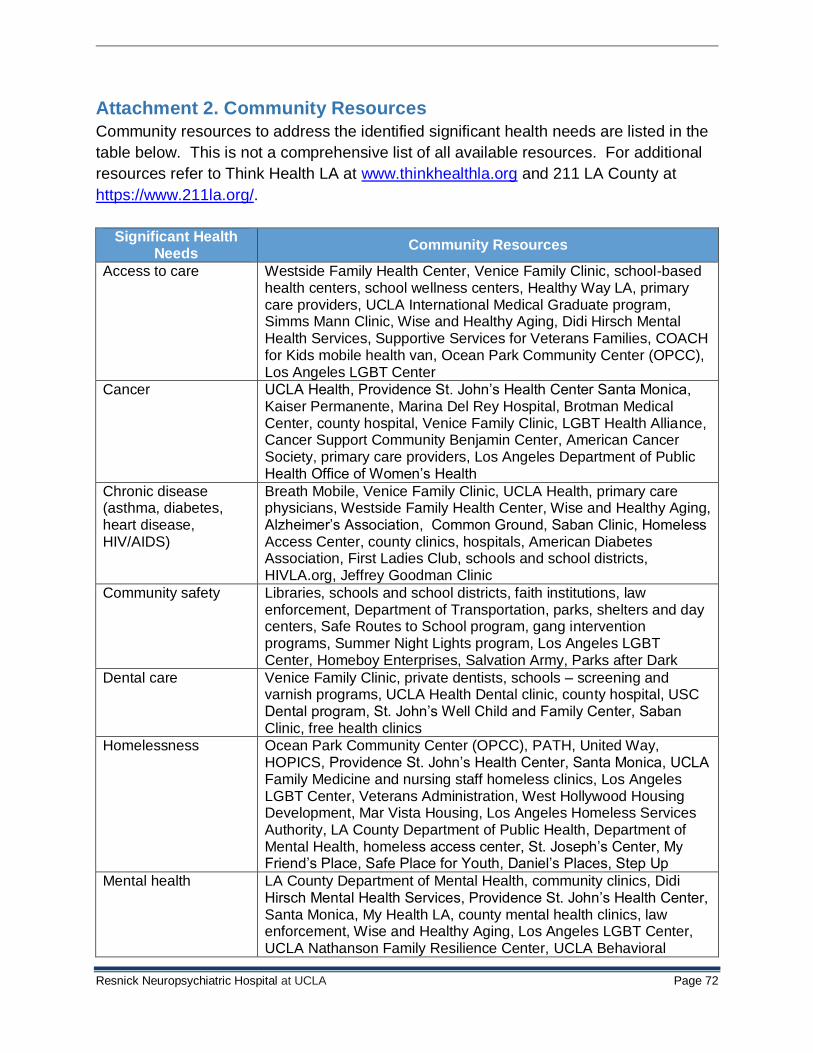
Resnick Neuropsychiatric Hospital at UCLA Page 72
Attachment 2. Community Resources
Community resources to address the identified significant health needs are listed in the
table below. This is not a comprehensive list of all available resources. For additional
resources refer to Think Health LA at www.thinkhealthla.org and 211 LA County at
https://www.211la.org/.
Significant Health Needs
Community Resources
Access to care Westside Family Health Center, Venice Family Clinic, school-based health centers, school wellness centers, Healthy Way LA, primary care providers, UCLA International Medical Graduate program, Simms Mann Clinic, Wise and Healthy Aging, Didi Hirsch Mental Health Services, Supportive Services for Veterans Families, COACH for Kids mobile health van, Ocean Park Community Center (OPCC), Los Angeles LGBT Center
Cancer UCLA Health, Providence St. John’s Health Center Santa Monica, Kaiser Permanente, Marina Del Rey Hospital, Brotman Medical Center, county hospital, Venice Family Clinic, LGBT Health Alliance, Cancer Support Community Benjamin Center, American Cancer Society, primary care providers, Los Angeles Department of Public Health Office of Women’s Health
Chronic disease (asthma, diabetes, heart disease, HIV/AIDS)
Breath Mobile, Venice Family Clinic, UCLA Health, primary care physicians, Westside Family Health Center, Wise and Healthy Aging, Alzheimer’s Association, Common Ground, Saban Clinic, Homeless Access Center, county clinics, hospitals, American Diabetes Association, First Ladies Club, schools and school districts, HIVLA.org, Jeffrey Goodman Clinic
Community safety Libraries, schools and school districts, faith institutions, law enforcement, Department of Transportation, parks, shelters and day centers, Safe Routes to School program, gang intervention programs, Summer Night Lights program, Los Angeles LGBT Center, Homeboy Enterprises, Salvation Army, Parks after Dark
Dental care Venice Family Clinic, private dentists, schools – screening and varnish programs, UCLA Health Dental clinic, county hospital, USC Dental program, St. John’s Well Child and Family Center, Saban Clinic, free health clinics
Homelessness Ocean Park Community Center (OPCC), PATH, United Way, HOPICS, Providence St. John’s Health Center, Santa Monica, UCLA Family Medicine and nursing staff homeless clinics, Los Angeles LGBT Center, Veterans Administration, West Hollywood Housing Development, Mar Vista Housing, Los Angeles Homeless Services Authority, LA County Department of Public Health, Department of Mental Health, homeless access center, St. Joseph’s Center, My Friend’s Place, Safe Place for Youth, Daniel’s Places, Step Up
Mental health LA County Department of Mental Health, community clinics, Didi Hirsch Mental Health Services, Providence St. John’s Health Center, Santa Monica, My Health LA, county mental health clinics, law enforcement, Wise and Healthy Aging, Los Angeles LGBT Center, UCLA Nathanson Family Resilience Center, UCLA Behavioral
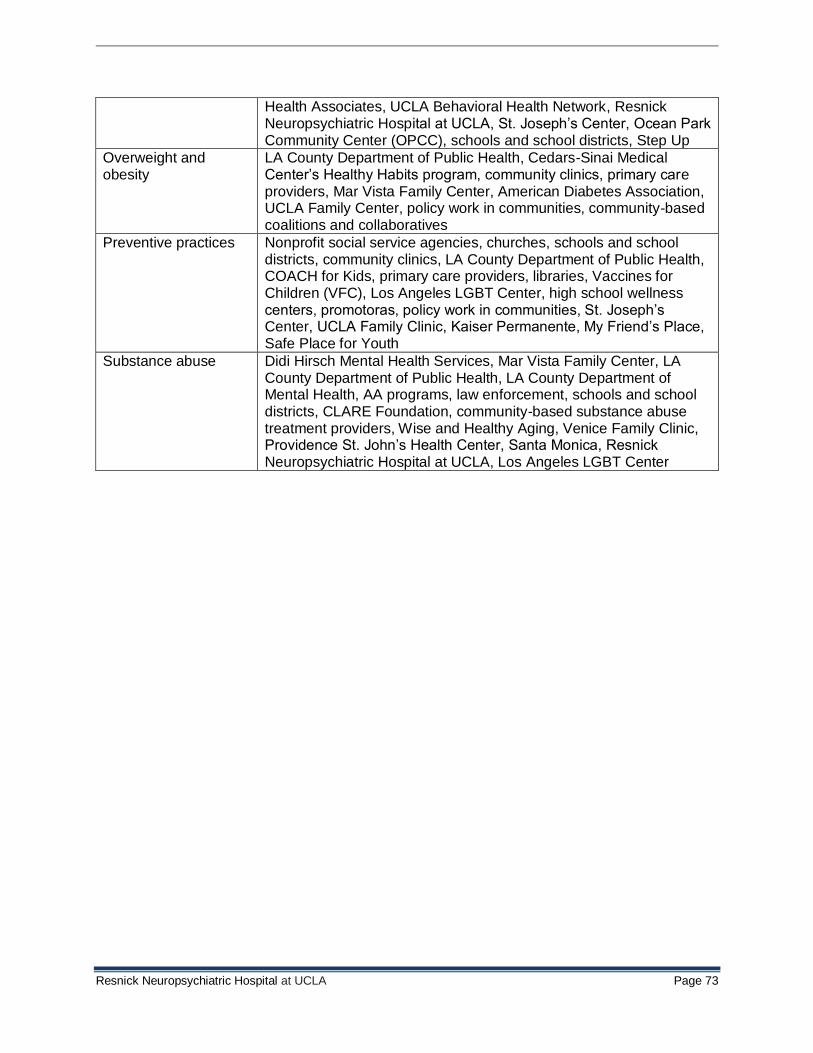
Resnick Neuropsychiatric Hospital at UCLA Page 73
Health Associates, UCLA Behavioral Health Network, Resnick Neuropsychiatric Hospital at UCLA, St. Joseph’s Center, Ocean Park Community Center (OPCC), schools and school districts, Step Up
Overweight and obesity
LA County Department of Public Health, Cedars-Sinai Medical Center’s Healthy Habits program, community clinics, primary care providers, Mar Vista Family Center, American Diabetes Association, UCLA Family Center, policy work in communities, community-based coalitions and collaboratives
Preventive practices Nonprofit social service agencies, churches, schools and school districts, community clinics, LA County Department of Public Health, COACH for Kids, primary care providers, libraries, Vaccines for Children (VFC), Los Angeles LGBT Center, high school wellness centers, promotoras, policy work in communities, St. Joseph’s Center, UCLA Family Clinic, Kaiser Permanente, My Friend’s Place, Safe Place for Youth
Substance abuse Didi Hirsch Mental Health Services, Mar Vista Family Center, LA County Department of Public Health, LA County Department of Mental Health, AA programs, law enforcement, schools and school districts, CLARE Foundation, community-based substance abuse treatment providers, Wise and Healthy Aging, Venice Family Clinic, Providence St. John’s Health Center, Santa Monica, Resnick Neuropsychiatric Hospital at UCLA, Los Angeles LGBT Center
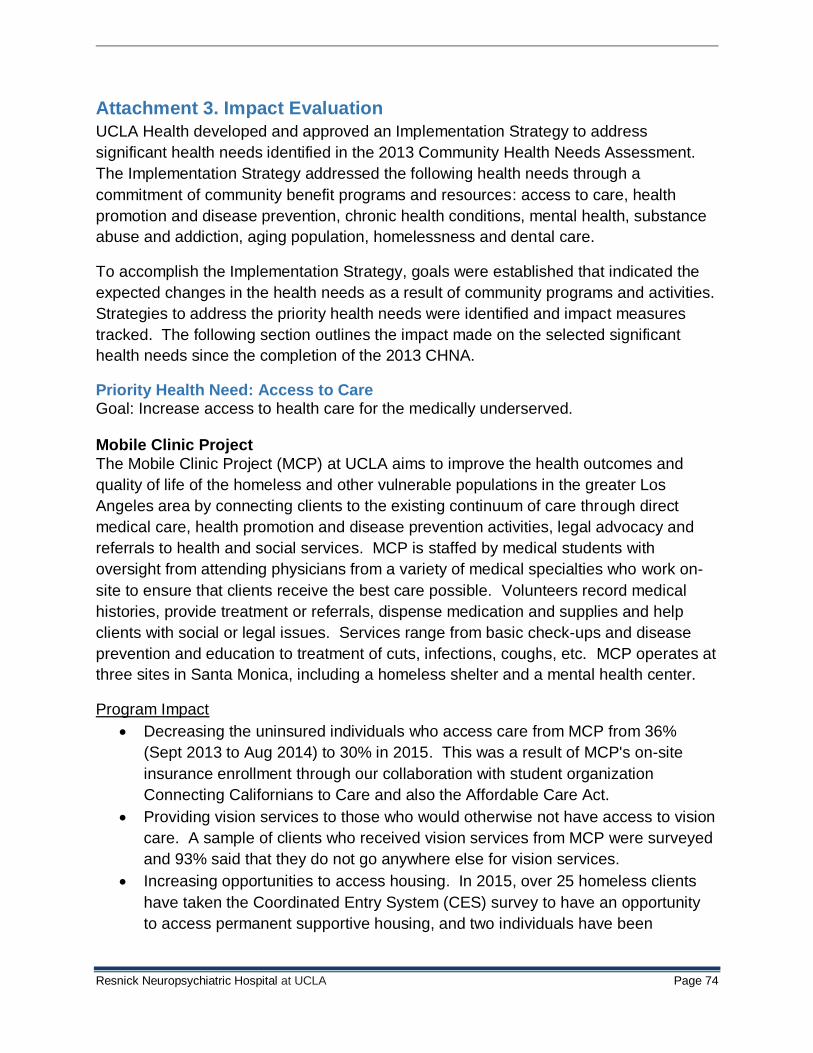
Resnick Neuropsychiatric Hospital at UCLA Page 74
Attachment 3. Impact Evaluation
UCLA Health developed and approved an Implementation Strategy to address
significant health needs identified in the 2013 Community Health Needs Assessment.
The Implementation Strategy addressed the following health needs through a
commitment of community benefit programs and resources: access to care, health
promotion and disease prevention, chronic health conditions, mental health, substance
abuse and addiction, aging population, homelessness and dental care.
To accomplish the Implementation Strategy, goals were established that indicated the
expected changes in the health needs as a result of community programs and activities.
Strategies to address the priority health needs were identified and impact measures
tracked. The following section outlines the impact made on the selected significant
health needs since the completion of the 2013 CHNA.
Priority Health Need: Access to Care Goal: Increase access to health care for the medically underserved. Mobile Clinic Project
The Mobile Clinic Project (MCP) at UCLA aims to improve the health outcomes and
quality of life of the homeless and other vulnerable populations in the greater Los
Angeles area by connecting clients to the existing continuum of care through direct
medical care, health promotion and disease prevention activities, legal advocacy and
referrals to health and social services. MCP is staffed by medical students with
oversight from attending physicians from a variety of medical specialties who work on-
site to ensure that clients receive the best care possible. Volunteers record medical
histories, provide treatment or referrals, dispense medication and supplies and help
clients with social or legal issues. Services range from basic check-ups and disease
prevention and education to treatment of cuts, infections, coughs, etc. MCP operates at
three sites in Santa Monica, including a homeless shelter and a mental health center.
Program Impact
Decreasing the uninsured individuals who access care from MCP from 36%
(Sept 2013 to Aug 2014) to 30% in 2015. This was a result of MCP's on-site
insurance enrollment through our collaboration with student organization
Connecting Californians to Care and also the Affordable Care Act.
Providing vision services to those who would otherwise not have access to vision
care. A sample of clients who received vision services from MCP were surveyed
and 93% said that they do not go anywhere else for vision services.
Increasing opportunities to access housing. In 2015, over 25 homeless clients
have taken the Coordinated Entry System (CES) survey to have an opportunity
to access permanent supportive housing, and two individuals have been
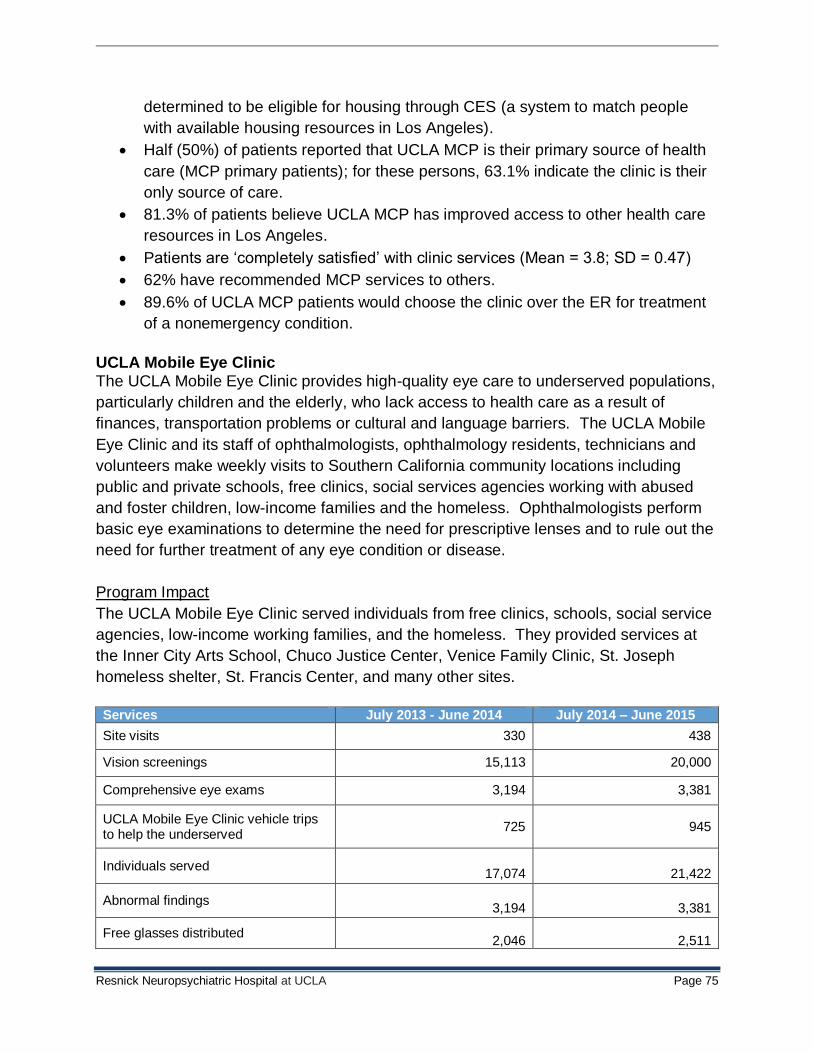
Resnick Neuropsychiatric Hospital at UCLA Page 75
determined to be eligible for housing through CES (a system to match people
with available housing resources in Los Angeles).
Half (50%) of patients reported that UCLA MCP is their primary source of health
care (MCP primary patients); for these persons, 63.1% indicate the clinic is their
only source of care.
81.3% of patients believe UCLA MCP has improved access to other health care
resources in Los Angeles.
Patients are ‘completely satisfied’ with clinic services (Mean = 3.8; SD = 0.47)
62% have recommended MCP services to others.
89.6% of UCLA MCP patients would choose the clinic over the ER for treatment
of a nonemergency condition.
UCLA Mobile Eye Clinic The UCLA Mobile Eye Clinic provides high-quality eye care to underserved populations,
particularly children and the elderly, who lack access to health care as a result of
finances, transportation problems or cultural and language barriers. The UCLA Mobile
Eye Clinic and its staff of ophthalmologists, ophthalmology residents, technicians and
volunteers make weekly visits to Southern California community locations including
public and private schools, free clinics, social services agencies working with abused
and foster children, low-income families and the homeless. Ophthalmologists perform
basic eye examinations to determine the need for prescriptive lenses and to rule out the
need for further treatment of any eye condition or disease.
Program Impact
The UCLA Mobile Eye Clinic served individuals from free clinics, schools, social service
agencies, low-income working families, and the homeless. They provided services at
the Inner City Arts School, Chuco Justice Center, Venice Family Clinic, St. Joseph
homeless shelter, St. Francis Center, and many other sites.
Services July 2013 - June 2014 July 2014 – June 2015
Site visits 330 438
Vision screenings 15,113 20,000
Comprehensive eye exams 3,194 3,381
UCLA Mobile Eye Clinic vehicle trips to help the underserved
725 945
Individuals served
17,074
21,422
Abnormal findings
3,194
3,381
Free glasses distributed
2,046
2,511
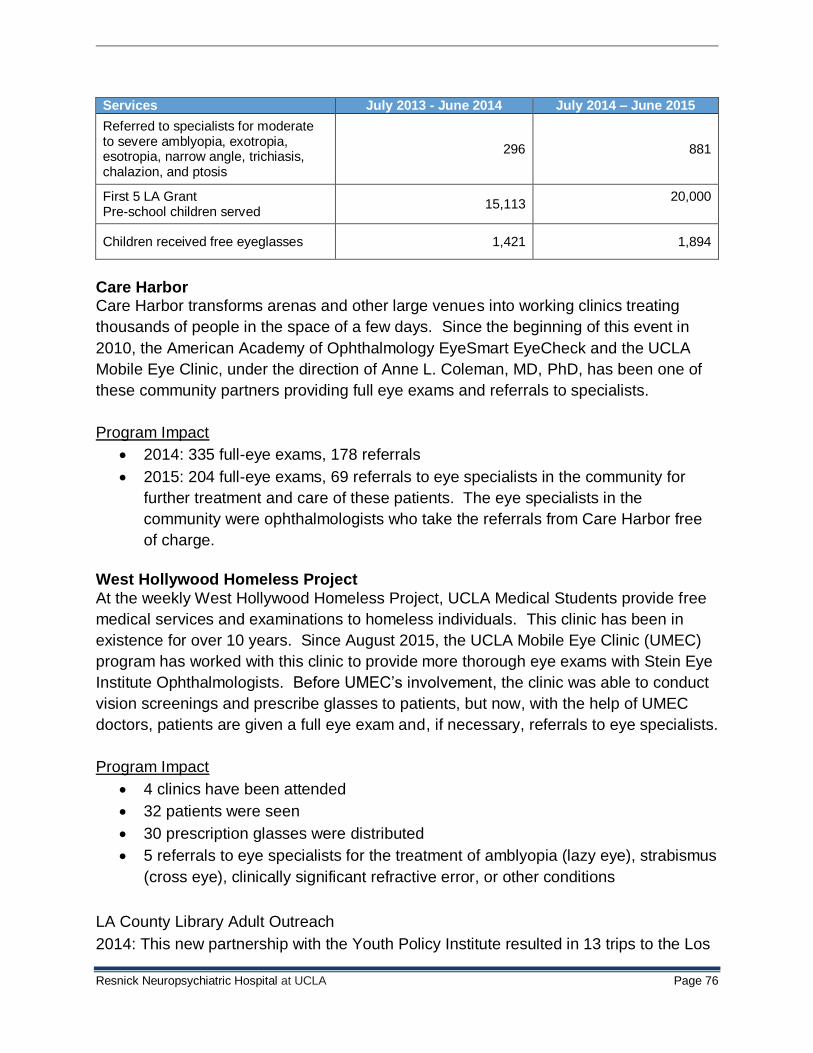
Resnick Neuropsychiatric Hospital at UCLA Page 76
Services July 2013 - June 2014 July 2014 – June 2015
Referred to specialists for moderate to severe amblyopia, exotropia, esotropia, narrow angle, trichiasis, chalazion, and ptosis
296 881
First 5 LA Grant Pre-school children served
15,113 20,000
Children received free eyeglasses 1,421 1,894
Care Harbor Care Harbor transforms arenas and other large venues into working clinics treating
thousands of people in the space of a few days. Since the beginning of this event in
2010, the American Academy of Ophthalmology EyeSmart EyeCheck and the UCLA
Mobile Eye Clinic, under the direction of Anne L. Coleman, MD, PhD, has been one of
these community partners providing full eye exams and referrals to specialists.
Program Impact
2014: 335 full-eye exams, 178 referrals
2015: 204 full-eye exams, 69 referrals to eye specialists in the community for
further treatment and care of these patients. The eye specialists in the
community were ophthalmologists who take the referrals from Care Harbor free
of charge.
West Hollywood Homeless Project
At the weekly West Hollywood Homeless Project, UCLA Medical Students provide free
medical services and examinations to homeless individuals. This clinic has been in
existence for over 10 years. Since August 2015, the UCLA Mobile Eye Clinic (UMEC)
program has worked with this clinic to provide more thorough eye exams with Stein Eye
Institute Ophthalmologists. Before UMEC’s involvement, the clinic was able to conduct
vision screenings and prescribe glasses to patients, but now, with the help of UMEC
doctors, patients are given a full eye exam and, if necessary, referrals to eye specialists.
Program Impact
4 clinics have been attended
32 patients were seen
30 prescription glasses were distributed
5 referrals to eye specialists for the treatment of amblyopia (lazy eye), strabismus
(cross eye), clinically significant refractive error, or other conditions
LA County Library Adult Outreach
2014: This new partnership with the Youth Policy Institute resulted in 13 trips to the Los
Resnick Neuropsychiatric Hospital at UCLA Page 77
Angeles Public Libraries. The UMEC helped promote the Promise Neighborhoods
Initiative of transforming underserved community by examining 189 individuals. All 189
individuals had abnormal findings; 159 received a free pair of eye glasses, and 19
individuals were referred to specialists.
2015: 36 Trips to Los Angeles County libraries, 357 people were seen, and 314 glasses
were distributed.
Venice Family Clinic Uninsured Cohort Pilot Program The Venice Family Clinic (VFC) Uninsured Cohort pilot program was developed to
improve access to specialty care and hospitalizations to a cohort of up to 1,200
uninsured, adult patients utilizing the VFC’s Irma Colen Health Center as their medical
home. The UCLA outpatient subspecialty services available to these primary care
patients are: Gastroenterology, Neurology, Ophthalmology, Orthopedics, Podiatry,
Rheumatology, Surgery (General), and Urology. Enrolled adults are assigned to one of
three VFC Irma Colen Health Center primary care physicians (PCPs) who are
responsible for managing their patients’ health care needs. If an enrolled patient needs
to be hospitalized, UCLA hospitalists will manage the inpatient care and
communicate/coordinate the patient’s transition to the outpatient setting with the
appropriate VFC Irma Colen Health Center PCP.
Program Impact
Provided uninsured adult patients at the Colen Health Center in Mar Vista with
more rapid and geographically convenient access to specialty clinics at UCLA at
no cost. As a result of this program, the patient wait time for a specialty care visit
was reduced. Typically, specialty care appointments may take months and over
a year if accessed through the Los Angeles County system.
Since 2010, 484 patients were registered and 367 referrals completed. From
2013 there have been 3 new patients registered and 7 referrals. This program
has been put on hold with the expansion of Medi-Cal.
Priority Health Need: Health Promotion and Disease Prevention Goal: Improve community health through health promotion and preventive practices. Tobacco Free Campus Initiative
The “Tobacco-Free Campus” Action Research Team (ART) is a student-led research
project formed to raise awareness and analyze UCLA’s tobacco-free policy. The overall
objective of the team’s research was to analyze the change in tobacco use before and
after the implementation of the ban.
Resnick Neuropsychiatric Hospital at UCLA Page 78
Program Impact
Increased overall awareness of tobacco ban on campus.
Compiled a film that featured hundreds of pictures of UCLA students and faculty
promoting the upcoming policy change.
Created a project website and Facebook page to inform students, other colleges,
and the general public about our work.
Attended several Earth Day events with visual and educational displays,
including informational posters that highlighted key statistics regarding the
environmental consequences of tobacco production and disposal.
“Great Butt Hunt” – ART + 15 student volunteers, walked throughout UCLA’s
campus and picked up nearly 10,000 cigarette butts
General research findings
Decreased cigarette litter: Cigarette Litter Counts were conducted bi-weekly for eight
weeks. There were decreased amounts of cigarette litter collected after the ban was
implemented. Overall decrease in median cigarette butt counts at five of seven
monitored sites, and an overall decrease in median cigarette butt counts across the
combined site counts. Across all sites, 595.5 cigarette butts formed the median before
the ban, with a standard deviation of 148.8, while post-ban analysis shows a 159.5
cigarette butt median and a 32.89 standard deviation. Using median values, the
amount of cigarette litter throughout all of our samples sites decreased by 73.2%.
UCLA Fit for Healthy Weight Clinic
UCLA Fit for Healthy Weight Clinic sees children who are overweight or obese (BMI
percentile over 85%) and who have not been able to lower their BMI with help from their
primary care provider. The UCLA Fit for Healthy Weight Clinic is staffed by a
multidisciplinary team, composed of a pediatrician specializing in nutrition, a
psychologist, and a dietician. Patients and their families enjoy the benefit of seeing all
three providers at every appointment. After an initial evaluation, a treatment plan is
made with appropriate phone and/or clinic follow up. Pediatric subspecialists and a
weight-loss surgeon are also available as needed. The UCLA Fit for Healthy Weight
Clinic is piloting a program with satellite clinics from Venice Family Clinic (Simms Mann
Telemedicine Fit Clinic) and Los Angeles Unified School District (LAUSD) to offer
consultation with the Fit for Healthy Weight Clinic using telemedicine technology. The
program also has an in-person clinic at UCLA.
Program Impact From July 1, 2014 through June 30, 2015, a retrospective chart review of 18
unduplicated patients receiving care through the telemedicine clinics at Los Angeles
Unified School District and Venice Family Clinic showed positive clinical outcomes, with
94% of patients stabilizing or decreasing weight within 6 months, and 40% of patients
Resnick Neuropsychiatric Hospital at UCLA Page 79
with blood pressures in the pre-hypertensive or hypertensive range at baseline having
normal blood pressure at follow-up.
Sound Body Sound Mind UCLA Health Sound Body Sound Mind was founded in 1999 to address the growing
obesity epidemic among Los Angeles adolescents by promoting healthy lifestyle
choices and the self-confidence needed to sustain them. To this end, we provide state-
of-the-art fitness centers to middle and high schools in LAUSD along with an innovative
physical education program designed to help students develop confidence and
competence in a variety of physical activities.
The ultimate goal of UCLA Health Sound Body Sound Mind is to ensure that every
student has the opportunity, knowledge and appropriate tools to pursue a healthy
lifestyle through physical fitness. The equipment in our workout facilities is varied and
plentiful enough to be accessible to all students and to keep large classes engaged.
Each new fitness center includes a selection of commercial-grade cardiovascular
equipment (ellipticals, hybrid cycles, spin bikes and arm cycles), strength training
equipment (weights and strength machines), and mobile equipment such as jump ropes
and agility ladders. Ultimately, UCLA Health Sound Body Sound Mind hopes to
empower students to maintain a lifetime of healthy habits through exercise and fitness.
The program has over 100 fitness centers serving over 100,000 students every year.
Over 85% of our partner schools are located in low-income communities, where
students have limited access to safe fitness resources.
Program Impact
FITNESSGRAM tests assess student fitness levels in the following areas: flexibility,
aerobic capacity, body composition, muscular strength and endurance. Six tests are
administered to students in order to make the aforementioned assessments, including:
BMI, sit and reach (stretching test), trunk lift (stretching test), pacer (running test), push-
ups and sit-ups. A comparative analysis of pre and post FITNESSGRAM scores is
completed to evaluate the impact of UCLA Health Sound Body Sound Mind
programming and curriculum on overall student health at each school where our
program is implemented.
UCLA Health Sound Body Sound Mind requires the physical education staff at each
school where our program is implemented to administer a survey to students before and
after program implementation. These surveys measure student attitudes toward
exercise, body image and fitness knowledge. As with the FITNESSGRAM data, UCLA
Health Sound Body Sound Mind performs an analysis of pre- and post-survey results to
identify changes in student perceptions toward fitness and exercise.
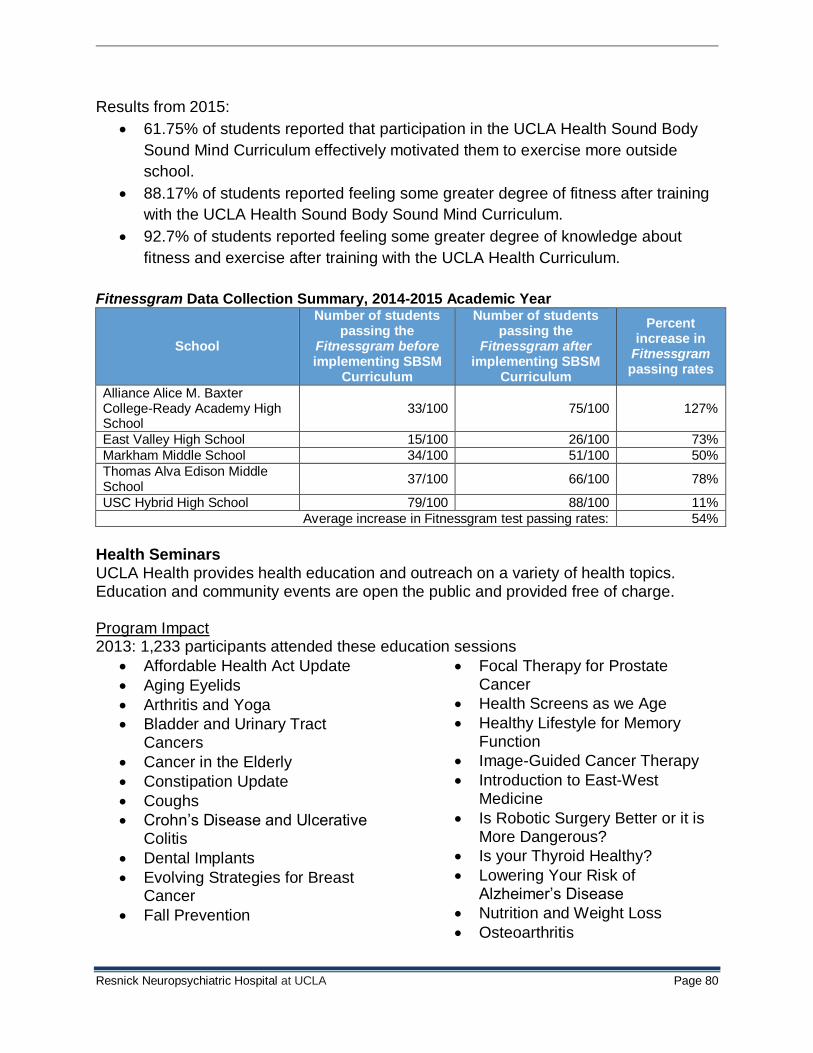
Resnick Neuropsychiatric Hospital at UCLA Page 80
Results from 2015:
61.75% of students reported that participation in the UCLA Health Sound Body
Sound Mind Curriculum effectively motivated them to exercise more outside
school.
88.17% of students reported feeling some greater degree of fitness after training
with the UCLA Health Sound Body Sound Mind Curriculum.
92.7% of students reported feeling some greater degree of knowledge about
fitness and exercise after training with the UCLA Health Curriculum.
Fitnessgram Data Collection Summary, 2014-2015 Academic Year
School
Number of students passing the
Fitnessgram before implementing SBSM
Curriculum
Number of students passing the
Fitnessgram after implementing SBSM
Curriculum
Percent increase in
Fitnessgram passing rates
Alliance Alice M. Baxter College-Ready Academy High School
33/100 75/100 127%
East Valley High School 15/100 26/100 73%
Markham Middle School 34/100 51/100 50%
Thomas Alva Edison Middle School
37/100 66/100 78%
USC Hybrid High School 79/100 88/100 11%
Average increase in Fitnessgram test passing rates: 54%
Health Seminars UCLA Health provides health education and outreach on a variety of health topics. Education and community events are open the public and provided free of charge. Program Impact 2013: 1,233 participants attended these education sessions
Affordable Health Act Update
Aging Eyelids
Arthritis and Yoga
Bladder and Urinary Tract Cancers
Cancer in the Elderly
Constipation Update
Coughs
Crohn’s Disease and Ulcerative Colitis
Dental Implants
Evolving Strategies for Breast Cancer
Fall Prevention
Focal Therapy for Prostate Cancer
Health Screens as we Age
Healthy Lifestyle for Memory Function
Image-Guided Cancer Therapy
Introduction to East-West Medicine
Is Robotic Surgery Better or it is More Dangerous?
Is your Thyroid Healthy?
Lowering Your Risk of Alzheimer’s Disease
Nutrition and Weight Loss
Osteoarthritis
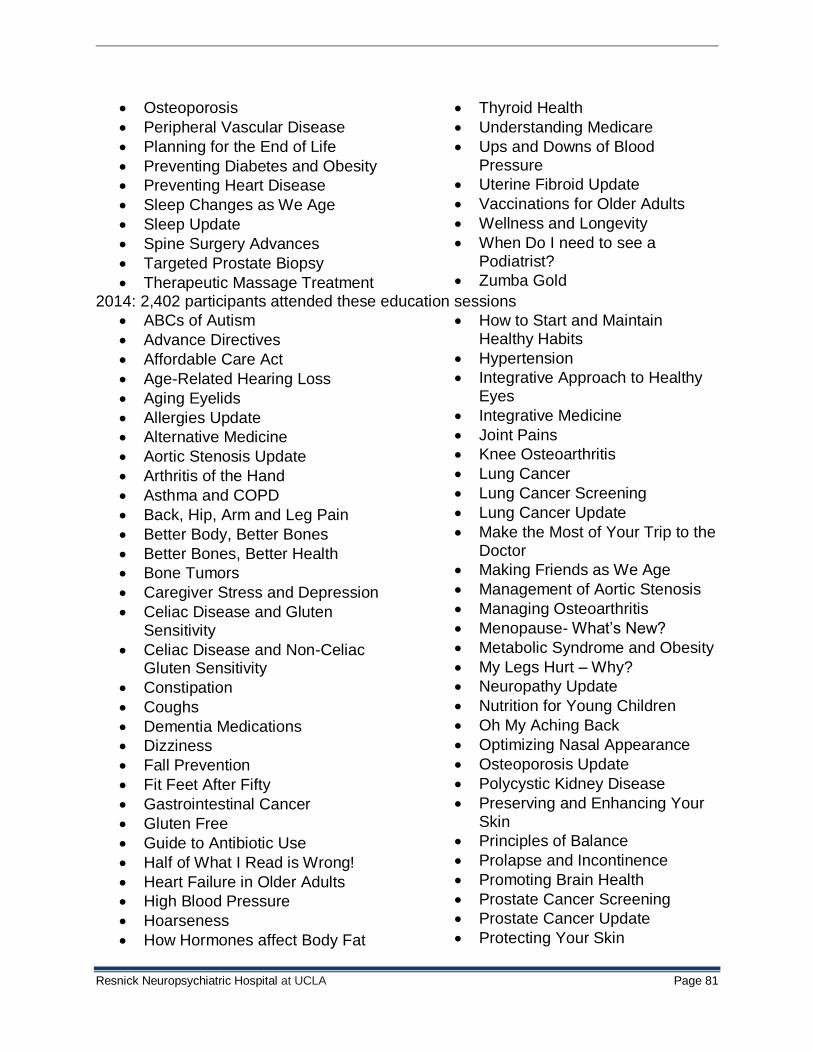
Resnick Neuropsychiatric Hospital at UCLA Page 81
Osteoporosis
Peripheral Vascular Disease
Planning for the End of Life
Preventing Diabetes and Obesity
Preventing Heart Disease
Sleep Changes as We Age
Sleep Update
Spine Surgery Advances
Targeted Prostate Biopsy
Therapeutic Massage Treatment
Thyroid Health
Understanding Medicare
Ups and Downs of Blood Pressure
Uterine Fibroid Update
Vaccinations for Older Adults
Wellness and Longevity
When Do I need to see a Podiatrist?
Zumba Gold
2014: 2,402 participants attended these education sessions
ABCs of Autism
Advance Directives
Affordable Care Act
Age-Related Hearing Loss
Aging Eyelids
Allergies Update
Alternative Medicine
Aortic Stenosis Update
Arthritis of the Hand
Asthma and COPD
Back, Hip, Arm and Leg Pain
Better Body, Better Bones
Better Bones, Better Health
Bone Tumors
Caregiver Stress and Depression
Celiac Disease and Gluten Sensitivity
Celiac Disease and Non-Celiac Gluten Sensitivity
Constipation
Coughs
Dementia Medications
Dizziness
Fall Prevention
Fit Feet After Fifty
Gastrointestinal Cancer
Gluten Free
Guide to Antibiotic Use
Half of What I Read is Wrong!
Heart Failure in Older Adults
High Blood Pressure
Hoarseness
How Hormones affect Body Fat
How to Start and Maintain Healthy Habits
Hypertension
Integrative Approach to Healthy Eyes
Integrative Medicine
Joint Pains
Knee Osteoarthritis
Lung Cancer
Lung Cancer Screening
Lung Cancer Update
Make the Most of Your Trip to the Doctor
Making Friends as We Age
Management of Aortic Stenosis
Managing Osteoarthritis
Menopause- What’s New?
Metabolic Syndrome and Obesity
My Legs Hurt – Why?
Neuropathy Update
Nutrition for Young Children
Oh My Aching Back
Optimizing Nasal Appearance
Osteoporosis Update
Polycystic Kidney Disease
Preserving and Enhancing Your Skin
Principles of Balance
Prolapse and Incontinence
Promoting Brain Health
Prostate Cancer Screening
Prostate Cancer Update
Protecting Your Skin
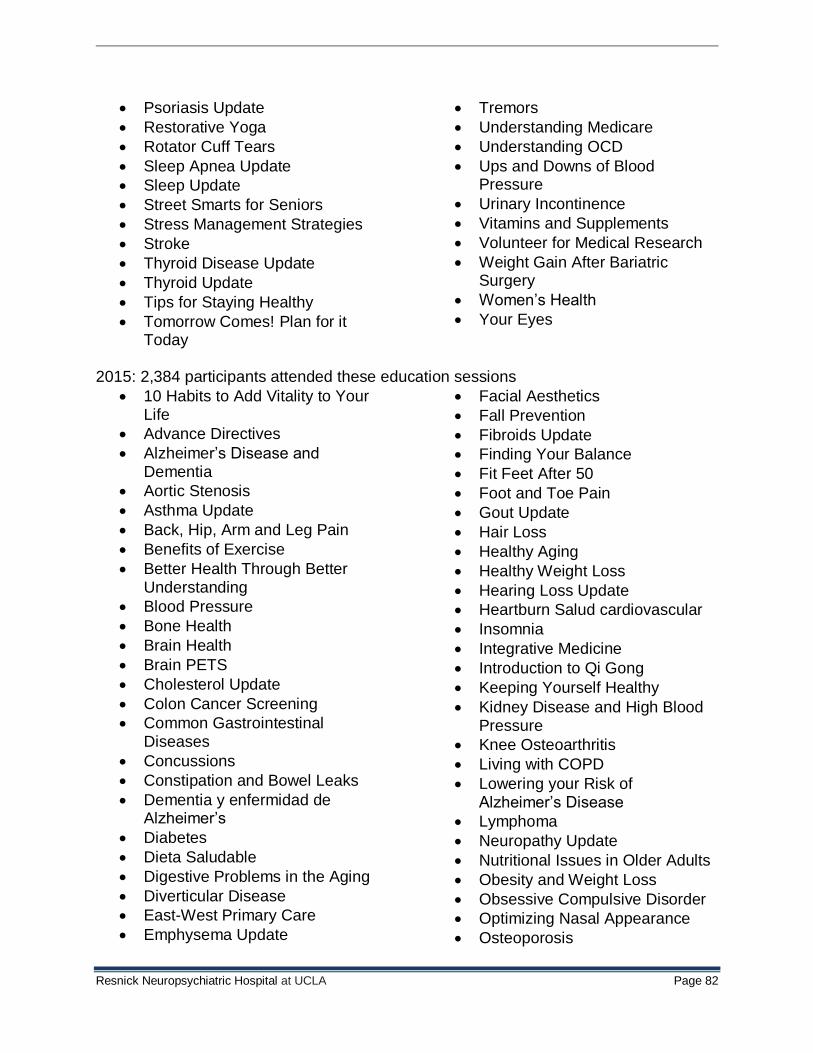
Resnick Neuropsychiatric Hospital at UCLA Page 82
Psoriasis Update
Restorative Yoga
Rotator Cuff Tears
Sleep Apnea Update
Sleep Update
Street Smarts for Seniors
Stress Management Strategies
Stroke
Thyroid Disease Update
Thyroid Update
Tips for Staying Healthy
Tomorrow Comes! Plan for it Today
Tremors
Understanding Medicare
Understanding OCD
Ups and Downs of Blood Pressure
Urinary Incontinence
Vitamins and Supplements
Volunteer for Medical Research
Weight Gain After Bariatric Surgery
Women’s Health
Your Eyes
2015: 2,384 participants attended these education sessions
10 Habits to Add Vitality to Your Life
Advance Directives
Alzheimer’s Disease and Dementia
Aortic Stenosis
Asthma Update
Back, Hip, Arm and Leg Pain
Benefits of Exercise
Better Health Through Better Understanding
Blood Pressure
Bone Health
Brain Health
Brain PETS
Cholesterol Update
Colon Cancer Screening
Common Gastrointestinal Diseases
Concussions
Constipation and Bowel Leaks
Dementia y enfermidad de Alzheimer’s
Diabetes
Dieta Saludable
Digestive Problems in the Aging
Diverticular Disease
East-West Primary Care
Emphysema Update
Facial Aesthetics
Fall Prevention
Fibroids Update
Finding Your Balance
Fit Feet After 50
Foot and Toe Pain
Gout Update
Hair Loss
Healthy Aging
Healthy Weight Loss
Hearing Loss Update
Heartburn Salud cardiovascular
Insomnia
Integrative Medicine
Introduction to Qi Gong
Keeping Yourself Healthy
Kidney Disease and High Blood Pressure
Knee Osteoarthritis
Living with COPD
Lowering your Risk of Alzheimer’s Disease
Lymphoma
Neuropathy Update
Nutritional Issues in Older Adults
Obesity and Weight Loss
Obsessive Compulsive Disorder
Optimizing Nasal Appearance
Osteoporosis
Resnick Neuropsychiatric Hospital at UCLA Page 83
Planning for the End of Life
Posture and Ergonomics
Prevent and Detect Skin Cancer
Reducing Risk of Cancer
Resilience
Riding the Cancer Wave
Role of Stress in Cancer Therapy
Rotator Cuff Tears
Testosterone Replacement Therapy
Understanding Medicare
Understanding OCD
Ups and Downs of Blood Pressure
Vaccine Recommendations
Virtual Colonoscopy
Vitamins/Minerals
What You Need to Know before going to ER
Your Eyes
Community Events/Health Fairs UCLA Health provides health education, outreach and screenings in the community. 2013: Over 3,750 participants at health and wellness fairs, health lectures and conferences. Screenings were provided for: varicose veins, blood pressure, flexibility/posture, and fall prevention. 2014: Over 7,900 participants at health and wellness fairs, health lectures and conferences. Screenings were provided for: nutrition, blood pressure, fall prevention, and varicose veins. 2015: Over 4,625 participants at health and wellness fairs, health lectures and conferences. Screenings were provided for: varicose veins, posture, blood pressure, and fall prevention. Annual Community Flu Shot Clinics
Flu shots were given to seniors at UCLA Urgent Care sites and at CVS Minute Clinics. The following number of flu shots was given to adults 50 years old and over. 2013 – 200 flu shots 2014 – 142 flu shots 2015 – 229 flu shots Priority Health Need: Management of Chronic Conditions Goal: Reduce impact of chronic conditions on health and increase focus on prevention, treatment and support. Simms/Mann – UCLA Center for Integrative Oncology Part of the Jonsson Comprehensive Cancer Center at UCLA, the Simms/Mann Center
is a special place designed to help patients and their families face the challenges
brought about by cancer and its treatments. The majority of Center programs, including
support groups and psychosocial care, are offered to individuals free of charge.
Program Impact
Insights Into Cancer is a monthly lecture series on a variety of cancer topics.
Resnick Neuropsychiatric Hospital at UCLA Page 84
2013: 1,020 persons attended the education sessions. 2014: 1,014 persons attended the education sessions. 2015: 297 persons attended the education sessions. Support Groups provide both educational, healing and support opportunities. The groups held at the Simms/Mann Center are:
Acupressure
Breast cancer support
Circle of Reflection
Caregivers support group
Grief Work
Healing through art
Partners of women with cancer
Li Bailey Living Beyond Limits
Look Good, Feel Better
Looking ahead
Meditation: Inner healing
Mindfulness meditation
Qigong
Young adult cancer support The support group participants evaluated the groups on a scale of 0 to 10 at a 9.8, where 0 is not beneficial and 10 is extremely beneficial. UCLA Breathmobile
The UCLA Breathmobile is the traveling doctor's office of Mattel Children's Hospital
UCLA. The Breathmobile van travels to inner-city schools and provides medical care to
children that cannot otherwise afford it. The UCLA Breathmobile provides:
Physical exam and consultation with a Pediatric Allergist
Spirometry
Pulse oximetry
Vital signs
Allergy skin testing
Education to parents and patients on the proper use of medicines, metered dose
inhalers, spacing devices, nebulizer treatments, and education on environmental
control measures
Program Impact
The UCLA Breathmobile provided care to 422 pediatric patients across 844 visits during
the time period September 1, 2013 to December 31, 2014. Additionally, the
Breathmobile participated in several health fairs including the 2013 Health Fair
Extravaganza, the 4th Annual Operation Backpack and the 2013 Northeast Los Angeles
Resnick Neuropsychiatric Hospital at UCLA Page 85
Health and Community Fair. At the Health Fairs, asthma and allergy screenings were
conducted on attendees and education and referrals were provided.
From October 1, 2013 to September 30, 2014, the UCLA Breathmobile provided
services at 20 schools in Long Beach in zones 1a, 2a, and 3a. Visits were made to the
schools at least 3 days per week. Visits to each school site occurred every 6-8 weeks or
sooner depending on need. Special visits were made for school fairs, health fairs,
nurse meetings and administrative meetings/school outreach. The regular visits to the
schools included registration of patients and assessment of eligibility to qualify for health
care programs such as Healthy Families and Medi-Cal. Efforts were made to enroll
families in these programs where applicable. Intake by the Nurse included assessment
of vital signs, height, weight, spirometry, evaluation of environmental risk factors, and
knowledge of their treatment plan (for return patients only). A detailed evaluation by a
physician and development of a respiratory health management plan was made.
Following the visit with the physician, all patients received education by a registered
nurse about their respiratory condition, medications, asthma action plan and a follow up
appointment was made if indicated. Additionally, the Breathmobile participated in
several Community Health Fairs where asthma and allergy screenings were conducted
on attendees and education and referrals were provided.
The UCLA Long Beach Breathmobile program provided care to 422 pediatric patients
across 844 visits to schools in zones 1a, 2a and 3a at the pre-selected sites during the
time period: September 1, 2013 to December 31, 2014. Patients were predominately
Hispanic (53%) or African-American (35%) and 57% were male. A total of 350 (83%)
diagnosed with asthma had the following baseline severity: 33% intermittent, 42% mild,
19% moderate and 6% severe. In children who returned for follow-up care, 78.5%
achieved well controlled asthma by their third visit to the program. Children who visited
the Breathmobile program for at least six months showed a significant reduction in ED
(Emergency Department) visits and hospitalizations. In 98% of follow-up visits, patients
reported no ED visits or hospitalizations during the interval preceding the visit. In the
year preceding treatment on the Breathmobile, a total of 121 ED visits for asthma
occurred compared to only 17 ED visits for children engaged in the Breathmobile
program for at least six months. In the year preceding treatment on the Breathmobile, a
total of 10 hospitalizations occurred compared to only 1 hospitalization for children
following engagement in the program for at least six months.
Children who participated in the Breathmobile program showed significant reduction in
school absenteeism due to asthma. A total of 59.4% of children missed school due to
asthma in the year preceding treatment on the Breathmobile compared to only 26.2 %
of children in the year following treatment on the Breathmobile. 6.8% of children missed
greater than 10 days of school due to asthma symptoms pre-treatment year compared
Resnick Neuropsychiatric Hospital at UCLA Page 86
to only 1.7 % following treatment on the Breathmobile. 19.5% of children engaged in
the Breathmobile program missed 5-10 days of school due to asthma in the pre-year
compared to only 2.5% in children engaged in the Breathmobile program during the
post year of treatment. 33.1% of children missed 1-4 days of school due to asthma in
the preceding year compared to only 22% in the post year of treatment on the
Breathmobile. Though we did not track missed work days, one can estimate that there
were significant decreases in parents’ missed work days due to their child’s asthma
following treatment on the Breathmobile with numbers that would correlate with missed
school days.
In May 2014, a cost analysis of Breathmobile operations was conducted. The estimates
from the analysis showed that the UCLA Breathmobile was saving local Long Beach
hospitals between $12,000 and $27,000 per school year in prevented emergency
department visits. The overall return on investment in the 2012‐2013 school‐year was
$4.69 per dollar invested.
UCLA Diabetes Program
UCLA offers diabetes self-management education (DSME), one-on-one counseling, free
talks in the community, and participation in health fairs.
Program Impact Insulin Connection (IConnect) support groups are free for people with Type 1 diabetes
offered every other month in Westwood and in the Conejo Valley (Thousand Oaks).
Monthly, 4-12 persons attend the support groups.
Annual Diabetes Patient Conference: Healthy Living With Diabetes
A half-day free patient conference with lectures, breakout sessions and foot screenings
was provided for people with Type 1 and Type 2 diabetes. Over 130 people attended in
2015 and 2016.
UCLA Fit for Healthy Weight Clinic
See impact information under Health Promotion and Disease Prevention Priority Health Need: Mental Health Disorders and Substance Abuse and Addiction
Goal: Increase access to mental health care and substance abuse services and resources. The UCLA Hospital System consists of three licensed hospitals: Ronald Reagan UCLA
Medical Center, Resnick Neuropsychiatric Hospital at UCLA, and UCLA Medical Center,
Santa Monica. Resnick Neuropsychiatric Hospital at UCLA is the psychiatric teaching
Resnick Neuropsychiatric Hospital at UCLA Page 87
facility of the David Geffen School of Medicine (DGSOM) and is located on the fourth
floor of Ronald Reagan UCLA Medical Center.
As part of the UCLA Health System, Ronald Reagan UCLA Medical Center and UCLA
Medical Center, Santa Monica collaborate with Resnick Neuropsychiatric Hospital at
UCLA and its psychiatric medical staff to address the mental health disorders and
substance abuse and addiction issues in the community.
Didi Hirsch Crisis Follow-Up Service and Suicide Prevention
The Didi Hirsch Crisis follow-up service and suicide prevention at UCLA enrolls patients
discharged from the hospital or the UCLA ER who are in crisis and need follow up
services. This includes phone calls and outreach from Didi Hirsch’s suicide prevention
team to assist in making appointments, generate safety plans, and re-assessing self-
injury.
Program Impact This program has been successful in creating a linkage between UCLA and a community center to provide important after care and safety planning for patients at risk for suicide. January – December
2013 January – December
2014 January-March 2015
Clients referred for follow-up
24 40 18
Number of clients contacted
10 24 15
Percentage of Clients Contacted (out of total referred)
42% 60% 83%
Percentage of Clients Given Referrals (out of total contacted)
60% 38% 38%
Number of contacts initiated
Data not available 207 110
Total Contacts Made Data not available 54 38
Mental Health Referrals
Data not available 8 15
Other Services Referrals
Data not available 4 0
Student Health Insurance Plan Behavioral Health Services
The Student Health Insurance Plan (SHIP) Behavioral Health Services aims to provide
high level behavioral health services to the student population at UCLA, allowing them
to remain in school through graduation. This program provides dedicated access for
students, addresses acute mental health disorders, and provides substance abuse and
dual diagnosis services to UCLA students, both undergraduates and graduates, under
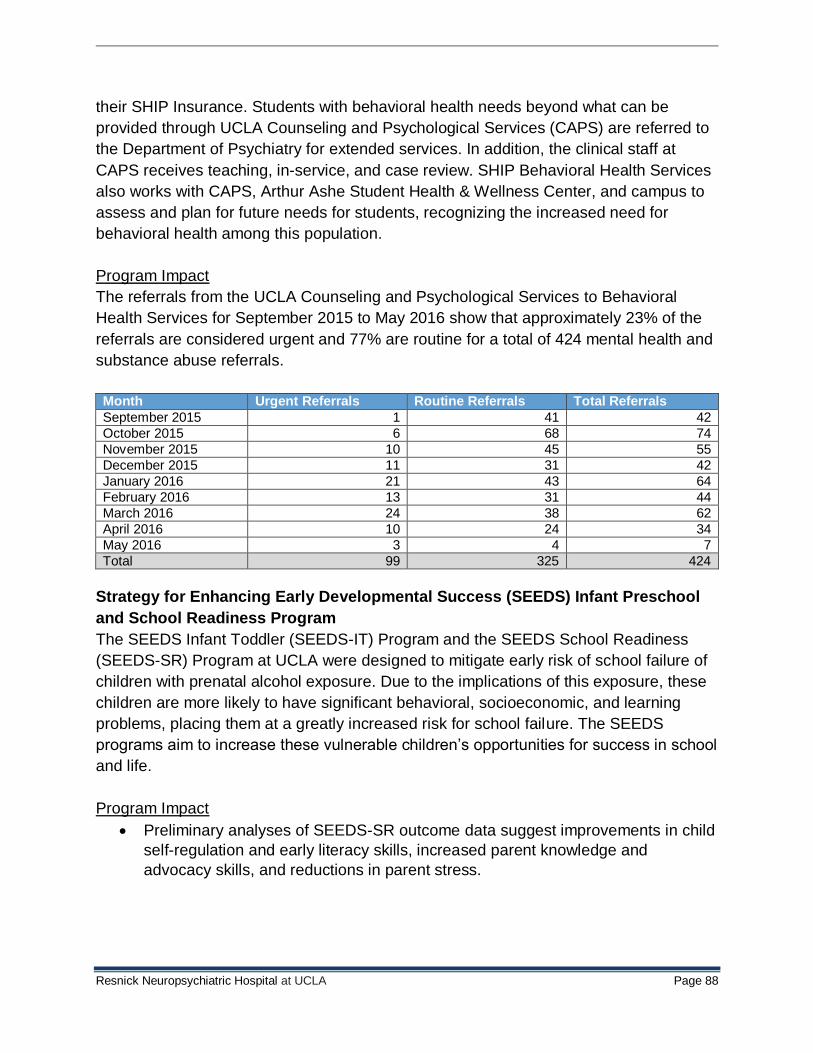
Resnick Neuropsychiatric Hospital at UCLA Page 88
their SHIP Insurance. Students with behavioral health needs beyond what can be
provided through UCLA Counseling and Psychological Services (CAPS) are referred to
the Department of Psychiatry for extended services. In addition, the clinical staff at
CAPS receives teaching, in-service, and case review. SHIP Behavioral Health Services
also works with CAPS, Arthur Ashe Student Health & Wellness Center, and campus to
assess and plan for future needs for students, recognizing the increased need for
behavioral health among this population.
Program Impact
The referrals from the UCLA Counseling and Psychological Services to Behavioral
Health Services for September 2015 to May 2016 show that approximately 23% of the
referrals are considered urgent and 77% are routine for a total of 424 mental health and
substance abuse referrals.
Month Urgent Referrals Routine Referrals Total Referrals
September 2015 1 41 42
October 2015 6 68 74
November 2015 10 45 55
December 2015 11 31 42
January 2016 21 43 64
February 2016 13 31 44
March 2016 24 38 62
April 2016 10 24 34
May 2016 3 4 7
Total 99 325 424
Strategy for Enhancing Early Developmental Success (SEEDS) Infant Preschool
and School Readiness Program
The SEEDS Infant Toddler (SEEDS-IT) Program and the SEEDS School Readiness
(SEEDS-SR) Program at UCLA were designed to mitigate early risk of school failure of
children with prenatal alcohol exposure. Due to the implications of this exposure, these
children are more likely to have significant behavioral, socioeconomic, and learning
problems, placing them at a greatly increased risk for school failure. The SEEDS
programs aim to increase these vulnerable children’s opportunities for success in school
and life.
Program Impact
Preliminary analyses of SEEDS-SR outcome data suggest improvements in child
self-regulation and early literacy skills, increased parent knowledge and
advocacy skills, and reductions in parent stress.
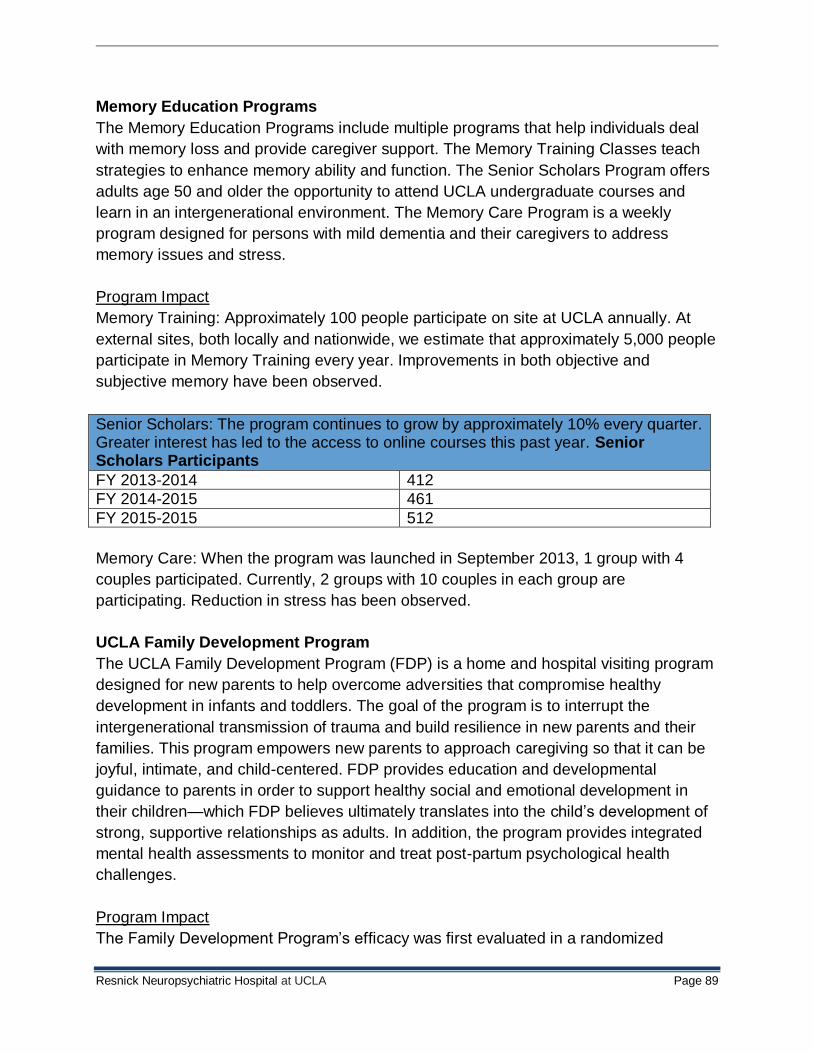
Resnick Neuropsychiatric Hospital at UCLA Page 89
Memory Education Programs
The Memory Education Programs include multiple programs that help individuals deal
with memory loss and provide caregiver support. The Memory Training Classes teach
strategies to enhance memory ability and function. The Senior Scholars Program offers
adults age 50 and older the opportunity to attend UCLA undergraduate courses and
learn in an intergenerational environment. The Memory Care Program is a weekly
program designed for persons with mild dementia and their caregivers to address
memory issues and stress.
Program Impact
Memory Training: Approximately 100 people participate on site at UCLA annually. At
external sites, both locally and nationwide, we estimate that approximately 5,000 people
participate in Memory Training every year. Improvements in both objective and
subjective memory have been observed.
Senior Scholars: The program continues to grow by approximately 10% every quarter. Greater interest has led to the access to online courses this past year. Senior Scholars Participants
FY 2013-2014 412
FY 2014-2015 461
FY 2015-2015 512
Memory Care: When the program was launched in September 2013, 1 group with 4
couples participated. Currently, 2 groups with 10 couples in each group are
participating. Reduction in stress has been observed.
UCLA Family Development Program
The UCLA Family Development Program (FDP) is a home and hospital visiting program
designed for new parents to help overcome adversities that compromise healthy
development in infants and toddlers. The goal of the program is to interrupt the
intergenerational transmission of trauma and build resilience in new parents and their
families. This program empowers new parents to approach caregiving so that it can be
joyful, intimate, and child-centered. FDP provides education and developmental
guidance to parents in order to support healthy social and emotional development in
their children—which FDP believes ultimately translates into the child’s development of
strong, supportive relationships as adults. In addition, the program provides integrated
mental health assessments to monitor and treat post-partum psychological health
challenges.
Program Impact
The Family Development Program’s efficacy was first evaluated in a randomized
Resnick Neuropsychiatric Hospital at UCLA Page 90
controlled trial funded by the National Institutes of Mental Health. Based on
assessments taken at 12 and 24 months, the families who participated in FDP, in
comparison to the control families, experienced:
Greater feelings of support from their partner and family member(s)
Increased maternal responsiveness to the child
Improvements in the child’s sense of security
Enhanced maternal encouragement of the child’s independence
Positive development of the child’s “separate self”
After 24 months, the mothers who participated in FDP intervention also demonstrated:
Greater ability to verbally set limits
Their children were more likely to respond positively to those boundaries
Mobile Health for Mental Health/ Salud Móvil para Salud Mental
Mobile Health for Mental Health (MH2) is a web/mobile application to optimize early
stimulant medication treatment for children with ADHD by improving communication
among the parent, teacher, and prescriber. Parents and teachers input symptoms and
medication side-effect ratings, and the information is aggregated into a web interface
accessible to providers during clinic appointments.
Salud Móvil para Salud Mental (SM2) is the Spanish adaptation, which allows limited
English proficiency (LEP) parents to fill out daily ratings in their native language.
Pilot-testing of both versions is underway at:
Augustus Hawkins— a community mental health clinic that services
predominantly low-income children and families in South Central Los Angeles
Child & Family Guidance Center—a mental health clinic in Northridge that serves
predominantly Hispanic families.
Program Impact
Nine English-speaking parents and one Spanish-speaking parent have piloted the
MH2/SM2 web app. Preliminary qualitative linguistic analysis of video recorded data
show that parents and providers use the tool to varying degrees, with some providers
integrating it into the clinic appointments and others engaging less with the tool.
The following are positive impacts on communication during the clinical visit:
A visual aid to teach parents about how stimulant medication works
A starting point for eliciting detailed narratives about specific problem incidents
that occurred between visits
Resnick Neuropsychiatric Hospital at UCLA Page 91
An aid for explaining providers’ medication recommendations so parents can
better understand the reasons for the provider’s medication decisions.
An aid in achieving patient-centered care and promoting parent agency, by
linking provider medication decisions to recorded observations by parents
In one case, the MH2 app also had a positive impact on the child himself: the child felt
more comfortable taking the new medication because he knew that the provider would
have a record of all his side-effects and of whether or not the medication was working.
Community Partners in Care
The Community Partners in Care (CPIC) compared a Community Engagement and
Planning (CEP) model to a Resources for Services (RS) model in a rigorous
randomized trial involving over 1,000 depressed clients drawn from 93 health care and
community-based programs. The clients were primarily African American and Latino,
the majority met federal poverty criteria and had multiple chronic medical conditions,
nearly half were uninsured and at high risk for being homeless, and many had
substance abuse problems.
The key feature of a CEP approach is community engagement, with equal power
sharing and authority in the planning process, to develop an evidence-based toolkit for
depression. The planning is followed by training as directed and supervised by the
community planning group, comprising strong community leaders and clinical experts.
RS is a model focused primarily on health care sectors alone, using the same evidence-
based toolkits to improve depression services and outcomes. The implementation is
based on a technical assistance model.
Program Impact
The 6-month client outcomes show that community engagement compared to technical
assistance:
Improved mental health-related quality of life and physical activity
Lowered the chances of being either currently homeless or having multiple risks
for homelessness
Lowered rate of hospitalization for a behavioral health condition
Shifted outpatient services from specialty medication visits toward primary care,
faith-based, and park depression services
The 12-month client outcomes show that community engagement compared to
technical assistance:
Improved mental health-related quality of life

Resnick Neuropsychiatric Hospital at UCLA Page 92
Lowered rate of hospitalization for a behavioral health condition compared to the
baseline rate
Implications: The community engagement model activated the community to provide
more complete support for health and social recovery—people were stabilized and
received more support where they were already receiving other services in the
community.
EXPORT/STRIVE (Support to Reunite, Involve, and Value Each Other)
The EXPORT/STRIVE randomized control trial project examines the efficacy of a 5
session family-based intervention to improve the reentry of formerly incarcerated
delinquent youth by reducing substance abuse, other HIV risk behaviors and psychiatric
disorders, and improving family functioning. EXPORT/STRIVE has been in the field
since October 2014, and has since recruited in different community locations, with an
emphasis on the juvenile delinquency courts. Given the high prevalence of the Latino
families in the juvenile justice system, the intervention is delivered in both English and
Spanish.
Program Impact
Over 700 youth—parent/guardian dyads have been approached to participate in
the project.
Based on current experience, being able to deliver the assessment in Spanish is
key to meeting the needs of the population and enrollment goals for the study.
Recruitment, assessment, and intervention delivery are ongoing. Follow up
assessments (3, 6, and 12 months) are being completed and 92 families are
enrolled, with a total of 182 participants (92 youth and 92 parents/guardians).
Baseline data are currently being analyzed and several professional posters and
manuscripts are in preparation.
The work of EXPORT/STRIVE has also been disseminated to communities of
interest, which enhance public understanding about evidence-based family
interventions for youth involved in the juvenile justice system.
The following presentations were also delivered during 2015-2016:
Conference Presentations
American Psychological Association Poster Presentation: Ayala Lopez, S., Mizel,
M., Bath, E., Amani, B., Comulada, S., & Norweeta Milburn. (August, 2015).
Emotional regulation, conduct problems and resilience among newly homeless
youth with PTSD.
Outreach to Stakeholder Groups and Community based Organizations
Outreach Health Fair with Aztec Rising May 2015
Resnick Neuropsychiatric Hospital at UCLA Page 93
Outreach Meetings with Los Angeles County Department of Mental Health, and
Probation, Juvenile Delinquency Court System (Quarterly)
Outreach Presentations with Community based organization, Soledad
Enrichment for Action (Quarterly)
UCLA Master of Social Work Leadership Fair (Biannual)
University-Based Outreach and Education Seminars
Charles R. Drew University of Medicine and Science: Weekly seminar on issues
of health disparities and social justice at. The name of the seminar series is
“Conversations on Health and Politics.” The seminar explores a wide variety of
health topics that impact communities of color such as community mental health,
reproductive health, gentrification, and incarceration.
UCLA Family Stress, Trauma and Resilience (STAR) Seminar. Working with
ethnically diverse at-risk adolescents: Lessons, Recommendations and
Surprises. March, 2016.
B-Resilient: Addressing disparities in mental health through community-
partnered app development
B-Resilient is a text-messaging intervention co-developed by academic and community
partners that supports self-management of depressive symptoms and personal
resiliency and addresses disparities in mental health.
Program Impact
In 2015, a pretest of the tool was conducted with 30 community members who used it
for 30 days and held a workgroup to collect initial feedback. Experiences were generally
positive from all attendees and users felt it was easy to use ("I am not technically savvy.
And [the app] was simplistic...I didn't have to think about it, how to figure stuff out”).
None of the participants opted out of receiving text messages. Users expressed a
desire for expanded content including additional guidance to perform cognitive
restructuring techniques and additional support services available within the community.
We also evaluated the Participatory Technology process through qualitative interviews
and a survey of community-based participatory engagement23 that was adapted by the
workgroup. There were three overall qualitative themes from the partners’ experiences:
(1) The Chorus platform reduced the barriers to entry for creating apps collaboratively;
(2) The Participatory Technology method enabled community-centered content
generation;
(3) The project stimulated partners’ thinking and motivation to participate in future app
development including expanding the initial app, leading to this grant application (“This
project has given me the idea that there are other ways that you can create things,
using the technology, to change things and to make quality of life better for people”).
Resnick Neuropsychiatric Hospital at UCLA Page 94
The partners also confirmed the participatory nature of the project and supported
proceeding with further B-RESILIENT development and pilot testing.
Health Neighborhoods Initiative
The Health Neighborhoods Initiative (HNI) is a Los Angeles County wide project that
aims to improve the health and wellness of our communities by joining together the
support of the Department of Mental Health, the Department of Public Health, the
Department of Health Services, LA Care, and other health and mental health providers,
public health and substance abuse treatment providers, along with a variety of social
service and community support agencies. Thus far, the HNI has focused on
coordination of care between mental health, health, and substance abuse services to
improve access to care. In addition, HNI will include supporting clients in such social
services as housing, employment coaching, tutoring to complete a GED, and partnering
with non-traditional and trusted members of a community to support the health and
mental health of individuals in their community, provide preventative programs, and
facilitate early detection and referral to treatment for behavioral health concerns.
Program Impact
Phase I of the HNI led to development of agreements to share and coordinate
services across 15-20 programs within 8 pilot neighborhoods
Phase II includes a call for proposals for multiple-year contracts for community
agencies to address mental health and social risk factors and structural
determinants including violence/trauma and housing/homelessness
With the conglomeration of DMH, DPH and DHS still being negotiated in Los Angeles
County the trajectory of the Health Neighborhoods Initiative and other community
engaged initiatives will continue to be articulated in new ways.
MyCoachConnect
MyCoachConnect (MCC) is a novel telephone-based engagement and assessment
technique for patients with severe mental illness. MCC has completed an initial pilot
implementation between August 2015 and February 2016 of 40 participants located at
ROADS Community Care Clinic in Compton, CA. ROADS enrolls patients with severe
mental illness such as schizophrenia, bipolar disorder, and major depression who also
are dually-eligible for Medicare and Medi-Cal. Patients call the automated telephone
number approximately twice a week for four months and answer open-ended questions
about their health status. These answers are transcribed and then made available to
their providers to integrate into their care planning and assessment. In addition, the
voice responses are analyzed to identify novel predictors of clinical outcome in this
Resnick Neuropsychiatric Hospital at UCLA Page 95
population (for example, being able to detect if a patient is not well while at home, in
between office visits).
Program Impact
This project is currently in the evaluation phase of the pilot stage. It was successfully
implemented with 40 participants and their providers in a community care setting of a
vulnerable and high-risk population with severe mental illness. Patients found the
MyCoachConnect system:
Acceptable, and through feedback and workgroup sessions, they found the
system to be very helpful in their lives
Helped address loneliness and made participants feel more positive about their
lives
Helped patients plan more for their week and address personal goals related to
their care
Preliminary results of speech samples from participants suggest that the samples can
be predictive of individual clinical outcomes. These results can be very impactful for
community health needs – increasing access to supportive interventions using
telephone/automated based technologies, increasing scalability of remote assessment
of clinical status and outcomes tracking using this automated system, and focus on
prevention of symptoms and outcomes such as acute care utilization through predictive
analytic approaches utilized around speech responses.
Los Angeles County Department of Mental Health Joint Mental Health Joint
Mental Health Operations
Through an affiliation agreement with the Los Angeles County Department of Mental
Health (LACODMH), UCLA provides academic services, training and GME services,
and other academic training service to support and/or develop training of public mental
health staff that is related to key LACODMH priorities. These priorities include jail
diversion, transition age youth, homelessness, and Integrated Substance Abuse
Program services for co-occurring mental health and substance use disorders.
Program Impact
45 persons have been trained in the past three years through this program. They
trained at the Edelman Mental Health Clinic, Augustus F. Hawkins Mental Health Clinic,
and the GENESIS program for seniors.
UCLA Center for Child Anxiety Resilience Education and Support
The UCLA Center for Child Anxiety Resilience Education and Support (CARES) aims to
reduce the burden of childhood anxiety and enhance family and community resilience,
through education/prevention, training, innovation, research, and enhanced public
education and advocacy. CARES was involved in the implementation of classroom-
Resnick Neuropsychiatric Hospital at UCLA Page 96
based programs designed to foster self-awareness, focus and resiliency, and overall
wellbeing. In addition, CARES created community-based parenting workshops and
teacher/staff workshops to help manage child anxiety.
Program Impact
Two pilot programs were offered in one elementary school and two high schools; over
550 students were trained in skills-building techniques for emotion regulation.
In the high school FOCUS programs, students were taught resilience through the skills
of emotion regulation, communication, problem-solving, goal setting, and managing
stress reminders. The team found that after group completion, students had
significantly improved overall internal resilience scores, as well as significantly improved
scores on subscales of problem-solving and empathy. Findings from focus groups
illustrated that the groups helped build connections between students, as well as
between students and teachers. The groups also helped destigmatize mental health
issues in the school environment.
In the elementary school Calm Classroom program, students and staff practiced
mindfulness-based brief exercises two to three times daily every day. Students under
the age of 8 (in pre-K through 2nd grade; n=207) reported that Calm Classroom made
them feel “very happy,” “happy,” or “neutral/calm.” Young students were able to identify
parts of their bodies affected by the exercises.
Students 8 and over (in 3rd through 5th grade; n=196) initially reported equally positive
and negative impressions of the exercise. Approximately half of older students felt that
the techniques helped them regulate their emotions, while half did not. Teachers and
staff (n=72) reported feeling that the program was relaxing/calming, easy to do, gave
classes an opportunity to slow down/refocus, and that it helps students focus. Staff also
reported that the majority of students enjoyed doing the techniques. The vast majority of
staff believed that students could use the techniques to regulate their emotions.
Behavioral Health Associates
Behavioral Health Associates (BHA) was established in November 2012 as an
evidence-based, all-payer collaborative care program within UCLA Health dedicated to
effectively delivering population-based services across a broad geographic area. BHA
provides short-term (up to 15 weeks) behavioral health treatment to children and adults,
including cognitive behavioral and/or supportive therapy or medication consultation by a
psychiatrist. Upon completion, stable patients transition back to primary care provider
care for ongoing medication management. Patients with longer-term treatment needs
are referred for additional behavioral health services. The co-location of behavioral
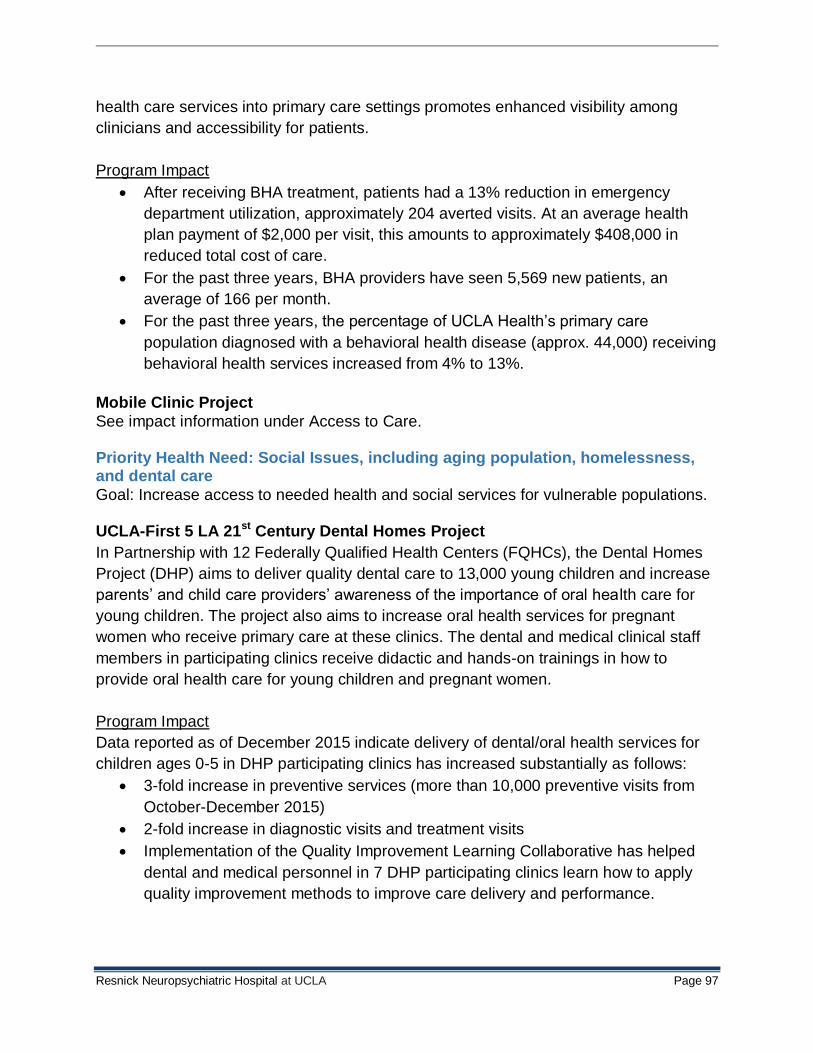
Resnick Neuropsychiatric Hospital at UCLA Page 97
health care services into primary care settings promotes enhanced visibility among
clinicians and accessibility for patients.
Program Impact
After receiving BHA treatment, patients had a 13% reduction in emergency
department utilization, approximately 204 averted visits. At an average health
plan payment of $2,000 per visit, this amounts to approximately $408,000 in
reduced total cost of care.
For the past three years, BHA providers have seen 5,569 new patients, an
average of 166 per month.
For the past three years, the percentage of UCLA Health’s primary care
population diagnosed with a behavioral health disease (approx. 44,000) receiving
behavioral health services increased from 4% to 13%.
Mobile Clinic Project
See impact information under Access to Care. Priority Health Need: Social Issues, including aging population, homelessness, and dental care
Goal: Increase access to needed health and social services for vulnerable populations. UCLA-First 5 LA 21st Century Dental Homes Project
In Partnership with 12 Federally Qualified Health Centers (FQHCs), the Dental Homes
Project (DHP) aims to deliver quality dental care to 13,000 young children and increase
parents’ and child care providers’ awareness of the importance of oral health care for
young children. The project also aims to increase oral health services for pregnant
women who receive primary care at these clinics. The dental and medical clinical staff
members in participating clinics receive didactic and hands-on trainings in how to
provide oral health care for young children and pregnant women.
Program Impact
Data reported as of December 2015 indicate delivery of dental/oral health services for
children ages 0-5 in DHP participating clinics has increased substantially as follows:
3-fold increase in preventive services (more than 10,000 preventive visits from
October-December 2015)
2-fold increase in diagnostic visits and treatment visits
Implementation of the Quality Improvement Learning Collaborative has helped
dental and medical personnel in 7 DHP participating clinics learn how to apply
quality improvement methods to improve care delivery and performance.
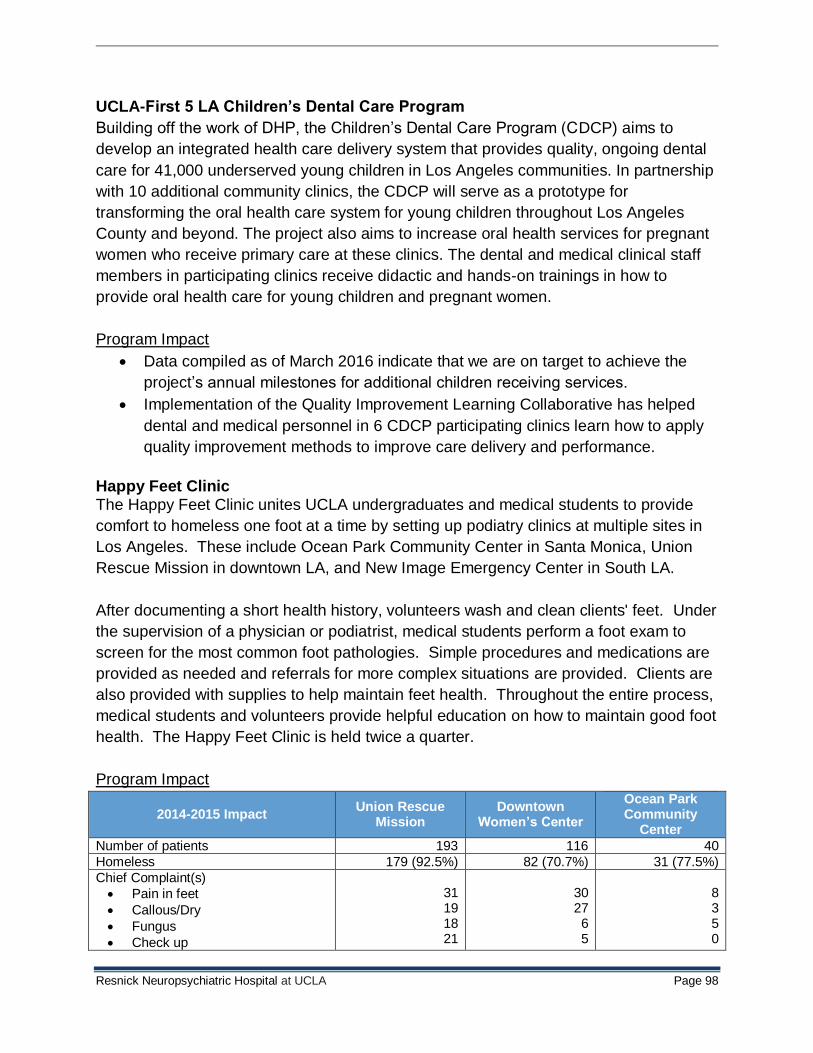
Resnick Neuropsychiatric Hospital at UCLA Page 98
UCLA-First 5 LA Children’s Dental Care Program
Building off the work of DHP, the Children’s Dental Care Program (CDCP) aims to
develop an integrated health care delivery system that provides quality, ongoing dental
care for 41,000 underserved young children in Los Angeles communities. In partnership
with 10 additional community clinics, the CDCP will serve as a prototype for
transforming the oral health care system for young children throughout Los Angeles
County and beyond. The project also aims to increase oral health services for pregnant
women who receive primary care at these clinics. The dental and medical clinical staff
members in participating clinics receive didactic and hands-on trainings in how to
provide oral health care for young children and pregnant women.
Program Impact
Data compiled as of March 2016 indicate that we are on target to achieve the
project’s annual milestones for additional children receiving services.
Implementation of the Quality Improvement Learning Collaborative has helped
dental and medical personnel in 6 CDCP participating clinics learn how to apply
quality improvement methods to improve care delivery and performance.
Happy Feet Clinic The Happy Feet Clinic unites UCLA undergraduates and medical students to provide
comfort to homeless one foot at a time by setting up podiatry clinics at multiple sites in
Los Angeles. These include Ocean Park Community Center in Santa Monica, Union
Rescue Mission in downtown LA, and New Image Emergency Center in South LA.
After documenting a short health history, volunteers wash and clean clients' feet. Under
the supervision of a physician or podiatrist, medical students perform a foot exam to
screen for the most common foot pathologies. Simple procedures and medications are
provided as needed and referrals for more complex situations are provided. Clients are
also provided with supplies to help maintain feet health. Throughout the entire process,
medical students and volunteers provide helpful education on how to maintain good foot
health. The Happy Feet Clinic is held twice a quarter.
Program Impact
2014-2015 Impact Union Rescue
Mission Downtown
Women’s Center
Ocean Park Community
Center
Number of patients 193 116 40
Homeless 179 (92.5%) 82 (70.7%) 31 (77.5%)
Chief Complaint(s)
Pain in feet
Callous/Dry
Fungus
Check up
31 19 18 21
30 27 6 5
8 3 5 0
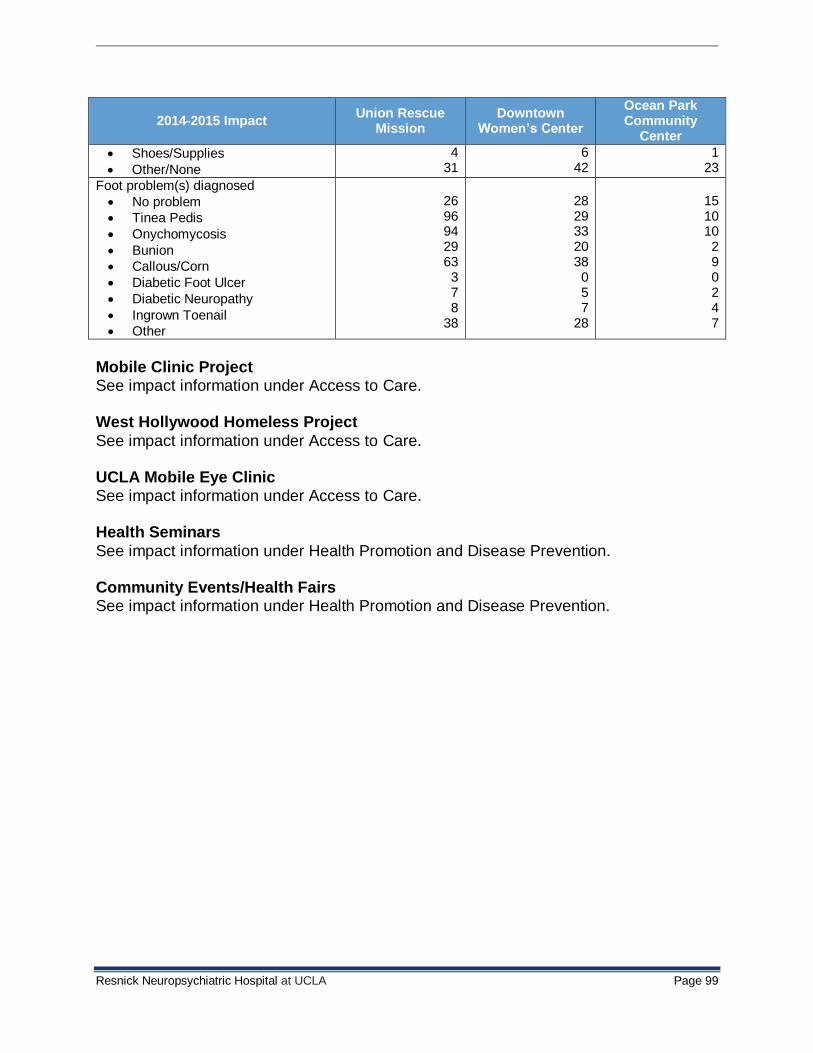
Resnick Neuropsychiatric Hospital at UCLA Page 99
2014-2015 Impact Union Rescue
Mission Downtown
Women’s Center
Ocean Park Community
Center
Shoes/Supplies
Other/None
4 31
6 42
1 23
Foot problem(s) diagnosed
No problem
Tinea Pedis
Onychomycosis
Bunion
Callous/Corn
Diabetic Foot Ulcer
Diabetic Neuropathy
Ingrown Toenail
Other
26 96 94 29 63 3 7 8
38
28 29 33 20 38 0 5 7
28
15 10
10 2 9 0 2
4 7
Mobile Clinic Project See impact information under Access to Care. West Hollywood Homeless Project
See impact information under Access to Care. UCLA Mobile Eye Clinic See impact information under Access to Care. Health Seminars
See impact information under Health Promotion and Disease Prevention. Community Events/Health Fairs See impact information under Health Promotion and Disease Prevention.


![[David Halliday, Resnick, Robert Resnick] Fisica -(BookFi.org)](https://img.pdfslide.net/doc/110x75/55cf9af8550346d033a43b9e/david-halliday-resnick-robert-resnick-fisica-bookfiorg.jpg)