Embed Size (px)
Citation preview
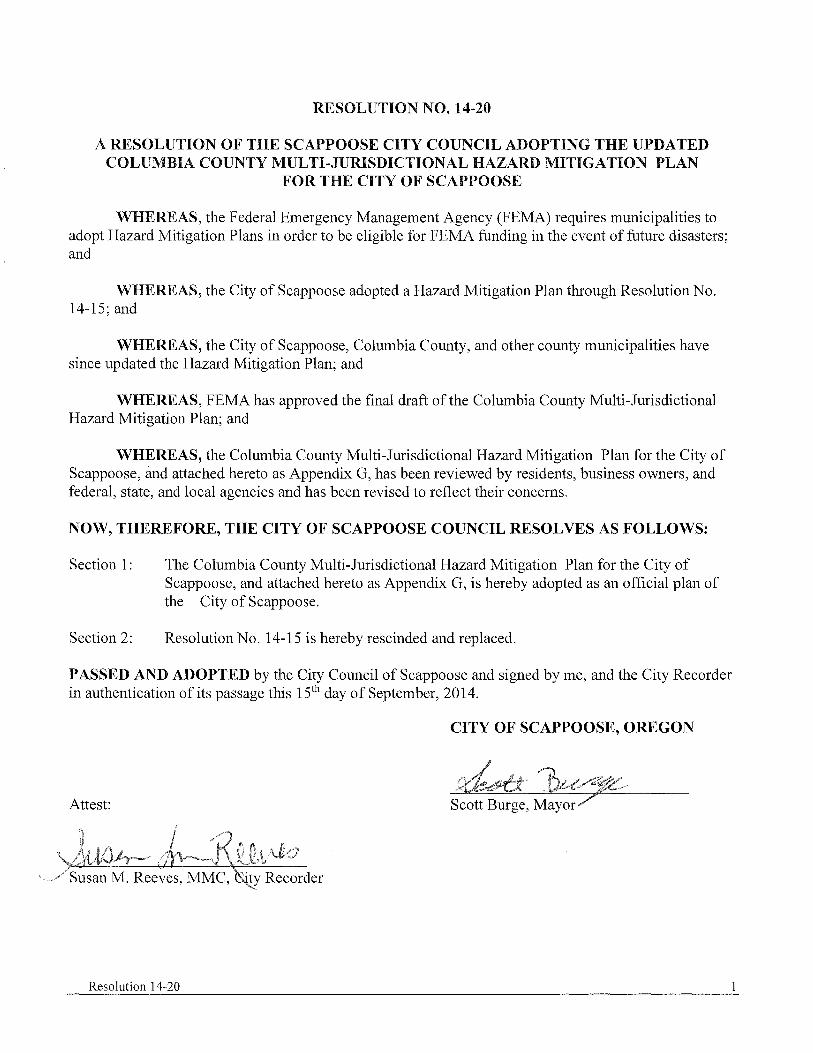
RESOLUTION NO. 14-20
A RESOLUTION OF THE SCAPPOOSE CITY COUNCIL ADOPTING THE UPDATED COLUMBIA COUNTY MULTI-JURISDICTIONAL HAZARD MITIGATION PLAN
FOR THE CITY OF SCAPPOOSE
WHEREAS, the Federal Emergency Management Agency (FEMA) requires municipalities to adopt Hazard Mitigation Plans in order to be eligible for FEMA funding in the event of future disasters; and
WHEREAS, the City of Scappoose adopted a Hazard Mitigation Plan through Resolution No. 14-15; and
WHEREAS, the City of Scappoose, Columbia County, and other county municipalities have since updated the Hazard Mitigation Plan; and
WHEREAS, FEMA has approved the final draft of the Columbia County Multi-Jurisdictional Hazard Mitigation Plan; and
WHEREAS, the Columbia County Multi-Jurisdictional Hazard Mitigation Plan for the City of Scappoose, and attached hereto as Appendix G, has been reviewed by residents, business owners, and federal, state, and local agencies and has been revised to reflect their concerns,
NOW, THEREFORE, THE CITY OF SCAPPOOSE COUNCIL RESOLVES AS FOLLOWS:
Section 1;
Section 2:
The Columbia County Multi-Jurisdictional Hazard Mitigation Plan for the City of Scappoose, and attached hereto as Appendix G, is hereby adopted as an official plan of the City of Scappoose.
Resolution No. 14-15 is hereby rescinded and replaced.
PASSED AND ADOPTED by the City Council of Scappoose and signed by me, and the City Recorder in authentication of its passage this 15th day of September, 2014.
CITY OF SCAPPOOSE, OREGON
Attest:
Resolution 14-20
2014
__________________________
Columbia County
Multi-Jurisdiction Hazard Mitigation Plan
Including the Cities:
Clatskanie
Columbia City
Prescott
Rainier
St. Helens
Scappoose
Vernonia
Columbia County Department of Emergency Management
TABLE OF CONTENTS
Columbia County Multi-Jurisdictional Hazard Mitigation Plan – May 2014 Draft i
1. INTRODUCTION .............................................................................................................. 1-1
1.1 Hazard Mitigation Planning ..................................................................... 1-1 1.2 Planning Requirements ............................................................................ 1-1
1.2.1 Local Mitigation Plans ................................................................. 1-1 1.3 Grant Programs Requiring Hazard Mitigation Plans ............................... 1-2
1.3.1 Disaster Funded Mitigation Assistance ....................................... 1-2 1.3.2 Hazard Mitigation Assistance Programs ...................................... 1-2
1.4 Multi-Jurisdictional Hazard Mitigation Plan Description ....................... 1-3
2. PREREQUISITES ............................................................................................................ 2-1
2.1 Adoption by Local Governing Bodies and Supporting
Documentation ......................................................................................... 2-1
3. COMMUNITY DESCRIPTION .......................................................................................... 3-1
3.1 Location, Geography, and History ........................................................... 3-1 3.2 Demographics .......................................................................................... 3-1
3.2.1 Columbia County ......................................................................... 3-1 3.2.2 City of Clatskanie ........................................................................ 3-2 3.2.3 Columbia City .............................................................................. 3-2
3.2.4 City of Prescott ............................................................................ 3-3
3.2.5 City of Rainier.............................................................................. 3-3 3.2.6 City of St. Helens ......................................................................... 3-3 3.2.7 City of Scappoose ........................................................................ 3-3
3.2.8 City of Vernonia .......................................................................... 3-4
3.3 Development ............................................................................................ 3-4
4. PLANNING PROCESS .................................................................................................... 4-1
4.1 Overview of Planning Process ................................................................. 4-2 4.1.1 Initial Planning Processes, 1998-2005 ......................................... 4-2 4.1.2 2009 Plan Update ......................................................................... 4-2
4.1.3 2014 Hazard Mitigation Plan Update .......................................... 4-3 4.2 Hazard Mitigation Steering committees .................................................. 4-4
4.2.1 Formation of the Committees ...................................................... 4-4 4.2.2 Planning Team Meetings and Tasks ............................................ 4-6
4.3 Public Involvement .................................................................................. 4-7 4.3.1 Project Introduction ..................................................................... 4-7 4.3.2 Public planning efforts ................................................................. 4-7
4.4 Incorporation of Existing Plans and Other Relevant Information ........... 4-8
5. HAZARD PROFILES ....................................................................................................... 5-1
TABLE OF CONTENTS
Columbia County Multi-Jurisdictional Hazard Mitigation Plan – May 2014 Draft ii
5.1 Overview of a Hazard Analysis ............................................................... 5-1 5.2 Hazard Identification and Screening ........................................................ 5-1 5.3 Hazard Profile .......................................................................................... 5-5
5.3.1 Flood ............................................................................................ 5-5
5.3.2 Winter Storm .............................................................................. 5-11 5.3.3 Landslide .................................................................................... 5-14 5.3.4 Wildfires .................................................................................... 5-17 5.3.5 Earthquake ................................................................................. 5-23 5.3.6 Volcano ...................................................................................... 5-26
5.3.7 Wind ........................................................................................... 5-29 5.3.8 Erosion ....................................................................................... 5-31 5.3.9 El Niño/Southern Oscillation ..................................................... 5-35
5.3.10 Expansive Soils .......................................................................... 5-37 5.3.11 Drought ...................................................................................... 5-39 5.3.12 Dam/Levee Failure..................................................................... 5-41
5.3.13 Disruption of Utility and Transportation Systems ..................... 5-44 5.3.14 Hazardous Materials .................................................................. 5-49
5.3.15 Terrorism.................................................................................... 5-56 5.3.16 Infectious Disease Epidemic ...................................................... 5-58
6. VULNERABILITY ANALYSIS .......................................................................................... 6-1
6.1 Overview of Vulnerability Analysis ........................................................ 6-1 6.2 Vulnerability Analysis: Specific Steps .................................................... 6-2
6.2.1 Asset Inventory ............................................................................ 6-2
6.2.2 Methodology ................................................................................ 6-5
6.2.3 Data Limitations........................................................................... 6-6 6.2.4 Exposure Analysis ....................................................................... 6-6
6.2.5 Areas of Future Development ...................................................... 6-6
7. MITIGATION STRATEGY ................................................................................................ 7-1
7.1 Developing Mitigation Goals ................................................................... 7-1 7.2 Identifying Mitigation Actions ................................................................ 7-2 7.3 Evaluating and Prioritizing Mitigation Actions ....................................... 7-4 7.4 Implementing a Mitigation Action Plan .................................................. 7-5
8. PLAN MAINTENANCE .................................................................................................... 8-1
8.1 Monitoring, Evaluating, and Updating the MHMP ................................. 8-1 8.2 Implementation Through Existing Planning Mechanisms ....................... 8-3
8.3 Continued Public Involvement ................................................................ 8-4
TABLE OF CONTENTS
Columbia County Multi-Jurisdictional Hazard Mitigation Plan – May 2014 Draft iii
List of Appendices
Appendix A Columbia County
Appendix B City of Clatskanie
Appendix C Columbia City
Appendix D City of Prescott
Appendix E City of Rainier
Appendix F City of St. Helens
Appendix G City of Scappoose
Appendix H City of Vernonia
Appendix I Hazard Maps
Appendix J Annual Review Worksheet
Appendix K Adoption Resolutions
TABLE OF CONTENTS
Columbia County Multi-Jurisdictional Hazard Mitigation Plan – May 2014 Draft iv
List of Tables
Table 4-1 Steering Committees
Table 4-2 Public Involvement Mechanisms
Table 5-1 Identification and Screening of Hazards
Table 5-2 Hazards by Jurisdiction
Table 5-3 Columbia County Hazard Analysis Matrix
Table 5-4 Winter Storms Events, 2000 – 2007
Table 5-5 Historic Fires in Oregon (1848-2008)
Table 5-6 Recent Large Fires in Columbia County and Vicinity
Table 5-7 Areas of Special Concern for Wildland/Urban Interface Fires
Table 5-8 Effects of Intensity and Magnitude Ratings
Table 5-9 Magnitude 4.0 or Greater Earthquakes, 1949 - 2006
Table 5-10 Windstorm Events, 1950 – 2008
Table 5-11 Historic Erosion Hazard Areas within Columbia County
Table 5-12 Expansive Soil Criteria Based on Shrink-Swell Potential
Table 5-13 National Inventory of Dams Listed Dams in Columbia County
Table 5-14 Countywide Infrastructure Affected by Utility and Transportation System
Disruptions
Table 5-15 National Response Center “Incidents” 1997 – 2007, Columbia County Oregon
Table 5-16 Extremely Hazardous Substances Listed Sites, Columbia County
Table 5-17 Columbia County Hazardous Materials Locations.
Table 5-18 Geographic Distribution of EHS Sites in Columbia County
Table 5-19 Hazardous Materials Incidents in 2000-2007, Reported Categories of Hazardous
Materials
Table 5-20 2002-2006 Oregon Disease Outbreaks
Table 6-1 Summary of NFIP Date - Columbia County
Table 7-1 Mitigation Goals
Table 7-2 Evaluation Criteria for Mitigation Actions
TABLE OF CONTENTS
Columbia County Multi-Jurisdictional Hazard Mitigation Plan – May 2014 Draft v
List of Acronyms and Abbreviations
ALF Animal Liberation Front
BPA Bonneville Power Administration
CCEM Columbia County Emergency Management
CCEPA Columbia County Emergency Planning Association
CDBG Community Development Block Grant
CDC United States Center for Disease Control
CEPA Citizen’s Emergency Preparedness Association
CFR Code of Federal Regulations
CR2K State Fire Marshall’s Community Right to Know
CRS Community Rating System
DHS United States Department of Homeland Security
DMA 2000 Disaster Mitigation Act of 2000
DOGAMI Oregon Department of Geology and Mineral Industries
DOT U.S. Department of Transportation
EHS Extremely Hazardous Substance
EIR Environmental Impact Report
ELF Earth Liberation Front
ENSO El Niño/Southern Oscillation
EPA U.S. Environmental Protection Agency
EPCRA Emergency Planning and Community Right to Know Act of 1986
FEMA Federal Emergency Management Agency
FIRM Flood Insurance Rate Map
FMA Flood Mitigation Assistance
FY Fiscal Year
GIS Geographic Information System
HMA Hazard Mitigation Assistance
HMGP Hazard Mitigation Grant Program
HS Hazardous Substance
HSIS Hazardous Substance Information System
MHMP Multi-Jurisdictional Hazard Mitigation Plan
MM Modified Mercalli
mph Miles per Hour
NID National Inventory of Dams
NFIA National Flood Insurance Act
NFIP National Flood Insurance Program
TABLE OF CONTENTS
Columbia County Multi-Jurisdictional Hazard Mitigation Plan – May 2014 Draft vi
List of Acronyms and Abbreviations (continued)
NFPA National Fire Protection Association
NGO Nongovernmental Organizations
NGVD National Geodetic Vertical Datum
ODF Oregon Department of Forestry
ODOT Oregon Department of Transportation
OSFM Oregon State Fire Marshall
PDM Pre-Disaster Mitigation
PGA Peak Ground Acceleration
RFC Repetitive Flood Claims
RL Repetitive Loss
SFHA Special Flood Hazard Area
SRL Severe Repetitive Loss
Stafford Act Robert T. Stafford Disaster Relief and Emergency Assistance Act
STAPLEE Social, Technical, Administrative, Political, Legal, Economic, and Environmental
USC United States Code
US Census United States Census Bureau
USGS United States Geological Survey
WUI Wildland-Urban Interface
INTRODUCTION
Columbia County Multi-Jurisdictional Hazard Mitigation Plan – May 2014 Draft 1-1
1. INTRODUCTION
This section provides a brief introduction to hazard mitigation planning, local mitigation plan
requirements, the grants associated with these requirements, and a description of this Multi-
Jurisdictional Hazard Mitigation Plan (MHMP).
1.1 HAZARD MITIGATION PLANNING
Hazard mitigation, as defined in Title 44 of the Code of Federal Regulations (CFR), Part 201.2,
is “any action taken to reduce or eliminate the long-term risk to human life and property from
natural hazards.” Many areas have expanded this definition to include human-caused hazards.
As such, hazard mitigation is any work done to minimize the impacts of any type of hazard event
before it occurs. It aims to reduce losses from future disasters. Hazard mitigation is a process in
which hazards are identified and profiled, people and facilities at risk are analyzed, and
mitigation actions are developed. The implementation of the mitigation actions, which include
long-term strategies that may include planning, policy changes, programs, projects, and other
activities, is the result of this process.
1.2 PLANNING REQUIREMENTS
1.2.1 Local Mitigation Plans
Local hazard mitigation planning is driven by a Federal law. On October 30, 2000, Congress
passed the Disaster Mitigation Act of 2000 (DMA 2000) (P.L. 106-390) which amended the
Robert T. Stafford Disaster Relief and Emergency Assistance Act (Stafford Act) (Title 42 of the
United States Code [USC] 5121 et seq.) by repealing the act’s previous mitigation planning
section (409) and replacing it with a new mitigation planning section (322). This new section
emphasized the need for State, Tribal, and local entities to closely coordinate mitigation planning
and implementation efforts. In addition, it provided the legal basis for the Federal Emergency
Management Agency’s (FEMA) mitigation plan requirements for mitigation grant assistance.
To implement these planning requirements, FEMA published an Interim Final Rule in the
Federal Register on February 26, 2002 (FEMA 2002a), 44 CFR Part 201 with subsequent
updates. The planning requirements for local entities are described in detail in Section 2
and are identified in their appropriate sections throughout this MHMP.
FEMA’s October 31, 2007 changes to 44 CFR Part 201 combined and expanded flood mitigation
planning requirements with local mitigation plans (44 CFR §201.6). All hazard mitigation
assistance program planning requirements for HMGP, PDM, FMA, SRL and potentially RFC
programs were combined eliminating duplicated mitigation plan requirements. It also required
participating NFIP communities’ risk assessments and mitigation strategies to identify and
address repetitively flood-damaged properties.
INTRODUCTION
Columbia County Multi-Jurisdictional Hazard Mitigation Plan – May 2014 Draft 1-2
Under the new 2008 44 CFR update, requirements have changed governing mitigation planning
requirements for local mitigation plans published under 44 CFR §201.6. Local mitigation plans
now qualify communities for the following federal mitigation grant programs:
Disaster Funded Grants:
Hazard Mitigation Grant Program (HMGP)
Hazard Mitigation Assistance Grants:
Pre-Disaster Mitigation (PDM)
Flood Mitigation Assistance (FMA)
1.3 GRANT PROGRAMS REQUIRING HAZARD MITIGATION PLANS
All five FEMA grant programs provide funding to States, Tribes, and local entities that have a
FEMA-approved State or Local Mitigation Plan. Two of the grants are authorized under the
Stafford Act and DMA 2000, while the remaining three are authorized under the National Flood
Insurance Act and the Bunning-Bereuter-Blumenauer Flood Insurance Reform Act. As of June
19, 2008, the grant programs were segregated. The HMGP is a state competitive grant program,
which is directly disaster funded. Whereas the other programs: PDM, and FMA, although
competitive, rely on specific pre-disaster grant funding sources, sharing several common
elements.
1.3.1 Disaster Funded Mitigation Assistance
Hazard Mitigation Grant Program: is authorized by Section 404 of the Robert T. Stafford
Disaster Relief and Emergency Assistance Act, as amended (the Stafford Act), Title 42, United
States Code (U.S.C.) 5170c. The key purpose of HMGP is to ensure that the opportunity to take
critical mitigation measures to reduce the risk of loss of life and property from future disasters is
not lost during the reconstruction process following a disaster. HMGP is available, when
authorized under a Presidential major disaster declaration, in the areas of the State requested by
the Governor. The amount of HMGP funding available to the Applicant is based upon the
estimated total Federal assistance to be provided by FEMA for disaster recovery under the
Presidential major disaster declaration.
1.3.2 Hazard Mitigation Assistance Programs
Pre-Disaster Mitigation Program: program is authorized by Section 203 of the Stafford Act, 42
U.S.C. 5133. The PDM program is designed to assist States, Territories, Indian Tribal
governments, and local communities to implement a sustained pre-disaster natural hazard
mitigation program to reduce overall risk to the population and structures from future hazard
events, while also reducing reliance on Federal funding from future disasters.
Flood Mitigation Assistance Grant Program: is authorized by Section 1366 of the National
Flood Insurance Act of 1968, as amended (NFIA), 42 U.S.C. 4104c, with the goal of reducing or
eliminating claims under the National Flood Insurance Program (NFIP). Particular emphasis for
this program is placed on mitigating repetitive loss (RL) properties (Repetitive loss properties: A
INTRODUCTION
Columbia County Multi-Jurisdictional Hazard Mitigation Plan – May 2014 Draft 1-3
property for which two or more NFIP losses of at least $1,000 each have been paid within any
10 year period since 1978). The primary source of funding for this program is the National
Flood Insurance Fund. Grant funding is available for three types of grants, including Planning,
Project, and Technical Assistance. Project grants, which use the majority of the program’s total
funding, are awarded to States, Tribes, and local entities to apply mitigation measures to reduce
flood losses to properties insured under the NFIP.
1.4 MULTI-JURISDICTIONAL HAZARD MITIGATION PLAN DESCRIPTION
The remainder of this MHMP consists of the following sections and appendices:
Prerequisites - This section addresses the prerequisites of plan adoption, which include adoption
by the governing body of each participating jurisdiction, including Columbia County and the
cities of Clatskanie, Columbia City, Prescott, Rainier, St. Helens, Scappoose, and Vernonia.
Adoption resolutions for each jurisdiction are included in Appendix K.
Community Description - This section provides a general history and background of the
communities and unincorporated areas of Columbia County, including historical trends for
population and the demographic and economic conditions that have shaped the area.
Planning Process - This section describes the planning process and identifies the Steering
Committee members, the meetings held as part of the planning process, and the key stakeholders
within the county and surrounding region. In addition, this section documents public outreach
activities and the review and incorporation of relevant plans, reports, and other appropriate
information.
Hazard Analysis - This section describes the process through which the Steering Committees
identified, screened, and selected the 16 hazards to be profiled in this version of the MHMP. The
hazard analysis includes the nature, history, location, extent, and probability of future events for
each hazard. In addition, historical and location hazard figures are included in Appendix I.
Vulnerability Analysis - This section identifies potentially vulnerable assets—people,
residential and nonresidential buildings dwelling units, RL properties, critical facilities, and
critical infrastructure—in the incorporated cities and unincorporated areas of the county. These
data were compiled by assessing the potential impacts from each hazard using Geographic
Information System (GIS) and community provided information. The resulting information
identifies the full range of hazards that the incorporated cities and unincorporated areas of the
county could face and potential impacts, damages, and (where data was available) economic
losses.
Mitigation Strategy - The mitigation strategy provides a plan for reducing the potential losses
identified in the vulnerability analysis. The Steering Committees developed a list of mitigation
goals and potential actions to address the risks facing Columbia County and the seven
incorporated communities. All hazard mitigation actions and strategies include NFIP
compliance, preventive actions, property protection techniques, natural resource protection
strategies, structural projects, emergency services, and public information and awareness
activities. The Steering Committees selected relevant mitigation actions and strategies to
implement countywide.
References - This section lists the reference materials used to prepare this MHMP.
INTRODUCTION
Columbia County Multi-Jurisdictional Hazard Mitigation Plan – May 2014 Draft 1-4
Appendices - Appendices A through H provide the vulnerability analyses and mitigation
strategies, including the capability assessments, for Columbia County and the cities of St.
Helens, Columbia City, Scappoose, Clatskanie, Rainier, Prescott, and Vernonia. Appendix I
includes figures and maps for hazards in the county and local jurisdictions. Appendix J provides
a copy of the Annual Review Worksheet that will be used by the County and Local steering
committees to report on annual reviews of the plan. Appendix K provides copies of the
resolutions of formal adoption of the plan by the county and the local jurisdictions.

INTRODUCTION
Columbia County Multi-Jurisdictional Hazard Mitigation Plan – May 2014 Draft 1-5
This page intentionally left blank
PREREQUISITES
Columbia County Multi-Jurisdictional Hazard Mitigation Plan 2-1
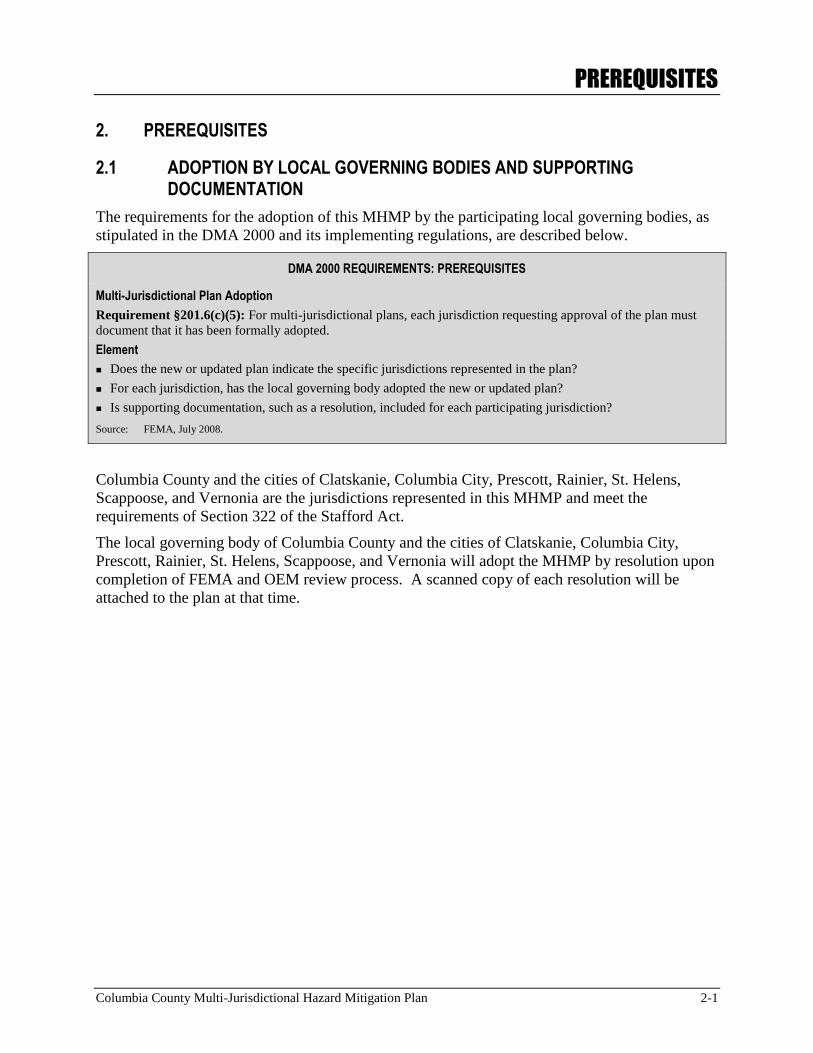
2. PREREQUISITES
2.1 ADOPTION BY LOCAL GOVERNING BODIES AND SUPPORTING DOCUMENTATION
The requirements for the adoption of this MHMP by the participating local governing bodies, as
stipulated in the DMA 2000 and its implementing regulations, are described below.
DMA 2000 REQUIREMENTS: PREREQUISITES
Multi-Jurisdictional Plan Adoption
Requirement §201.6(c)(5): For multi-jurisdictional plans, each jurisdiction requesting approval of the plan must
document that it has been formally adopted.
Element
Does the new or updated plan indicate the specific jurisdictions represented in the plan?
For each jurisdiction, has the local governing body adopted the new or updated plan?
Is supporting documentation, such as a resolution, included for each participating jurisdiction?
Source: FEMA, July 2008.
Columbia County and the cities of Clatskanie, Columbia City, Prescott, Rainier, St. Helens,
Scappoose, and Vernonia are the jurisdictions represented in this MHMP and meet the
requirements of Section 322 of the Stafford Act.
The local governing body of Columbia County and the cities of Clatskanie, Columbia City,
Prescott, Rainier, St. Helens, Scappoose, and Vernonia will adopt the MHMP by resolution upon
completion of FEMA and OEM review process. A scanned copy of each resolution will be
attached to the plan at that time.
PREREQUISITES
Columbia County Multi-Jurisdictional Hazard Mitigation Plan 2-2
This page intentionally left blank
COMMUNITY DESCRIPTION
Columbia County Multi-Jurisdictional Hazard Mitigation Plan 3-1
3. COMMUNITY DESCRIPTION
This section describes the location, geography, and history; demographics; and land use
development trends of Columbia County and the cities of Clatskanie, Columbia City, Prescott,
Rainier, St. Helens, Scappoose, and Vernonia.
3.1 LOCATION, GEOGRAPHY, AND HISTORY
Columbia County, named for the Columbia River, was created in 1854 from the northern half of
Washington County. As shown in Figure I-1, it encompasses 687 square miles and is bounded on
the north and east by 62 miles of the Columbia River. It is bordered on the west by Clatsop
County and on the south by Washington and Multnomah Counties. Columbia County is
Oregon’s third smallest county and the sixteenth county to be formed.
Columbia County lies within the marine west coast climate zone. Summers are warm and dry
with clear skies, with July averaging 68.4° Fahrenheit (F). Winters can be mild to chilly, and
very moist, with January averaging 39°F. The rainfall averages 44.6 inches per year. Columbia
County averages 155 days of measurable precipitation a year. Snow occurs infrequently
delivering trace amounts however, the County can experience major snow and ice storms as cold
air patterns flow from the Columbia River Gorge. The county’s winter snowfall totals range
from negligible to 60.9 inches in the early 1890s. The County’s lowest temperature was −3°F on
February 2, 1950; the highest temperature reached 107°F on July 29, 1965, August 8, 1981, and
August 10, 1981.
The Lewis and Clark expedition traveled through Columbia County on its way to the Pacific
Ocean. Early fur traders settled the County in 1810. Many settlers came to the heavily forested
region as immigrants seeking adventure and lush farmland. Other inhabitants left Washington
State because of ongoing Indian wars. These emigrants sought safer locations on the other side of
the Columbia River arriving in what is now St. Helens and Columbia City.
The primary industries of private sector employment within Columbia County are
manufacturing, retail trade, and private educational and health services. The county was covered
by old growth timber, which was completely logged over by the 1950s. Second growth timber
provides the raw material for local lumber and paper mills.
3.2 DEMOGRAPHICS
3.2.1 Columbia County
According to the 2010 Census report, conducted by the United States Census Bureau, (U.S.
Census) Columbia County’s population was 49,351. The Portland State University (PSU)
Population Research Center has estimated the 2013 population of Columbia County at 49,850.
From 2000 to 2013, the percentage of the county’s population age 17 and under has decreased
from 27.3 percent to 22.6 percent while the percentage of those 65 and over has grown from 11.6
percent to 15.8 percent. The County’s labor force (civilian population age 16 and over) has
grown from 22,478 in 2000 to 23,792 in 2013, an increase of 5.8 percent. The median
COMMUNITY DESCRIPTION
Columbia County Multi-Jurisdictional Hazard Mitigation Plan 3-2
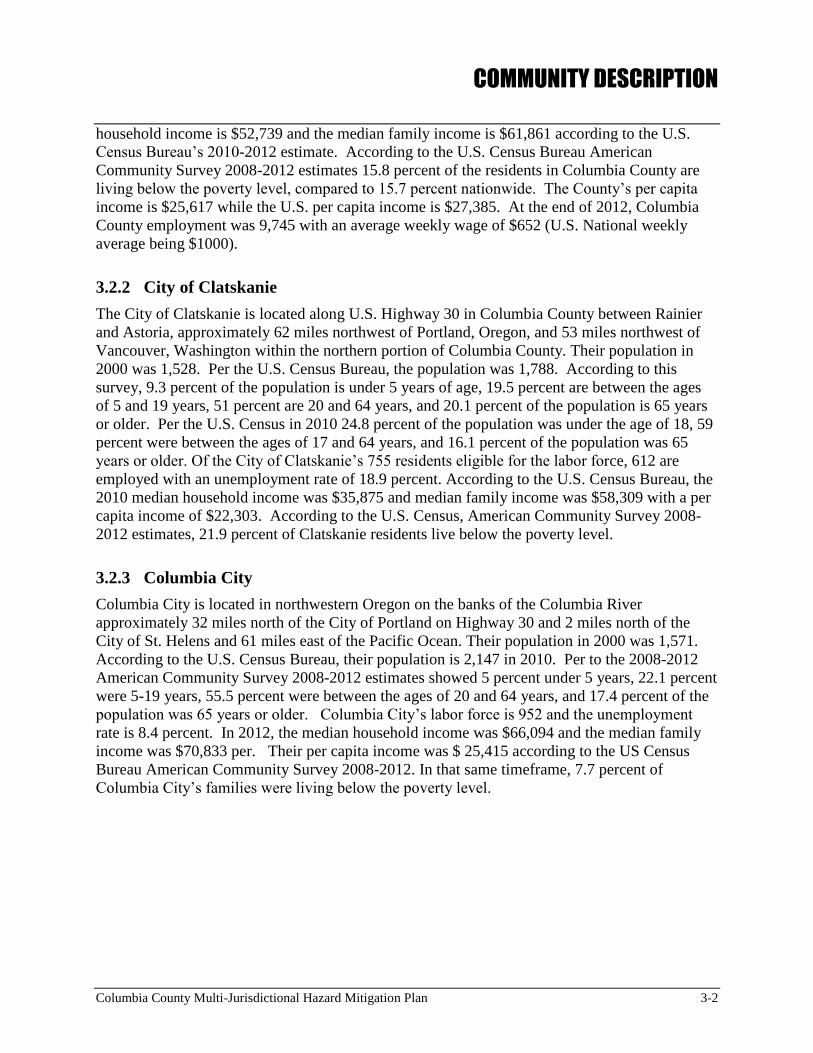
household income is $52,739 and the median family income is $61,861 according to the U.S.
Census Bureau’s 2010-2012 estimate. According to the U.S. Census Bureau American
Community Survey 2008-2012 estimates 15.8 percent of the residents in Columbia County are
living below the poverty level, compared to 15.7 percent nationwide. The County’s per capita
income is $25,617 while the U.S. per capita income is $27,385. At the end of 2012, Columbia
County employment was 9,745 with an average weekly wage of $652 (U.S. National weekly
average being $1000).
3.2.2 City of Clatskanie
The City of Clatskanie is located along U.S. Highway 30 in Columbia County between Rainier
and Astoria, approximately 62 miles northwest of Portland, Oregon, and 53 miles northwest of
Vancouver, Washington within the northern portion of Columbia County. Their population in
2000 was 1,528. Per the U.S. Census Bureau, the population was 1,788. According to this
survey, 9.3 percent of the population is under 5 years of age, 19.5 percent are between the ages
of 5 and 19 years, 51 percent are 20 and 64 years, and 20.1 percent of the population is 65 years
or older. Per the U.S. Census in 2010 24.8 percent of the population was under the age of 18, 59
percent were between the ages of 17 and 64 years, and 16.1 percent of the population was 65
years or older. Of the City of Clatskanie’s 755 residents eligible for the labor force, 612 are
employed with an unemployment rate of 18.9 percent. According to the U.S. Census Bureau, the
2010 median household income was $35,875 and median family income was $58,309 with a per
capita income of $22,303. According to the U.S. Census, American Community Survey 2008-
2012 estimates, 21.9 percent of Clatskanie residents live below the poverty level.
3.2.3 Columbia City
Columbia City is located in northwestern Oregon on the banks of the Columbia River
approximately 32 miles north of the City of Portland on Highway 30 and 2 miles north of the
City of St. Helens and 61 miles east of the Pacific Ocean. Their population in 2000 was 1,571.
According to the U.S. Census Bureau, their population is 2,147 in 2010. Per to the 2008-2012
American Community Survey 2008-2012 estimates showed 5 percent under 5 years, 22.1 percent
were 5-19 years, 55.5 percent were between the ages of 20 and 64 years, and 17.4 percent of the
population was 65 years or older. Columbia City’s labor force is 952 and the unemployment
rate is 8.4 percent. In 2012, the median household income was $66,094 and the median family
income was $70,833 per. Their per capita income was $ 25,415 according to the US Census
Bureau American Community Survey 2008-2012. In that same timeframe, 7.7 percent of
Columbia City’s families were living below the poverty level.
COMMUNITY DESCRIPTION
Columbia County Multi-Jurisdictional Hazard Mitigation Plan 3-3
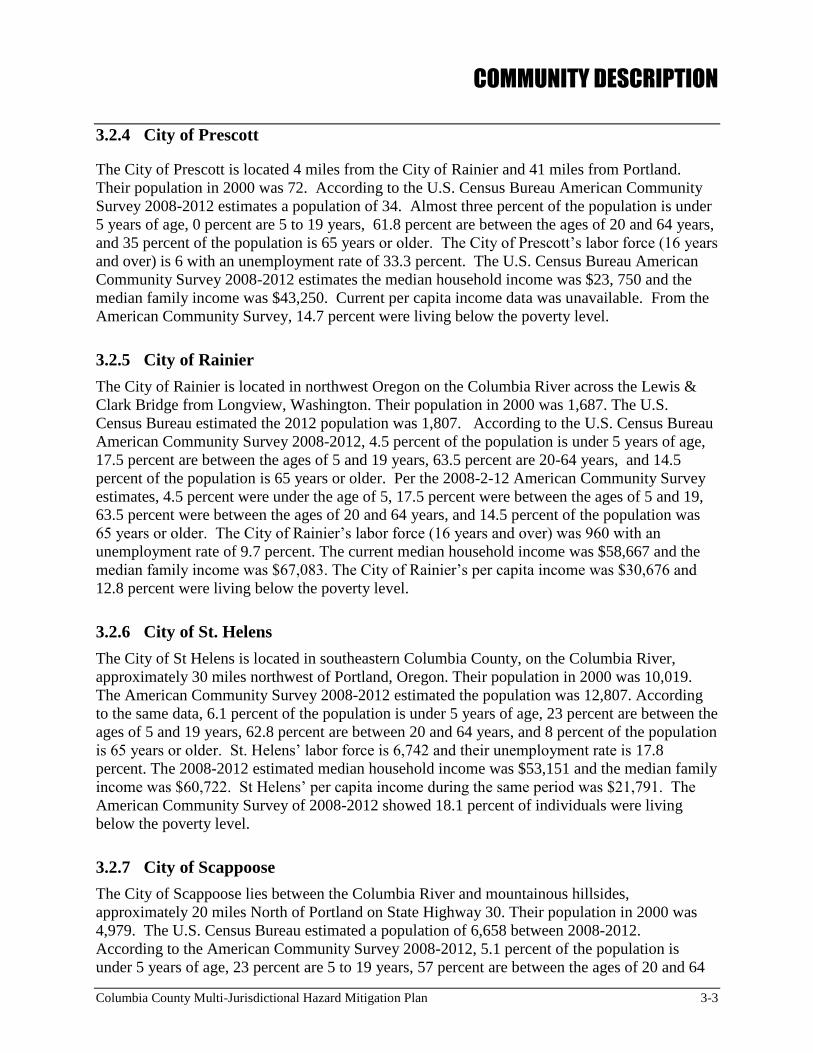
3.2.4 City of Prescott
The City of Prescott is located 4 miles from the City of Rainier and 41 miles from Portland.
Their population in 2000 was 72. According to the U.S. Census Bureau American Community
Survey 2008-2012 estimates a population of 34. Almost three percent of the population is under
5 years of age, 0 percent are 5 to 19 years, 61.8 percent are between the ages of 20 and 64 years,
and 35 percent of the population is 65 years or older. The City of Prescott’s labor force (16 years
and over) is 6 with an unemployment rate of 33.3 percent. The U.S. Census Bureau American
Community Survey 2008-2012 estimates the median household income was $23, 750 and the
median family income was $43,250. Current per capita income data was unavailable. From the
American Community Survey, 14.7 percent were living below the poverty level.
3.2.5 City of Rainier
The City of Rainier is located in northwest Oregon on the Columbia River across the Lewis &
Clark Bridge from Longview, Washington. Their population in 2000 was 1,687. The U.S.
Census Bureau estimated the 2012 population was 1,807. According to the U.S. Census Bureau
American Community Survey 2008-2012, 4.5 percent of the population is under 5 years of age,
17.5 percent are between the ages of 5 and 19 years, 63.5 percent are 20-64 years, and 14.5
percent of the population is 65 years or older. Per the 2008-2-12 American Community Survey
estimates, 4.5 percent were under the age of 5, 17.5 percent were between the ages of 5 and 19,
63.5 percent were between the ages of 20 and 64 years, and 14.5 percent of the population was
65 years or older. The City of Rainier’s labor force (16 years and over) was 960 with an
unemployment rate of 9.7 percent. The current median household income was $58,667 and the
median family income was $67,083. The City of Rainier’s per capita income was $30,676 and
12.8 percent were living below the poverty level.
3.2.6 City of St. Helens
The City of St Helens is located in southeastern Columbia County, on the Columbia River,
approximately 30 miles northwest of Portland, Oregon. Their population in 2000 was 10,019.
The American Community Survey 2008-2012 estimated the population was 12,807. According
to the same data, 6.1 percent of the population is under 5 years of age, 23 percent are between the
ages of 5 and 19 years, 62.8 percent are between 20 and 64 years, and 8 percent of the population
is 65 years or older. St. Helens’ labor force is 6,742 and their unemployment rate is 17.8
percent. The 2008-2012 estimated median household income was $53,151 and the median family
income was $60,722. St Helens’ per capita income during the same period was $21,791. The
American Community Survey of 2008-2012 showed 18.1 percent of individuals were living
below the poverty level.
3.2.7 City of Scappoose
The City of Scappoose lies between the Columbia River and mountainous hillsides,
approximately 20 miles North of Portland on State Highway 30. Their population in 2000 was
4,979. The U.S. Census Bureau estimated a population of 6,658 between 2008-2012.
According to the American Community Survey 2008-2012, 5.1 percent of the population is
under 5 years of age, 23 percent are 5 to 19 years, 57 percent are between the ages of 20 and 64
COMMUNITY DESCRIPTION
Columbia County Multi-Jurisdictional Hazard Mitigation Plan 3-4
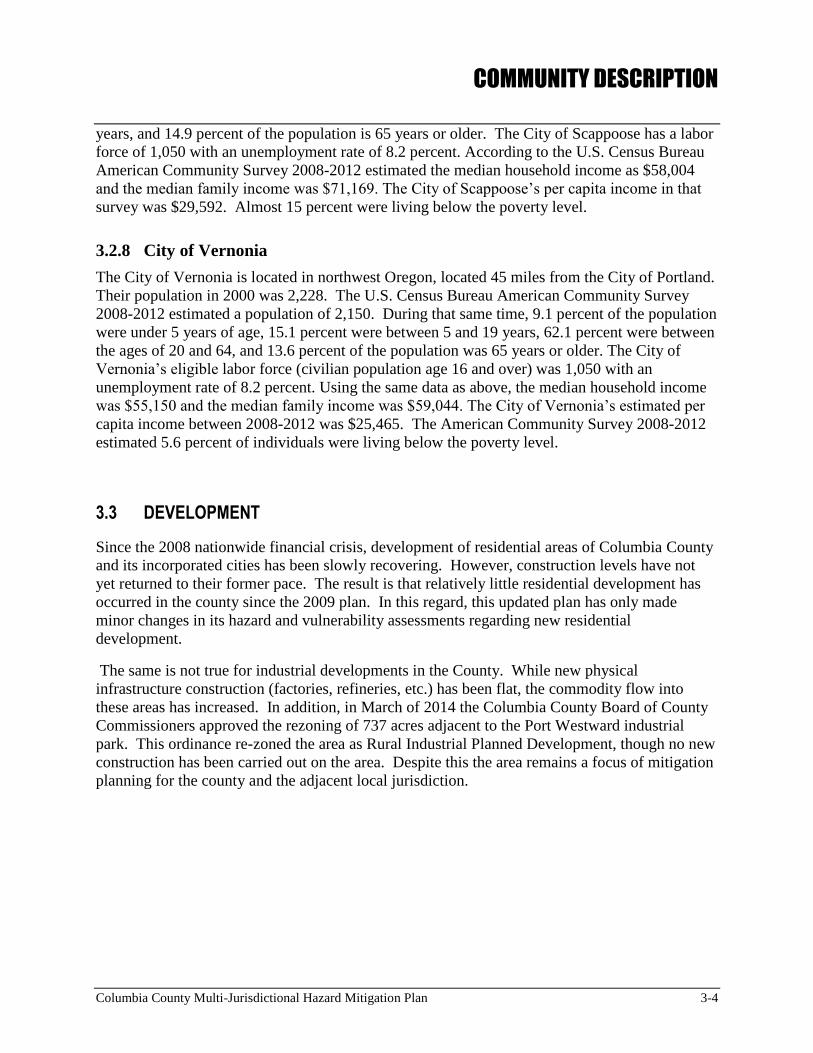
years, and 14.9 percent of the population is 65 years or older. The City of Scappoose has a labor
force of 1,050 with an unemployment rate of 8.2 percent. According to the U.S. Census Bureau
American Community Survey 2008-2012 estimated the median household income as $58,004
and the median family income was $71,169. The City of Scappoose’s per capita income in that
survey was $29,592. Almost 15 percent were living below the poverty level.
3.2.8 City of Vernonia
The City of Vernonia is located in northwest Oregon, located 45 miles from the City of Portland.
Their population in 2000 was 2,228. The U.S. Census Bureau American Community Survey
2008-2012 estimated a population of 2,150. During that same time, 9.1 percent of the population
were under 5 years of age, 15.1 percent were between 5 and 19 years, 62.1 percent were between
the ages of 20 and 64, and 13.6 percent of the population was 65 years or older. The City of
Vernonia’s eligible labor force (civilian population age 16 and over) was 1,050 with an
unemployment rate of 8.2 percent. Using the same data as above, the median household income
was $55,150 and the median family income was $59,044. The City of Vernonia’s estimated per
capita income between 2008-2012 was $25,465. The American Community Survey 2008-2012
estimated 5.6 percent of individuals were living below the poverty level.
3.3 DEVELOPMENT
Since the 2008 nationwide financial crisis, development of residential areas of Columbia County
and its incorporated cities has been slowly recovering. However, construction levels have not
yet returned to their former pace. The result is that relatively little residential development has
occurred in the county since the 2009 plan. In this regard, this updated plan has only made
minor changes in its hazard and vulnerability assessments regarding new residential
development.
The same is not true for industrial developments in the County. While new physical
infrastructure construction (factories, refineries, etc.) has been flat, the commodity flow into
these areas has increased. In addition, in March of 2014 the Columbia County Board of County
Commissioners approved the rezoning of 737 acres adjacent to the Port Westward industrial
park. This ordinance re-zoned the area as Rural Industrial Planned Development, though no new
construction has been carried out on the area. Despite this the area remains a focus of mitigation
planning for the county and the adjacent local jurisdiction.
PLANNING PROCESS
Columbia County Multi-Jurisdictional Hazard Mitigation Plan 4-1
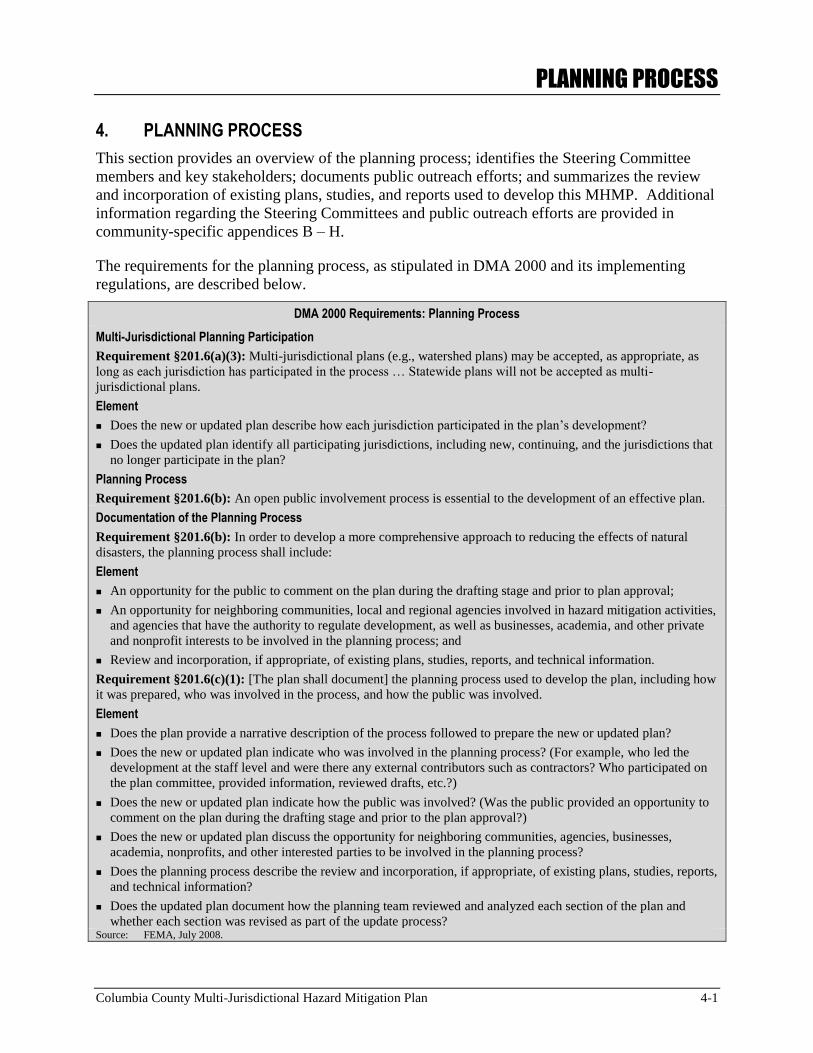
4. PLANNING PROCESS
This section provides an overview of the planning process; identifies the Steering Committee
members and key stakeholders; documents public outreach efforts; and summarizes the review
and incorporation of existing plans, studies, and reports used to develop this MHMP. Additional
information regarding the Steering Committees and public outreach efforts are provided in
community-specific appendices B – H.
The requirements for the planning process, as stipulated in DMA 2000 and its implementing
regulations, are described below.
DMA 2000 Requirements: Planning Process
Multi-Jurisdictional Planning Participation
Requirement §201.6(a)(3): Multi-jurisdictional plans (e.g., watershed plans) may be accepted, as appropriate, as
long as each jurisdiction has participated in the process … Statewide plans will not be accepted as multi-
jurisdictional plans.
Element
Does the new or updated plan describe how each jurisdiction participated in the plan’s development?
Does the updated plan identify all participating jurisdictions, including new, continuing, and the jurisdictions that
no longer participate in the plan?
Planning Process
Requirement §201.6(b): An open public involvement process is essential to the development of an effective plan.
Documentation of the Planning Process
Requirement §201.6(b): In order to develop a more comprehensive approach to reducing the effects of natural
disasters, the planning process shall include:
Element
An opportunity for the public to comment on the plan during the drafting stage and prior to plan approval;
An opportunity for neighboring communities, local and regional agencies involved in hazard mitigation activities,
and agencies that have the authority to regulate development, as well as businesses, academia, and other private
and nonprofit interests to be involved in the planning process; and
Review and incorporation, if appropriate, of existing plans, studies, reports, and technical information.
Requirement §201.6(c)(1): [The plan shall document] the planning process used to develop the plan, including how
it was prepared, who was involved in the process, and how the public was involved.
Element
Does the plan provide a narrative description of the process followed to prepare the new or updated plan?
Does the new or updated plan indicate who was involved in the planning process? (For example, who led the
development at the staff level and were there any external contributors such as contractors? Who participated on
the plan committee, provided information, reviewed drafts, etc.?)
Does the new or updated plan indicate how the public was involved? (Was the public provided an opportunity to
comment on the plan during the drafting stage and prior to the plan approval?)
Does the new or updated plan discuss the opportunity for neighboring communities, agencies, businesses,
academia, nonprofits, and other interested parties to be involved in the planning process?
Does the planning process describe the review and incorporation, if appropriate, of existing plans, studies, reports,
and technical information?
Does the updated plan document how the planning team reviewed and analyzed each section of the plan and
whether each section was revised as part of the update process? Source: FEMA, July 2008.
PLANNING PROCESS
Columbia County Multi-Jurisdictional Hazard Mitigation Plan 4-2
4.1 OVERVIEW OF PLANNING PROCESS
4.1.1 Initial Planning Processes, 1998-2005
In 1997 Columbia County was the first county in Oregon to begin the development of a complete
(in 1998) a Hazard Mitigation plan – anticipating the requirement of the Disaster Mitigation Act
of 2000 by two years.
In 2005, the Columbia County Director of Emergency Management, under direction from the
County Commissioners, expanded the original Steering Committee to include, not only County
agencies, but also city agencies, public safety agencies, private organizations, and businesses
broadening countywide citizen involvement. The newly expanded Steering Committee
collaboratively worked to evaluate and update the 1998 Natural Hazards Mitigation Plan to
fulfill newly developed DMA 2000 requirements ultimately adopting it as the 2005 Natural
Hazards Mitigation Plan (2005 HMP).
The 2005 HMP Steering Committee consisted of a county level commissioner, emergency
management, road department, land development staff, city public works, police, fire and rescue,
911 communications staff, State forestry, fire district personnel and a consultant.
The 2005 HMP formed the basis for the County’s All Hazard Mitigation Planning focus --
identifying five far-reaching planning goals with supporting objectives, and corresponding action
items. This process refined goal achievement with a matrix to delineate coordinating and partner
organizations, timelines, and lists the specific planning goals addressed by each action item.
The plan proceeded to explain Oregon and Columbia County planning initiatives and
legislatively mandated land-use policy and supporting initiatives, the development methodology
and research process along with a detailed explanation of each chosen hazard potentially
threatening the county. Various natural processes were defined for each community and
participating jurisdiction along with demographic information to form the basis for a risk
assessment. However, only the flood hazard had a well defined critical facility risk assessment
and vulnerability analysis. The remaining hazards did not possess a thorough assessment due to
limited available information, resources, and funding.
The plan listed several mitigation actions to reduce or prevent damage and losses from natural
hazards. However, limited resources prevented developing specific actions or assigning
responsible entities to undertake project development and completion.
4.1.2 2009 Plan Update
The 2009 Columbia County Multi-Jurisdictional Hazard Mitigation Plan update was intended to:
include newly identified hazards affecting individual jurisdictions; provide a comprehensive risk
assessment and vulnerability analysis; provide community based mitigation actions; identify
funding sources; and include all incorporated jurisdictions within the county as part of the
update.
FEMA provided technical assistance to facilitate developing this MHMP. This includes
updating the portions of the existing plan for the unincorporated areas within the County as well
as including the incorporated cities (the Cities of Clatskanie, Columbia City, Prescott, Rainier,
PLANNING PROCESS
Columbia County Multi-Jurisdictional Hazard Mitigation Plan 4-3
Scappoose, and Vernonia). The City of Vernonia’s portion of this plan also addresses update
requirements as part of bringing all of the cities under one multi-jurisdictional plan.
The following six-step planning process formed the basis for this planning effort.
Organize Resources: Each Steering Committee identified resources, including county
staff, city departments and agencies, and local nongovernmental organization (NGOs),
which could provide the technical expertise and historical information needed to update
the MHMP.
Profile Hazards: Each Steering Committee identified the hazards specific to Columbia
County and the cities of Clatskanie, Columbia City, Prescott, Rainier, St. Helens,
Scappoose, and Vernonia. A hazard analysis was developed for these 16 hazards.
Assess Risks: A vulnerability analysis was developed for the county and each of the
incorporated communities. The county and incorporated communities used the
vulnerability analysis results during the mitigation strategy development.
Assess Capabilities: Each Steering Committee reviewed the current administrative and
technical, legal and regulatory, and fiscal capabilities to determine whether existing
provisions and requirements adequately addressed relevant hazards in each respective
jurisdiction.
Develop Mitigation Strategy: Each Steering Committee developed a comprehensive
range of potential mitigation goals and actions. Subsequently, Columbia County and the
incorporated communities identified, evaluated, and prioritized the actions to be
implemented in the county- and city-specific Mitigation Action Plans (Appendices A-H).
Monitor Progress: Each Steering Committee developed an implementation process to
ensure the success of an ongoing program to minimize hazard impacts to Columbia
County and the incorporated communities.
The 2009 planning effort was a comprehensive and technical substitution of the county’s
previous HMP. The plan has served successfully to guide previous and ongoing mitigation
efforts in the county, and will to provide the basis for subsequent hazard mitigation planning
efforts in the future.
4.1.3 2014 Hazard Mitigation Plan Update
Unlike the 2009 effort this update did not rely on the services of an outside contractor – the
entire effort was conducted ‘in house’. This decision was made based on the quality of the
product that the county adopted in 2009. Resultantly, while that plan forms the template for this
2014 effort, significant changes have been made throughout the basic plan and the county and
jurisdictional appendices.
The 2014 plan update process is narrated in the following divisions of this section.
PLANNING PROCESS
Columbia County Multi-Jurisdictional Hazard Mitigation Plan 4-4
4.2 HAZARD MITIGATION STEERING COMMITTEES
4.2.1 Formation of the Committees
This plan update process began in November of 2013 with the creation of the first pre-plan, used
to develop timeline and build the planning committees. From this pre-plan three committee types
were formed:
1. Basic Plan Steering committee
2. County Appendix Steering committee
3. Jurisdictional Appendix Steering Committees
The first committee to form and begin its work was the Basic Plan committee. This committee
formed in order to review, and revise where appropriate, the basic methodology of the plan.
When this step had been taken, the additional annex steering committees were formed to conduct
the reviews of the county and local jurisdictions plans. Each Committee was formed using staff
from relevant local departments, agencies, and NGOs. The Steering Committee members
represent community members within Columbia County and each of the county’s seven
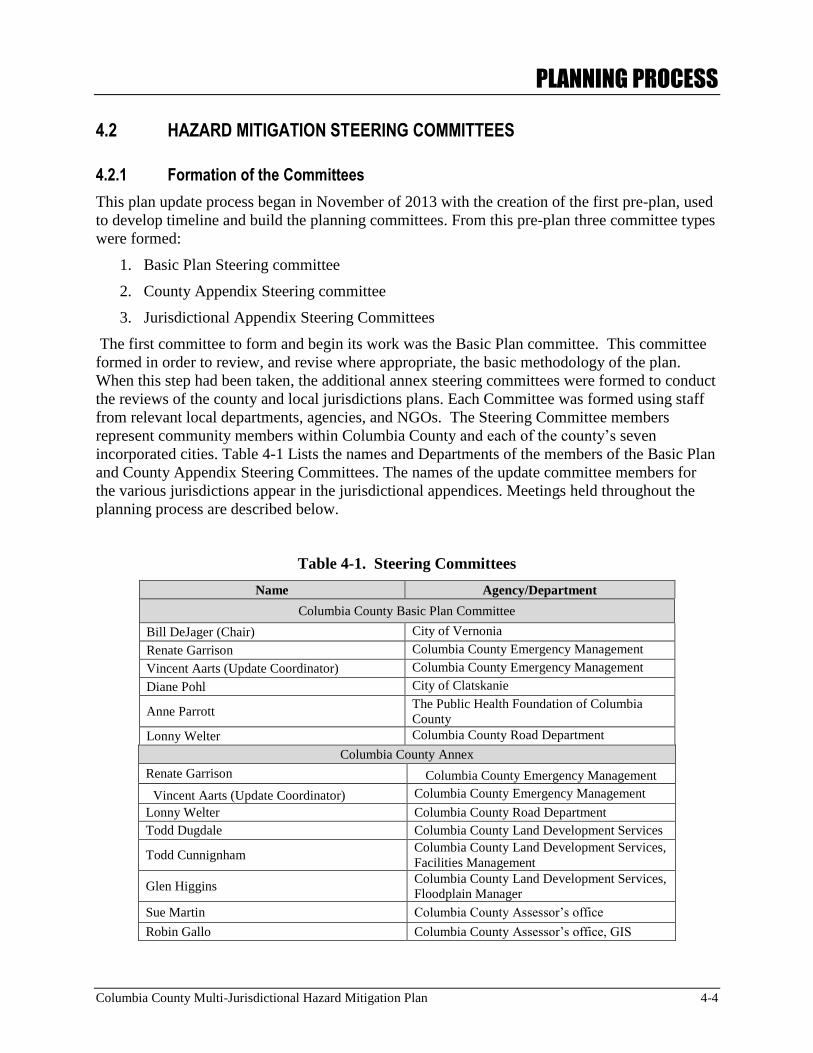
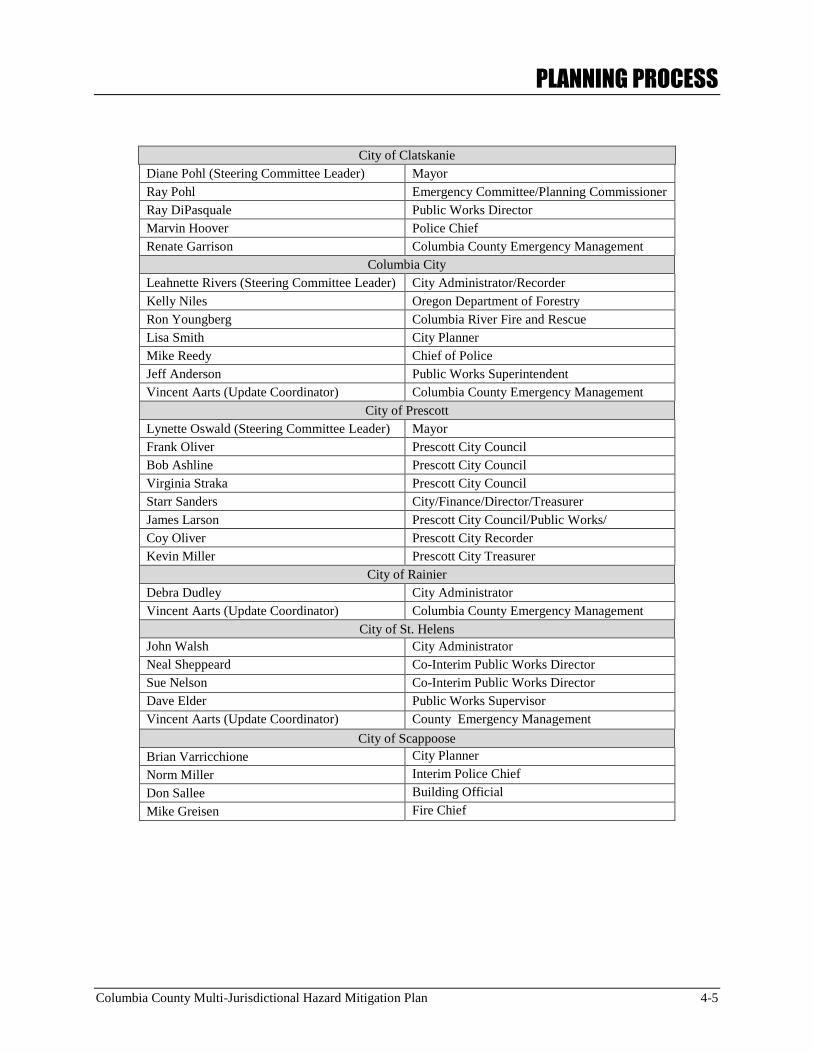
incorporated cities. Table 4-1 Lists the names and Departments of the members of the Basic Plan
and County Appendix Steering Committees. The names of the update committee members for
the various jurisdictions appear in the jurisdictional appendices. Meetings held throughout the
planning process are described below.
Table 4-1. Steering Committees
Name Agency/Department
Columbia County Basic Plan Committee
Bill DeJager (Chair) City of Vernonia
Renate Garrison Columbia County Emergency Management
Vincent Aarts (Update Coordinator) Columbia County Emergency Management
Diane Pohl City of Clatskanie
Anne Parrott The Public Health Foundation of Columbia
County
Lonny Welter Columbia County Road Department
Columbia County Annex
Renate Garrison Columbia County Emergency Management
Vincent Aarts (Update Coordinator) Columbia County Emergency Management
Lonny Welter Columbia County Road Department
Todd Dugdale Columbia County Land Development Services
Todd Cunnignham Columbia County Land Development Services,
Facilities Management
Glen Higgins Columbia County Land Development Services,
Floodplain Manager
Sue Martin Columbia County Assessor’s office
Robin Gallo Columbia County Assessor’s office, GIS
PLANNING PROCESS
Columbia County Multi-Jurisdictional Hazard Mitigation Plan 4-5
City of Clatskanie
Diane Pohl (Steering Committee Leader) Mayor
Ray Pohl Emergency Committee/Planning Commissioner
Ray DiPasquale Public Works Director
Marvin Hoover Police Chief
Renate Garrison Columbia County Emergency Management
Columbia City
Leahnette Rivers (Steering Committee Leader) City Administrator/Recorder
Kelly Niles Oregon Department of Forestry
Ron Youngberg Columbia River Fire and Rescue
Lisa Smith City Planner
Mike Reedy Chief of Police
Jeff Anderson Public Works Superintendent
Vincent Aarts (Update Coordinator) Columbia County Emergency Management
City of Prescott
Lynette Oswald (Steering Committee Leader) Mayor
Frank Oliver Prescott City Council
Bob Ashline Prescott City Council
Virginia Straka Prescott City Council
Starr Sanders City/Finance/Director/Treasurer
James Larson Prescott City Council/Public Works/
Coy Oliver Prescott City Recorder
Kevin Miller Prescott City Treasurer
City of Rainier
Debra Dudley City Administrator
Vincent Aarts (Update Coordinator) Columbia County Emergency Management
City of St. Helens
John Walsh City Administrator
Neal Sheppeard Co-Interim Public Works Director
Sue Nelson Co-Interim Public Works Director
Dave Elder Public Works Supervisor
Vincent Aarts (Update Coordinator) County Emergency Management
City of Scappoose
Brian Varricchione City Planner
Norm Miller Interim Police Chief
Don Sallee Building Official
Mike Greisen Fire Chief
PLANNING PROCESS
Columbia County Multi-Jurisdictional Hazard Mitigation Plan 4-6
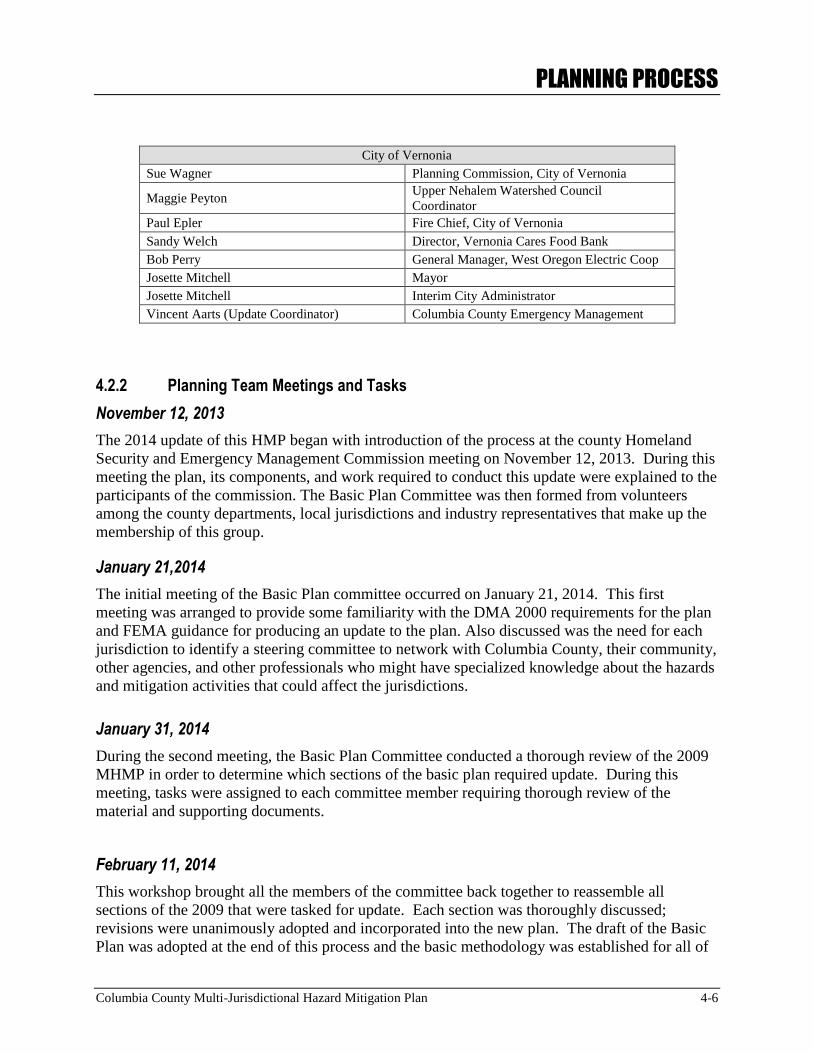
City of Vernonia
Sue Wagner Planning Commission, City of Vernonia
Maggie Peyton Upper Nehalem Watershed Council
Coordinator
Paul Epler Fire Chief, City of Vernonia
Sandy Welch Director, Vernonia Cares Food Bank
Bob Perry General Manager, West Oregon Electric Coop
Josette Mitchell Mayor
Josette Mitchell Interim City Administrator
Vincent Aarts (Update Coordinator) Columbia County Emergency Management
4.2.2 Planning Team Meetings and Tasks
November 12, 2013
The 2014 update of this HMP began with introduction of the process at the county Homeland
Security and Emergency Management Commission meeting on November 12, 2013. During this
meeting the plan, its components, and work required to conduct this update were explained to the
participants of the commission. The Basic Plan Committee was then formed from volunteers
among the county departments, local jurisdictions and industry representatives that make up the
membership of this group.
January 21,2014
The initial meeting of the Basic Plan committee occurred on January 21, 2014. This first
meeting was arranged to provide some familiarity with the DMA 2000 requirements for the plan
and FEMA guidance for producing an update to the plan. Also discussed was the need for each
jurisdiction to identify a steering committee to network with Columbia County, their community,
other agencies, and other professionals who might have specialized knowledge about the hazards
and mitigation activities that could affect the jurisdictions.
January 31, 2014
During the second meeting, the Basic Plan Committee conducted a thorough review of the 2009
MHMP in order to determine which sections of the basic plan required update. During this
meeting, tasks were assigned to each committee member requiring thorough review of the
material and supporting documents.
February 11, 2014
This workshop brought all the members of the committee back together to reassemble all
sections of the 2009 that were tasked for update. Each section was thoroughly discussed;
revisions were unanimously adopted and incorporated into the new plan. The draft of the Basic
Plan was adopted at the end of this process and the basic methodology was established for all of
PLANNING PROCESS
Columbia County Multi-Jurisdictional Hazard Mitigation Plan 4-7
the following appendices. At the conclusion of this workshop the committee had completed its
work.
Steering Committee Meetings
At this point, the Update Coordinator released the updated basic plan to the county and
jurisdictional steering committees. These committees were now free to begin the process of
updating their assigned appendices. Each committee in its relevant jurisdiction met several
times, and included public involvement in their process. The process for each jurisdiction is
located in its appendix.
4.3 PUBLIC INVOLVEMENT
4.3.1 Project Introduction
In early November 2013 the update process was first introduced to the Columbia County
Homeland Security and Emergency Management Commission. From the available role of
HSEMC participants and the attending public, the Basic Plan Committee was formed and work
on the project began forthwith. Throughout the following months of the planning process,
multiple efforts were made to encourage and generate public involvement in the process. In
addition, each jurisdictional appendix including the county appendix was updated with
opportunity for public involvement
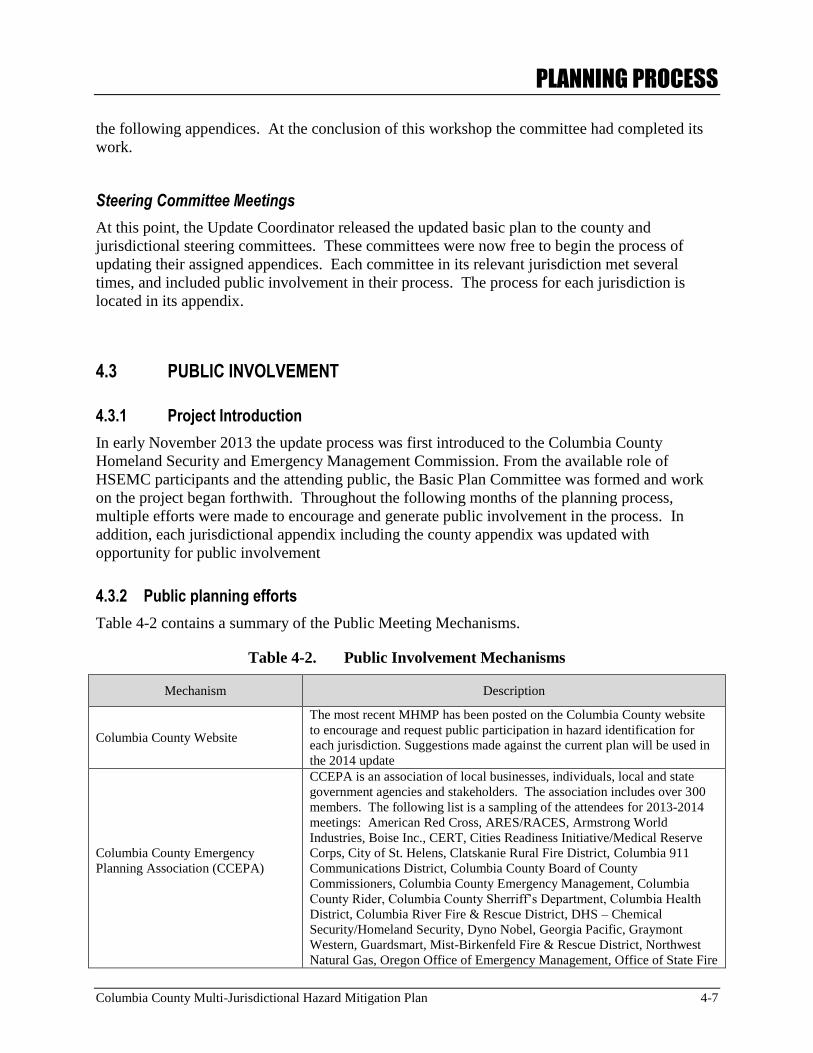
4.3.2 Public planning efforts
Table 4-2 contains a summary of the Public Meeting Mechanisms.
Table 4-2. Public Involvement Mechanisms
Mechanism Description
Columbia County Website
The most recent MHMP has been posted on the Columbia County website
to encourage and request public participation in hazard identification for
each jurisdiction. Suggestions made against the current plan will be used in
the 2014 update
Columbia County Emergency
Planning Association (CCEPA)
CCEPA is an association of local businesses, individuals, local and state
government agencies and stakeholders. The association includes over 300
members. The following list is a sampling of the attendees for 2013-2014
meetings: American Red Cross, ARES/RACES, Armstrong World
Industries, Boise Inc., CERT, Cities Readiness Initiative/Medical Reserve
Corps, City of St. Helens, Clatskanie Rural Fire District, Columbia 911
Communications District, Columbia County Board of County
Commissioners, Columbia County Emergency Management, Columbia
County Rider, Columbia County Sherriff’s Department, Columbia Health
District, Columbia River Fire & Rescue District, DHS – Chemical
Security/Homeland Security, Dyno Nobel, Georgia Pacific, Graymont
Western, Guardsmart, Mist-Birkenfeld Fire & Rescue District, Northwest
Natural Gas, Oregon Office of Emergency Management, Office of State Fire
PLANNING PROCESS
Columbia County Multi-Jurisdictional Hazard Mitigation Plan 4-8
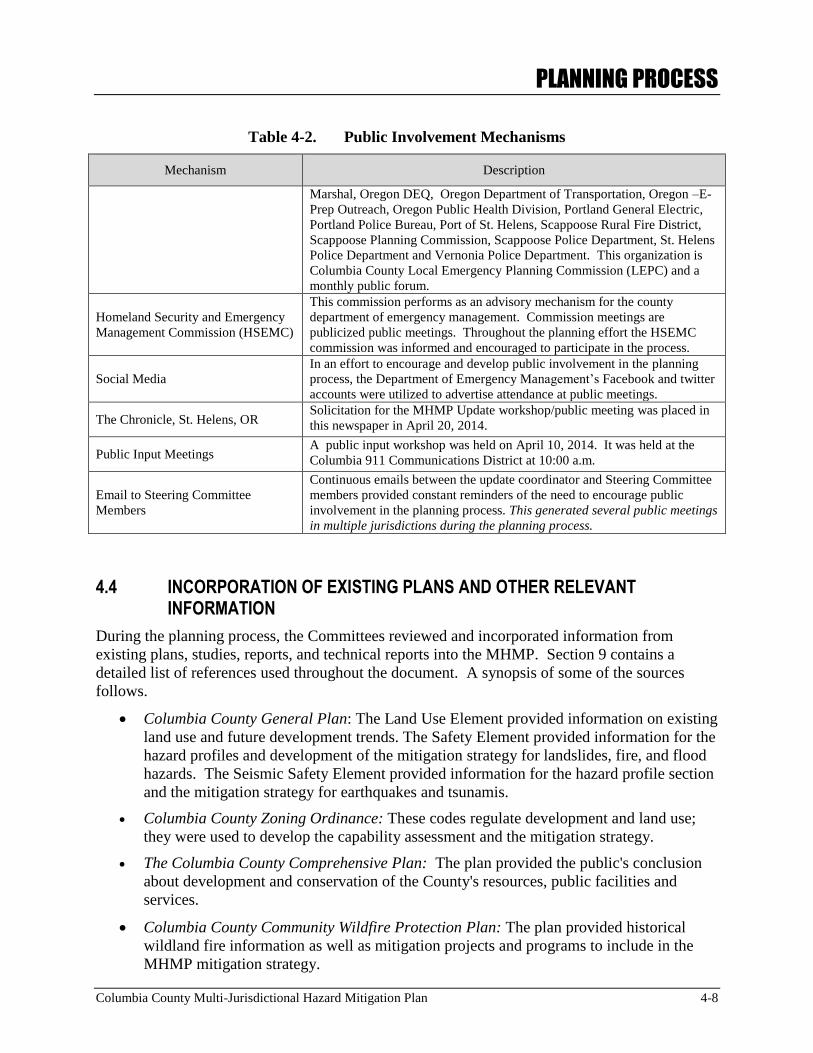
Table 4-2. Public Involvement Mechanisms
Mechanism Description
Marshal, Oregon DEQ, Oregon Department of Transportation, Oregon –E-
Prep Outreach, Oregon Public Health Division, Portland General Electric,
Portland Police Bureau, Port of St. Helens, Scappoose Rural Fire District,
Scappoose Planning Commission, Scappoose Police Department, St. Helens
Police Department and Vernonia Police Department. This organization is
Columbia County Local Emergency Planning Commission (LEPC) and a
monthly public forum.
Homeland Security and Emergency
Management Commission (HSEMC)
This commission performs as an advisory mechanism for the county
department of emergency management. Commission meetings are
publicized public meetings. Throughout the planning effort the HSEMC
commission was informed and encouraged to participate in the process.
Social Media
In an effort to encourage and develop public involvement in the planning
process, the Department of Emergency Management’s Facebook and twitter
accounts were utilized to advertise attendance at public meetings.
The Chronicle, St. Helens, OR Solicitation for the MHMP Update workshop/public meeting was placed in
this newspaper in April 20, 2014.
Public Input Meetings A public input workshop was held on April 10, 2014. It was held at the
Columbia 911 Communications District at 10:00 a.m.
Email to Steering Committee
Members
Continuous emails between the update coordinator and Steering Committee
members provided constant reminders of the need to encourage public
involvement in the planning process. This generated several public meetings
in multiple jurisdictions during the planning process.
4.4 INCORPORATION OF EXISTING PLANS AND OTHER RELEVANT INFORMATION
During the planning process, the Committees reviewed and incorporated information from
existing plans, studies, reports, and technical reports into the MHMP. Section 9 contains a
detailed list of references used throughout the document. A synopsis of some of the sources
follows.
Columbia County General Plan: The Land Use Element provided information on existing
land use and future development trends. The Safety Element provided information for the
hazard profiles and development of the mitigation strategy for landslides, fire, and flood
hazards. The Seismic Safety Element provided information for the hazard profile section
and the mitigation strategy for earthquakes and tsunamis.
Columbia County Zoning Ordinance: These codes regulate development and land use;
they were used to develop the capability assessment and the mitigation strategy.
The Columbia County Comprehensive Plan: The plan provided the public's conclusion
about development and conservation of the County's resources, public facilities and
services.
Columbia County Community Wildfire Protection Plan: The plan provided historical
wildland fire information as well as mitigation projects and programs to include in the
MHMP mitigation strategy.
PLANNING PROCESS
Columbia County Multi-Jurisdictional Hazard Mitigation Plan 4-9
State of Oregon Natural Hazards Mitigation Plan: This plan, prepared by the State
Interagency Hazard Mitigation Team was consulted to ensure that the MHMP is
consistent with the State hazard mitigation plan.
Multi-Hazard Mitigation Plan for Columbia County, Oregon: The 2009 plan was used as
a baseline for this planning update. Hazards, critical facilities, and mitigation goals and
actions were reviewed as part of the update process.
Multi-Hazard Mitigation Plan for Vernonia, Oregon: The 2005 plan was also used as a
baseline for this planning update. Hazards, critical facilities, and mitigation goals and
actions were reviewed as part of the update process.
Appendices B through H include the incorporated city-specific existing plans, studies, and
reports used during the update.
HAZARD PROFILES
Columbia County Multi-Jurisdictional Hazard Mitigation Plan 5-1
5. HAZARD PROFILES
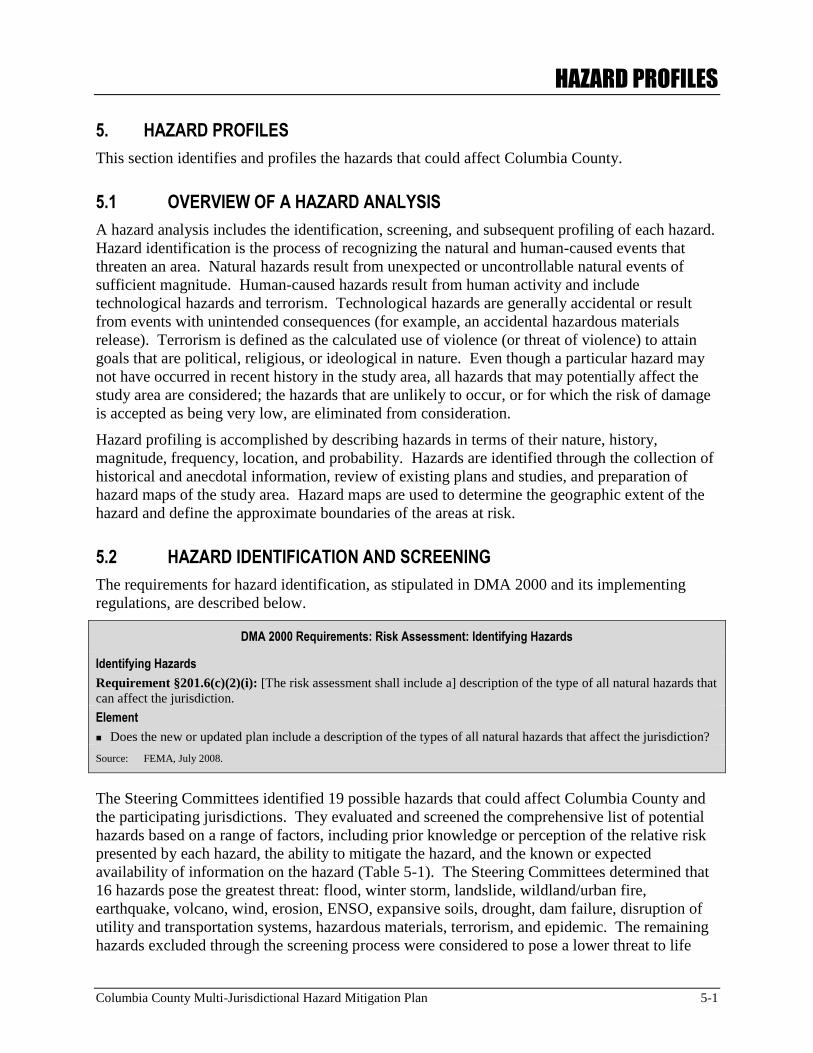
This section identifies and profiles the hazards that could affect Columbia County.
5.1 OVERVIEW OF A HAZARD ANALYSIS
A hazard analysis includes the identification, screening, and subsequent profiling of each hazard.
Hazard identification is the process of recognizing the natural and human-caused events that
threaten an area. Natural hazards result from unexpected or uncontrollable natural events of
sufficient magnitude. Human-caused hazards result from human activity and include
technological hazards and terrorism. Technological hazards are generally accidental or result
from events with unintended consequences (for example, an accidental hazardous materials
release). Terrorism is defined as the calculated use of violence (or threat of violence) to attain
goals that are political, religious, or ideological in nature. Even though a particular hazard may
not have occurred in recent history in the study area, all hazards that may potentially affect the
study area are considered; the hazards that are unlikely to occur, or for which the risk of damage
is accepted as being very low, are eliminated from consideration.
Hazard profiling is accomplished by describing hazards in terms of their nature, history,
magnitude, frequency, location, and probability. Hazards are identified through the collection of
historical and anecdotal information, review of existing plans and studies, and preparation of
hazard maps of the study area. Hazard maps are used to determine the geographic extent of the
hazard and define the approximate boundaries of the areas at risk.
5.2 HAZARD IDENTIFICATION AND SCREENING
The requirements for hazard identification, as stipulated in DMA 2000 and its implementing
regulations, are described below.
DMA 2000 Requirements: Risk Assessment: Identifying Hazards
Identifying Hazards
Requirement §201.6(c)(2)(i): [The risk assessment shall include a] description of the type of all natural hazards that
can affect the jurisdiction.
Element
Does the new or updated plan include a description of the types of all natural hazards that affect the jurisdiction?
Source: FEMA, July 2008.
The Steering Committees identified 19 possible hazards that could affect Columbia County and
the participating jurisdictions. They evaluated and screened the comprehensive list of potential
hazards based on a range of factors, including prior knowledge or perception of the relative risk
presented by each hazard, the ability to mitigate the hazard, and the known or expected
availability of information on the hazard (Table 5-1). The Steering Committees determined that
16 hazards pose the greatest threat: flood, winter storm, landslide, wildland/urban fire,
earthquake, volcano, wind, erosion, ENSO, expansive soils, drought, dam failure, disruption of
utility and transportation systems, hazardous materials, terrorism, and epidemic. The remaining
hazards excluded through the screening process were considered to pose a lower threat to life
HAZARD PROFILES
Columbia County Multi-Jurisdictional Hazard Mitigation Plan 5-2
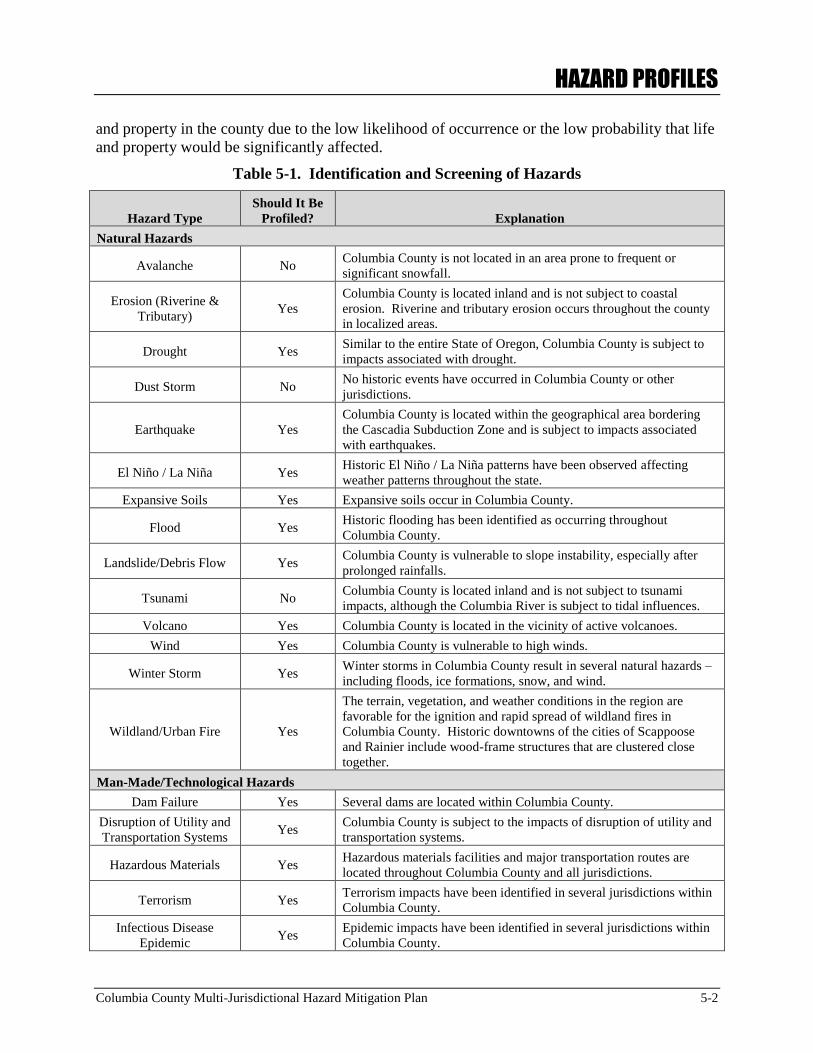
and property in the county due to the low likelihood of occurrence or the low probability that life
and property would be significantly affected.
Table 5-1. Identification and Screening of Hazards
Hazard Type
Should It Be
Profiled? Explanation
Natural Hazards
Avalanche No Columbia County is not located in an area prone to frequent or
significant snowfall.
Erosion (Riverine &
Tributary) Yes
Columbia County is located inland and is not subject to coastal
erosion. Riverine and tributary erosion occurs throughout the county
in localized areas.
Drought Yes Similar to the entire State of Oregon, Columbia County is subject to
impacts associated with drought.
Dust Storm No No historic events have occurred in Columbia County or other
jurisdictions.
Earthquake Yes
Columbia County is located within the geographical area bordering
the Cascadia Subduction Zone and is subject to impacts associated
with earthquakes.
El Niño / La Niña Yes Historic El Niño / La Niña patterns have been observed affecting
weather patterns throughout the state.
Expansive Soils Yes Expansive soils occur in Columbia County.
Flood Yes Historic flooding has been identified as occurring throughout
Columbia County.
Landslide/Debris Flow Yes Columbia County is vulnerable to slope instability, especially after
prolonged rainfalls.
Tsunami No Columbia County is located inland and is not subject to tsunami
impacts, although the Columbia River is subject to tidal influences.
Volcano Yes Columbia County is located in the vicinity of active volcanoes.
Wind Yes Columbia County is vulnerable to high winds.
Winter Storm Yes Winter storms in Columbia County result in several natural hazards –
including floods, ice formations, snow, and wind.
Wildland/Urban Fire Yes
The terrain, vegetation, and weather conditions in the region are
favorable for the ignition and rapid spread of wildland fires in
Columbia County. Historic downtowns of the cities of Scappoose
and Rainier include wood-frame structures that are clustered close
together.
Man-Made/Technological Hazards
Dam Failure Yes Several dams are located within Columbia County.
Disruption of Utility and
Transportation Systems Yes
Columbia County is subject to the impacts of disruption of utility and
transportation systems.
Hazardous Materials Yes Hazardous materials facilities and major transportation routes are
located throughout Columbia County and all jurisdictions.
Terrorism Yes Terrorism impacts have been identified in several jurisdictions within
Columbia County.
Infectious Disease
Epidemic Yes
Epidemic impacts have been identified in several jurisdictions within
Columbia County.
HAZARD PROFILES
Columbia County Multi-Jurisdictional Hazard Mitigation Plan 5-3
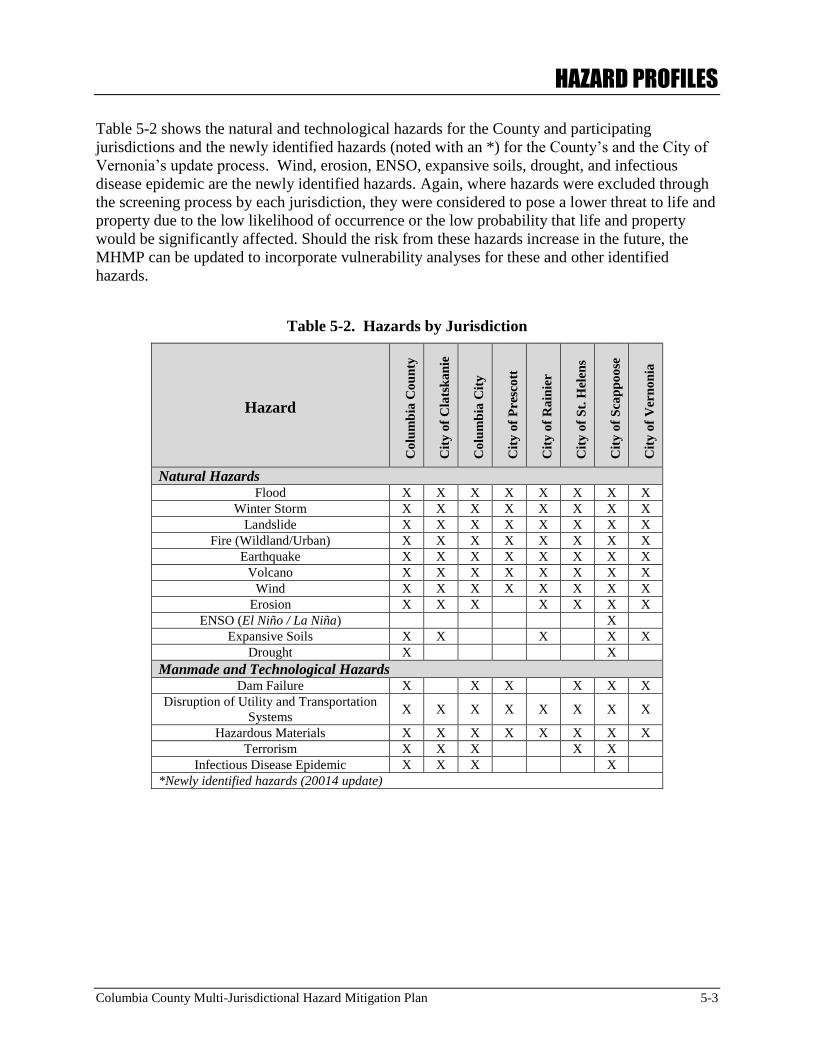
Table 5-2 shows the natural and technological hazards for the County and participating
jurisdictions and the newly identified hazards (noted with an *) for the County’s and the City of
Vernonia’s update process. Wind, erosion, ENSO, expansive soils, drought, and infectious
disease epidemic are the newly identified hazards. Again, where hazards were excluded through
the screening process by each jurisdiction, they were considered to pose a lower threat to life and
property due to the low likelihood of occurrence or the low probability that life and property
would be significantly affected. Should the risk from these hazards increase in the future, the
MHMP can be updated to incorporate vulnerability analyses for these and other identified
hazards.
Table 5-2. Hazards by Jurisdiction
Hazard C
olu
mb
ia C
ou
nty
Cit
y o
f C
lats
ka
nie
Co
lum
bia
Cit
y
Cit
y o
f P
resc
ott
Cit
y o
f R
ain
ier
Cit
y o
f S
t. H
elen
s
Cit
y o
f S
cap
po
ose
Cit
y o
f V
ern
on
ia
Natural Hazards Flood X X X X X X X X
Winter Storm X X X X X X X X
Landslide X X X X X X X X
Fire (Wildland/Urban) X X X X X X X X
Earthquake X X X X X X X X
Volcano X X X X X X X X
Wind X X X X X X X X
Erosion X X X X X X X
ENSO (El Niño / La Niña) X
Expansive Soils X X X X X
Drought X X
Manmade and Technological Hazards Dam Failure X X X X X X
Disruption of Utility and Transportation
Systems X X X X X X X X
Hazardous Materials X X X X X X X X
Terrorism X X X X X
Infectious Disease Epidemic X X X X
*Newly identified hazards (20014 update)
HAZARD PROFILES
Columbia County Multi-Jurisdictional Hazard Mitigation Plan 5-4
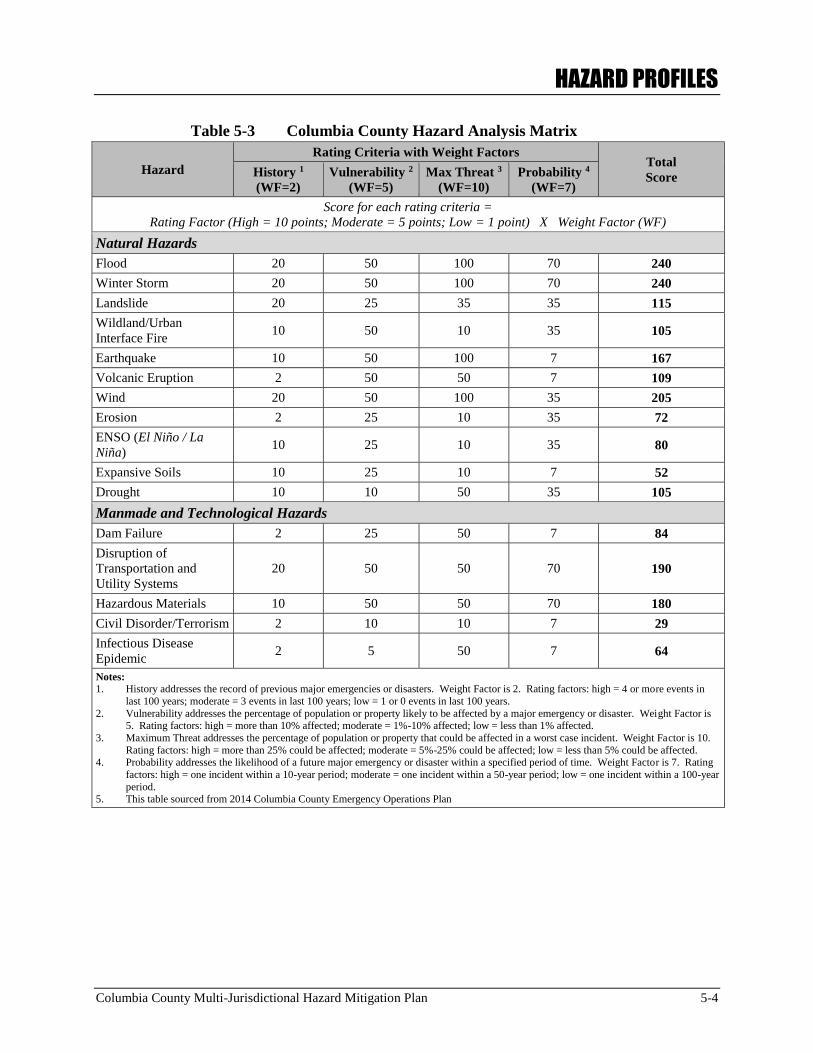
Table 5-3 Columbia County Hazard Analysis Matrix
Hazard
Rating Criteria with Weight Factors Total
Score History 1
(WF=2)
Vulnerability 2
(WF=5)
Max Threat 3
(WF=10)
Probability 4
(WF=7)
Score for each rating criteria =
Rating Factor (High = 10 points; Moderate = 5 points; Low = 1 point) X Weight Factor (WF)
Natural Hazards
Flood 20 50 100 70 240
Winter Storm 20 50 100 70 240
Landslide 20 25 35 35 115
Wildland/Urban
Interface Fire 10 50 10 35 105
Earthquake 10 50 100 7 167
Volcanic Eruption 2 50 50 7 109
Wind 20 50 100 35 205
Erosion 2 25 10 35 72
ENSO (El Niño / La
Niña) 10 25 10 35 80
Expansive Soils 10 25 10 7 52
Drought 10 10 50 35 105
Manmade and Technological Hazards
Dam Failure 2 25 50 7 84
Disruption of
Transportation and
Utility Systems
20 50 50 70 190
Hazardous Materials 10 50 50 70 180
Civil Disorder/Terrorism 2 10 10 7 29
Infectious Disease
Epidemic 2 5 50 7 64
Notes:
1. History addresses the record of previous major emergencies or disasters. Weight Factor is 2. Rating factors: high = 4 or more events in
last 100 years; moderate = 3 events in last 100 years; low = 1 or 0 events in last 100 years.
2. Vulnerability addresses the percentage of population or property likely to be affected by a major emergency or disaster. Weight Factor is 5. Rating factors: high = more than 10% affected; moderate = 1%-10% affected; low = less than 1% affected.
3. Maximum Threat addresses the percentage of population or property that could be affected in a worst case incident. Weight Factor is 10.
Rating factors: high = more than 25% could be affected; moderate = 5%-25% could be affected; low = less than 5% could be affected. 4. Probability addresses the likelihood of a future major emergency or disaster within a specified period of time. Weight Factor is 7. Rating
factors: high = one incident within a 10-year period; moderate = one incident within a 50-year period; low = one incident within a 100-year
period. 5. This table sourced from 2014 Columbia County Emergency Operations Plan
HAZARD PROFILES
Columbia County Multi-Jurisdictional Hazard Mitigation Plan 5-5
5.3 HAZARD PROFILE
The requirements for hazard profiles, as stipulated in DMA 2000 and its implementing
regulations, are described below.
DMA 2000 Requirements: Risk Assessment – Profiling Hazards
Profiling Hazards
Requirement §201.6(c)(2)(i): [The risk assessment shall include a] description of the location and extent of all
natural hazards that can affect the jurisdiction. The plan shall include information on previous occurrences of
hazard events and on the probability of future hazard events.
Element
Does the risk assessment identify the location (i.e., geographic area affected) of each natural hazard addressed in
the new or updated plan?
Does the risk assessment identify the extent (i.e., magnitude or severity) of each hazard addressed in the new or
updated plan?
Does the plan provide information on previous occurrences of each hazard addressed in the new or updated plan?
Does the plan include the probability of future events (i.e., chance of occurrence) for each hazard addressed in the
new or updated plan?
Source: FEMA, July 2008.
The specific hazards selected by the Steering Committees for profiling, have been examined in a
methodical manner based on the following factors:
Nature
History
Location
Extent
Probability of future events
The order of presentation does not signify the level of importance or risk.
5.3.1 Flood
5.3.1.1 Nature
A flood is the temporary inundation of water or mud on normally dry land. Heavy or prolonged
rain, snowmelt, or dam collapse can cause inundation, as can riverine and flash floods. (NOAA
2008) Urban and riverine flooding primarily affect Columbia County.
Urban flooding occurs in developed areas where the amount of water generated from rainfall and
runoff exceeds the storm water systems’ capacity. As land is converted from agricultural and
forest to urban uses, it often loses its ability to adsorb rainfall. Rain flows over impervious
surfaces such as concrete and asphalt and into nearby storm sewers and streams. This runoff can
result in the rapid rise of floodwaters. During urban floods, streets can become inundated, and
basements can fill with water. Storm drains often back up because of the volume of water and
become blocked by vegetative debris like yard waste, which can cause additional flooding.
HAZARD PROFILES
Columbia County Multi-Jurisdictional Hazard Mitigation Plan 5-6
Development in the floodplain can raise the base flood elevation and cause floodwaters to
expand past their historic floodplains. (FEMA 2008c)
Riverine or overbank flooding of rivers and streams is the most common type of flood hazard.
Riverine flooding most frequently occurs in winter and late spring. Air rises and cools over the
Coast Range and its foothills and heavy rainfall develops over high-elevation streams, as storms
move from the Pacific across the Oregon Coast. In this region, as much as four to six inches of
rain can fall over a 24-hour period. Severe and prolonged storms can raise rivers and streams to
their flood stages for three to four days or longer. (State of Oregon 2008)
Flash floods were identified as occurring in Columbia County by members of the public as part
of this planning process. However, the incident events do not fulfill the following scientifically
defined flashflood parameters.
Flash floods typically originate from slow-moving storms that can generate immense
volumes of rainfall and a rapid rise in water levels. The flash floods themselves quickly
reach high velocities, and often carry debris. Flash floods can strike a community with
little to no warning within 6 hours of heavy rain or rain and snowmelt, dam or levee
failure and may bring 10 to 20 feet of water. These events can move boulders the size of
small cars, uproot trees, destroy structures and facilities, erode roadways, sweep away
vehicles and create new water channels. The County’s erodibility index (a soils
sensitivity to the effects of wind and water on the soil structure) will greatly determine its
water and wind erosion potential and its impact from heavy rains and flash floods. Flash
flood intensity is proportionate to rainfall intensity and duration, and is affected by
watershed steepness and vegetation, stream gradient, natural and artificial flood storage
areas, and streambed and floodplain configurations. Urban areas are more vulnerable
to flash flooding because of development, land clearing, drainage system construction,
and unobstructed channels such as roads, parking lots and ditches. Wildfires may also
contribute to flash floods and landslides by removing vegetation and altering soil
conditions. (NOAA 2002, State of Oregon 2008)
Floods usually are the result of prolonged rainfall over a large area from major weather systems
that cause flooding of smaller streams that flow into major rivers. This type of flood and
inundation of the natural floodplains of the river system is a part of the natural process.
Development in or near the floodplain puts lives and property at risk.
Flood damage can include:
Structure inundation
Erosion of stream banks, road embankments, foundations, footings for bridge piers and
other features
Impact damage from high-velocity flow and from debris
Additional debris damage from accumulation on or blockage of infrastructure
Cropland destruction
Sewage and hazardous or toxic materials releases from damaged pipelines, tanks, and
facilities
Economic loss (local facilities, utilities, communications, agriculture)
HAZARD PROFILES
Columbia County Multi-Jurisdictional Hazard Mitigation Plan 5-7
5.3.1.2 History
Several very destructive floods have been recorded in Columbia County, as well as much of
western Oregon, throughout the years. Between 1955 and 1999, Oregon ranked eleventh
nationally for flood losses, with more than $197 million in annual damages. The county lies
between the Coastal Range and the Cascade Range, in topography rich with rivers and
tributaries. Because of this topography, melting snow and heavy winter rains can combine to
produce devastating flood events. Floods along the Columbia River itself are in many places
limited by the high, steep banks of the river, which contain most floodwaters to a narrow band.
However, other waterways exceed their banks more easily. (FEMA 2008b, Goettel 2005)
1948. A flood in 1948 covered eight drainage districts, inundated the industrial port of
St. Helens, and much of Clatskanie’s central business district.
In 1964, 1972, and 1974, the Nehalem River, Scappoose Creek, North Scappoose Creek,
Clatskanie River, Conyers Creek, and McNulty Creek were all subject to winter flooding.
(Goettel 2005)
December 1964. Nearly every river in the state of Oregon exceeded its flood stages as
weather stations set new records for precipitation. Known as the Christmas Flood, the
event triggered debris flows, bridge failures and flooding that caused thousands to
evacuate and closed airports, railways and hundreds of miles of roads across the state.
Ultimately, the event caused more than $157 million in damages and 20 people were
killed. (FEMA 2008b)
In 1987, a major flood of Scappoose Creek inundated many homes in Scappoose.
(Goettel 2005)
February 1996. Virtually every county in the state received a disaster declaration due to a
combination of warm temperatures, heavy snow pack and four days of record-breaking
rain. Many areas had already received above-average rainfall, meaning rivers were at or
reaching their capacities and flood stages. Recent logging activities contributed to
increased runoff, resulting in atypical sediment and debris, which made conditions ripe
for flooding and landslides. Hundreds of homes were destroyed, power outages were
widespread, thousands were evacuated to public shelters and five people died. Some
estimates of flood-related damages exceeded $1 billion. Later that year, in November, a
tropical air mass swept across the state, once again bringing record-breaking
precipitation. The stormy weather continued into December and early January as 26
major rivers reached flood stage. Snowmelt and intense rain caused extensive flooding
that led to widespread landslides, erosion, power outages, damaged homes and
businesses, closed roads and eventually resulted in a Presidential Disaster Declaration.
(FEMA 2008b, Goettel 2005)
In Columbia County, there were widespread road closures due to high water and
landslides, including the Scappoose-Vernonia Road and highways 30 and 47 in several
places. At the peak of the flood, all major highways were closed and those secondary
roads that were open were restricted to emergency vehicles. Road closures isolated
Vernonia and Clatskanie. Much of these two communities as well as parts of Scappoose,
St. Helens and Rainier had to be evacuated. A boil-water alert was in effect for most of
the county, and telecommunications, including some emergency communications, were
HAZARD PROFILES
Columbia County Multi-Jurisdictional Hazard Mitigation Plan 5-8
disrupted. FEMA disbursed repair and response totaling more than $5,000,000 to public
entities, and the Oregon Economic Development Department funded nearly $1,000,000
in Disaster Recovery Grants. Damages to private property were estimated at more than
$5,000,000. Extensive as the 1996 flood was, much larger floods are possible in
Columbia County. (FEMA 2008b, Goettel 2005)
Other notable flooding events occurred in January 1972, November 1973, January 1974,
January 1987, December 1995, November 1996, December 1996 - January 1997,
December 2003 - January 2004, March 2006, and December 2006. (FEMA 2008b)
December 2007. Severe storms, winds, mudslides, landslides, and flooding occurred
between December 1 and 17, 2007 shutting down roads and highways including
Interstate 5. Public infrastructure, homes, and personal property were damaged. In
Oregon, 73,000 residents were without power, and wastewater treatment plants were
overwhelmed. A major disaster was declared for the State of Oregon on December 8,
2007 with Columbia County included in the declaration. (FEMA 2008) Coastal river
flooding was estimated at or above the 25-year stage and compared to that of the 1964
and 1996 flood events.
The December storm flooded over 750 residences with 340 of those located in the City of
Vernonia alone. 220 Vernonia homes were more than 50% damaged, and 34 greater than 70%
damaged with an estimated $16.5 million in losses. March 2008 FEMA disaster aid was
estimated at approximately $20 million including:
$6,051,729 in individual assistance approved
$10,957,500 in low-interest disaster loan assistance approved to homeowners, renters and
businesses of all sizes
$3,157,918 in public assistance obligated
3,569 individuals registered for assistance
3,864 individuals visited Disaster Recovery Centers
2,014 home inspections completed
5.3.1.3 Location
Columbia County is subject to flooding from river overflow (the Columbia River, Multnomah
Channel, and smaller rivers such as the Nehalem and Clatskanie rivers) and lesser waterways
(including Conyers, McNulty, Milton, Rock, and Scappoose creeks); as well as flooding from
local storm water drainage. Between October and April, the county is susceptible to winter rain
flooding, while between May and July, snowmelt and runoff can create floods. Typically, the
most severe floods are winter rainfall floods in December, January and February.
Flood control storage reservoirs have substantially reduced flood potential along the Columbia
River and other major waterways. Upstream of Columbia County, the Columbia River has 22
major reservoirs (representing 40 million acre-feet of flood storage), the Willamette River has 11
major reservoirs (1.7 million acre-feet), and the Cowlitz River, one (360,000 acre-feet). The
Lewis River has three reservoirs (12,420 acre-feet). These reservoirs have reduced, but not
eliminated flood potential.

HAZARD PROFILES
Columbia County Multi-Jurisdictional Hazard Mitigation Plan 5-9
Figures I-3 through I-3H identify the location of the 100-year and 500-year floodplains for the
county and participating jurisdictions.
5.3.1.4 Extent
Floods are described in terms of their extent (including the horizontal area affected and the
vertical depth of floodwaters) and the related probability of occurrence. Flood studies often use
historical records, such as stream flow gauges, to determine the probability of occurrence for
floods of different magnitudes.
FEMA has mapped most of the flood-prone streams in Oregon for 100- and 500-year flood
events. A 100-year flood (one percent probability of occurring within any given year) is used as
the standard for floodplain management in the United States and is referred to as a base flood.
Flood Insurance Rate Maps (FIRMs) prepared by FEMA provide the most readily available
source of information for 100-year floods. These maps are used to support the NFIP. FIRMs
delineate 100- and 500-year (two percent probability of occurring in a given year) floodplain
boundaries for identified flood hazards; these areas are Special Flood Hazard Areas (SFHAs) and
provide the basis for flood insurance and floodplain management requirements.
Columbia County contains a total of 82.2 square miles within the 100-year floodplain, and 103.8
square miles within the 500-year floodplain. The 500-year event floodplain generally
encompasses slightly more area than a 100-year event. Each watershed has its own water
absorption characteristics. Buildings, roads, and parks replace grass and soil with asphalt or other
non-absorbing materials, which limit or prevent water absorption. Therefore, 500-year events
contain more water, which spreads further throughout the floodplain until the water can be
managed by manmade and natural drainage systems.
The FEMA-mapped floodplains in Columbia County include, for the most part, only areas along
the larger rivers and streams, which also have significant population and/or development. Other
areas in the county have flood risk, but are not included in the FIRM because of small stream
size or low population. Flood hazard evaluation for Columbia County must also take into
account these localized areas of high flood risk or repetitive flooding which lie outside mapped
floodplains. (Goettel 2005)
For Columbia County, there are several dozen FIRMs for cities as well as for communities in the
unincorporated portions of the county. These maps are available at the County Courthouse or
online at:
https://msc.fema.gov/webapp/wcs/stores/servlet/info?storeId=10001&catalogId=10001&langId=
1&content=productFIRM&title=NFIP%2520Flood%2520Maps&parent=productInfo&parentTitl
e=Product%2520Information
5.3.1.5 Probability of Future Events
Columbia County and the incorporated Cities of St. Helens, Columbia City, Scappoose,
Clatskanie, Rainier, Prescott, and Vernonia, participate in the NFIP and are required to regulate
floodplain development. Any structure built in the floodplain after 1974 must meet NFIP
requirements for elevation and flood proofing. Columbia County and the incorporated
HAZARD PROFILES
Columbia County Multi-Jurisdictional Hazard Mitigation Plan 5-10
jurisdictions use FEMA developed floodplain maps as the basis for implementing floodplain
regulations. FIRMs delineate flood hazard areas where NFIP regulations apply. FIRMS and
flood insurance studies assess the probability of flooding at given locations. These maps
represent a snapshot in time, and do not account for changes in the floodplains. Development
and other natural and artificial changes in floodplains have caused changes to the rivers and
streams in Columbia County. For areas not mapped by FIRMS, flood-susceptible areas can be
delineated and flood levels estimated by using historic stream flow records to determine flood
frequency and recurrence.
Flood studies use this information to determine the probability of occurrence for floods of
different magnitudes. The probability of occurrence is expressed as a percentage indicating the
probability of a specific flood event occurring in any given year.
Factors contributing to the frequency and severity of riverine flooding include:
Rainfall intensity and duration
Moisture conditions
Watershed conditions, including steepness of terrain, soil types, amount and type of
vegetation, and density of development
The existence of attenuating features in the watershed, including natural features such as
swamps and lakes, and human-built features such as dams
The existence of flood control features, such as levees and flood control channels
Velocity of flow
Tide heights and storm surge
Availability of sediment for transport, and the likelihood of erosion of the bed and banks
of the watercourse
These factors are evaluated using a hydrologic analysis to determine the probability that
discharge of a certain size will occur, and to determine the characteristics and depth of the flood
resulting from that discharge.
Flooding in western Oregon generally occurs when storms from the Pacific Ocean bring intense
or prolonged rainfall to the west coast. Columbia County typically experiences the most severe
floods from winter rainfall in December, January, and February. These floods are occasionally
exacerbated by frozen snow packs where rain and snow melt combine while the ground is frozen,
preventing ground seepage capability. The County is subject to flooding from river overflows; as
well as flooding from local storm water drainage. The county is susceptible to winter rain
flooding from October through April; while the months between May and July bring snowmelt
and runoff floods. Based on previous occurrences, the county is not susceptible to flash floods
according to NOAA’s National Weather Service – Portland Office, Warning Coordination
Meteorologist. However, the county is likely to experience major flood events occurring in and
around the county every 2 to 6 years based on recent historic occurrences.
HAZARD PROFILES
Columbia County Multi-Jurisdictional Hazard Mitigation Plan 5-11
5.3.2 Winter Storm
Winter storms occurring in Columbia County result in several natural hazards – including floods,
landslides/debris flows, and wind. Each on its own, or in combination, can completely
immobilize emergency response activities, close down transportation corridors, and disrupt
transportation and utilities. Each of these natural hazards is individually discussed in detail in
their respective sections.
Winter storms in Columbia County can bring snow as well as rain, or can be followed by rising
temperatures that melt newly fallen snow in higher elevations. Either scenario often causes
flooding; most floods in western Oregon occur as a result of winter storms. The flood hazard is
described in detail in the flood section of this document.
As is the case with flood, wind as a hazard in Columbia County most frequently occurs as part of
a winter storm. The nature, history, location, extent, and probability of future events for wind,
including winter storm wind, are explored in detail in the wind section of this document.
5.3.2.1 Nature
Ice and snowstorms, which include freezing rain, sleet, and hail, can be the most devastating of
winter weather phenomena and are often the cause of automobile accidents, power outages and
personal injury. Ice storms result in the accumulation of ice from freezing rain, which coats
every surface it falls on with a glaze of ice. Freezing rain is most commonly found in a narrow
band on the cold side of a warm front, where surface temperatures are at or just below freezing.
Typically, ice crystals high in the atmosphere grow by collecting water vapor molecules, which
are sometimes supplied by evaporating cloud droplets. As the ice crystals fall, the air warms and
the particles melt and collapse into raindrops. As the raindrops approach the ground, they
encounter a layer of cold air and cool to temperatures below freezing. However, since the cold
layer is shallow, the drops themselves do not freeze, but rather are supercooled, that is cooled in
a liquid state to below-freezing temperatures. These supercooled raindrops freeze on contact
when they strike the ground or other cold surfaces.
Snowstorms happen when a mass of very cold air collides with a mass of warm air. The warm
air rises quickly and the cold air cuts underneath it, cooling and condensing as it rises, forming a
cloud bank in the process. As the moisture droplets in the cloud cool to a point below freezing,
they become ice crystals, which then collide within the cloud and snow is formed. The resulting
precipitation falls as snow only when the temperature of the air between the bottom of the cloud
and the ground is below 40 degrees Fahrenheit. (ONHW 2006) A higher temperature will cause
the snowflakes to melt as they fall through the air, turning them into rain or sleet. Similar to
those of ice storms, the effects of a snowstorm can disturb a community for weeks or even
months. The combination of heavy snowfall, high winds and cold temperatures poses danger
from prolonged power outages, automobile accidents and transportation delays, dangerous
walkways, and through direct damage to buildings, pipes, crops, other vegetation, and livestock.
Buildings and trees can also collapse under the weight of heavy snow.
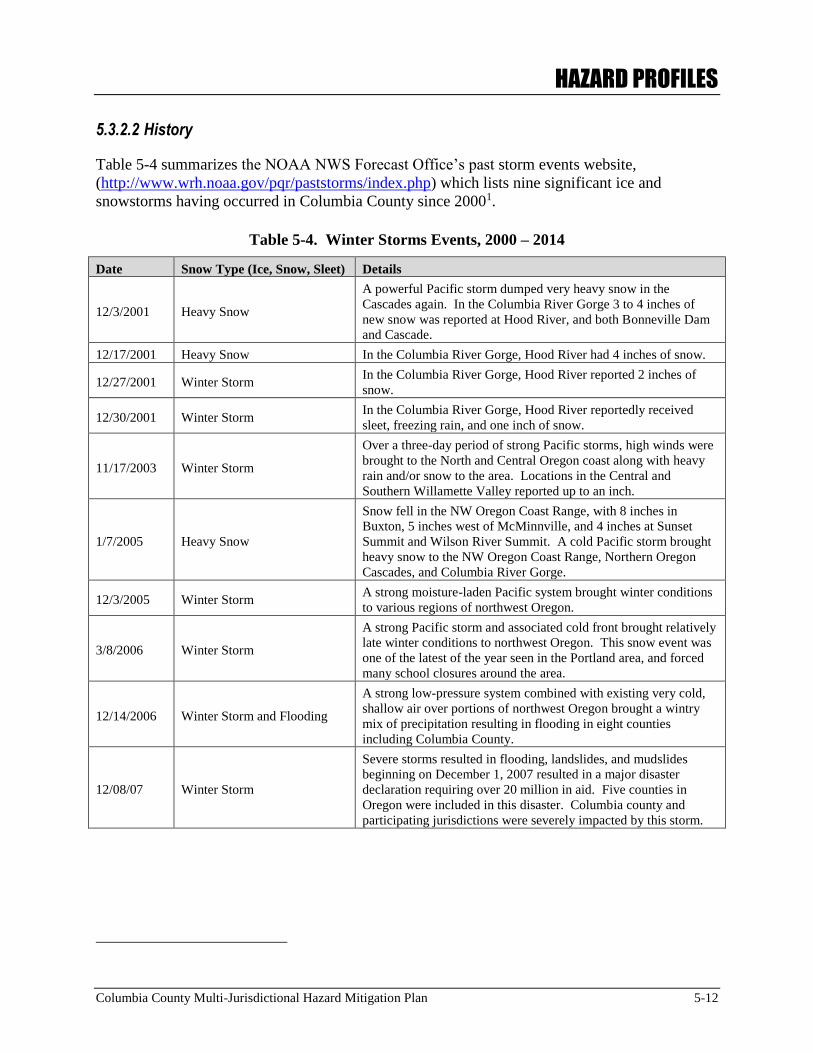
HAZARD PROFILES
Columbia County Multi-Jurisdictional Hazard Mitigation Plan 5-12
5.3.2.2 History
Table 5-4 summarizes the NOAA NWS Forecast Office’s past storm events website,
(http://www.wrh.noaa.gov/pqr/paststorms/index.php) which lists nine significant ice and
snowstorms having occurred in Columbia County since 20001.
Table 5-4. Winter Storms Events, 2000 – 2014
Date Snow Type (Ice, Snow, Sleet) Details
12/3/2001 Heavy Snow
A powerful Pacific storm dumped very heavy snow in the
Cascades again. In the Columbia River Gorge 3 to 4 inches of
new snow was reported at Hood River, and both Bonneville Dam
and Cascade.
12/17/2001 Heavy Snow In the Columbia River Gorge, Hood River had 4 inches of snow.
12/27/2001 Winter Storm In the Columbia River Gorge, Hood River reported 2 inches of
snow.
12/30/2001 Winter Storm In the Columbia River Gorge, Hood River reportedly received
sleet, freezing rain, and one inch of snow.
11/17/2003 Winter Storm
Over a three-day period of strong Pacific storms, high winds were
brought to the North and Central Oregon coast along with heavy
rain and/or snow to the area. Locations in the Central and
Southern Willamette Valley reported up to an inch.
1/7/2005 Heavy Snow
Snow fell in the NW Oregon Coast Range, with 8 inches in
Buxton, 5 inches west of McMinnville, and 4 inches at Sunset
Summit and Wilson River Summit. A cold Pacific storm brought
heavy snow to the NW Oregon Coast Range, Northern Oregon
Cascades, and Columbia River Gorge.
12/3/2005 Winter Storm A strong moisture-laden Pacific system brought winter conditions
to various regions of northwest Oregon.
3/8/2006 Winter Storm
A strong Pacific storm and associated cold front brought relatively
late winter conditions to northwest Oregon. This snow event was
one of the latest of the year seen in the Portland area, and forced
many school closures around the area.
12/14/2006 Winter Storm and Flooding
A strong low-pressure system combined with existing very cold,
shallow air over portions of northwest Oregon brought a wintry
mix of precipitation resulting in flooding in eight counties
including Columbia County.
12/08/07 Winter Storm
Severe storms resulted in flooding, landslides, and mudslides
beginning on December 1, 2007 resulted in a major disaster
declaration requiring over 20 million in aid. Five counties in
Oregon were included in this disaster. Columbia county and
participating jurisdictions were severely impacted by this storm.
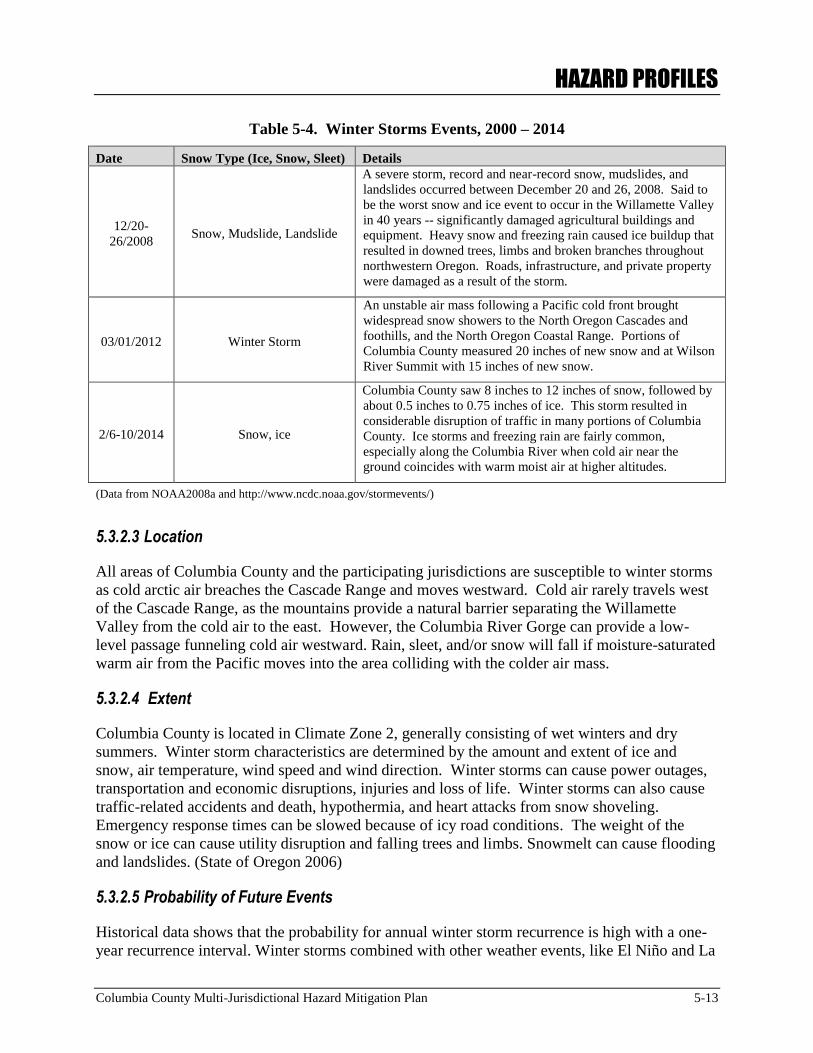
HAZARD PROFILES
Columbia County Multi-Jurisdictional Hazard Mitigation Plan 5-13
Table 5-4. Winter Storms Events, 2000 – 2014
Date Snow Type (Ice, Snow, Sleet) Details
12/20-
26/2008 Snow, Mudslide, Landslide
A severe storm, record and near-record snow, mudslides, and
landslides occurred between December 20 and 26, 2008. Said to
be the worst snow and ice event to occur in the Willamette Valley
in 40 years -- significantly damaged agricultural buildings and
equipment. Heavy snow and freezing rain caused ice buildup that
resulted in downed trees, limbs and broken branches throughout
northwestern Oregon. Roads, infrastructure, and private property
were damaged as a result of the storm.
03/01/2012 Winter Storm
An unstable air mass following a Pacific cold front brought
widespread snow showers to the North Oregon Cascades and
foothills, and the North Oregon Coastal Range. Portions of
Columbia County measured 20 inches of new snow and at Wilson
River Summit with 15 inches of new snow.
2/6-10/2014 Snow, ice
Columbia County saw 8 inches to 12 inches of snow, followed by
about 0.5 inches to 0.75 inches of ice. This storm resulted in
considerable disruption of traffic in many portions of Columbia
County. Ice storms and freezing rain are fairly common,
especially along the Columbia River when cold air near the
ground coincides with warm moist air at higher altitudes.
(Data from NOAA2008a and http://www.ncdc.noaa.gov/stormevents/)
5.3.2.3 Location
All areas of Columbia County and the participating jurisdictions are susceptible to winter storms
as cold arctic air breaches the Cascade Range and moves westward. Cold air rarely travels west
of the Cascade Range, as the mountains provide a natural barrier separating the Willamette
Valley from the cold air to the east. However, the Columbia River Gorge can provide a low-
level passage funneling cold air westward. Rain, sleet, and/or snow will fall if moisture-saturated
warm air from the Pacific moves into the area colliding with the colder air mass.
5.3.2.4 Extent
Columbia County is located in Climate Zone 2, generally consisting of wet winters and dry
summers. Winter storm characteristics are determined by the amount and extent of ice and
snow, air temperature, wind speed and wind direction. Winter storms can cause power outages,
transportation and economic disruptions, injuries and loss of life. Winter storms can also cause
traffic-related accidents and death, hypothermia, and heart attacks from snow shoveling.
Emergency response times can be slowed because of icy road conditions. The weight of the
snow or ice can cause utility disruption and falling trees and limbs. Snowmelt can cause flooding
and landslides. (State of Oregon 2006)
5.3.2.5 Probability of Future Events
Historical data shows that the probability for annual winter storm recurrence is high with a one-
year recurrence interval. Winter storms combined with other weather events, like El Niño and La
HAZARD PROFILES
Columbia County Multi-Jurisdictional Hazard Mitigation Plan 5-14
Niña cycle; often result in compounded hazards countywide. Winter storms have caused
flooding, landslides, debris flows, utility and transportation systems disruptions.
5.3.3 Landslide
5.3.3.1 Nature
Landslide is a general term for the dislodgment and fall of a mass of soil or rocks along a sloped
surface, or for the dislodged mass itself. The term is used for varying phenomena, including
mudflows, mudslides, debris flows, rock falls, rockslides, debris avalanches, debris slides and
slump-earth flows. The susceptibility of hillside and mountainous areas to landslides depends on
variations in geology, topography, vegetation and weather.
Landslides can be triggered by natural events such as seismic tremors and earthquakes, volcanic
eruptions, stream erosion, snowmelt, and prolonged or heavy rainfall. Development and other
human activities can also provoke landslides. Increased runoff, excavation in hillsides, shocks
and vibrations from construction, placement of non-engineered fill, and changes in vegetation
from fire, timber harvesting and land clearing have all led to landslide events. Weathering and
decomposition of geologic material, and alterations in flow of surface or ground water can
further increase the potential for landslides.
The United States Geological Survey (USGS) identifies six types of landslides, distinguished by
the type of material and movement mechanism involved:
Slides: The more accurate and restrictive use of the term landslide refers to a mass
movement of material, originating from a discrete area of weakness that slides from
stable underlying material. A rotational slide occurs when there is movement along a
concave surface; and a translational slide originates from movement along a flat surface.
Debris flows: Flows arise from saturated material that generally moves rapidly down a
slope. A debris flow usually mobilizes from other types of landslides on steep slopes,
then flows through confined channels, liquefying and gaining speed. Debris flows can
travel at speeds of more than 35 miles per hour for several miles. Other types of flows
include debris avalanches, mudflows, creeps, earthflows, debris flows, and lahars.
Lateral Spreads: This type of landslide generally occurs on gentle slopes or flat terrain.
Lateral spreads are characterized by liquefaction of fine-grained soils. The event is
typically triggered by an earthquake or human-caused rapid ground motion.
Falls: Falls are the free-fall movement of rocks and boulders detached from steep slopes
or cliffs.
Topples: Topples are rocks and boulders that rotate forward and may become falls.
Complex: Any combination of landslide types.
The likelihood of a landslide in any given slide-prone location is largely dependent on the water
content of the soil or rock fill. Landslides may happen at any time of the year, especially during
rainy months when soils become saturated with water. Earthquakes can add to slope stress and
disrupt ground stability, thereby triggering landslides, usually in already slide-prone locations.
HAZARD PROFILES
Columbia County Multi-Jurisdictional Hazard Mitigation Plan 5-15
In addition, unconsolidated deposits of alluvial and glacial outwash materials are subject to
accelerated stream bank erosion and landslides.
Indicators of a possible landslide include:
springs, seeps, or wet ground that is not typically wet;
new cracks or bulges in the ground or pavement;
soil subsiding from a foundation;
secondary structures (decks, patios) tilting or moving away from main structures;
broken water line or other underground utility;
leaning structures that were previously straight;
offset fence lines;
sunken or dropped-down road beds;
rapid increase in stream levels, sometimes with increased turbidity;
rapid decrease in stream levels even though it is raining or has recently stopped; and
sticking doors and windows, visible spaces indicating frames out of plumb.
Landslides often occur in conjunction with other natural hazards, thereby exacerbating
conditions, as described below:
Shaking due to earthquakes can trigger events ranging from rock falls and topples to
massive slides.
Intense or prolonged precipitation that causes flooding can also saturate slopes and cause
failures leading to landslides.
Landslides into a reservoir can indirectly compromise dam safety, and a landslide can
even affect the dam itself.
Wildfires can remove vegetation from hillsides, significantly increasing runoff and
landslide potential.
5.3.3.2 History
Landslides and debris flows are common in Columbia County. Much of the terrain is hilly and
susceptible to slides; however, many slides take place in undeveloped areas and are unreported
or even unnoticed. A statewide survey of winter storm landslides during 1996 and 1997,
conducted by the Oregon Department of Geology and Mineral Industries (DOGAMI), reported
9,582 documented slides. The actual number was estimated to be many times the documented
number. (Goettel 2005)
Historically, long periods of winter rain and heavy snowfall in the mountains trigger landslides
(see Table 5-4 for winter storm history). These landslides affect county roads and key emergency
transportation routes.
HAZARD PROFILES
Columbia County Multi-Jurisdictional Hazard Mitigation Plan 5-16
A February 1996 winter storm triggered numerous slides in Columbia County. Slides interrupted
transportation routes in dozens of locations, including two emergency transportation routes, the
Scappoose-Vernonia Road (19 locations) and Apiary Road (four locations). (Goettel 2005)
The December 2007 winter storm caused 77 landslides and 41 debris flows in Columbia,
Clatsop, and Tillamook counties. In northwestern Columbia County, one or more small
landslides occurred triggering a debris flow that traveled approximately 1 mile and blocked a
drainage near Woodson on Highway 30. This blockage, combined with additional rainfall
resulted in a temporary lake (30-40 feet deep and 200 feet long). Woodson residents were
evacuated and Highway 30 was closed on December 11th 2007. A catastrophic debris flow
occurred when the embankment failed and engulfed Highway 30 and Woodson. No fatalities
occurred.
Since this latest event small incidents continue to require occasional clean up and indicate that
landslides remain a constant hazard for county residents in the future.
5.3.3.3 Location
In general, the probability of slope failure increases with an increase in slope inclination.
However, this is not always the case. Depending on various factors such as soil type and water
content, a slope having a relatively low inclination could be at greater risk of failure than another
slope having a relatively high inclination. Other factors that influence susceptibility include:
rock type; vegetative cover and type; slope aspect; permeability and rate of infiltration;
proximity to seismic sources; and magnitude of seismic events. In addition, unconsolidated
deposits of alluvial and glacial outwash materials are subject to accelerated stream bank erosion
and landslides. The possibility of failure also increases in sloped areas in which human
influences, such as cutbacks, have occurred. Figures I-4 through I-4H show landslide hazard
areas.
5.3.3.4 Extent
The Oregon Department of Forestry (ODF) conducted a 3-year study of the impacts of landslides
for two 1996 winter storms, entitled, Storm Impacts and Landslides of 1996: Final Report. The
ODF study included eight study areas, one of which was in Columbia County, but did not
provide a detailed inventory of landslide prone areas in Columbia County, outside of the very
small study area. This study concluded that the highest hazard for shallow rapid landslides in
western Oregon occurs on slopes of over 70% to 80% steepness (depending on landform and
geology).
The geographic extent of landslide events is essentially the same as slide location, while the
effects depend on what infrastructure is in the way of a slide, as well as the magnitude and force
of the slide itself. The extent of effects could be as limited as one building or property, to
region-wide effects, as in the case of a major transportation disruption, slide-induced dam failure,
or utility outage.
Rapidly moving landslides have the greatest potential to endanger human life or inflict serious
injury, especially to those living in or traveling through rapidly moving slide prone areas. Slow
moving slides are less likely to inflict serious human injuries, but can cause property damage.
(ONHW 2006)
HAZARD PROFILES
Columbia County Multi-Jurisdictional Hazard Mitigation Plan 5-17
5.3.3.5 Probability of Future Events
Landslides are an annual occurrence in Oregon during the rainy months, October through April.
They generally result from intense or prolonged rainfall, particularly during a rain on snow
event. Slope alteration and shape can also be a recurrence interval factor. Oregon’s Enhanced
Natural Hazard Mitigation Plan states that, “Landslide recurrence interval is highly variable” and
is terrain dependent. Recurrence intervals for steep terrain can range from 50-5,000 years, with
some debris flow recurrence intervals of less than 10 years.
5.3.4 Wildfires
5.3.4.1 Nature
Wildfires can be classified as wildland fires, wildland/urban interface (or intermix) fires, urban
fires, and prescribed fires. Due to the large amount of forested land in Columbia County, both
wildland fires and wildland/urban interface fires are significant hazards.
Wildland fires spread through the consumption of vegetation. They often begin unnoticed,
spread quickly, and are usually signaled by dense smoke that may be visible for miles around.
Wildland fires can be caused by human activities such as arson or campfires, or by natural events
like lightning. Wildland fires often occur in forests or other areas with ample vegetation. When
a wildland fire spreads to developed areas such as suburbs, small communities, or isolated
homes, it becomes a wildland/urban interface fire.
The following three factors contribute appreciably to wildland fire behavior and can be used to
identify hazards.
Topography: As slope increases, the rate of wildfire spread increases. South-facing
slopes are also subject to more solar radiation, making them drier and thereby
intensifying wildfire behavior. However, ridge tops can mark the end of a wildfire’s
spread, since fire spreads more slowly or may even be unable to spread downhill.
Fuel: The type and condition of vegetation plays a significant role in the occurrence and
spread of wildfires. Certain types of plants are more susceptible to burning or will burn
with greater intensity. Dense or overgrown vegetation increases the amount of
combustible material available to fuel the fire (referred to as the “fuel load”). The ratio
of living to dead plant matter is also important. The moisture content of both living and
dead plant matter decreases during periods of prolonged drought and greatly increases the
risk of fire. The fuel’s continuity, both horizontally and vertically, is also an important
factor. Forests with strong ladder fuels (understory growth between ground fuels and tree
crowns) are more likely to have major fires involving tree crowns. Forests with limited
ground fuels and little or no ladder fuels are much more likely to experience minor
ground fires than a fire involving tree crowns. (ONHW 2006)
Weather: The most variable factor affecting wildfire behavior is weather. Temperature,
humidity, wind and lightning can affect chances for ignition and spread of fire. Extreme
weather, such as high temperatures coupled with low humidity, can lead to devastating
wildfires. Conversely, cool temperatures and higher humidity often signal reduced
wildfire occurrence and easier containment of existing fires.
HAZARD PROFILES
Columbia County Multi-Jurisdictional Hazard Mitigation Plan 5-18
In Columbia County, wildland fires burn primarily vegetative fuels, outside highly urbanized
areas. Wildland fires can be categorized as occurring in the following locations:
Agricultural: Agricultural fires burn in areas where the primary fuels are flammable
cultivated crops, such as wheat. This type of fire tends to spread very rapidly, but is
relatively easy to suppress if adequate resources are available. Structures threatened, if
any, are generally those belonging to ranch and farm owners. There can also be
significant losses in agricultural products.
Forest: Forest fires are the classic wildland fire. These fires burn fuels composed
primarily of timber and associated fuels, such as brush, grass, logging residue and thick
stands of replanted trees. Due to variations in fuel and topography, this type of fire may
be extremely difficult and costly to suppress.
Wildland-Urban Interface: Fires involving the wildland-urban interface occur in areas
where urbanization and the presence of natural vegetation fuels allow a fire to spread
rapidly from natural fuels to structures and vice versa. Especially in the early stage of
such fires, structural fire suppression resources can be quickly overwhelmed, increasing
the number of structures destroyed. Such fires are known for the large number of
structures simultaneously exposed to fire. Nationally, wildland interface fires commonly
produce widespread losses.
Urban: While fires in urban areas rarely spread out of control, thanks to proximity to
fire-fighting resources and less fuel between buildings, urban conflagration is a hazard in
densely populated areas. Many of the same factors that influence hazard in wildland and
interface areas come into play in urban centers. Drought, high temperatures, and fuel
load are joined by factors such as flammable building materials, aging electrical wiring,
and closely packed structures to increase fire hazard. When combined with inadequate or
faulty firefighting equipment, staff shortages, or poor location data, urban fire risk factors
can set the stage for disaster.
Although thought of as a summer occurrence, wildland fires can, and do, occur during any month
of the year. The vast majority of wildland fires occur between July and October. Dry spells
during the winter months, especially when combined with the factors of winds or dead fuels,
result in fires that burn with alarming intensity and rate of spread. Common causes of wildland
fire include: lightning; equipment use; railroad activity; debris burning; arson; and improperly
extinguished cigarettes.
Wildland fires are part of the natural ecology and natural life cycles of wildlands. Fires create
open spaces with different habitats for both plants and animals than existed previously. Fires
also reduce fuel loads in areas, which in turn decreases the potential for large catastrophic fires.
(ONHW 2006) However, a wildland fire may grow into an emergency or disaster if not
promptly controlled. Even a small fire can threaten lives and resources and destroy property,
especially in heavily developed interface areas. Wildland fires may also harm livestock and pets.
In addition to threatening humans, animals, and infrastructure, wildfires in forested areas have a
severe impact on natural resources. Wildland fires strip the land of vegetation and destroy forest
resources. Soil exposed to intense heat may lose its capability to absorb moisture and support
life. Exposed soils erode quickly and enhance siltation of rivers and streams, thus increasing
flood potential, harming aquatic life and degrading water quality. Lands stripped of vegetation
are also subject to increased debris flow hazards, as discussed in the landslides hazard profile.
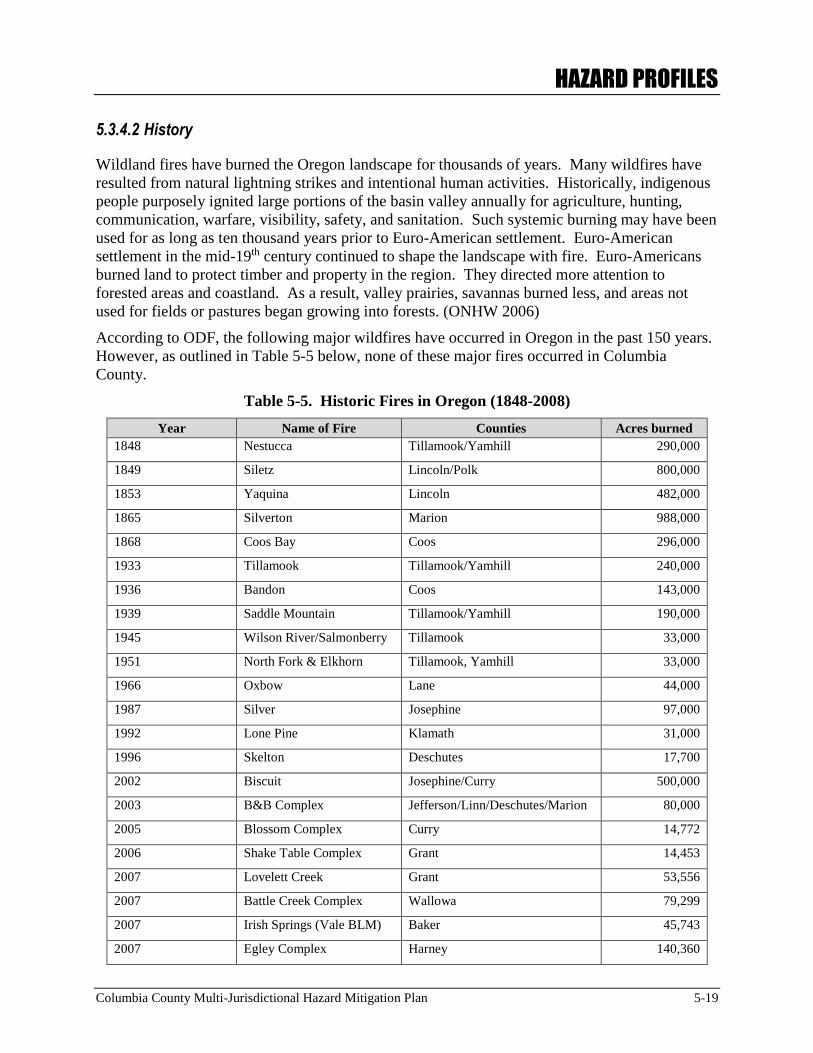
HAZARD PROFILES
Columbia County Multi-Jurisdictional Hazard Mitigation Plan 5-19
5.3.4.2 History
Wildland fires have burned the Oregon landscape for thousands of years. Many wildfires have
resulted from natural lightning strikes and intentional human activities. Historically, indigenous
people purposely ignited large portions of the basin valley annually for agriculture, hunting,
communication, warfare, visibility, safety, and sanitation. Such systemic burning may have been
used for as long as ten thousand years prior to Euro-American settlement. Euro-American
settlement in the mid-19th century continued to shape the landscape with fire. Euro-Americans
burned land to protect timber and property in the region. They directed more attention to
forested areas and coastland. As a result, valley prairies, savannas burned less, and areas not
used for fields or pastures began growing into forests. (ONHW 2006)
According to ODF, the following major wildfires have occurred in Oregon in the past 150 years.
However, as outlined in Table 5-5 below, none of these major fires occurred in Columbia
County.
Table 5-5. Historic Fires in Oregon (1848-2008)
Year Name of Fire Counties Acres burned
1848 Nestucca Tillamook/Yamhill 290,000
1849 Siletz Lincoln/Polk 800,000
1853 Yaquina Lincoln 482,000
1865 Silverton Marion 988,000
1868 Coos Bay Coos 296,000
1933 Tillamook Tillamook/Yamhill 240,000
1936 Bandon Coos 143,000
1939 Saddle Mountain Tillamook/Yamhill 190,000
1945 Wilson River/Salmonberry Tillamook 33,000
1951 North Fork & Elkhorn Tillamook, Yamhill 33,000
1966 Oxbow Lane 44,000
1987 Silver Josephine 97,000
1992 Lone Pine Klamath 31,000
1996 Skelton Deschutes 17,700
2002 Biscuit Josephine/Curry 500,000
2003 B&B Complex Jefferson/Linn/Deschutes/Marion 80,000
2005 Blossom Complex Curry 14,772
2006 Shake Table Complex Grant 14,453
2007 Lovelett Creek Grant 53,556
2007 Battle Creek Complex Wallowa 79,299
2007 Irish Springs (Vale BLM) Baker 45,743
2007 Egley Complex Harney 140,360
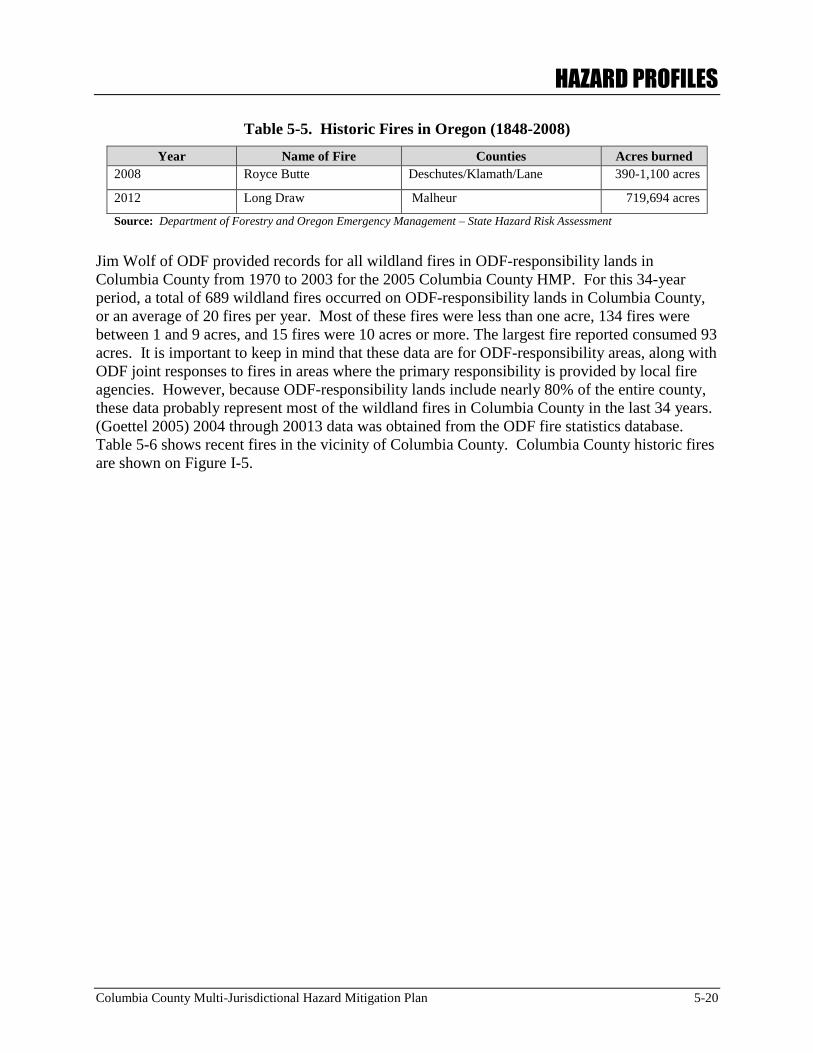
HAZARD PROFILES
Columbia County Multi-Jurisdictional Hazard Mitigation Plan 5-20
Table 5-5. Historic Fires in Oregon (1848-2008)
Year Name of Fire Counties Acres burned
2008 Royce Butte Deschutes/Klamath/Lane 390-1,100 acres
2012 Long Draw Malheur 719,694 acres
Source: Department of Forestry and Oregon Emergency Management – State Hazard Risk Assessment
Jim Wolf of ODF provided records for all wildland fires in ODF-responsibility lands in
Columbia County from 1970 to 2003 for the 2005 Columbia County HMP. For this 34-year
period, a total of 689 wildland fires occurred on ODF-responsibility lands in Columbia County,
or an average of 20 fires per year. Most of these fires were less than one acre, 134 fires were
between 1 and 9 acres, and 15 fires were 10 acres or more. The largest fire reported consumed 93
acres. It is important to keep in mind that these data are for ODF-responsibility areas, along with
ODF joint responses to fires in areas where the primary responsibility is provided by local fire
agencies. However, because ODF-responsibility lands include nearly 80% of the entire county,
these data probably represent most of the wildland fires in Columbia County in the last 34 years.
(Goettel 2005) 2004 through 20013 data was obtained from the ODF fire statistics database.
Table 5-6 shows recent fires in the vicinity of Columbia County. Columbia County historic fires
are shown on Figure I-5.
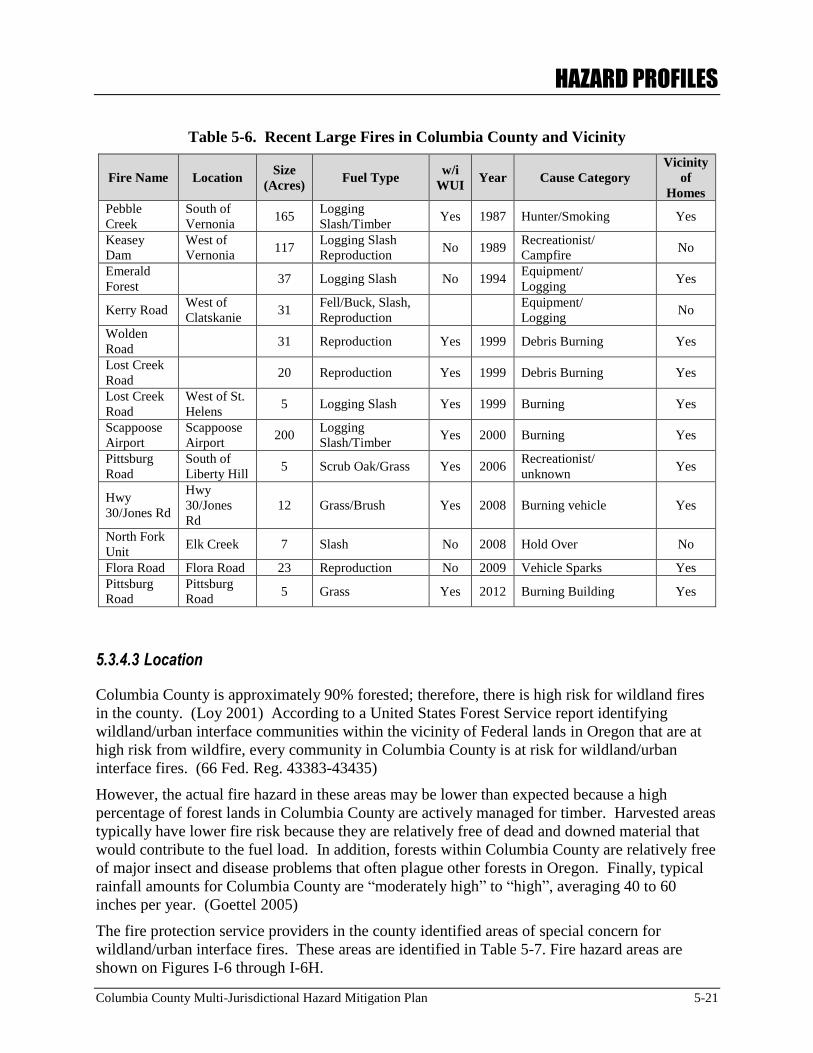
HAZARD PROFILES
Columbia County Multi-Jurisdictional Hazard Mitigation Plan 5-21
Table 5-6. Recent Large Fires in Columbia County and Vicinity
Fire Name Location Size
(Acres) Fuel Type
w/i
WUI Year Cause Category
Vicinity
of
Homes
Pebble
Creek
South of
Vernonia 165
Logging
Slash/Timber Yes 1987 Hunter/Smoking Yes
Keasey
Dam
West of
Vernonia 117
Logging Slash
Reproduction No 1989
Recreationist/
Campfire No
Emerald
Forest 37 Logging Slash No 1994
Equipment/
Logging Yes
Kerry Road West of
Clatskanie 31
Fell/Buck, Slash,
Reproduction
Equipment/
Logging No
Wolden
Road 31 Reproduction Yes 1999 Debris Burning Yes
Lost Creek
Road 20 Reproduction Yes 1999 Debris Burning Yes
Lost Creek
Road
West of St.
Helens 5 Logging Slash Yes 1999 Burning Yes
Scappoose
Airport
Scappoose
Airport 200
Logging
Slash/Timber Yes 2000 Burning Yes
Pittsburg
Road
South of
Liberty Hill 5 Scrub Oak/Grass Yes 2006
Recreationist/
unknown Yes
Hwy
30/Jones Rd
Hwy
30/Jones
Rd
12 Grass/Brush Yes 2008 Burning vehicle Yes
North Fork
Unit Elk Creek 7 Slash No 2008 Hold Over No
Flora Road Flora Road 23 Reproduction No 2009 Vehicle Sparks Yes
Pittsburg
Road
Pittsburg
Road 5 Grass Yes 2012 Burning Building Yes
5.3.4.3 Location
Columbia County is approximately 90% forested; therefore, there is high risk for wildland fires
in the county. (Loy 2001) According to a United States Forest Service report identifying
wildland/urban interface communities within the vicinity of Federal lands in Oregon that are at
high risk from wildfire, every community in Columbia County is at risk for wildland/urban
interface fires. (66 Fed. Reg. 43383-43435)
However, the actual fire hazard in these areas may be lower than expected because a high
percentage of forest lands in Columbia County are actively managed for timber. Harvested areas
typically have lower fire risk because they are relatively free of dead and downed material that
would contribute to the fuel load. In addition, forests within Columbia County are relatively free
of major insect and disease problems that often plague other forests in Oregon. Finally, typical
rainfall amounts for Columbia County are “moderately high” to “high”, averaging 40 to 60
inches per year. (Goettel 2005)
The fire protection service providers in the county identified areas of special concern for
wildland/urban interface fires. These areas are identified in Table 5-7. Fire hazard areas are
shown on Figures I-6 through I-6H.
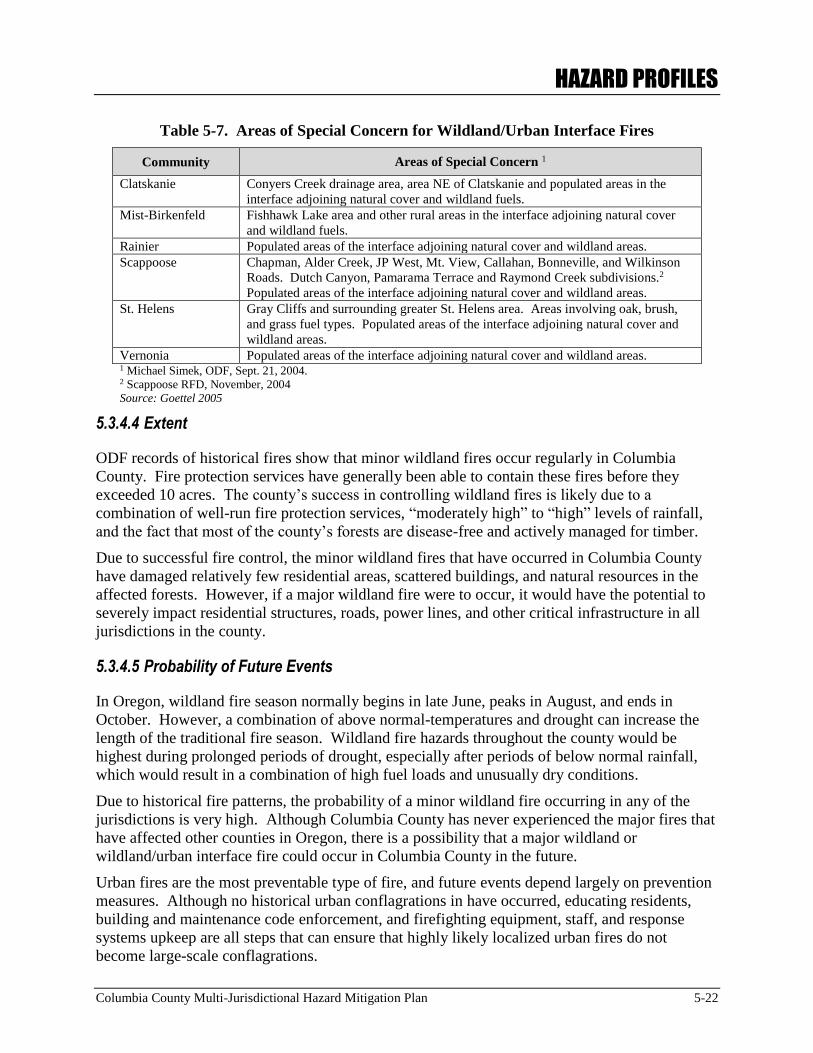
HAZARD PROFILES
Columbia County Multi-Jurisdictional Hazard Mitigation Plan 5-22
Table 5-7. Areas of Special Concern for Wildland/Urban Interface Fires
Community Areas of Special Concern 1
Clatskanie Conyers Creek drainage area, area NE of Clatskanie and populated areas in the
interface adjoining natural cover and wildland fuels.
Mist-Birkenfeld Fishhawk Lake area and other rural areas in the interface adjoining natural cover
and wildland fuels.
Rainier Populated areas of the interface adjoining natural cover and wildland areas.
Scappoose Chapman, Alder Creek, JP West, Mt. View, Callahan, Bonneville, and Wilkinson
Roads. Dutch Canyon, Pamarama Terrace and Raymond Creek subdivisions.2
Populated areas of the interface adjoining natural cover and wildland areas.
St. Helens Gray Cliffs and surrounding greater St. Helens area. Areas involving oak, brush,
and grass fuel types. Populated areas of the interface adjoining natural cover and
wildland areas.
Vernonia Populated areas of the interface adjoining natural cover and wildland areas. 1 Michael Simek, ODF, Sept. 21, 2004. 2 Scappoose RFD, November, 2004
Source: Goettel 2005
5.3.4.4 Extent
ODF records of historical fires show that minor wildland fires occur regularly in Columbia
County. Fire protection services have generally been able to contain these fires before they
exceeded 10 acres. The county’s success in controlling wildland fires is likely due to a
combination of well-run fire protection services, “moderately high” to “high” levels of rainfall,
and the fact that most of the county’s forests are disease-free and actively managed for timber.
Due to successful fire control, the minor wildland fires that have occurred in Columbia County
have damaged relatively few residential areas, scattered buildings, and natural resources in the
affected forests. However, if a major wildland fire were to occur, it would have the potential to
severely impact residential structures, roads, power lines, and other critical infrastructure in all
jurisdictions in the county.
5.3.4.5 Probability of Future Events
In Oregon, wildland fire season normally begins in late June, peaks in August, and ends in
October. However, a combination of above normal-temperatures and drought can increase the
length of the traditional fire season. Wildland fire hazards throughout the county would be
highest during prolonged periods of drought, especially after periods of below normal rainfall,
which would result in a combination of high fuel loads and unusually dry conditions.
Due to historical fire patterns, the probability of a minor wildland fire occurring in any of the
jurisdictions is very high. Although Columbia County has never experienced the major fires that
have affected other counties in Oregon, there is a possibility that a major wildland or
wildland/urban interface fire could occur in Columbia County in the future.
Urban fires are the most preventable type of fire, and future events depend largely on prevention
measures. Although no historical urban conflagrations in have occurred, educating residents,
building and maintenance code enforcement, and firefighting equipment, staff, and response
systems upkeep are all steps that can ensure that highly likely localized urban fires do not
become large-scale conflagrations.
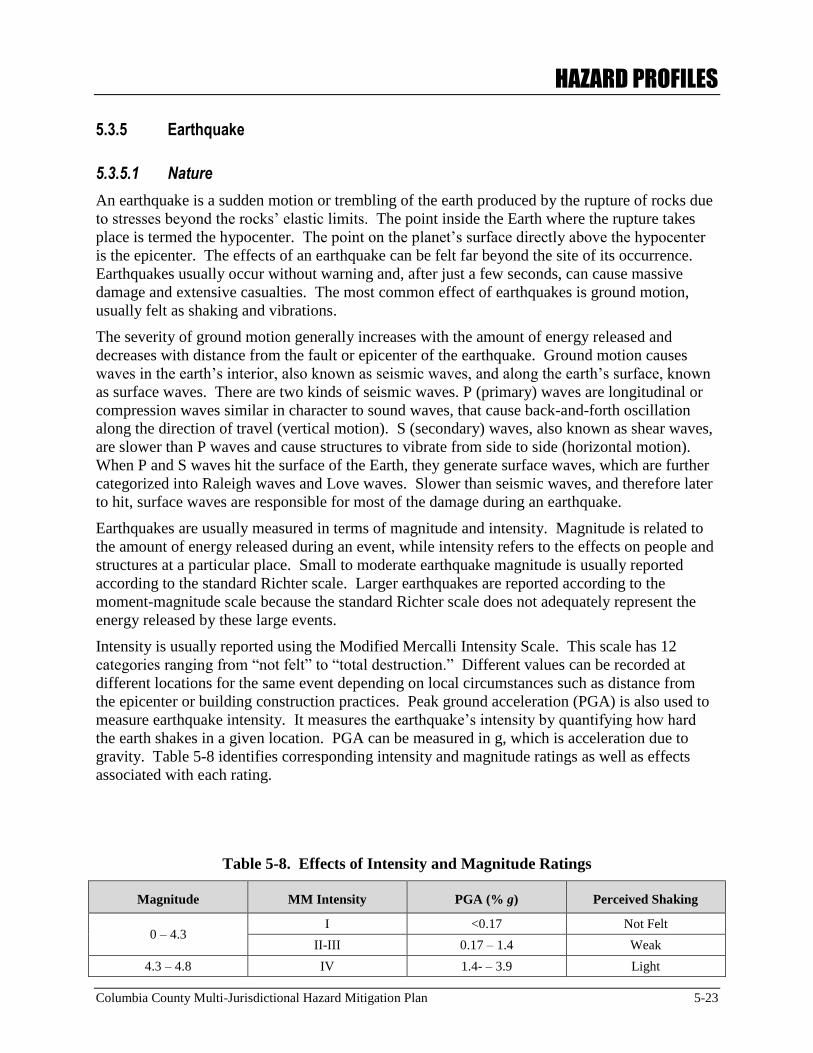
HAZARD PROFILES
Columbia County Multi-Jurisdictional Hazard Mitigation Plan 5-23
5.3.5 Earthquake
5.3.5.1 Nature
An earthquake is a sudden motion or trembling of the earth produced by the rupture of rocks due
to stresses beyond the rocks’ elastic limits. The point inside the Earth where the rupture takes
place is termed the hypocenter. The point on the planet’s surface directly above the hypocenter
is the epicenter. The effects of an earthquake can be felt far beyond the site of its occurrence.
Earthquakes usually occur without warning and, after just a few seconds, can cause massive
damage and extensive casualties. The most common effect of earthquakes is ground motion,
usually felt as shaking and vibrations.
The severity of ground motion generally increases with the amount of energy released and
decreases with distance from the fault or epicenter of the earthquake. Ground motion causes
waves in the earth’s interior, also known as seismic waves, and along the earth’s surface, known
as surface waves. There are two kinds of seismic waves. P (primary) waves are longitudinal or
compression waves similar in character to sound waves, that cause back-and-forth oscillation
along the direction of travel (vertical motion). S (secondary) waves, also known as shear waves,
are slower than P waves and cause structures to vibrate from side to side (horizontal motion).
When P and S waves hit the surface of the Earth, they generate surface waves, which are further
categorized into Raleigh waves and Love waves. Slower than seismic waves, and therefore later
to hit, surface waves are responsible for most of the damage during an earthquake.
Earthquakes are usually measured in terms of magnitude and intensity. Magnitude is related to
the amount of energy released during an event, while intensity refers to the effects on people and
structures at a particular place. Small to moderate earthquake magnitude is usually reported
according to the standard Richter scale. Larger earthquakes are reported according to the
moment-magnitude scale because the standard Richter scale does not adequately represent the
energy released by these large events.
Intensity is usually reported using the Modified Mercalli Intensity Scale. This scale has 12
categories ranging from “not felt” to “total destruction.” Different values can be recorded at
different locations for the same event depending on local circumstances such as distance from
the epicenter or building construction practices. Peak ground acceleration (PGA) is also used to
measure earthquake intensity. It measures the earthquake’s intensity by quantifying how hard
the earth shakes in a given location. PGA can be measured in g, which is acceleration due to
gravity. Table 5-8 identifies corresponding intensity and magnitude ratings as well as effects
associated with each rating.
Table 5-8. Effects of Intensity and Magnitude Ratings
Magnitude MM Intensity PGA (% g) Perceived Shaking
0 – 4.3 I <0.17 Not Felt
II-III 0.17 – 1.4 Weak
4.3 – 4.8 IV 1.4- – 3.9 Light
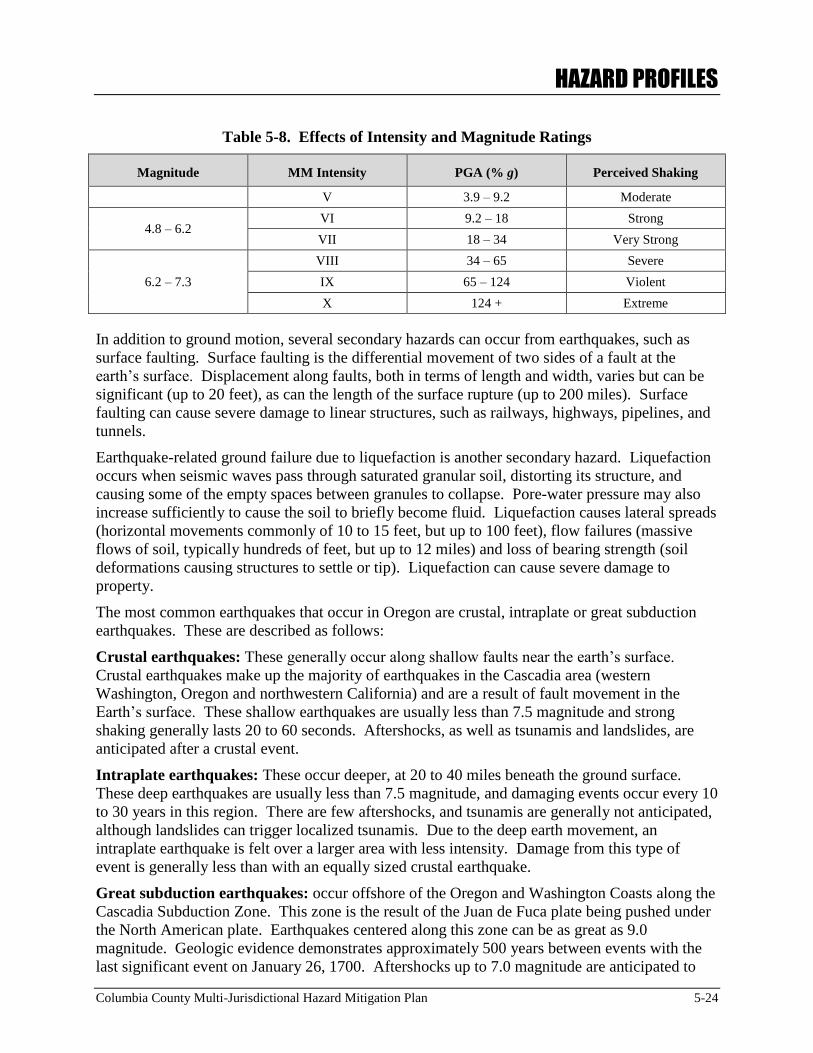
HAZARD PROFILES
Columbia County Multi-Jurisdictional Hazard Mitigation Plan 5-24
Table 5-8. Effects of Intensity and Magnitude Ratings
Magnitude MM Intensity PGA (% g) Perceived Shaking
V 3.9 – 9.2 Moderate
4.8 – 6.2 VI 9.2 – 18 Strong
VII 18 – 34 Very Strong
6.2 – 7.3
VIII 34 – 65 Severe
IX 65 – 124 Violent
X 124 + Extreme
In addition to ground motion, several secondary hazards can occur from earthquakes, such as
surface faulting. Surface faulting is the differential movement of two sides of a fault at the
earth’s surface. Displacement along faults, both in terms of length and width, varies but can be
significant (up to 20 feet), as can the length of the surface rupture (up to 200 miles). Surface
faulting can cause severe damage to linear structures, such as railways, highways, pipelines, and
tunnels.
Earthquake-related ground failure due to liquefaction is another secondary hazard. Liquefaction
occurs when seismic waves pass through saturated granular soil, distorting its structure, and
causing some of the empty spaces between granules to collapse. Pore-water pressure may also
increase sufficiently to cause the soil to briefly become fluid. Liquefaction causes lateral spreads
(horizontal movements commonly of 10 to 15 feet, but up to 100 feet), flow failures (massive
flows of soil, typically hundreds of feet, but up to 12 miles) and loss of bearing strength (soil
deformations causing structures to settle or tip). Liquefaction can cause severe damage to
property.
The most common earthquakes that occur in Oregon are crustal, intraplate or great subduction
earthquakes. These are described as follows:
Crustal earthquakes: These generally occur along shallow faults near the earth’s surface.
Crustal earthquakes make up the majority of earthquakes in the Cascadia area (western
Washington, Oregon and northwestern California) and are a result of fault movement in the
Earth’s surface. These shallow earthquakes are usually less than 7.5 magnitude and strong
shaking generally lasts 20 to 60 seconds. Aftershocks, as well as tsunamis and landslides, are
anticipated after a crustal event.
Intraplate earthquakes: These occur deeper, at 20 to 40 miles beneath the ground surface.
These deep earthquakes are usually less than 7.5 magnitude, and damaging events occur every 10
to 30 years in this region. There are few aftershocks, and tsunamis are generally not anticipated,
although landslides can trigger localized tsunamis. Due to the deep earth movement, an
intraplate earthquake is felt over a larger area with less intensity. Damage from this type of
event is generally less than with an equally sized crustal earthquake.
Great subduction earthquakes: occur offshore of the Oregon and Washington Coasts along the
Cascadia Subduction Zone. This zone is the result of the Juan de Fuca plate being pushed under
the North American plate. Earthquakes centered along this zone can be as great as 9.0
magnitude. Geologic evidence demonstrates approximately 500 years between events with the
last significant event on January 26, 1700. Aftershocks up to 7.0 magnitude are anticipated to
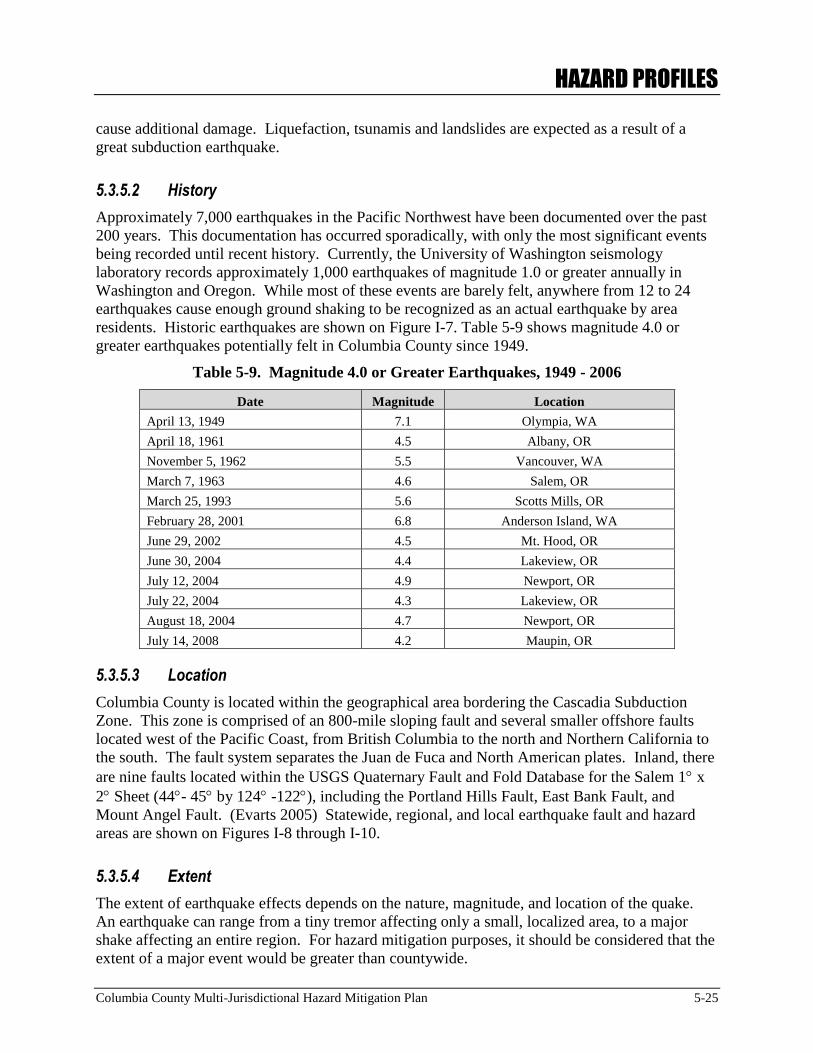
HAZARD PROFILES
Columbia County Multi-Jurisdictional Hazard Mitigation Plan 5-25
cause additional damage. Liquefaction, tsunamis and landslides are expected as a result of a
great subduction earthquake.
5.3.5.2 History
Approximately 7,000 earthquakes in the Pacific Northwest have been documented over the past
200 years. This documentation has occurred sporadically, with only the most significant events
being recorded until recent history. Currently, the University of Washington seismology
laboratory records approximately 1,000 earthquakes of magnitude 1.0 or greater annually in
Washington and Oregon. While most of these events are barely felt, anywhere from 12 to 24
earthquakes cause enough ground shaking to be recognized as an actual earthquake by area
residents. Historic earthquakes are shown on Figure I-7. Table 5-9 shows magnitude 4.0 or
greater earthquakes potentially felt in Columbia County since 1949.
Table 5-9. Magnitude 4.0 or Greater Earthquakes, 1949 - 2006
Date Magnitude Location
April 13, 1949 7.1 Olympia, WA
April 18, 1961 4.5 Albany, OR
November 5, 1962 5.5 Vancouver, WA
March 7, 1963 4.6 Salem, OR
March 25, 1993 5.6 Scotts Mills, OR
February 28, 2001 6.8 Anderson Island, WA
June 29, 2002 4.5 Mt. Hood, OR
June 30, 2004 4.4 Lakeview, OR
July 12, 2004 4.9 Newport, OR
July 22, 2004 4.3 Lakeview, OR
August 18, 2004 4.7 Newport, OR
July 14, 2008 4.2 Maupin, OR
5.3.5.3 Location
Columbia County is located within the geographical area bordering the Cascadia Subduction
Zone. This zone is comprised of an 800-mile sloping fault and several smaller offshore faults
located west of the Pacific Coast, from British Columbia to the north and Northern California to
the south. The fault system separates the Juan de Fuca and North American plates. Inland, there
are nine faults located within the USGS Quaternary Fault and Fold Database for the Salem 1 x
2 Sheet (44- 45 by 124 -122), including the Portland Hills Fault, East Bank Fault, and
Mount Angel Fault. (Evarts 2005) Statewide, regional, and local earthquake fault and hazard
areas are shown on Figures I-8 through I-10.
5.3.5.4 Extent
The extent of earthquake effects depends on the nature, magnitude, and location of the quake.
An earthquake can range from a tiny tremor affecting only a small, localized area, to a major
shake affecting an entire region. For hazard mitigation purposes, it should be considered that the
extent of a major event would be greater than countywide.
HAZARD PROFILES
Columbia County Multi-Jurisdictional Hazard Mitigation Plan 5-26
During the rainy winter season, an earthquake may trigger a landslide. Areas with steep slopes
and loose rock are most susceptible. The Cities of St. Helens, Columbia City, and Scappoose,
may be subject to earthquake-induced landslides. To date, these “high” landslide potential areas
of have received little development; although some residential areas are present.
Overall, an earthquake may affect water and sewer systems, natural gas lines, and
power/electrical systems.
5.3.5.5 Probability of Future Events
Geological evidence indicates that damaging earthquakes (M 8.0 to M 9.0) may have occurred at
least seven times in the last 3,500 years, suggesting a return interval of 300 to 600 years. While
it is impossible to predict when an earthquake may occur, it is highly probable (1 event in 35
years) that a moderate earthquake (M 4.0 and greater) will occur along the Cascadia Subduction
Zone, thereby affecting the jurisdictions in Columbia County.
Shaking hazard maps produced by the USGS consider two alternative scenarios for damaging
earthquakes (M 8.3 or M 9.0) along the subduction zone. The shaking hazard maps show the
level of ground motion that has 1 chance in 475 of being exceeded each year, which is equal to a
10 percent probability of being exceeded in 50 years. Any place within the planning area may be
subject to earthquake. However, the jurisdictions in the western portion of Columbia County are
more likely to be impacted by a major quake, because of their closer proximity to the Cascadia
Subduction Zone. (Weldon 2003)
5.3.6 Volcano
5.3.6.1 Nature
A volcano is a vent or opening in the earth’s crust from which molten lava (magma), pyroclastic
materials, and volcanic gases are expelled onto the surface. Volcanoes and other volcanic
phenomena can unleash cataclysmic destructive power greater than nuclear bombs, and can pose
serious hazards if they occur in populated and/or cultivated regions. Ashfall and tephra, an
eruptive hazard, are of the greatest concern in Columbia County.
There are four general types of volcanoes found within a short distance of Columbia County:
Lava domes are domes that are formed when lava erupts and accumulates near the vent.
Cinder cones are cone-shaped and formed by accumulation of cinders, ash, and other
fragmented materials originating from an eruption.
Shield volcanoes are broad, gently sloping volcanic cones of flat domical shape, usually
several tens or hundreds of square miles in extent, built chiefly of overlapping and
interfingering basaltic lava flows.
Composite or stratovolcanoes are typically steep-sided, symmetrical cones of large
dimensions built of alternating layers of lava flows, volcanic ash, cinders, and blocks.
Most composite volcanoes have a crater at the summit containing a central vent or
clustered group of vents.
HAZARD PROFILES
Columbia County Multi-Jurisdictional Hazard Mitigation Plan 5-27
Along with the different kinds of volcanoes there are different types of eruptions. The type of
eruption is a major determinant of what physical results an event will create, and what hazards it
poses. Six main types of volcano hazards exist:
Volcanic gases are made up of water vapor (steam), carbon dioxide, ammonia, as well as
sulfur, chlorine, fluorine, boron, and several other compounds. Wind is the primary
source of dispersion for volcanic gases. Life, health, and property can be endangered
from volcanic gases within about six miles of a volcano. Acids, ammonia, and other
compounds present in volcanic gases can damage eyes and respiratory systems, and
heavier-than-air gases, such as carbon dioxide, can accumulate in closed depressions and
suffocate humans or animals.
Lahars are formed when loose masses of unconsolidated, wet debris become mobilized,
and are usually created by shield volcanoes and stratovolcanoes. Eruptions may trigger
one or more lahar directly by quickly melting snow and ice on a volcano or ejecting water
from a crater lake. More often, lahars are formed by intense rainfall during or after an
eruption. Rainwater can easily erode loose volcanic rock and soil on hillsides and in river
valleys. As a lahar moves farther away from a volcano, it will eventually begin to lose its
heavy load of sediment and decrease in size.
Landslides are common on stratovolcanoes because their massive cones typically rise
thousands of feet above the surrounding terrain, and are often weakened by the very
process that created the mountain – the rise and eruption of molten rock (magma). If the
moving rock debris is large enough and contains a large content of water and soil
material, the landslide may transform into a lahar and flow more than 50 miles from the
volcano.
Lava flows are streams of molten rock that erupt from a vent and move down slope.
Lava flows destroy everything in their path. However, deaths caused directly by lava
flows are uncommon because most move slowly, and flows usually do not travel far from
the source vent. Lava flows can bury homes and agricultural land under hardened rock,
obscuring landmarks and property lines.
Pyroclastic flows are dense mixtures of hot, dry rock fragments and gases that can reach
50 mph. Most pyroclastic flows include a ground flow composed of coarse fragments
and an ash cloud that can travel by wind. Escape from a pyroclastic flow is unlikely
because of the speed at which they move.
Tephra is a term describing any size of volcanic rock or lava that is expelled from a
volcano during an eruption. Large fragments generally fall back close to the erupting
vent, while particles of ash can be carried hundreds to thousands of miles away from the
source by wind. Ash clouds are common adaptations of tephra.
5.3.6.2 History
Mount St. Helens has been the most active volcano in the Cascade Range during the past 10,000
years. In Oregon, awareness of the potential for volcanic eruptions was greatly increased by the
May 18, 1980 eruption which killed 57 people. The upper portion of the summit collapsed in a
massive landslide triggered by volcanic tremors. That portion of the mountain is now a
HAZARD PROFILES
Columbia County Multi-Jurisdictional Hazard Mitigation Plan 5-28
horseshoe-shaped crater partially filled by a lava dome. Early 19th Century settlers in the region
witnessed eruptions occurring along the north flank area of the mountain.
As a result of the 1980 eruption and the far-reaching extent of the lateral blast, damage and
reconstruction exceeded $1 billion. The coverage area was 230 square miles and reached 17
miles northwest of the crater. Impacts from pyroclastic flows covered six square miles and
reached 5 miles north of the crater, and landslides covered 23 square miles. Lahars (mudflows)
affected the North and South Forks of the Toutle River, the Green River, and ultimately the
Columbia River as far as 70 miles from the volcano.
Mount St Helens’ most recent eruption began in October of 2004, with initial steam and ash
eruptions giving away to slow-moving lava flows which ceased in January of 2008.
Mount Hood erupted in approximately 1805. Two other minor eruption periods occurred during
the last 500 years with some lava flow near the summit. The eruptions created pyroclastic flows
and lahars with little ash fall. (State Interagency Hazard Mitigation Team 2006) The other
volcanoes in the Pacific Northwest have undergone similar formation and eruption cycles.
5.3.6.3 Location
The extensive north-south oriented chain of volcanoes known as the Cascadia volcanic arc, or
Cascade Range were formed by the Cascadia subduction zone. As the seafloor plate sinks
beneath the North American Plate, it heats up and begins to melt, providing a vast reservoir of
the heat and molten rock that create the magma chambers that become volcanoes.
Volcanoes near Columbia County include Mount St. Helens, Mt. Hood, Mt. Rainier, and Mt.
Adams. The first three are active, and Mt. Adams is potentially active. Columbia County is
approximately 40 miles from Mount St. Helens, and further away from the other volcanoes.
Historic volcanic eruptions are shown on Figure I-11.
5.3.6.4 Extent
The volcanoes nearest to Columbia County are far enough away that none of the more
devastating near source hazards are likely to be experienced. Heavier tephra particles will
generally not reach Columbia County.
The major hazard for Columbia County is ashfall – either minor ash falls from an eruption of
Mount St. Helens or lesser ash falls from more distant volcanoes. Ashfall deposition is controlled
by prevailing wind direction, which in the Cascades is predominately from the west. During
previous eruptions, ashfall has drifted to the east of the volcanoes. (State Interagency Hazard
Mitigation Team 2006) Volcanic eruptions may impact water bodies, such as the Columbia River
at Longview and further downstream. River valleys are susceptible to debris flows, landslides,
and lahars; rivers may require dredging to maintain channel depths for navigation.
Mount St. Helens, a stratovolcano, is located in southwestern Washington and is believed to be
the volcano with the greatest potential to have a near-term impact on the region because of it’s
ongoing activity since the cataclysmic event in 1980. A large eruption of Mount St. Helens is
expected to eject tephra to altitudes of 12 to 20 miles, with a deposition area of 40,000 square
miles or more. Wind direction and velocity, along with the vigor and duration of the eruption,
will control the location, size, and shape of the area affected by tephra fall.
HAZARD PROFILES
Columbia County Multi-Jurisdictional Hazard Mitigation Plan 5-29
Mount St. Helens most recently erupted in October of 2004, pushing ash more than 10,000 ft into
the air, and lava flows continued until January 2008, after which activity ceased. The volcano
has been recently downgraded from “Advisory” to “Normal”, although another eruption in the
near future is highly likely.
5.3.6.5 Probability of Future Events
By careful analysis of past activity, geologists can make general forecasts of long-term activity
associated with individual volcanoes, but these are on the order of trends and likelihood, rather
than specific events or timeline. Short-range forecasts are often possible with greater accuracy.
Several signs of increasing activity can indicate that an eruption will follow within weeks or
months. Magma moving upward into a volcano often causes a significant increase in small,
localized earthquakes, and increased emissions of carbon dioxide and compounds of sulfur and
chlorine that can be measured. Shifts in magma depth and location can cause changes in ground
level elevation that can be detected through ground instrumentation or remote sensing.
The USGS has identified several other potentially active volcanoes in Washington, Oregon, and
California. The effects of volcanic activity from these volcanoes could include landslide
avalanches, lahars, tephra, lava, and pyroclastic flows or surges. Activity from one of these
volcanoes is highly likely in the near future.
5.3.7 Wind
5.3.7.1 Nature
Wind is air flow that travels horizontally with respect to the Earth’s surface. High winds are
defined as those that last longer than one hour at greater than 39 miles per hour (mph) or for any
length of time at greater than 57 mph. Wind speeds vary with individual storms.
In general, the damaging effects of windstorms may extend for distances of 100 to 300 miles
from the center of storm activity. Many buildings, utility and transportation systems in open
areas, natural grasslands, agricultural, or timberlands are especially vulnerable to wind damage.
Columbia County’s most devastating windstorms typically occur from the south.
5.3.7.2 History
Columbia County has a two-year recurrence interval of sustained winds speed that ranges from
37 to 43 mph. Winds of this velocity may cause significant damage at sites where local wind
speeds are higher than this average. Damage is more prevalent in clear-cut areas. The 50-year
recurrence interval winds speed range from 56 to 62 mph, which can cause widespread wind
damage.
Numerous damaging windstorms have occurred within Columbia County. Table 5-10 includes
some of the most noteworthy windstorms that brought extensive damage to the region. (NOAA
2008b)
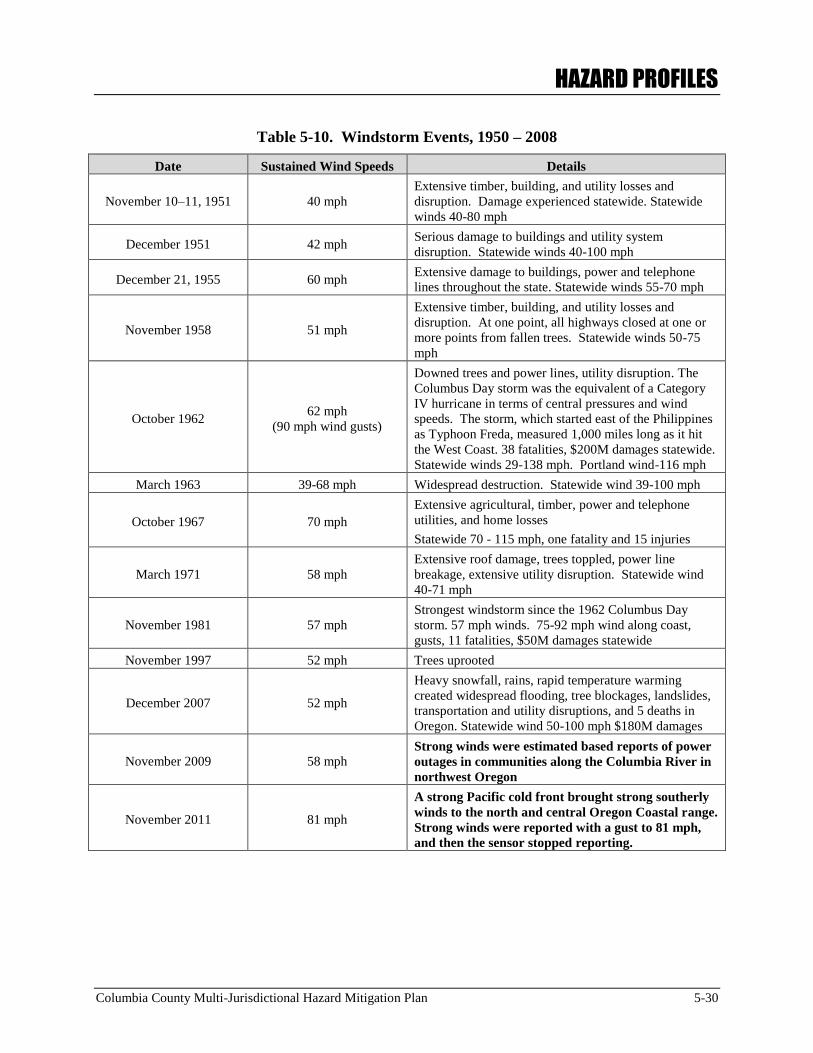
HAZARD PROFILES
Columbia County Multi-Jurisdictional Hazard Mitigation Plan 5-30
Table 5-10. Windstorm Events, 1950 – 2008
Date Sustained Wind Speeds Details
November 10–11, 1951 40 mph
Extensive timber, building, and utility losses and
disruption. Damage experienced statewide. Statewide
winds 40-80 mph
December 1951 42 mph Serious damage to buildings and utility system
disruption. Statewide winds 40-100 mph
December 21, 1955 60 mph Extensive damage to buildings, power and telephone
lines throughout the state. Statewide winds 55-70 mph
November 1958 51 mph
Extensive timber, building, and utility losses and
disruption. At one point, all highways closed at one or
more points from fallen trees. Statewide winds 50-75
mph
October 1962 62 mph
(90 mph wind gusts)
Downed trees and power lines, utility disruption. The
Columbus Day storm was the equivalent of a Category
IV hurricane in terms of central pressures and wind
speeds. The storm, which started east of the Philippines
as Typhoon Freda, measured 1,000 miles long as it hit
the West Coast. 38 fatalities, $200M damages statewide.
Statewide winds 29-138 mph. Portland wind-116 mph
March 1963 39-68 mph Widespread destruction. Statewide wind 39-100 mph
October 1967 70 mph
Extensive agricultural, timber, power and telephone
utilities, and home losses
Statewide 70 - 115 mph, one fatality and 15 injuries
March 1971 58 mph
Extensive roof damage, trees toppled, power line
breakage, extensive utility disruption. Statewide wind
40-71 mph
November 1981 57 mph
Strongest windstorm since the 1962 Columbus Day
storm. 57 mph winds. 75-92 mph wind along coast,
gusts, 11 fatalities, $50M damages statewide
November 1997 52 mph Trees uprooted
December 2007 52 mph
Heavy snowfall, rains, rapid temperature warming
created widespread flooding, tree blockages, landslides,
transportation and utility disruptions, and 5 deaths in
Oregon. Statewide wind 50-100 mph $180M damages
November 2009 58 mph Strong winds were estimated based reports of power
outages in communities along the Columbia River in
northwest Oregon
November 2011 81 mph
A strong Pacific cold front brought strong southerly
winds to the north and central Oregon Coastal range.
Strong winds were reported with a gust to 81 mph,
and then the sensor stopped reporting.
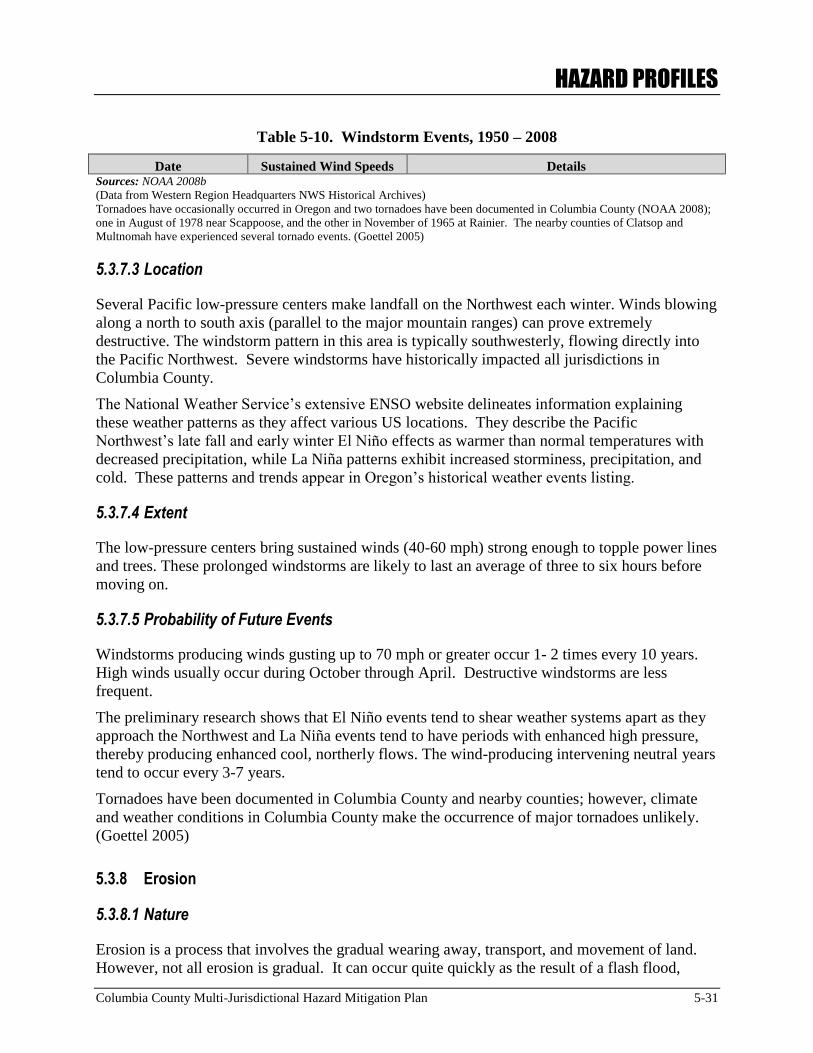
HAZARD PROFILES
Columbia County Multi-Jurisdictional Hazard Mitigation Plan 5-31
Table 5-10. Windstorm Events, 1950 – 2008
Date Sustained Wind Speeds Details Sources: NOAA 2008b
(Data from Western Region Headquarters NWS Historical Archives)
Tornadoes have occasionally occurred in Oregon and two tornadoes have been documented in Columbia County (NOAA 2008);
one in August of 1978 near Scappoose, and the other in November of 1965 at Rainier. The nearby counties of Clatsop and
Multnomah have experienced several tornado events. (Goettel 2005)
5.3.7.3 Location
Several Pacific low-pressure centers make landfall on the Northwest each winter. Winds blowing
along a north to south axis (parallel to the major mountain ranges) can prove extremely
destructive. The windstorm pattern in this area is typically southwesterly, flowing directly into
the Pacific Northwest. Severe windstorms have historically impacted all jurisdictions in
Columbia County.
The National Weather Service’s extensive ENSO website delineates information explaining
these weather patterns as they affect various US locations. They describe the Pacific
Northwest’s late fall and early winter El Niño effects as warmer than normal temperatures with
decreased precipitation, while La Niña patterns exhibit increased storminess, precipitation, and
cold. These patterns and trends appear in Oregon’s historical weather events listing.
5.3.7.4 Extent
The low-pressure centers bring sustained winds (40-60 mph) strong enough to topple power lines
and trees. These prolonged windstorms are likely to last an average of three to six hours before
moving on.
5.3.7.5 Probability of Future Events
Windstorms producing winds gusting up to 70 mph or greater occur 1- 2 times every 10 years.
High winds usually occur during October through April. Destructive windstorms are less
frequent.
The preliminary research shows that El Niño events tend to shear weather systems apart as they
approach the Northwest and La Niña events tend to have periods with enhanced high pressure,
thereby producing enhanced cool, northerly flows. The wind-producing intervening neutral years
tend to occur every 3-7 years.
Tornadoes have been documented in Columbia County and nearby counties; however, climate
and weather conditions in Columbia County make the occurrence of major tornadoes unlikely.
(Goettel 2005)
5.3.8 Erosion
5.3.8.1 Nature
Erosion is a process that involves the gradual wearing away, transport, and movement of land.
However, not all erosion is gradual. It can occur quite quickly as the result of a flash flood,
HAZARD PROFILES
Columbia County Multi-Jurisdictional Hazard Mitigation Plan 5-32
coastal storm, or other event. Most of the geomorphic change that occurs in a river system is in
response to a peak flow event. It is a natural process but its effects can be exacerbated by human
activity.
Erosion is a problem in developed areas where the disappearing land threatens development and
infrastructure. There are three main types of erosion that affect human activity in Oregon.
Coastal erosion is the wearing away of land and loss of beach, shoreline, or dune
material because of natural activity or man-made influences. It can occur gradually or
suddenly. Usually erosion is a long-term process, but it can also happen quickly during
storm events.
Wind erosion occurs when wind removes, moves, and redeposits soil. It can cause a loss
of topsoil, hindering agricultural production. Blowing dust can also reduce visibility and
have a negative effect on air quality.
Riverine erosion results from the force of flowing water in, and adjacent to, river, creek,
and tributary channels. This erosion affects the bed and banks of the channel and can alter
or preclude any channel navigation or embankment development. In less stable braided
channel reaches, erosion and material deposition are a constant issue. In more stable
meandering channels, episodes of erosion may only occur occasionally.
Riverine and wind erosion threaten various communities along the rivers, creeks, and tributaries
in Columbia County. Erosion of any type rarely causes death or injury. However, erosion can
cause significant destruction to property and infrastructure. The Columbia River is subject to
tidal influences in the far distant lower river. Additionally, a major river reclamation project has
taken away part of the natural floodplain north of Clatskanie. This combination of a high tide
and reduced floodplain exacerbates flooding damages as these two conditions limit where excess
Clatskanie River water can flow during a high-flow flood event. Flooding and erosion scour
result from these two conditions.
Generally, erosion within the Columbia River occurs when the flow of the river changes and is
directed towards the banks or mid-channel islands. These changes can be caused by surface
wind stress and gravity waves during storm events (primarily severe winter storms), transporting
sediment by bottom currents. (Sternberg 1986)
The reduction in peak river-flows due to the construction of dams and reservoirs have reduced
the amount of sand reaching the lower river as well as reducing nearshore sediment movement in
many areas of the Columbia River. (Mitchell 2008, O’Conner, 2003)
Rivers constantly alter their courses, changing shape and depth, trying to find a balance between
the sediment transport capacity of the water and the sediment supply. This process is usually
seen as the wearing away of the water course’s banks and beds over a long time period.
Riverine erosion is often initiated by failure of an embankment causing high sediment loads, or
by heavy rainfall. This generates high volume and velocity run-off, which will concentrate in the
lower drainages within a river's catchment area. When the stress applied by these flows exceeds
the resistance of the embankment material, erosion will occur. As the sediment load increases,
fast-flowing waters will erode their banks downstream. Eventually, the river, creek, or tributary
becomes overloaded or velocity is reduced, leading to the deposition of sediment further
HAZARD PROFILES
Columbia County Multi-Jurisdictional Hazard Mitigation Plan 5-33
downstream or in dams and reservoirs. The deposition may eventually lead to the watercourse
developing a new channel.
While all rivers change in the long-term, short-term rates of change vary significantly. All rivers
can be categorized based on their ability to adjust their shape and gradient as either bedrock or
alluvial channels. Within Columbia County, the Columbia River is an alluvial channel. (Tetra
Tech 1992)
5.3.8.2 History
Erosion loss has historically occurred in Columbia County from landslides, stream bank failures,
and agricultural activities. All rivers and creeks are subject to erosion. Columbia County has over
200 rivers and creeks.
A series of dams were constructed along the Columbia River and its major tributaries from 1912
through the 1970s; the US Army Corps of Engineers dredged the Clatskanie River to
accommodate navigational concerns in 1924 and lowered the channel depth to -7.5 feet National
Geodetic Vertical Datum (NGVD) (referring to the elevation above or below mean sea level).
Periodic dredging occurred until 1968 to maintain the channel depth, and again in 1998 by the
City of Clatskanie.
The combination of dam construction, dredging, flow training device construction, and bank
stabilization projects has affected river velocities and sediment transport. Only limited major
alterations have occurred since 1970 to the lower river system. (Tetra Tech 1992)
The following descriptions provide a brief overview of historic erosion events in Columbia
County.
Sand Island, located east of the City of St. Helens in the Columbia River has experienced
annual erosion loss.
The shoreline at the Nehalem Street Bridge on the Clatskanie River lost 1.25 feet of depth
between 1981 and 1996.
A small side drainage coming into Conyer’s Creek from the west caused road culvert
damage. (City of Clatskanie, 1999)
5.3.8.3 Location
Columbia County has experienced erosion loss in several localized areas. Rivers, creeks, and
tributaries within the county are subject to the effects of erosion include the Columbia,
Clatskanie, and Nehalem Rivers, Beaver Creek, Conyer’s Creek, Fox Creek, Nice Creek, Owl
Creek, Rock Creek, and Bear Creek and several unidentified tributaries. The County experiences
annual rain and wind events which assail river shorelines combined with landslides and debris
flows within the watersheds, loss of plant cover in riparian areas, and river traffic induced
erosion, particularly during severe storm events.
Historic erosion hazard areas and community identified areas of potential erosion hazards are
identified in Figures I-12 through I-12G and in Table 5-11.
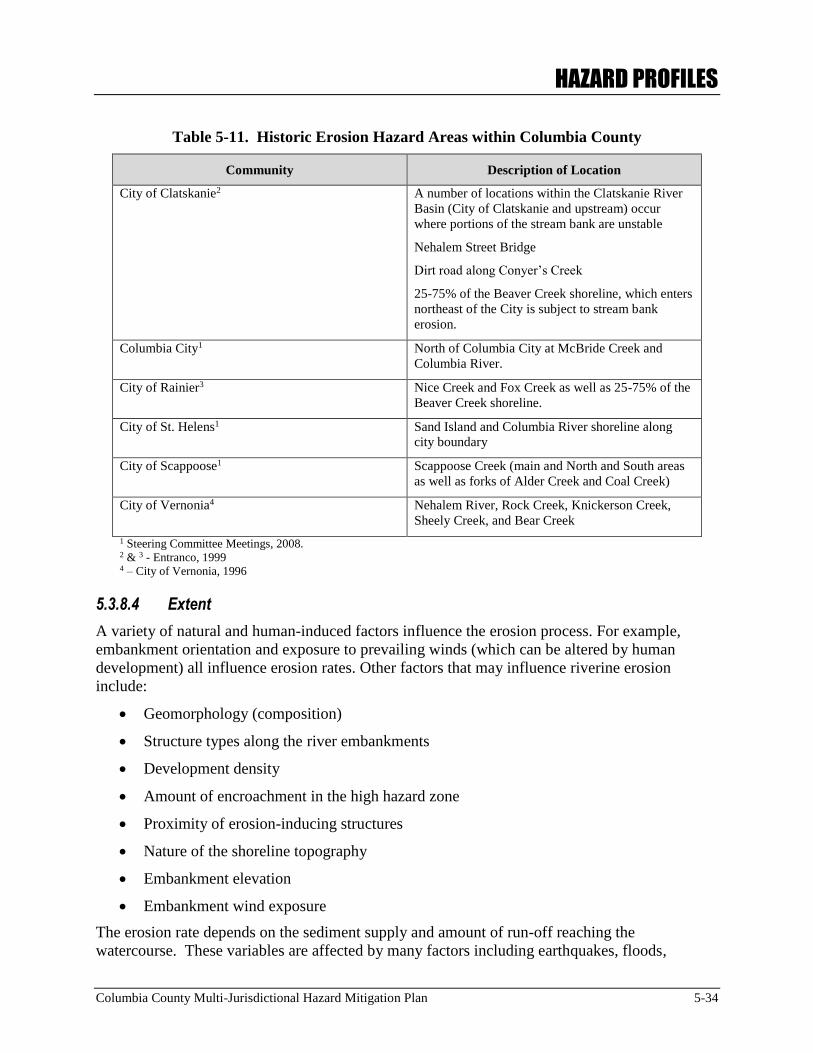
HAZARD PROFILES
Columbia County Multi-Jurisdictional Hazard Mitigation Plan 5-34
Table 5-11. Historic Erosion Hazard Areas within Columbia County
Community Description of Location
City of Clatskanie2 A number of locations within the Clatskanie River
Basin (City of Clatskanie and upstream) occur
where portions of the stream bank are unstable
Nehalem Street Bridge
Dirt road along Conyer’s Creek
25-75% of the Beaver Creek shoreline, which enters
northeast of the City is subject to stream bank
erosion.
Columbia City1 North of Columbia City at McBride Creek and
Columbia River.
City of Rainier3 Nice Creek and Fox Creek as well as 25-75% of the
Beaver Creek shoreline.
City of St. Helens1 Sand Island and Columbia River shoreline along
city boundary
City of Scappoose1 Scappoose Creek (main and North and South areas
as well as forks of Alder Creek and Coal Creek)
City of Vernonia4 Nehalem River, Rock Creek, Knickerson Creek,
Sheely Creek, and Bear Creek
1 Steering Committee Meetings, 2008. 2 & 3 - Entranco, 1999 4 – City of Vernonia, 1996
5.3.8.4 Extent
A variety of natural and human-induced factors influence the erosion process. For example,
embankment orientation and exposure to prevailing winds (which can be altered by human
development) all influence erosion rates. Other factors that may influence riverine erosion
include:
Geomorphology (composition)
Structure types along the river embankments
Development density
Amount of encroachment in the high hazard zone
Proximity of erosion-inducing structures
Nature of the shoreline topography
Embankment elevation
Embankment wind exposure
The erosion rate depends on the sediment supply and amount of run-off reaching the
watercourse. These variables are affected by many factors including earthquakes, floods,
HAZARD PROFILES
Columbia County Multi-Jurisdictional Hazard Mitigation Plan 5-35
climatic changes, loss of bank vegetation, urbanization, and the construction of civil works in the
waterway.
Erosion along the banks of the rivers and streams in Columbia County is generally caused by a
combination of factors:
The natural process of a watercourse to find the path of least resistance.
Debris flows within the watershed.
Loss of plant cover in of riparian areas.
Logging.
Increased boat traffic close to river embankments.
Runoff from rainfall.
While erosion has been identified as occurring within the county, only one event was reported to
result in damage (City of Clatskanie culvert at Conyer’s Creek). Additionally, the Clatskanie
River is reported to have lost 1.25 feet of depth over a 15-year period. Based on past events and
the lack of development in proximity to erosion hazard areas, the magnitude and severity of
erosion impacts in Columbia County are considered negligible.
5.3.8.5 Probability of Future Events
Based on historic events it is possible that structures located near the shoreline of the Columbia,
Clatskanie, and Nehalem Rivers, and numerous creeks and tributaries are vulnerable to erosion.
Erosion data is limited to localized geographic areas within the County.
5.3.9 El Niño/Southern Oscillation
ENSO comprise two weather phenomenon known as El Niño and La Niña. While ENSO
activities are not a hazard itself, it can lead to severe weather events and large-scale damage
throughout the jurisdictions in Columbia County. Direct correlations have been found linking
ENSO events to severe weather across the Pacific Northwest, particularly drought, flooding, and
severe winter storms. (State of Oregon 2004) Therefore, increased awareness and understanding
of the impacts of ENSO events on regional weather are important.
For more detailed discussions on drought, flood, and winter storms, please refer to their
respective sections in this chapter.
5.3.9.1 Nature
ENSO weather patterns portray periodic warming and cooling of the central Pacific Ocean. This
warming and cooling cycle has global implications as normal weather patterns are altered over
vast areas of the world, causing changes in temperature and precipitation from Chile to Indonesia
to the Pacific Northwest.
During El Niño periods, alterations in atmospheric pressure in equatorial regions yield an
increase in the surface temperature off the west coast of South America. This gradual warming
sets off a chain reaction affecting major air and water currents throughout the Pacific Ocean. In
HAZARD PROFILES
Columbia County Multi-Jurisdictional Hazard Mitigation Plan 5-36
the North Pacific, the Jet Stream is pushed north, carrying moisture laden air up and away from
its normal landfall along the Pacific Northwest coast. In Oregon, this shift results in reduced
precipitation and warmer temperatures, normally experienced several months after the initial
onset of the El Niño. (Taylor 2008a) These periods tend to last nine to twelve months, after
which surface temperatures begin to trend back towards the long-term average.
La Niña periods ensue when surface temperatures increase past the long-term average. Typical
weather patterns throughout the Pacific Ocean are strengthened, yielding stormier than normal
weather throughout the Pacific Northwest. Above average precipitation and colder temperatures
are experienced across Oregon during these periods, with the potential for severe snow storms
increasing. (Taylor 2008a) These periods generally last longer than El Niño events, taking
anywhere from one to three years to dissipate.
Both El Niño and La Niña periods tend to develop between March and June, and peak from
December to April. (NOAA 2005)
5.3.9.2 History
An examination of past ENSO patterns show El Niño and La Niña events are regularly observed
in Oregon. Direct correlations have been found linking precipitation, temperature, and snowfall
with ENSO across Oregon, including Columbia County (Taylor 2008a). In general, El Niño
periods result in warmer temperatures and lower precipitation, while La Niña periods are colder
and wetter. (Lubomudrov 2008)
Strong El Niños of 1982 and 1997 were observed throughout the state, and the El Niño in 1994
resulted in widespread drought conditions. Alternatively, severe flooding caused by the heavy
snow and intense rain in the winters of 1995-1996 and 1998-1999 were due to La Niñas. (State
of Oregon 2004)
5.3.9.3 Location
ENSO weather pattern effects are experienced on a global scale. Any local climate changes
experienced in Columbia County will be reflective of a much broader trend impacting the entire
Pacific Northwest. Hazards resulting from one of these periods will most likely be spread across
large regions of the state, with adjoining counties experiencing similar conditions.
5.3.9.4 Extent
Columbia County has a climate generally consisting of wet winters and dry summers. (Taylor
2008b) During El Niño years, decreased precipitation and increased temperatures throughout the
winter can lead to drought. Alternatively, increased precipitation and decreased temperatures
associated with La Niña periods can result in widespread flooding and severe winter storms.
5.3.9.5 Probability of Future Events
As climate scientists continue to unravel the oceanic and atmospheric relationships governing
ENSO, predictive powers are growing. 1997 marked the first time an El Niño was accurately
forecasted, and as more studies detail how ENSO impacts the Pacific Northwest, and Oregon in
particular, hazard mitigation agencies will benefit from increased warning time. ENSO generally
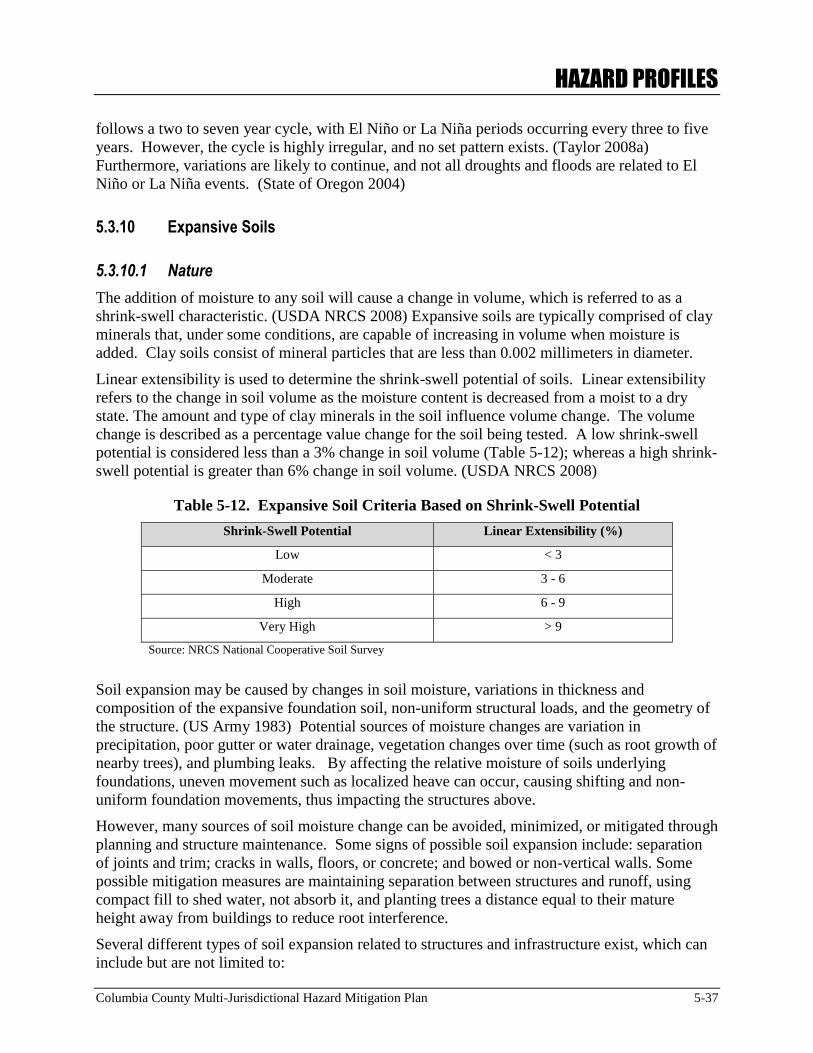
HAZARD PROFILES
Columbia County Multi-Jurisdictional Hazard Mitigation Plan 5-37
follows a two to seven year cycle, with El Niño or La Niña periods occurring every three to five
years. However, the cycle is highly irregular, and no set pattern exists. (Taylor 2008a)
Furthermore, variations are likely to continue, and not all droughts and floods are related to El
Niño or La Niña events. (State of Oregon 2004)
5.3.10 Expansive Soils
5.3.10.1 Nature
The addition of moisture to any soil will cause a change in volume, which is referred to as a
shrink-swell characteristic. (USDA NRCS 2008) Expansive soils are typically comprised of clay
minerals that, under some conditions, are capable of increasing in volume when moisture is
added. Clay soils consist of mineral particles that are less than 0.002 millimeters in diameter.
Linear extensibility is used to determine the shrink-swell potential of soils. Linear extensibility
refers to the change in soil volume as the moisture content is decreased from a moist to a dry
state. The amount and type of clay minerals in the soil influence volume change. The volume
change is described as a percentage value change for the soil being tested. A low shrink-swell
potential is considered less than a 3% change in soil volume (Table 5-12); whereas a high shrink-
swell potential is greater than 6% change in soil volume. (USDA NRCS 2008)
Table 5-12. Expansive Soil Criteria Based on Shrink-Swell Potential
Shrink-Swell Potential Linear Extensibility (%)
Low < 3
Moderate 3 - 6
High 6 - 9
Very High > 9
Source: NRCS National Cooperative Soil Survey
Soil expansion may be caused by changes in soil moisture, variations in thickness and
composition of the expansive foundation soil, non-uniform structural loads, and the geometry of
the structure. (US Army 1983) Potential sources of moisture changes are variation in
precipitation, poor gutter or water drainage, vegetation changes over time (such as root growth of
nearby trees), and plumbing leaks. By affecting the relative moisture of soils underlying
foundations, uneven movement such as localized heave can occur, causing shifting and non-
uniform foundation movements, thus impacting the structures above.
However, many sources of soil moisture change can be avoided, minimized, or mitigated through
planning and structure maintenance. Some signs of possible soil expansion include: separation
of joints and trim; cracks in walls, floors, or concrete; and bowed or non-vertical walls. Some
possible mitigation measures are maintaining separation between structures and runoff, using
compact fill to shed water, not absorb it, and planting trees a distance equal to their mature
height away from buildings to reduce root interference.
Several different types of soil expansion related to structures and infrastructure exist, which can
include but are not limited to:
HAZARD PROFILES
Columbia County Multi-Jurisdictional Hazard Mitigation Plan 5-38
Doming heave - upward, long-term, dome-shaped foundation movement that develops
over many years,
Cyclic heave - shrink and swell associated with seasonal or water leak events,
Edge heave - damaging edge or dish-shaped heaving, and
Lateral movement – lateral thrust of expansive soils.
5.3.10.2 History
In 1982, expansive soils were documented as the most costly natural hazard in the US, causing
more damage than all other natural hazards combined, including earthquakes, floods, tornadoes
and hurricanes. (FEMA 1982) Annual losses nationwide have been estimated between $2
billion and $9 billion. (Jones and Jones 1987) While expansive soils occur in Columbia County,
there have been no historic damages reported.
5.3.10.3 Location
In Columbia County, approximately 18,925 acres contain soils with “moderate” to “high” rated
shrink-swell potential, concentrated mainly in the northern portion of the county and along the
Columbia River.
Potential damages to structures from expansive soils in Columbia County include: cracks in
grade beams, walls, and drilled shafts; distortion and cracking of pavements and on-grade floor
slabs; failure of steel or concrete blocks supporting grade beams; jammed or misaligned doors
and windows; and buckling of basement and retaining walls due to lateral forces. Extensive
damage can potentially result in the condemnation of structures. (US Army 1983)
Expansive soil locations are shown on Figures I-13 through I-13D.
5.3.10.4 Extent
The geographic extent of expansive soil events are directly dependant on the extent of clay-based
expansive soil types and the size and type of moisture event that triggers the soil expansion.
Another dependant factor for the extent is the amount and type of infrastructure that exists at the
expansive soil location and near proximity, as well as the percentage volume change of the
swelling or shrinking soil. The extent of expansive soil effects could be very local and limited to
a single structure (i.e. resulting from a plumbing leak), or more landscape in nature due to a large
area of soil moisture change (i.e. resulting from a large flood or storm event).
5.3.10.5 Probability of Future Events
Expansive soil events are difficult to predict because the location and time when water is
available to the soil could happen at various periods in the life of a structure. Most soil
expansion and associated structural damage has been shown to occur within five to eight years
following construction. However, the effects of heave may also not be observed for many years
until some change occurs in the foundation conditions to disrupt the moisture regime. (PCCDD
2006) The probability of damages increases for structures on expansive soils if the climate,
HAZARD PROFILES
Columbia County Multi-Jurisdictional Hazard Mitigation Plan 5-39
effects of construction, and effects of occupancy promote moisture changes in the soil. (US
Army 1983)
5.3.11 Drought
5.3.11.1 Nature
Drought is variously defined as a period of abnormally dry weather creating hydrologic
imbalance, shortage of precipitation adversely affecting crops, or a period of below-average
water in streams and lakes, reservoirs, aquifers, and soils. (USGS 2008) There is no universal
measure of precipitation or dryness that signifies drought. Historically, droughts have been seen
as unpredictable and unavoidable events. Climate fluctuations occur everywhere, and periods of
low precipitation are a normal, recurrent feature of climate.
Drought is commonly referenced in terms of its effects on agriculture, with crop damage or
failure used to measure its effects. Other direct environmental effects of drought include
livestock death or decreased production, wildland fire, impaired productivity of forest land,
damage to fish habitat, loss of wetlands, and air quality effects. Indirect effects to society are
measured by the economic and physical hardships brought on by drought and by the increased
stress on residents of a drought-stricken area. (ONHW 2004) The economic impact of drought
is estimated between $6 and $8 billion annually in the United States. These costs primarily
affect agricultural, forestry, fisheries, recreation and tourism, transportation and energy sectors.
Drought is also associated with insect infestation, disease, and wind erosion. (ONHW 2006)
Drought is usually thought of as a meteorological phenomenon, resulting from abnormally low
precipitation. It can also be an institutional phenomenon, resulting from poor management of
water supply and reserves – an imbalance in supply and demand – and is often due to a
combination of these factors. Understanding drought as a recurring climate cycle is a first step
toward creating management practices that effectively mitigate its effects.
Drought is difficult to measure, due to its diverse geographical and temporal nature, and its
operation on many scales. Despite that difficulty, various indices for measuring and
characterizing drought can be useful. The Palmer Drought Indices and the Standardized
Precipitation Index are most commonly used. Palmer’s indices describe water balance—looking
at water supply (precipitation), demand (evapotranspiration), and loss (runoff)—on three scales;
weekly during growing season, long-term cumulative measured by month, and another long-term
scale that takes into account hydrological factors such as reservoir and groundwater levels.
These are the Crop Moisture Index, the Palmer Drought Severity Index, and the Palmer
Hydrological Drought Index, respectively. The Standardized Precipitation Index considers
precipitation alone, comparing the probability of a region’s receiving a given amount of
precipitation (based on historical levels) in a given time period with precipitation actually
recorded. (NOAA 2008d)
There are four types of drought: meteorological, agricultural, hydrological and socioeconomic.
Meteorological drought is based on the degree of dryness. Agricultural drought focuses the
amount of soil moisture versus the needs of the crops. Hydrological drought is associated with
shortfalls of surface and subsurface water supply. Socioeconomic drought refers to physical
water shortages and its human effect, and occurs when the need for water exceeds the supply
resulting in a shortfall. (ONHW 2006)
HAZARD PROFILES
Columbia County Multi-Jurisdictional Hazard Mitigation Plan 5-40
5.3.11.2 History
Drought occurs in all parts of Oregon, and has had profound effects in the past on the state’s
economy, particularly the agricultural and hydro-power sectors. Environmental consequences
have included insect infestations in forests, insufficient stream flows to support endangered fish
species, and increased susceptibility to fire.
The following past drought events were recorded for Columbia County:
1928-1941 – Statewide prolonged drought caused major agricultural problems
1976-1981 – Stream flows were low for western Oregon; 1976 and 1977 were the driest
years of the century.
1985- 1994 – Ten consecutive years of drought cause problems statewide; fires were
common and insects attacked trees; a drought emergency was declared in 1992.
1999 – Drought reduced spring and summer agriculture yields and delayed planting of
winter wheat. (NOAA 2008d)
2000-2001 – Severe drought conditions; October 2000 to February 2001 was the second
driest period of record in Washington and Oregon.
2005 – February 2005 was the driest since 1977. (ONHW 2006)
5.3.11.3 Location
Droughts occur in every climate zone, and can vary from region to region. Drought occurs in all
parts of Oregon, and has had profound effects on the state’s economy, particularly the
agricultural and hydro-power sectors. All jurisdictions in Columbia County are susceptible to
drought.
5.3.11.4 Extent
Drought is often associated with El Niño events affecting the polar and subtropical jet streams.
The polar jet stream dips southward causing the northwest to be drier than average. The severity
of drought depends on the degree of moisture deficiency, duration, and size of the affected area.
The agricultural sector is usually the first to feel the impacts of drought because of its
dependence on soil moisture. Those reliant on surface and groundwater sources are usually the
last to feel the effects of drought. (ONHW 2006)
5.3.11.5 Probability of Future Events
As part of a statewide HMP process, county emergency management program managers
conducted risk analyses to determine probability of, and vulnerability to, severe drought
occurrence in each county. Oregon’s Partnership for Disaster Resilience assesses Columbia
County as having an “average risk” for drought; a future drought affecting the planning area is
likely. (Partnership 2008)
Drought appears to be a cyclic part of the climate of Oregon, occurring in both summer and
winter, with an average recurrence interval between 8 and 12 years. Short-term, seasonal events
HAZARD PROFILES
Columbia County Multi-Jurisdictional Hazard Mitigation Plan 5-41
are more frequent, while the less frequent, long-term events have ranged from 3 to 12 years in
length.
Estimating drought probability and frequency is difficult, but understanding cyclic climate
variations and other variables that contribute to weather behavior is advancing. (State
Interagency Hazard Mitigation Team 2006) Understanding ENSO weather systems are helping
scientists to better predict weather changes in the Pacific Northwest.
5.3.12 Dam/Levee Failure
5.3.12.1 Nature
Dams are impervious artificial barriers typically constructed of earth, rock, concrete, or mine
tailings. The purpose of a dam is to divert water or impound (store) water, wastewater, or liquid-
borne materials for any one or a combination of several reasons including: flood control, human
water supply, irrigation, livestock water supply, energy generation, and containment of mine
tailings, recreation, and pollution control.
Dams can be embankment dams constructed with excavated natural materials or masonry dams
constructed with stone, brick or concrete blocks painted with mortar. Most dams are built at the
narrowest part of a river on a stable foundation made of concrete, rock, or compacted soil. The
abutments of a dam can be the natural valley walls or constructed of artificial materials when a
natural abutment is not suitable. There are several types of dams named for the primary material
used in construction, the primary purpose of the dam, and/or the way they are engineered to
function. Common types of dams include:
Diversion Dam: diverts water from one waterway to another waterway
Arch Dam: a concrete dam that is convex on the upstream side and concave on the
downstream side, taking advantage of the water load itself to compress the concrete, and
allowing the majority of water load to shift to the abutments
Overflow Dam: designed to be overtopped
Regulating Dam: designed to regulate water flow downstream
Gravity Dam: constructed of masonry materials wherein the weight and internal strength
provides stability
Levees are man-made structures, usually an earthen embankment, designed and constructed with
sound engineering practices to contain, control or divert the flow of water in order to provide
protection from temporary flooding. A levee is built parallel to a body of water (most often a
river) to protect the lives and properties behind it.
Dam inundation is the flooding that occurs resulting from the structural failure of a dam (breach)
or mis-operation (unscheduled release). Outlet works and spillways allow dam managers to
make scheduled releases when necessary, e.g., to prevent damaging flooding. Dam failures can
result from any one or a combination of the following causes:
Prolonged periods of rainfall and flooding
Seismic activity/Earthquake
HAZARD PROFILES
Columbia County Multi-Jurisdictional Hazard Mitigation Plan 5-42
Landslides into reservoir or onto dam itself
Inadequate spillway capacity, resulting in excess overtopping flows
Internal erosion caused by embankment or foundation leakage or piping
Improper design or construction
Improper maintenance or operation
Failure of upstream dams on the same waterway
Vegetation growth
Structural integrity loss from burrowing small animals
Dam failures can create flash floods that are catastrophic to life and property. Seismic activity
can directly cause dam failure, and can also generate a wave capable of overtopping a dam,
which may inundate the surrounding area but not cause dam failure. Two factors that influence
the potential severity of a full or partial dam failure include: (1) the amount of water impounded,
and (2) the density, type, and value of development and infrastructure located downstream.
The hazard potential for dams is determined by the downstream damage that could result from
improper operation or dam failure. It is important to note that neither the integrity of a dam nor
the probability of failure are considerations when determining the hazard potential. The hazard
potential rating for dams describes only the extent of expected losses if the dam were to fail.
Hazard potential categories are organized into three tiers:
High hazard: dam failure or improper operation would probably cause loss of life. Economic,
environmental, and lifeline losses are also likely but not necessary for this rating, which is based
solely on probable loss of life.
Significant hazard: dam failure or improper operation would cause property damage or
temporary loss of roads or utilities, with a remote chance of loss of life.
Low hazard: dams would have little or no effect to life and property downstream in the event of
failure or improper operation.
5.3.12.2 History
The National Performance of Dams Program records no dam failures for dams located in
Columbia County.
5.3.12.3 Location
Dams and reservoirs have been built throughout Columbia County primarily for the purposes of
irrigation and water diversion. The National Inventory of Dams (NID), maintained by the US
Army Corps of Engineers, is a database of all dams in the United States that either pose a
significant or high hazard, or that meet inclusion criteria for dam height and storage (exceed 25
feet in height and 15 acre-feet of storage, or exceed 6 feet in height and 50 acre-feet of storage).
There are many dams too small to be listed in the NID, but these small dams are not expected to
have significant impacts if they fail. The storage capacities of reservoirs and impoundments in
the planning area range from a few acre-feet to several thousand acre-feet. The water from most
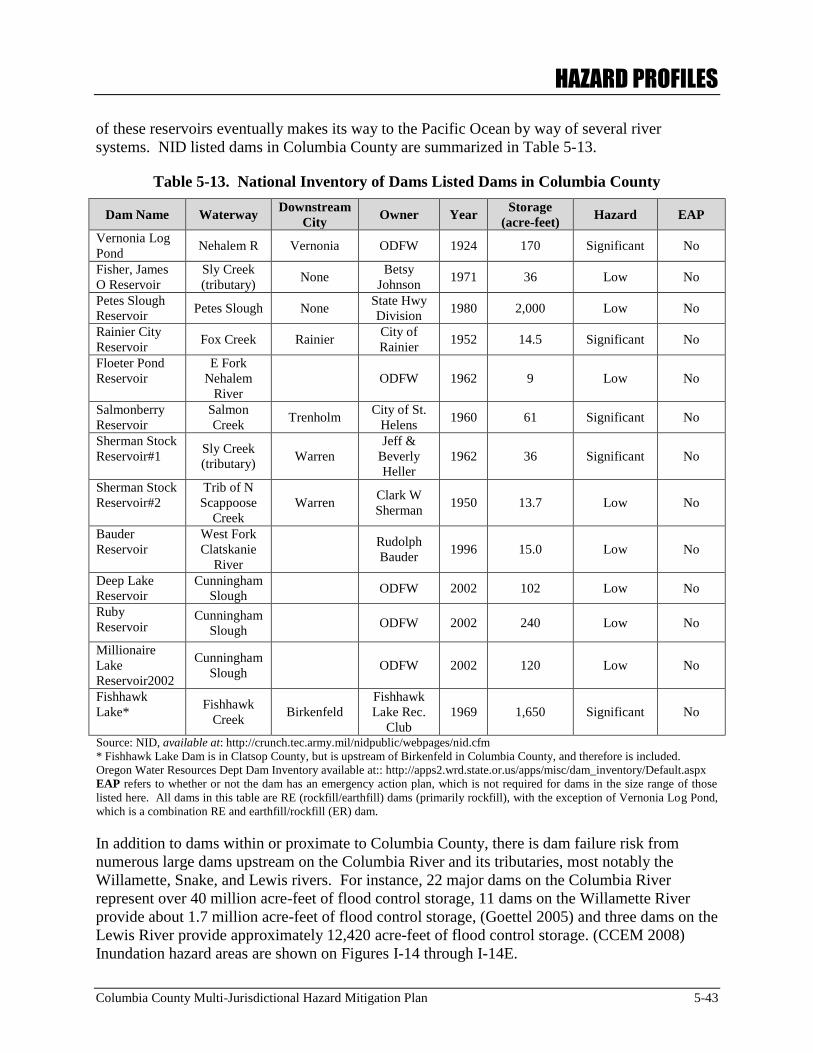
HAZARD PROFILES
Columbia County Multi-Jurisdictional Hazard Mitigation Plan 5-43
of these reservoirs eventually makes its way to the Pacific Ocean by way of several river
systems. NID listed dams in Columbia County are summarized in Table 5-13.
Table 5-13. National Inventory of Dams Listed Dams in Columbia County
Dam Name Waterway Downstream
City Owner Year
Storage
(acre-feet) Hazard EAP
Vernonia Log
Pond Nehalem R Vernonia ODFW 1924 170 Significant No
Fisher, James
O Reservoir
Sly Creek
(tributary) None
Betsy
Johnson 1971 36 Low No
Petes Slough
Reservoir Petes Slough None
State Hwy
Division 1980 2,000 Low No
Rainier City
Reservoir Fox Creek Rainier
City of
Rainier 1952 14.5 Significant No
Floeter Pond
Reservoir
E Fork
Nehalem
River
ODFW 1962 9 Low No
Salmonberry
Reservoir
Salmon
Creek Trenholm
City of St.
Helens 1960 61 Significant No
Sherman Stock
Reservoir#1 Sly Creek
(tributary) Warren
Jeff &
Beverly
Heller
1962 36 Significant No
Sherman Stock
Reservoir#2
Trib of N
Scappoose
Creek
Warren Clark W
Sherman 1950 13.7 Low No
Bauder
Reservoir
West Fork
Clatskanie
River
Rudolph
Bauder 1996 15.0 Low No
Deep Lake
Reservoir
Cunningham
Slough ODFW 2002 102 Low No
Ruby
Reservoir Cunningham
Slough ODFW 2002 240 Low No
Millionaire
Lake
Reservoir2002
Cunningham
Slough ODFW 2002 120 Low No
Fishhawk
Lake* Fishhawk
Creek Birkenfeld
Fishhawk
Lake Rec.
Club
1969 1,650 Significant No
Source: NID, available at: http://crunch.tec.army.mil/nidpublic/webpages/nid.cfm
* Fishhawk Lake Dam is in Clatsop County, but is upstream of Birkenfeld in Columbia County, and therefore is included.
Oregon Water Resources Dept Dam Inventory available at:: http://apps2.wrd.state.or.us/apps/misc/dam_inventory/Default.aspx
EAP refers to whether or not the dam has an emergency action plan, which is not required for dams in the size range of those
listed here. All dams in this table are RE (rockfill/earthfill) dams (primarily rockfill), with the exception of Vernonia Log Pond,
which is a combination RE and earthfill/rockfill (ER) dam.
In addition to dams within or proximate to Columbia County, there is dam failure risk from
numerous large dams upstream on the Columbia River and its tributaries, most notably the
Willamette, Snake, and Lewis rivers. For instance, 22 major dams on the Columbia River
represent over 40 million acre-feet of flood control storage, 11 dams on the Willamette River
provide about 1.7 million acre-feet of flood control storage, (Goettel 2005) and three dams on the
Lewis River provide approximately 12,420 acre-feet of flood control storage. (CCEM 2008)
Inundation hazard areas are shown on Figures I-14 through I-14E.
HAZARD PROFILES
Columbia County Multi-Jurisdictional Hazard Mitigation Plan 5-44
5.3.12.4 Extent
The extent of dam failure effects in the planning area can be assessed region-wide or by each
body of impounded water. Effects depend a great deal on the nature of the failure—for instance,
whether a dam fails when retaining a normal level of water, or whether water influx is involved
in the dam failure, which then involves a greater-than-usual volume of impounded water.
Likewise, whether a dam is overtopped, damaged, or fails completely will make a great
difference in volume of water released, and therefore in effects. An isolated dam failure, even a
significant release, may have less significant impact than a series of dam failures caused by
region-wide flooding.
Of the twelve dams within Columbia County, five of them would have a significant impact if
breached. The volume of water held by each of these strategically located dams is large enough
to create a chain reaction of flooding, property damage, and/or impairment of the local water
supplies. Oregon’s Water Resources Department advocates for a continued dialogue among dam
owners and municipalities to practice emergency planning procedures to ensure public safety
should such an event occur.
5.3.12.5 Probability of Future Events
Given that there are no recorded dam failure events in the county, it is impossible to predict the
probability of future events of dam failure with significant effects on the jurisdictions along the
waterways. The risk to the jurisdictions in Columbia County from upstream dams, and the
history of dam failures in those areas, has yet to be evaluated. Also, it is important to note that
global and regional climate change could alter the likelihood of dam failure in the planning area,
if increasing storms and rainfall were to significantly change water inflow.
5.3.13 Disruption of Utility and Transportation Systems
The 2009 Multi-Jurisdiction Hazard Mitigation Plan for Columbia County treated disruption of
utility and transportation systems as a separate hazard because, while such disruption is a
potential impact of each of the natural and human-caused hazards reviewed, its ramifications are
far-reaching and much broader than direct damage and direct loss of service. For continuity and
ease of comparison, this revised plan will do the same.
It is important to remember, in considering any of the other hazards profiled in this plan, that
disruption of utility and transportation systems should be viewed in addition to other impacts.
The probability, duration, extent, and risk associated with disruption of systems is described
below, and in some cases quantified. Electric power outages are dealt with in more detail than
other disruptions because loss of electric power has the most widespread effects on other
utilities.
5.3.13.1 Nature
The major transportation modes of significance to Columbia County are roads and railways.
Both are subject to disruption from the hazards already profiled in this plan: flood, dam failure,
landslide, earthquake, volcano, wind, fire, winter storm, infectious disease epidemic (quarantine,
public transit restrictions), hazardous materials incidents, and terrorism.
HAZARD PROFILES
Columbia County Multi-Jurisdictional Hazard Mitigation Plan 5-45
The ramifications of transportation system disruption range from effects on life, health, and
safety (emergency vehicle mobility, access to hospitals, access to evacuation routes, access to
vital supplies if transport is seriously disrupted for an extended period of time) to the economic
effects of delays, lost commerce, and lost time.
Similarly, disruption of utility systems can affect the county at the level of commerce and
recreation as well as at the level of fundamental health and safety. Analysis of potential utilities
disruptions is complicated because utilities like electric power, potable water, wastewater,
natural gas, and telecommunications are all networks, consisting of nodes (centers where
something happens) and links (connections between nodes). Networks typically have some level
of redundancy built in, and the amount and nature of alternate pathways determines the
robustness of the system to any particular disturbance. (Goettel 2005)
Many water treatment plants in Columbia County are located in flood-prone areas. Floodwater
inundation can cause raw water to circumvent and contaminate source wells and filtration and
treatment systems. Earthquakes can damage water storage, treatment, and transport systems.
Water systems are also extremely vulnerable to power outages. Storage tanks are usually located
60 to 200 feet above the water customer network, and water is pumped into these tanks using
electricity. Storage tanks typically contain one to two days’ supply of water. Power outages of
longer duration can result in a shortage of clean water for drinking and cooking—a basic
requirement for public health. (Goettel 2005)
Wastewater management is also crucial for public health, and wastewater systems are similarly
vulnerable to floods, earthquake damages, and power outages. Floods may cause collection
pipes to overflow, and can cause inflow that exceeds treatment plant capacity, resulting in release
of untreated or partially treated wastewater. Treatment plants are often located in low-lying
areas, which facilitates gravity flow of collected wastewater to the plant. However, this means
that treatment plants are often found in flood zones. Wastewater pipes and plants are subject to
earthquake damage, and loss of power can result in plant shutdown and releases of untreated or
partially treated water. (Goettel 2005) Public health hazards can be posed by backed up
wastewater and sewage, as well as by releases of untreated or incompletely treated wastewater.
Natural gas systems (compression stations and distribution pipes) are vulnerable to seismic
events, and compression stations are vulnerable to flood damage and power loss. Landslides,
too, can affect natural gas systems. (Goettel 2005) Where it is used for cooking or heating,
disruption of natural gas distribution will create difficulties. Leaks in enclosed areas present a
health hazard, and it is both flammable and explosive, attributes which are addressed in the
Hazardous Materials section.
Telecommunications systems (including telephone, broadcast radio and television, as well as
cable networks) are generally somewhat less vulnerable to hazards than other services, given that
few nodes (stations) are located in flood zones or landslide areas. Buried lines have more ability
to stretch than do gas and water lines, and can usually accommodate several feet of ground
movement before failing. Above-ground lines are vulnerable to falling trees or the failure of
poles, but disruptions are about 10 times less common than electrical line failures—partly
because electrical lines are the highest on utility poles and therefore the first to be hit by falling
trees and branches, and partly because the much lower voltage of communications lines makes
them much less vulnerable to arcing or shorting out if lines come very close to one another.
(Goettel 2005) Telecommunications failures can have devastating impacts on a community.

HAZARD PROFILES
Columbia County Multi-Jurisdictional Hazard Mitigation Plan 5-46
Emergency response systems at the individual level (fire, police, ambulance) as well as at the
disaster-response level rely on immediate, accurate communications.
Electrical power plants and transmission lines are vulnerable to most of the hazards covered in
this Plan. Flood, fire, earthquake, volcano, intentional sabotage and/or terrorism are all threats to
power sources and transmission and distribution lines. Columbia County has only one small
(530 megawatt) generating plant (near Clatskanie). The bulk of the County’s electrical power is
produced outside the county and transmitted via high-voltage transmission lines—most of which
are operated by the Bonneville Power Administration (BPA). BPA electricity comes from Corps
of Engineers and Bureau of Reclamation operated hydroelectric power plants, and from the
Pacific Interties, a high-voltage transmission system that moves electric power between
California, the Pacific Northwest, and western Canada. Electric power is pivotal to modern life.
Residential, commercial, and public facilities all rely heavily on electricity. Emergency facilities
such as hospitals and emergency response centers typically are equipped with backup generators
for critical life-support and communications functions. Nonetheless, the consequences of long-
term and widespread electrical power outages are significant. Other utility systems, discussed
above, are also dependent on electricity for normal operations, so loss of electric power can have
serious secondary effects. In addition, power outages longer than a few hours can greatly
increase the impact of riverine floods, as all of the drainage districts and drainage improvement
companies within Columbia County rely on pumping to keep diked areas dry, even during non-
flood conditions. (Goettel 2005)
5.3.13.2 History
System disruptions are deemed a secondary hazard or a result from a primary hazard event and
receive discussion in the natural hazards sections throughout this document.
5.3.13.3 Location
Columbia County has and relies upon modern infrastructure. Transportation and utility systems
are the basis of everyday life in both urban and rural areas of the county.
The County has worked with each community to identify critical system networks and links
which may experience critical failure from these technological hazards. To that end, all
jurisdictions communities have expressed that they have or are working to acquire emergency
generators, bury utility lines, and ensure fuel availability for their critical infrastructure’s
sustainability. Many of the communities have also identified the need to work with their utility
suppliers to encourage them to consider mitigating power line failure projects, developing plans
for fuel distribution, and water-waste treatment alternatives.
The most common countywide relied upon critical components are summarized below in Table
5-14.
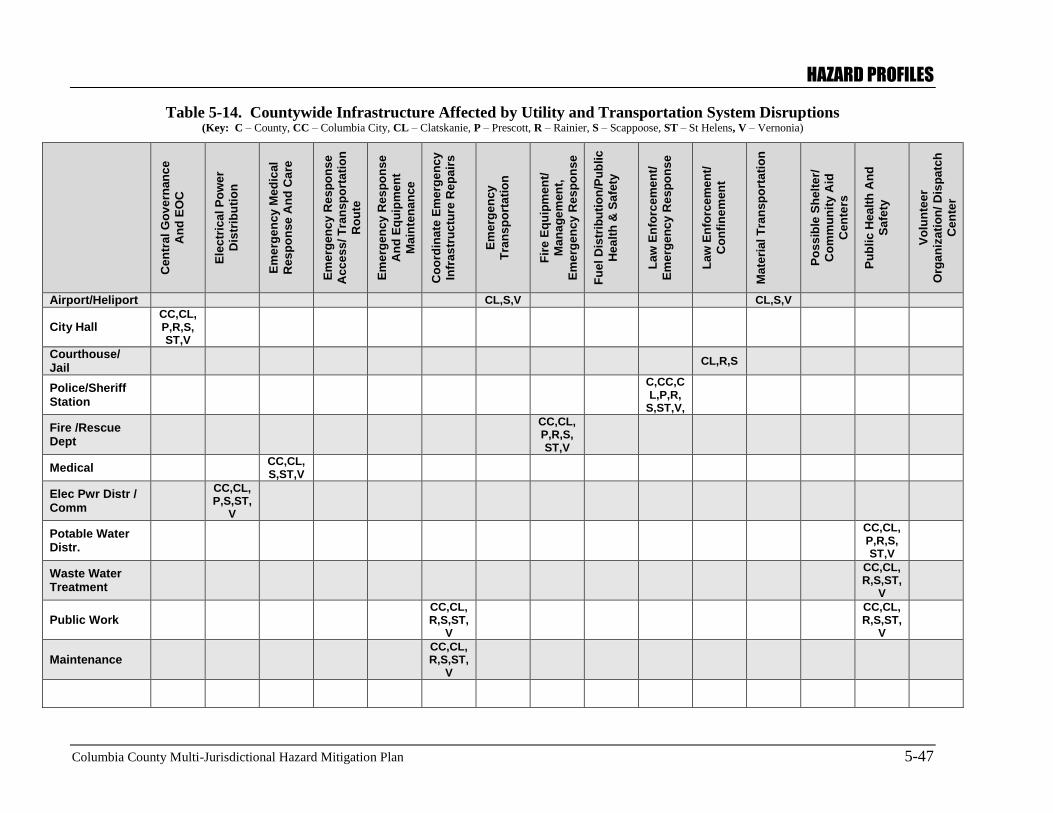
HAZARD PROFILES
Columbia County Multi-Jurisdictional Hazard Mitigation Plan 5-47
Table 5-14. Countywide Infrastructure Affected by Utility and Transportation System Disruptions (Key: C – County, CC – Columbia City, CL – Clatskanie, P – Prescott, R – Rainier, S – Scappoose, ST – St Helens, V – Vernonia)
Cen
tral
Go
ve
rnan
ce
An
d E
OC
Ele
ctr
ica
l P
ow
er
Dis
trib
uti
on
Em
erg
en
cy
Me
dic
al
Res
po
nse
An
d C
are
Em
erg
en
cy
Re
sp
on
se
Acc
es
s/ T
ran
sp
ort
ati
on
Ro
ute
Em
erg
en
cy
Re
sp
on
se
An
d E
qu
ipm
en
t
Ma
inte
na
nce
Co
ord
ina
te E
me
rge
nc
y
Infr
as
tru
ctu
re R
ep
air
s
Em
erg
en
cy
Tra
ns
po
rtati
on
Fir
e E
qu
ipm
en
t/
Ma
na
ge
men
t,
Em
erg
en
cy
Re
sp
on
se
Fu
el
Dis
trib
uti
on
/Pu
bli
c
Hea
lth
& S
afe
ty
La
w E
nfo
rce
me
nt/
Em
erg
en
cy
Re
sp
on
se
La
w E
nfo
rce
me
nt/
Co
nfi
ne
men
t
Ma
teri
al
Tra
nsp
ort
ati
on
Po
ss
ible
Sh
elt
er/
Co
mm
un
ity A
id
Cen
ters
Pu
bli
c H
ea
lth
An
d
Sa
fety
Vo
lun
tee
r
Org
an
iza
tio
n/
Dis
pa
tch
Cen
ter
Airport/Heliport CL,S,V CL,S,V
City Hall CC,CL,P,R,S,ST,V
Courthouse/ Jail
CL,R,S
Police/Sheriff Station
C,CC,CL,P,R,
S,ST,V,
Fire /Rescue Dept
CC,CL,P,R,S,ST,V
Medical CC,CL,S,ST,V
Elec Pwr Distr / Comm
CC,CL,P,S,ST,
V
Potable Water Distr.
CC,CL,P,R,S,ST,V
Waste Water Treatment
CC,CL,R,S,ST,
V
Public Work CC,CL,R,S,ST,
V
CC,CL,R,S,ST,
V
Maintenance CC,CL,R,S,ST,
V
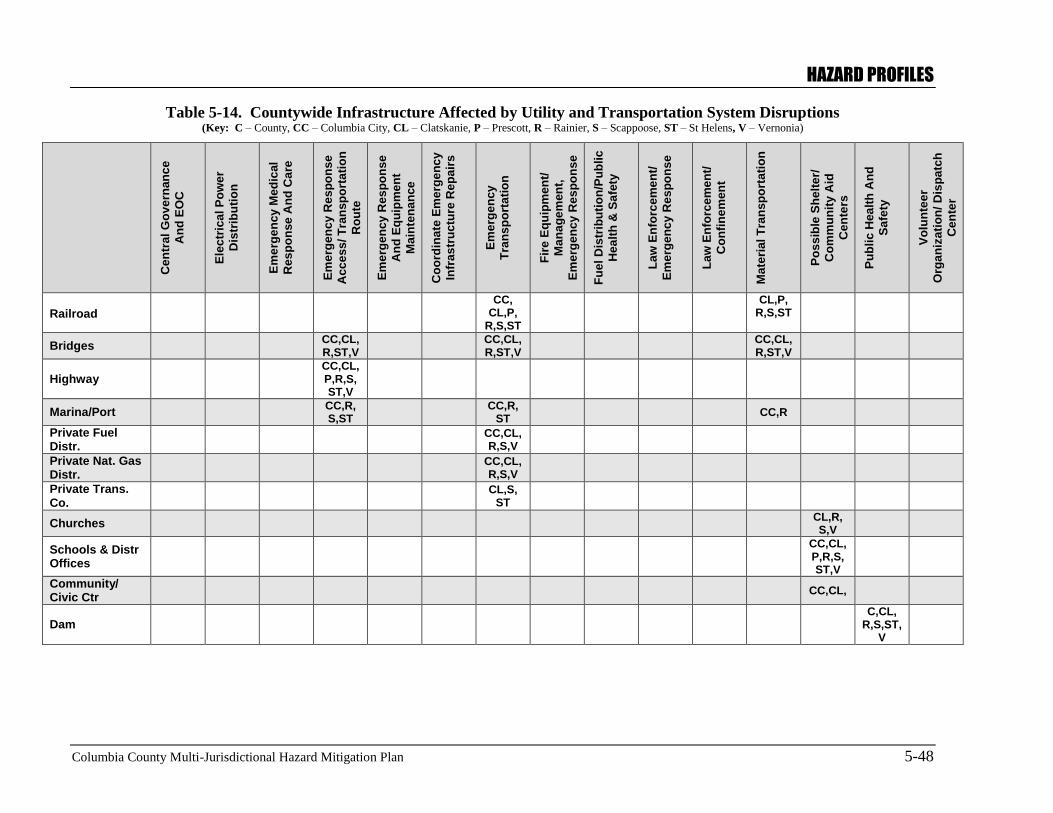
HAZARD PROFILES
Columbia County Multi-Jurisdictional Hazard Mitigation Plan 5-48
Table 5-14. Countywide Infrastructure Affected by Utility and Transportation System Disruptions (Key: C – County, CC – Columbia City, CL – Clatskanie, P – Prescott, R – Rainier, S – Scappoose, ST – St Helens, V – Vernonia)
Cen
tral
Go
ve
rnan
ce
An
d E
OC
Ele
ctr
ica
l P
ow
er
Dis
trib
uti
on
Em
erg
en
cy
Me
dic
al
Res
po
nse
An
d C
are
Em
erg
en
cy
Re
sp
on
se
Acc
es
s/ T
ran
sp
ort
ati
on
Ro
ute
Em
erg
en
cy
Re
sp
on
se
An
d E
qu
ipm
en
t
Ma
inte
na
nce
Co
ord
ina
te E
me
rge
nc
y
Infr
as
tru
ctu
re R
ep
air
s
Em
erg
en
cy
Tra
ns
po
rtati
on
Fir
e E
qu
ipm
en
t/
Ma
na
ge
men
t,
Em
erg
en
cy
Re
sp
on
se
Fu
el
Dis
trib
uti
on
/Pu
bli
c
Hea
lth
& S
afe
ty
La
w E
nfo
rce
me
nt/
Em
erg
en
cy
Re
sp
on
se
La
w E
nfo
rce
me
nt/
Co
nfi
ne
men
t
Ma
teri
al
Tra
nsp
ort
ati
on
Po
ss
ible
Sh
elt
er/
Co
mm
un
ity A
id
Cen
ters
Pu
bli
c H
ea
lth
An
d
Sa
fety
Vo
lun
tee
r
Org
an
iza
tio
n/
Dis
pa
tch
Cen
ter
Railroad
CC, CL,P,
R,S,ST
CL,P, R,S,ST
Bridges CC,CL,R,ST,V
CC,CL,R,ST,V
CC,CL,R,ST,V
Highway CC,CL,P,R,S,ST,V
Marina/Port CC,R, S,ST
CC,R,
ST CC,R
Private Fuel Distr.
CC,CL,R,S,V
Private Nat. Gas Distr.
CC,CL,R,S,V
Private Trans. Co.
CL,S,
ST
Churches CL,R, S,V
Schools & Distr Offices
CC,CL,P,R,S,ST,V
Community/ Civic Ctr
CC,CL,
Dam C,CL,
R,S,ST,V
HAZARD PROFILES
Columbia County Multi-Jurisdictional Hazard Mitigation Plan 5-49
5.3.13.4 Extent
The extent of transportation or utility service disruptions is directly dependent on the nature and
magnitude of the hazard. Minor hazard events may cause minor disruptions, while significant
hazard events may cause long-term transportation and utility failures.
5.3.13.5 Probability of Future Events
Inclement weather, topography, and human influence are the usual cause for transportation and
utility system failure events. Increased usage (portrayed by heavy traffic periods or increased
utility needs such as summer air conditioning or winter heating) can exacerbate or accelerate
these systems’ failure rate. Consequently, Columbia County will continue to experience episodic
utility failure.
5.3.14 Hazardous Materials
5.3.14.1 Nature
Hazardous materials can be defined as any materials having a negative impact on health; human,
animal, aquatic, or environmental. Hazardous materials exposure may cause injury, illness, or
death. Exposure impacts may be evident within seconds, minutes, or hours. Or impacts may not
surface until days, weeks, or even years after exposure. Also, it is important to note that harmful
effects can be short- or long-term.
Some hazardous materials are highly toxic so that even brief exposures to minute amounts may
be dangerous or even fatal. Other hazardous materials are much less toxic. Negative effects may
occur only after a significant exposure to large quantities of a substance, or exposure to smaller
quantities for a prolonged period of time. The technical term “toxic,” or “toxicity,” which is
widely used to describe hazardous materials, is simply a synonym for the more common terms
“poison” or “poisonous.” A toxin is thus defined as any substance that causes injury, illness, or
death to living tissue by chemical activity.
The Institute of Hazardous Materials defines hazardous materials according to several regulatory
agencies:
. . .any item or agent (biological, chemical, physical) which has the potential to cause harm to
humans, animals, or the environment, either by itself or through interaction with other
factors. Hazardous materials professionals are responsible for and properly qualified to
manage such materials. This includes managing and/or advising other managers on such
items at any point in their life-cycle, from process planning and development of new products;
through manufacture, distribution, and use; to disposal, cleanup, and remediation.
Hazardous materials are defined and regulated in the United States primarily by laws and
regulations administered by the U.S. Environmental Protection Agency (EPA), the U.S.
Occupational Safety and Health Administration (OSHA), the U.S. Department of
Transportation (DOT), and the U.S. Nuclear Regulatory Commission (NRC). Each has its
own definition of a "hazardous material."
OSHA’s definition includes any substance or chemical which is a "health hazard" or
"physical hazard," including: chemicals which are carcinogens, toxic agents, irritants,
corrosives, sensitizers; agents which act on the hematopoietic system; agents which damage
HAZARD PROFILES
Columbia County Multi-Jurisdictional Hazard Mitigation Plan 5-50
the lungs, skin, eyes, or mucous membranes; chemicals which are combustible, explosive,
flammable, oxidizers, pyrophorics, unstable-reactive or water-reactive; and chemicals which
in the course of normal handling, use, or storage may produce or release dusts, gases, fumes,
vapors, mists or smoke which may have any of the previously mentioned characteristics. (Full
definitions can be found at 29 Code of Federal Regulations (CFR) 1910.1200.)
EPA incorporates the OSHA definition, and adds any item or chemical which can cause harm
to people, plants, or animals when released by spilling, leaking, pumping, pouring, emitting,
emptying, discharging, injecting, escaping, leaching, dumping or disposing into the
environment. (40 CFR 355 contains a list of over 350 hazardous and extremely hazardous
substances.)
DOT defines a hazardous material as any item or chemical which, when being transported or
moved, is a risk to public safety or the environment, and is regulated as such under the:
Hazardous Materials Regulations (49 CFR 100-180); International Maritime Dangerous
Goods Code; Dangerous Goods Regulations of the International Air Transport Association;
Technical Instructions of the International Civil Aviation Organization; U.S. Air Force Joint
Manual, Preparing Hazardous Materials for Military Air Shipments.
The NRC regulates items or chemicals which are "special nuclear source" or by-product
materials or radioactive substances. (See 10 CFR 20).
http://www.ihmm.org/dspWhatIsHazMat.cfm
Both Federal and State of Oregon statutes govern hazardous materials. Federal regulations
include the Clean Air Act, Emergency Planning and Community Right to Know Act, and
Superfund Amendments and Reauthorization Act. Oregon statutes are listed below:
ORS Chapter 453, 453.001 to 453.185 and 453.605 to 453.807
ORS Chapter 465, Hazardous Waste, Haz. Mat. I
ORS Chapter 466, Hazardous Waste, Haz. Mat. II
ORS Chapter 475, 475.405 to 475.495, Illegal Drug Clean-up
ORS Chapter 480, Explosives, flammable materials, pressure vessels.
Hazards are found nearly everywhere; petroleum products, natural and synthetic gas, acids, and
other acutely toxic chemicals found in everyday products such as paints, solvents, adhesives,
household cleaners, pesticides and herbicides, batteries, and even medicines.
This plan does not focus on the hazards in everyday products, but rather on the larger quantities
of hazardous materials classified as Hazardous Substances (HS) or Extremely Hazardous
Substances (EHS) that are transported through the planning area by rail, highway, and air.
Hazardous substances can present problems when spilled, however EHS potentially pose the
most catastrophic threat as the category includes substances, such as chlorine and ammonia,
which pose an acute inhalable toxic threat to humans and animals. (Alaska State HMP, 2007)
The toxicity of a specific substance is one important factor in determining the risk it poses, but
there are other factors that can be just as, if not more, significant. Factors affecting the severity
of an accidental release include toxicity, quantity, dispersal characteristics, release location,
population density, environmental sensitivity, and efficacy of response and recovery actions.
Hazardous materials are generally classified by their primary health effects on humans. Some
common types include the following:
Anesthetics and narcotics depress the central nervous system.
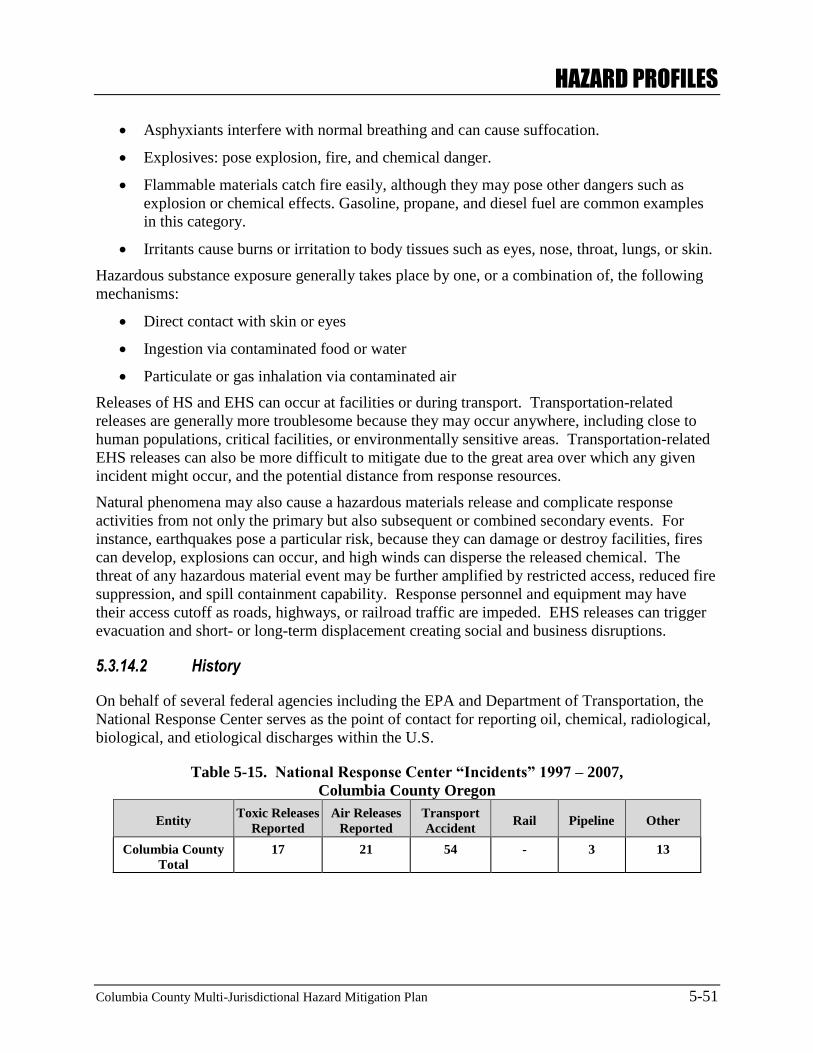
HAZARD PROFILES
Columbia County Multi-Jurisdictional Hazard Mitigation Plan 5-51
Asphyxiants interfere with normal breathing and can cause suffocation.
Explosives: pose explosion, fire, and chemical danger.
Flammable materials catch fire easily, although they may pose other dangers such as
explosion or chemical effects. Gasoline, propane, and diesel fuel are common examples
in this category.
Irritants cause burns or irritation to body tissues such as eyes, nose, throat, lungs, or skin.
Hazardous substance exposure generally takes place by one, or a combination of, the following
mechanisms:
Direct contact with skin or eyes
Ingestion via contaminated food or water
Particulate or gas inhalation via contaminated air
Releases of HS and EHS can occur at facilities or during transport. Transportation-related
releases are generally more troublesome because they may occur anywhere, including close to
human populations, critical facilities, or environmentally sensitive areas. Transportation-related
EHS releases can also be more difficult to mitigate due to the great area over which any given
incident might occur, and the potential distance from response resources.
Natural phenomena may also cause a hazardous materials release and complicate response
activities from not only the primary but also subsequent or combined secondary events. For
instance, earthquakes pose a particular risk, because they can damage or destroy facilities, fires
can develop, explosions can occur, and high winds can disperse the released chemical. The
threat of any hazardous material event may be further amplified by restricted access, reduced fire
suppression, and spill containment capability. Response personnel and equipment may have
their access cutoff as roads, highways, or railroad traffic are impeded. EHS releases can trigger
evacuation and short- or long-term displacement creating social and business disruptions.
5.3.14.2 History
On behalf of several federal agencies including the EPA and Department of Transportation, the
National Response Center serves as the point of contact for reporting oil, chemical, radiological,
biological, and etiological discharges within the U.S.
Table 5-15. National Response Center “Incidents” 1997 – 2007,
Columbia County Oregon
Entity Toxic Releases
Reported
Air Releases
Reported
Transport
Accident Rail Pipeline Other
Columbia County
Total
17 21 54 - 3 13
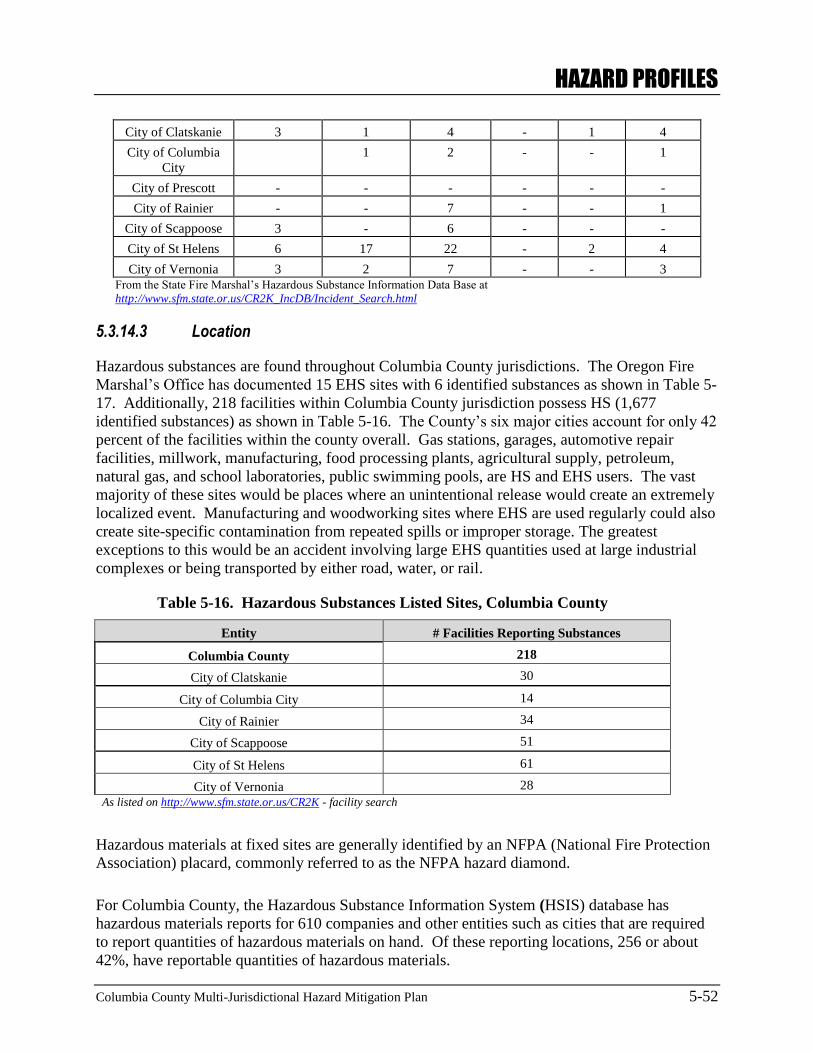
HAZARD PROFILES
Columbia County Multi-Jurisdictional Hazard Mitigation Plan 5-52
City of Clatskanie 3 1 4 - 1 4
City of Columbia
City
1 2 - - 1
City of Prescott - - - - - -
City of Rainier - - 7 - - 1
City of Scappoose 3 - 6 - - -
City of St Helens 6 17 22 - 2 4
City of Vernonia 3 2 7 - - 3
From the State Fire Marshal’s Hazardous Substance Information Data Base at
http://www.sfm.state.or.us/CR2K_IncDB/Incident_Search.html
5.3.14.3 Location
Hazardous substances are found throughout Columbia County jurisdictions. The Oregon Fire
Marshal’s Office has documented 15 EHS sites with 6 identified substances as shown in Table 5-
17. Additionally, 218 facilities within Columbia County jurisdiction possess HS (1,677
identified substances) as shown in Table 5-16. The County’s six major cities account for only 42
percent of the facilities within the county overall. Gas stations, garages, automotive repair
facilities, millwork, manufacturing, food processing plants, agricultural supply, petroleum,
natural gas, and school laboratories, public swimming pools, are HS and EHS users. The vast
majority of these sites would be places where an unintentional release would create an extremely
localized event. Manufacturing and woodworking sites where EHS are used regularly could also
create site-specific contamination from repeated spills or improper storage. The greatest
exceptions to this would be an accident involving large EHS quantities used at large industrial
complexes or being transported by either road, water, or rail.
Table 5-16. Hazardous Substances Listed Sites, Columbia County
Entity # Facilities Reporting Substances
Columbia County 218
City of Clatskanie 30
City of Columbia City 14
City of Rainier 34
City of Scappoose 51
City of St Helens 61
City of Vernonia 28
As listed on http://www.sfm.state.or.us/CR2K - facility search
Hazardous materials at fixed sites are generally identified by an NFPA (National Fire Protection
Association) placard, commonly referred to as the NFPA hazard diamond.
For Columbia County, the Hazardous Substance Information System (HSIS) database has
hazardous materials reports for 610 companies and other entities such as cities that are required
to report quantities of hazardous materials on hand. Of these reporting locations, 256 or about
42%, have reportable quantities of hazardous materials.
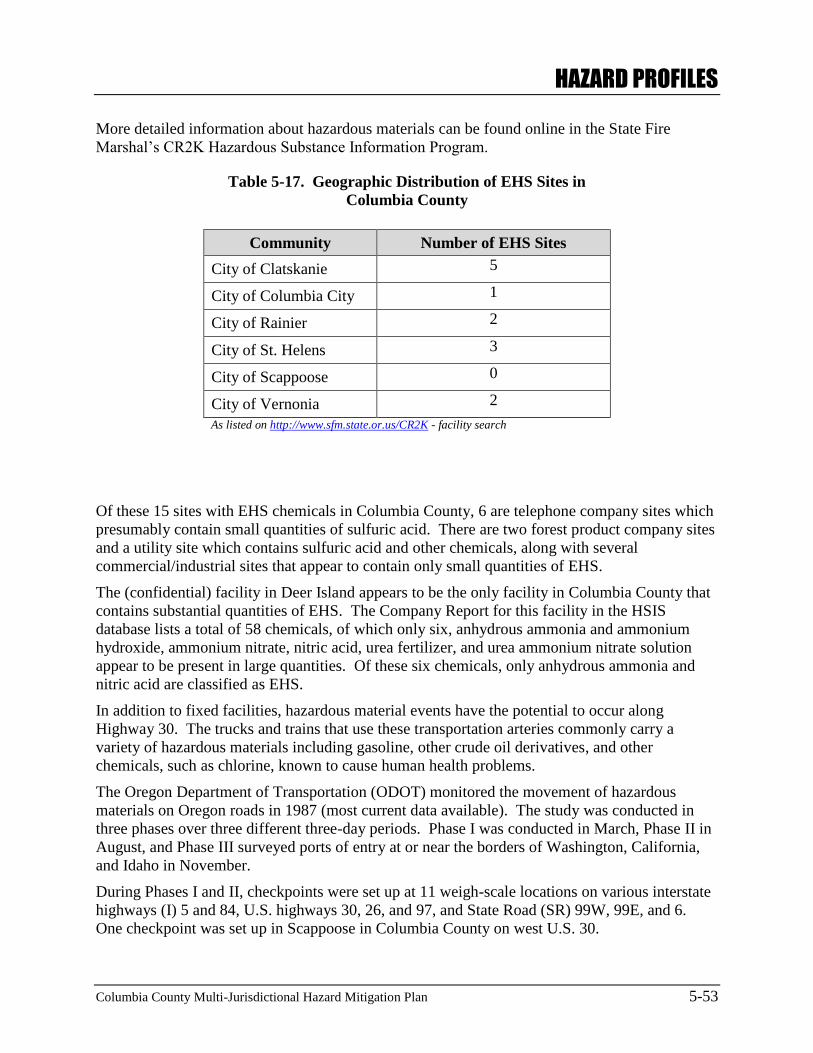
HAZARD PROFILES
Columbia County Multi-Jurisdictional Hazard Mitigation Plan 5-53
More detailed information about hazardous materials can be found online in the State Fire
Marshal’s CR2K Hazardous Substance Information Program.
Table 5-17. Geographic Distribution of EHS Sites in
Columbia County
Community Number of EHS Sites
City of Clatskanie 5
City of Columbia City 1
City of Rainier 2
City of St. Helens 3
City of Scappoose 0
City of Vernonia 2
As listed on http://www.sfm.state.or.us/CR2K - facility search
Of these 15 sites with EHS chemicals in Columbia County, 6 are telephone company sites which
presumably contain small quantities of sulfuric acid. There are two forest product company sites
and a utility site which contains sulfuric acid and other chemicals, along with several
commercial/industrial sites that appear to contain only small quantities of EHS.
The (confidential) facility in Deer Island appears to be the only facility in Columbia County that
contains substantial quantities of EHS. The Company Report for this facility in the HSIS
database lists a total of 58 chemicals, of which only six, anhydrous ammonia and ammonium
hydroxide, ammonium nitrate, nitric acid, urea fertilizer, and urea ammonium nitrate solution
appear to be present in large quantities. Of these six chemicals, only anhydrous ammonia and
nitric acid are classified as EHS.
In addition to fixed facilities, hazardous material events have the potential to occur along
Highway 30. The trucks and trains that use these transportation arteries commonly carry a
variety of hazardous materials including gasoline, other crude oil derivatives, and other
chemicals, such as chlorine, known to cause human health problems.
The Oregon Department of Transportation (ODOT) monitored the movement of hazardous
materials on Oregon roads in 1987 (most current data available). The study was conducted in
three phases over three different three-day periods. Phase I was conducted in March, Phase II in
August, and Phase III surveyed ports of entry at or near the borders of Washington, California,
and Idaho in November.
During Phases I and II, checkpoints were set up at 11 weigh-scale locations on various interstate
highways (I) 5 and 84, U.S. highways 30, 26, and 97, and State Road (SR) 99W, 99E, and 6.
One checkpoint was set up in Scappoose in Columbia County on west U.S. 30.
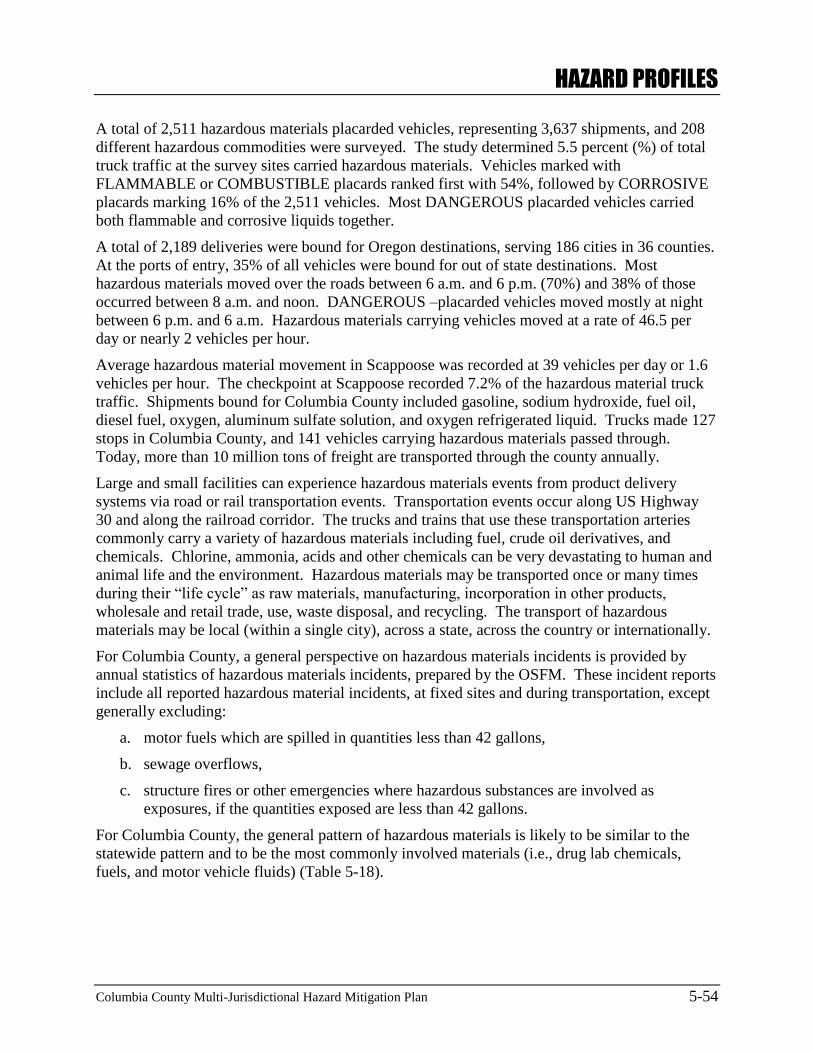
HAZARD PROFILES
Columbia County Multi-Jurisdictional Hazard Mitigation Plan 5-54
A total of 2,511 hazardous materials placarded vehicles, representing 3,637 shipments, and 208
different hazardous commodities were surveyed. The study determined 5.5 percent (%) of total
truck traffic at the survey sites carried hazardous materials. Vehicles marked with
FLAMMABLE or COMBUSTIBLE placards ranked first with 54%, followed by CORROSIVE
placards marking 16% of the 2,511 vehicles. Most DANGEROUS placarded vehicles carried
both flammable and corrosive liquids together.
A total of 2,189 deliveries were bound for Oregon destinations, serving 186 cities in 36 counties.
At the ports of entry, 35% of all vehicles were bound for out of state destinations. Most
hazardous materials moved over the roads between 6 a.m. and 6 p.m. (70%) and 38% of those
occurred between 8 a.m. and noon. DANGEROUS –placarded vehicles moved mostly at night
between 6 p.m. and 6 a.m. Hazardous materials carrying vehicles moved at a rate of 46.5 per
day or nearly 2 vehicles per hour.
Average hazardous material movement in Scappoose was recorded at 39 vehicles per day or 1.6
vehicles per hour. The checkpoint at Scappoose recorded 7.2% of the hazardous material truck
traffic. Shipments bound for Columbia County included gasoline, sodium hydroxide, fuel oil,
diesel fuel, oxygen, aluminum sulfate solution, and oxygen refrigerated liquid. Trucks made 127
stops in Columbia County, and 141 vehicles carrying hazardous materials passed through.
Today, more than 10 million tons of freight are transported through the county annually.
Large and small facilities can experience hazardous materials events from product delivery
systems via road or rail transportation events. Transportation events occur along US Highway
30 and along the railroad corridor. The trucks and trains that use these transportation arteries
commonly carry a variety of hazardous materials including fuel, crude oil derivatives, and
chemicals. Chlorine, ammonia, acids and other chemicals can be very devastating to human and
animal life and the environment. Hazardous materials may be transported once or many times
during their “life cycle” as raw materials, manufacturing, incorporation in other products,
wholesale and retail trade, use, waste disposal, and recycling. The transport of hazardous
materials may be local (within a single city), across a state, across the country or internationally.
For Columbia County, a general perspective on hazardous materials incidents is provided by
annual statistics of hazardous materials incidents, prepared by the OSFM. These incident reports
include all reported hazardous material incidents, at fixed sites and during transportation, except
generally excluding:
a. motor fuels which are spilled in quantities less than 42 gallons,
b. sewage overflows,
c. structure fires or other emergencies where hazardous substances are involved as
exposures, if the quantities exposed are less than 42 gallons.
For Columbia County, the general pattern of hazardous materials is likely to be similar to the
statewide pattern and to be the most commonly involved materials (i.e., drug lab chemicals,
fuels, and motor vehicle fluids) (Table 5-18).
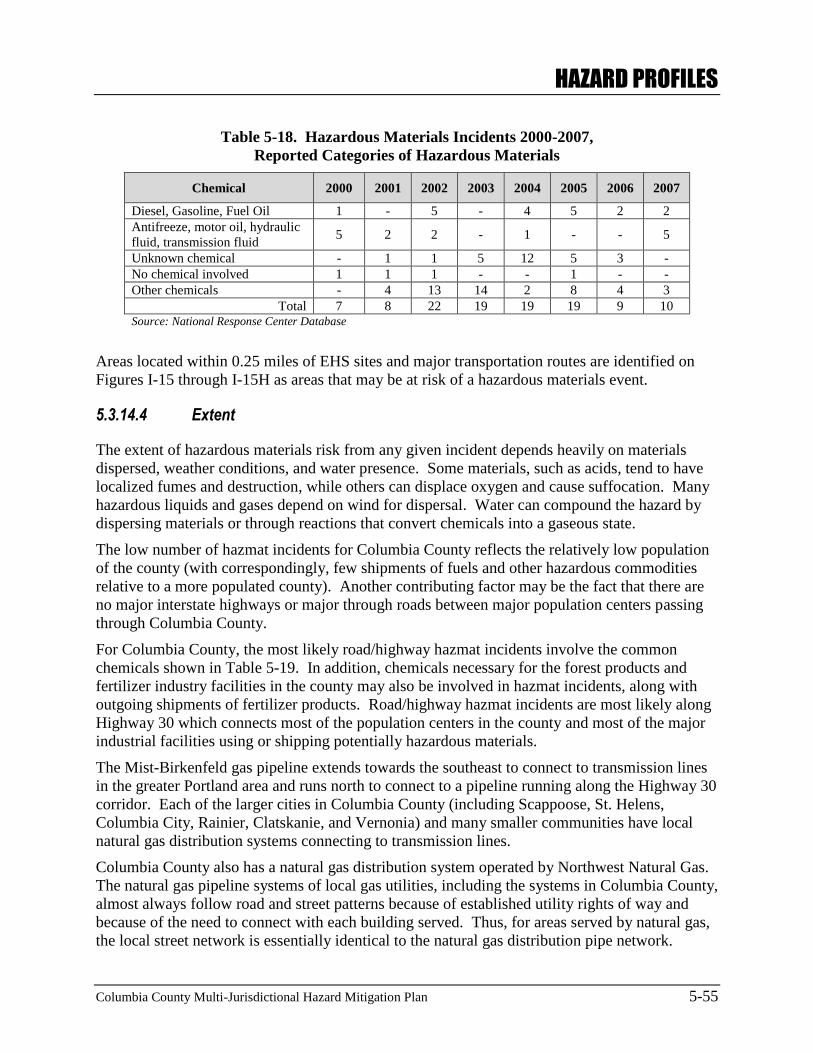
HAZARD PROFILES
Columbia County Multi-Jurisdictional Hazard Mitigation Plan 5-55
Table 5-18. Hazardous Materials Incidents 2000-2007,
Reported Categories of Hazardous Materials
Chemical 2000 2001 2002 2003 2004 2005 2006 2007
Diesel, Gasoline, Fuel Oil 1 - 5 - 4 5 2 2
Antifreeze, motor oil, hydraulic
fluid, transmission fluid 5 2 2 - 1 - - 5
Unknown chemical - 1 1 5 12 5 3 -
No chemical involved 1 1 1 - - 1 - -
Other chemicals - 4 13 14 2 8 4 3
Total 7 8 22 19 19 19 9 10 Source: National Response Center Database
Areas located within 0.25 miles of EHS sites and major transportation routes are identified on
Figures I-15 through I-15H as areas that may be at risk of a hazardous materials event.
5.3.14.4 Extent
The extent of hazardous materials risk from any given incident depends heavily on materials
dispersed, weather conditions, and water presence. Some materials, such as acids, tend to have
localized fumes and destruction, while others can displace oxygen and cause suffocation. Many
hazardous liquids and gases depend on wind for dispersal. Water can compound the hazard by
dispersing materials or through reactions that convert chemicals into a gaseous state.
The low number of hazmat incidents for Columbia County reflects the relatively low population
of the county (with correspondingly, few shipments of fuels and other hazardous commodities
relative to a more populated county). Another contributing factor may be the fact that there are
no major interstate highways or major through roads between major population centers passing
through Columbia County.
For Columbia County, the most likely road/highway hazmat incidents involve the common
chemicals shown in Table 5-19. In addition, chemicals necessary for the forest products and
fertilizer industry facilities in the county may also be involved in hazmat incidents, along with
outgoing shipments of fertilizer products. Road/highway hazmat incidents are most likely along
Highway 30 which connects most of the population centers in the county and most of the major
industrial facilities using or shipping potentially hazardous materials.
The Mist-Birkenfeld gas pipeline extends towards the southeast to connect to transmission lines
in the greater Portland area and runs north to connect to a pipeline running along the Highway 30
corridor. Each of the larger cities in Columbia County (including Scappoose, St. Helens,
Columbia City, Rainier, Clatskanie, and Vernonia) and many smaller communities have local
natural gas distribution systems connecting to transmission lines.
Columbia County also has a natural gas distribution system operated by Northwest Natural Gas.
The natural gas pipeline systems of local gas utilities, including the systems in Columbia County,
almost always follow road and street patterns because of established utility rights of way and
because of the need to connect with each building served. Thus, for areas served by natural gas,
the local street network is essentially identical to the natural gas distribution pipe network.
HAZARD PROFILES
Columbia County Multi-Jurisdictional Hazard Mitigation Plan 5-56
The only freight railroad serving Columbia County is the Portland & Western Line that runs
from Astoria through Columbia County along the Highway 30 corridor to Portland. Specific
data on hazmat shipments for this rail line were not available for this mitigation plan. However,
the most likely chemicals for potential spills are generally similar to those noted above for road
shipments within Columbia County.
The toxicity of particular hazardous materials is an important measure of the potential impact of
hazardous materials on affected communities, but not the only important measure. Other
characteristics of hazardous materials, especially the quantity of material and the ease of
dispersal of the material may be as important, or more important, in governing the level of
potential threat to a community.
5.3.14.5 Probability of Future Events
There are many fixed locations in Columbia County with inventories, and a considerable
volume, of hazardous materials being transported to, from, within, or through the county.
Historically, the safety record for hazardous materials has been good, with relatively few, mostly
minor hazmat incidents. Nevertheless, there is a potential for larger hazmat incidents in
Columbia County. Previous occurrences indicate the likelihood of a small oil or chemical spill
occurring within the County approximately 10 times per year. However, more comprehensive
information on the probability and magnitude of hazardous material events from all types of
sources is not available. Wide variations among the characteristics of hazardous material sources
and among the materials themselves make such an evaluation difficult. While it is beyond the
scope of this HMP to make detailed hazardous materials probability and magnitude evaluations
for Columbia County, it is possible to determine building and critical facility exposure to this
hazard. Two hundred-seventy one sites were identified as being EHS sites from annual EPA
Tier II Material Inventory Reports.
Figures I-15 through I-15H show areas vulnerable to a hazardous material event, including an
area within a 1-mile radius of major highways, EHS facilities, and railroad routes.
5.3.15 Terrorism
5.3.15.1 Nature
The Homeland Security Act of 2002, Public Law 107-296, 107th Congress, Nov 25, 2002, 6
USC 101, §2(15) defines terrorism as:
“…any activity that involves an act that is dangerous to human life or potential
destructive of critical infrastructure or key resources; and is a violation of the criminal
laws of the United States or of any State or other subdivisions of the United States; and
appears to be intended to intimidate or coerce a civilian population; to influence the
policy of government by intimidation or coercion; or to affect the conduct of a
government by mass destruction, assassination or kidnapping.”
Terrorists may use a range of possible malevolent actions, including vandalism, arson,
explosions and armed attacks, as well as use of chemical, biological, radioactive or nuclear
materials.
HAZARD PROFILES
Columbia County Multi-Jurisdictional Hazard Mitigation Plan 5-57
Chemical attacks: deliberate release of a toxic agent (gaseous, liquid, or solid) that can
poison people or the environment
Biological attacks: releases of large quantities of living, disease-causing microorganisms
that have extraordinary lethal potential
Radiological attacks: deliberate dispersal of radioactive materials, via dirty bombs
(conventional explosives laced with radioactive materials) or other methods.
Nuclear attacks: explosion of nuclear devices and the radioactive fallout from such
explosions.
Cyber-terrorism: deliberate disruption/damage of computer systems and data.
5.3.15.2 History
Two major underground movements active in Columbia County, Oregon - the Earth Liberation
Front (ELF) and the Animal Liberation Front (ALF) - are among the most destructive domestic
terrorist groups in the United States. ALF, ELF, and related movements have claimed
responsibility for more than 1,200 criminal acts since 1990 and caused more than $110 million in
property damage in the United States since 1976. (J. Lewis 2005, J. Lewis 2004) Since 1996,
ALF and ELF have claimed responsibility for acts which have destroyed property in excess of
$13 million in Oregon alone.
In January 2006, 11 suspected members of an animal rights and environmental extremist cell in
Oregon were indicted on 65 counts of conspiracy and related offenses including arson and
attempted arson. The cell was allegedly responsible for a domestic terrorism campaign that
spanned five Western states from 1996 to 2001. Specifically in Oregon, ELF is responsible for
firebombing a Southern Oregon lumber mill office, toppling a high-tension electric line, and
torching a Clatskanie tree farm. (Mail Tribune 2005) ELF burned part of the headquarters of the
cottonwood plantation with damages estimated at $1 million dollars. Columbia County lost
several jobs, causing families to move out and the schools to lose 40 children (due to relocation);
the latter resulted in the school shutting down. (D. Pohl 2008)
5.3.15.3 Location
Oregon is home to a wide variety of criminal extremist groups including hate groups, anti-
government groups, anarchists, and special issue movements like environmental and animal
rights extremists, as well as activity by foreign terrorists. Individuals connected to these groups
have used criminal activities to achieve their objectives, including arson, harassment, threats,
extortion, home invasions, animal releases, sabotage, and destruction of private and government
property. All jurisdictions throughout Columbia County are subject to impacts associated with
domestic terrorism.
5.3.15.4 Extent
Because of its location among logging industries and endangered species, Columbia County is
susceptible to the following types of terrorism: vandalism, cyber/computer hacking, and eco-
terrorism actions.
HAZARD PROFILES
Columbia County Multi-Jurisdictional Hazard Mitigation Plan 5-58
5.3.15.5 Probability of Future Events
Within Columbia County, there is risk of terrorism incidents based on infrastructure and the
environmental resources. Federal agencies work with state agencies to watch these organized
groups; agencies may infiltrate their core structure and/or terminate any actions that cause harm
to citizens, property, and the environment.
5.3.16 Infectious Disease Epidemic
5.3.16.1 Nature
Infectious diseases impair or damage bodily functions. They are caused by foreign organisms
entering the human body and multiplying; including bacteria, viruses, fungi, and protozoa.
Infections range from mild to deadly. Organisms enter the body via means such as: skin contact;
inhalation; ingestion; blood (intravenous contact, bites, or punctures); sexual contact; and
transmission from mothers to unborn children.
While infectious diseases pose a threat to people of any age and health condition, they are often a
greater hazard to very young children, older adults, or people with compromised health.
Vaccines and other advances in medical technology have reduced risks of some infectious
diseases; however, new diseases emerge, new strains of existing diseases appear, and diseases
that have been previously eliminated may reemerge.
When a disease spreads rapidly, affecting a greater portion of the population than would
normally be expected, we call it an epidemic. An epidemic that reaches worldwide proportions
is called a pandemic. When an infectious disease reaches epidemic level, it is considered to be a
public health emergency. Such emergencies are commonly addressed through quarantine and
immunization.
Viruses and bacteria are of particular concern in epidemics. Both types of organisms are capable
of rapid mutation, and some mutations can make an organism more easily communicable, or
more virulent, or resistant to the preventions or remedies that humans use against the disease.
For instance, a new strain of a disease previously passed only from animal to human may be
communicable between humans, and such a mutation will multiply rapidly because it affords the
disease a way to colonize new hosts much more quickly. Because of the rapidly changing nature
of infectious disease, even though recent historical data for Columbia County would lead one to
believe that infectious disease is not a problem today, public health officials carefully monitor
communicable diseases as well as those with current limitations that preclude epidemic
outbreaks. (L. Rivers, personal communication)
Non-communicable, vector-borne diseases (such as those carried by mosquitoes or ticks) are
important in community education, but generally would not lead to an epidemic in their current
forms. It is worth noting that there is an association between climate and many infectious
diseases, and global climate change will affect the range and prevalence of certain epidemics. In
2005, the World Health Organization published a report on using climate, and climate change
models, to predict infectious disease epidemics. A climate-based early warning system may
become an important tool for public health officials. (Khun et al. 2005)

HAZARD PROFILES
Columbia County Multi-Jurisdictional Hazard Mitigation Plan 5-59
In Oregon, some of the most common pathogens that cause disease outbreaks are E. coli,
Salmonella, Shigella, and norovirus. Outbreaks of pertussis and measles still occur. Oregon is
now tracking mumps as a reportable disease.
(http://www.oregon.gov/DHS/ph/acd/outbreak/outbreak.shtml )
Three diseases that occur or have potential to be introduced to the residents of Columbia County
are norovirus, influenza, and West Nile virus. These diseases have been documented within the
State of Oregon; information is available through the Oregon Department of Human Services,
Public Health Emergency Preparedness. The state also tracks other infectious diseases that could
become a hazard to the community in the future, such as the emerging avian influenza (bird flu).
Influenza
Influenza viruses have been present in the human population for many years. Major changes in
the virus (antigenic shifts) in the 20th century have led to three pandemics or global outbreaks of
the disease, identified by the country or region that first reported the outbreak: the 1918 Spanish
Influenza; 1957 Asian Influenza; and the 1968 Hong Kong Influenza. The 1918 pandemic,
which was the only major influenza outbreak during which the most affected population group
was young, healthy individuals (18 to 34 years old), coincided with World War I, and the
movement of many young men around the globe as soldiers. (L. Rivers, personal
communication; Diamond, 1997)
Influenza viruses are passed between people through respiratory droplets that are spread by
coughing or sneezing. Transmission is typically via air, but may also occur by contact with
infected surfaces and then touching mucous membranes, such as those in the eyes, mouth, or
nose. Incubation of the virus typically ranges from 1 to 5 days and symptoms generally last for 2
to 7 days. Symptoms may include fever, muscle aches, headache, cough, sore throat, runny or
stuffy nose, and fatigue.
There are three types of influenza virus (A, B, and C) and many different strains of each type.
Types A and B are known to cause annual epidemics, while Type C produces mild respiratory
illnesses and is not known to cause epidemics. Influenza is a virus that mutates continually and
rapidly in ways that essentially disguise the virus from human immune systems, so that previous
exposure to, or illness from, the virus does not confer immunity. Vaccines are updated annually
for Types A and B, based on the previous year’s virus. (CDC 2008a)
In the northern hemisphere, influenza generally occurs from November through May. Peak
months vary, but February is often the peak of flu season. The U.S. Center for Disease Control
(CDC) reports than an average of 36,000 people died annually due to influenza between 1990
and 1999. In the same time-period, an average of 226,000 people were hospitalized annually.
(CDC 2008b)
Norovirus
The original strain of noroviruses appeared in Norwalk, Ohio in 1968. The virus produces a
condition known as gastroenteritis, an inflammation of the stomach and intestines resulting in
vomiting or diarrhea. The condition is often referred to as the "stomach flu," although it is not
related to influenza. There are five groups of noroviruses and over 30 genetic clusters.
Noroviruses are transmitted between humans by eating or drinking food or water contaminated
with feces from an infected person. Some reports indicate that the virus can be transmitted
through droplets produced when a person is vomiting; the droplets may be swallowed by others.
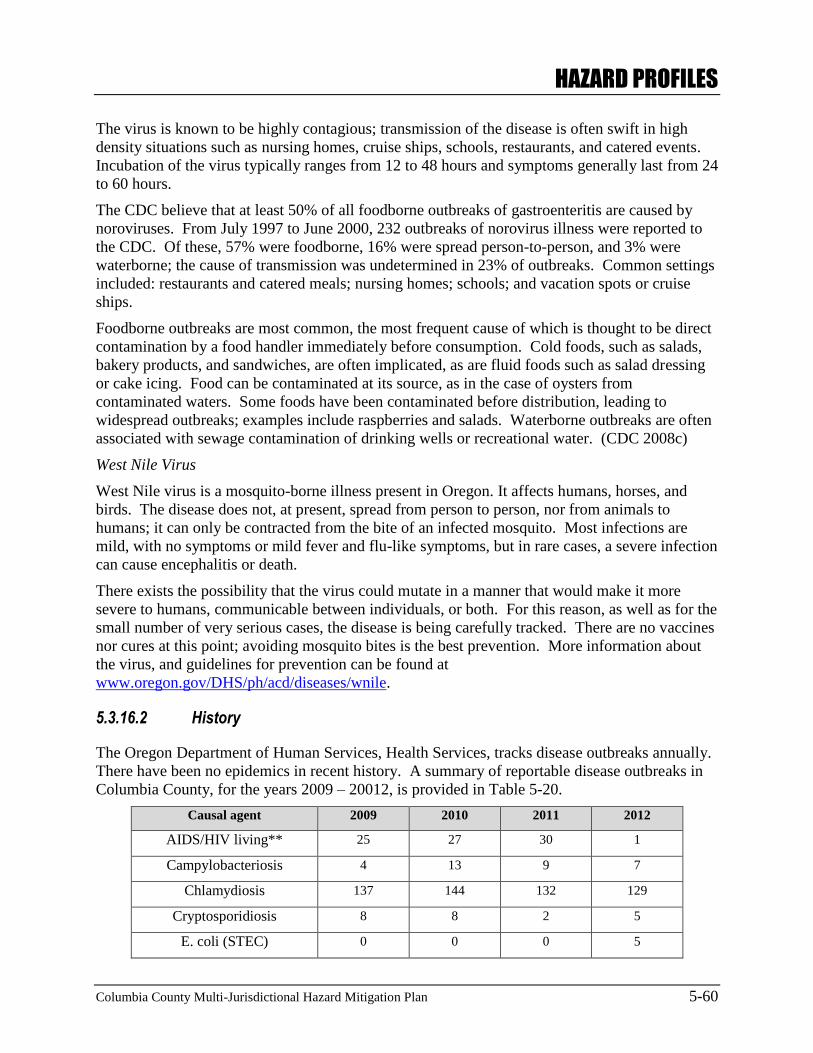
HAZARD PROFILES
Columbia County Multi-Jurisdictional Hazard Mitigation Plan 5-60
The virus is known to be highly contagious; transmission of the disease is often swift in high
density situations such as nursing homes, cruise ships, schools, restaurants, and catered events.
Incubation of the virus typically ranges from 12 to 48 hours and symptoms generally last from 24
to 60 hours.
The CDC believe that at least 50% of all foodborne outbreaks of gastroenteritis are caused by
noroviruses. From July 1997 to June 2000, 232 outbreaks of norovirus illness were reported to
the CDC. Of these, 57% were foodborne, 16% were spread person-to-person, and 3% were
waterborne; the cause of transmission was undetermined in 23% of outbreaks. Common settings
included: restaurants and catered meals; nursing homes; schools; and vacation spots or cruise
ships.
Foodborne outbreaks are most common, the most frequent cause of which is thought to be direct
contamination by a food handler immediately before consumption. Cold foods, such as salads,
bakery products, and sandwiches, are often implicated, as are fluid foods such as salad dressing
or cake icing. Food can be contaminated at its source, as in the case of oysters from
contaminated waters. Some foods have been contaminated before distribution, leading to
widespread outbreaks; examples include raspberries and salads. Waterborne outbreaks are often
associated with sewage contamination of drinking wells or recreational water. (CDC 2008c)
West Nile Virus
West Nile virus is a mosquito-borne illness present in Oregon. It affects humans, horses, and
birds. The disease does not, at present, spread from person to person, nor from animals to
humans; it can only be contracted from the bite of an infected mosquito. Most infections are
mild, with no symptoms or mild fever and flu-like symptoms, but in rare cases, a severe infection
can cause encephalitis or death.
There exists the possibility that the virus could mutate in a manner that would make it more
severe to humans, communicable between individuals, or both. For this reason, as well as for the
small number of very serious cases, the disease is being carefully tracked. There are no vaccines
nor cures at this point; avoiding mosquito bites is the best prevention. More information about
the virus, and guidelines for prevention can be found at
www.oregon.gov/DHS/ph/acd/diseases/wnile.
5.3.16.2 History
The Oregon Department of Human Services, Health Services, tracks disease outbreaks annually.
There have been no epidemics in recent history. A summary of reportable disease outbreaks in
Columbia County, for the years 2009 – 20012, is provided in Table 5-20.
Causal agent 2009 2010 2011 2012
AIDS/HIV living** 25 27 30 1
Campylobacteriosis 4 13 9 7
Chlamydiosis 137 144 132 129
Cryptosporidiosis 8 8 2 5
E. coli (STEC) 0 0 0 5
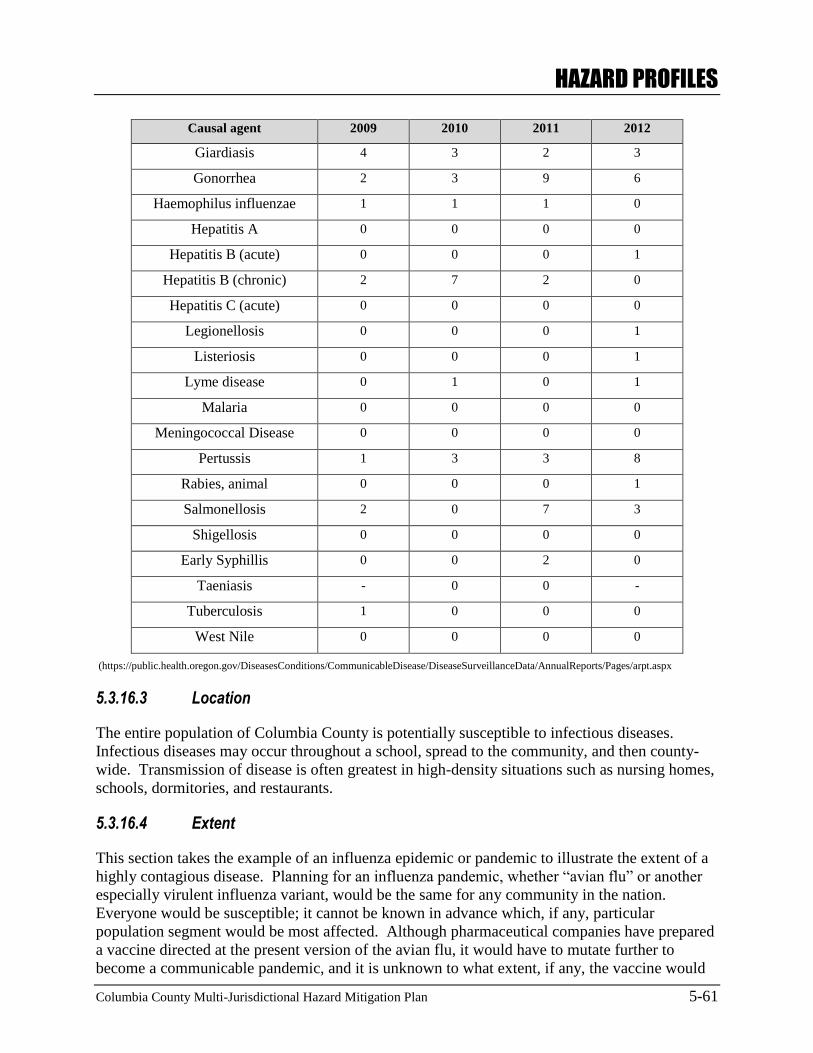
HAZARD PROFILES
Columbia County Multi-Jurisdictional Hazard Mitigation Plan 5-61
Causal agent 2009 2010 2011 2012
Giardiasis 4 3 2 3
Gonorrhea 2 3 9 6
Haemophilus influenzae 1 1 1 0
Hepatitis A 0 0 0 0
Hepatitis B (acute) 0 0 0 1
Hepatitis B (chronic) 2 7 2 0
Hepatitis C (acute) 0 0 0 0
Legionellosis 0 0 0 1
Listeriosis 0 0 0 1
Lyme disease 0 1 0 1
Malaria 0 0 0 0
Meningococcal Disease 0 0 0 0
Pertussis 1 3 3 8
Rabies, animal 0 0 0 1
Salmonellosis 2 0 7 3
Shigellosis 0 0 0 0
Early Syphillis 0 0 2 0
Taeniasis - 0 0 -
Tuberculosis 1 0 0 0
West Nile 0 0 0 0
(https://public.health.oregon.gov/DiseasesConditions/CommunicableDisease/DiseaseSurveillanceData/AnnualReports/Pages/arpt.aspx
5.3.16.3 Location
The entire population of Columbia County is potentially susceptible to infectious diseases.
Infectious diseases may occur throughout a school, spread to the community, and then county-
wide. Transmission of disease is often greatest in high-density situations such as nursing homes,
schools, dormitories, and restaurants.
5.3.16.4 Extent
This section takes the example of an influenza epidemic or pandemic to illustrate the extent of a
highly contagious disease. Planning for an influenza pandemic, whether “avian flu” or another
especially virulent influenza variant, would be the same for any community in the nation.
Everyone would be susceptible; it cannot be known in advance which, if any, particular
population segment would be most affected. Although pharmaceutical companies have prepared
a vaccine directed at the present version of the avian flu, it would have to mutate further to
become a communicable pandemic, and it is unknown to what extent, if any, the vaccine would
HAZARD PROFILES
Columbia County Multi-Jurisdictional Hazard Mitigation Plan 5-62
apply to a new strain. Even if applicable, the avian vaccine cannot be grown in eggs (the
standard method of mass-producing vaccines) and supply would be unlikely to meet demand.
(L. Rivers, personal communication)
Immunity or resistance might then largely depend on inherent genetic diversity within the
population, which is the case in any human population facing a newly emerged virulent disease.
(Diamond, 1997)
5.3.16.5 Probability of Future Events
Based on historical events, Columbia County can expect that there will continue to be limited
outbreaks of infectious diseases each year, including food-borne viral and bacterial pathogens,
measles, pertussis, hepatitis, and influenza, among others. The likelihood of any of these
diseases reaching epidemic proportions in any given year is very low.
If another influenza pandemic occurs, Columbia County is very likely to be affected. In the past
century, there have been three influenza pandemics, with 40 and 10-year return intervals. The
last one was in 1968, 40 years ago, which is one reason that health officials are becoming
concerned about when the next one will occur. However, the emergence of pandemic illnesses
depends on a number of extremely complex factors, which makes the timing of such an outbreak
extremely difficult to predict.
As mentioned above, climate has an affect on communicable disease, and climate change could
alter the repertoire of diseases that exist in Oregon, as well as outbreak frequency.
VULNERABILITY ANALYSIS
Columbia County Multi-Jurisdictional Hazard Mitigation Plan 6-1
6. VULNERABILITY ANALYSIS
This section provides an overview of the vulnerability analysis and describes the five specific
steps: asset inventory, methodology, data limitations and exposure analysis for current assets,
and areas of future development. County- and city-specific asset inventory and exposure analysis
tables are listed in Appendices A through H.
6.1 OVERVIEW OF VULNERABILITY ANALYSIS
A vulnerability analysis predicts the extent of exposure, and the impacts that may result from a
hazard event of a given intensity in a given area. The analysis provides quantitative data that may
be used to identify and prioritize potential mitigation measures by allowing communities to focus
attention on areas with the greatest risk of damage. A vulnerability analysis is divided into five
steps including asset inventory, methodology, data limitations, exposure analysis for current
assets, and areas of future development.
The requirements for a vulnerability analysis as stipulated in DMA 2000 and its implementing
regulations are described below.
A summary of the community’s vulnerability to each hazard that addresses the impact of
each hazard on the community.
DMA 2000 Requirements: Risk Assessment, Assessing Vulnerability, Overview
Assessing Vulnerability: Overview
Requirement §201.6(c)(2)(ii): [The risk assessment shall include a] description of the jurisdiction’s vulnerability to
the hazards described in paragraph (c)(2)(i) of this section. This description shall include an overall summary of
each hazard and its impact on the community.
Element
Does the new or updated plan include an overall summary description of the jurisdiction’s vulnerability to each
hazard?
Does the new or updated plan address the impact of each hazard on the jurisdiction?
Source: FEMA, July 2008.
An identification of the types and numbers of existing vulnerable buildings,
infrastructure, and critical facilities and, if possible, the types and numbers of vulnerable
future development.
DMA 2000 Requirements: Risk Assessment, Assessing Vulnerability, Addressing Repetitive Loss Properties
Assessing Vulnerability: Addressing Repetitive Loss Properties
Requirement §201.6(c)(2)(ii): [The risk assessment ]must also address National Flood Insurance Program (NFIP)
insured structures that have been repetitively damaged by floods.
Element
Does the new or updated plan describe vulnerability in terms of the types and numbers of repetitive loss
properties located in the identified hazard areas?
Source: FEMA, July 2008.
VULNERABILITY ANALYSIS
Columbia County Multi-Jurisdictional Hazard Mitigation Plan 6-2
DMA 2000 Recommendations: Risk Assessment, Assessing Vulnerability, Identifying Structures
Assessing Vulnerability: Identifying Structures
Requirement §201.6(c)(2)(ii)(A): The plan should describe vulnerability in terms of the types and numbers of
existing and future buildings, infrastructure, and critical facilities located in the identified hazard area.
Element
Does the new or updated plan describe vulnerability in terms of the types and numbers of existing buildings,
infrastructure, and critical facilities located in the identified hazard areas?
Does the new or updated plan describe vulnerability in terms of the types and numbers of future buildings,
infrastructure, and critical facilities located in the identified hazard areas?
Source: FEMA, July 2008.
Estimate of potential dollar losses to vulnerable structures and the methodology used to
prepare the estimate.
DMA 2000 Recommendations: Risk Assessment, Assessing Vulnerability, Estimating Potential Losses
Assessing Vulnerability: Estimating Potential Losses
Requirement §201.6(c)(2)(ii)(B): [The plan should describe vulnerability in terms of an] estimate of the potential
dollar losses to vulnerable structures identified in paragraph (c)(2)(i)(A) of this section and a description of the
methodology used to prepare the estimate.
Element
Does the new or updated plan estimate potential dollar losses to vulnerable structures?
Does the new or updated plan describe the methodology used to prepare the estimate?
Source: FEMA, July 2008.
Assess each jurisdiction’s risks where they vary from the risks facing the entire planning
area.
DMA 2000 Recommendations: Multi-Jurisdictional Risk Assessment
Assessing Vulnerability: Multi-Jurisdictional Risk Assessment
Requirement §201.6(c)(2)(iii): For multi-jurisdictional plans, the risk assessment must assess each jurisdiction’s
risks where they vary from the risks facing the entire planning area
Element
Does the new or updated plan include a risk assessment for each participating jurisdiction as needed to reflect
unique or varied risks?
Source: FEMA, July 2008.
6.2 VULNERABILITY ANALYSIS: SPECIFIC STEPS
6.2.1 Asset Inventory
An asset inventory is the first step of a vulnerability analysis. Assets throughout the County that
may be affected by hazard events include population, residential and nonresidential buildings,
critical facilities, and infrastructure.
VULNERABILITY ANALYSIS
Columbia County Multi-Jurisdictional Hazard Mitigation Plan 6-3
The asset inventory delineates Columbia County’s existing building and infrastructure assets and
insured values and are identified in detail in Appendix A, Table A – 7. Jurisdiction-specific asset
inventories are located in Appendices B – H.
Appendix A, Tables A – 8, 9, and 10 (and respective jurisdiction-specific appendices B – H)
portray the critical infrastructure numbers and values, and their potential vulnerability by hazard
type.
Within the Asset Inventory, (Table A-7,) valuations for critical facilities and infrastructure are
insured values. These values have been calculated by multiplying the 2009 value by a
standardized inflation rate (2009 to 2014 dollars) provided by the Bureau of Labor statistics at
9.4%. The Basic Plan committee has determined this to be the most accurate method to report
current values after concluding that a process to reassess these prices, based on market influences
would be unworkable.
Columbia County seeks to protect its population by supporting Oregon State initiatives,
ordinances, building codes, and development regulations. One of the most important initiatives is
to prohibit or not allow future development of buildings, infrastructure and critical facilities in
identified high hazard areas. Any essential infrastructure component will undergo stringent
review to ensure potential hazard risk is mitigated.
6.2.1.1 Population and Building Stock
Population data for all of Columbia County were obtained from the 2010 U.S. Census, which
was collected at the census block level. Columbia County’s total population for 2010 was
49,351with a certified estimated of 49,286 for 2012, and the Portland State University estimated
an increase to 49,680 for 2013. (Appendix A) Jurisdiction specific population data are found in
their respective Appendices B – H.
Estimated numbers of residential buildings and replacement values for those structures, as shown
in Appendices A-f, were obtained from the 2010 U.S. Census. A total of 20,659 residential
buildings were considered in this analysis, including single-family dwellings, mobile homes,
multi-family dwellings, temporary lodgings, and institutional dormitory facilities.
6.2.1.2 Repetitive Loss Properties
Repetitive loss properties are properties that suffer from repeated flooding. FEMA defines a RL
property as a NFIP insured property with at least two $1,000 claims within any 10-year period
since 1978. Severe Repetitive Loss (SRL) properties have been identified by FEMA as most at
risk for repeat flooding. These properties include every property that since 1978 has experienced:
four or more separate building and content claims (that are NFIP insured) each exceeding $5,000
with cumulative claims exceeding $20,000, or at least two separate building claims with
cumulative losses exceeding the value of the property (that is, the value of the structure).
Table 6-1 shows general NFIP data located for the county. Locations for both RL and SRL
properties are not available for publication, however this information is maintained by the NFIP
Coordinator, at the Oregon Department of Land Conservation and Development.
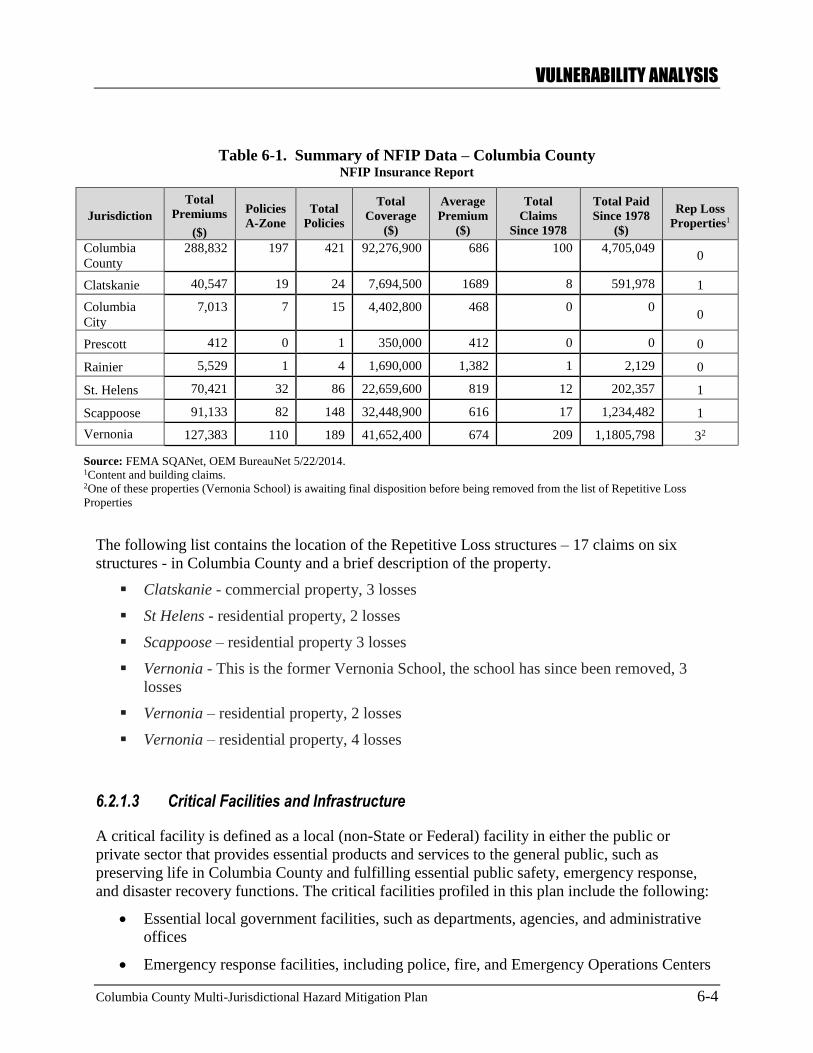
VULNERABILITY ANALYSIS
Columbia County Multi-Jurisdictional Hazard Mitigation Plan 6-4
Table 6-1. Summary of NFIP Data – Columbia County NFIP Insurance Report
Jurisdiction
Total
Premiums
($)
Policies
A-Zone
Total
Policies
Total
Coverage
($)
Average
Premium
($)
Total
Claims
Since 1978
Total Paid
Since 1978
($)
Rep Loss
Properties1
Columbia
County
288,832 197 421 92,276,900 686 100 4,705,049 0
Clatskanie 40,547 19 24 7,694,500 1689 8 591,978 1
Columbia
City
7,013 7 15 4,402,800 468 0 0 0
Prescott 412 0 1 350,000 412 0 0 0
Rainier 5,529 1 4 1,690,000 1,382 1 2,129 0
St. Helens 70,421 32 86 22,659,600 819 12 202,357 1
Scappoose 91,133 82 148 32,448,900 616 17 1,234,482 1
Vernonia 127,383 110 189 41,652,400 674 209 1,1805,798 32
Source: FEMA SQANet, OEM BureauNet 5/22/2014. 1Content and building claims. 2One of these properties (Vernonia School) is awaiting final disposition before being removed from the list of Repetitive Loss
Properties
The following list contains the location of the Repetitive Loss structures – 17 claims on six
structures - in Columbia County and a brief description of the property.
Clatskanie - commercial property, 3 losses
St Helens - residential property, 2 losses
Scappoose – residential property 3 losses
Vernonia - This is the former Vernonia School, the school has since been removed, 3
losses
Vernonia – residential property, 2 losses
Vernonia – residential property, 4 losses
6.2.1.3 Critical Facilities and Infrastructure
A critical facility is defined as a local (non-State or Federal) facility in either the public or
private sector that provides essential products and services to the general public, such as
preserving life in Columbia County and fulfilling essential public safety, emergency response,
and disaster recovery functions. The critical facilities profiled in this plan include the following:
Essential local government facilities, such as departments, agencies, and administrative
offices
Emergency response facilities, including police, fire, and Emergency Operations Centers
VULNERABILITY ANALYSIS
Columbia County Multi-Jurisdictional Hazard Mitigation Plan 6-5
Educational facilities, including grades 1-12
Care facilities, such as congregate living health, residential care, and continuing care
retirement facilities
Public Health Clinics
The total number of county-identified critical facilities is listed in Appendix A. The incorporated
city-specific critical facilities are listed in their corresponding appendices.
Similar to critical facilities, critical infrastructure includes infrastructure that is essential to
preserving life and safety of Columbia County. Critical infrastructure profiled in this plan
includes the following:
State and Federal Highways
Railroad Tracks
Local, State, and Federal bridges
Utilities, including communication (cell, radio, and television), water and wastewater,
and electrical facilities
6.2.2 Methodology
A conservative exposure-level analysis was conducted to assess the risks of the identified
hazards. This analysis is a simplified assessment of the potential effects of the hazards on values
at risk without consideration of probability or level of damage.
Using census block level information, a spatial proportion was used to determine the percentage
of the population and residential and nonresidential structures located where hazards are likely to
occur. Census blocks that are completely within the boundary of a hazard area were determined
to be vulnerable and were totaled. A spatial proportion was also used to determine the amount of
linear assets, such as highways, within a hazard area. The exposure analysis for linear assets was
measured in miles.
Replacement values or insurance coverage were developed for physical assets. These values
were provided by the county and each jurisdiction. For facilities that didn’t have specific values
per building in a multi-building scenario (e.g., schools), the buildings were grouped together and
assigned one value where available. Value information is not available for all critical facilities at
this time and will be collected as it becomes available. For each physical asset located within a
hazard area, exposure was calculated by assuming the worst-case scenario (that is, the asset
would be completely destroyed and would have to be replaced). Finally, the aggregate exposure,
in terms of replacement value or insurance coverage, for each category of structure or facility
was calculated.
A similar analysis was used to evaluate the proportion of the population at risk. However, the
analysis simply represents the number of people at risk; no estimate of the number of potential
injuries or deaths was prepared.
VULNERABILITY ANALYSIS
Columbia County Multi-Jurisdictional Hazard Mitigation Plan 6-6
6.2.3 Data Limitations
The vulnerability estimates provided herein use the best data currently available, and the
methodologies applied result in an approximation of risk. These estimates may be used to
understand relative risk from hazards and potential losses. However, uncertainties are inherent in
any loss estimation methodology, arising in part from incomplete scientific knowledge
concerning hazards and their effects on the built environment as well as the use of
approximations and simplifications that are necessary for a comprehensive analysis.
It is also important to note that the quantitative vulnerability assessment results are limited to the
exposure of people, buildings, and critical facilities and infrastructure to the identified hazards. It
was beyond the scope of this MHMP to develop a more detailed or comprehensive assessment of
risk (including annualized losses, people injured or killed, shelter requirements, loss of
facility/system function, and economic losses). Such impacts may be addressed with future
updates of the MHMP.
6.2.4 Exposure Analysis
The results of the exposure analysis for loss estimations in Columbia County and each
participating jurisdiction are located in Appendices A – H. Each appendix represents a
jurisdiction and lists the critical facilities and the specific hazard areas in which each facility is
located.
6.2.5 Areas of Future Development
Columbia County and the participating jurisdictions represented in this MHMP seek to protect its
population by supporting Oregon State initiatives, ordinances, building codes, and development
regulations. One of the most important initiatives is to prohibit or not allow future development
of buildings, infrastructure and critical facilities in identified high hazard areas. Any proposed
essential infrastructure component will undergo stringent review and design to ensure potential
hazard risk is mitigated.
MITIGATION STRATEGY
Columbia County Multi-Jurisdictional Hazard Mitigation Plan 7-1
7. MITIGATION STRATEGY This section outlines the four-step process for preparing a mitigation strategy including:
Developing mitigation goals,
Identifying mitigation actions,
Evaluating mitigation actions, and
Implementing mitigation action plans.
In 2014 The County Steering Committee, reviewed potential mitigation actions, and approved
the Mitigation Action Plan for the unincorporated portion of the County. The incorporated
jurisdictions pursued the same process. As such, County and city-specific Appendices
(Appendices A – H) are provided with their respective information.
7.1 DEVELOPING MITIGATION GOALS
The requirements for the local hazard mitigation goals, as stipulated in DMA 2000 and its
implementing regulations, are described below.
DMA 2000 Requirements: Mitigation Strategy – Local Hazard Mitigation Goals
Local Hazard Mitigation Goals
Requirement §201.6(c)(3)(i): [The hazard mitigation strategy shall include a] description of mitigation goals to
reduce or avoid long-term vulnerabilities to the identified hazards.
Element
Does the new or updated plan include a description of mitigation goals to reduce or avoid long-term
vulnerabilities to the identified hazards? (GOALS are long-term; represent what the community wants to achieve,
such as “eliminate flood damage,” and are based on the risk assessment findings.)
Source: FEMA, July 2008.
Throughout the 2014 update, the County and participating jurisdictions steering committees
reviewed County and city-specific analysis results as a basis for developing the mitigation goals
and potential mitigation actions (Appendices A – H).
Mitigation goals are defined as general guidelines that explain what a community wants to
achieve in terms of hazard and loss prevention. Goal statements are typically long-range, policy-
oriented statements representing community-wide visions. As such, the Basic Plan Review
Committee decided to keep their original goals (Table 7-1) reflected in their 2009 HMP which
are focused on reducing or avoiding long-term vulnerabilities to the identified hazards.
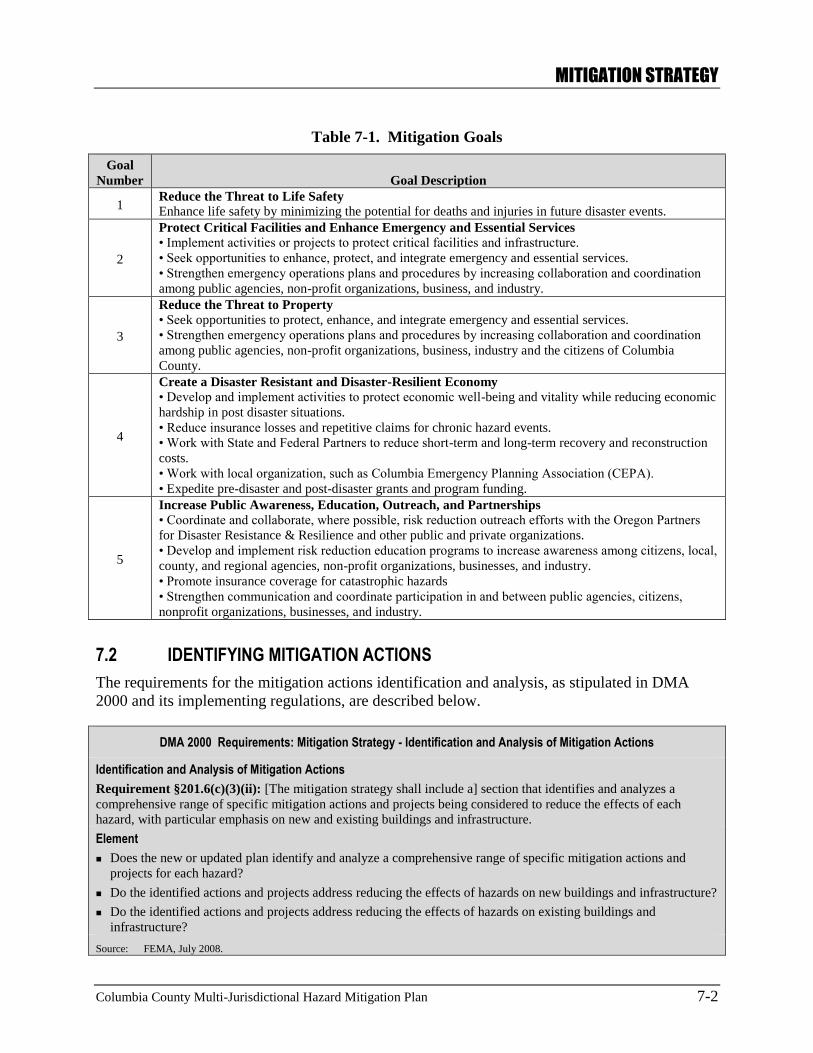
MITIGATION STRATEGY
Columbia County Multi-Jurisdictional Hazard Mitigation Plan 7-2
Table 7-1. Mitigation Goals
Goal
Number Goal Description
1 Reduce the Threat to Life Safety
Enhance life safety by minimizing the potential for deaths and injuries in future disaster events.
2
Protect Critical Facilities and Enhance Emergency and Essential Services
• Implement activities or projects to protect critical facilities and infrastructure.
• Seek opportunities to enhance, protect, and integrate emergency and essential services.
• Strengthen emergency operations plans and procedures by increasing collaboration and coordination
among public agencies, non-profit organizations, business, and industry.
3
Reduce the Threat to Property
• Seek opportunities to protect, enhance, and integrate emergency and essential services.
• Strengthen emergency operations plans and procedures by increasing collaboration and coordination
among public agencies, non-profit organizations, business, industry and the citizens of Columbia
County.
4
Create a Disaster Resistant and Disaster-Resilient Economy
• Develop and implement activities to protect economic well-being and vitality while reducing economic
hardship in post disaster situations.
• Reduce insurance losses and repetitive claims for chronic hazard events.
• Work with State and Federal Partners to reduce short-term and long-term recovery and reconstruction
costs.
• Work with local organization, such as Columbia Emergency Planning Association (CEPA).
• Expedite pre-disaster and post-disaster grants and program funding.
5
Increase Public Awareness, Education, Outreach, and Partnerships
• Coordinate and collaborate, where possible, risk reduction outreach efforts with the Oregon Partners
for Disaster Resistance & Resilience and other public and private organizations.
• Develop and implement risk reduction education programs to increase awareness among citizens, local,
county, and regional agencies, non-profit organizations, businesses, and industry.
• Promote insurance coverage for catastrophic hazards
• Strengthen communication and coordinate participation in and between public agencies, citizens,
nonprofit organizations, businesses, and industry.
7.2 IDENTIFYING MITIGATION ACTIONS
The requirements for the mitigation actions identification and analysis, as stipulated in DMA
2000 and its implementing regulations, are described below.
DMA 2000 Requirements: Mitigation Strategy - Identification and Analysis of Mitigation Actions
Identification and Analysis of Mitigation Actions
Requirement §201.6(c)(3)(ii): [The mitigation strategy shall include a] section that identifies and analyzes a
comprehensive range of specific mitigation actions and projects being considered to reduce the effects of each
hazard, with particular emphasis on new and existing buildings and infrastructure.
Element
Does the new or updated plan identify and analyze a comprehensive range of specific mitigation actions and
projects for each hazard?
Do the identified actions and projects address reducing the effects of hazards on new buildings and infrastructure?
Do the identified actions and projects address reducing the effects of hazards on existing buildings and
infrastructure?
Source: FEMA, July 2008.
MITIGATION STRATEGY
Columbia County Multi-Jurisdictional Hazard Mitigation Plan 7-3
The County and Jurisdictional steering committees then proceeded to evaluate potential
mitigation actions after finalizing the mitigation goals. Mitigation actions are activities,
measures, or projects that help achieve the goals of a mitigation plan. Appendix A depicts the
County’s existing and newly considered mitigation actions developed during this mitigation plan
update. The appendix further defines whether the existing actions were completed, deleted,
deferred, or ongoing. Appendices B through H contain jurisdiction specific mitigation actions
considered as part of this MHMP update.
Appendices A through H contain County and jurisdiction-specific mitigation actions to reduce
hazard impacts to new and existing buildings and infrastructure.
DMA 2000 Requirements: Mitigation Strategy - National Flood Insurance Program (NFIP) Compliance
National Flood Insurance Program (NFIP) Compliance
Requirement §201.6(c)(3)(ii): [The mitigation strategy] must also address the jurisdiction’s participation in the
National Flood Insurance Program (NFIP), and continued compliance with NFIP requirements, as appropriate.
Element
Does the new or updated plan describe the jurisdiction(s) participation in the NFIP?
Does the mitigation strategy identify, analyze and prioritize actions related to continued compliance with the
NFIP?
Source: FEMA, July 2008.
Columbia County, and the Cities of Clatskanie, Columbia City, Prescott, Rainier, St. Helens,
Scappoose, and Vernonia all actively participate in FEMA’s National Flood Insurance Program
(NFIP) and have implemented floodplain policies, regulations, and ordinances to protect their
threatened population and infrastructure to assure NFIP compliance.
Each jurisdiction’s Mitigation Strategy identified and analyzed potential flood mitigation actions
that will fulfill NFIP initiatives. They subsequently selected and prioritized County or
community appropriate actions to ensure an effective flood mitigation program. The County and
jurisdictional appendices (A – H) describe their respective processes. Each jurisdiction also
specifically addressed RL properties.
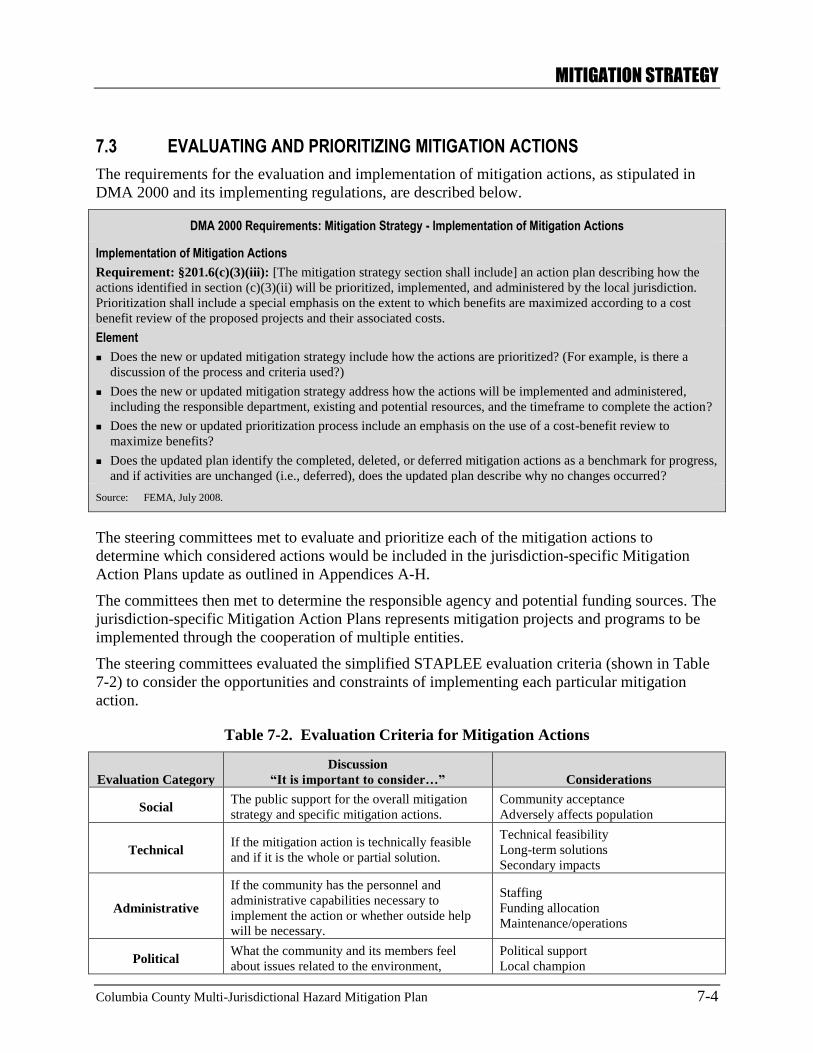
MITIGATION STRATEGY
Columbia County Multi-Jurisdictional Hazard Mitigation Plan 7-4
7.3 EVALUATING AND PRIORITIZING MITIGATION ACTIONS
The requirements for the evaluation and implementation of mitigation actions, as stipulated in
DMA 2000 and its implementing regulations, are described below.
DMA 2000 Requirements: Mitigation Strategy - Implementation of Mitigation Actions
Implementation of Mitigation Actions
Requirement: §201.6(c)(3)(iii): [The mitigation strategy section shall include] an action plan describing how the
actions identified in section (c)(3)(ii) will be prioritized, implemented, and administered by the local jurisdiction.
Prioritization shall include a special emphasis on the extent to which benefits are maximized according to a cost
benefit review of the proposed projects and their associated costs.
Element
Does the new or updated mitigation strategy include how the actions are prioritized? (For example, is there a
discussion of the process and criteria used?)
Does the new or updated mitigation strategy address how the actions will be implemented and administered,
including the responsible department, existing and potential resources, and the timeframe to complete the action?
Does the new or updated prioritization process include an emphasis on the use of a cost-benefit review to
maximize benefits?
Does the updated plan identify the completed, deleted, or deferred mitigation actions as a benchmark for progress,
and if activities are unchanged (i.e., deferred), does the updated plan describe why no changes occurred?
Source: FEMA, July 2008.
The steering committees met to evaluate and prioritize each of the mitigation actions to
determine which considered actions would be included in the jurisdiction-specific Mitigation
Action Plans update as outlined in Appendices A-H.
The committees then met to determine the responsible agency and potential funding sources. The
jurisdiction-specific Mitigation Action Plans represents mitigation projects and programs to be
implemented through the cooperation of multiple entities.
The steering committees evaluated the simplified STAPLEE evaluation criteria (shown in Table
7-2) to consider the opportunities and constraints of implementing each particular mitigation
action.
Table 7-2. Evaluation Criteria for Mitigation Actions
Evaluation Category
Discussion
“It is important to consider…” Considerations
Social The public support for the overall mitigation
strategy and specific mitigation actions.
Community acceptance
Adversely affects population
Technical If the mitigation action is technically feasible
and if it is the whole or partial solution.
Technical feasibility
Long-term solutions
Secondary impacts
Administrative
If the community has the personnel and
administrative capabilities necessary to
implement the action or whether outside help
will be necessary.
Staffing
Funding allocation
Maintenance/operations
Political What the community and its members feel
about issues related to the environment,
Political support
Local champion
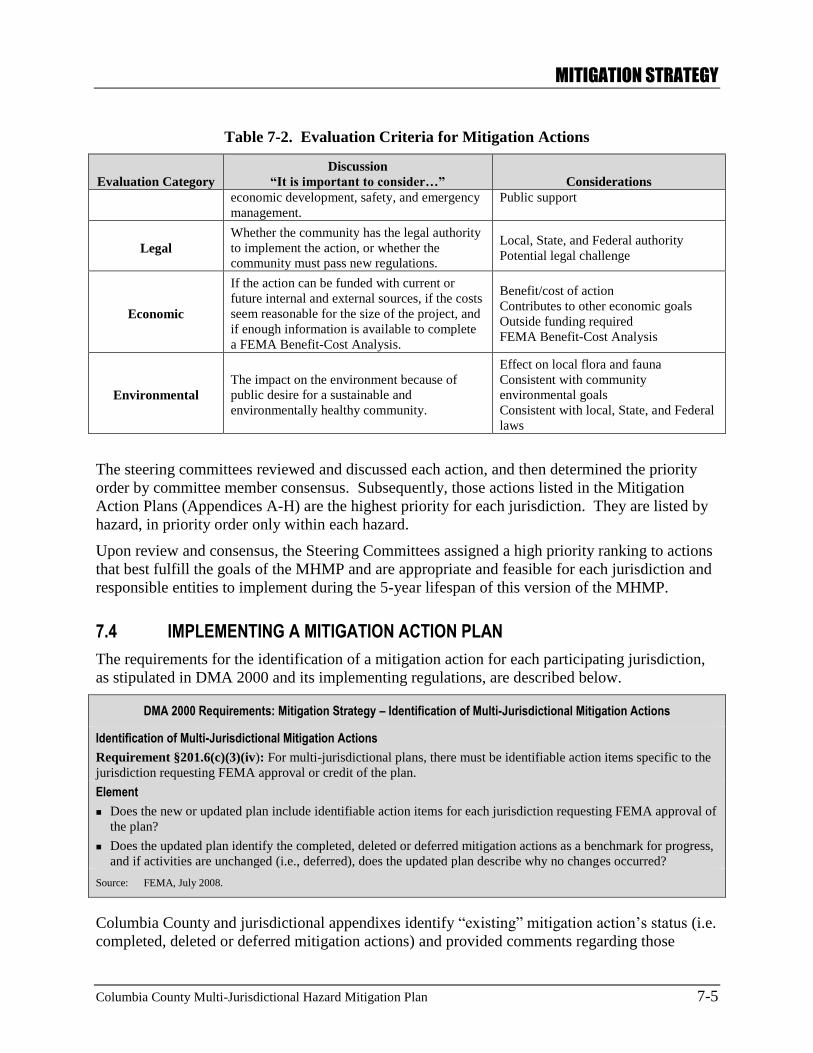
MITIGATION STRATEGY
Columbia County Multi-Jurisdictional Hazard Mitigation Plan 7-5
Table 7-2. Evaluation Criteria for Mitigation Actions
Evaluation Category
Discussion
“It is important to consider…” Considerations
economic development, safety, and emergency
management.
Public support
Legal
Whether the community has the legal authority
to implement the action, or whether the
community must pass new regulations.
Local, State, and Federal authority
Potential legal challenge
Economic
If the action can be funded with current or
future internal and external sources, if the costs
seem reasonable for the size of the project, and
if enough information is available to complete
a FEMA Benefit-Cost Analysis.
Benefit/cost of action
Contributes to other economic goals
Outside funding required
FEMA Benefit-Cost Analysis
Environmental
The impact on the environment because of
public desire for a sustainable and
environmentally healthy community.
Effect on local flora and fauna
Consistent with community
environmental goals
Consistent with local, State, and Federal
laws
The steering committees reviewed and discussed each action, and then determined the priority
order by committee member consensus. Subsequently, those actions listed in the Mitigation
Action Plans (Appendices A-H) are the highest priority for each jurisdiction. They are listed by
hazard, in priority order only within each hazard.
Upon review and consensus, the Steering Committees assigned a high priority ranking to actions
that best fulfill the goals of the MHMP and are appropriate and feasible for each jurisdiction and
responsible entities to implement during the 5-year lifespan of this version of the MHMP.
7.4 IMPLEMENTING A MITIGATION ACTION PLAN
The requirements for the identification of a mitigation action for each participating jurisdiction,
as stipulated in DMA 2000 and its implementing regulations, are described below.
DMA 2000 Requirements: Mitigation Strategy – Identification of Multi-Jurisdictional Mitigation Actions
Identification of Multi-Jurisdictional Mitigation Actions
Requirement §201.6(c)(3)(iv): For multi-jurisdictional plans, there must be identifiable action items specific to the
jurisdiction requesting FEMA approval or credit of the plan.
Element
Does the new or updated plan include identifiable action items for each jurisdiction requesting FEMA approval of
the plan?
Does the updated plan identify the completed, deleted or deferred mitigation actions as a benchmark for progress,
and if activities are unchanged (i.e., deferred), does the updated plan describe why no changes occurred?
Source: FEMA, July 2008.
Columbia County and jurisdictional appendixes identify “existing” mitigation action’s status (i.e.
completed, deleted or deferred mitigation actions) and provided comments regarding those
MITIGATION STRATEGY
Columbia County Multi-Jurisdictional Hazard Mitigation Plan 7-6
actions that were deferred. The tables indicate “Ongoing” for those actions that were
implemented and are now continuous initiatives.
Columbia County’s Mitigation Action Plan matrix (Appendix A) states that the benefit-costs
consideration will be determined once an action undergoes development, and how each
mitigation action will be implemented and administered by the responsible entity where
appropriate.
The Action Plan Matrix for each jurisdiction and the county each share a common feature.
Actions are prioritized from highest to lowest within each section for each hazard.
Roadblocks to Implementing Mitigation Actions:
All jurisdictions rely heavily on available and consistent programmatic funding to ensure
existing programs remain viable. Fluctuations within these funding streams will
dramatically affect each jurisdiction’s mitigation strategies. Reductions will severely
limit successful mitigation action plan implementation.
Permitting processes vary by jurisdiction and regulatory agency. There is no established
clearinghouse or one-stop-shopping process. Coordinating between regulatory agencies
like Fish and Game, the Department of Natural Resources, the Army Corps of Engineers,
and other agencies can be cumbersome and time consuming.
Limited available funding prevents preparing potential mitigation project Benefit/Cost
Analysis prior to project development and submittal for grant application development.
PLAN MAINTENANCE
Columbia County Multi-Jurisdictional Hazard Mitigation Plan 8-1
8. PLAN MAINTENANCE
This section describes a formal plan maintenance process to ensure that the MHMP remains an
active and applicable document. It includes an explanation of how Columbia County Emergency
Management and the Steering Committees intend to organize their efforts to ensure that
improvements and revisions to the MHMP occur in a well-managed, efficient, and coordinated
manner.
The following three process steps are addressed in detail below:
Monitoring, evaluating, and updating the MHMP
Implementation through existing planning mechanisms
Continued public involvement
8.1 MONITORING, EVALUATING, AND UPDATING THE MHMP
The requirements for monitoring, evaluating, and updating the MHMP, as stipulated in the DMA
2000 and its implementing regulations, are described below.
DMA 2000 Requirements: Plan Maintenance Process - Monitoring, Evaluating, and Updating the Plan
Monitoring, Evaluating and Updating the Plan
Requirement §201.6(c)(4)(i): [The plan maintenance process shall include a] section describing the method and
schedule of monitoring, evaluating, and updating the mitigation plan within a five-year cycle.
Element
Does the new or updated plan describe the method and schedule for monitoring the plan, including the
responsible department?
Does the new or updated plan describe the method and schedule for evaluating the plan, including how, when and
by whom (i.e. the responsible department)?
Does the new or updated plan describe the method and schedule for updating the plan within the five-year cycle?
Source: FEMA, July 2008.
The MHMP was prepared as a collaborative effort among Columbia County Emergency
Management (CCEM) and the Steering Committees of the participating jurisdictions. To
maintain momentum and build upon previous hazard mitigation planning efforts and successes,
CCEM will use the Steering Committees to monitor, evaluate, and update the MHMP. Columbia
County Emergency Management, Emergency Manager, will serve as the primary point-of-
contact and will coordinate all local efforts to monitor, evaluate, and revise the MHMP.
Each participating jurisdiction will be responsible for implementing the county- or city-specific
Mitigation Action Plan. CCEM will serve as the primary point of contact and will coordinate all
local efforts to monitor, evaluate, and revise the MHMP.
Each member of the Steering Committee, or representative from each participating jurisdiction,
will conduct an annual review to monitor the progress in implementing the MHMP, particularly
the County- or city-specific Mitigation Action Plan. As shown in Appendix J, the Annual
Review Worksheet will provide the basis for possible changes to the overall MHMP Mitigation
Action Plan and each County- or city-specific Mitigation Action Plan by refocusing on new or
PLAN MAINTENANCE
Columbia County Multi-Jurisdictional Hazard Mitigation Plan 8-2
more threatening hazards, adjusting to changes to, or increases in, resource allocations, and
engaging additional support for the MHMP implementation.
CCEM will initiate an annual review one month prior to the adoption date anniversary. The
findings from these reviews will be presented at the annual Steering Committee meeting.
The review will contain an evaluation of the MHMP implementation progress, particularly the
Mitigation Action Plan Appendices (A-H). The CCEM will use the Annual Review Worksheet
(Appendix J) to document possible changes to the Mitigation Action Plan.
Each review, as shown on the Annual Review Worksheet, will include an evaluation of the
following:
Participation of each jurisdiction and others in the MHMP implementation
Notable changes in the countywide risk of natural or human-caused hazards
Impacts of land development activities and related programs on hazard mitigation
Progress made with the countywide Mitigation Action Plan as well as each county- or
city-Mitigation Action Plan (identify problems and suggest improvements as necessary)
The adequacy of local and county resources for implementation of the MHMP
Each participating jurisdiction will submit a Progress Report (Appendix J) to the planning
coordinator, annually. The report will include the current status of the Mitigation Action Plan’s
mitigation projects, including any changes made to the projects, the identification of
implementation problems and appropriate strategies to overcome them, and whether or not the
project has achieved the appropriate goals identified in the plan.
In addition to the annual review, the Steering Committee will update the MHMP every five (5)
years. To ensure that this update occurs, in the third year following adoption of the MHMP,
CCEM and the Steering Committees will undertake the following activities:
Submit a request for eligible grant-funding for the MHMP update (2019) from the State
of Oregon Division of Emergency Management.
Review FEMA MHMP update requirements for the new planning cycle.
Thoroughly analyze and update the risk of natural and human-caused hazards
countywide.
Provide a copy of the County and its participating jurisdictions’ prior and current years
annual reviews.
Complete a detailed mitigation strategy review and revision.
Update the Mitigation Action Plan for all participating jurisdictions identifying the status
of the currently identified actions and adding newly considered, prioritized, and assigned
actions.
Prepare a new draft MHMP and submit it to the each appropriate governing body for
review.
Submit an updated MHMP to the Oregon Division of Emergency Management and
FEMA for review.
PLAN MAINTENANCE
Columbia County Multi-Jurisdictional Hazard Mitigation Plan 8-3
Present MHMP with FEMA’s “Conditional Approval” to the County and City Councils
for adoption
Return a copy of the finalized MHMP with adoption resolutions from all participating
jurisdictions to FEMA to finalize FEMA’s approval.
8.2 IMPLEMENTATION THROUGH EXISTING PLANNING MECHANISMS
The requirements for implementation through existing planning mechanisms, as stipulated in the
DMA 2000 and its implementing regulations, are described below.
DMA 2000 Requirements: Plan Maintenance Process - Incorporation into Existing Planning Mechanisms
Incorporation into Existing Planning Mechanisms
Requirement §201.6(c)(4)(ii): [The plan shall include a] process by which local governments incorporate the
requirements of the mitigation plan into other planning mechanisms such as comprehensive or capital improvement
plans, when appropriate.
Element
Does the new or updated plan identify other local planning mechanisms available for incorporating the mitigation
requirements of the mitigation plan?
Does the new or updated plan include a process by which the local government will incorporate the mitigation
strategy and other information contained in the plan (e.g., risk assessment) into other planning mechanisms, when
appropriate?
Does the updated plan explain how the local government incorporated the mitigation strategy and other
information contained in the plan (e.g., risk assessment) into other planning mechanisms, when appropriate?
Source: FEMA, July 2008.
The original 2005 Hazard Mitigation Plan called for a steering committee to be convened on a
periodic basis to focus efforts on maintaining the plan and implementing the mitigation strategy
and applicable initiatives. This has occurred at the local level in most instances. Existing
programs continue to address statewide planning goals and legislative requirements. The
County's comprehensive land use plan, capital improvement plan, mandated standards and
building codes currently address identified mitigation initiatives and code compliance
requirements. The county strives to incorporate mitigation actions into existing programs and
procedures as the opportunity arises.
Table 3 in each of appendices A-H identifies the local planning mechanisms and regulatory tools
available for incorporating the mitigation requirements of the mitigation plan.
The Steering Committee, after MHMP adoption, will ensure that the MHMP, in particular each
Mitigation Action Plan is incorporated into existing planning mechanisms. Each Steering
Committee will achieve this incorporation by undertaking the following activities.
Conduct a review of the community-specific regulatory tools to assess the schedule for
integration of the mitigation strategy. These regulatory tools are identified in each
community-specific capability assessment presented in Appendices A-H.
Work with pertinent community departments and agencies to increase MHMP awareness
and provide assistance in integrating the mitigation strategy into relevant planning
PLAN MAINTENANCE
Columbia County Multi-Jurisdictional Hazard Mitigation Plan 8-4
mechanisms. Implementation of these requirements may require updating or amending
specific planning mechanisms.
There were no specific documents identified that had incorporated the results of the original
2005 HMP or of the 2009 MHMP. However, the steering committee members are now aware of
the resources available in this updated document and how they can be utilized to enhance other
planning activities.
8.3 CONTINUED PUBLIC INVOLVEMENT
The requirements for continued public involvement, as stipulated in the DMA 2000 and its
implementing regulations, are described below.
DMA 2000 Requirements: Plan Maintenance Process - Continued Public Involvement
Continued Public Involvement
Requirement §201.6(c)(4)(iii): [The plan maintenance process shall include a] discussion on how the community
will continue public participation in the plan maintenance process.
Element
Does the new or updated plan explain how continued public participation will be obtained? (For example, will
there be public notices, an ongoing mitigation plan committee, or annual review meetings with stakeholders?)
Source: FEMA, July 2008.
CCEM and each of the seven incorporated cities within the County are dedicated to involving the
public directly in the continual reshaping and updating of the MHMP. Electronic and hard copies
of the MHMP will be provided to Columbia County and each city. In addition, a downloadable
copy of the MHMP and any proposed changes will be posted on CCEM’s Web site. This site
will also contain an e-mail address and phone number to which people can direct their comments
or concerns.
CCEM and the steering committees will also identify opportunities to raise community
awareness about the MHMP and the hazards that affect the County and participating
jurisdictions. This effort could include attendance and provision of materials at County-, city-,
and school-sponsored events; through the American Red Cross, the Columbia County Fire
Districts, AARP, and other outreach programs and public mailings. Any public comments
received regarding the MHMP will be collected by CCEM, included in the annual report, and
considered during future MHMP updates.
Any public comments received regarding the MHMP will be collected by the Steering
Committee leader, included in the annual Steering Committee Meeting’s report, and considered
during future MHMP updates.
REFERENCES
Columbia County Multi-Jurisdictional Hazard Mitigation Plan 8-1
References
Association of State Dam Safety Officials. 2008. CRS Report for Congress: Aging
Infrastructure and Dam Safety. Accessed
http://www.fas.org/sgp/crs/homesec/RL33108.pdf August, 2008.
Ballou, B. and Oregon Department of Forestry. 2004. A Short History of Wildland/Urban
Interface Fire in Oregon. Accessed http://www.oregon.gov/ODF/FIRE/fire.shtml.
Accessed July 31, 2008.
Centers for Disease Control and Prevention (CDC). 2008a. Diseases and Conditions: The
Influenza (Flu) Viruses. Accessed http://www.cdc.gov/flu/about/viruses/index.htm
July, 2008.
Centers for Disease Control and Prevention (CDC). 2008b. Diseases and Conditions: Seasonal
Flu. Accessed http://www.cdc.gov/flu/ July, 2008.
Centers for Disease Control and Prevention (CDC). 2008b. Norovirus: Technical Fact Sheet.
National Center for Immunization and Respiratory Diseases, Division of Viral
Diseases. Accessed http://www.cdc.gov/ncidod/dvrd/revb/gastro/norovirus-
factsheet.htm July, 2008.
City of Vernonia. 1996. Comprehensive Plan and Implementing Ordinances.
Columbia County, Columbia County Community WildFire Protection Plan, 2007, Accessed
http://www.co.columbia.or.us/emgt/pdf/columbia_county_comm_wildfire_prot_plan.
pdf November, 2013
Community Right-to-Know (CR2K) Hazardous Substance Incident Search:
http://www.sfm.state.or.us/CR2K_IncDB/Incident_Search.html . Accessed December
2014
Conlan, Roberta, and Service, Robert. 2000. El Niño and La Niña : Tracing the Dance of Ocean
and Atmosphere. National Academy of Sciences. Accessed
http://www7.nationalacademies.org/opus/elnino.html July, 2008.
Diamond, Jared. 1997. Guns, Germs, and Steel: The Fates of Human Societies. W.W. Norton &
Company, Inc., 500 Fifth Avenue, New York, NY 10110.
Diane Pohl, Mayor, Clatskanie, Oregon. Personal Communication with Laura Young of URS
Corporation. July 28, 2008.
Evarts, Russell C. 2005. Geologic Map of the Deer Island Quadrangle, Columbia County,
Oregon and Cowlitz County, Washington. http://pubs.usgs.gov/mf/2002/2392/
Accessed August 1, 2008.
Entranco. 1999. City of Clatskanie Flood Hazard Mitigation Plan.
FEMA (Federal Emergency Management Agency). 2001. How-To Guide #2: Understanding
Your Risks – Identifying Hazards and Estimating Loss Potential. U.S. Department of
Homeland Security, FEMA 386-2. Available:
http://www.fema.gov/fima/planning_toc3.shtm. (July 2008).
FEMA. 2002a. 44 CFR Parts 201 and 206, RIN 3067-AD22, Hazard Mitigation Planning and
Hazard Mitigation Grant Program, Interim Final Rule. In Federal Register 67, No.
REFERENCES
Columbia County Multi-Jurisdictional Hazard Mitigation Plan 8-2
38. U.S. Department of Homeland Security. Available:
http://www.fema.gov/pdf/fima/fr02_4321.pdf. (July 2008).
FEMA. 2002b. State and Local Plan Interim Criteria under the Disaster Mitigation Act of
2000 – Final Draft. U.S. Department of Homeland Security. Available:
http://www.fema.gov/fima/planning_toc4.shtm. (July 2008).
FEMA. 2002c. How-To Guide #1: Getting Started: Building Support for Mitigation Planning.
U.S. Department of Homeland Security, FEMA 386-1. Available:
http://www.fema.gov/fima/planning_toc5.shtm. (July 2008).
FEMA. 2002d. How-To Guide #7: Integrating Manmade Hazards into Mitigation Planning. U.S.
Department of Homeland Security, FEMA 386-7. Available:
http://www.fema.gov/plan/mitplanning/howto7.shtm. (July 2008).
FEMA. 2002e. 44 CFR Parts 201 and 206, RIN 3067-AD22, Hazard Mitigation Planning and
Hazard Mitigation Grant Program, Interim Final Rule. In Federal Register 67, no.
190. U.S. Department of Homeland Security. Available:
http://www.fema.gov/pdf/fima/fr02_24998.pdf. (July 2008).
FEMA. 2003a. How-To Guide #3: Developing the Mitigation Plan; Identifying Mitigation
Actions and Implementing Strategies. U.S. Department of Homeland Security, FEMA
386-3. Available: http://www.fema.gov/plan/mitplanning/howto3.shtm. (July 2008).
FEMA. 2003b. How-To Guide #4: Bringing The Plan to Life; Implementing the Hazard
Mitigation Plan. U.S. Department of Homeland Security, FEMA 386-4. Available:
http://www.fema.gov/plan/mitplanning/howto4.shtm. (July 2008).
FEMA. 2004. Multi-Hazard Mitigation Planning Guidance Under the Disaster Mitigation Act of
2000. Available: http://www.fema.gov/doc/fima/part_3_031904.doc. (July 2008).
FEMA. 2008a. FEMA Q3 Hydrologic Hazard Areas. Accessed http://www.msc.fema.gov May
2008.
FEMA. 2008b. FEMA Oregon State Disaster History. Accessed
http://www.fema.gov/news/disasters_state.fema?id=41 May 2008.
FEMA. 2008c. FEMA Flood Facts. Accessed
http://www.floodsmart.gov/floodsmart/pages/flood_facts.jsp June 2008.
FEMA. 2008d. FEMA Frequently Asked Questions: Flood Zones. Accessed
http://www.floodsmart.gov/floodsmart/pages/faqs_flood.jsp June 2008.
FEMA 20010. FEMA Hazard Mitigation Assistance Unified Guidance, Hazard Mitigation Grant
Program, Pre-Disaster Mitigation Program, Flood Mitigation Assistance Program, Repetitive
Flood Claims Program, Severe Repetitive Loss Program,
http://www.fema.gov/media-library-data/20130726-1737-25045-
4275/final_june_1_2010_hma_unified_guidance_09252012a_508.pdf June 2010.
Goettel, Kenneth. 2005. Multi-Hazard Mitigation Plan for Columbia County, Oregon. Prepared
for Columbia County Emergency Management Services. January 2005.
Goettel, Kenneth. 2005a. Multi-Hazard Mitigation Plan for Vernonia, Oregon. Prepared for the
City of Vernonia. December 2005.
REFERENCES
Columbia County Multi-Jurisdictional Hazard Mitigation Plan 8-3
Homeland Security, 2002, The Homeland Security Act of 2002, Pub. L. No. 107-296 (Nov. 25,
2002), as amended by the Intelligence Reform and Terrorism Prevention Act of 2004,
and the Implementing Recommendations of the 9/11 Commission Act of 2007.
Available at: http://www.whitehouse.gov/deptofhomeland/bill/hsl-bill.pdf Accessed
July 2008.
Interagency Hazard Mitigation Team. 2000. Oregon State Hazard Mitigation Plan. Oregon State
Police – Office of Emergency Management. Salem, OR.
Jones, Kathleen. 2004. Extreme Ice Thicknesses from Freezing Rain. US Army Corps of
Engineers, Cold Regions Research Engineering Laboratory.
Knutson, Cody, Mike Hayes and Tom Phillips. 1998. How to Reduce Drought Risk. Western
Drought Coordination Council. Preparedness and Mitigation Working Group, March
1998.
Kuhn, K. et al. 2005. Using Climate to Predict Infectious Disease Epidemics. World Health
Organization. ISBN 92 4 159686 5. Accessed
http://www.who.int/globalchange/publications/infectdiseases/en/index.html July,
2008.
Ladd, Karen; Health Department Director, Columbia County, Oregon. Personal communication
with Laura Young of URS Corporation. July, 2008.
Lewis, John E., Deputy Assistant Director, Counterterrorism Division, Federal Bureau of
Investigation. Congressional Testimony. Statement before the Senate Judiciary
Committee. May 18, 2004.
Lewis, John E., Deputy Assistant Director, Counterterrorism Division, Federal Bureau of
Investigation. Congressional Testimony. Statement before the Senate Committee on
Environment and Public Works. May 18, 2005.
Loy, William J. ed. Atlas of Oregon, 2nd ed. Portland: University of Oregon Press, 2001.
Lubomudrov, Larissa. 2008. El Niño, Oregon Sea Grant. Accessed
http://seagrant.oregonstate.edu/sgpubs/onlinepubs/g97008.html July, 2008.
Mail Tribune. December 10, 2005. Man Arraigned on Eco terrorism in Oregon. Available at:
http://archive.mailtribune.com/archive/2005/1210/local/stories/02local.htm .
Accessed July 2008.
Marion County, Oregon. 2005. Natural Hazards Mitigation Plan. Accessed
https://scholarsbank.uoregon.edu/dspace/bitstream/1794/4006/1/Marion_County_Haz
ard_Mitigation_Plan.pdf July 2008
Mitchell, Martha. 2008. Scales of Change: Predicting Erosion at the Ocean’s Sedimentary Edge.
Accessed http://www.forester.net/ec_0109_scales.html July 2008.
National Snow and Ice Data Center. Accessed: http://nsidc.org/snow/avalanche/#WHEN
NOAA. 2002. National Weather Service. Floods: The Awesome Power. August 2002.
NOAA. 2008. National Weather Service Definitions. Accessed http://www.weather.gov/glassary
June 2008.
REFERENCES
Columbia County Multi-Jurisdictional Hazard Mitigation Plan 8-4
NOAA. 2008a. National Weather Service Definitions. Accessed
http://www.weather.gov/glassary June 2008.
NOAA. 2008b National Weather Service Forecast Office, Past Storm Event website:
http://www.wrh.noaa.gov/pqr/paststorms/index.php
NOAA. 2008c National Climatic Data Center, National Weather Events Archive: Accessed
http://www4.ncdc.noaa.gov/cgi-win/wwcgi.dll?wwevent~storms July, 2008.
NOAA. 2008d. The Palmer Drought Indices. National Climatic Data Center, National Oceanic
and Atmospheric Administration. Accessed
http://lwf.ncdc.noaa.gov/oa/climate/research/prelim/drought/palmer.html July, 2008.
NOAA/National Weather Service. 2005. Frequently Asked Questions About El Niño and La
Niña.
http://www.cpc.ncep.noaa.gov/products/analysis_monitoring/ensostuff/ensofaq.shtml
#PREDICTION Accessed July, 2008.
O’Conner, J.E. 2003. The Corps of Discovery in the Columbia River Gorge, Oregon and
Washington.
Oregon Department of Water Resources. 2008. Dam Safety and Public Water Supply.
Accessed http://www.wrd.state.or.us/OWRD/SW/dam_safety.shtml August 1, 2008.
Oregon Hazardous Substance Information Survey Annual Report 2005:
http://www.oregon.gov/OSP/SFM/docs/CR2K/Cr2k_pdfs/2005HSISAnnualReport.p
df . Accessed July 2008.
Oregon Mountaineering Association. 2006. Avalanche History. Accessed: http://www.i-
world.net/oma/avalanche/avalanche-history.html
Oregon Natural Hazards Workgroup. (ONHW) 2004. Region 6 (Central Oregon) Hazards
Assessment. Report for: Partnership for Disaster Resilience, Oregon Showcase.
Accessed http://www.oregonshowcase.org/index.cfm?mode=projects&page=region6
July 2006.
Oregon Natural Hazards Workgroup. (ONHW) 2006. Yamhill County Natural Hazards
Mitigation Plan. Report for: Yamhill County Emergency Management, McMinnville,
OR.
Oregon State Oregon Water Resource Department, stream gage Peak Flow Estimation:
http://www.wrd.state.or.us/OWRD/SW/peakflow_gage.shtml
Partnership for Disaster Resilience. 2008. Regional Hazards Viewer. Oregon Showcase.
Accessed
http://mtjune.uoregon.edu/website/hazardmaps/webapp/hazardsViewer_content.html
July, 2008.
Portland State University Center for Population research. http://www.pdx.edu/prc/census-data-
for-oregon Accessed march 2014
Rivers, Leahnette; City Administrator/Recorder, Columbia City, Oregon. Personal
communication with Laura Young of URS Corporation. July, 2008.
REFERENCES
Columbia County Multi-Jurisdictional Hazard Mitigation Plan 8-5
State of Alaska, Division of Homeland Security and Emergency Management. 2007. Alaska
State Hazard Mitigation Plan. §5.13 Oil Spills & Hazardous Materials:
http://www.ak-prepared.com/plans/word_docs/StateHazardMitigationPlan07/5-
13%20Oil%20Spills%20&%20Hazardous%20Materials.doc . Accessed July 2008.
State Interagency Hazard Mitigation Team. 2006. State of Oregon Natural Hazards Mitigation
Plan. http://www.oregonshowcase.org/index.cfm?mode=stateplan. Adopted March 6.
Accessed July 2008.
State of Oregon. 2004. Emergency Management Plan: El Niño-La Niña. Partners for Disaster
Resistance and Resilience. Accessed
http://www.oregonshowcase.org/downloads/pdf/stateplan/OR-SNHMP_elnino-
lanina_chapter.pdf July, 2008.
State of Oregon Department of Justice. 2006. Organized Crime in Oregon. Available at:
http://www.doj.state.or.us/hot_topics/pdf/oc_report_final.pdf . Accessed July 2008.
State of Oregon. 2008. Oregon’s Enhanced State Natural Hazard Mitigation Plan. Accessed
http://www.oregonshowcase.org/index.cfm?mode=stateplan&page=part3 June 2008.
State of Oregon. 2008a. Disease Prevention & Epidemiology. Oregon Department of Human
Services. Accessed http://www.oregon.gov/DHS/ph/preparedness/index.shtml July,
2008.
State of Oregon. 2008b. West Nile Virus: Prevention and Education, Info. Oregon Department of
Human Services, Acute and Communicable Disease Prevention. Accessed
http://www.oregon.gov/DHS/ph/acd/diseases/wnile/wnvprevent.shtml July, 2008.
State of Washington. 2008. Avalanche Preparedness. Washington Military Department,
Emergency Management Division. Accessed
http://www.emd.wa.gov/preparedness/info_house/prep_infohouse_avalanche.shtml
July, 2008.
Sternberg, R.W. 1986. Transport and Accumulation of River-Derived Sediment on the
Washington Continental Shelf, USA.
Taylor, George H.. 2008. Impacts of the El Niño/Southern Oscillation on the Pacific Northwest.
Accessed http://www.ocs.orst.edu/reports/enso_pnw.html July, 2008.
Taylor, George H.. 2008. Climate of Columbia County. Oregon Climate Services, University of
Oregon, Corvalis, OR. Accessed
http://www.ocs.orst.edu/county_climate/Columbia_files/Columbia.html August,
2008.
Tetra Tech. 1992. Reconnaissance Survey of the Lower Columbia River.
Weldon, R.J., et al. 2003. An Update of Quaternary Faults of Central and Eastern Oregon.
http://pubs.usgs.gov/of/2002/of02-301/ . Accessed August 2008.
Urban Wildland Interface Communities Within the Vicinity of Federal Lands That Are at High
Risk From Wildfire, 66 Federal Register 43383-43435 (August 21, 2001).
U.S. Census Bureau. 2010 Census. http://www.census.gov/2010census/ Accessed March 2014.
REFERENCES
Columbia County Multi-Jurisdictional Hazard Mitigation Plan 8-6
USEPA. 2007. Envirofacts Warehouse Toxic Release Inventory:
http://oaspub.epa.gov/enviro/fii_master.fii_retrieve?county_name=Columbia&state_c
ode=OR&all_programs=YES&program_search=1&report=1&page_no=1&output_sq
l_switch=TRUE&database_type=TRIS . Accessed July 2008.
USGS. 2006. Mount Hood, Mount Jefferson, and Mount St. Helens Volcanoes Oregon. Cascades
Volcano Observatory, Vancouver, Washington.
http://vulcan.wr.usgs.gov/Volcanoes/Hood/description_hood.html. Accessed July
2008.
USGS. 2008. Definitions of Drought. MD-DE-DC Science Center, United States Geological
Survey. Accessed http://md.water.usgs.gov/drought/define.html July, 2008.
Young, Laura URS corporation. 2009. Multi-Jurisdictional - Hazard Mitigation Plan for
Columbia County, Oregon. Prepared for Columbia County Department of Emergency
Management. January 2009.


Appendix G
City of Scappoose
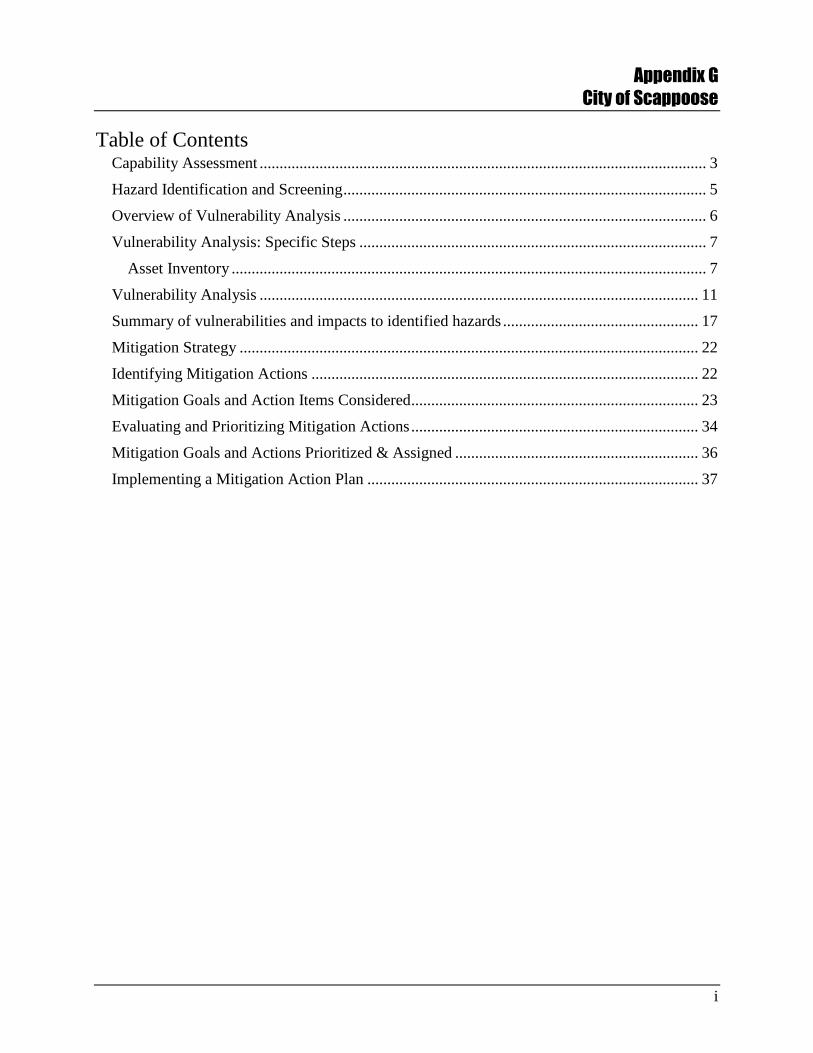
Appendix G
City of Scappoose
i
Table of Contents Capability Assessment ................................................................................................................ 3
Hazard Identification and Screening ........................................................................................... 5
Overview of Vulnerability Analysis ........................................................................................... 6
Vulnerability Analysis: Specific Steps ....................................................................................... 7
Asset Inventory ....................................................................................................................... 7
Vulnerability Analysis .............................................................................................................. 11
Summary of vulnerabilities and impacts to identified hazards ................................................. 17
Mitigation Strategy ................................................................................................................... 22
Identifying Mitigation Actions ................................................................................................. 22
Mitigation Goals and Action Items Considered ........................................................................ 23
Evaluating and Prioritizing Mitigation Actions ........................................................................ 34
Mitigation Goals and Actions Prioritized & Assigned ............................................................. 36
Implementing a Mitigation Action Plan ................................................................................... 37
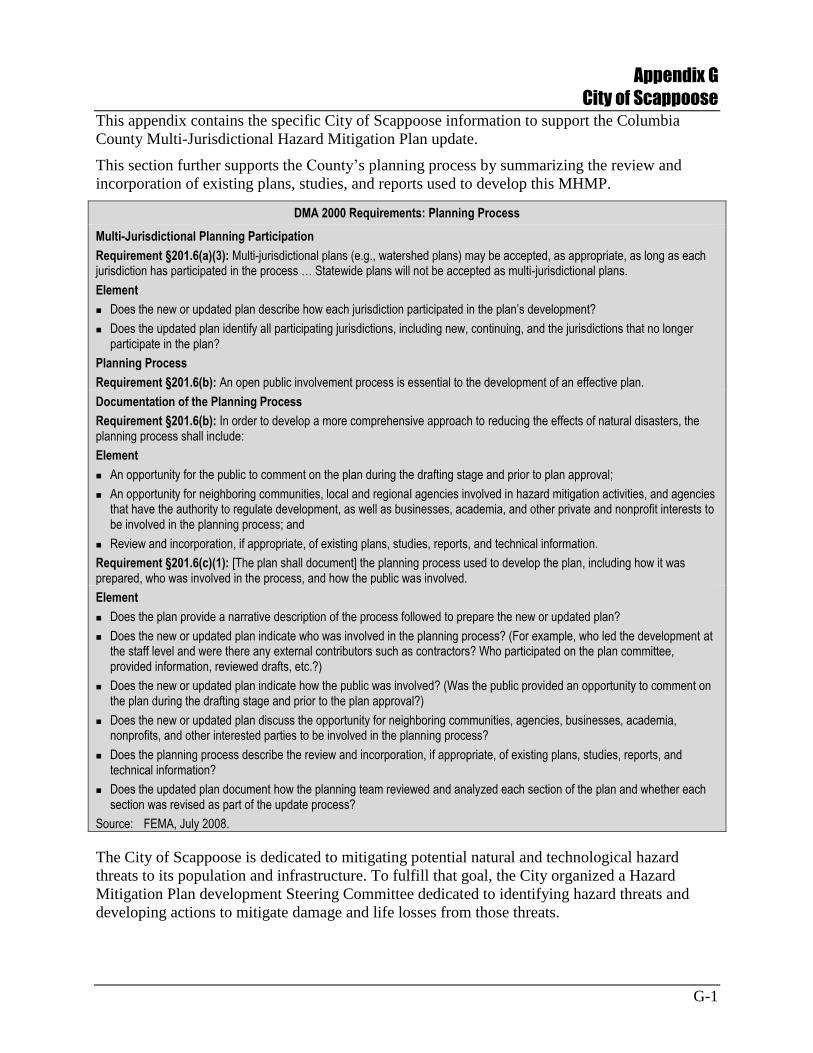
Appendix G
City of Scappoose
G-1
This appendix contains the specific City of Scappoose information to support the Columbia
County Multi-Jurisdictional Hazard Mitigation Plan update.
This section further supports the County’s planning process by summarizing the review and
incorporation of existing plans, studies, and reports used to develop this MHMP.
DMA 2000 Requirements: Planning Process
Multi-Jurisdictional Planning Participation
Requirement §201.6(a)(3): Multi-jurisdictional plans (e.g., watershed plans) may be accepted, as appropriate, as long as each jurisdiction has participated in the process … Statewide plans will not be accepted as multi-jurisdictional plans.
Element
Does the new or updated plan describe how each jurisdiction participated in the plan’s development?
Does the updated plan identify all participating jurisdictions, including new, continuing, and the jurisdictions that no longer participate in the plan?
Planning Process
Requirement §201.6(b): An open public involvement process is essential to the development of an effective plan.
Documentation of the Planning Process
Requirement §201.6(b): In order to develop a more comprehensive approach to reducing the effects of natural disasters, the planning process shall include:
Element
An opportunity for the public to comment on the plan during the drafting stage and prior to plan approval;
An opportunity for neighboring communities, local and regional agencies involved in hazard mitigation activities, and agencies that have the authority to regulate development, as well as businesses, academia, and other private and nonprofit interests to be involved in the planning process; and
Review and incorporation, if appropriate, of existing plans, studies, reports, and technical information.
Requirement §201.6(c)(1): [The plan shall document] the planning process used to develop the plan, including how it was prepared, who was involved in the process, and how the public was involved.
Element
Does the plan provide a narrative description of the process followed to prepare the new or updated plan?
Does the new or updated plan indicate who was involved in the planning process? (For example, who led the development at the staff level and were there any external contributors such as contractors? Who participated on the plan committee, provided information, reviewed drafts, etc.?)
Does the new or updated plan indicate how the public was involved? (Was the public provided an opportunity to comment on the plan during the drafting stage and prior to the plan approval?)
Does the new or updated plan discuss the opportunity for neighboring communities, agencies, businesses, academia, nonprofits, and other interested parties to be involved in the planning process?
Does the planning process describe the review and incorporation, if appropriate, of existing plans, studies, reports, and technical information?
Does the updated plan document how the planning team reviewed and analyzed each section of the plan and whether each section was revised as part of the update process?
Source: FEMA, July 2008.
The City of Scappoose is dedicated to mitigating potential natural and technological hazard
threats to its population and infrastructure. To fulfill that goal, the City organized a Hazard
Mitigation Plan development Steering Committee dedicated to identifying hazard threats and
developing actions to mitigate damage and life losses from those threats.
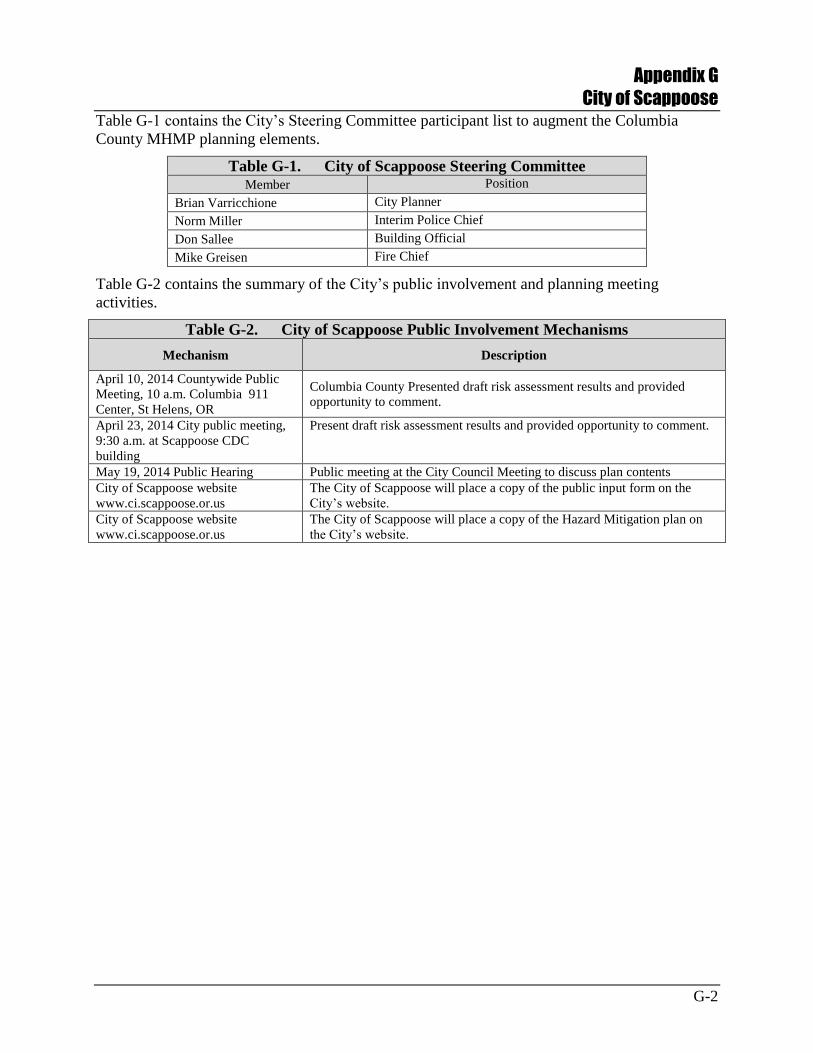
Appendix G
City of Scappoose
G-2
Table G-1 contains the City’s Steering Committee participant list to augment the Columbia
County MHMP planning elements.
Table G-1. City of Scappoose Steering Committee Member Position
Brian Varricchione City Planner
Norm Miller Interim Police Chief
Don Sallee Building Official
Mike Greisen Fire Chief
Table G-2 contains the summary of the City’s public involvement and planning meeting
activities.
Table G-2. City of Scappoose Public Involvement Mechanisms
Mechanism Description
April 10, 2014 Countywide Public
Meeting, 10 a.m. Columbia 911
Center, St Helens, OR
Columbia County Presented draft risk assessment results and provided
opportunity to comment.
April 23, 2014 City public meeting,
9:30 a.m. at Scappoose CDC
building
Present draft risk assessment results and provided opportunity to comment.
May 19, 2014 Public Hearing Public meeting at the City Council Meeting to discuss plan contents
City of Scappoose website
www.ci.scappoose.or.us
The City of Scappoose will place a copy of the public input form on the
City’s website.
City of Scappoose website
www.ci.scappoose.or.us
The City of Scappoose will place a copy of the Hazard Mitigation plan on
the City’s website.
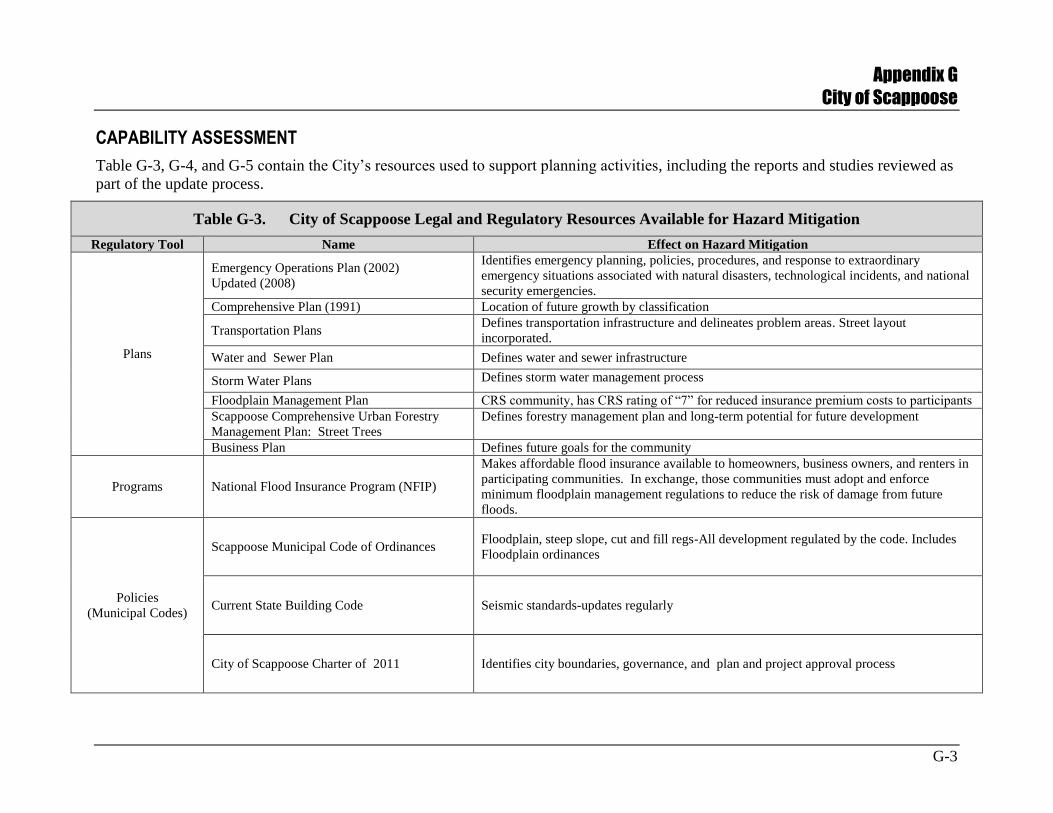
Appendix G
City of Scappoose
G-3
CAPABILITY ASSESSMENT
Table G-3, G-4, and G-5 contain the City’s resources used to support planning activities, including the reports and studies reviewed as
part of the update process.
Table G-3. City of Scappoose Legal and Regulatory Resources Available for Hazard Mitigation
Regulatory Tool Name Effect on Hazard Mitigation
Plans
Emergency Operations Plan (2002)
Updated (2008)
Identifies emergency planning, policies, procedures, and response to extraordinary
emergency situations associated with natural disasters, technological incidents, and national
security emergencies.
Comprehensive Plan (1991) Location of future growth by classification
Transportation Plans Defines transportation infrastructure and delineates problem areas. Street layout
incorporated.
Water and Sewer Plan Defines water and sewer infrastructure
Storm Water Plans Defines storm water management process
Floodplain Management Plan CRS community, has CRS rating of “7” for reduced insurance premium costs to participants
Scappoose Comprehensive Urban Forestry
Management Plan: Street Trees
Defines forestry management plan and long-term potential for future development
Business Plan Defines future goals for the community
Programs National Flood Insurance Program (NFIP)
Makes affordable flood insurance available to homeowners, business owners, and renters in
participating communities. In exchange, those communities must adopt and enforce
minimum floodplain management regulations to reduce the risk of damage from future
floods.
Policies
(Municipal Codes)
Scappoose Municipal Code of Ordinances Floodplain, steep slope, cut and fill regs-All development regulated by the code. Includes
Floodplain ordinances
Current State Building Code Seismic standards-updates regularly
City of Scappoose Charter of 2011 Identifies city boundaries, governance, and plan and project approval process
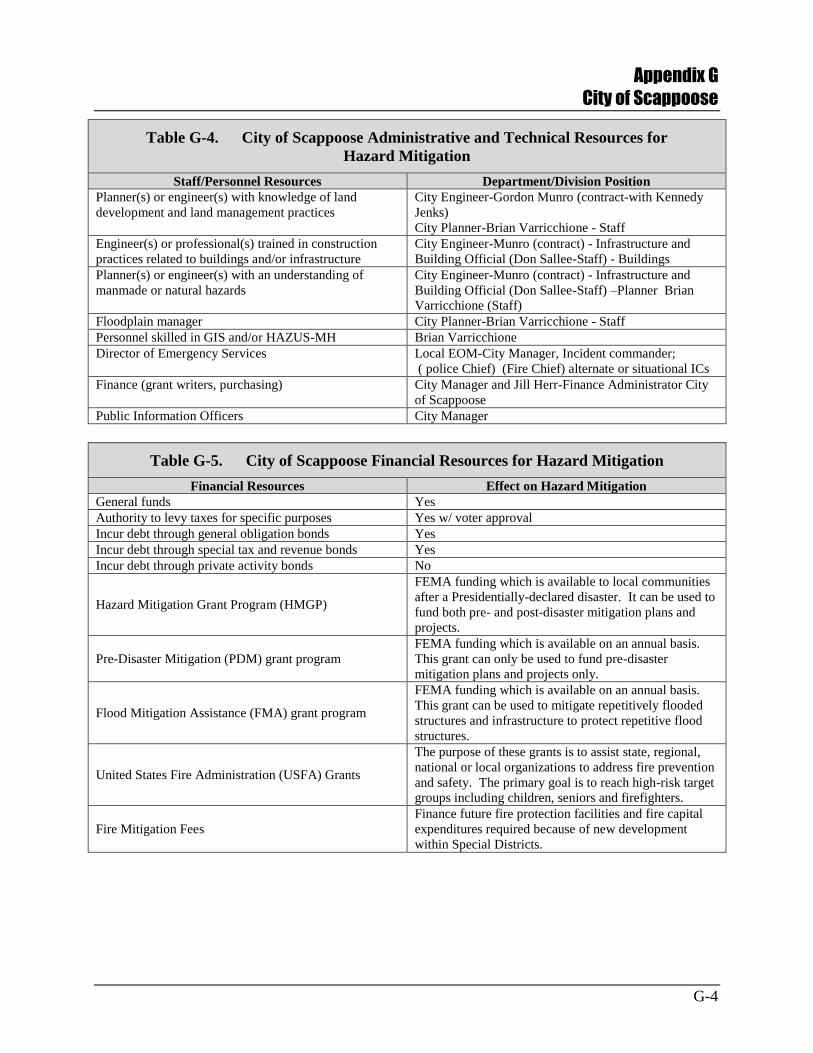
Appendix G
City of Scappoose
G-4
Table G-4. City of Scappoose Administrative and Technical Resources for
Hazard Mitigation
Staff/Personnel Resources Department/Division Position
Planner(s) or engineer(s) with knowledge of land
development and land management practices
City Engineer-Gordon Munro (contract-with Kennedy
Jenks)
City Planner-Brian Varricchione - Staff
Engineer(s) or professional(s) trained in construction
practices related to buildings and/or infrastructure
City Engineer-Munro (contract) - Infrastructure and
Building Official (Don Sallee-Staff) - Buildings
Planner(s) or engineer(s) with an understanding of
manmade or natural hazards
City Engineer-Munro (contract) - Infrastructure and
Building Official (Don Sallee-Staff) –Planner Brian
Varricchione (Staff)
Floodplain manager City Planner-Brian Varricchione - Staff
Personnel skilled in GIS and/or HAZUS-MH Brian Varricchione
Director of Emergency Services Local EOM-City Manager, Incident commander;
( police Chief) (Fire Chief) alternate or situational ICs
Finance (grant writers, purchasing) City Manager and Jill Herr-Finance Administrator City
of Scappoose
Public Information Officers City Manager
Table G-5. City of Scappoose Financial Resources for Hazard Mitigation
Financial Resources Effect on Hazard Mitigation
General funds Yes
Authority to levy taxes for specific purposes Yes w/ voter approval
Incur debt through general obligation bonds Yes
Incur debt through special tax and revenue bonds Yes
Incur debt through private activity bonds No
Hazard Mitigation Grant Program (HMGP)
FEMA funding which is available to local communities
after a Presidentially-declared disaster. It can be used to
fund both pre- and post-disaster mitigation plans and
projects.
Pre-Disaster Mitigation (PDM) grant program
FEMA funding which is available on an annual basis.
This grant can only be used to fund pre-disaster
mitigation plans and projects only.
Flood Mitigation Assistance (FMA) grant program
FEMA funding which is available on an annual basis.
This grant can be used to mitigate repetitively flooded
structures and infrastructure to protect repetitive flood
structures.
United States Fire Administration (USFA) Grants
The purpose of these grants is to assist state, regional,
national or local organizations to address fire prevention
and safety. The primary goal is to reach high-risk target
groups including children, seniors and firefighters.
Fire Mitigation Fees
Finance future fire protection facilities and fire capital
expenditures required because of new development
within Special Districts.
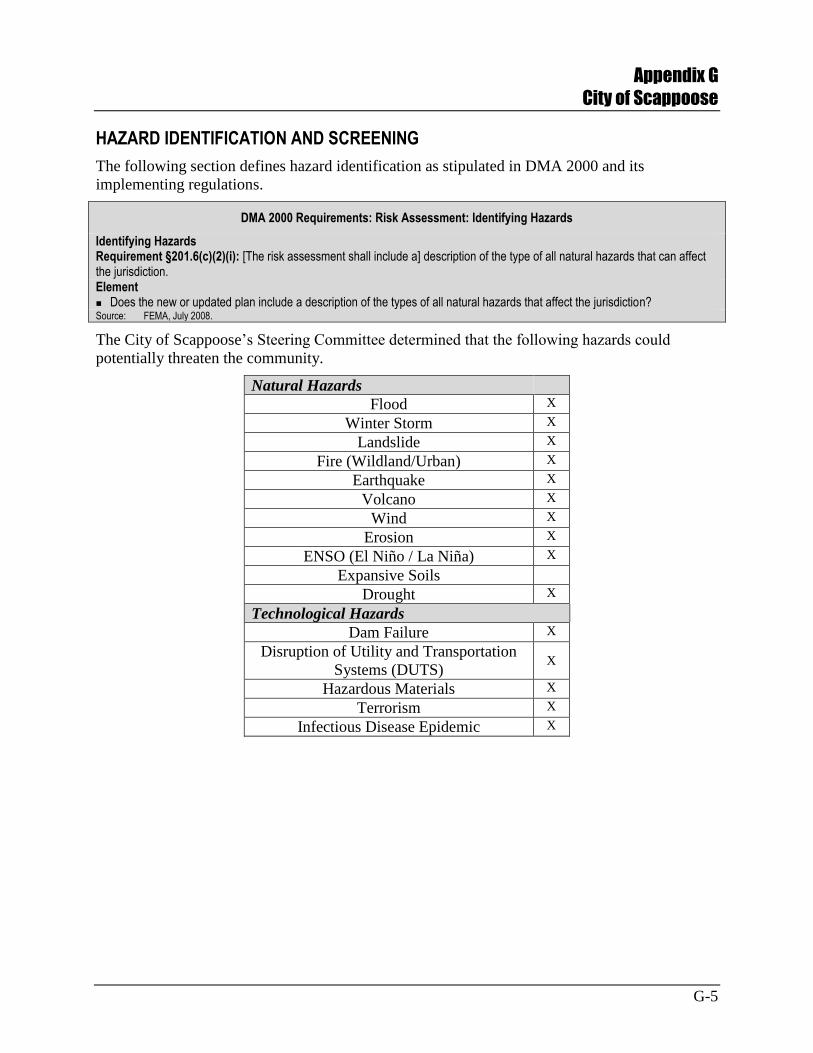
Appendix G
City of Scappoose
G-5
HAZARD IDENTIFICATION AND SCREENING
The following section defines hazard identification as stipulated in DMA 2000 and its
implementing regulations.
DMA 2000 Requirements: Risk Assessment: Identifying Hazards
Identifying Hazards Requirement §201.6(c)(2)(i): [The risk assessment shall include a] description of the type of all natural hazards that can affect the jurisdiction. Element Does the new or updated plan include a description of the types of all natural hazards that affect the jurisdiction? Source: FEMA, July 2008.
The City of Scappoose’s Steering Committee determined that the following hazards could
potentially threaten the community.
Natural Hazards
Flood X
Winter Storm X
Landslide X
Fire (Wildland/Urban) X
Earthquake X
Volcano X
Wind X
Erosion X
ENSO (El Niño / La Niña) X
Expansive Soils
Drought X
Technological Hazards
Dam Failure X
Disruption of Utility and Transportation
Systems (DUTS) X
Hazardous Materials X
Terrorism X
Infectious Disease Epidemic X
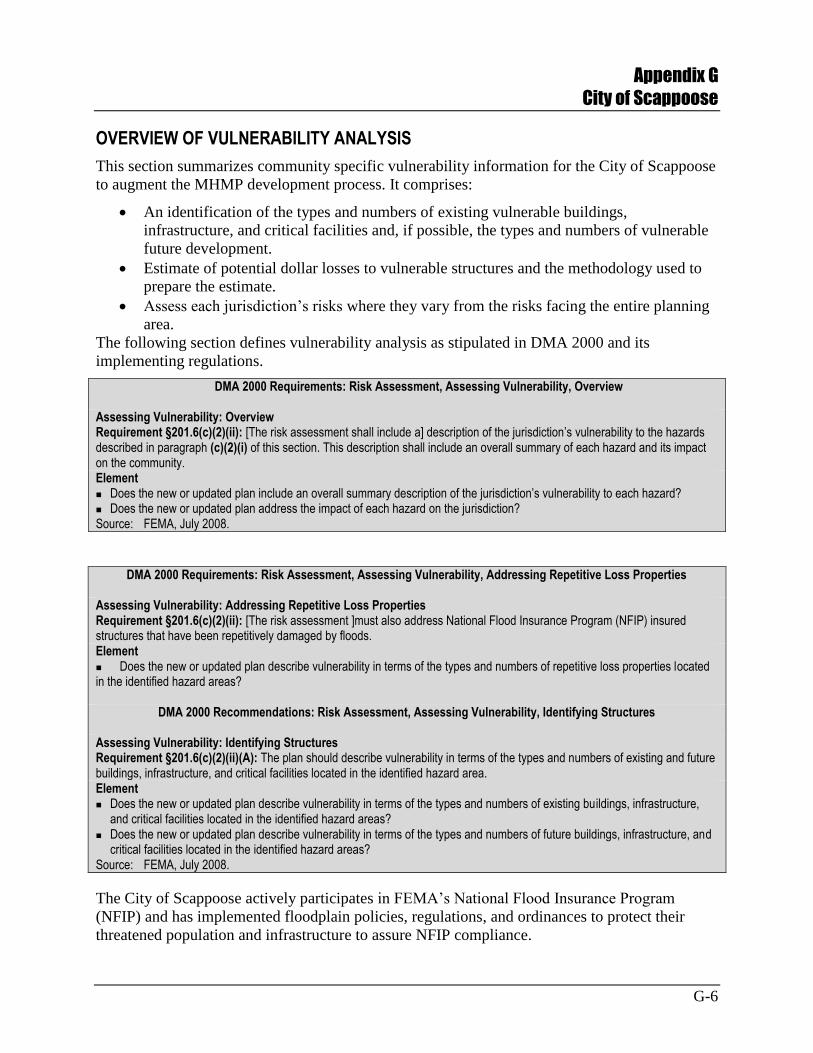
Appendix G
City of Scappoose
G-6
OVERVIEW OF VULNERABILITY ANALYSIS
This section summarizes community specific vulnerability information for the City of Scappoose
to augment the MHMP development process. It comprises:
An identification of the types and numbers of existing vulnerable buildings,
infrastructure, and critical facilities and, if possible, the types and numbers of vulnerable
future development.
Estimate of potential dollar losses to vulnerable structures and the methodology used to
prepare the estimate.
Assess each jurisdiction’s risks where they vary from the risks facing the entire planning
area.
The following section defines vulnerability analysis as stipulated in DMA 2000 and its
implementing regulations.
DMA 2000 Requirements: Risk Assessment, Assessing Vulnerability, Overview
Assessing Vulnerability: Overview Requirement §201.6(c)(2)(ii): [The risk assessment shall include a] description of the jurisdiction’s vulnerability to the hazards described in paragraph (c)(2)(i) of this section. This description shall include an overall summary of each hazard and its impact on the community. Element Does the new or updated plan include an overall summary description of the jurisdiction’s vulnerability to each hazard? Does the new or updated plan address the impact of each hazard on the jurisdiction? Source: FEMA, July 2008.
DMA 2000 Requirements: Risk Assessment, Assessing Vulnerability, Addressing Repetitive Loss Properties
Assessing Vulnerability: Addressing Repetitive Loss Properties Requirement §201.6(c)(2)(ii): [The risk assessment ]must also address National Flood Insurance Program (NFIP) insured structures that have been repetitively damaged by floods. Element Does the new or updated plan describe vulnerability in terms of the types and numbers of repetitive loss properties located in the identified hazard areas?
DMA 2000 Recommendations: Risk Assessment, Assessing Vulnerability, Identifying Structures
Assessing Vulnerability: Identifying Structures Requirement §201.6(c)(2)(ii)(A): The plan should describe vulnerability in terms of the types and numbers of existing and future buildings, infrastructure, and critical facilities located in the identified hazard area. Element Does the new or updated plan describe vulnerability in terms of the types and numbers of existing buildings, infrastructure,
and critical facilities located in the identified hazard areas? Does the new or updated plan describe vulnerability in terms of the types and numbers of future buildings, infrastructure, and
critical facilities located in the identified hazard areas? Source: FEMA, July 2008.
The City of Scappoose actively participates in FEMA’s National Flood Insurance Program
(NFIP) and has implemented floodplain policies, regulations, and ordinances to protect their
threatened population and infrastructure to assure NFIP compliance.
Appendix G
City of Scappoose
G-7
The City’s Mitigation Strategy identified and analyzed potential flood mitigation actions that
would fulfill NFIP initiatives, and prioritized County or community appropriate actions to assure
an effective flood mitigation program.
DMA 2000 Recommendations: Risk Assessment, Assessing Vulnerability, Estimating Potential Losses
Assessing Vulnerability: Estimating Potential Losses Requirement §201.6(c)(2)(ii)(B): [The plan should describe vulnerability in terms of an] estimate of the potential dollar losses to vulnerable structures identified in paragraph (c)(2)(i)(A) of this section and a description of the methodology used to prepare the estimate. Element Does the new or updated plan estimate potential dollar losses to vulnerable structures? Does the new or updated plan describe the methodology used to prepare the estimate? Source:
DMA 2000 Recommendations: Multi-Jurisdictional Risk Assessment
Assessing Vulnerability: Multi-Jurisdictional Risk Assessment Requirement §201.6(c)(2)(iii): For multi-jurisdictional plans, the risk assessment must assess each jurisdiction’s risks where they vary from the risks facing the entire planning area Element Does the new or updated plan include a risk assessment for each participating jurisdiction as needed to reflect unique or
varied risks? Source: FEMA, July 2008.
VULNERABILITY ANALYSIS: SPECIFIC STEPS
Asset Inventory
Asset inventory is the first step of a vulnerability analysis. Assets within each community that
may be affected by hazard events include population, residential and nonresidential buildings,
critical facilities, and infrastructure.
The asset inventory delineates the City’s existing building and infrastructure assets and insured
values and are identified in detail in Tables G-6A, G-6B and G-7.
Tables G-8, G-9, and G-10 portray the City’s critical infrastructure numbers and values, and their
potential vulnerability by hazard type.
The City of Scappoose seeks to protect its population by supporting Columbia County and
Oregon State initiatives, ordinances, building codes, and development regulations. One of the
most important initiatives is to prohibit or not allow future development of buildings,
infrastructure and critical facilities in identified high hazard areas. Any essential infrastructure
component will undergo stringent review to ensure potential hazard risk will be mitigated.
Population and Building Stock
Population data listed in Table G-6A were obtained from the 2010 U.S. Census, UGB report and
Portland State University. It comprises census block level data, and estimates from university
conducted community research.
The City’s existing building and infrastructure and insured values are identified in Tables G-6A,
G-6B, and G-7.
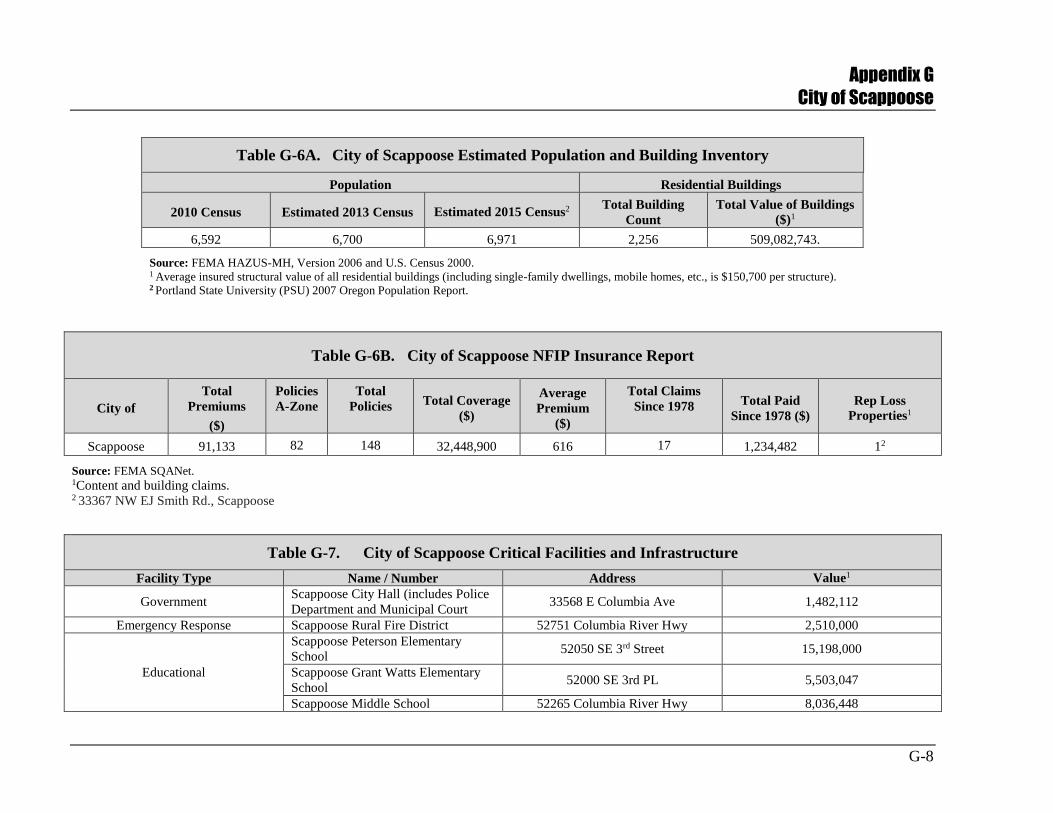
Appendix G
City of Scappoose
G-8
Table G-6A. City of Scappoose Estimated Population and Building Inventory
Population Residential Buildings
2010 Census Estimated 2013 Census Estimated 2015 Census2 Total Building
Count
Total Value of Buildings
($)1
6,592 6,700 6,971 2,256 509,082,743.
Source: FEMA HAZUS-MH, Version 2006 and U.S. Census 2000. 1 Average insured structural value of all residential buildings (including single-family dwellings, mobile homes, etc., is $150,700 per structure). 2 Portland State University (PSU) 2007 Oregon Population Report.
Table G-6B. City of Scappoose NFIP Insurance Report
City of
Total
Premiums
($)
Policies
A-Zone
Total
Policies Total Coverage
($)
Average
Premium
($)
Total Claims
Since 1978 Total Paid
Since 1978 ($)
Rep Loss
Properties1
Scappoose 91,133 82 148 32,448,900 616 17 1,234,482 12
Source: FEMA SQANet. 1Content and building claims. 2 33367 NW EJ Smith Rd., Scappoose
Table G-7. City of Scappoose Critical Facilities and Infrastructure
Facility Type Name / Number Address Value1
Government Scappoose City Hall (includes Police
Department and Municipal Court 33568 E Columbia Ave 1,482,112
Emergency Response Scappoose Rural Fire District 52751 Columbia River Hwy 2,510,000
Educational
Scappoose Peterson Elementary
School 52050 SE 3rd Street 15,198,000
Scappoose Grant Watts Elementary
School 52000 SE 3rd PL 5,503,047
Scappoose Middle School 52265 Columbia River Hwy 8,036,448
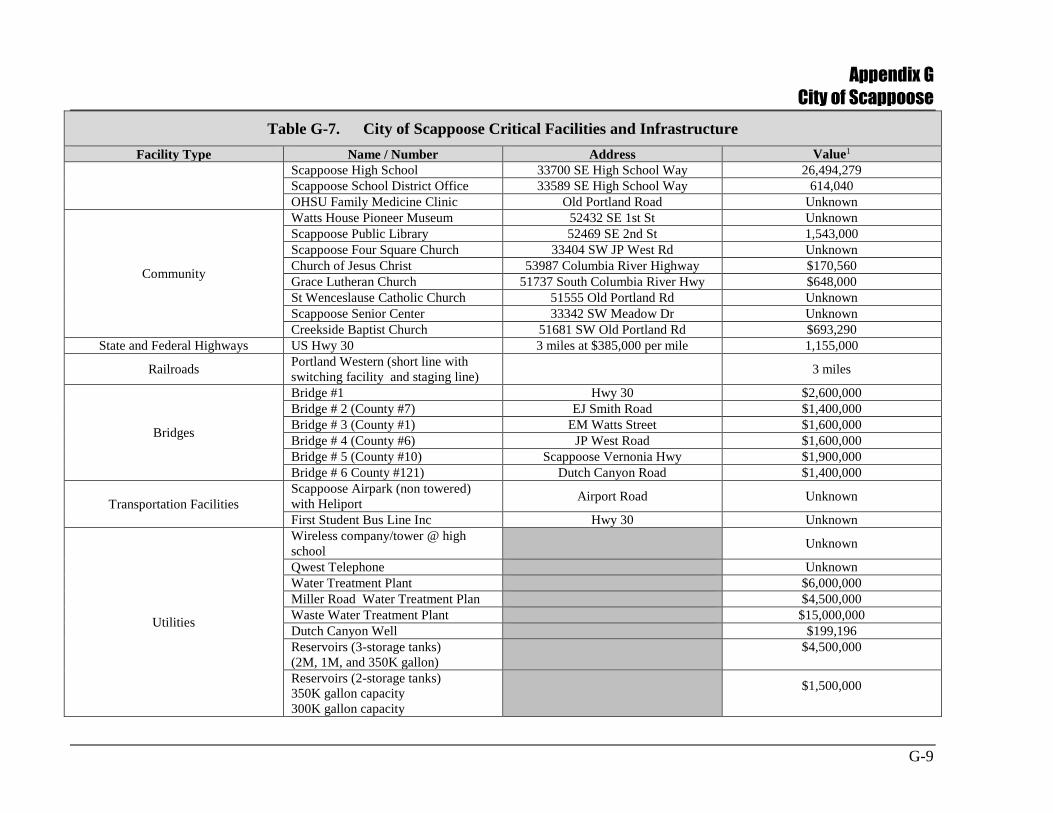
Appendix G
City of Scappoose
G-9
Table G-7. City of Scappoose Critical Facilities and Infrastructure
Facility Type Name / Number Address Value1
Scappoose High School 33700 SE High School Way 26,494,279
Scappoose School District Office 33589 SE High School Way 614,040
OHSU Family Medicine Clinic Old Portland Road Unknown
Community
Watts House Pioneer Museum 52432 SE 1st St Unknown
Scappoose Public Library 52469 SE 2nd St 1,543,000
Scappoose Four Square Church 33404 SW JP West Rd Unknown
Church of Jesus Christ 53987 Columbia River Highway $170,560
Grace Lutheran Church 51737 South Columbia River Hwy $648,000
St Wenceslause Catholic Church 51555 Old Portland Rd Unknown
Scappoose Senior Center 33342 SW Meadow Dr Unknown
Creekside Baptist Church 51681 SW Old Portland Rd $693,290
State and Federal Highways US Hwy 30 3 miles at $385,000 per mile 1,155,000
Railroads Portland Western (short line with
switching facility and staging line) 3 miles
Bridges
Bridge #1 Hwy 30 $2,600,000
Bridge # 2 (County #7) EJ Smith Road $1,400,000
Bridge # 3 (County #1) EM Watts Street $1,600,000
Bridge # 4 (County #6) JP West Road $1,600,000
Bridge # 5 (County #10) Scappoose Vernonia Hwy $1,900,000
Bridge # 6 County #121) Dutch Canyon Road $1,400,000
Transportation Facilities
Scappoose Airpark (non towered)
with Heliport Airport Road Unknown
First Student Bus Line Inc Hwy 30 Unknown
Utilities
Wireless company/tower @ high
school Unknown
Qwest Telephone Unknown
Water Treatment Plant Key Road $6,000,000
Miller Road Water Treatment Plan Miller Road $4,500,000
Waste Water Treatment Plant 34485 E Columbia Ave $15,000,000
Dutch Canyon Well SW Corner of Old Portland Rd $199,196
Reservoirs (3-storage tanks)
(2M, 1M, and 350K gallon) 3 Keys Road Water Plant
$4,500,000
Reservoirs (2-storage tanks)
350K gallon capacity
300K gallon capacity
Belle Vista Drive $1,500,000
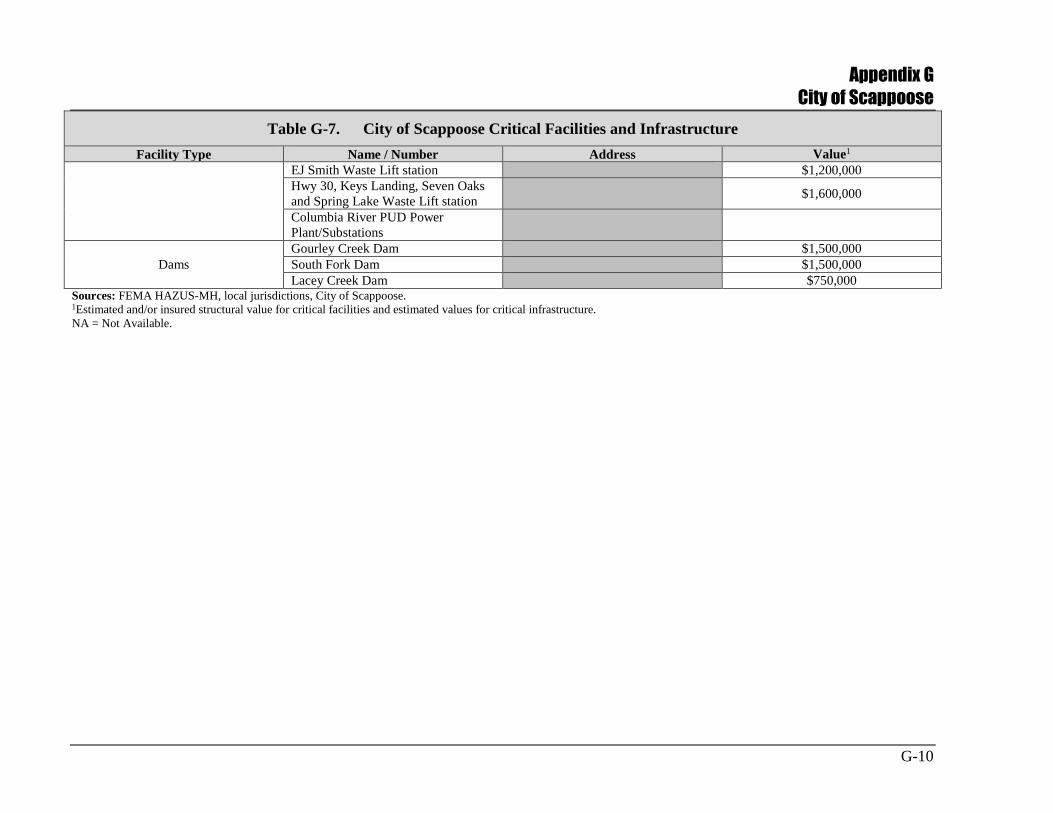
Appendix G
City of Scappoose
G-10
Table G-7. City of Scappoose Critical Facilities and Infrastructure
Facility Type Name / Number Address Value1
EJ Smith Waste Lift station 333 $1,200,000
Hwy 30, Keys Landing, Seven Oaks
and Spring Lake Waste Lift station $1,600,000
Columbia River PUD Power
Plant/Substations E Columbia Ave
Dams
Gourley Creek Dam unknown $1,500,000
South Fork Dam unknown $1,500,000
Lacey Creek Dam unknown $750,000 Sources: FEMA HAZUS-MH, local jurisdictions, City of Scappoose. 1Estimated and/or insured structural value for critical facilities and estimated values for critical infrastructure.
NA = Not Available.
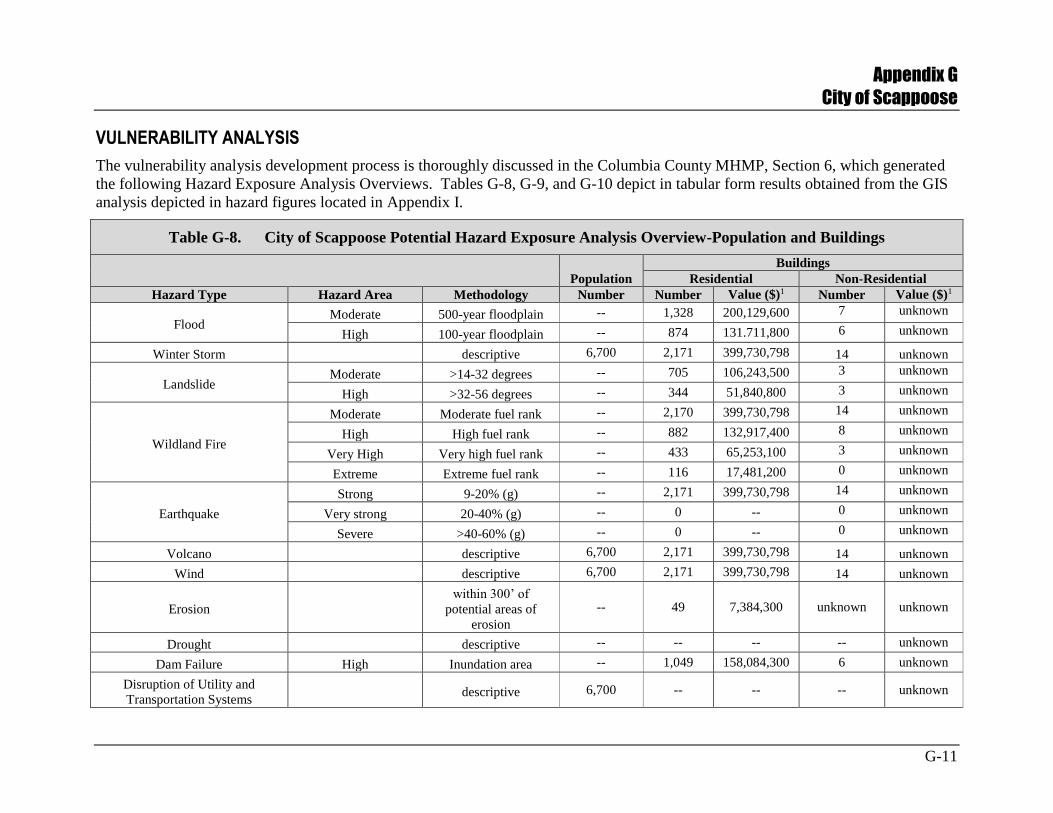
Appendix G
City of Scappoose
G-11
VULNERABILITY ANALYSIS
The vulnerability analysis development process is thoroughly discussed in the Columbia County MHMP, Section 6, which generated
the following Hazard Exposure Analysis Overviews. Tables G-8, G-9, and G-10 depict in tabular form results obtained from the GIS
analysis depicted in hazard figures located in Appendix I.
Table G-8. City of Scappoose Potential Hazard Exposure Analysis Overview-Population and Buildings
Population
Buildings
Residential Non-Residential
Hazard Type Hazard Area Methodology Number Number Value ($)1 Number Value ($)1
Flood Moderate 500-year floodplain -- 1,328 200,129,600 7 unknown
High 100-year floodplain -- 874 131.711,800 6 unknown
Winter Storm descriptive 6,700 2,171 399,730,798 14 unknown
Landslide Moderate >14-32 degrees -- 705 106,243,500 3 unknown
High >32-56 degrees -- 344 51,840,800 3 unknown
Wildland Fire
Moderate Moderate fuel rank -- 2,170 399,730,798 14 unknown
High High fuel rank -- 882 132,917,400 8 unknown
Very High Very high fuel rank -- 433 65,253,100 3 unknown
Extreme Extreme fuel rank -- 116 17,481,200 0 unknown
Earthquake
Strong 9-20% (g) -- 2,171 399,730,798 14 unknown
Very strong 20-40% (g) -- 0 -- 0 unknown
Severe >40-60% (g) -- 0 -- 0 unknown
Volcano descriptive 6,700 2,171 399,730,798 14 unknown
Wind descriptive 6,700 2,171 399,730,798 14 unknown
Erosion
within 300’ of
potential areas of
erosion
-- 49 7,384,300 unknown unknown
Drought descriptive -- -- -- -- unknown
Dam Failure High Inundation area -- 1,049 158,084,300 6 unknown
Disruption of Utility and
Transportation Systems descriptive 6,700 -- -- -- unknown
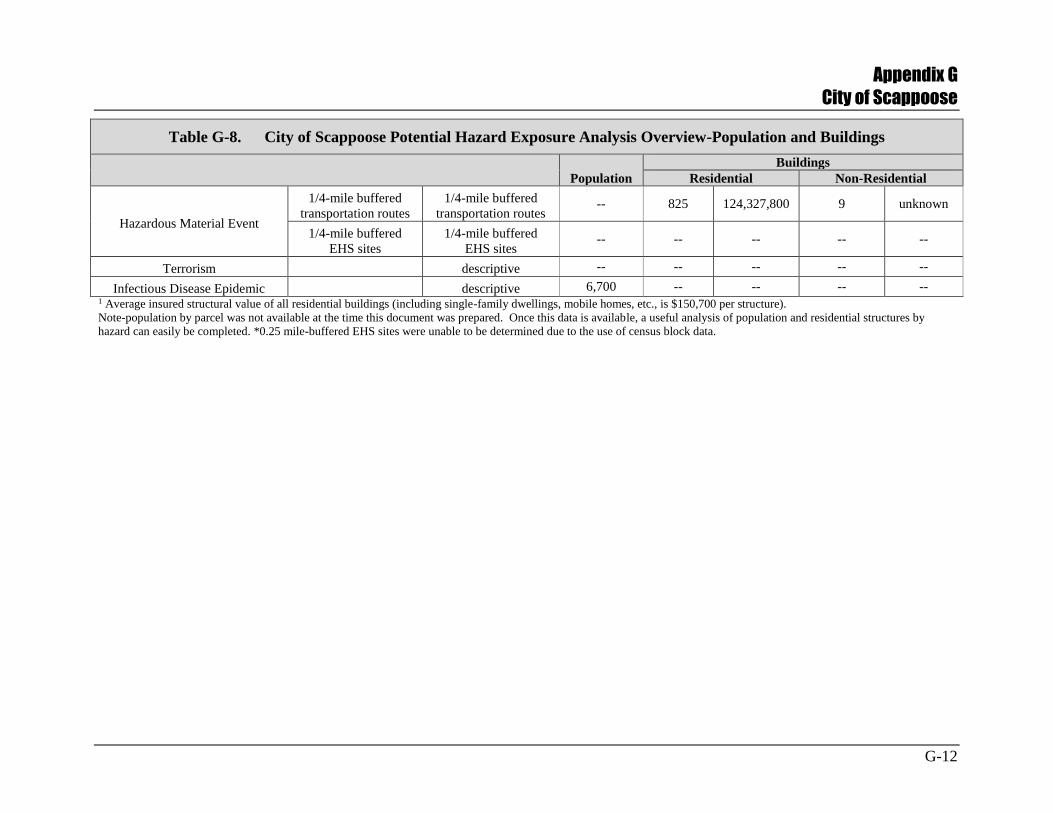
Appendix G
City of Scappoose
G-12
Table G-8. City of Scappoose Potential Hazard Exposure Analysis Overview-Population and Buildings
Population
Buildings
Residential Non-Residential
Hazardous Material Event
1/4-mile buffered
transportation routes
1/4-mile buffered
transportation routes -- 825 124,327,800 9 unknown
1/4-mile buffered
EHS sites
1/4-mile buffered
EHS sites -- -- -- -- --
Terrorism descriptive -- -- -- -- --
Infectious Disease Epidemic descriptive 6,700 -- -- -- -- 1 Average insured structural value of all residential buildings (including single-family dwellings, mobile homes, etc., is $150,700 per structure).
Note-population by parcel was not available at the time this document was prepared. Once this data is available, a useful analysis of population and residential structures by
hazard can easily be completed. *0.25 mile-buffered EHS sites were unable to be determined due to the use of census block data.
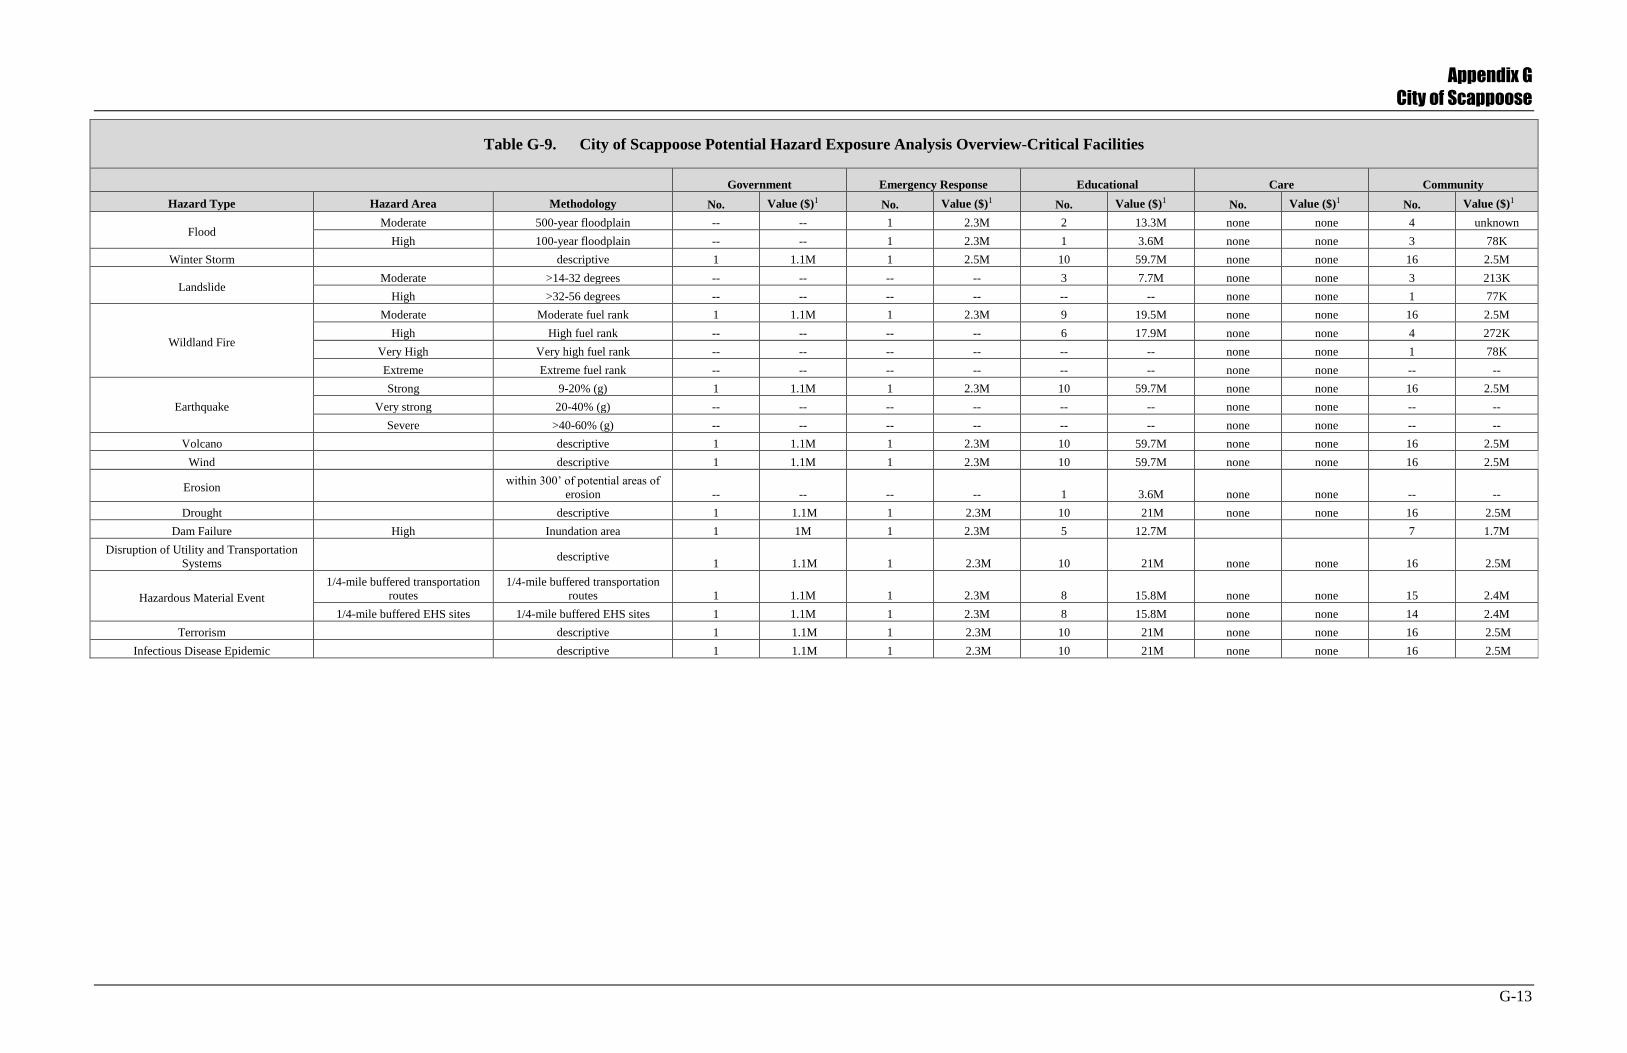
Appendix G
City of Scappoose
G-13
Table G-9. City of Scappoose Potential Hazard Exposure Analysis Overview-Critical Facilities
Government Emergency Response Educational Care Community
Hazard Type Hazard Area Methodology No. Value ($)1 No. Value ($)1 No. Value ($)1 No. Value ($)1 No. Value ($)1
Flood Moderate 500-year floodplain -- -- 1 2.3M 2 13.3M none none 4 unknown
High 100-year floodplain -- -- 1 2.3M 1 3.6M none none 3 78K
Winter Storm descriptive 1 1.1M 1 2.5M 10 59.7M none none 16 2.5M
Landslide Moderate >14-32 degrees -- -- -- -- 3 7.7M none none 3 213K
High >32-56 degrees -- -- -- -- -- -- none none 1 77K
Wildland Fire
Moderate Moderate fuel rank 1 1.1M 1 2.3M 9 19.5M none none 16 2.5M
High High fuel rank -- -- -- -- 6 17.9M none none 4 272K
Very High Very high fuel rank -- -- -- -- -- -- none none 1 78K
Extreme Extreme fuel rank -- -- -- -- -- -- none none -- --
Earthquake
Strong 9-20% (g) 1 1.1M 1 2.3M 10 59.7M none none 16 2.5M
Very strong 20-40% (g) -- -- -- -- -- -- none none -- --
Severe >40-60% (g) -- -- -- -- -- -- none none -- --
Volcano descriptive 1 1.1M 1 2.3M 10 59.7M none none 16 2.5M
Wind descriptive 1 1.1M 1 2.3M 10 59.7M none none 16 2.5M
Erosion within 300’ of potential areas of
erosion -- -- -- -- 1 3.6M none none -- --
Drought descriptive 1 1.1M 1 2.3M 10 21M none none 16 2.5M
Dam Failure High Inundation area 1 1M 1 2.3M 5 12.7M 7 1.7M
Disruption of Utility and Transportation
Systems descriptive
1 1.1M 1 2.3M 10 21M none none 16 2.5M
Hazardous Material Event
1/4-mile buffered transportation
routes
1/4-mile buffered transportation
routes 1 1.1M 1 2.3M 8 15.8M none none 15 2.4M
1/4-mile buffered EHS sites 1/4-mile buffered EHS sites 1 1.1M 1 2.3M 8 15.8M none none 14 2.4M
Terrorism descriptive 1 1.1M 1 2.3M 10 21M none none 16 2.5M
Infectious Disease Epidemic descriptive 1 1.1M 1 2.3M 10 21M none none 16 2.5M

Appendix G
City of Scappoose
G-14
This page intentionally left blank
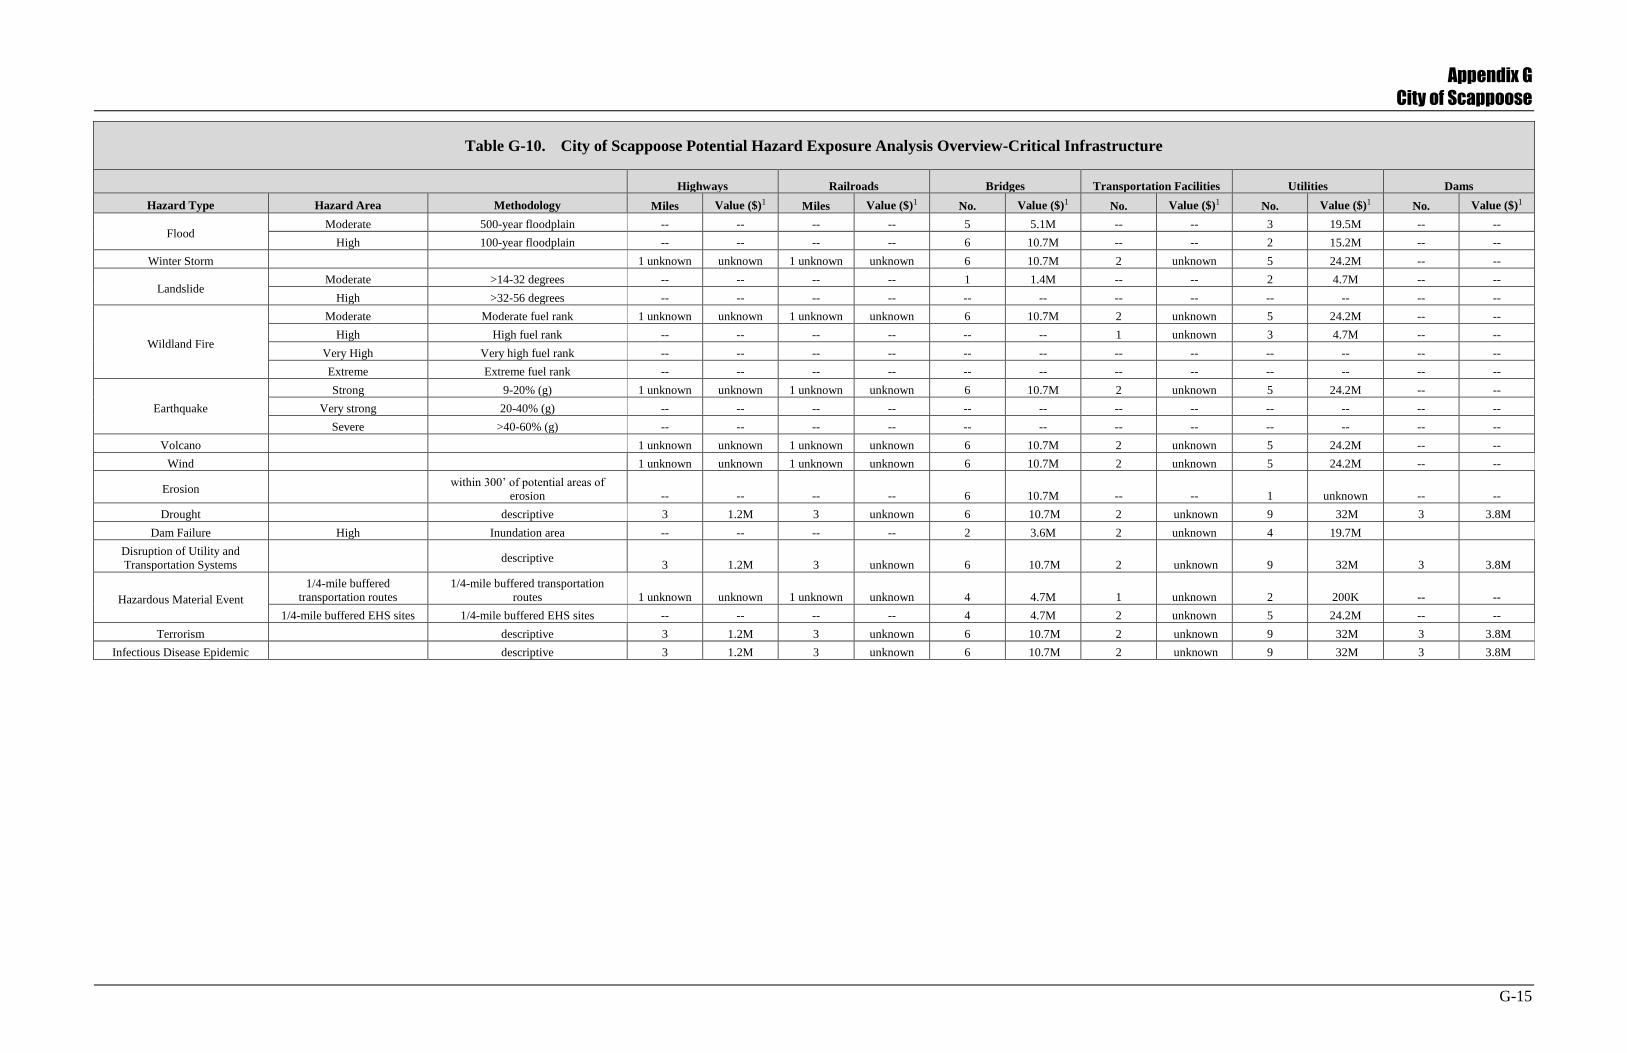
Appendix G
City of Scappoose
G-15
Table G-10. City of Scappoose Potential Hazard Exposure Analysis Overview-Critical Infrastructure
Highways Railroads Bridges Transportation Facilities Utilities Dams
Hazard Type Hazard Area Methodology Miles Value ($)1 Miles Value ($)1 No. Value ($)1 No. Value ($)1 No. Value ($)1 No. Value ($)1
Flood Moderate 500-year floodplain -- -- -- -- 5 5.1M -- -- 3 19.5M -- --
High 100-year floodplain -- -- -- -- 6 10.7M -- -- 2 15.2M -- --
Winter Storm 1 unknown unknown 1 unknown unknown 6 10.7M 2 unknown 5 24.2M -- --
Landslide Moderate >14-32 degrees -- -- -- -- 1 1.4M -- -- 2 4.7M -- --
High >32-56 degrees -- -- -- -- -- -- -- -- -- -- -- --
Wildland Fire
Moderate Moderate fuel rank 1 unknown unknown 1 unknown unknown 6 10.7M 2 unknown 5 24.2M -- --
High High fuel rank -- -- -- -- -- -- 1 unknown 3 4.7M -- --
Very High Very high fuel rank -- -- -- -- -- -- -- -- -- -- -- --
Extreme Extreme fuel rank -- -- -- -- -- -- -- -- -- -- -- --
Earthquake
Strong 9-20% (g) 1 unknown unknown 1 unknown unknown 6 10.7M 2 unknown 5 24.2M -- --
Very strong 20-40% (g) -- -- -- -- -- -- -- -- -- -- -- --
Severe >40-60% (g) -- -- -- -- -- -- -- -- -- -- -- --
Volcano 1 unknown unknown 1 unknown unknown 6 10.7M 2 unknown 5 24.2M -- --
Wind 1 unknown unknown 1 unknown unknown 6 10.7M 2 unknown 5 24.2M -- --
Erosion within 300’ of potential areas of
erosion -- -- -- -- 6 10.7M -- -- 1 unknown -- --
Drought descriptive 3 1.2M 3 unknown 6 10.7M 2 unknown 9 32M 3 3.8M
Dam Failure High Inundation area -- -- -- -- 2 3.6M 2 unknown 4 19.7M
Disruption of Utility and
Transportation Systems descriptive
3 1.2M 3 unknown 6 10.7M 2 unknown 9 32M 3 3.8M
Hazardous Material Event
1/4-mile buffered
transportation routes
1/4-mile buffered transportation
routes 1 unknown unknown 1 unknown unknown 4 4.7M 1 unknown 2 200K -- --
1/4-mile buffered EHS sites 1/4-mile buffered EHS sites -- -- -- -- 4 4.7M 2 unknown 5 24.2M -- --
Terrorism descriptive 3 1.2M 3 unknown 6 10.7M 2 unknown 9 32M 3 3.8M
Infectious Disease Epidemic descriptive 3 1.2M 3 unknown 6 10.7M 2 unknown 9 32M 3 3.8M

Appendix G
City of Scappoose
G-16
This page intentionally left blank
Appendix G
City of Scappoose
G-17
SUMMARY OF VULNERABILITIES AND IMPACTS TO IDENTIFIED HAZARDS
The following section describes community specific vulnerabilities and impacts from natural
hazards in addition to technological and manmade hazards identified in the 2009 Columbia
County MHMP and 2010 FEMA flood map.
The following is derived from the best available data for facility locations and values. In many
cases, values were unavailable, and therefore the totals listed below should be considered
incomplete and likely less than the actual costs associated with the respective hazards.
Flood
FEMA FIRMs were used to outline the 100-year and 500-year floodplains for the City of
Scappoose. The 100-year floodplain delineates an area of high risk, while the 500-year
floodplain delineates an area of moderate risk.
There are 874 residential structures (worth $131.7M), six non-residential structures (value
unknown), one emergency response facility (worth $2.3M), three community facilities (worth
$78K), six bridges (worth $10.5M) and two utilities (worth $15.2M) within the boundaries of the
100-year floodplain.
There are 1,328 residential structures (worth $250M), seven non-residential structures (value
unknown), one emergency response facility (worth $2.3M) four community facilities (value
unknown), five bridges (worth $8.5M) and three utilities (worth $19.5M) within the 500-year
floodplain.
Winter Storm
The natural hazards resulting from winter storms, such as ice, cold, wind and floods, are often
widespread. A single event is capable of impacting all people, critical facilities and
infrastructure within the City of Scappoose, and therefore the entire population (6,700 people),
including 2,171 residential structures (worth $327.2M), 14 non-residential structures (value
unknown), one government facility (worth $1.1M), one emergency response facility (worth
$2.3M), seven educational facilities (worth $59.7M), 16 community facilities (value $2.5M), six
bridges (worth $10.7M), one highway (value unknown), one railroad (value unknown), two
transportation facilities (value unknown), and five utilities (worth $24.2M) are located in the
winter storm area.
Landslide
The potential impacts from landslides can be widespread. Potential debris flows and landslides
can impact transportation and rail routes, utility systems, and water and waste treatment
infrastructure along with public, private, and business structures located adjacent to steep slopes,
along riverine embankments, or within alluvial fans or natural drainages. Response and recovery
efforts will likely vary from minor cleanup to more extensive utility system rebuilding. Utility
disruptions are usually local and terrain dependent. Damages may require reestablishing
electrical, communication, and gas pipeline connections occurring from specific breakage points.
Initial debris clearing from emergency routes and high traffic areas may be required. Water and
Appendix G
City of Scappoose
G-18
waste water utilities may need treatment to quickly improve water quality by reducing excessive
water turbidity and reestablishing waste disposal capability.
USGS elevation datasets were used to determine the landslide hazard areas within the City of
Scappoose. Risk was assigned based on slope angle. A slope angle less than 14 degrees was
assigned a low risk, a slope angle between 14 and 32 degrees was assigned a medium risk, and a
slope angle greater than 32 degrees was assigned a high risk.
There are 705 residential structures (worth $106.2M), three non-residential structures (value
unknown), two educational facilities (worth $8.1M), three community facilities (worth $213K),
one bridge (worth $1.4M) and two utilities (worth $4.7M) in the medium landslide risk area.
There are 344 residential structures (worth $51.8M), three non-residential structures (value
unknown), and one community facility (worth $77K) in the high landslide risk area.
Wildland Fires
Wildland fire hazard areas were identified using a model incorporating slope, aspect, and fuel
load. South-facing, steep, and heavily vegetated areas were assigned the highest fuel values
while areas with little slope and natural vegetation were assigned the lowest fuel values. Risk
levels of moderate, high, very high, and extreme were assigned to the entire region based on the
results of this modeling.
There are 2,209 residential structures (worth $327M), 14 non-residential structures (value
unknown), one government facility (worth $1.1M), one emergency response facility (worth
$2.3M), seven educational facilities (worth $59.7M), 16 community facilities (value $2.5M), six
bridges (worth $5.7M), one highway (value unknown), one railroad (value unknown), two
transportation facilities (value unknown), and five utilities (worth $24.2M) located in moderate
fire risk areas.
There are 882 residential structures (worth $132.9M), eight non-residential structures (value
unknown), seven educational facilities (worth $59.7M), four community facilities (value $272K),
one transportation facility (value unknown), two bridges (worth $2.8M), and three utilities (value
$4.7M) located in the high fire risk areas.
There are 433 residential structures (worth $65.3M), three non-residential structures (value
unknown), one community facility (worth $78K), and two utilities (worth $4.7M) located in very
high fire risk areas. There were 116 residential structures (worth $17.5M) and no critical
facilities identified in the extreme fire risk area.
Earthquake
Based on PGA shake maps produced by the USGS, the western portion of Columbia County is
likely to experience higher levels of shaking than the eastern portion, as a result of its proximity
to the Cascadia Subduction Zone. Ground movement in both areas, however, is likely to cause
damage to weak, unreinforced masonry buildings, and to induce small landslides along unstable
slopes. As well as landslide, earthquakes can trigger other hazards such as dam failure and
disruption of transportation and utility systems.
The eastern portion of Columbia County is likely to experience strong shaking should a
subduction zone earthquake occur (9-20 percent of the acceleration of gravity). In contrast, the
Appendix G
City of Scappoose
G-19
far western portion of the county is likely to experience very strong shaking (20-25 percent).
This rating represents the peak acceleration of the ground caused by the earthquake.
Due to City of Scappoose’s proximity to the eastern portion of the county, all people, critical
facilities and infrastructure within the City of Scappoose, and therefore the entire population
(6,700 people), including 2,209 residential structures (worth $450M), 14 non-residential
structures (value unknown), one government facility (worth $1.1M), one emergency response
facility (worth $2.3M), seven educational facilities (worth $59.7M), 16 community facilities
(value $2.5M), six bridges (worth $10.5M), one highway (value unknown), one railroad (value
unknown), two transportation facilities (value unknown), and five utilities (worth $24.2M) are
located in the strong shaking (9-20 percent) area.
Volcano
A volcanic eruption would have a minor impact on The City of Scappoose due to the proximity
to volcanoes within the Cascade region. The major resources of concern include air quality and
waterway sedimentation. During previous eruptions, ashfall has drifted to the east of the
volcanoes. (State Interagency Hazard Mitigation Team 2006)
The City of Scappoose will likely only experience damage from volcanic eruption columns and
clouds which contain volcanic gases, minerals, and rock. The columns and clouds form rapidly
and extend several miles above an eruption. Solid particles within the clouds present a serious
aviation threat, can distribute acid rain (sulfur dioxide gas and water), can create risk of
suffocation (carbon dioxide is heavier than air and collects in valleys and depressions threatening
human and animals), and pose a toxic threat from fluorine which clings to ash particles
potentially poisoning grazing livestock and contaminating domestic water supplies.
Buildings streets and roads throughout the city may require minor cleanup with negligible
impacts. Temporary utility interruptions are likely, and minor cleanup may be required for
electrical and other utility services. Water treatment facilities may require additional attention to
address high turbidity water. River traffic along the Columbia River could be disrupted due to
sedimentation from a large eruption from Mt. St. Helens or Hood and dredging to restore channel
depths may be necessary. Injuries associated with respiratory problems may result. (Goettel
2005)
Due to the nature of the hazard, it is impossible to predict the location or extent of future events
with any probability, although it can be assumed that all critical facilities and infrastructure
within the City of Scappoose are at risk including the entire population (6,700 people), including
2,209 residential structures (worth $450M), 14 non-residential structures (value unknown), one
government facility (worth $1.1M), one emergency response facility (worth $2.3M), seven
educational facilities (worth $59.7M), 16 community facilities (value $2.5M), six bridges (worth
$10.5M), one highway (value unknown), one railroad (value unknown), two transportation
facilities (value unknown), and five utilities (worth $24.2M).
Wind
Many buildings, utilities and transportation systems in open areas, natural grasslands, or
agricultural lands are especially vulnerable to wind damage. Impacts associated with wind can
Appendix G
City of Scappoose
G-20
include damage to power lines, trees, and structures, and can also cause temporary disruptions of
power. Additionally, high winds can cause significant damage to forestlands.
All areas within the City of Scappoose are equally at risk of a windstorm event including all
people, critical facilities and infrastructure, and therefore the entire population (6,090 people),
including 2,209 residential structures (worth $450M), 14 non-residential structures (value
unknown), one government facility (worth $1.1M), one emergency response facility (worth
$2.3M), seven educational facilities (worth $59.7M), 16 community facilities (value $2.5M), six
bridges (worth $10.7M), one highway (value unknown), one railroad (value unknown), two
transportation facilities (value unknown), and five utilities (worth $24.2M).
Erosion
Riverine and stream erosion rarely causes death or injury. However, erosion causes significant
destruction of property, development, and infrastructure. Erosion hazard data is not readily
available; however, descriptions of several localized areas were identified during the
development of this document and are identified only by location on a map referencing the river
or stream reach described. Critical facilities that may be at risk of erosion were identified using a
300 foot-buffer in the areas identified as having historic erosion impacts to conservatively
account for building footprints.
The City of Scappoose has 49 residential structures (worth $7.4M), one educational facility
(worth $3.6M), and six bridges (worth $10.7M) within potential erosion hazard areas. There is
also one pump station (worth 1.2M ) and sewer and water lines (values unknown) in close
proximity (within 30 feet) of Scappoose Creek which posses an erosion threat to the
infrastructure.
Drought
State-wide droughts have historically occurred in Oregon, and as it is a region-wide
phenomenon, all residents are equally at risk. Structural damage from drought is not expected;
rather the risks are present to humans and resources. Agriculture, fishing, and timber have
historically been impacted, as well as local and regional economies.
Dam Failure
US Army Corps of Engineers inundation data for the Columbia River and the PacifiCorp
inundation data for the Lewis River in the State of Washington were used to determine the
impacts from dam failure upriver from the City of Scappoose. There are 1,049 residential
structures (worth $200M), six non-residential structures (value unknown), one government
facility (value $1M), one emergency response facility (value $2.3M), seven educational facilities
(worth $59.7M), seven community facilities (value $1.7M), two bridges (worth $3.6M), two
transportation facilities (value unknown), and four utilities (value $19.7M) located in the
inundation area.
Disruption of Utility and Transportation Systems
Transportation system disruption impacts range from effects on life, health, and safety
(emergency vehicle mobility, access to hospitals, access to evacuation routes, access to vital
Appendix G
City of Scappoose
G-21
supplies if transport is seriously disrupted for a long time) to the economic effects of delays, lost
commerce, and lost time. Similarly, disruption of utility systems can affect the county at the
level of commerce and recreation as well as at the level of fundamental health and safety.
County-wide as well as localized areas of disruption are likely to impact all residents equally.
Structural damage from disruption to these systems is not expected; rather the risks are present to
residents and those traveling in the area.
Hazardous Material Event
The National Response Center and the EPA’s Environmental Facts Multisystem Query were
used to locate hazardous waste handling facilities and businesses that generate hazardous waste
from their activities. (In Progress) Transportation routes likely to carry hazardous waste were
examined, and all facilities within a 0.25 mile radius of those are considered at risk.
There are 825 residential structures (worth $150M), nine non-residential structures (value
unknown), one government facility (worth $1.1M), one emergency response facility (worth
$2.3M), seven educational facilities (worth $59.7M), 15 community facilities (worth $2.4M),
one highway (value unknown), one railroad (value unknown), 4 bridges (worth $7.2M), one
transportation facility (value unknown), and two utilities (worth $200K) located within 0.25 mile
of a transportation route and may be at risk from a hazardous material event.
Facilities considered at risk near 0.25 mile-buffered EHS Sites include one government facility
(worth $1.1M), one emergency response facility (worth $2.3M), seven educational facilities
(worth $59.7M), 14 community facilities (worth $2.4M), 4 bridges (worth $7.2M), two
transportation facilities (value unknown), and five utilities (worth $24.2M).
Terrorism
It is difficult to determine the scope of any terrorist threat to the City of Scappoose. Although
there seem to be few high-profile targets present, it is impossible to predict future terrorist
events. Depending on the extent of the action, the community may suffer economic loss,
disruption of utilities, and cleanup relating to explosions and other facility damages. Structural
damage, injuries or casualties may occur, however, it is beyond the scope of this analysis to
estimate losses.
Infectious Disease Epidemic
The consequences of a pandemic as described in Chapter 5 could be devastating. In the event of
a poor-fit vaccine or very limited vaccine supply, the public health measures that would work
best include: isolation and quarantine; restricting movement between and within communities;
prohibiting public gatherings and group activities; and closing schools.
The county and state have isolation and quarantine laws; cities can also apply quarantines and
restrict public movement in a public health emergency. The recently passed public health
emergency law in Oregon provides a process for such mechanisms to be implemented.
Impacts associated with infectious disease epidemics in general have the potential to include loss
of life and shutdown of critical facilities. Furthermore, an epidemic level of infectious disease in
the community could overwhelm local resources, although there are no structural risks or losses
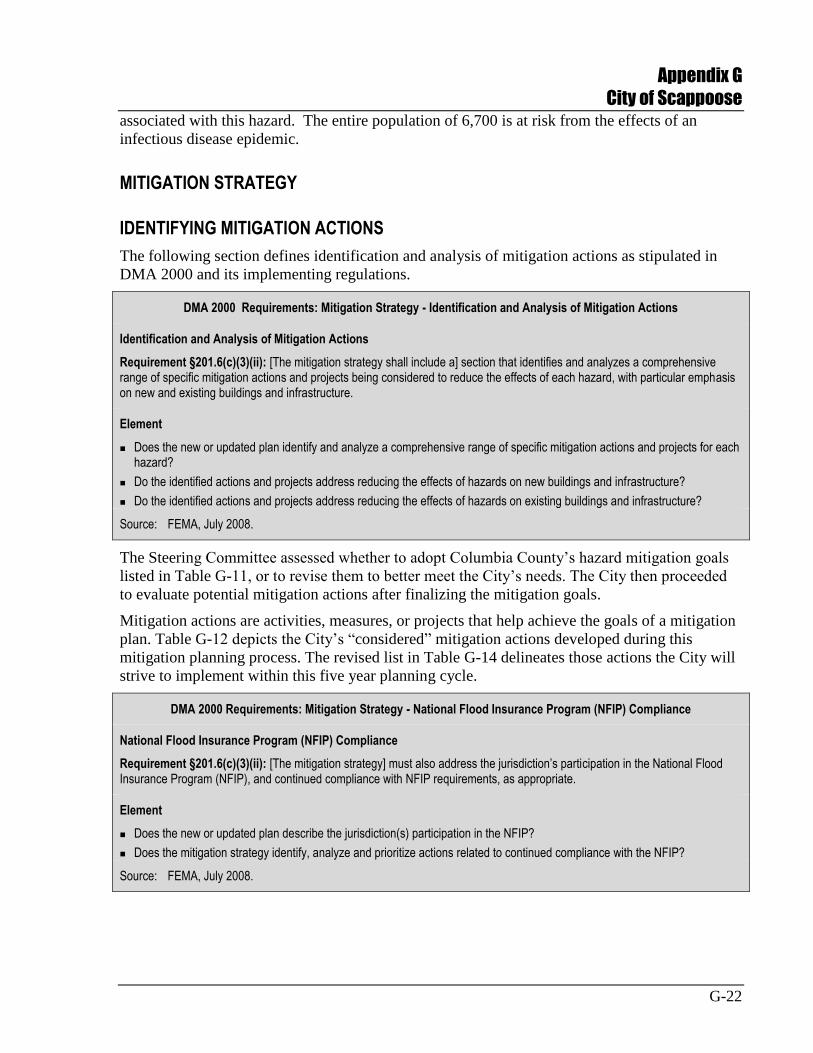
Appendix G
City of Scappoose
G-22
associated with this hazard. The entire population of 6,700 is at risk from the effects of an
infectious disease epidemic.
MITIGATION STRATEGY
IDENTIFYING MITIGATION ACTIONS
The following section defines identification and analysis of mitigation actions as stipulated in
DMA 2000 and its implementing regulations.
DMA 2000 Requirements: Mitigation Strategy - Identification and Analysis of Mitigation Actions
Identification and Analysis of Mitigation Actions
Requirement §201.6(c)(3)(ii): [The mitigation strategy shall include a] section that identifies and analyzes a comprehensive range of specific mitigation actions and projects being considered to reduce the effects of each hazard, with particular emphasis on new and existing buildings and infrastructure.
Element
Does the new or updated plan identify and analyze a comprehensive range of specific mitigation actions and projects for each hazard?
Do the identified actions and projects address reducing the effects of hazards on new buildings and infrastructure?
Do the identified actions and projects address reducing the effects of hazards on existing buildings and infrastructure?
Source: FEMA, July 2008.
The Steering Committee assessed whether to adopt Columbia County’s hazard mitigation goals
listed in Table G-11, or to revise them to better meet the City’s needs. The City then proceeded
to evaluate potential mitigation actions after finalizing the mitigation goals.
Mitigation actions are activities, measures, or projects that help achieve the goals of a mitigation
plan. Table G-12 depicts the City’s “considered” mitigation actions developed during this
mitigation planning process. The revised list in Table G-14 delineates those actions the City will
strive to implement within this five year planning cycle.
DMA 2000 Requirements: Mitigation Strategy - National Flood Insurance Program (NFIP) Compliance
National Flood Insurance Program (NFIP) Compliance
Requirement §201.6(c)(3)(ii): [The mitigation strategy] must also address the jurisdiction’s participation in the National Flood Insurance Program (NFIP), and continued compliance with NFIP requirements, as appropriate.
Element
Does the new or updated plan describe the jurisdiction(s) participation in the NFIP?
Does the mitigation strategy identify, analyze and prioritize actions related to continued compliance with the NFIP?
Source: FEMA, July 2008.
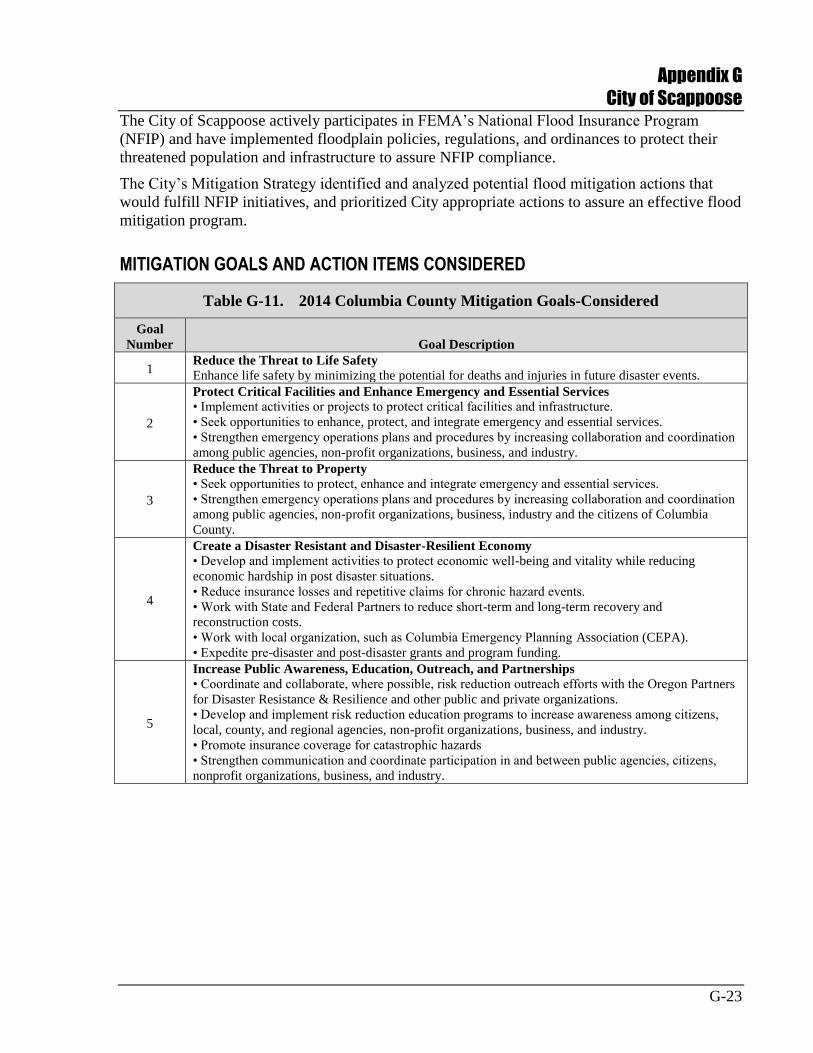
Appendix G
City of Scappoose
G-23
The City of Scappoose actively participates in FEMA’s National Flood Insurance Program
(NFIP) and have implemented floodplain policies, regulations, and ordinances to protect their
threatened population and infrastructure to assure NFIP compliance.
The City’s Mitigation Strategy identified and analyzed potential flood mitigation actions that
would fulfill NFIP initiatives, and prioritized City appropriate actions to assure an effective flood
mitigation program.
MITIGATION GOALS AND ACTION ITEMS CONSIDERED
Table G-11. 2014 Columbia County Mitigation Goals-Considered
Goal
Number Goal Description
1 Reduce the Threat to Life Safety
Enhance life safety by minimizing the potential for deaths and injuries in future disaster events.
2
Protect Critical Facilities and Enhance Emergency and Essential Services
• Implement activities or projects to protect critical facilities and infrastructure.
• Seek opportunities to enhance, protect, and integrate emergency and essential services.
• Strengthen emergency operations plans and procedures by increasing collaboration and coordination
among public agencies, non-profit organizations, business, and industry.
3
Reduce the Threat to Property
• Seek opportunities to protect, enhance and integrate emergency and essential services.
• Strengthen emergency operations plans and procedures by increasing collaboration and coordination
among public agencies, non-profit organizations, business, industry and the citizens of Columbia
County.
4
Create a Disaster Resistant and Disaster-Resilient Economy
• Develop and implement activities to protect economic well-being and vitality while reducing
economic hardship in post disaster situations.
• Reduce insurance losses and repetitive claims for chronic hazard events.
• Work with State and Federal Partners to reduce short-term and long-term recovery and
reconstruction costs.
• Work with local organization, such as Columbia Emergency Planning Association (CEPA).
• Expedite pre-disaster and post-disaster grants and program funding.
5
Increase Public Awareness, Education, Outreach, and Partnerships
• Coordinate and collaborate, where possible, risk reduction outreach efforts with the Oregon Partners
for Disaster Resistance & Resilience and other public and private organizations.
• Develop and implement risk reduction education programs to increase awareness among citizens,
local, county, and regional agencies, non-profit organizations, business, and industry.
• Promote insurance coverage for catastrophic hazards
• Strengthen communication and coordinate participation in and between public agencies, citizens,
nonprofit organizations, business, and industry.
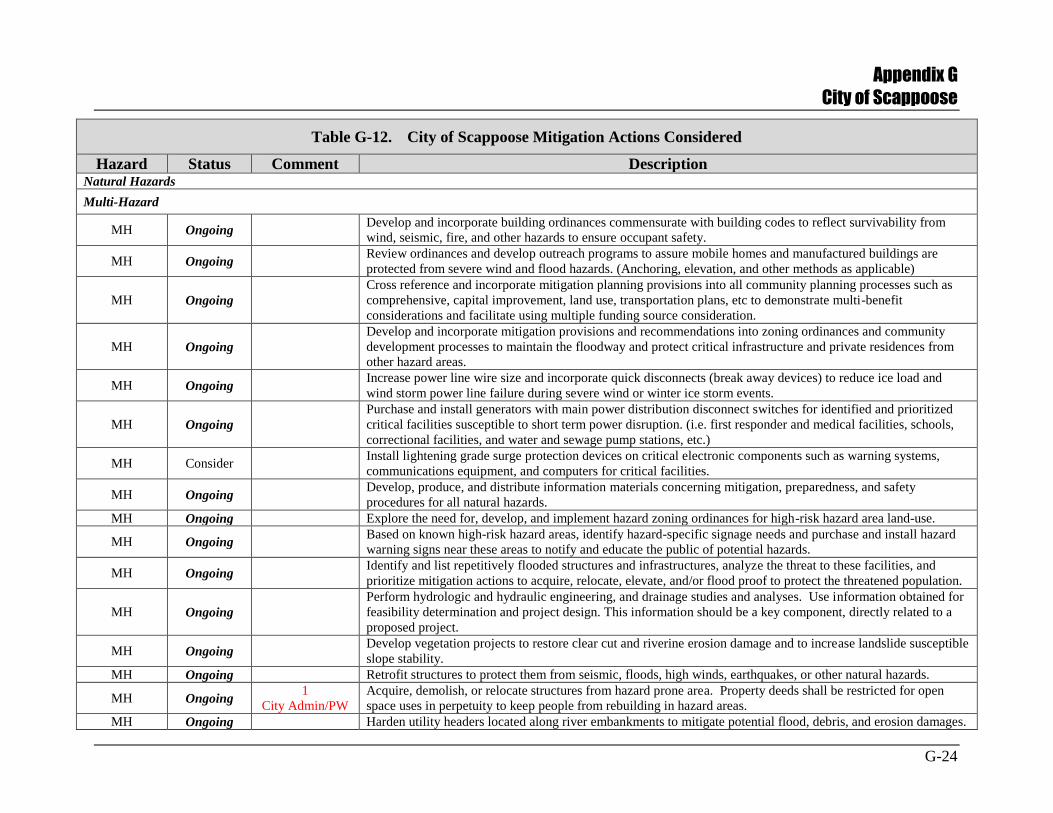
Appendix G
City of Scappoose
G-24
Table G-12. City of Scappoose Mitigation Actions Considered
Hazard Status Comment Description Natural Hazards
Multi-Hazard
MH Ongoing Develop and incorporate building ordinances commensurate with building codes to reflect survivability from
wind, seismic, fire, and other hazards to ensure occupant safety.
MH Ongoing Review ordinances and develop outreach programs to assure mobile homes and manufactured buildings are
protected from severe wind and flood hazards. (Anchoring, elevation, and other methods as applicable)
MH Ongoing
Cross reference and incorporate mitigation planning provisions into all community planning processes such as
comprehensive, capital improvement, land use, transportation plans, etc to demonstrate multi-benefit
considerations and facilitate using multiple funding source consideration.
MH Ongoing
Develop and incorporate mitigation provisions and recommendations into zoning ordinances and community
development processes to maintain the floodway and protect critical infrastructure and private residences from
other hazard areas.
MH Ongoing Increase power line wire size and incorporate quick disconnects (break away devices) to reduce ice load and
wind storm power line failure during severe wind or winter ice storm events.
MH Ongoing
Purchase and install generators with main power distribution disconnect switches for identified and prioritized
critical facilities susceptible to short term power disruption. (i.e. first responder and medical facilities, schools,
correctional facilities, and water and sewage pump stations, etc.)
MH Consider Install lightening grade surge protection devices on critical electronic components such as warning systems,
communications equipment, and computers for critical facilities.
MH Ongoing Develop, produce, and distribute information materials concerning mitigation, preparedness, and safety
procedures for all natural hazards.
MH Ongoing Explore the need for, develop, and implement hazard zoning ordinances for high-risk hazard area land-use.
MH Ongoing Based on known high-risk hazard areas, identify hazard-specific signage needs and purchase and install hazard
warning signs near these areas to notify and educate the public of potential hazards.
MH Ongoing Identify and list repetitively flooded structures and infrastructures, analyze the threat to these facilities, and
prioritize mitigation actions to acquire, relocate, elevate, and/or flood proof to protect the threatened population.
MH Ongoing
Perform hydrologic and hydraulic engineering, and drainage studies and analyses. Use information obtained for
feasibility determination and project design. This information should be a key component, directly related to a
proposed project.
MH Ongoing Develop vegetation projects to restore clear cut and riverine erosion damage and to increase landslide susceptible
slope stability.
MH Ongoing Retrofit structures to protect them from seismic, floods, high winds, earthquakes, or other natural hazards.
MH Ongoing 1
City Admin/PW
Acquire, demolish, or relocate structures from hazard prone area. Property deeds shall be restricted for open
space uses in perpetuity to keep people from rebuilding in hazard areas.
MH Ongoing Harden utility headers located along river embankments to mitigate potential flood, debris, and erosion damages.
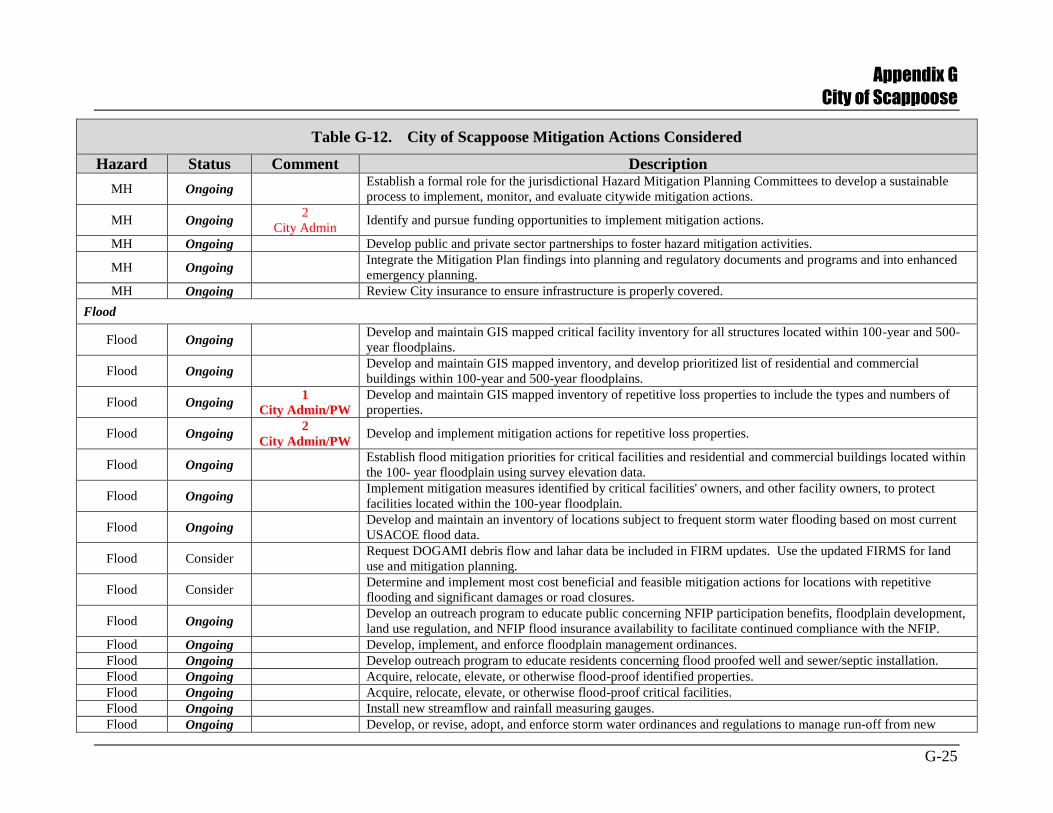
Appendix G
City of Scappoose
G-25
Table G-12. City of Scappoose Mitigation Actions Considered
Hazard Status Comment Description
MH Ongoing Establish a formal role for the jurisdictional Hazard Mitigation Planning Committees to develop a sustainable
process to implement, monitor, and evaluate citywide mitigation actions.
MH Ongoing 2
City Admin Identify and pursue funding opportunities to implement mitigation actions.
MH Ongoing Develop public and private sector partnerships to foster hazard mitigation activities.
MH Ongoing Integrate the Mitigation Plan findings into planning and regulatory documents and programs and into enhanced
emergency planning.
MH Ongoing Review City insurance to ensure infrastructure is properly covered.
Flood
Flood Ongoing Develop and maintain GIS mapped critical facility inventory for all structures located within 100-year and 500-
year floodplains.
Flood Ongoing Develop and maintain GIS mapped inventory, and develop prioritized list of residential and commercial
buildings within 100-year and 500-year floodplains.
Flood Ongoing 1
City Admin/PW
Develop and maintain GIS mapped inventory of repetitive loss properties to include the types and numbers of
properties.
Flood Ongoing 2
City Admin/PW Develop and implement mitigation actions for repetitive loss properties.
Flood Ongoing Establish flood mitigation priorities for critical facilities and residential and commercial buildings located within
the 100- year floodplain using survey elevation data.
Flood Ongoing Implement mitigation measures identified by critical facilities' owners, and other facility owners, to protect
facilities located within the 100-year floodplain.
Flood Ongoing Develop and maintain an inventory of locations subject to frequent storm water flooding based on most current
USACOE flood data.
Flood Consider Request DOGAMI debris flow and lahar data be included in FIRM updates. Use the updated FIRMS for land
use and mitigation planning.
Flood Consider Determine and implement most cost beneficial and feasible mitigation actions for locations with repetitive
flooding and significant damages or road closures.
Flood Ongoing Develop an outreach program to educate public concerning NFIP participation benefits, floodplain development,
land use regulation, and NFIP flood insurance availability to facilitate continued compliance with the NFIP.
Flood Ongoing Develop, implement, and enforce floodplain management ordinances.
Flood Ongoing Develop outreach program to educate residents concerning flood proofed well and sewer/septic installation.
Flood Ongoing Acquire, relocate, elevate, or otherwise flood-proof identified properties.
Flood Ongoing Acquire, relocate, elevate, or otherwise flood-proof critical facilities.
Flood Ongoing Install new streamflow and rainfall measuring gauges.
Flood Ongoing Develop, or revise, adopt, and enforce storm water ordinances and regulations to manage run-off from new
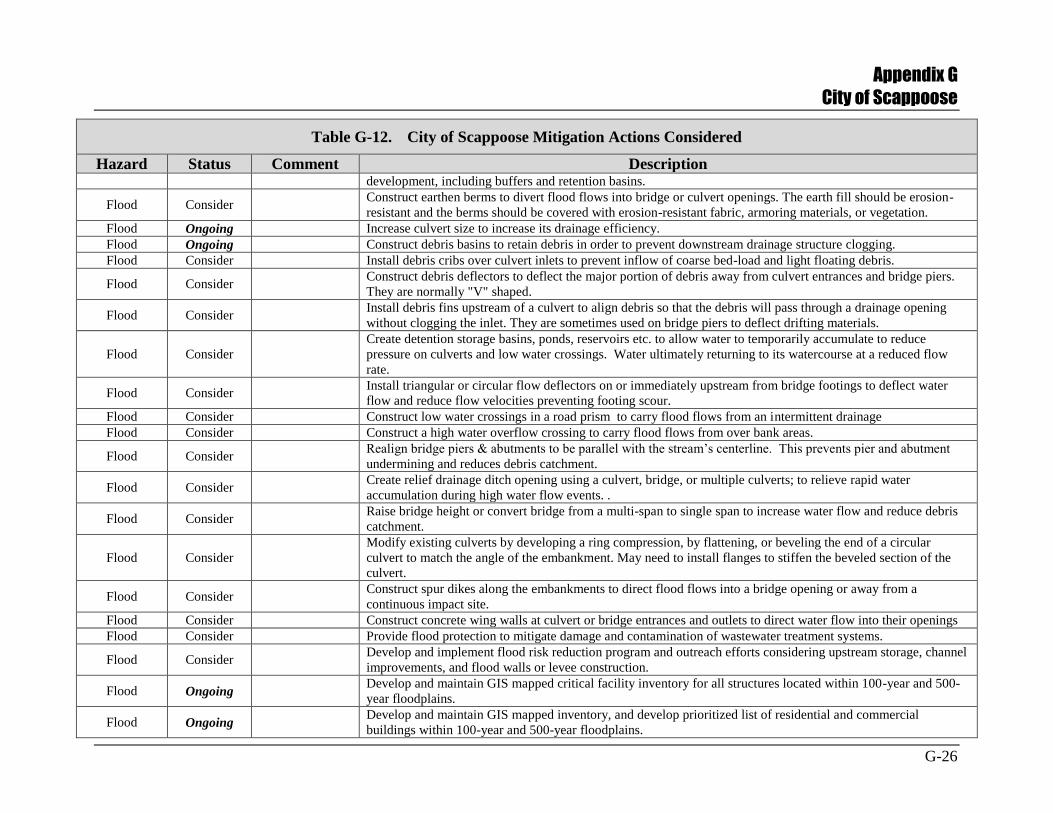
Appendix G
City of Scappoose
G-26
Table G-12. City of Scappoose Mitigation Actions Considered
Hazard Status Comment Description development, including buffers and retention basins.
Flood Consider Construct earthen berms to divert flood flows into bridge or culvert openings. The earth fill should be erosion-
resistant and the berms should be covered with erosion-resistant fabric, armoring materials, or vegetation.
Flood Ongoing Increase culvert size to increase its drainage efficiency.
Flood Ongoing Construct debris basins to retain debris in order to prevent downstream drainage structure clogging.
Flood Consider Install debris cribs over culvert inlets to prevent inflow of coarse bed-load and light floating debris.
Flood Consider Construct debris deflectors to deflect the major portion of debris away from culvert entrances and bridge piers.
They are normally "V" shaped.
Flood Consider Install debris fins upstream of a culvert to align debris so that the debris will pass through a drainage opening
without clogging the inlet. They are sometimes used on bridge piers to deflect drifting materials.
Flood Consider
Create detention storage basins, ponds, reservoirs etc. to allow water to temporarily accumulate to reduce
pressure on culverts and low water crossings. Water ultimately returning to its watercourse at a reduced flow
rate.
Flood Consider Install triangular or circular flow deflectors on or immediately upstream from bridge footings to deflect water
flow and reduce flow velocities preventing footing scour.
Flood Consider Construct low water crossings in a road prism to carry flood flows from an intermittent drainage
Flood Consider Construct a high water overflow crossing to carry flood flows from over bank areas.
Flood Consider Realign bridge piers & abutments to be parallel with the stream’s centerline. This prevents pier and abutment
undermining and reduces debris catchment.
Flood Consider Create relief drainage ditch opening using a culvert, bridge, or multiple culverts; to relieve rapid water
accumulation during high water flow events. .
Flood Consider Raise bridge height or convert bridge from a multi-span to single span to increase water flow and reduce debris
catchment.
Flood Consider
Modify existing culverts by developing a ring compression, by flattening, or beveling the end of a circular
culvert to match the angle of the embankment. May need to install flanges to stiffen the beveled section of the
culvert.
Flood Consider Construct spur dikes along the embankments to direct flood flows into a bridge opening or away from a
continuous impact site.
Flood Consider Construct concrete wing walls at culvert or bridge entrances and outlets to direct water flow into their openings
Flood Consider Provide flood protection to mitigate damage and contamination of wastewater treatment systems.
Flood Consider Develop and implement flood risk reduction program and outreach efforts considering upstream storage, channel
improvements, and flood walls or levee construction.
Flood Ongoing Develop and maintain GIS mapped critical facility inventory for all structures located within 100-year and 500-
year floodplains.
Flood Ongoing Develop and maintain GIS mapped inventory, and develop prioritized list of residential and commercial
buildings within 100-year and 500-year floodplains.
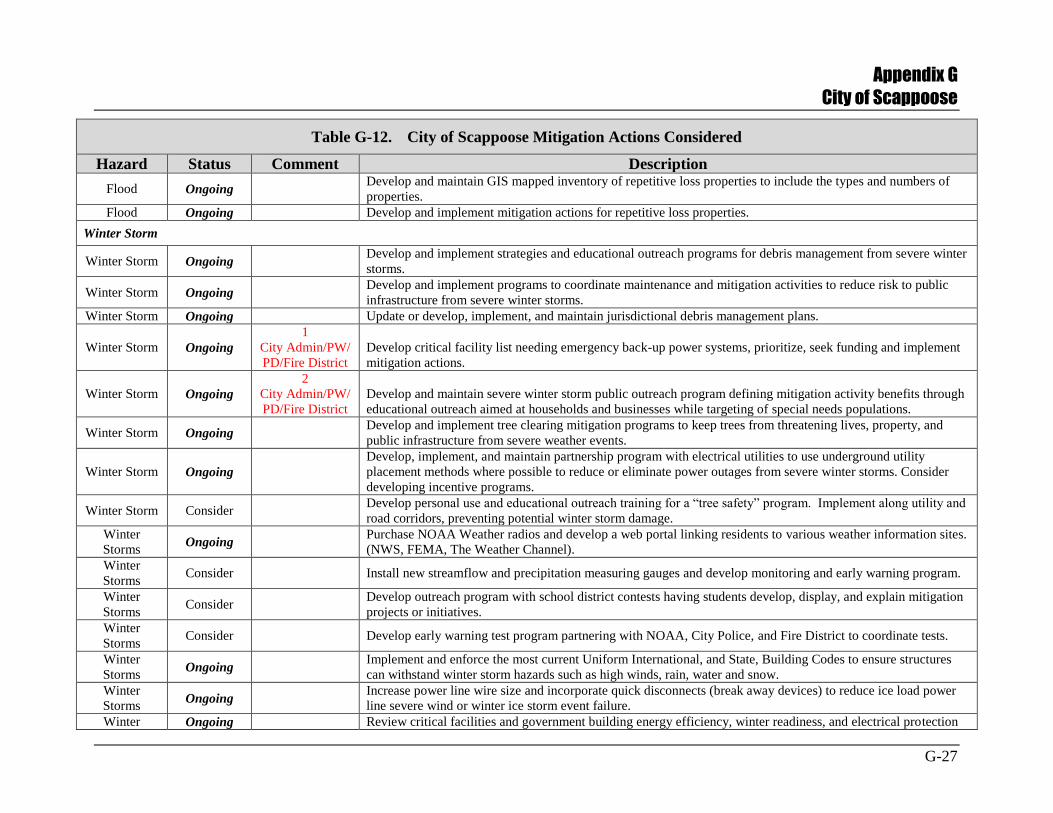
Appendix G
City of Scappoose
G-27
Table G-12. City of Scappoose Mitigation Actions Considered
Hazard Status Comment Description
Flood Ongoing Develop and maintain GIS mapped inventory of repetitive loss properties to include the types and numbers of
properties.
Flood Ongoing Develop and implement mitigation actions for repetitive loss properties.
Winter Storm
Winter Storm Ongoing Develop and implement strategies and educational outreach programs for debris management from severe winter
storms.
Winter Storm Ongoing Develop and implement programs to coordinate maintenance and mitigation activities to reduce risk to public
infrastructure from severe winter storms.
Winter Storm Ongoing Update or develop, implement, and maintain jurisdictional debris management plans.
Winter Storm Ongoing
1
City Admin/PW/
PD/Fire District
Develop critical facility list needing emergency back-up power systems, prioritize, seek funding and implement
mitigation actions.
Winter Storm Ongoing
2
City Admin/PW/
PD/Fire District
Develop and maintain severe winter storm public outreach program defining mitigation activity benefits through
educational outreach aimed at households and businesses while targeting of special needs populations.
Winter Storm Ongoing Develop and implement tree clearing mitigation programs to keep trees from threatening lives, property, and
public infrastructure from severe weather events.
Winter Storm Ongoing
Develop, implement, and maintain partnership program with electrical utilities to use underground utility
placement methods where possible to reduce or eliminate power outages from severe winter storms. Consider
developing incentive programs.
Winter Storm Consider Develop personal use and educational outreach training for a “tree safety” program. Implement along utility and
road corridors, preventing potential winter storm damage.
Winter
Storms Ongoing
Purchase NOAA Weather radios and develop a web portal linking residents to various weather information sites.
(NWS, FEMA, The Weather Channel).
Winter
Storms Consider Install new streamflow and precipitation measuring gauges and develop monitoring and early warning program.
Winter
Storms Consider
Develop outreach program with school district contests having students develop, display, and explain mitigation
projects or initiatives.
Winter
Storms Consider Develop early warning test program partnering with NOAA, City Police, and Fire District to coordinate tests.
Winter
Storms Ongoing
Implement and enforce the most current Uniform International, and State, Building Codes to ensure structures
can withstand winter storm hazards such as high winds, rain, water and snow.
Winter
Storms Ongoing
Increase power line wire size and incorporate quick disconnects (break away devices) to reduce ice load power
line severe wind or winter ice storm event failure.
Winter Ongoing Review critical facilities and government building energy efficiency, winter readiness, and electrical protection
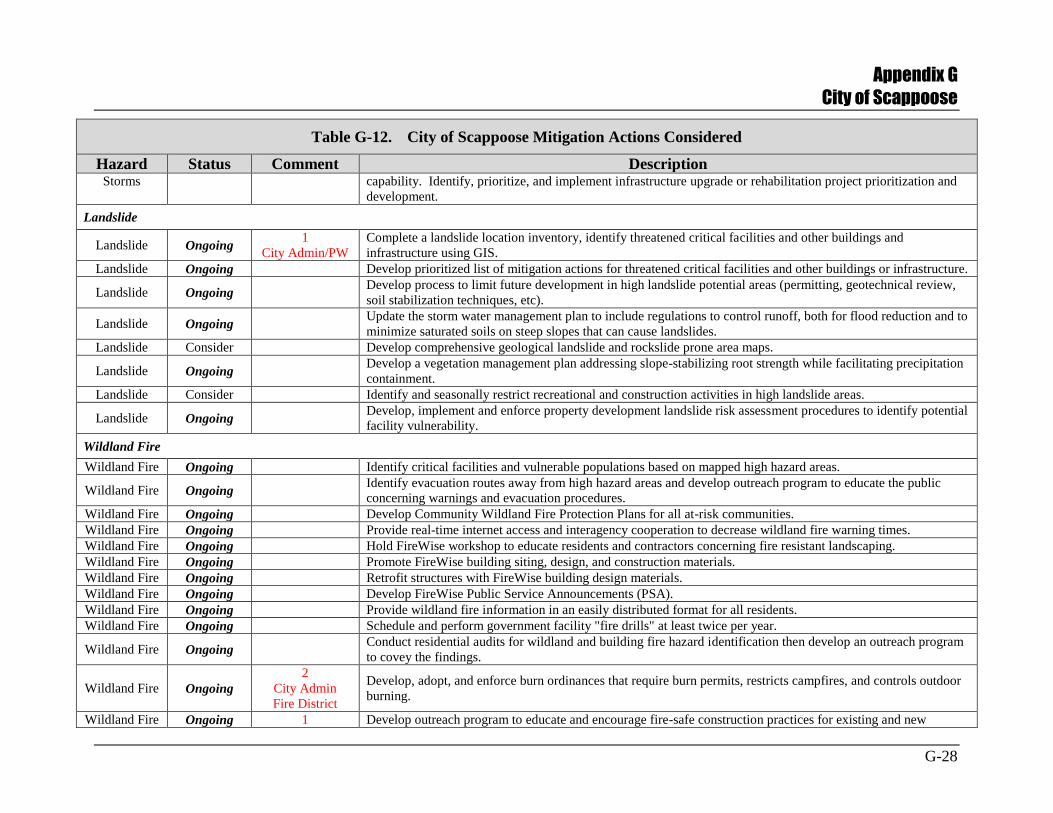
Appendix G
City of Scappoose
G-28
Table G-12. City of Scappoose Mitigation Actions Considered
Hazard Status Comment Description Storms capability. Identify, prioritize, and implement infrastructure upgrade or rehabilitation project prioritization and
development.
Landslide
Landslide Ongoing 1
City Admin/PW
Complete a landslide location inventory, identify threatened critical facilities and other buildings and
infrastructure using GIS.
Landslide Ongoing Develop prioritized list of mitigation actions for threatened critical facilities and other buildings or infrastructure.
Landslide Ongoing Develop process to limit future development in high landslide potential areas (permitting, geotechnical review,
soil stabilization techniques, etc).
Landslide Ongoing Update the storm water management plan to include regulations to control runoff, both for flood reduction and to
minimize saturated soils on steep slopes that can cause landslides.
Landslide Consider Develop comprehensive geological landslide and rockslide prone area maps.
Landslide Ongoing Develop a vegetation management plan addressing slope-stabilizing root strength while facilitating precipitation
containment.
Landslide Consider Identify and seasonally restrict recreational and construction activities in high landslide areas.
Landslide Ongoing Develop, implement and enforce property development landslide risk assessment procedures to identify potential
facility vulnerability.
Wildland Fire
Wildland Fire Ongoing Identify critical facilities and vulnerable populations based on mapped high hazard areas.
Wildland Fire Ongoing Identify evacuation routes away from high hazard areas and develop outreach program to educate the public
concerning warnings and evacuation procedures.
Wildland Fire Ongoing Develop Community Wildland Fire Protection Plans for all at-risk communities.
Wildland Fire Ongoing Provide real-time internet access and interagency cooperation to decrease wildland fire warning times.
Wildland Fire Ongoing Hold FireWise workshop to educate residents and contractors concerning fire resistant landscaping.
Wildland Fire Ongoing Promote FireWise building siting, design, and construction materials.
Wildland Fire Ongoing Retrofit structures with FireWise building design materials.
Wildland Fire Ongoing Develop FireWise Public Service Announcements (PSA).
Wildland Fire Ongoing Provide wildland fire information in an easily distributed format for all residents.
Wildland Fire Ongoing Schedule and perform government facility "fire drills" at least twice per year.
Wildland Fire Ongoing Conduct residential audits for wildland and building fire hazard identification then develop an outreach program
to covey the findings.
Wildland Fire Ongoing
2
City Admin
Fire District
Develop, adopt, and enforce burn ordinances that require burn permits, restricts campfires, and controls outdoor
burning.
Wildland Fire Ongoing 1 Develop outreach program to educate and encourage fire-safe construction practices for existing and new
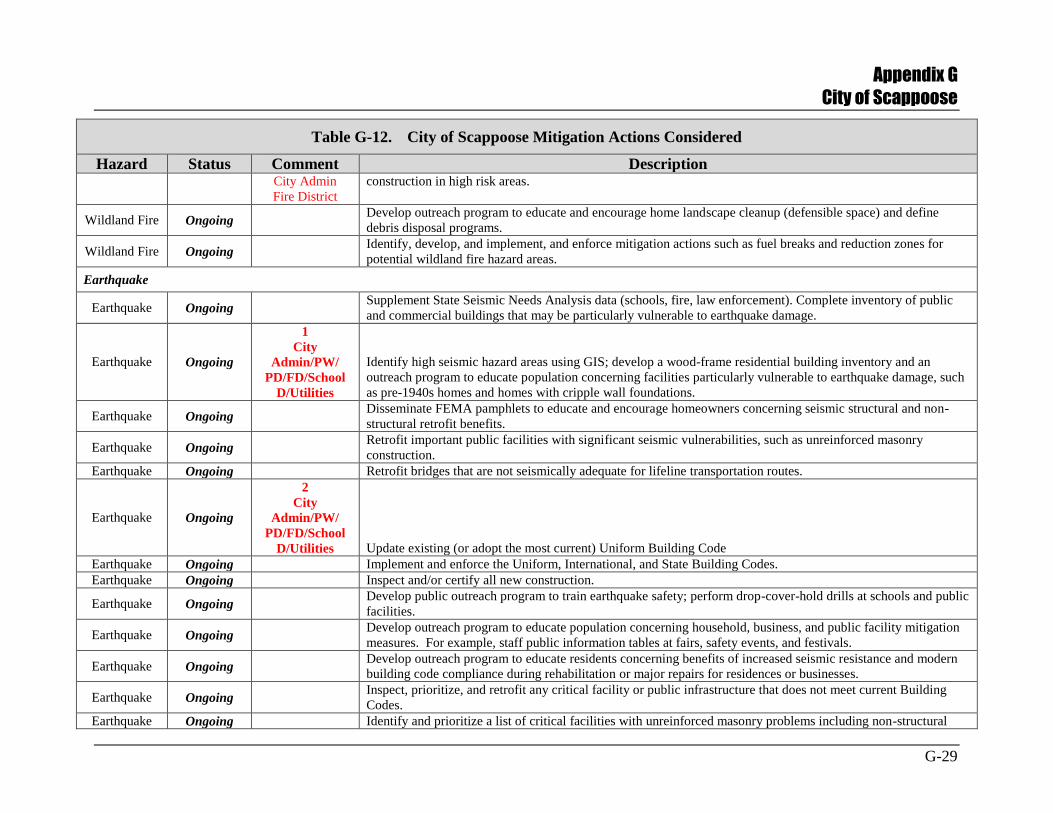
Appendix G
City of Scappoose
G-29
Table G-12. City of Scappoose Mitigation Actions Considered
Hazard Status Comment Description City Admin
Fire District
construction in high risk areas.
Wildland Fire Ongoing Develop outreach program to educate and encourage home landscape cleanup (defensible space) and define
debris disposal programs.
Wildland Fire Ongoing Identify, develop, and implement, and enforce mitigation actions such as fuel breaks and reduction zones for
potential wildland fire hazard areas.
Earthquake
Earthquake Ongoing Supplement State Seismic Needs Analysis data (schools, fire, law enforcement). Complete inventory of public
and commercial buildings that may be particularly vulnerable to earthquake damage.
Earthquake Ongoing
1
City
Admin/PW/
PD/FD/School
D/Utilities
Identify high seismic hazard areas using GIS; develop a wood-frame residential building inventory and an
outreach program to educate population concerning facilities particularly vulnerable to earthquake damage, such
as pre-1940s homes and homes with cripple wall foundations.
Earthquake Ongoing Disseminate FEMA pamphlets to educate and encourage homeowners concerning seismic structural and non-
structural retrofit benefits.
Earthquake Ongoing Retrofit important public facilities with significant seismic vulnerabilities, such as unreinforced masonry
construction.
Earthquake Ongoing Retrofit bridges that are not seismically adequate for lifeline transportation routes.
Earthquake Ongoing
2
City
Admin/PW/
PD/FD/School
D/Utilities Update existing (or adopt the most current) Uniform Building Code
Earthquake Ongoing Implement and enforce the Uniform, International, and State Building Codes.
Earthquake Ongoing Inspect and/or certify all new construction.
Earthquake Ongoing Develop public outreach program to train earthquake safety; perform drop-cover-hold drills at schools and public
facilities.
Earthquake Ongoing Develop outreach program to educate population concerning household, business, and public facility mitigation
measures. For example, staff public information tables at fairs, safety events, and festivals.
Earthquake Ongoing Develop outreach program to educate residents concerning benefits of increased seismic resistance and modern
building code compliance during rehabilitation or major repairs for residences or businesses.
Earthquake Ongoing Inspect, prioritize, and retrofit any critical facility or public infrastructure that does not meet current Building
Codes.
Earthquake Ongoing Identify and prioritize a list of critical facilities with unreinforced masonry problems including non-structural
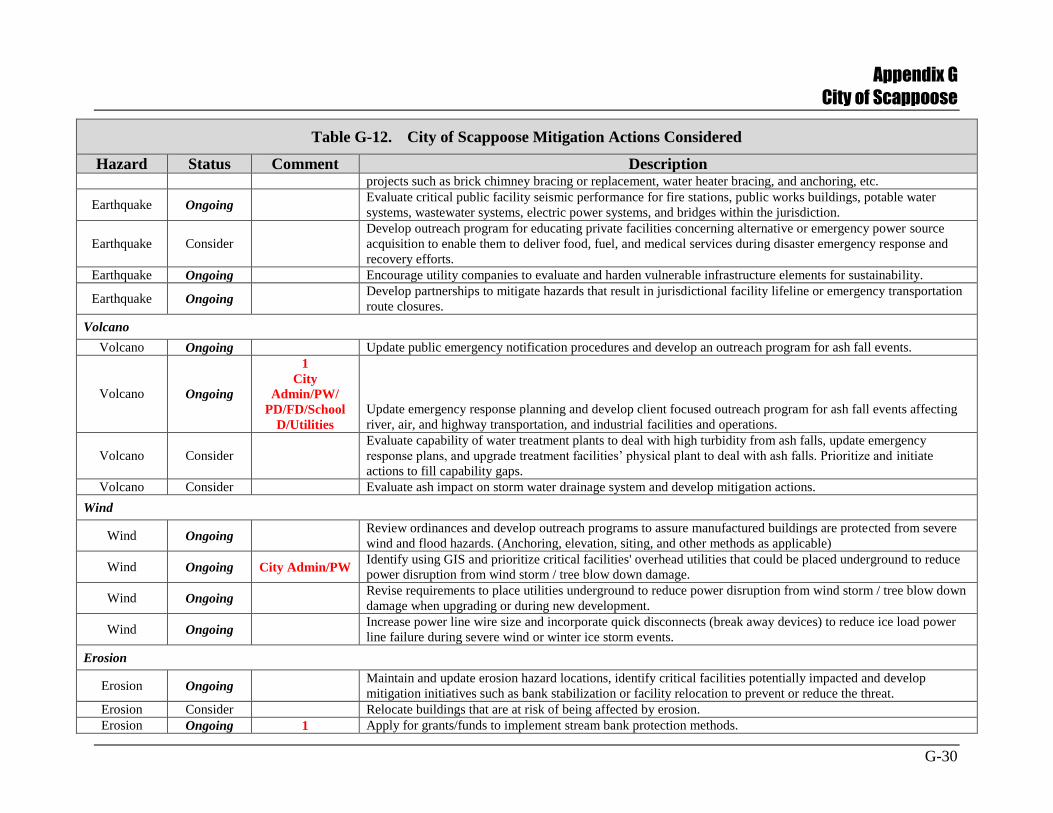
Appendix G
City of Scappoose
G-30
Table G-12. City of Scappoose Mitigation Actions Considered
Hazard Status Comment Description projects such as brick chimney bracing or replacement, water heater bracing, and anchoring, etc.
Earthquake Ongoing Evaluate critical public facility seismic performance for fire stations, public works buildings, potable water
systems, wastewater systems, electric power systems, and bridges within the jurisdiction.
Earthquake Consider
Develop outreach program for educating private facilities concerning alternative or emergency power source
acquisition to enable them to deliver food, fuel, and medical services during disaster emergency response and
recovery efforts.
Earthquake Ongoing Encourage utility companies to evaluate and harden vulnerable infrastructure elements for sustainability.
Earthquake Ongoing Develop partnerships to mitigate hazards that result in jurisdictional facility lifeline or emergency transportation
route closures.
Volcano
Volcano Ongoing Update public emergency notification procedures and develop an outreach program for ash fall events.
Volcano Ongoing
1
City
Admin/PW/
PD/FD/School
D/Utilities
Update emergency response planning and develop client focused outreach program for ash fall events affecting
river, air, and highway transportation, and industrial facilities and operations.
Volcano Consider
Evaluate capability of water treatment plants to deal with high turbidity from ash falls, update emergency
response plans, and upgrade treatment facilities’ physical plant to deal with ash falls. Prioritize and initiate
actions to fill capability gaps.
Volcano Consider Evaluate ash impact on storm water drainage system and develop mitigation actions.
Wind
Wind Ongoing Review ordinances and develop outreach programs to assure manufactured buildings are protected from severe
wind and flood hazards. (Anchoring, elevation, siting, and other methods as applicable)
Wind Ongoing City Admin/PW Identify using GIS and prioritize critical facilities' overhead utilities that could be placed underground to reduce
power disruption from wind storm / tree blow down damage.
Wind Ongoing Revise requirements to place utilities underground to reduce power disruption from wind storm / tree blow down
damage when upgrading or during new development.
Wind Ongoing Increase power line wire size and incorporate quick disconnects (break away devices) to reduce ice load power
line failure during severe wind or winter ice storm events.
Erosion
Erosion Ongoing Maintain and update erosion hazard locations, identify critical facilities potentially impacted and develop
mitigation initiatives such as bank stabilization or facility relocation to prevent or reduce the threat.
Erosion Consider Relocate buildings that are at risk of being affected by erosion.
Erosion Ongoing 1 Apply for grants/funds to implement stream bank protection methods.
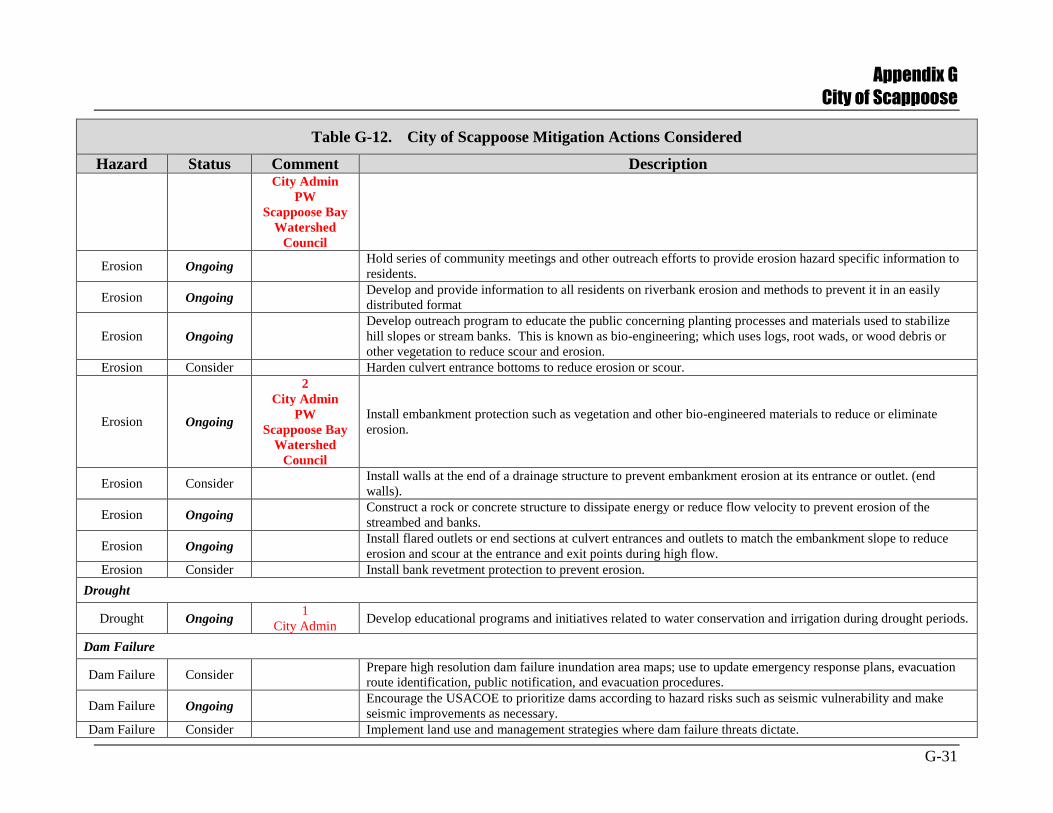
Appendix G
City of Scappoose
G-31
Table G-12. City of Scappoose Mitigation Actions Considered
Hazard Status Comment Description City Admin
PW
Scappoose Bay
Watershed
Council
Erosion Ongoing Hold series of community meetings and other outreach efforts to provide erosion hazard specific information to
residents.
Erosion Ongoing Develop and provide information to all residents on riverbank erosion and methods to prevent it in an easily
distributed format
Erosion Ongoing
Develop outreach program to educate the public concerning planting processes and materials used to stabilize
hill slopes or stream banks. This is known as bio-engineering; which uses logs, root wads, or wood debris or
other vegetation to reduce scour and erosion.
Erosion Consider Harden culvert entrance bottoms to reduce erosion or scour.
Erosion Ongoing
2
City Admin
PW
Scappoose Bay
Watershed
Council
Install embankment protection such as vegetation and other bio-engineered materials to reduce or eliminate
erosion.
Erosion Consider Install walls at the end of a drainage structure to prevent embankment erosion at its entrance or outlet. (end
walls).
Erosion Ongoing Construct a rock or concrete structure to dissipate energy or reduce flow velocity to prevent erosion of the
streambed and banks.
Erosion Ongoing Install flared outlets or end sections at culvert entrances and outlets to match the embankment slope to reduce
erosion and scour at the entrance and exit points during high flow.
Erosion Consider Install bank revetment protection to prevent erosion.
Drought
Drought Ongoing 1
City Admin Develop educational programs and initiatives related to water conservation and irrigation during drought periods.
Dam Failure
Dam Failure Consider Prepare high resolution dam failure inundation area maps; use to update emergency response plans, evacuation
route identification, public notification, and evacuation procedures.
Dam Failure Ongoing Encourage the USACOE to prioritize dams according to hazard risks such as seismic vulnerability and make
seismic improvements as necessary.
Dam Failure Consider Implement land use and management strategies where dam failure threats dictate.
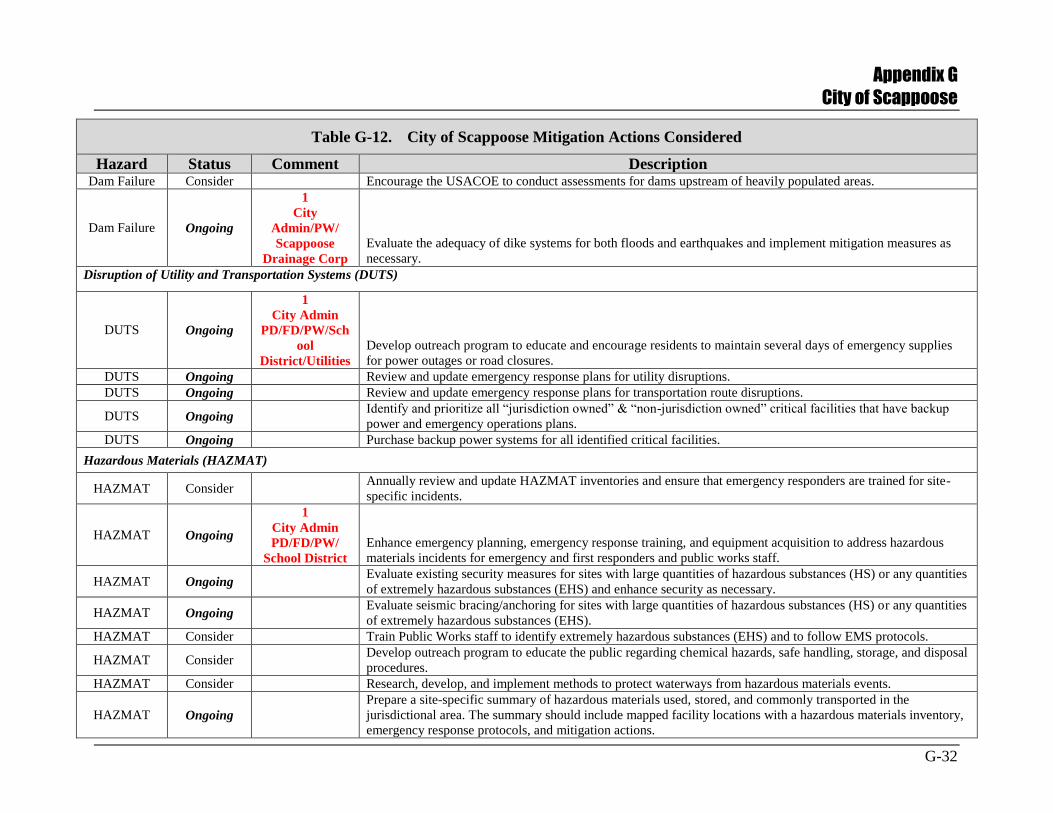
Appendix G
City of Scappoose
G-32
Table G-12. City of Scappoose Mitigation Actions Considered
Hazard Status Comment Description Dam Failure Consider Encourage the USACOE to conduct assessments for dams upstream of heavily populated areas.
Dam Failure Ongoing
1
City
Admin/PW/
Scappoose
Drainage Corp
Evaluate the adequacy of dike systems for both floods and earthquakes and implement mitigation measures as
necessary.
Disruption of Utility and Transportation Systems (DUTS)
DUTS Ongoing
1
City Admin
PD/FD/PW/Sch
ool
District/Utilities
Develop outreach program to educate and encourage residents to maintain several days of emergency supplies
for power outages or road closures.
DUTS Ongoing Review and update emergency response plans for utility disruptions.
DUTS Ongoing Review and update emergency response plans for transportation route disruptions.
DUTS Ongoing Identify and prioritize all “jurisdiction owned” & “non-jurisdiction owned” critical facilities that have backup
power and emergency operations plans.
DUTS Ongoing Purchase backup power systems for all identified critical facilities.
Hazardous Materials (HAZMAT)
HAZMAT Consider Annually review and update HAZMAT inventories and ensure that emergency responders are trained for site-
specific incidents.
HAZMAT Ongoing
1
City Admin
PD/FD/PW/
School District
Enhance emergency planning, emergency response training, and equipment acquisition to address hazardous
materials incidents for emergency and first responders and public works staff.
HAZMAT Ongoing Evaluate existing security measures for sites with large quantities of hazardous substances (HS) or any quantities
of extremely hazardous substances (EHS) and enhance security as necessary.
HAZMAT Ongoing Evaluate seismic bracing/anchoring for sites with large quantities of hazardous substances (HS) or any quantities
of extremely hazardous substances (EHS).
HAZMAT Consider Train Public Works staff to identify extremely hazardous substances (EHS) and to follow EMS protocols.
HAZMAT Consider Develop outreach program to educate the public regarding chemical hazards, safe handling, storage, and disposal
procedures.
HAZMAT Consider Research, develop, and implement methods to protect waterways from hazardous materials events.
HAZMAT Ongoing
Prepare a site-specific summary of hazardous materials used, stored, and commonly transported in the
jurisdictional area. The summary should include mapped facility locations with a hazardous materials inventory,
emergency response protocols, and mitigation actions.
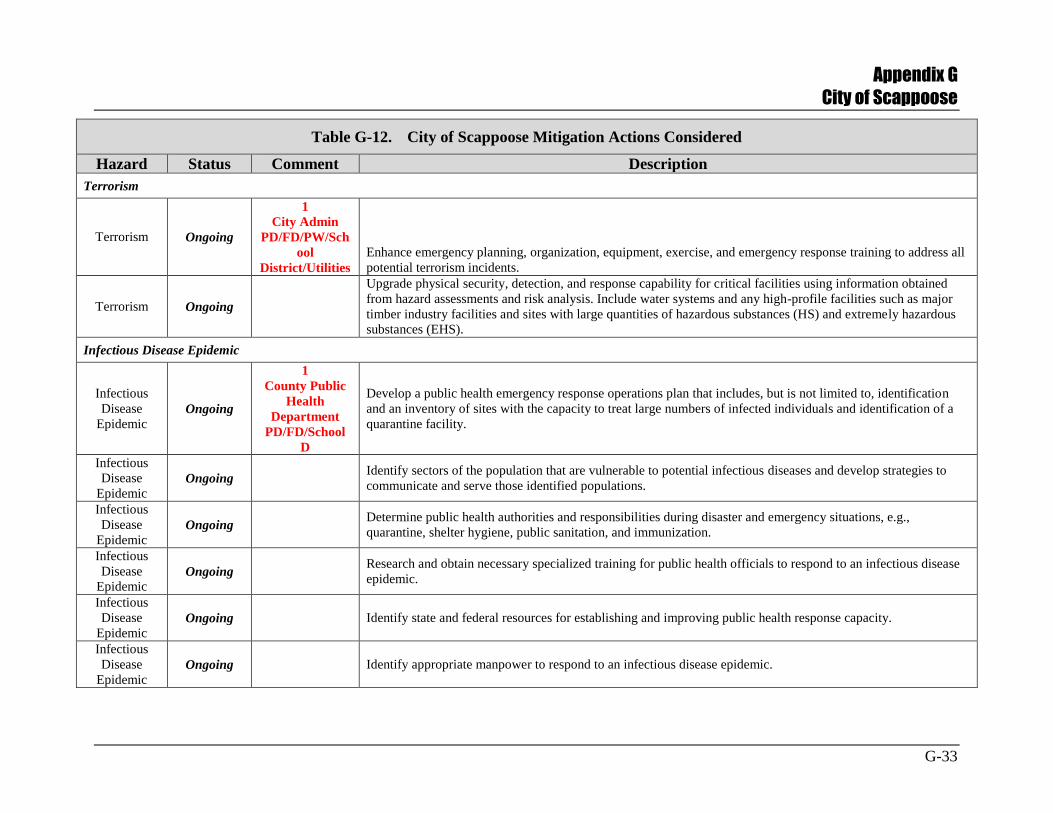
Appendix G
City of Scappoose
G-33
Table G-12. City of Scappoose Mitigation Actions Considered
Hazard Status Comment Description
Terrorism
Terrorism Ongoing
1
City Admin
PD/FD/PW/Sch
ool
District/Utilities
Enhance emergency planning, organization, equipment, exercise, and emergency response training to address all
potential terrorism incidents.
Terrorism Ongoing
Upgrade physical security, detection, and response capability for critical facilities using information obtained
from hazard assessments and risk analysis. Include water systems and any high-profile facilities such as major
timber industry facilities and sites with large quantities of hazardous substances (HS) and extremely hazardous
substances (EHS).
Infectious Disease Epidemic
Infectious
Disease
Epidemic Ongoing
1
County Public
Health
Department
PD/FD/School
D
Develop a public health emergency response operations plan that includes, but is not limited to, identification
and an inventory of sites with the capacity to treat large numbers of infected individuals and identification of a
quarantine facility.
Infectious
Disease
Epidemic Ongoing
Identify sectors of the population that are vulnerable to potential infectious diseases and develop strategies to
communicate and serve those identified populations.
Infectious
Disease
Epidemic Ongoing
Determine public health authorities and responsibilities during disaster and emergency situations, e.g.,
quarantine, shelter hygiene, public sanitation, and immunization.
Infectious
Disease
Epidemic Ongoing
Research and obtain necessary specialized training for public health officials to respond to an infectious disease
epidemic.
Infectious
Disease
Epidemic Ongoing Identify state and federal resources for establishing and improving public health response capacity.
Infectious
Disease
Epidemic Ongoing Identify appropriate manpower to respond to an infectious disease epidemic.
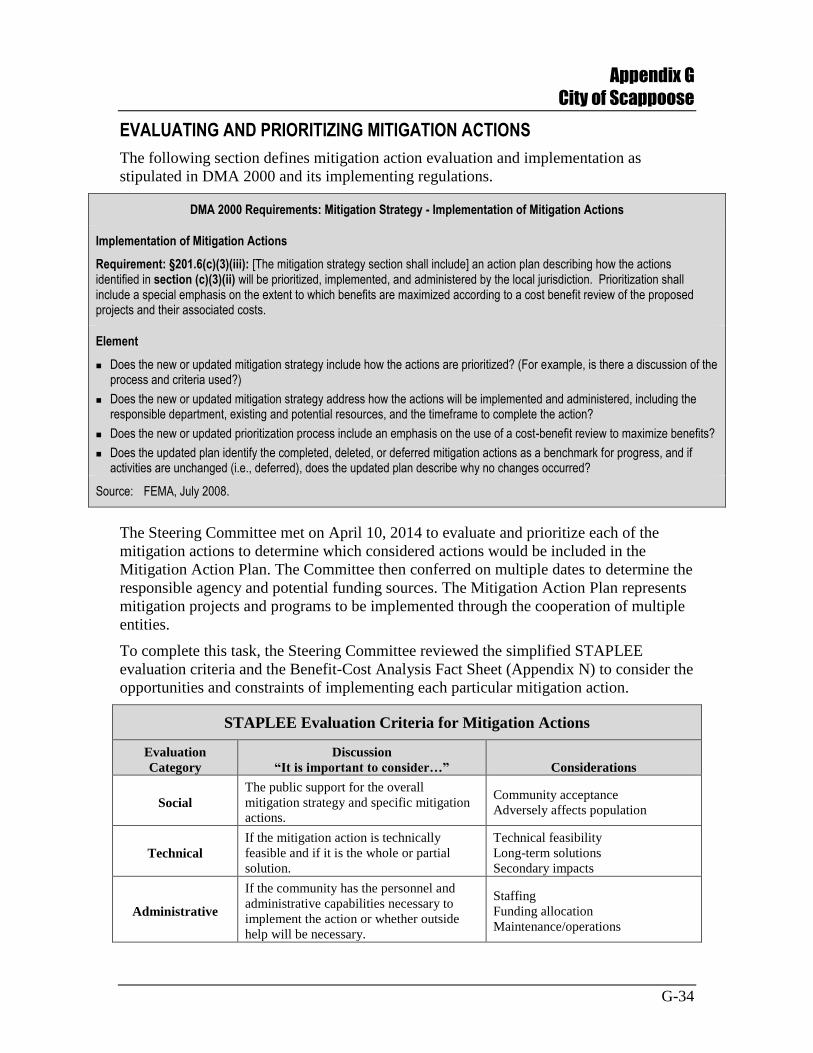
Appendix G
City of Scappoose
G-34
EVALUATING AND PRIORITIZING MITIGATION ACTIONS
The following section defines mitigation action evaluation and implementation as
stipulated in DMA 2000 and its implementing regulations.
DMA 2000 Requirements: Mitigation Strategy - Implementation of Mitigation Actions
Implementation of Mitigation Actions
Requirement: §201.6(c)(3)(iii): [The mitigation strategy section shall include] an action plan describing how the actions identified in section (c)(3)(ii) will be prioritized, implemented, and administered by the local jurisdiction. Prioritization shall include a special emphasis on the extent to which benefits are maximized according to a cost benefit review of the proposed projects and their associated costs.
Element
Does the new or updated mitigation strategy include how the actions are prioritized? (For example, is there a discussion of the process and criteria used?)
Does the new or updated mitigation strategy address how the actions will be implemented and administered, including the responsible department, existing and potential resources, and the timeframe to complete the action?
Does the new or updated prioritization process include an emphasis on the use of a cost-benefit review to maximize benefits?
Does the updated plan identify the completed, deleted, or deferred mitigation actions as a benchmark for progress, and if activities are unchanged (i.e., deferred), does the updated plan describe why no changes occurred?
Source: FEMA, July 2008.
The Steering Committee met on April 10, 2014 to evaluate and prioritize each of the
mitigation actions to determine which considered actions would be included in the
Mitigation Action Plan. The Committee then conferred on multiple dates to determine the
responsible agency and potential funding sources. The Mitigation Action Plan represents
mitigation projects and programs to be implemented through the cooperation of multiple
entities.
To complete this task, the Steering Committee reviewed the simplified STAPLEE
evaluation criteria and the Benefit-Cost Analysis Fact Sheet (Appendix N) to consider the
opportunities and constraints of implementing each particular mitigation action.
STAPLEE Evaluation Criteria for Mitigation Actions
Evaluation
Category
Discussion
“It is important to consider…” Considerations
Social
The public support for the overall
mitigation strategy and specific mitigation
actions.
Community acceptance
Adversely affects population
Technical
If the mitigation action is technically
feasible and if it is the whole or partial
solution.
Technical feasibility
Long-term solutions
Secondary impacts
Administrative
If the community has the personnel and
administrative capabilities necessary to
implement the action or whether outside
help will be necessary.
Staffing
Funding allocation
Maintenance/operations
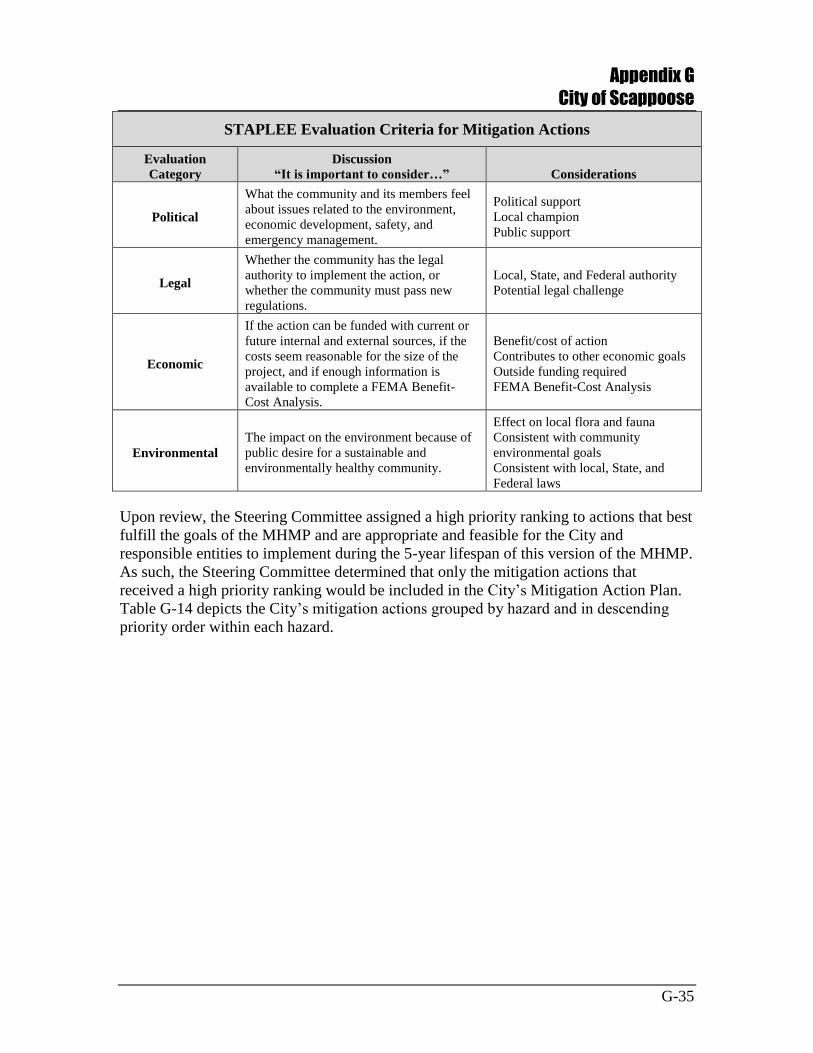
Appendix G
City of Scappoose
G-35
STAPLEE Evaluation Criteria for Mitigation Actions
Evaluation
Category
Discussion
“It is important to consider…” Considerations
Political
What the community and its members feel
about issues related to the environment,
economic development, safety, and
emergency management.
Political support
Local champion
Public support
Legal
Whether the community has the legal
authority to implement the action, or
whether the community must pass new
regulations.
Local, State, and Federal authority
Potential legal challenge
Economic
If the action can be funded with current or
future internal and external sources, if the
costs seem reasonable for the size of the
project, and if enough information is
available to complete a FEMA Benefit-
Cost Analysis.
Benefit/cost of action
Contributes to other economic goals
Outside funding required
FEMA Benefit-Cost Analysis
Environmental
The impact on the environment because of
public desire for a sustainable and
environmentally healthy community.
Effect on local flora and fauna
Consistent with community
environmental goals
Consistent with local, State, and
Federal laws
Upon review, the Steering Committee assigned a high priority ranking to actions that best
fulfill the goals of the MHMP and are appropriate and feasible for the City and
responsible entities to implement during the 5-year lifespan of this version of the MHMP.
As such, the Steering Committee determined that only the mitigation actions that
received a high priority ranking would be included in the City’s Mitigation Action Plan.
Table G-14 depicts the City’s mitigation actions grouped by hazard and in descending
priority order within each hazard.
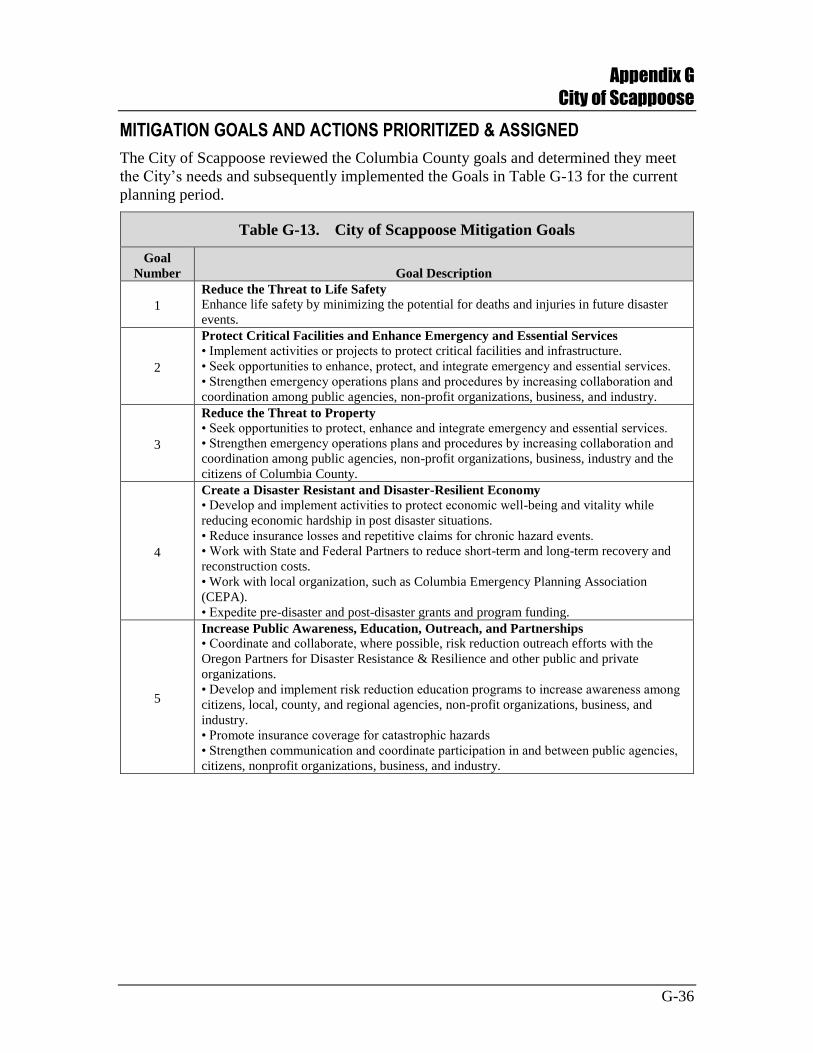
Appendix G
City of Scappoose
G-36
MITIGATION GOALS AND ACTIONS PRIORITIZED & ASSIGNED
The City of Scappoose reviewed the Columbia County goals and determined they meet
the City’s needs and subsequently implemented the Goals in Table G-13 for the current
planning period.
Table G-13. City of Scappoose Mitigation Goals
Goal
Number Goal Description
1
Reduce the Threat to Life Safety
Enhance life safety by minimizing the potential for deaths and injuries in future disaster
events.
2
Protect Critical Facilities and Enhance Emergency and Essential Services
• Implement activities or projects to protect critical facilities and infrastructure.
• Seek opportunities to enhance, protect, and integrate emergency and essential services.
• Strengthen emergency operations plans and procedures by increasing collaboration and
coordination among public agencies, non-profit organizations, business, and industry.
3
Reduce the Threat to Property
• Seek opportunities to protect, enhance and integrate emergency and essential services.
• Strengthen emergency operations plans and procedures by increasing collaboration and
coordination among public agencies, non-profit organizations, business, industry and the
citizens of Columbia County.
4
Create a Disaster Resistant and Disaster-Resilient Economy
• Develop and implement activities to protect economic well-being and vitality while
reducing economic hardship in post disaster situations.
• Reduce insurance losses and repetitive claims for chronic hazard events.
• Work with State and Federal Partners to reduce short-term and long-term recovery and
reconstruction costs.
• Work with local organization, such as Columbia Emergency Planning Association
(CEPA).
• Expedite pre-disaster and post-disaster grants and program funding.
5
Increase Public Awareness, Education, Outreach, and Partnerships
• Coordinate and collaborate, where possible, risk reduction outreach efforts with the
Oregon Partners for Disaster Resistance & Resilience and other public and private
organizations.
• Develop and implement risk reduction education programs to increase awareness among
citizens, local, county, and regional agencies, non-profit organizations, business, and
industry.
• Promote insurance coverage for catastrophic hazards
• Strengthen communication and coordinate participation in and between public agencies,
citizens, nonprofit organizations, business, and industry.
Appendix G
City of Scappoose
G-37
IMPLEMENTING A MITIGATION ACTION PLAN
The following section defines the mitigation action identification process for each participating jurisdiction as stipulated in DMA 2000
and its implementing regulations.
DMA 2000 Requirements: Mitigation Strategy-Identification of Multi-Jurisdictional Mitigation Actions
Identification of Multi-Jurisdictional Mitigation Actions
Requirement §201.6(c)(3)(iv): For multi-jurisdictional plans, there must be identifiable action items specific to the jurisdiction requesting FEMA approval or credit of the plan.
Element
Does the new or updated plan include identifiable action items for each jurisdiction requesting FEMA approval of the plan?
Does the updated plan identify the completed, deleted or deferred mitigation actions as a benchmark for progress, and if activities are unchanged (i.e., deferred), does the updated plan describe why no changes occurred?
Source: FEMA, July 2008.
This appendix identifies action items specific to the City of Scappoose. Since the update includes incorporation of the City of
Scappoose as part of the MHMP, all actions in this appendix are considered new. Table G-14 displays the City of Scappoose’s
Mitigation Action Plan matrix that lists mitigation actions by hazard and are only prioritized within each hazard, not in total. Each
mitigation action will be implemented and administered by the applicable managing department, agency, or responsible entity.
**Whenever TBD is used, it means that a benefit/cost analysis will be completed as a project is developed to validate the most appropriate mitigation action.
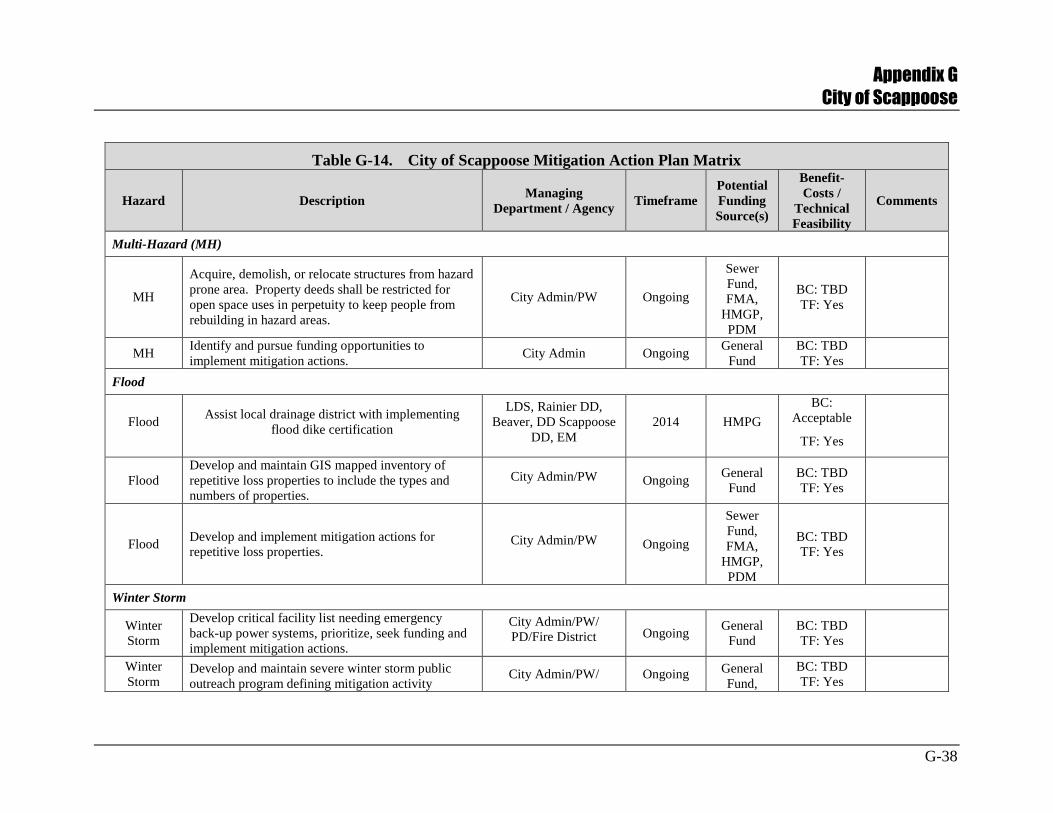
Appendix G
City of Scappoose
G-38
Table G-14. City of Scappoose Mitigation Action Plan Matrix
Hazard Description Managing
Department / Agency Timeframe
Potential
Funding
Source(s)
Benefit-
Costs /
Technical
Feasibility
Comments
Multi-Hazard (MH)
MH
Acquire, demolish, or relocate structures from hazard
prone area. Property deeds shall be restricted for
open space uses in perpetuity to keep people from
rebuilding in hazard areas.
City Admin/PW Ongoing
Sewer
Fund,
FMA,
HMGP,
PDM
BC: TBD
TF: Yes
MH Identify and pursue funding opportunities to
implement mitigation actions. City Admin Ongoing
General
Fund
BC: TBD
TF: Yes
Flood
Flood Assist local drainage district with implementing
flood dike certification
LDS, Rainier DD,
Beaver, DD Scappoose
DD, EM
2014 HMPG
BC:
Acceptable
TF: Yes
Flood
Develop and maintain GIS mapped inventory of
repetitive loss properties to include the types and
numbers of properties.
City Admin/PW Ongoing General
Fund
BC: TBD
TF: Yes
Flood Develop and implement mitigation actions for
repetitive loss properties. City Admin/PW Ongoing
Sewer
Fund,
FMA,
HMGP,
PDM
BC: TBD
TF: Yes
Winter Storm
Winter
Storm
Develop critical facility list needing emergency
back-up power systems, prioritize, seek funding and
implement mitigation actions.
City Admin/PW/
PD/Fire District Ongoing General
Fund
BC: TBD
TF: Yes
Winter
Storm Develop and maintain severe winter storm public
outreach program defining mitigation activity City Admin/PW/ Ongoing General
Fund,
BC: TBD
TF: Yes
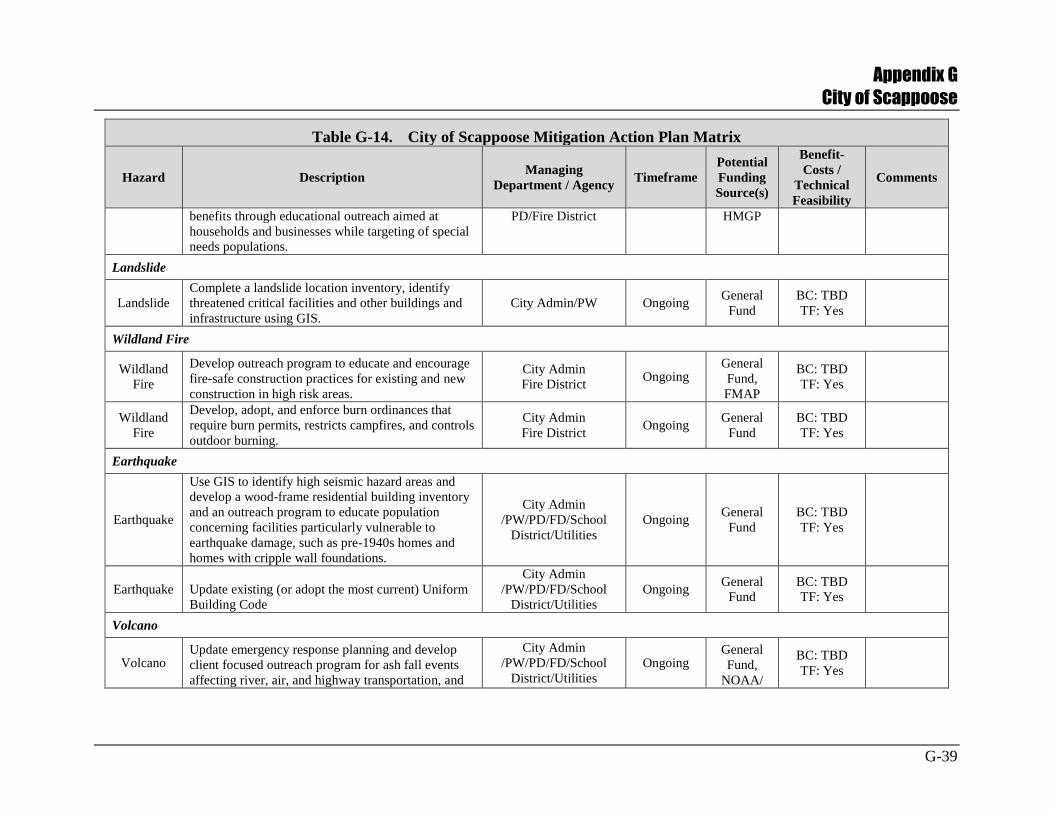
Appendix G
City of Scappoose
G-39
Table G-14. City of Scappoose Mitigation Action Plan Matrix
Hazard Description Managing
Department / Agency Timeframe
Potential
Funding
Source(s)
Benefit-
Costs /
Technical
Feasibility
Comments
benefits through educational outreach aimed at
households and businesses while targeting of special
needs populations.
PD/Fire District HMGP
Landslide
Landslide
Complete a landslide location inventory, identify
threatened critical facilities and other buildings and
infrastructure using GIS.
City Admin/PW Ongoing General
Fund
BC: TBD
TF: Yes
Wildland Fire
Wildland
Fire
Develop outreach program to educate and encourage
fire-safe construction practices for existing and new
construction in high risk areas.
City Admin
Fire District Ongoing
General
Fund,
FMAP
BC: TBD
TF: Yes
Wildland
Fire
Develop, adopt, and enforce burn ordinances that
require burn permits, restricts campfires, and controls
outdoor burning.
City Admin
Fire District Ongoing
General
Fund
BC: TBD
TF: Yes
Earthquake
Earthquake
Use GIS to identify high seismic hazard areas and
develop a wood-frame residential building inventory
and an outreach program to educate population
concerning facilities particularly vulnerable to
earthquake damage, such as pre-1940s homes and
homes with cripple wall foundations.
City Admin
/PW/PD/FD/School
District/Utilities
Ongoing General
Fund
BC: TBD
TF: Yes
Earthquake Update existing (or adopt the most current) Uniform
Building Code
City Admin
/PW/PD/FD/School
District/Utilities
Ongoing General
Fund
BC: TBD
TF: Yes
Volcano
Volcano Update emergency response planning and develop
client focused outreach program for ash fall events
affecting river, air, and highway transportation, and
City Admin
/PW/PD/FD/School
District/Utilities
Ongoing General
Fund,
NOAA/
BC: TBD
TF: Yes
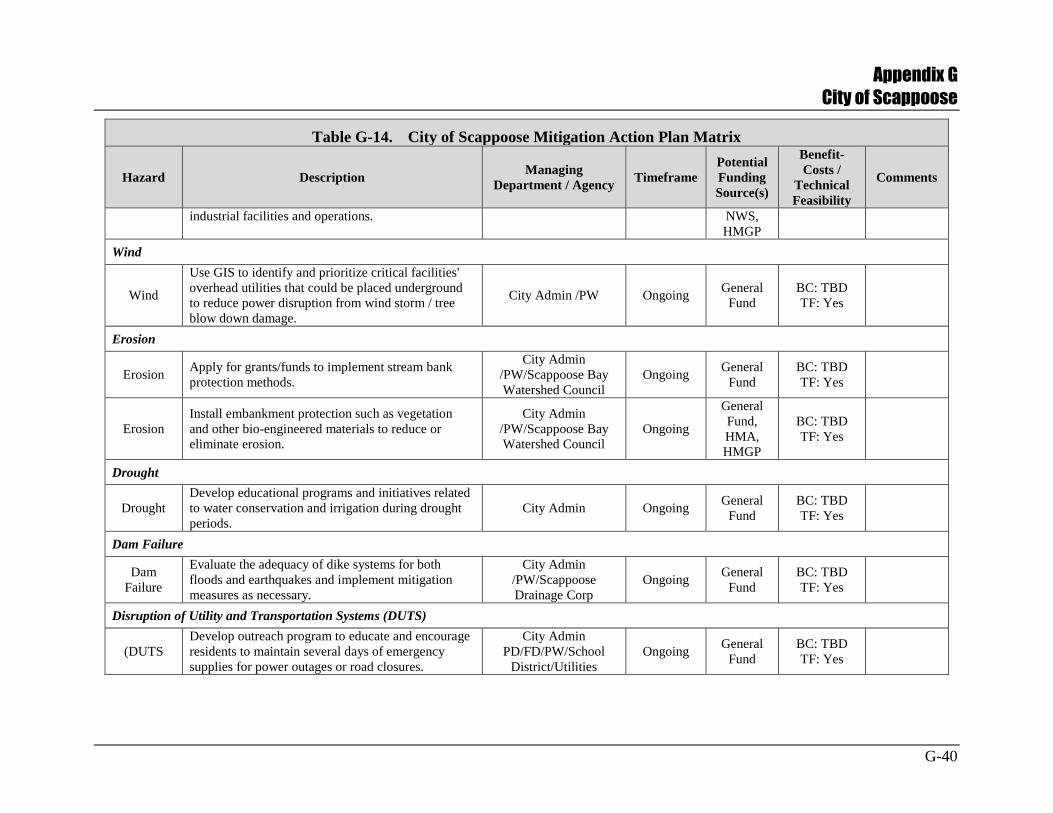
Appendix G
City of Scappoose
G-40
Table G-14. City of Scappoose Mitigation Action Plan Matrix
Hazard Description Managing
Department / Agency Timeframe
Potential
Funding
Source(s)
Benefit-
Costs /
Technical
Feasibility
Comments
industrial facilities and operations. NWS,
HMGP
Wind
Wind
Use GIS to identify and prioritize critical facilities'
overhead utilities that could be placed underground
to reduce power disruption from wind storm / tree
blow down damage.
City Admin /PW Ongoing General
Fund
BC: TBD
TF: Yes
Erosion
Erosion Apply for grants/funds to implement stream bank
protection methods.
City Admin
/PW/Scappoose Bay
Watershed Council
Ongoing General
Fund
BC: TBD
TF: Yes
Erosion
Install embankment protection such as vegetation
and other bio-engineered materials to reduce or
eliminate erosion.
City Admin
/PW/Scappoose Bay
Watershed Council
Ongoing
General
Fund,
HMA,
HMGP
BC: TBD
TF: Yes
Drought
Drought
Develop educational programs and initiatives related
to water conservation and irrigation during drought
periods.
City Admin Ongoing General
Fund
BC: TBD
TF: Yes
Dam Failure
Dam
Failure
Evaluate the adequacy of dike systems for both
floods and earthquakes and implement mitigation
measures as necessary.
City Admin
/PW/Scappoose
Drainage Corp
Ongoing General
Fund
BC: TBD
TF: Yes
Disruption of Utility and Transportation Systems (DUTS)
(DUTS
Develop outreach program to educate and encourage
residents to maintain several days of emergency
supplies for power outages or road closures.
City Admin
PD/FD/PW/School
District/Utilities
Ongoing General
Fund
BC: TBD
TF: Yes
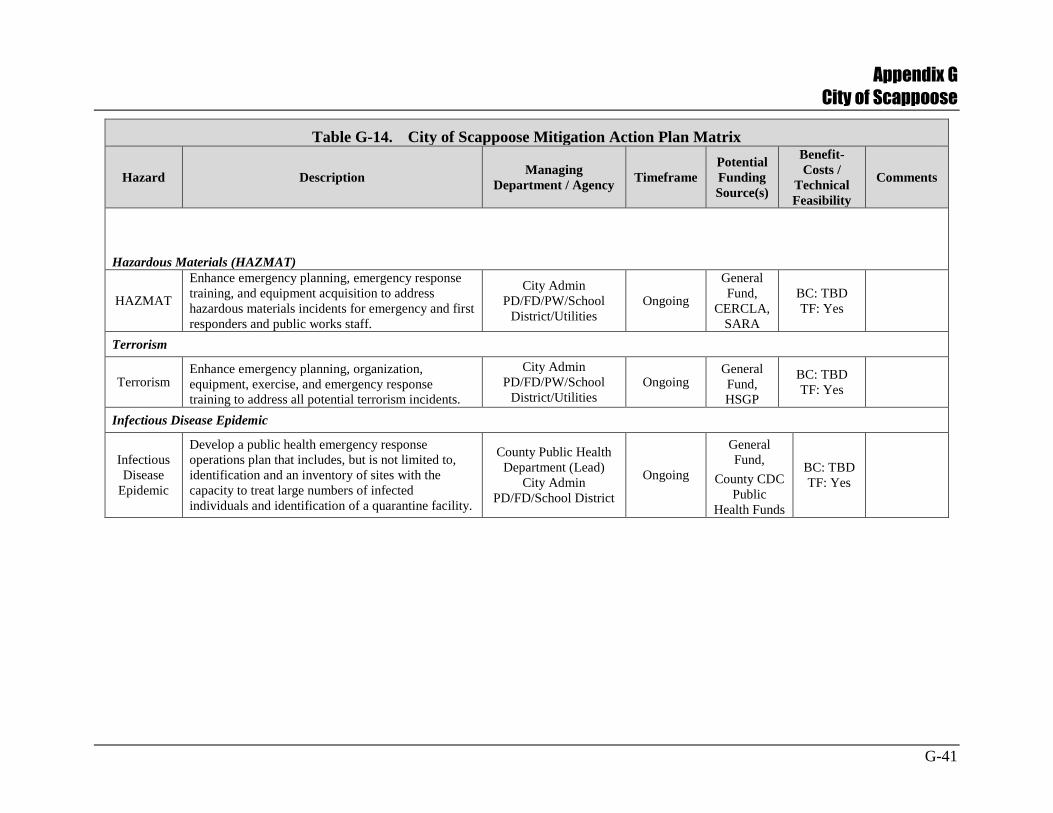
Appendix G
City of Scappoose
G-41
Table G-14. City of Scappoose Mitigation Action Plan Matrix
Hazard Description Managing
Department / Agency Timeframe
Potential
Funding
Source(s)
Benefit-
Costs /
Technical
Feasibility
Comments
Hazardous Materials (HAZMAT)
HAZMAT
Enhance emergency planning, emergency response
training, and equipment acquisition to address
hazardous materials incidents for emergency and first
responders and public works staff.
City Admin
PD/FD/PW/School
District/Utilities
Ongoing
General
Fund,
CERCLA,
SARA
BC: TBD
TF: Yes
Terrorism
Terrorism Enhance emergency planning, organization,
equipment, exercise, and emergency response
training to address all potential terrorism incidents.
City Admin
PD/FD/PW/School
District/Utilities
Ongoing General
Fund,
HSGP
BC: TBD
TF: Yes
Infectious Disease Epidemic
Infectious
Disease
Epidemic
Develop a public health emergency response
operations plan that includes, but is not limited to,
identification and an inventory of sites with the
capacity to treat large numbers of infected
individuals and identification of a quarantine facility.
County Public Health
Department (Lead)
City Admin
PD/FD/School District
Ongoing
General
Fund,
County CDC
Public
Health Funds
BC: TBD
TF: Yes
Appendix G
City of Scappoose
G-42
HISTORY
Hazard Mitigation Completion 2009-2014
The Scappoose School District replaced the Otto Peterson Elementary School with a new structure meeting all building and seismic
codes. A backup power generator was installed to operate the Otto Peterson School along with a power generator at the high school
for the School District computer system.
The Scappoose Fire District completed a seismic upgrade to the Scappoose Fire Station.
The City of Scappoose installed larger power generators at the waste water treatment plant and the Keys road water treatment plant.