Embed Size (px)
Citation preview

5
Resonance and Nonlinear Seismo-Acoustic
Land Mine Detection
Dimitri M. Donskoy
Stevens Institute of Technology
USA
1. Introduction
Since WWII acoustic echo-location method utilized in sonars has been one of the primary approaches for detecting underwater mines. However, earlier attempts to replicate sonar approach and its modifications for detection of landmines were not successful. For example, Caulfield, 1989, House & Pape, 1994, Don & Rogers, 1994 suggested the use of acoustic impulse reflection from soil. A buried object is detected by measuring a relative change in acoustic reflectivity of soil. However, compared to water, soil is an extremely inhomogeneous medium exhibiting wide variations in the physical properties: density, porosity, moisture content, etc. These variations often have a spatial scale comparable with the size of a mine creating respective variations in acoustic reflectivity regardless of presence of buried mines. Another significant drawback of these methods is their inability to discriminate mine from clatter with similar acoustic reflectivity (rocks, tree roots, etc.) The breakthrough in acoustic landmine detection had occurred with the discovery of landmine’s resonance and nonlinear behaviors.
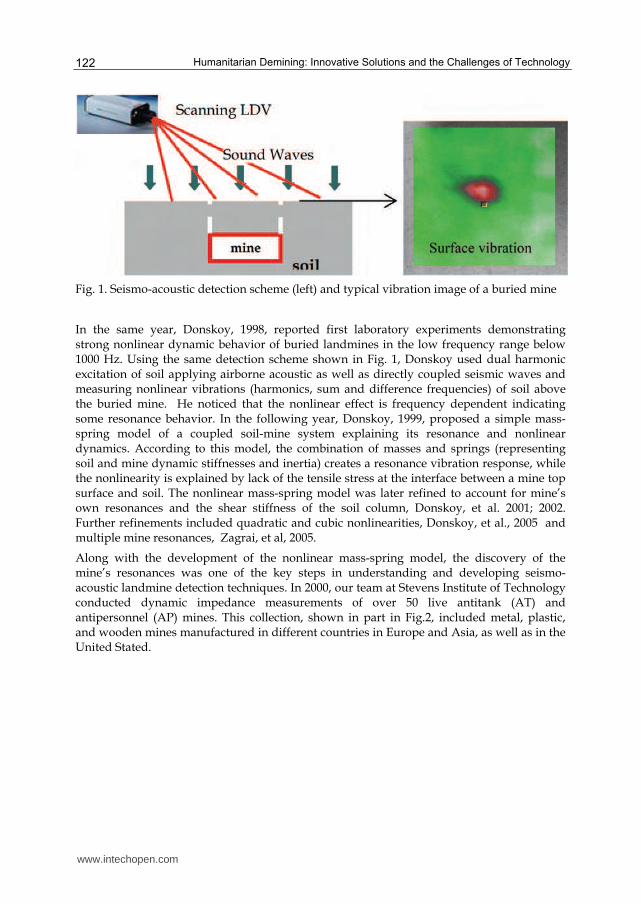
In 1999 Sabatier and Xiang reported the results of the first field test detecting live buried landmines using seismo-acoustic approach, proposed a decade earlier (according to the patent filing date) by Sabatier & Gilbert, 2000. Sabatier & Xiang used Laser Doppler Vibrometer (LDV) to measure vibration of soil excited with an airborne sound. Fig. 1 illustrates the detection approach and the resulting image of soil vibration above a buried mine. They observed noticeable deference (contrast) in soil vibration velocities measured above and off a buried mine. The contrast was observed for a variety of antitank (AT) mines in the relatively low frequency range of 50 to 300 Hz, which was quite puzzling at the time.
Simultaneously, Scott et al., 1998, initiated a laboratory testing of the detection scheme using seismic waves and radar vibrometer. Using sophisticated signal processing, the authors demonstrated that a buried object like a mine reflects a portion of seismic energy propagating along soil surface. They suggested to utilize this reflection effect for landmine detection.
Source: Humanitarian Demining: Innovative Solutions and the Challenges of Technology, Book edited by: Maki K. Habib, ISBN 978-3-902613-11-0, pp. 392, February 2008, I-Tech Education and Publishing, Vienna, Austria
Ope
n A
cces
s D
atab
ase
ww
w.in
tehw
eb.c
om
www.intechopen.com
Humanitarian Demining: Innovative Solutions and the Challenges of Technology
122
Fig. 1. Seismo-acoustic detection scheme (left) and typical vibration image of a buried mine
In the same year, Donskoy, 1998, reported first laboratory experiments demonstrating strong nonlinear dynamic behavior of buried landmines in the low frequency range below 1000 Hz. Using the same detection scheme shown in Fig. 1, Donskoy used dual harmonic excitation of soil applying airborne acoustic as well as directly coupled seismic waves and measuring nonlinear vibrations (harmonics, sum and difference frequencies) of soil above the buried mine. He noticed that the nonlinear effect is frequency dependent indicating some resonance behavior. In the following year, Donskoy, 1999, proposed a simple mass-spring model of a coupled soil-mine system explaining its resonance and nonlinear dynamics. According to this model, the combination of masses and springs (representing soil and mine dynamic stiffnesses and inertia) creates a resonance vibration response, while the nonlinearity is explained by lack of the tensile stress at the interface between a mine top surface and soil. The nonlinear mass-spring model was later refined to account for mine’s own resonances and the shear stiffness of the soil column, Donskoy, et al. 2001; 2002. Further refinements included quadratic and cubic nonlinearities, Donskoy, et al., 2005 and multiple mine resonances, Zagrai, et al, 2005.
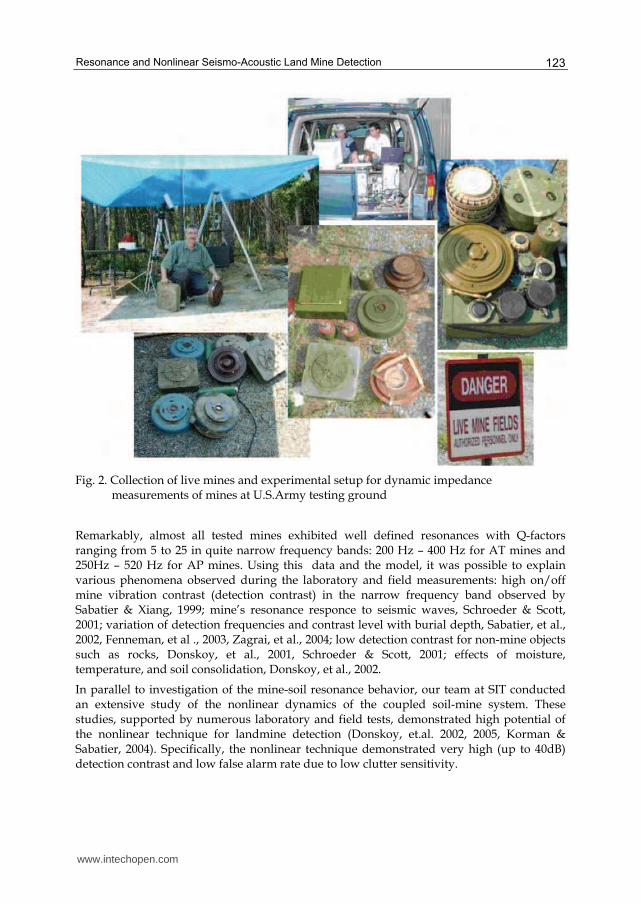
Along with the development of the nonlinear mass-spring model, the discovery of the mine’s resonances was one of the key steps in understanding and developing seismo-acoustic landmine detection techniques. In 2000, our team at Stevens Institute of Technology conducted dynamic impedance measurements of over 50 live antitank (AT) and antipersonnel (AP) mines. This collection, shown in part in Fig.2, included metal, plastic, and wooden mines manufactured in different countries in Europe and Asia, as well as in the United Stated.
www.intechopen.com
Resonance and Nonlinear Seismo-Acoustic Land Mine Detection
123
Fig. 2. Collection of live mines and experimental setup for dynamic impedance measurements of mines at U.S.Army testing ground
Remarkably, almost all tested mines exhibited well defined resonances with Q-factors ranging from 5 to 25 in quite narrow frequency bands: 200 Hz – 400 Hz for AT mines and 250Hz – 520 Hz for AP mines. Using this data and the model, it was possible to explain various phenomena observed during the laboratory and field measurements: high on/off mine vibration contrast (detection contrast) in the narrow frequency band observed by Sabatier & Xiang, 1999; mine’s resonance responce to seismic waves, Schroeder & Scott, 2001; variation of detection frequencies and contrast level with burial depth, Sabatier, et al., 2002, Fenneman, et al ., 2003, Zagrai, et al., 2004; low detection contrast for non-mine objects such as rocks, Donskoy, et al., 2001, Schroeder & Scott, 2001; effects of moisture, temperature, and soil consolidation, Donskoy, et al., 2002.
In parallel to investigation of the mine-soil resonance behavior, our team at SIT conducted an extensive study of the nonlinear dynamics of the coupled soil-mine system. These studies, supported by numerous laboratory and field tests, demonstrated high potential of the nonlinear technique for landmine detection (Donskoy, et.al. 2002, 2005, Korman & Sabatier, 2004). Specifically, the nonlinear technique demonstrated very high (up to 40dB) detection contrast and low false alarm rate due to low clutter sensitivity.
www.intechopen.com
Humanitarian Demining: Innovative Solutions and the Challenges of Technology
124
Following this introduction, we describe major results obtained and methodology developed by the SIT team.
2. Resonance Vibrations of Land Mines
Seismo-acoustic detection of buried landmines explores the dynamic mechanical behavior of mines coupled with soil. Therefore, knowing mine’s dynamic properties would be a natural first step toward understanding the mechanism of the detection, building its physical model, and developing effective detection algorithms.
In August 2000, at the U.S.Army testing site, we conducted first comprehensive measurements of variety of live mines: mines with explosive charges but without fuses. Overall over 50 mines were tested including metal, plastic and wooden AT and AP mines manufactured throughout the world. These tests involved the evaluation of mine’s mechanical impedance in the frequency range 30 – 800 Hz by measuring the acoustic pressure, exerted on mine, and the resulting vibration velocity of the mine top surface. Each tested mine was placed on 2x2x2 cu. ft. concrete foundation flush buried in the ground. External force (airborne acoustic pressure) was applied with a loudspeaker suspended above the mine. We used sinusoidal signal linearly swept from 30 to 800 Hz. The acoustic pressure, P, was measured with a microphone positioned a few mm above the mine top. The mine’s vibration velocity, V, was simultaneously measured just beneath the microphone using a non-contact Laser-Doppler Vibrometer. Data from the microphone and the LDV were fed into a two-channel data acquisition system which calculated and recorded
magnitudes of the mine dynamic impedance (per unit area) as function of frequency, ω;
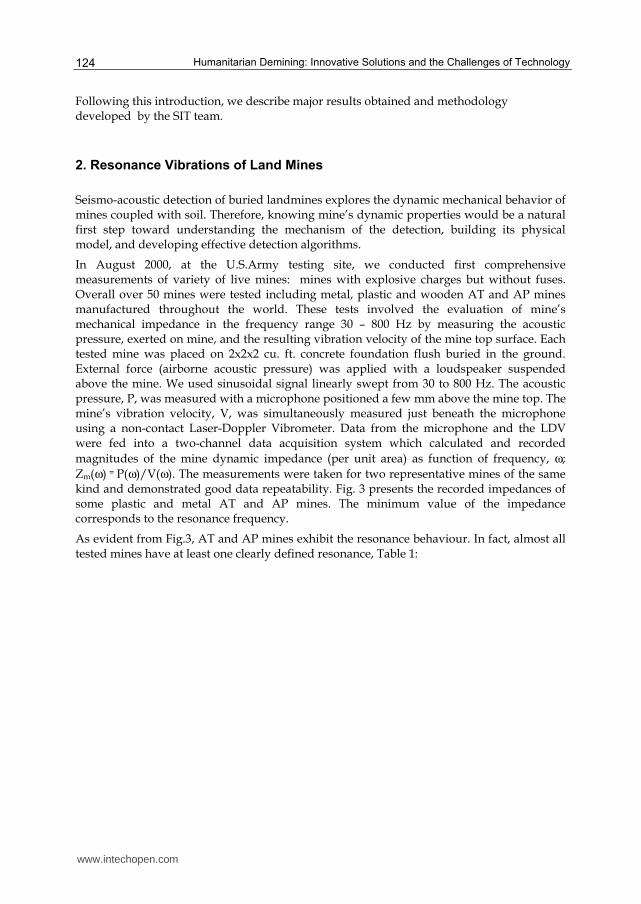
Zm(ω) = P(ω)/V(ω). The measurements were taken for two representative mines of the same kind and demonstrated good data repeatability. Fig. 3 presents the recorded impedances of some plastic and metal AT and AP mines. The minimum value of the impedance corresponds to the resonance frequency.
As evident from Fig.3, AT and AP mines exhibit the resonance behaviour. In fact, almost all tested mines have at least one clearly defined resonance, Table 1:
www.intechopen.com
Resonance and Nonlinear Seismo-Acoustic Land Mine Detection
125
Fig. 3. Representative impedances of AT mines (TMA-4, MK-7, TM-46, VS-1.6) and AP
mines (VS-50, TS-50, OZM-72, PPM-2)
www.intechopen.com

Humanitarian Demining: Innovative Solutions and the Challenges of Technology
126
Table 1. Dynamic parameters of live mines Considering a mine as an oscillator, its impedance in the vicinity of the first (lowest) resonance can be expressed through oscillator’s dynamic parameters (per unit area): inertia or mass, Mm , stiffness, Km , and damping, Rm , as following
zm(ω )= Rm + j(ωMm - Km/ω) . (1)
Using curve fitting of the calculated impedance (1) into the measured impedance curve, we estimate the dynamic parameters of each mine for their lowest resonance. These values are also shown in Table 1. What is the physical nature of these resonances? Depending on mine’s structure, there are two major types of resonances: piston and flexural (bending) resonances of mines’ upper diaphragms. Some mines, such as VS-2.2, VS-1.6, SH-55, TS-50, VS-50, and some others have a very softly supported disk-shaped pressure plate (piston). For such mines, the support is much softer than the rigidity of the plate, so the plate vibrates as a whole (as a piston) up and down or wobble from side to side or from one side only without deformation, Fig.4. These images obtained with a scanning LDV show the vibration velocity distribution at the top of the mine. The color indicates the magnitude of the velocity: red is high and green is low. Each mode is associated with the particular resonance frequency, as shown for the mine VS-50. Many mines have a top cover rigidly connected to their side casings as it can be seen on the pictures of mines TMA-4, TM-46, MK-7, OZM-72 (Fig.3). These covers can be considered as
Mine type First Resonance frequency
f0 (Hz)
Dynamic stiffness
Km*10-7 (Pa/m)
Dynamic massMm
(kg/m2)
Damping constant
Rm (kg/s*m2)
Description
TS-50 520 10 9 4000 AP Plastic
VS-50 330 6 13 3300 AP Plastic
PONZ-2 380 50 85 26000 AP Plastic
PPM-2 320 4 10 4000 AP Plastic
OZM-72 330 80 190 18000 AP Metal
VS-1.6 220 2.5 12 1700 AT Plastic
TMA-5 190 0.2 1.4 300 AT Plastic
SH-55 280 2.5 8 3000 AT Plastic
VS-HCT-2 465 2.8 3.3 500 AT Plastic
TM-62P3 200 7 45 9000 AT Plastic
PTMIBA-3 260 2.5 10 1300 AT Plastic
TMA-4 250 17 65 20000 AT Metal
TM-46 250 4 16 1200 AT Metal
AT-72 200 2 14 1800 AT Wood
www.intechopen.com
Resonance and Nonlinear Seismo-Acoustic Land Mine Detection
127
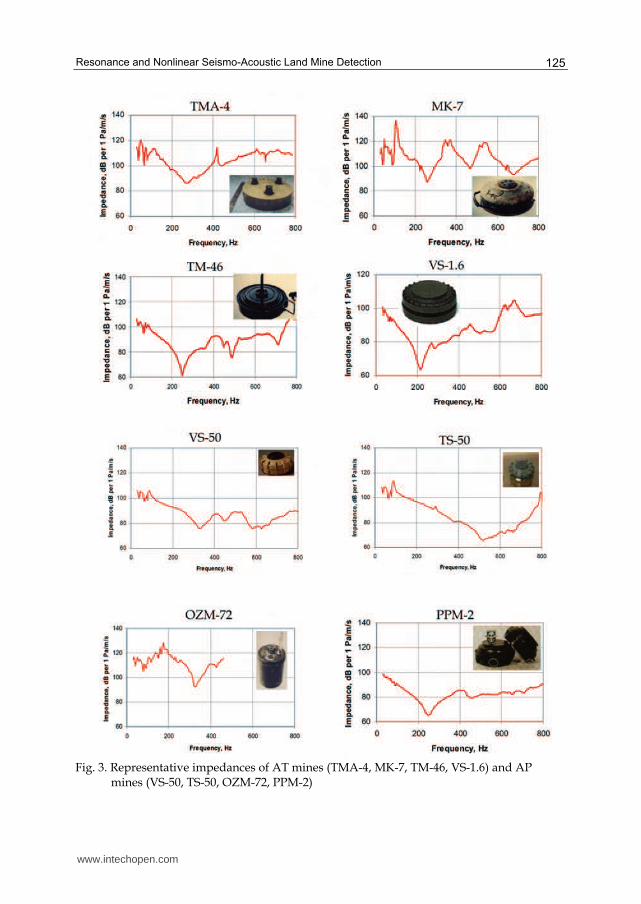
dynamically flexible diaphragms with the respective flexural resonating modes, example of which is depicted in Fig.5 for AT mine TMA-2.
Fig. 4. Piston modes of vibration of AP mine VS-50 (left) and AT mine VS2.2 (right)
Fig. 5. Flexural modes of vibration of AT mine TMA-2 with the respective resonance
frequencies 190 Hz and 490 Hz As an example, we estimate the first flexural resonance frequency for a metal AT mine, similar to TM-46. We simplify its upper diaphragm as a clamped circular plate. The first flexural resonance frequency of this plate can be evaluated using the following formula, Skudrzyk, 1968:
ρυ
π
)1(122 220−
≅E
R
hf , (2)
where h and R are the thickness and the radius of the plate respectively and E, ν, ρ are the material parameters of the plate (Young’s modulus, Poisson’s ratio, and density). Thus, for 1 mm thick and 0.1 m radius steel plate, the resonance frequency is app. 240 Hz, which is a quite accurate estimate of the measured resonance frequency 250Hz for this mine.
www.intechopen.com
Humanitarian Demining: Innovative Solutions and the Challenges of Technology
128
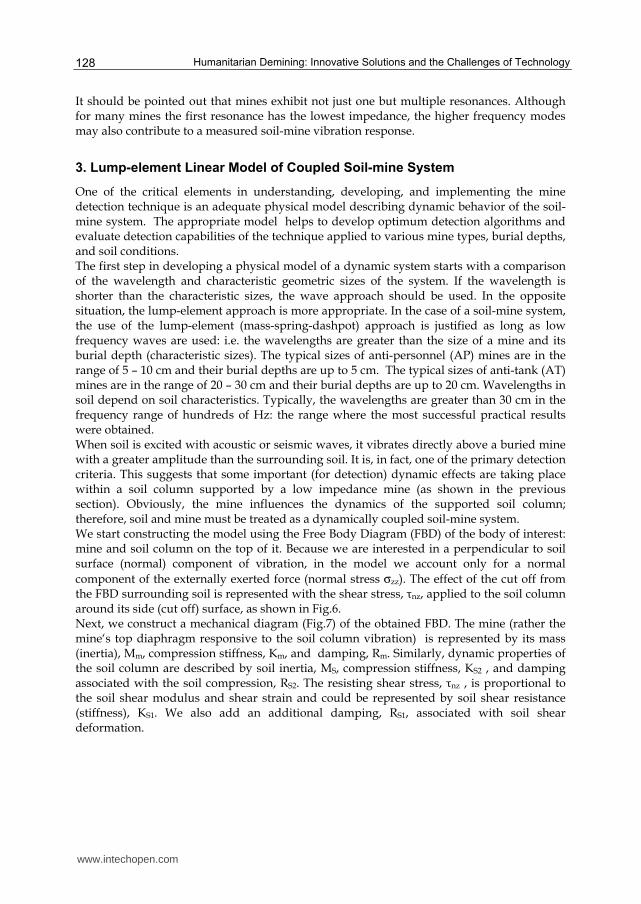
It should be pointed out that mines exhibit not just one but multiple resonances. Although for many mines the first resonance has the lowest impedance, the higher frequency modes may also contribute to a measured soil-mine vibration response.
3. Lump-element Linear Model of Coupled Soil-mine System
One of the critical elements in understanding, developing, and implementing the mine detection technique is an adequate physical model describing dynamic behavior of the soil-mine system. The appropriate model helps to develop optimum detection algorithms and evaluate detection capabilities of the technique applied to various mine types, burial depths, and soil conditions. The first step in developing a physical model of a dynamic system starts with a comparison of the wavelength and characteristic geometric sizes of the system. If the wavelength is shorter than the characteristic sizes, the wave approach should be used. In the opposite situation, the lump-element approach is more appropriate. In the case of a soil-mine system, the use of the lump-element (mass-spring-dashpot) approach is justified as long as low frequency waves are used: i.e. the wavelengths are greater than the size of a mine and its burial depth (characteristic sizes). The typical sizes of anti-personnel (AP) mines are in the range of 5 – 10 cm and their burial depths are up to 5 cm. The typical sizes of anti-tank (AT) mines are in the range of 20 – 30 cm and their burial depths are up to 20 cm. Wavelengths in soil depend on soil characteristics. Typically, the wavelengths are greater than 30 cm in the frequency range of hundreds of Hz: the range where the most successful practical results were obtained. When soil is excited with acoustic or seismic waves, it vibrates directly above a buried mine with a greater amplitude than the surrounding soil. It is, in fact, one of the primary detection criteria. This suggests that some important (for detection) dynamic effects are taking place within a soil column supported by a low impedance mine (as shown in the previous section). Obviously, the mine influences the dynamics of the supported soil column; therefore, soil and mine must be treated as a dynamically coupled soil-mine system. We start constructing the model using the Free Body Diagram (FBD) of the body of interest: mine and soil column on the top of it. Because we are interested in a perpendicular to soil surface (normal) component of vibration, in the model we account only for a normal
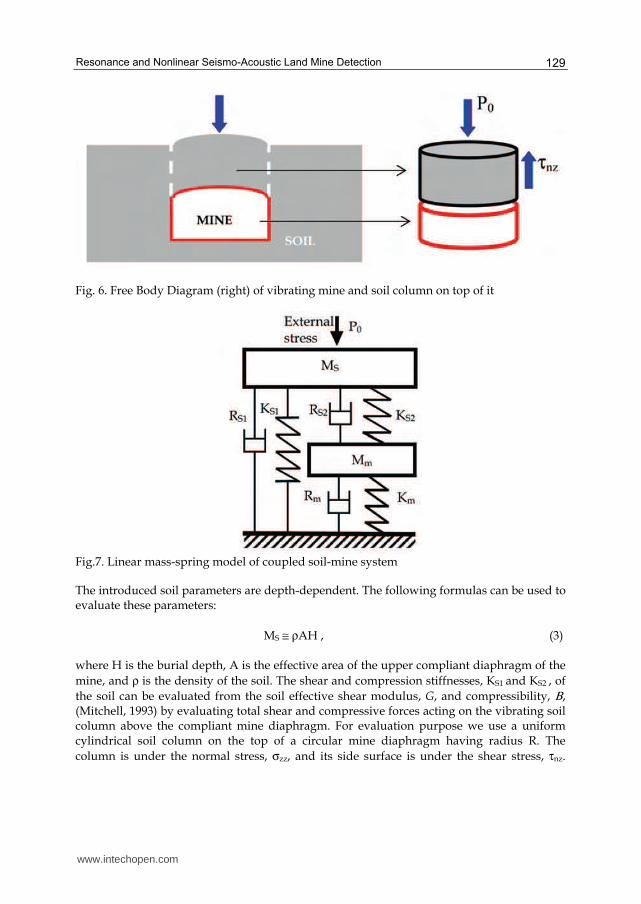
component of the externally exerted force (normal stress σzz). The effect of the cut off from the FBD surrounding soil is represented with the shear stress, τnz, applied to the soil column around its side (cut off) surface, as shown in Fig.6.
Next, we construct a mechanical diagram (Fig.7) of the obtained FBD. The mine (rather the mine‘s top diaphragm responsive to the soil column vibration) is represented by its mass (inertia), Mm, compression stiffness, Km, and damping, Rm. Similarly, dynamic properties of the soil column are described by soil inertia, MS, compression stiffness, KS2 , and damping associated with the soil compression, RS2. The resisting shear stress, τnz , is proportional to the soil shear modulus and shear strain and could be represented by soil shear resistance (stiffness), KS1. We also add an additional damping, RS1, associated with soil shear deformation.
www.intechopen.com
Resonance and Nonlinear Seismo-Acoustic Land Mine Detection
129
Fig. 6. Free Body Diagram (right) of vibrating mine and soil column on top of it
Fig.7. Linear mass-spring model of coupled soil-mine system
The introduced soil parameters are depth-dependent. The following formulas can be used to evaluate these parameters:
MS ≅ ρAH , (3)
where H is the burial depth, A is the effective area of the upper compliant diaphragm of the
mine, and ρ is the density of the soil. The shear and compression stiffnesses, KS1 and KS2 , of
the soil can be evaluated from the soil effective shear modulus, G, and compressibility, Β, (Mitchell, 1993) by evaluating total shear and compressive forces acting on the vibrating soil column above the compliant mine diaphragm. For evaluation purpose we use a uniform cylindrical soil column on the top of a circular mine diaphragm having radius R. The
column is under the normal stress, σzz, and its side surface is under the shear stress, τnz.
www.intechopen.com
Humanitarian Demining: Innovative Solutions and the Challenges of Technology
130
Spring stiffnesses are defined as a ratio of an exerted external force (stress) to the resulting deformation:
KS2 = (P0A)/Δn, KS1 = (τnzS)/Δs, (4)
where S = 2πRH is the side area of the column, A = πR2 is the area of the column foundation,
Δn = εH and Δs = γ(λS/4) are normal and shear deformations, respectively, and λS is the shear
wavelength. Here the deformations are defined using respective normal and shear strains, ε
and γ, multiplied by respective characteristic lengths. In dynamic (wave) problems, the characteristic lengths could be estimated as a quarter of the wavelengths: compression (P-wave) wavelength for the normal deformation and shear (S-wave) wavelength for the shear deformation. In the outlined problem, however, the height of the column, H, is much less than the wavelength of the P-wave, so H is used as a characteristic length for the normal deformation. Substituting the defined deformations into the Eq.(4) and taking into account the stress-strain relationships for the normal and shear deformations, the effective soil column stiffnesses can be evaluated as
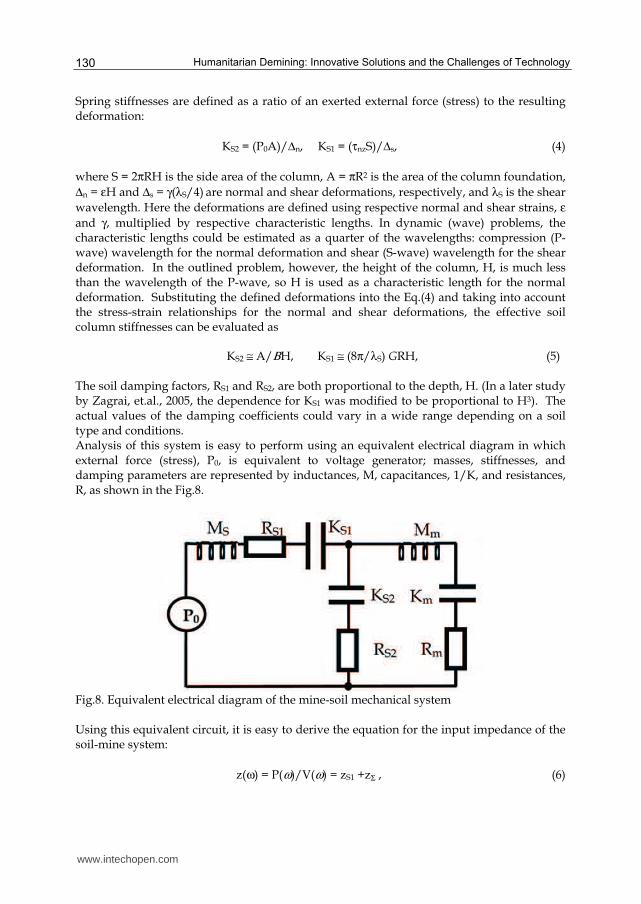
KS2 ≅ A/ΒH, KS1 ≅ (8π/λS) GRH, (5) The soil damping factors, RS1 and RS2, are both proportional to the depth, H. (In a later study by Zagrai, et.al., 2005, the dependence for KS1 was modified to be proportional to H3). The actual values of the damping coefficients could vary in a wide range depending on a soil type and conditions. Analysis of this system is easy to perform using an equivalent electrical diagram in which external force (stress), P0, is equivalent to voltage generator; masses, stiffnesses, and damping parameters are represented by inductances, M, capacitances, 1/K, and resistances, R, as shown in the Fig.8.
Fig.8. Equivalent electrical diagram of the mine-soil mechanical system Using this equivalent circuit, it is easy to derive the equation for the input impedance of the soil-mine system:
z(ω) = P(ω)/V(ω) = zS1 +zΣ , (6)
www.intechopen.com
Resonance and Nonlinear Seismo-Acoustic Land Mine Detection
131
where
zΣ = zS2 zm /( zS2 + zm), zS1 = RS1 +j(ωMS –KS1/ω), zS2 = Rs2 – jKS2/ω , (6a) and zm is defined by the Eq.(1). The described model is one-dimentional or single degree of freedom (SDOF). It is simple, yet very effective and easy to analyze. It explains the linear detection contrast as well as many other experimental observations, such as frequency, phase, and amplitude dependencies of the measured soil vibration as a function of various mine and soil parameters. This SDOF model could be expanded into two-dimensional one, as it is done in Zagrai, et al, 2005, and to include the nonlinear behavior of mines, Donskoy, et al., 2002; 2005.
4. Linear Detection Contrast and its Dependence on Mine and Soil
Parameters
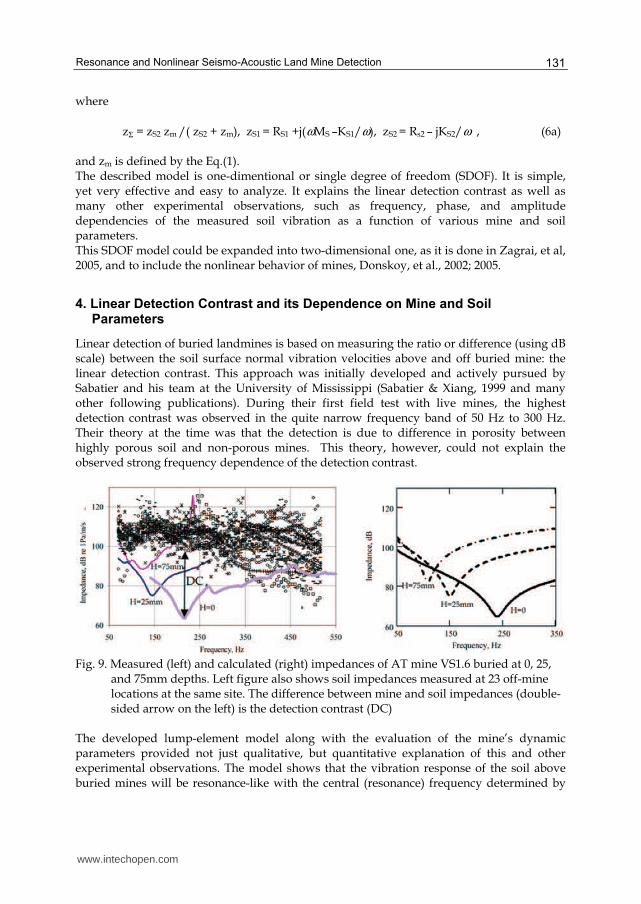
Linear detection of buried landmines is based on measuring the ratio or difference (using dB scale) between the soil surface normal vibration velocities above and off buried mine: the linear detection contrast. This approach was initially developed and actively pursued by Sabatier and his team at the University of Mississippi (Sabatier & Xiang, 1999 and many other following publications). During their first field test with live mines, the highest detection contrast was observed in the quite narrow frequency band of 50 Hz to 300 Hz. Their theory at the time was that the detection is due to difference in porosity between highly porous soil and non-porous mines. This theory, however, could not explain the observed strong frequency dependence of the detection contrast.
Fig. 9. Measured (left) and calculated (right) impedances of AT mine VS1.6 buried at 0, 25,
and 75mm depths. Left figure also shows soil impedances measured at 23 off-mine locations at the same site. The difference between mine and soil impedances (double-sided arrow on the left) is the detection contrast (DC)
The developed lump-element model along with the evaluation of the mine’s dynamic parameters provided not just qualitative, but quantitative explanation of this and other experimental observations. The model shows that the vibration response of the soil above buried mines will be resonance-like with the central (resonance) frequency determined by
www.intechopen.com
Humanitarian Demining: Innovative Solutions and the Challenges of Technology
132
the mine and soil dynamic parameters introduced in the model. Fig.8 (left) shows the impedances of soil measured at 23 off-mine locations (dotted lines) and impedances on the top and above an AT mine VS1.6 at the depths of 0 mm (flash buried), 25 mm, and 75 mm (solid lines). It demonstrates that the detection contrast is resonance-like, its maximum is depth dependant, and it diminishes with the depth. All of these are predicted by the model, Fig.9 (right). The model explains many other field observations. For example, zero linear detection contrast (no detection) for mines buried in frozen soil, in which the shear stiffness, KS2, is very high. As can be seen from the model diagrams depicted in Fig.6 or Fig.7, high value of the shear stiffness dominates the total impedance of the system overwhelming the mine’s contribution. Similarly, an increase in shear stiffness of consolidating soil explains the diminishing contrast for mines buried for a long period of time. Furthermore, the analysis of the model shows that the soil shear stiffness, KS1, is one of the key parameters determining the detection contrast: the higher is the stiffness, the lower is the contrast.
4.1 Effect of Soil Shear Stiffness on the Detection Contrast
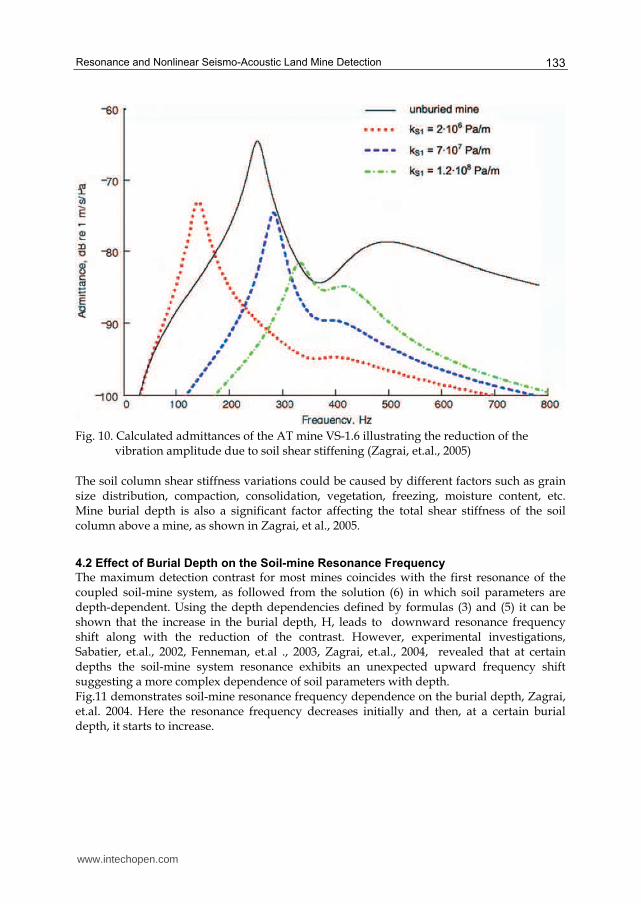
A range of factors influences the detection contrast including the soil mechanical loading, its inhomogeneity, the distribution of moisture in the soil, vegetation, weathering, etc. As a result, the soil layer above the buried mine considerably affects the system dynamic response, the detection contrast, and its resonance frequency. At greater depths, the contrast is diminishing (Fig. 9) leading to poor detection and discrimination. Understanding physical mechanisms that contribute to the reduction in soil vibration amplitude above buried mine is crucially important, since the amplitude is a key parameter used for detection. Certainly, dissipation of the elastic energy in a soil column above the mine plays an important role. However, the dissipation along can’t explain the reduction of the detection contrast with time (for the same undisturbed mine) as soil consolidates. The dissipation can’t account for significant contrast reduction for deeper buried mines. Based on the model analysis, we suggest that increasing shear stiffness of soil contributes to reduction of the vibration amplitude above the buried mine. This effect is illustrated in Fig. 10, showing calculated admittances (inverse impedances) for the AT mine VS-1.6. The solid line in the figure is the admittance of the flush-buried mine (zero depth) obtained by using the experimental data from the Table 1. The dotted line represents the admittance of the mine buried at 1 cm, where KS1=2.106 Pa/m. Then, without modifying other parameters in the model, we calculated admittances for the higher shear stiffness: KS1=7.107 Pa/m (dashed line) and KS1 =1.2 .108 Pa/m (dashed-dotted line). As it could be seen from the figure, the vibration amplitude of the mine buried in the stiffer soil decreased substantially without any change in damping.
www.intechopen.com
Resonance and Nonlinear Seismo-Acoustic Land Mine Detection
133
Fig. 10. Calculated admittances of the AT mine VS-1.6 illustrating the reduction of the
vibration amplitude due to soil shear stiffening (Zagrai, et.al., 2005)
The soil column shear stiffness variations could be caused by different factors such as grain size distribution, compaction, consolidation, vegetation, freezing, moisture content, etc. Mine burial depth is also a significant factor affecting the total shear stiffness of the soil column above a mine, as shown in Zagrai, et al., 2005.
4.2 Effect of Burial Depth on the Soil-mine Resonance Frequency
The maximum detection contrast for most mines coincides with the first resonance of the coupled soil-mine system, as followed from the solution (6) in which soil parameters are depth-dependent. Using the depth dependencies defined by formulas (3) and (5) it can be shown that the increase in the burial depth, H, leads to downward resonance frequency shift along with the reduction of the contrast. However, experimental investigations, Sabatier, et.al., 2002, Fenneman, et.al ., 2003, Zagrai, et.al., 2004, revealed that at certain depths the soil-mine system resonance exhibits an unexpected upward frequency shift suggesting a more complex dependence of soil parameters with depth. Fig.11 demonstrates soil-mine resonance frequency dependence on the burial depth, Zagrai, et.al. 2004. Here the resonance frequency decreases initially and then, at a certain burial depth, it starts to increase.
www.intechopen.com
Humanitarian Demining: Innovative Solutions and the Challenges of Technology
134
0.2
0.3
0.4
0.5
0.6
0.7
0 0.005 0.01 0.015 0.02 0.025 0.03 0.035 0.04
H,m
Rela
tive r
esonance fre
quency F
(H)/
F(0
) .
Experiment 1 Experiment 2
Mass and stiffness theory Added mass theory
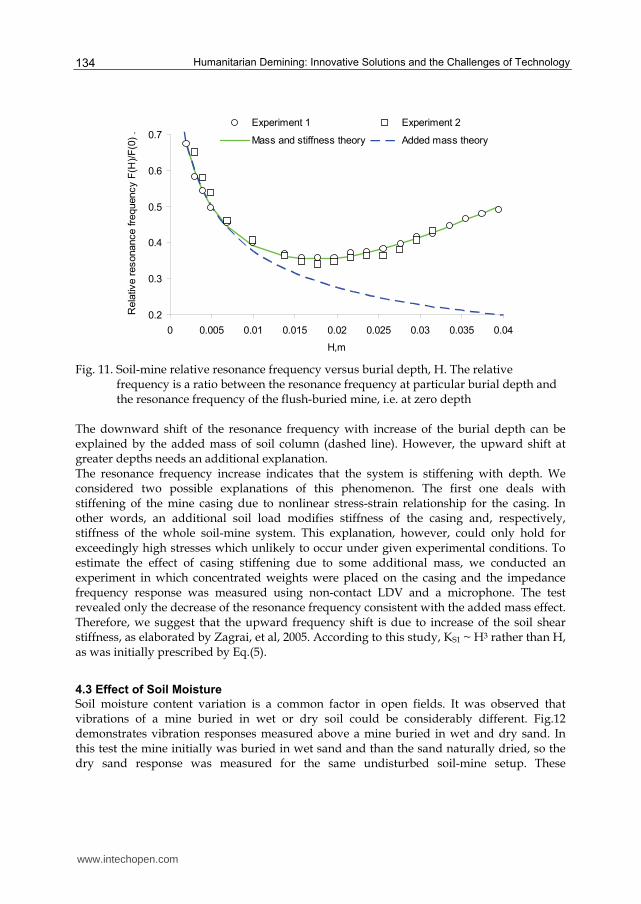
Fig. 11. Soil-mine relative resonance frequency versus burial depth, H. The relative
frequency is a ratio between the resonance frequency at particular burial depth and the resonance frequency of the flush-buried mine, i.e. at zero depth
The downward shift of the resonance frequency with increase of the burial depth can be explained by the added mass of soil column (dashed line). However, the upward shift at greater depths needs an additional explanation. The resonance frequency increase indicates that the system is stiffening with depth. We considered two possible explanations of this phenomenon. The first one deals with stiffening of the mine casing due to nonlinear stress-strain relationship for the casing. In other words, an additional soil load modifies stiffness of the casing and, respectively, stiffness of the whole soil-mine system. This explanation, however, could only hold for exceedingly high stresses which unlikely to occur under given experimental conditions. To estimate the effect of casing stiffening due to some additional mass, we conducted an experiment in which concentrated weights were placed on the casing and the impedance frequency response was measured using non-contact LDV and a microphone. The test revealed only the decrease of the resonance frequency consistent with the added mass effect. Therefore, we suggest that the upward frequency shift is due to increase of the soil shear stiffness, as elaborated by Zagrai, et al, 2005. According to this study, KS1 ~ H3 rather than H, as was initially prescribed by Eq.(5).
4.3 Effect of Soil Moisture
Soil moisture content variation is a common factor in open fields. It was observed that vibrations of a mine buried in wet or dry soil could be considerably different. Fig.12 demonstrates vibration responses measured above a mine buried in wet and dry sand. In this test the mine initially was buried in wet sand and than the sand naturally dried, so the dry sand response was measured for the same undisturbed soil-mine setup. These
www.intechopen.com
Resonance and Nonlinear Seismo-Acoustic Land Mine Detection
135
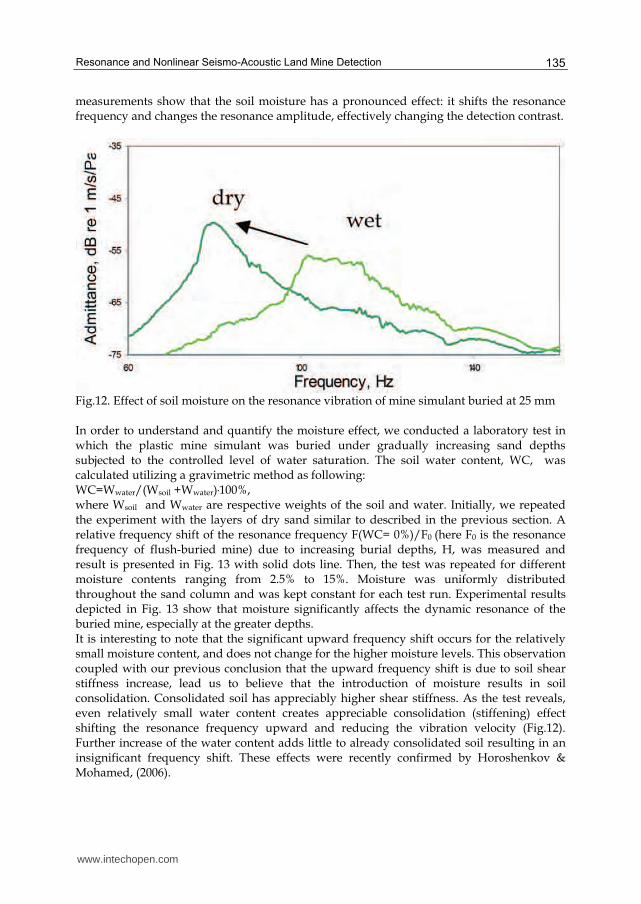
measurements show that the soil moisture has a pronounced effect: it shifts the resonance frequency and changes the resonance amplitude, effectively changing the detection contrast.
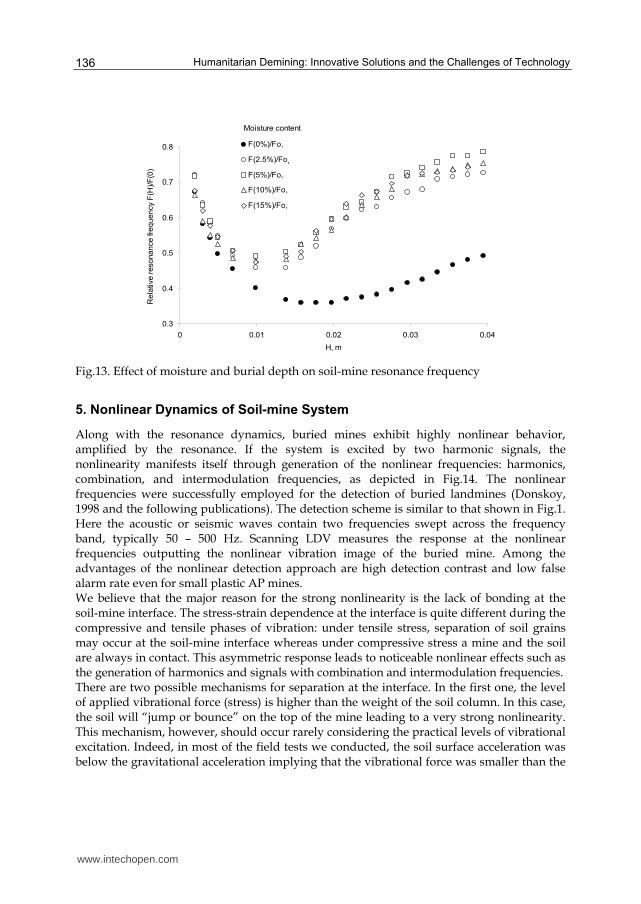
Fig.12. Effect of soil moisture on the resonance vibration of mine simulant buried at 25 mm In order to understand and quantify the moisture effect, we conducted a laboratory test in which the plastic mine simulant was buried under gradually increasing sand depths subjected to the controlled level of water saturation. The soil water content, WC, was calculated utilizing a gravimetric method as following: WC=Wwater/(Wsoil +Wwater).100%, where Wsoil and Wwater are respective weights of the soil and water. Initially, we repeated the experiment with the layers of dry sand similar to described in the previous section. A relative frequency shift of the resonance frequency F(WC= 0%)/F0 (here F0 is the resonance frequency of flush-buried mine) due to increasing burial depths, H, was measured and result is presented in Fig. 13 with solid dots line. Then, the test was repeated for different moisture contents ranging from 2.5% to 15%. Moisture was uniformly distributed throughout the sand column and was kept constant for each test run. Experimental results depicted in Fig. 13 show that moisture significantly affects the dynamic resonance of the buried mine, especially at the greater depths. It is interesting to note that the significant upward frequency shift occurs for the relatively small moisture content, and does not change for the higher moisture levels. This observation coupled with our previous conclusion that the upward frequency shift is due to soil shear stiffness increase, lead us to believe that the introduction of moisture results in soil consolidation. Consolidated soil has appreciably higher shear stiffness. As the test reveals, even relatively small water content creates appreciable consolidation (stiffening) effect shifting the resonance frequency upward and reducing the vibration velocity (Fig.12). Further increase of the water content adds little to already consolidated soil resulting in an insignificant frequency shift. These effects were recently confirmed by Horoshenkov & Mohamed, (2006).
www.intechopen.com
Humanitarian Demining: Innovative Solutions and the Challenges of Technology
136
Moisture content
0.3
0.4
0.5
0.6
0.7
0.8
0 0.01 0.02 0.03 0.04
H, m
Rela
tive r
esonance fre
quency F
(H)/F
(0)
F(0%)/Fo,
F(2.5%)/Fo-2,
F(5%)/Fo,
F(10%)/Fo,
F(15%)/Fo,
,
Fig.13. Effect of moisture and burial depth on soil-mine resonance frequency
5. Nonlinear Dynamics of Soil-mine System
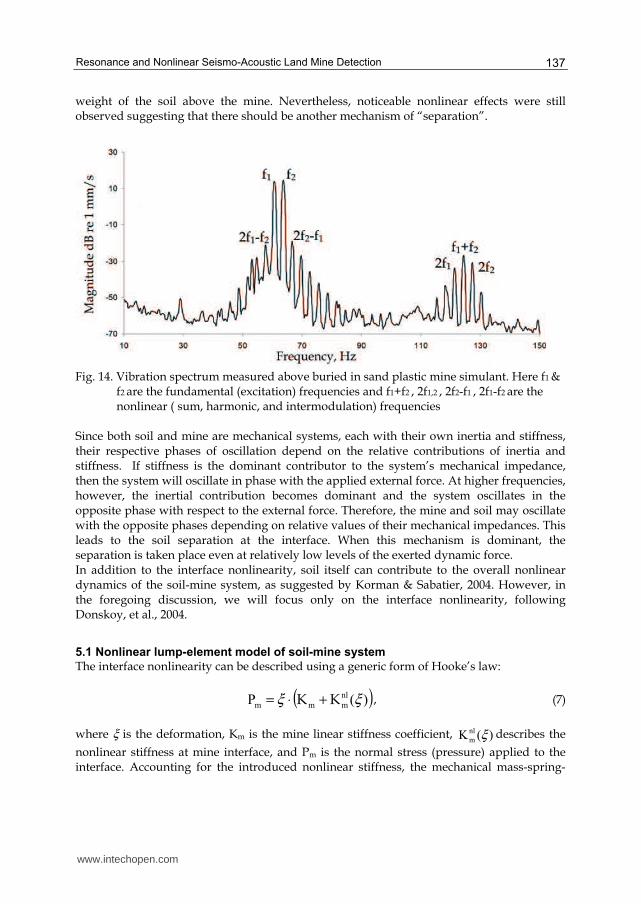
Along with the resonance dynamics, buried mines exhibit highly nonlinear behavior, amplified by the resonance. If the system is excited by two harmonic signals, the nonlinearity manifests itself through generation of the nonlinear frequencies: harmonics, combination, and intermodulation frequencies, as depicted in Fig.14. The nonlinear frequencies were successfully employed for the detection of buried landmines (Donskoy, 1998 and the following publications). The detection scheme is similar to that shown in Fig.1. Here the acoustic or seismic waves contain two frequencies swept across the frequency band, typically 50 – 500 Hz. Scanning LDV measures the response at the nonlinear frequencies outputting the nonlinear vibration image of the buried mine. Among the advantages of the nonlinear detection approach are high detection contrast and low false alarm rate even for small plastic AP mines. We believe that the major reason for the strong nonlinearity is the lack of bonding at the soil-mine interface. The stress-strain dependence at the interface is quite different during the compressive and tensile phases of vibration: under tensile stress, separation of soil grains may occur at the soil-mine interface whereas under compressive stress a mine and the soil are always in contact. This asymmetric response leads to noticeable nonlinear effects such as the generation of harmonics and signals with combination and intermodulation frequencies. There are two possible mechanisms for separation at the interface. In the first one, the level of applied vibrational force (stress) is higher than the weight of the soil column. In this case, the soil will “jump or bounce” on the top of the mine leading to a very strong nonlinearity. This mechanism, however, should occur rarely considering the practical levels of vibrational excitation. Indeed, in most of the field tests we conducted, the soil surface acceleration was below the gravitational acceleration implying that the vibrational force was smaller than the
www.intechopen.com
Resonance and Nonlinear Seismo-Acoustic Land Mine Detection
137
weight of the soil above the mine. Nevertheless, noticeable nonlinear effects were still observed suggesting that there should be another mechanism of “separation”.
Fig. 14. Vibration spectrum measured above buried in sand plastic mine simulant. Here f1 &
f2 are the fundamental (excitation) frequencies and f1+f2 , 2f1,2 , 2f2-f1 , 2f1-f2 are the
nonlinear ( sum, harmonic, and intermodulation) frequencies
Since both soil and mine are mechanical systems, each with their own inertia and stiffness, their respective phases of oscillation depend on the relative contributions of inertia and stiffness. If stiffness is the dominant contributor to the system’s mechanical impedance, then the system will oscillate in phase with the applied external force. At higher frequencies, however, the inertial contribution becomes dominant and the system oscillates in the opposite phase with respect to the external force. Therefore, the mine and soil may oscillate with the opposite phases depending on relative values of their mechanical impedances. This leads to the soil separation at the interface. When this mechanism is dominant, the separation is taken place even at relatively low levels of the exerted dynamic force. In addition to the interface nonlinearity, soil itself can contribute to the overall nonlinear dynamics of the soil-mine system, as suggested by Korman & Sabatier, 2004. However, in the foregoing discussion, we will focus only on the interface nonlinearity, following Donskoy, et al., 2004.
5.1 Nonlinear lump-element model of soil-mine system
The interface nonlinearity can be described using a generic form of Hooke’s law:
( ))(P nl
mmm ξξ KK +⋅= , (7)
where ξ is the deformation, Km is the mine linear stiffness coefficient, )(K nl
m ξ describes the
nonlinear stiffness at mine interface, and Pm is the normal stress (pressure) applied to the interface. Accounting for the introduced nonlinear stiffness, the mechanical mass-spring-
www.intechopen.com
Humanitarian Demining: Innovative Solutions and the Challenges of Technology
138
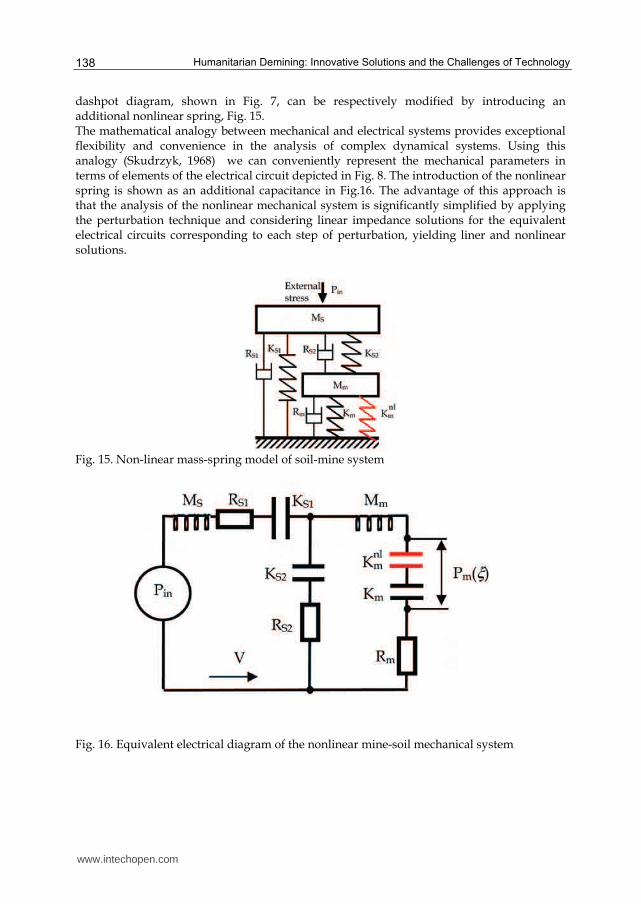
dashpot diagram, shown in Fig. 7, can be respectively modified by introducing an additional nonlinear spring, Fig. 15. The mathematical analogy between mechanical and electrical systems provides exceptional flexibility and convenience in the analysis of complex dynamical systems. Using this analogy (Skudrzyk, 1968) we can conveniently represent the mechanical parameters in terms of elements of the electrical circuit depicted in Fig. 8. The introduction of the nonlinear spring is shown as an additional capacitance in Fig.16. The advantage of this approach is that the analysis of the nonlinear mechanical system is significantly simplified by applying the perturbation technique and considering linear impedance solutions for the equivalent electrical circuits corresponding to each step of perturbation, yielding liner and nonlinear solutions.
Fig. 15. Non-linear mass-spring model of soil-mine system
Fig. 16. Equivalent electrical diagram of the nonlinear mine-soil mechanical system
www.intechopen.com
Resonance and Nonlinear Seismo-Acoustic Land Mine Detection
139
The nonlinear nature of the acoustic interaction at the soil-mine interface is accounted for by
the dependence of stiffness on deformation, ξ , in Hooke’s law, Eq. (7). For small deformations, the nonlinear contribution can be approximated using the 1st and 2nd terms in
Taylor’s expansion, i.e. ( )22
m
nl
m K)(K ξβαξξ +≈ . Substitution of this approximation into
Eq.(7) yeilds
Pm(ξ) = Kmξ [1 + αξ + (βξ)2]. (8)
The coefficients α and β characterize, respectively, the quadratic and cubic nonlinearities of the soil-mine interface. The first, second, and third terms on the right-hand side of Eq.(8) are
equal when ξ = 1/α = 1/β which is the case of very strong nonlinearity. In practice, the nonlinearity is usually weak, so we assume:
α ξ << 1 and β ξ << 1 . (9)
In classical nonlinear acoustics, the quadratic term in the nonlinear form of Hooke’s law, as a rule, dominates over the cubic term and the effects of the latter are usually neglected, unless there is strong hysteretic or other non-classical nonlinearity. We are not discounting the hysteretic and relaxation nature of the soil dynamics. In fact, such nonlinearity is common for grainy media and could contribute to the nonlinearity of the soil-mine system, as pointed out by Korman & Sabatier, 2004. Regardless of its nature, the cubic nonlinearity could have appreciable effects in a resonance system, such as soil-
mine. If the probing signal has excitation frequencies ω1 and ω2 close to the system’s resonance frequency, the nonlinear response due to the cubic nonlinearity manifests itself at
the intermodulation (IM) frequencies 2ω1-ω2 and 2ω2-ω1 (the term IM is widely used in electronic and RF engineering to describe similar cubic nonlinear effects). If these intermodulation frequencies lie within the system’s resonance they are effectively amplified
by the resonance. In contrast, the quadratic nonlinear response observed at frequencies ω1-
ω2, ω1+ω2, 2ω1, 2ω2 is not amplified since these frequencies are outside of the resonance frequency band. As a result, even if the contribution of the cubic nonlinearity in Eq. (8) is
weak, the response of the system at frequencies 2ω1-ω2 and 2ω2-ω1 could be comparable or even exceeding the response associated with the quadratic nonlinearity.
5.2 Quadratic and Intermodulation Nonlinear Solutions
The analytical solution of a “weakly” nonlinear system represented in Fig.16 is derived using the perturbation method (Donskoy, et.al., 2004). Skipping the derivations, here we present the final solution for the nonlinear vibration velocity responces of the mine-soil system under the bi-harmonic excitation:
.ccePeP)t(Pti
02
ti
01in21 ++= ωω , (10)
where P01 and P02 are complex amplitudes of the applied acoustic normal stress at the
respective frequencies ω1 and ω2 .
The quadratic nonlinearity manifests itself at sum, ω1+ω2, and difference, ω1-ω2, frequencies.
The sum frequency solution for the vibration velocity, VΣ , is the following (the similar solution is for the difference frequency):
www.intechopen.com
Humanitarian Demining: Innovative Solutions and the Challenges of Technology
140
)(z
1
)(z)(z
)(z)(zVV
K2V
12m1m
2121
21
m
Σ
ΣΣΣ =
ωωω
ωω
ωω
α , (11)
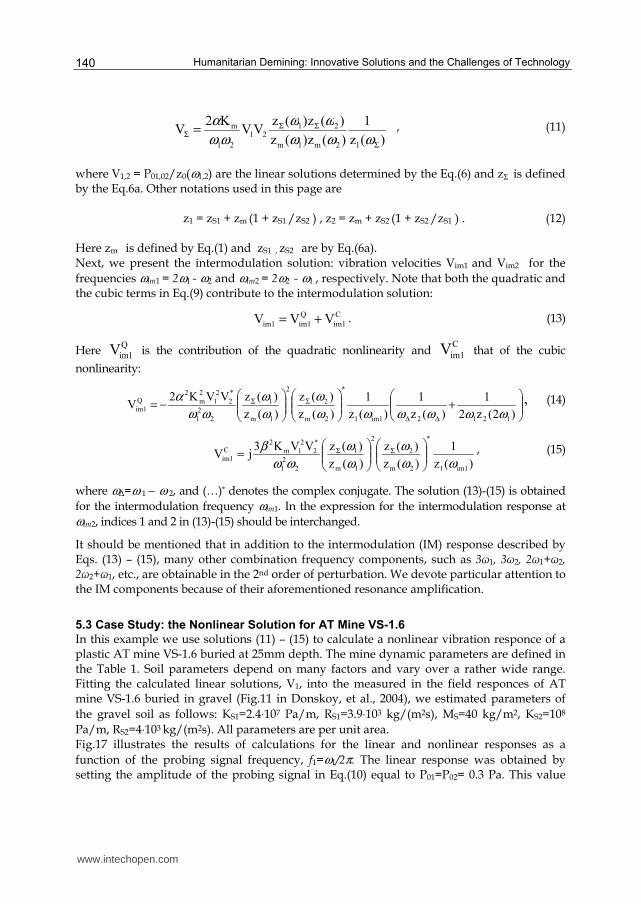
where V1,2 = P01,02/z0(ω1,2) are the linear solutions determined by the Eq.(6) and zΣ is defined by the Eq.6a. Other notations used in this page are
z1 = zS1 + zm (1 + zS1 /zS2 ) , z2 = zm + zS2 (1 + zS2 /zS1 ) . (12) Here zm is defined by Eq.(1) and zS1 , zS2 are by Eq.(6a). Next, we present the intermodulation solution: vibration velocities Vim1 and Vim2 for the
frequencies ωim1 = 2ω1 - ω2 and ωim2 = 2ω2 - ω1 , respectively. Note that both the quadratic and the cubic terms in Eq.(9) contribute to the intermodulation solution:
C
1im
Q
1im1im VVV += . (13)
Here Q
1imV is the contribution of the quadratic nonlinearity and C
1imV that of the cubic
nonlinearity:
⎟⎟⎠⎞⎜⎜⎝
⎛+⎟⎟⎠
⎞⎜⎜⎝⎛⎟⎟⎠
⎞⎜⎜⎝⎛
−=ΔΔ
ΣΣ
)2(z2
1
)(z
1
)(z
1
)(z
)(z
)(z
)(zVVK2V
12121im1
*
2m
2
2
1m
1
2
2
1
*
2
2
1
2
m
2Q
1im ωωωωωω
ω
ω
ω
ωω
α , (14)
)(z
1
)(z
)(z
)(z
)(zVVK3jV
1im1
*
2m
2
2
1m
1
2
2
1
*
2
2
1m
2C
1im ωω
ω
ω
ω
ωω
β ⎟⎟⎠⎞⎜⎜⎝
⎛⎟⎟⎠⎞⎜⎜⎝
⎛= ΣΣ , (15)
where ωΔ=ω 1 − ω 2, and (…)* denotes the complex conjugate. The solution (13)-(15) is obtained
for the intermodulation frequency ωim1. In the expression for the intermodulation response at
ωim2, indices 1 and 2 in (13)-(15) should be interchanged.
It should be mentioned that in addition to the intermodulation (IM) response described by Eqs. (13) – (15), many other combination frequency components, such as 3ω1, 3ω2, 2ω1+ω2, 2ω2+ω1, etc., are obtainable in the 2nd order of perturbation. We devote particular attention to the IM components because of their aforementioned resonance amplification.
5.3 Case Study: the Nonlinear Solution for AT Mine VS-1.6
In this example we use solutions (11) – (15) to calculate a nonlinear vibration responce of a plastic AT mine VS-1.6 buried at 25mm depth. The mine dynamic parameters are defined in the Table 1. Soil parameters depend on many factors and vary over a rather wide range. Fitting the calculated linear solutions, V1, into the measured in the field responces of AT mine VS-1.6 buried in gravel (Fig.11 in Donskoy, et al., 2004), we estimated parameters of
the gravel soil as follows: KS1=2.4⋅107 Pa/m, RS1=3.9⋅103 kg/(m2s), MS=40 kg/m2, KS2=108
Pa/m, RS2=4⋅103 kg/(m2s). All parameters are per unit area. Fig.17 illustrates the results of calculations for the linear and nonlinear responses as a
function of the probing signal frequency, f1=ω1/2π. The linear response was obtained by setting the amplitude of the probing signal in Eq.(10) equal to P01=P02= 0.3 Pa. This value
www.intechopen.com
Resonance and Nonlinear Seismo-Acoustic Land Mine Detection
141
corresponds to the amplitude of the acoustic pressure at the soil surface, which, according to
field measurements, produces a soil surface velocity of V1 ≈ V2 ≈ 5.7⋅10-5m/s at the soil-mine
resonance frequency f0 ≈150 Hz (mine is buried at 25 mm depth). This result is presented in
Fig.17 with a solid line and denoted as ω = ω1,2. As it can be seen from the linear response,
the resonance frequency bandwidth at –6 dB level is approximately Δf = 20 Hz. In order to
observe the resonance amplification of the intermodulation frequencies, Δf should be greater
than the difference between the frequencies of the probing signal (5), i.e. Δf > δf = f2 - f1 and
for this reason we have chosen δf = 5 Hz.
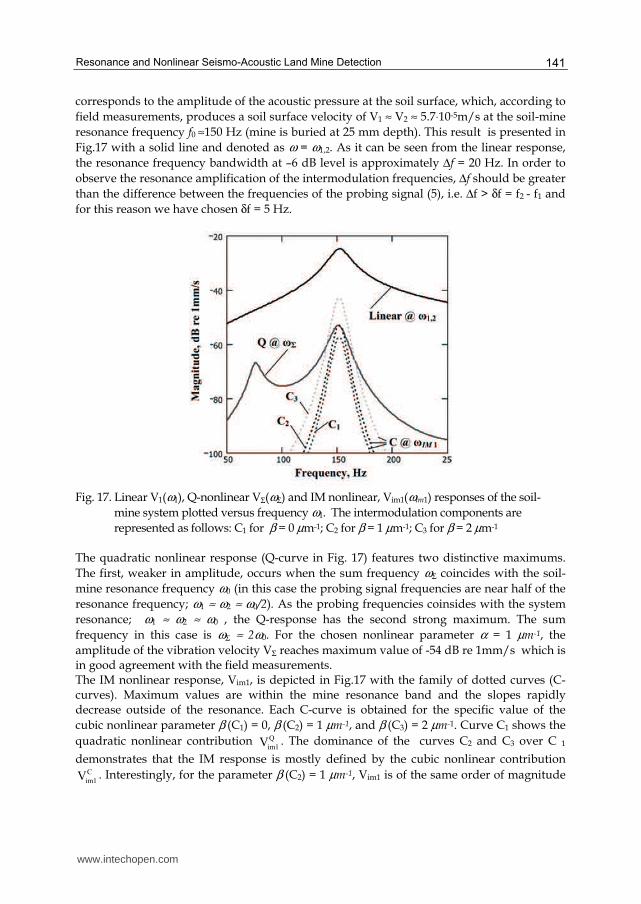
Fig. 17. Linear V1(ω1), Q-nonlinear VΣ(ωΣ) and IM nonlinear, Vim1(ωim1) responses of the soil-
mine system plotted versus frequency ω1. The intermodulation components are
represented as follows: C1 for β = 0 µm-1; C2 for β = 1 µm-1; C3 for β = 2 µm-1 The quadratic nonlinear response (Q-curve in Fig. 17) features two distinctive maximums.
The first, weaker in amplitude, occurs when the sum frequency ωΣ coincides with the soil-
mine resonance frequency ω0 (in this case the probing signal frequencies are near half of the
resonance frequency; ω1 ≈ ω2 ≈ ω0/2). As the probing frequencies coinsides with the system
resonance; ω1 ≈ ω2 ≈ ω0 , the Q-response has the second strong maximum. The sum
frequency in this case is ωΣ ≈ 2ω0. For the chosen nonlinear parameter α = 1 µm-1, the
amplitude of the vibration velocity VΣ reaches maximum value of -54 dB re 1mm/s which is in good agreement with the field measurements. The IM nonlinear response, Vim1, is depicted in Fig.17 with the family of dotted curves (C-curves). Maximum values are within the mine resonance band and the slopes rapidly decrease outside of the resonance. Each C-curve is obtained for the specific value of the
cubic nonlinear parameter β (C1) = 0, β (C2) = 1 µm-1, and β (C3) = 2 µm-1. Curve C1 shows the
quadratic nonlinear contribution Q
1imV . The dominance of the curves C2 and C3 over C 1
demonstrates that the IM response is mostly defined by the cubic nonlinear contribution C
1imV . Interestingly, for the parameter β (C2) = 1 µm-1, Vim1 is of the same order of magnitude
www.intechopen.com
Humanitarian Demining: Innovative Solutions and the Challenges of Technology
142
as VΣ and for β (C3) = 2 µm-1 the IM response even exceeds the maximum value of the
quadratic nonlinear response VΣ.
5.4 Nonlinear Detection Contrast
Similar to the linear detection contrast, the nonlinear contrast is the ratio (linear scale) or difference (dB scale) between nonlinear vibration velocities of the soil above and off buried mine. Essentially, it is the detection contrast that determines the detectability of a buried landmine. With a background level (or, in other words, velocities measured at off mine locations) of approximately –(40÷50) dB re 1 mm/s (Sabatier &Xiang, 1999), typical values of the detection contrast for linear detection is in the range of ~ 10÷20 dB. The nonlinear background level is ~ –80 dB re 1 mm/s (Donskoy, et.al., 2002), so the nonlinear detection contrast is in the range of ~ 30÷40 dB. This is an order of magnitude greater than the linear detection scheme could offer. This indicates that the nonlinear detection has the potential of being very sensitive. Immediate use of the nonlinear contrast gain, however, is constrained by the relatively high noise floor of commercially available scanning LDVs. For example, the Polytec scanning LDV used in our field tests has a noise level of ~ -60 dB re 1 mm/s thereby limiting the nonlinear contrast to ~10÷20 dB only. At the same time, a single point LDV (from Polytec as well) with lower noise levels allowed for the measurements of background nonlinearity at –80 dB, thus, bringing up the nonlinear contrast to the predicted value of 40 dB.
5.5 False Target Nonlinear Response
Aside from the high detection contrast, nonlinear detection offers very low sensitivity to clutters: rocks, tree roots, solid metal pieces, such as shrapnel, etc. This is because the clutter is much less dynamically compliant than mines. Compliance of mines and their resonance nature lead to the separation and other nonlinear effects (hysteresis, slow dynamics) at the soil-mine interface.
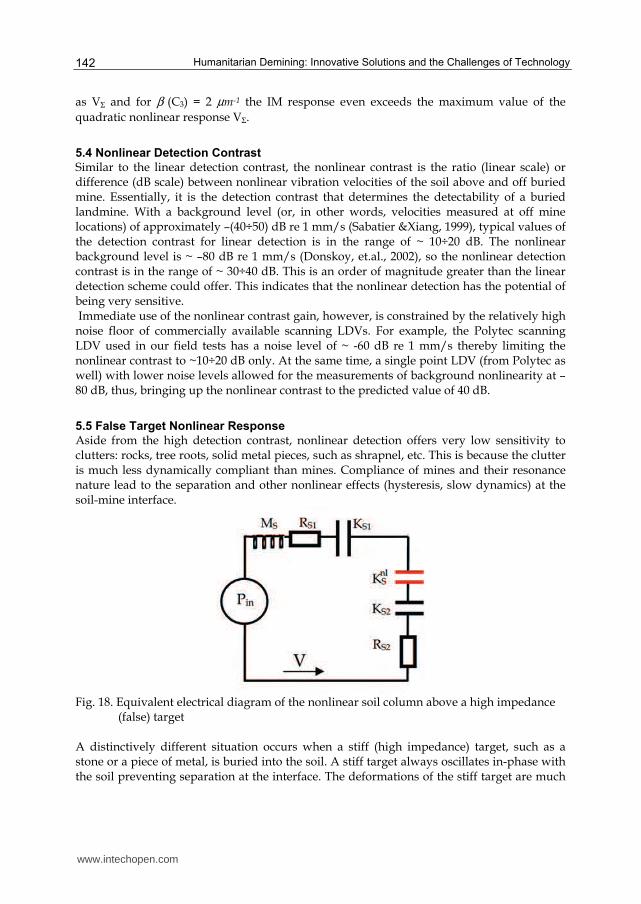
Fig. 18. Equivalent electrical diagram of the nonlinear soil column above a high impedance
(false) target A distinctively different situation occurs when a stiff (high impedance) target, such as a stone or a piece of metal, is buried into the soil. A stiff target always oscillates in-phase with the soil preventing separation at the interface. The deformations of the stiff target are much
www.intechopen.com
Resonance and Nonlinear Seismo-Acoustic Land Mine Detection
143
smaller than those of compliant mine, so any other nonlinear phenomena at the soil-stiff target interface are also much smaller. Therefore, in case of a high impedance (false) target, the nonlinear response is due to inherent nonlinearity of a soil column above the target. In order to estimate this nonlinear response, the equivalent electrical diagram of the soil-mine system should be modified by eliminating the elements that are responsible for mine
parameters and by including a soil nonlinear spring nl
SK , Fig.18. Using this diagram, it is not
difficult to show that linear and quadratic nonlinear responses are governed by the following relationships:
V1,2 = P01, 02/zS(ω1,2) , (16)
VΣ = 2αS KS V1 V2/[ω1 ω2 zS(ωΣ)] , (17)
where zS = zS1 + zS2 is a complex soil impedance, KS = KS1 + KS2 is a total soil stiffness and αS corresponds to the quadratic nonlinear parameter of the soil. Here we consider only quadratic nonlinearity. In order to be noticeable, the IM response requires strong resonance amplification, which is not apparent in this system. To be consistent with the field test and previous estimates for an AT mine, we consider
gravel soil with the same dynamic parameters as used in § 5.3 : KS1=2.4⋅107 Pa/m,
RS1=3.9⋅103 kg/(m2s), MS=40 kg/m2, KS2=108 Pa/m, RS2=4⋅103 kg/(m2s). We will use the
value of the nonlinear parameter αS = 0.03 µm-1 as estimated for gravel soil (Donskoy, et.al.,2004). We also assume that soil vibration velocities, V1 and V2, above buried false target
are the same as on top of buried AT mine VS-1.6 (§ 5.3) , i.e. V1 = V2 = 5.7⋅10-5m/s at the frequency 150 Hz. This means that the mine and the false target exhibit the same linear
detection contrast. Substituting the above values into Eq.(17) we get VΣ(false target) = -71 dB re 1mm/s which is 17 dB below vibration level for the mine VS-1.6 as estimated in § 5.3. That is, even if the mine and the false target are unrecognizable using linear detection generating false alarm, the nonlinear detection offers 17 dB difference effectively eliminating the false alarm. In reality, the nonlinear response from a false target will be even less than this estimate because for the same incident pressure P0, vibration velocities above stiff targets will be less than above mines. This brings the response from the false target well below the nonlinear background level of app. -75 ÷ - 80 dB re 1mm/s (Donskoy, et.al., 2004) which is conducive with the field measurements. In our field tests, various false targets, such as shown in Fig. 19, buried at different depths in gravel soil were not recognizable from the background effectively providing zero false alarms.
www.intechopen.com
Humanitarian Demining: Innovative Solutions and the Challenges of Technology
144
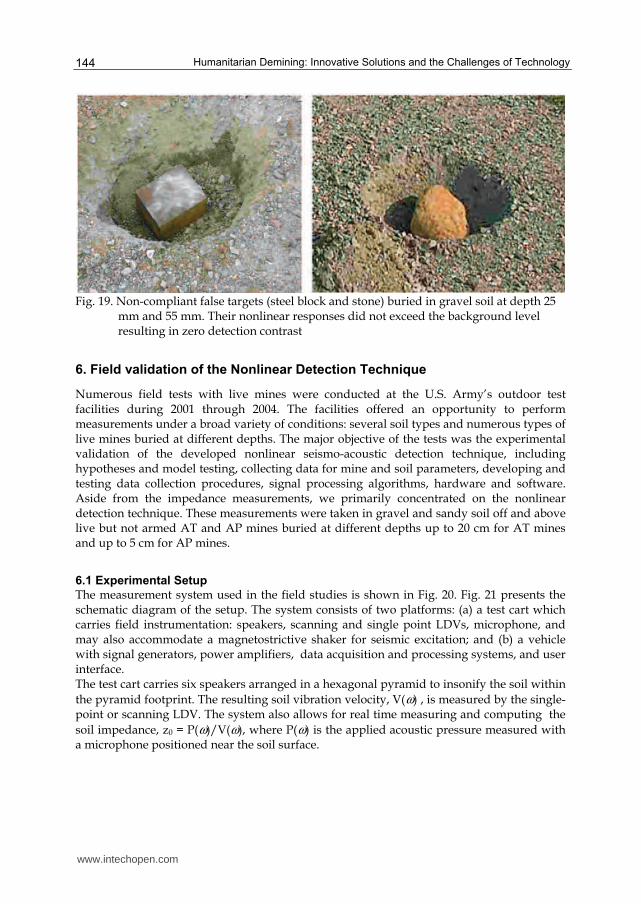
Fig. 19. Non-compliant false targets (steel block and stone) buried in gravel soil at depth 25
mm and 55 mm. Their nonlinear responses did not exceed the background level resulting in zero detection contrast
6. Field validation of the Nonlinear Detection Technique
Numerous field tests with live mines were conducted at the U.S. Army’s outdoor test facilities during 2001 through 2004. The facilities offered an opportunity to perform measurements under a broad variety of conditions: several soil types and numerous types of live mines buried at different depths. The major objective of the tests was the experimental validation of the developed nonlinear seismo-acoustic detection technique, including hypotheses and model testing, collecting data for mine and soil parameters, developing and testing data collection procedures, signal processing algorithms, hardware and software. Aside from the impedance measurements, we primarily concentrated on the nonlinear detection technique. These measurements were taken in gravel and sandy soil off and above live but not armed AT and AP mines buried at different depths up to 20 cm for AT mines and up to 5 cm for AP mines.
6.1 Experimental Setup
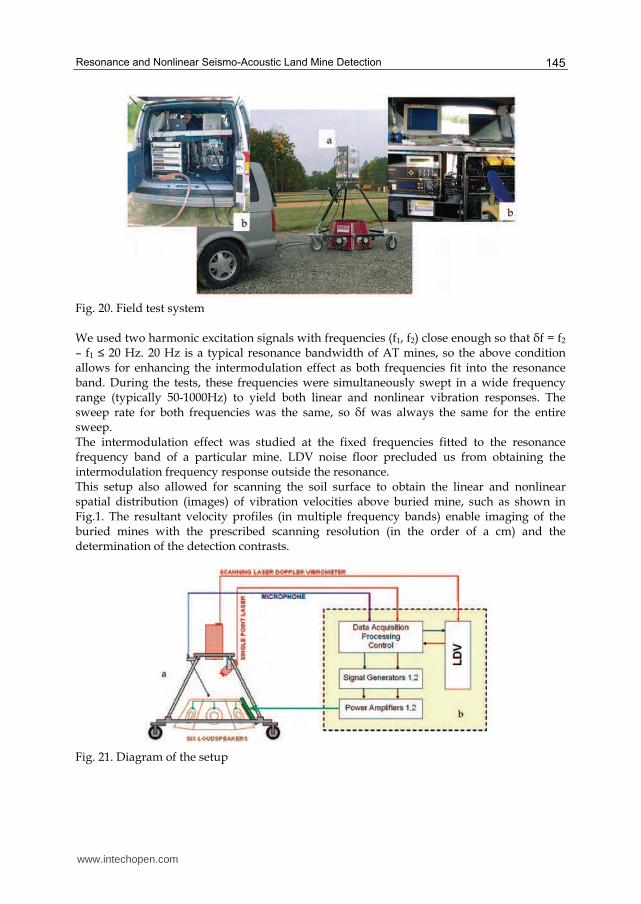
The measurement system used in the field studies is shown in Fig. 20. Fig. 21 presents the schematic diagram of the setup. The system consists of two platforms: (a) a test cart which carries field instrumentation: speakers, scanning and single point LDVs, microphone, and may also accommodate a magnetostrictive shaker for seismic excitation; and (b) a vehicle with signal generators, power amplifiers, data acquisition and processing systems, and user interface. The test cart carries six speakers arranged in a hexagonal pyramid to insonify the soil within
the pyramid footprint. The resulting soil vibration velocity, V(ω) , is measured by the single-point or scanning LDV. The system also allows for real time measuring and computing the
soil impedance, z0 = P(ω)/V(ω), where P(ω) is the applied acoustic pressure measured with a microphone positioned near the soil surface.
www.intechopen.com
Resonance and Nonlinear Seismo-Acoustic Land Mine Detection
145
Fig. 20. Field test system We used two harmonic excitation signals with frequencies (f1, f2) close enough so that δf = f2 – f1 ≤ 20 Hz. 20 Hz is a typical resonance bandwidth of AT mines, so the above condition allows for enhancing the intermodulation effect as both frequencies fit into the resonance band. During the tests, these frequencies were simultaneously swept in a wide frequency range (typically 50-1000Hz) to yield both linear and nonlinear vibration responses. The sweep rate for both frequencies was the same, so δf was always the same for the entire sweep. The intermodulation effect was studied at the fixed frequencies fitted to the resonance frequency band of a particular mine. LDV noise floor precluded us from obtaining the intermodulation frequency response outside the resonance. This setup also allowed for scanning the soil surface to obtain the linear and nonlinear spatial distribution (images) of vibration velocities above buried mine, such as shown in Fig.1. The resultant velocity profiles (in multiple frequency bands) enable imaging of the buried mines with the prescribed scanning resolution (in the order of a cm) and the determination of the detection contrasts.
Fig. 21. Diagram of the setup
www.intechopen.com
Humanitarian Demining: Innovative Solutions and the Challenges of Technology
146
6.2. Linear and Nonlinear Correlation Imaging
Step-frequency sweeping (initially used in earlier experiments) at every grid point during the soil surface scan requires significant time. For example, each frequency step may last 100ms to achieve 10Hz resolution; therefore sweeping through 500Hz band with 10 Hz resolution requires N = 50 steps with the total time of 5 sec. Scanning 1 sq.m. of area with 4 cm resolution yields 625 point, so the total scan time will be 625x5sec = 3125sec, or 52 min which is unacceptably long. In order to speedup the scanning time we developed a very efficient and fast correlation imaging algorithm which provides N time faster, simultaneously linear and nonlinear, imaging in a wide frequency band, yet preserving a spectral content, so the images could be reconstructed in multiple frequency sub-bands. The developed approach uses two chirp (linearly continuously swept) signals, P1(t) and P2(t) with start (initial) frequencies f1 and f2 and the same sweep rate, so at every moment of time there is δf = f2 – f1 frequency shift between these two signals:
P1,2(t) = P01,02 cos[2πf1,2 (1 + ΔF t/f1,2T) t] , (18)
where ΔF is the total frequency band of the sweep, and T is the duration of the sweep. LDV receives linear and nonlinear vibration signals:
V1,2(t) = V01,02 cos[2πf1,2 (1 + ΔF t/f1,2T) t] , (19)
VΣ(t) = V0Σ cos[2π(f1 +f2 ) t + 2ΔF t2/T)] . (20) Next we compute convolution for both linear and nonlinear signals using linear and nonlinear convolution bases, respectively:
u1,2(t) = cos[2πf1,2 (1 + ΔF t/f1,2T) t] and gΣ(t) = u1(t) x u2(t) . (21) For every scan grid point we output the maximum value of the computed convolutions for the linear and nonlinear responses:
⎥⎦⎤⎢⎣
⎡+= ∫2t
1t
111 d)(V)t(umaxK τττ , ⎥⎦⎤⎢⎣
⎡+= ∫ ΣΣΣ
2t
1t
d)(V)t(gmaxK τττ . (22)
Here the time interval [t1, t2] determines the corresponding frequency band in which the
convolution is calculated. Thus, the full frequency band ΔF is defined by the interval [0, T].
Using different time intervals, K1 and KΣ could be calculated for multiple sub-band to find the one with the maximum detection contrast. Fig. 22 illustrates the frequency sub-band division and resulting images. As expected, the best contrast (best image) is obtained for the sub-band which coincides with the soil-mine resonance. In the field, the precise resonance frequency of the soil-mine system is not known because it depends on the depth and soil parameters, therefore the sub-division procedure is essential for reliable and sensitive detection.
www.intechopen.com
Resonance and Nonlinear Seismo-Acoustic Land Mine Detection
147
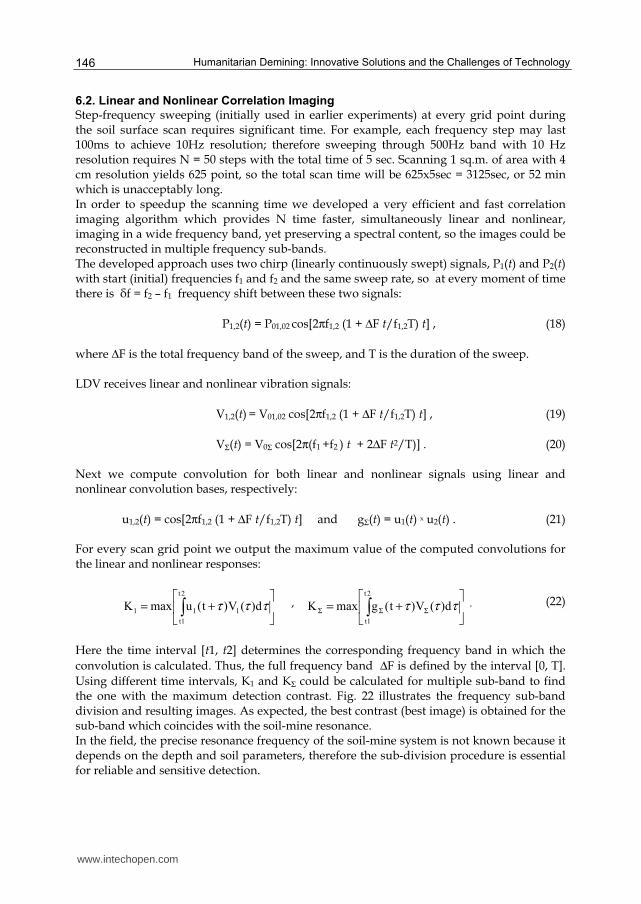
Fig. 22. Illustration of the frequency sub-band division and the resulting correlation images
of AP mine VS-50 buried at 25 mm depth. Here ΔF is the total frequency band occupied by the chirp signal and Δf is the sub-band. Red resonance line illustrates the soil-mine resonance response
The linear and nonlinear detection contrasts for the correlation imaging is defined similarly to the vibration velocity detection contrast; i.e. the linear detection contrast LDC = K1(on
mine)/ K1(off mine) and the nonlinear detection contrast NDC = KΣ(on mine)/ KΣ(off mine). The developed correlation imaging algorithm includes an optimization analysis to obtain the best detection contrast choosing the optimum duration and bandwidth of the chirp signals.
6.3. Examples of the Nonlinear Detection of Buried AT and AP Mines
Some of the field test results have already been presented throughout this chapter as an illustration of the developed detection technique, model, and algorithms. Many more examples of linear and nonlinear detection are described in numerous publications referred in this chapter. Fig.23 and Fig.24 show two more examples illustrating nonlinear detection of live mines obtained with the correlation imaging algorithm.
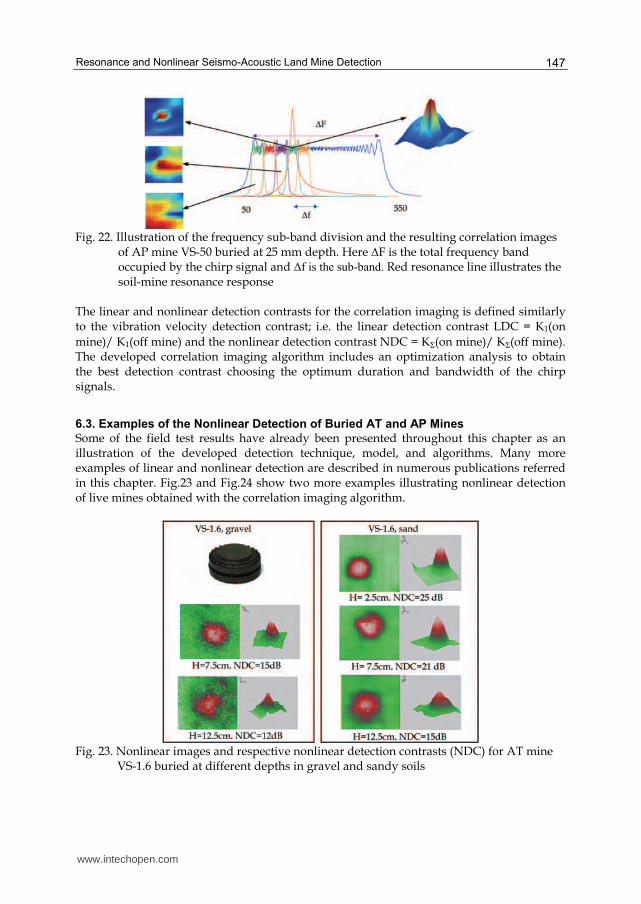
Fig. 23. Nonlinear images and respective nonlinear detection contrasts (NDC) for AT mine
VS-1.6 buried at different depths in gravel and sandy soils
www.intechopen.com
Humanitarian Demining: Innovative Solutions and the Challenges of Technology
148
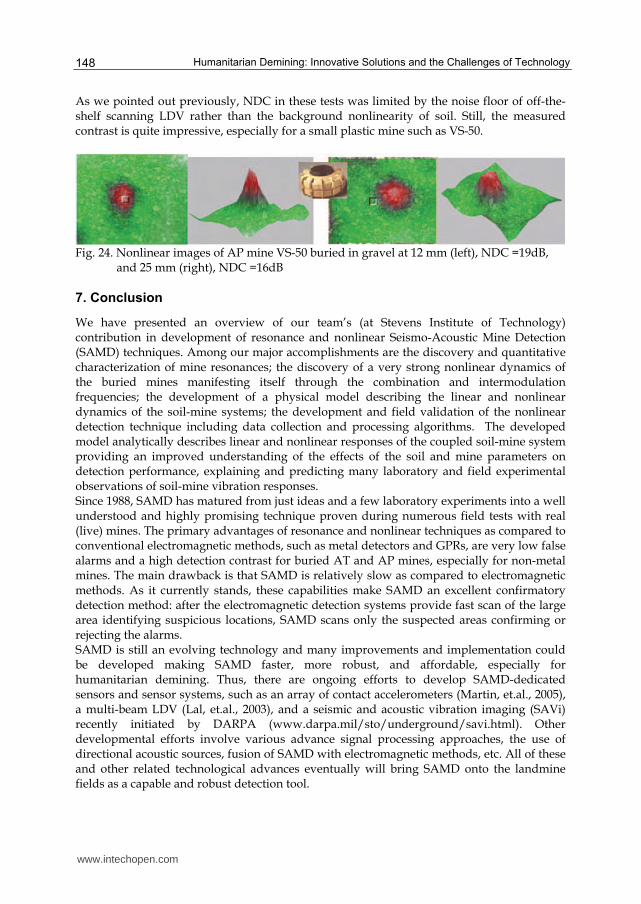
As we pointed out previously, NDC in these tests was limited by the noise floor of off-the-shelf scanning LDV rather than the background nonlinearity of soil. Still, the measured contrast is quite impressive, especially for a small plastic mine such as VS-50.
Fig. 24. Nonlinear images of AP mine VS-50 buried in gravel at 12 mm (left), NDC =19dB,
and 25 mm (right), NDC =16dB
7. Conclusion
We have presented an overview of our team’s (at Stevens Institute of Technology) contribution in development of resonance and nonlinear Seismo-Acoustic Mine Detection (SAMD) techniques. Among our major accomplishments are the discovery and quantitative characterization of mine resonances; the discovery of a very strong nonlinear dynamics of the buried mines manifesting itself through the combination and intermodulation frequencies; the development of a physical model describing the linear and nonlinear dynamics of the soil-mine systems; the development and field validation of the nonlinear detection technique including data collection and processing algorithms. The developed model analytically describes linear and nonlinear responses of the coupled soil-mine system providing an improved understanding of the effects of the soil and mine parameters on detection performance, explaining and predicting many laboratory and field experimental observations of soil-mine vibration responses. Since 1988, SAMD has matured from just ideas and a few laboratory experiments into a well understood and highly promising technique proven during numerous field tests with real (live) mines. The primary advantages of resonance and nonlinear techniques as compared to conventional electromagnetic methods, such as metal detectors and GPRs, are very low false alarms and a high detection contrast for buried AT and AP mines, especially for non-metal mines. The main drawback is that SAMD is relatively slow as compared to electromagnetic methods. As it currently stands, these capabilities make SAMD an excellent confirmatory detection method: after the electromagnetic detection systems provide fast scan of the large area identifying suspicious locations, SAMD scans only the suspected areas confirming or rejecting the alarms. SAMD is still an evolving technology and many improvements and implementation could be developed making SAMD faster, more robust, and affordable, especially for humanitarian demining. Thus, there are ongoing efforts to develop SAMD-dedicated sensors and sensor systems, such as an array of contact accelerometers (Martin, et.al., 2005), a multi-beam LDV (Lal, et.al., 2003), and a seismic and acoustic vibration imaging (SAVi) recently initiated by DARPA (www.darpa.mil/sto/underground/savi.html). Other developmental efforts involve various advance signal processing approaches, the use of directional acoustic sources, fusion of SAMD with electromagnetic methods, etc. All of these and other related technological advances eventually will bring SAMD onto the landmine fields as a capable and robust detection tool.
www.intechopen.com
Resonance and Nonlinear Seismo-Acoustic Land Mine Detection
149
8. Acknowledgements
The work presented here is the result of the collaborative efforts of out team at SIT including (in alphabetic order): D.Donskoy, A.Ekimov, A.Reznik, N.Sedunov, M.Tsionskiy, and A.Zagrai. The U.S. Army NVESD and ARO and the U.S. Navy ONR supported this work. We especially appreciate help and insights provided by Drs. T. Witten, B.Libbey, and D.Fenneman of NVESD and Dr. C. Anderson of ONR.
9. References
Caulfield, D.D. (1989). Acoustic detection apparatus, US Patent No. 4922467 Don, C.G. and Rogers, A. J. (1994) Using acoustic impulses to identify a buried non-metallic
objects, Journal of Acoustical Society of America, Vol.95, No. 5, pp. 2837-2838, ISSN:0001-4966.
Donskoy, D.M. (1998). Nonlinear vibro-acoustic technique for land mine detection, Proceedings of SPIE „Detection and Remediation Technologies for Mines and Minelike Targets III“, A.C.Dubey, J.F.Harvey, and J.T.Broach, (Eds), Vol.3392, pp.211-217, ISBN: 9780819428417. April 1998, Orlando, USA, Published by SPIE.
Donskoy, D.M. (1998). Nonlinear sesmo-acoustic technique for land mine detection and discrimination, Proceedings of IEE Conference „Detection of Abandoned Land Mines“, Publication No.458 pp.244-248, ISBN: 085296711-X. October, 1998, Edinburgh, UK. Published by IEEE.
Donskoy, D.M. (1999). Detection and discrimination of nonmetallic mines, Proceedings of SPIE „Detection and Remediation Technologies for Mines and Minelike Targets IV“, A.C.Dubey, J.F.Harvey, J.T.Broach, and, R.E.Dugan (Eds), Vol.3710, pp. 239-246, ISBN: 9780819431844. April 1999, Orlando, USA, Published by SPIE.
Donskoy, D.M., Sedunov, N., Ekimov, A., & Tsionskiy, M. (2001). Optimization of seismo-acoustic land mine detection using dynamic impedances of mines and soil, Proceedings of SPIE „Detection and Remediation Technologies for Mines and Minelike Targets VI“, A.C.Dubey, J.F.Harvey, J.T.Broach and V.George (Eds), Vol.4394, pp.575-582, ISBN: 9780819440891. April 2001, Orlando, USA, Published by SPIE.
Donskoy, D.M., Ekimov, A., Sedunov, N., & Tsionskiy, M. (2002), Nonlinear seismo-acoustic land mine detection and discrimination. Journal of Acoustical Society of America,Vol.111, No.6, pp.2705-2714, ISSN:0001-4966.
Donskoy D.M. Zagrai, A.N., Reznik, A., & Ekimov A. (2005). Nonlinear vibrations of buried landmines. Journal of Acoustical Society of America, Vol..117, No.2, pp.690-700, ISSN:0001-4966.
Fenneman, D. , Slick, C. , & D. Velea, (2003). Comparison of Measured vs. Predicted Buried Mine Resonant Behavior. Proceedings of SPIE „Detection and Remediation Technologies for Mines and Minelike Targets VIII“, R.S. Hurmon, G.H.Holloway, & J.T.Broach, (Eds), Vol. 5089, pp. 495-504, ISBN: 9780819453389. April 2003, Orlando, USA, Published by SPIE.
Horoshenkov, K.V. & Mohamed, M.H.A., (2006). Experimental investigation of the effects of water saturation on the acoustic admittance of sandy soils. Journal of Acoustical Society of America, Vol.120, No.4, pp.1910-1921, ISSN:0001-4966.
House, L.J. & Pape, D.B. (1994). Method and apparatus for acoustic energy identification of objects buried in soil, US Patent No. 5357063
www.intechopen.com
Humanitarian Demining: Innovative Solutions and the Challenges of Technology
150
Korman, M. S. & Sabatier, J. M. (2004). Nonlinear acoustic techniques for landmine detection, Journal of Acoustical Society of America, Vol.116, No.6, pp.3354-3369, ISSN:0001-4966.
Lal, A.K., Zhang, H., Aranchuk, V., Hurtado, E., & Hess, C.F., (2003). Multiple-Beam LDV system for buried landmines. Proceedings of SPIE „Detection and Remediation Technologies for Mines and Minelike Targets VIII“, R.S. Hurmon, G.H.Holloway, & J.T.Broach, (Eds), Vol. 5089, pp. 579-590, ISBN: 9780819453389. April 2003, Orlando, USA, Published by SPIE.
Martin, J.S., Larson, G.D., & Scott, W.R., (2005). Non-intrusive ground-contacting vibrometer for aoustic/seismic landmine detection. Journal of Acoustical Society of America, Vol.117, No.4, pp.2456, ISSN:0001-4966.
Mitchell, J.K. (1993). Fundamentals of Soil Behavior, p.170, John Willey&Sons, Inc. New York, ISBN: 0471856401.
Sabatier, J.M.& Xiang, N., (1999). Laser-doppler based acoustic-to-seismic detection of buried mines, Proceedings of SPIE „Detection and Remediation Technologies for Mines and Minelike Targets IV“, A.C.Dubey, J.F.Harvey, J.T.Broach, and, R.E.Dugan (Eds),, Vol.3710, pp.215-222, ISBN: 9780819431844. April 1999, Orlando, USA, Published by SPIE.
Sabatier, J. M. & Gilbert, K. E. (2000). Method for detecting buried objects by measuring seismic vibrations induced by acoustical coupling with a remote source of sound. U.S.Patent 6081481.
Sabatier, J. M., Korman, M. S., & Xiang, N., (2002). Linear and non-linear acoustic velocity profiles over buried landmines. ’’ Proceedings of SPIE „Detection and Remediation Technologies for Mines and Minelike Targets VII , J.T.Broach, R.S.Harmon, and G.J.Dobeck, (Eds), Vol. 4742, pp. 695-700, ISBN: 9780819444929, April 2002, Orlando, USA, Published by SPIE.
Schroeder, C.T. & Scott, W.R. Jr. (2001). Resonance behavior of buried landmines. Proceedings of SPIE „Detection and Remediation Technologies for Mines and Minelike Targets VI“, A.C.Dubey, J.F.Harvey, J.T.Broach and V.George (Eds), Vol.4394, pp.553-562, ISBN: 9780819440891. April 2001, Orlando, USA, Published by SPIE.
Scott, W.R.,Jr., Schroeder, C., & Martin, J.S. (1998). Acousto-electromagnetic sensor for locating land mines, Proceedings of SPIE „Detection and Remediation Technologies for Mines and Minelike Targets III“, A.C.Dubey, J.F.Harvey, and J.T.Broach, (Eds), Vol. 3392, pp. 176-186, ISBN: 9780819428417. April 1998, Orlando, USA, Published by SPIE.
Skudrzyk, E., (1968). Simple and Complex Vibratory Systems, pp.280-290, University Press, University Park & London, ISBN: 0271731273.
Zagrai, A.N., Donskoy, D.M., & Ekimov, A. (2004). Resonance Vibrations of Buried Landmines, Proceedings of SPIE „Detection and Remediation Technologies for Mines and Minelike Targets IX“, R.S.Harmon, J.T.Broach, and J.H.Holloway (Eds), Vol.5415, pp.21-29, ISBN: 9780819453389, April 2004, Orlando, USA, Published by SPIE.
Zagrai, A.N., Donskoy, D.M., & Ekimov, A. (2005). Structural vibrations of buried land mines, Journal of Acoustical Society of America, Vol.118, No.6, pp. 3619-3628, ISSN:0001-4966.
www.intechopen.com
Humanitarian DeminingEdited by Maki K. Habib
ISBN 978-3-902613-11-0Hard cover, 392 pagesPublisher I-Tech Education and PublishingPublished online 01, February, 2008Published in print edition February, 2008
InTech EuropeUniversity Campus STeP Ri Slavka Krautzeka 83/A 51000 Rijeka, Croatia Phone: +385 (51) 770 447 Fax: +385 (51) 686 166
InTech ChinaUnit 405, Office Block, Hotel Equatorial Shanghai No.65, Yan An Road (West), Shanghai, 200040, China
Phone: +86-21-62489820 Fax: +86-21-62489821
United Nation Department of Human Affairs (UNDHA) assesses that there are more than 100 million minesthat are scattered across the world and pose significant hazards in more than 68 countries. The internationalCommittee of the Red Cross (ICRC) estimates that the casualty rate from landmines currently exceeds 26,000persons every year. It is estimated that more than 800 persons are killed and 1,200 maimed each month bylandmines around the world. Humanitarian demining demands that all the landmines (especially AP mines)and ERW affecting the places where ordinary people live must be cleared, and their safety in areas that havebeen cleared must be guaranteed. Innovative solutions and technologies are required and hence this book iscoming out to address and deal with the problems, difficulties, priorities, development of sensing and deminingtechnologies and the technological and research challenges. This book reports on the state of the art researchand development findings and results. The content of the book has been structured into three technicalresearch sections with total of 16 chapters written by well recognized researchers in the field worldwide. Themain topics of these three technical research sections are: Humanitarian Demining: the Technology and theResearch Challenges (Chapters 1 and 2), Sensors and Detection Techniques for Humanitarian Demining(Chapters 3 to 8), and Robotics and Flexible Mechanisms for Humanitarian Demining respectively (Chapters 9to 16).
How to referenceIn order to correctly reference this scholarly work, feel free to copy and paste the following:
Dimitri M. Donskoy (2008). Resonance and Nonlinear Seismo-Acoustic Land Mine Detection, HumanitarianDemining, Maki K. Habib (Ed.), ISBN: 978-3-902613-11-0, InTech, Available from:http://www.intechopen.com/books/humanitarian_demining/resonance_and_nonlinear_seismo-acoustic_land_mine_detection
www.intechopen.com

www.intechopen.com
![How can acoustic resonance reduce the average velocity in ... · and speed of sound in air [7,8]. We propose enhancing the classical acoustic resonance experiment with the following](https://img.pdfslide.net/doc/110x75/5e4508cc5e1601420e742095/how-can-acoustic-resonance-reduce-the-average-velocity-in-and-speed-of-sound.jpg)