Embed Size (px)
Citation preview
Japan Advanced Institute of Science and Technology
JAIST Repositoryhttps://dspace.jaist.ac.jp/
Title
Resonance frequency-retuned quartz tuning fork as
a force sensor for noncontact atomic force
microscopy
Author(s)Ooe, Hiroaki; Sakuishi, Tatsuya; Nogami, Makoto;
Tomitori, Masahiko; Arai, Toyoko
CitationApplied Physics Letters, 105(4): 043107-1-043107-
4
Issue Date 2014-07-30
Type Journal Article
Text version publisher
URL http://hdl.handle.net/10119/12895
Rights
(c) 2014 Author(s). All article content, except
where otherwise noted, is licensed under a
Creative Commons Attribution 3.0 Unported
License. The following article appeared in
Hiroaki Ooe, Tatsuya Sakuishi, Makoto Nogami,
Masahiko Tomitori and Toyoko Arai, Applied
Physics Letters, 105(4), 043107 (2014) and may be
found at http://dx.doi.org/10.1063/1.4891882
Description
Resonance frequency-retuned quartz tuning fork as a force sensor for noncontactatomic force microscopyHiroaki Ooe, Tatsuya Sakuishi, Makoto Nogami, Masahiko Tomitori, and Toyoko Arai Citation: Applied Physics Letters 105, 043107 (2014); doi: 10.1063/1.4891882 View online: http://dx.doi.org/10.1063/1.4891882 View Table of Contents: http://scitation.aip.org/content/aip/journal/apl/105/4?ver=pdfcov Published by the AIP Publishing Articles you may be interested in Implementation and characterization of a quartz tuning fork based probe consisted of discrete resonators fordynamic mode atomic force microscopy Rev. Sci. Instrum. 81, 063706 (2010); 10.1063/1.3455219 Active Q control in tuning-fork-based atomic force microscopy Appl. Phys. Lett. 91, 023103 (2007); 10.1063/1.2753112 Atomic resolution on MgO(001) by atomic force microscopy using a double quartz tuning fork sensor at low-temperature and ultrahigh vacuum Appl. Phys. Lett. 87, 083104 (2005); 10.1063/1.2012523 Double quartz tuning fork sensor for low temperature atomic force and scanning tunneling microscopy Rev. Sci. Instrum. 75, 2446 (2004); 10.1063/1.1765753 Atomic resolution on Si (111)-(7×7) by noncontact atomic force microscopy with a force sensor based on aquartz tuning fork Appl. Phys. Lett. 76, 1470 (2000); 10.1063/1.126067
This article is copyrighted as indicated in the article. Reuse of AIP content is subject to the terms at: http://scitation.aip.org/termsconditions. Downloaded to IP: 150.65.7.11
On: Fri, 11 Sep 2015 01:31:44
Resonance frequency-retuned quartz tuning fork as a force sensorfor noncontact atomic force microscopy
Hiroaki Ooe,1 Tatsuya Sakuishi,1 Makoto Nogami,2 Masahiko Tomitori,2 and Toyoko Arai1,a)
1Natural Science and Technology, Kanazawa University, Kanazawa, Ishikawa 920-1192, Japan2Japan Advanced Institute of Science and Technology, Nomi, Ishikawa 923-1292, Japan
(Received 16 June 2014; accepted 21 July 2014; published online 30 July 2014)
Based on a two-prong type quartz tuning fork, a force sensor with a high Q factor, which we call a
retuned fork sensor, was developed for non-contact atomic force microscopy (nc-AFM) with
atomic resolution. By cutting a small notch and attaching an AFM tip to one prong, its resonance
frequency can be retuned to that of the other intact prong. In balancing the two prongs in this
manner, a high Q factor (>50 000 in ultrahigh vacuum) is obtained for the sensor. An atomic
resolution image of the Si(111)-7� 7 surface was demonstrated using an nc-AFM with the sensor.
The dependence of the Q factor on resonance frequency of the sensor and the long-range force
between tip and sample were measured and analyzed in view of the various dissipation channels.
Dissipation in the signal detection circuit turned out to be mainly limited by the total Q factor of
the nc-AFM system. VC 2014 Author(s). All article content, except where otherwise noted, islicensed under a Creative Commons Attribution 3.0 Unported License.
[http://dx.doi.org/10.1063/1.4891882]
Non-contact atomic force microscopy (nc-AFM)1 is a
powerful technique to observe sample surfaces on an atomic
scale through the detection of the forces between sample and
tip on an oscillating cantilever.2,3 To describe the atom-scale
short-range forces between them, the oscillation amplitude
should be as small as possible at close separations between
tip and sample because the forces range only over nanometer
separations.4 To operate stably, a high spring constant is
required for the cantilever (force sensor) to avoid jump-to-
contact behavior.5
Cantilevers with high spring constants have been fabri-
cated using single-crystal quartz with a high Young modulus.
These are easily purchased commercially as high-quality
oscillators. The high-force sensitivity and long-term stability
of the nc-AFM imaging have been obtained using the force
sensor of a quartz oscillator with a high Q factor and a low
thermal drift in its resonance frequency. The Q factor domi-
nates the minimum detection limit of the force differentia-
tion dF0min given by1
dF0min ¼ffiffiffiffiffiffiffiffiffiffiffiffiffiffiffiffiffiffiffiffiffiffiffiffiffiffiffiffiffiffiffiffi4kkBTB=pf0QA2
p; (1)
where k is the spring constant of the force sensor, kB is the
Boltzmann constant, T is the temperature in Kelvin, B is the
bandwidth of the detection system, f0 is the resonance fre-
quency of the force sensor, and A is the oscillation amplitude.
dF0min is proportional toffiffiffiffiffiffiffiffiffik=Q
pat constant T, B, f0, and A.
Consequently, a high Q factor for the oscillator is necessary
for high force sensitivity. A high Q factor means that the
energy dissipation from mechanical oscillations of the oscilla-
tor is less. This is defined as Q¼ 2p (oscillation energy stored
in the oscillator)/(dissipation energy per oscillation cycle).
Up to now, two types of force sensors, based on quartz
tuning forks as the oscillator with high Q factor, have been
frequently used in nc-AFM. The tuning fork comprises two
prongs joined at their ends; the resonance frequencies (fTF)
of the two prongs are precisely tuned to the same frequency
(typically, fTF¼ 32 768 Hz). One of the force sensors is a
two-prong type,6 and the other is a single-prong type, called
the qPlus sensor.7 The Q factor of the tuning fork in its reso-
nant state, the anti-phase oscillation mode of the two prongs,
is greater than that in the in-phase oscillation mode and that
for the one-prong sensor. This is because the anti-phase
mode cancels the distortional oscillation amplitude at the
join, leading to low energy dissipation at the join. However,
when an AFM tip is attached to one prong, the oscillations of
two prongs become unbalanced through the detuning of the
resonance frequencies of the prongs, resulting in a lower Qfactor.6 To overcome this problem, Giessibl developed the
qPlus sensor by fixing one prong, so that it would not oscil-
late, and observed atom-resolved images of Si(111)–7� 7
using the oscillation of the other prong.8 In contrast, the
two-prong force sensors with a tip imaged only step struc-
tures of Si(111)6 and highly ordered pyrolytic graphite.9 To
date, the high Q factor of a tuning fork has not been well
exploited in nc-AFM.
For this study, we fabricated a two-prong force sensor
with a high Q factor, which we call a retuned fork sensor, by
retuning the resonance frequency of the prong with the AFM
tip to that of the other intact prong. The imbalance caused by
attaching the tip is cancelled by cutting a notch into the
prong. A resonance state with a high Q factor is thereby
restored. Atomic resolution images of Si(111)–7� 7 were
obtained with the sensor.
A quartz tuning fork oscillator (MS1V, Micro Crystal
AG, Grenchen, Switzerland) in a metal can was used for the
retuned fork sensor. The spring constant of the one prong
was calculated from its size to be 1800 N/m.8 fTF and Q in
the can measured 32 768 Hz and �60 000, respectively.
Fabrication of the sensor is depicted in Fig. 1. Aftera)Electronic mail: [email protected]
0003-6951/2014/105(4)/043107/4 VC Author(s) 2014105, 043107-1
APPLIED PHYSICS LETTERS 105, 043107 (2014)
This article is copyrighted as indicated in the article. Reuse of AIP content is subject to the terms at: http://scitation.aip.org/termsconditions. Downloaded to IP: 150.65.7.11
On: Fri, 11 Sep 2015 01:31:44
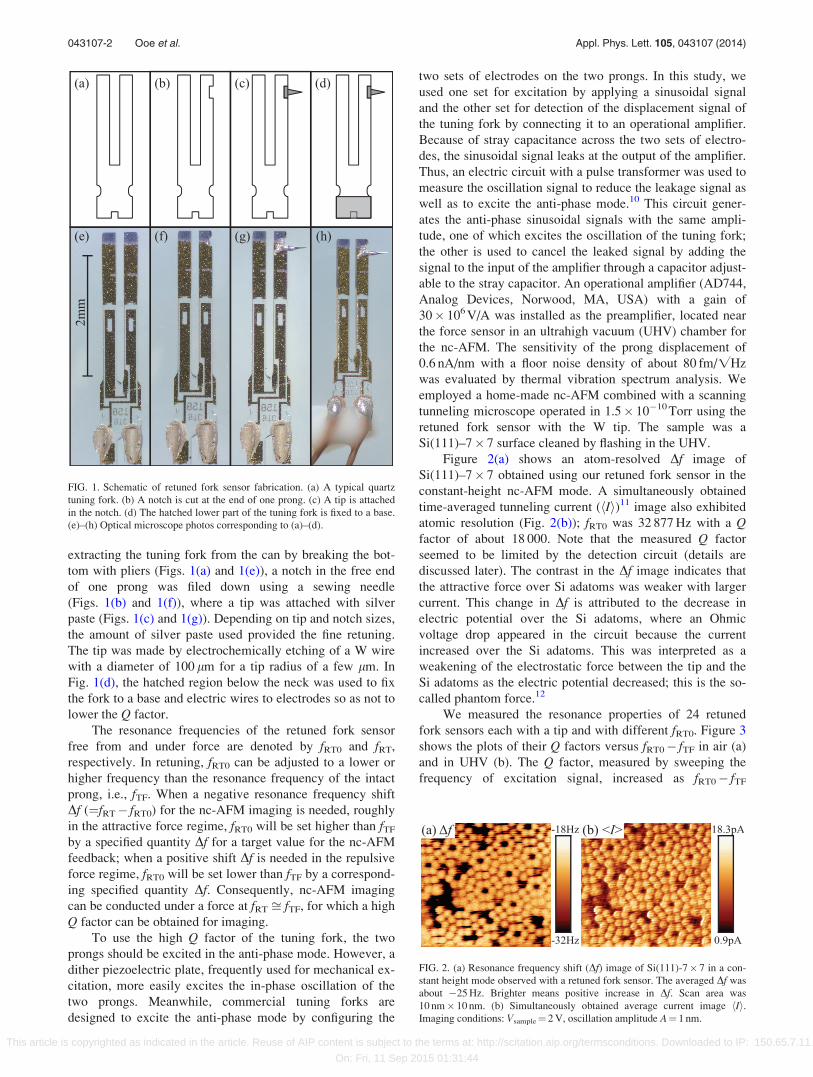
extracting the tuning fork from the can by breaking the bot-
tom with pliers (Figs. 1(a) and 1(e)), a notch in the free end
of one prong was filed down using a sewing needle
(Figs. 1(b) and 1(f)), where a tip was attached with silver
paste (Figs. 1(c) and 1(g)). Depending on tip and notch sizes,
the amount of silver paste used provided the fine retuning.
The tip was made by electrochemically etching of a W wire
with a diameter of 100 lm for a tip radius of a few lm. In
Fig. 1(d), the hatched region below the neck was used to fix
the fork to a base and electric wires to electrodes so as not to
lower the Q factor.
The resonance frequencies of the retuned fork sensor
free from and under force are denoted by fRT0 and fRT,
respectively. In retuning, fRT0 can be adjusted to a lower or
higher frequency than the resonance frequency of the intact
prong, i.e., fTF. When a negative resonance frequency shift
Df (¼fRT� fRT0) for the nc-AFM imaging is needed, roughly
in the attractive force regime, fRT0 will be set higher than fTF
by a specified quantity Df for a target value for the nc-AFM
feedback; when a positive shift Df is needed in the repulsive
force regime, fRT0 will be set lower than fTF by a correspond-
ing specified quantity Df. Consequently, nc-AFM imaging
can be conducted under a force at fRT ffi fTF, for which a high
Q factor can be obtained for imaging.
To use the high Q factor of the tuning fork, the two
prongs should be excited in the anti-phase mode. However, a
dither piezoelectric plate, frequently used for mechanical ex-
citation, more easily excites the in-phase oscillation of the
two prongs. Meanwhile, commercial tuning forks are
designed to excite the anti-phase mode by configuring the
two sets of electrodes on the two prongs. In this study, we
used one set for excitation by applying a sinusoidal signal
and the other set for detection of the displacement signal of
the tuning fork by connecting it to an operational amplifier.
Because of stray capacitance across the two sets of electro-
des, the sinusoidal signal leaks at the output of the amplifier.
Thus, an electric circuit with a pulse transformer was used to
measure the oscillation signal to reduce the leakage signal as
well as to excite the anti-phase mode.10 This circuit gener-
ates the anti-phase sinusoidal signals with the same ampli-
tude, one of which excites the oscillation of the tuning fork;
the other is used to cancel the leaked signal by adding the
signal to the input of the amplifier through a capacitor adjust-
able to the stray capacitor. An operational amplifier (AD744,
Analog Devices, Norwood, MA, USA) with a gain of
30� 106 V/A was installed as the preamplifier, located near
the force sensor in an ultrahigh vacuum (UHV) chamber for
the nc-AFM. The sensitivity of the prong displacement of
0.6 nA/nm with a floor noise density of about 80 fm/CHz
was evaluated by thermal vibration spectrum analysis. We
employed a home-made nc-AFM combined with a scanning
tunneling microscope operated in 1.5� 10�10 Torr using the
retuned fork sensor with the W tip. The sample was a
Si(111)–7� 7 surface cleaned by flashing in the UHV.
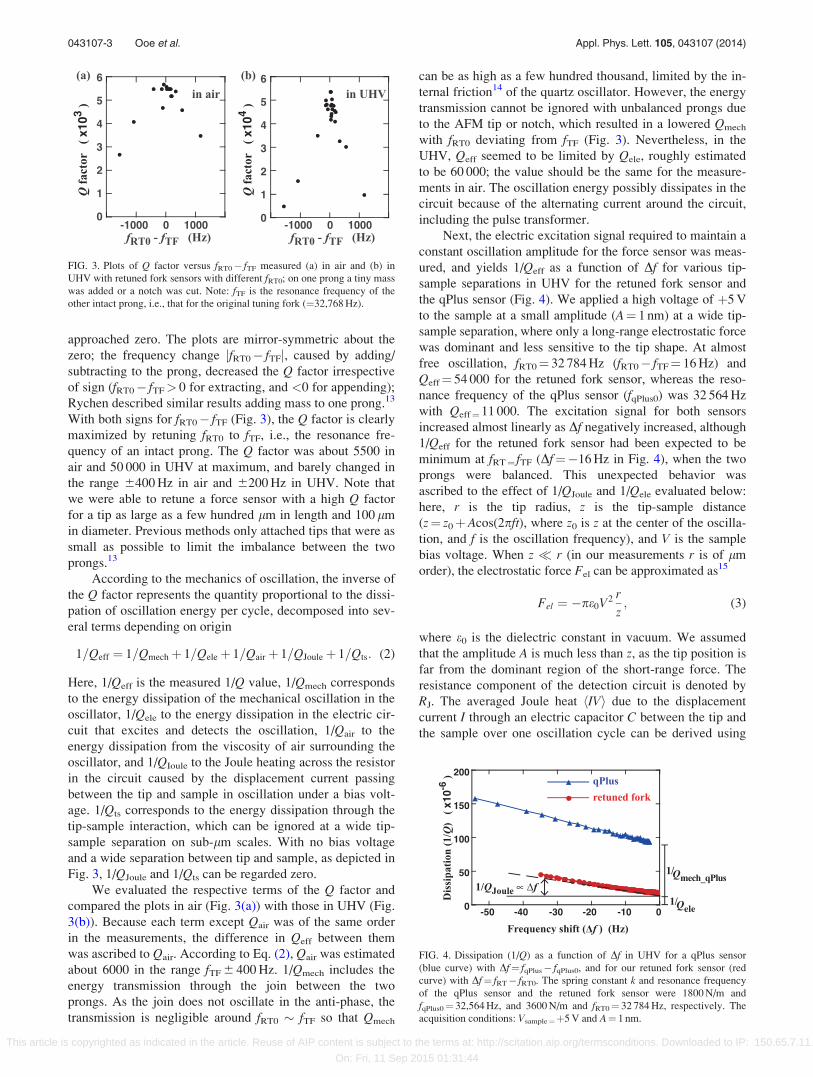
Figure 2(a) shows an atom-resolved Df image of
Si(111)–7� 7 obtained using our retuned fork sensor in the
constant-height nc-AFM mode. A simultaneously obtained
time-averaged tunneling current (hIi)11 image also exhibited
atomic resolution (Fig. 2(b)); fRT0 was 32 877 Hz with a Qfactor of about 18 000. Note that the measured Q factor
seemed to be limited by the detection circuit (details are
discussed later). The contrast in the Df image indicates that
the attractive force over Si adatoms was weaker with larger
current. This change in Df is attributed to the decrease in
electric potential over the Si adatoms, where an Ohmic
voltage drop appeared in the circuit because the current
increased over the Si adatoms. This was interpreted as a
weakening of the electrostatic force between the tip and the
Si adatoms as the electric potential decreased; this is the so-
called phantom force.12
We measured the resonance properties of 24 retuned
fork sensors each with a tip and with different fRT0. Figure 3
shows the plots of their Q factors versus fRT0� fTF in air (a)
and in UHV (b). The Q factor, measured by sweeping the
frequency of excitation signal, increased as fRT0� fTF
FIG. 1. Schematic of retuned fork sensor fabrication. (a) A typical quartz
tuning fork. (b) A notch is cut at the end of one prong. (c) A tip is attached
in the notch. (d) The hatched lower part of the tuning fork is fixed to a base.
(e)–(h) Optical microscope photos corresponding to (a)–(d).
FIG. 2. (a) Resonance frequency shift (Df) image of Si(111)-7� 7 in a con-
stant height mode observed with a retuned fork sensor. The averaged Df was
about �25 Hz. Brighter means positive increase in Df. Scan area was
10 nm� 10 nm. (b) Simultaneously obtained average current image hIi.Imaging conditions: Vsample¼ 2 V, oscillation amplitude A¼ 1 nm.
043107-2 Ooe et al. Appl. Phys. Lett. 105, 043107 (2014)
This article is copyrighted as indicated in the article. Reuse of AIP content is subject to the terms at: http://scitation.aip.org/termsconditions. Downloaded to IP: 150.65.7.11
On: Fri, 11 Sep 2015 01:31:44
approached zero. The plots are mirror-symmetric about the
zero; the frequency change jfRT0� fTFj, caused by adding/
subtracting to the prong, decreased the Q factor irrespective
of sign (fRT0� fTF> 0 for extracting, and <0 for appending);
Rychen described similar results adding mass to one prong.13
With both signs for fRT0� fTF (Fig. 3), the Q factor is clearly
maximized by retuning fRT0 to fTF, i.e., the resonance fre-
quency of an intact prong. The Q factor was about 5500 in
air and 50 000 in UHV at maximum, and barely changed in
the range 6400 Hz in air and 6200 Hz in UHV. Note that
we were able to retune a force sensor with a high Q factor
for a tip as large as a few hundred lm in length and 100 lm
in diameter. Previous methods only attached tips that were as
small as possible to limit the imbalance between the two
prongs.13
According to the mechanics of oscillation, the inverse of
the Q factor represents the quantity proportional to the dissi-
pation of oscillation energy per cycle, decomposed into sev-
eral terms depending on origin
1=Qeff ¼ 1=Qmechþ 1=Qeleþ 1=Qairþ 1=QJouleþ 1=Qts: (2)
Here, 1/Qeff is the measured 1/Q value, 1/Qmech corresponds
to the energy dissipation of the mechanical oscillation in the
oscillator, 1/Qele to the energy dissipation in the electric cir-
cuit that excites and detects the oscillation, 1/Qair to the
energy dissipation from the viscosity of air surrounding the
oscillator, and 1/QIoule to the Joule heating across the resistor
in the circuit caused by the displacement current passing
between the tip and sample in oscillation under a bias volt-
age. 1/Qts corresponds to the energy dissipation through the
tip-sample interaction, which can be ignored at a wide tip-
sample separation on sub-lm scales. With no bias voltage
and a wide separation between tip and sample, as depicted in
Fig. 3, 1/QJoule and 1/Qts can be regarded zero.
We evaluated the respective terms of the Q factor and
compared the plots in air (Fig. 3(a)) with those in UHV (Fig.
3(b)). Because each term except Qair was of the same order
in the measurements, the difference in Qeff between them
was ascribed to Qair. According to Eq. (2), Qair was estimated
about 6000 in the range fTF 6 400 Hz. 1/Qmech includes the
energy transmission through the join between the two
prongs. As the join does not oscillate in the anti-phase, the
transmission is negligible around fRT0 � fTF so that Qmech
can be as high as a few hundred thousand, limited by the in-
ternal friction14 of the quartz oscillator. However, the energy
transmission cannot be ignored with unbalanced prongs due
to the AFM tip or notch, which resulted in a lowered Qmech
with fRT0 deviating from fTF (Fig. 3). Nevertheless, in the
UHV, Qeff seemed to be limited by Qele, roughly estimated
to be 60 000; the value should be the same for the measure-
ments in air. The oscillation energy possibly dissipates in the
circuit because of the alternating current around the circuit,
including the pulse transformer.
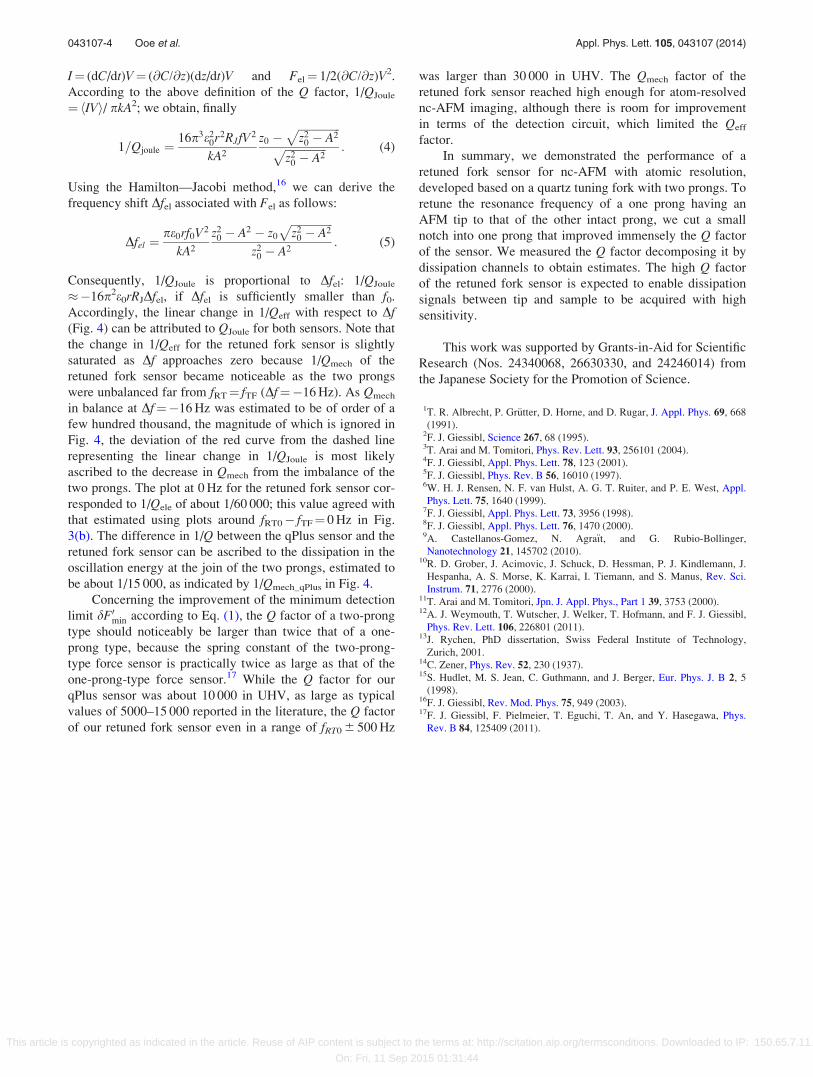
Next, the electric excitation signal required to maintain a
constant oscillation amplitude for the force sensor was meas-
ured, and yields 1/Qeff as a function of Df for various tip-
sample separations in UHV for the retuned fork sensor and
the qPlus sensor (Fig. 4). We applied a high voltage of þ5 V
to the sample at a small amplitude (A¼ 1 nm) at a wide tip-
sample separation, where only a long-range electrostatic force
was dominant and less sensitive to the tip shape. At almost
free oscillation, fRT0¼ 32 784 Hz (fRT0� fTF¼ 16 Hz) and
Qeff¼ 54 000 for the retuned fork sensor, whereas the reso-
nance frequency of the qPlus sensor (fqPlus0) was 32 564 Hz
with Qeff¼11 000. The excitation signal for both sensors
increased almost linearly as Df negatively increased, although
1/Qeff for the retuned fork sensor had been expected to be
minimum at fRT¼ fTF (Df¼�16 Hz in Fig. 4), when the two
prongs were balanced. This unexpected behavior was
ascribed to the effect of 1/QJoule and 1/Qele evaluated below:
here, r is the tip radius, z is the tip-sample distance
(z¼ z0þAcos(2pft), where z0 is z at the center of the oscilla-
tion, and f is the oscillation frequency), and V is the sample
bias voltage. When z � r (in our measurements r is of lm
order), the electrostatic force Fel can be approximated as15
Fel ¼ �pe0V2 r
z; (3)
where e0 is the dielectric constant in vacuum. We assumed
that the amplitude A is much less than z, as the tip position is
far from the dominant region of the short-range force. The
resistance component of the detection circuit is denoted by
RJ. The averaged Joule heat hIVi due to the displacement
current I through an electric capacitor C between the tip and
the sample over one oscillation cycle can be derived using
FIG. 3. Plots of Q factor versus fRT0� fTF measured (a) in air and (b) in
UHV with retuned fork sensors with different fRT0; on one prong a tiny mass
was added or a notch was cut. Note: fTF is the resonance frequency of the
other intact prong, i.e., that for the original tuning fork (¼32,768 Hz).
FIG. 4. Dissipation (1/Q) as a function of Df in UHV for a qPlus sensor
(blue curve) with Df¼ fqPlus� fqPlus0, and for our retuned fork sensor (red
curve) with Df¼ fRT� fRT0. The spring constant k and resonance frequency
of the qPlus sensor and the retuned fork sensor were 1800 N/m and
fqPlus0¼ 32,564 Hz, and 3600 N/m and fRT0¼ 32 784 Hz, respectively. The
acquisition conditions: Vsample¼þ5 V and A¼ 1 nm.
043107-3 Ooe et al. Appl. Phys. Lett. 105, 043107 (2014)
This article is copyrighted as indicated in the article. Reuse of AIP content is subject to the terms at: http://scitation.aip.org/termsconditions. Downloaded to IP: 150.65.7.11
On: Fri, 11 Sep 2015 01:31:44
I¼ (dC/dt)V¼ (@C/@z)(dz/dt)V and Fel¼ 1/2(@C/@z)V2.
According to the above definition of the Q factor, 1/QJoule
¼hIVi/ pkA2; we obtain, finally
1=Qjoule ¼16p3e2
0r2RJfV2
kA2
z0 �ffiffiffiffiffiffiffiffiffiffiffiffiffiffiffiz2
0 � A2p
ffiffiffiffiffiffiffiffiffiffiffiffiffiffiffiz2
0 � A2p : (4)
Using the Hamilton—Jacobi method,16 we can derive the
frequency shift Dfel associated with Fel as follows:
Dfel ¼pe0rf0V2
kA2
z20 � A2 � z0
ffiffiffiffiffiffiffiffiffiffiffiffiffiffiffiz2
0 � A2p
z20 � A2
: (5)
Consequently, 1/QJoule is proportional to Dfel: 1/QJoule
��16p2e0rRJDfel, if Dfel is sufficiently smaller than f0.
Accordingly, the linear change in 1/Qeff with respect to Df(Fig. 4) can be attributed to QJoule for both sensors. Note that
the change in 1/Qeff for the retuned fork sensor is slightly
saturated as Df approaches zero because 1/Qmech of the
retuned fork sensor became noticeable as the two prongs
were unbalanced far from fRT¼ fTF (Df¼�16 Hz). As Qmech
in balance at Df¼�16 Hz was estimated to be of order of a
few hundred thousand, the magnitude of which is ignored in
Fig. 4, the deviation of the red curve from the dashed line
representing the linear change in 1/QJoule is most likely
ascribed to the decrease in Qmech from the imbalance of the
two prongs. The plot at 0 Hz for the retuned fork sensor cor-
responded to 1/Qele of about 1/60 000; this value agreed with
that estimated using plots around fRT0� fTF¼ 0 Hz in Fig.
3(b). The difference in 1/Q between the qPlus sensor and the
retuned fork sensor can be ascribed to the dissipation in the
oscillation energy at the join of the two prongs, estimated to
be about 1/15 000, as indicated by 1/Qmech_qPlus in Fig. 4.
Concerning the improvement of the minimum detection
limit dF0min according to Eq. (1), the Q factor of a two-prong
type should noticeably be larger than twice that of a one-
prong type, because the spring constant of the two-prong-
type force sensor is practically twice as large as that of the
one-prong-type force sensor.17 While the Q factor for our
qPlus sensor was about 10 000 in UHV, as large as typical
values of 5000–15 000 reported in the literature, the Q factor
of our retuned fork sensor even in a range of fRT0 6 500 Hz
was larger than 30 000 in UHV. The Qmech factor of the
retuned fork sensor reached high enough for atom-resolved
nc-AFM imaging, although there is room for improvement
in terms of the detection circuit, which limited the Qeff
factor.
In summary, we demonstrated the performance of a
retuned fork sensor for nc-AFM with atomic resolution,
developed based on a quartz tuning fork with two prongs. To
retune the resonance frequency of a one prong having an
AFM tip to that of the other intact prong, we cut a small
notch into one prong that improved immensely the Q factor
of the sensor. We measured the Q factor decomposing it by
dissipation channels to obtain estimates. The high Q factor
of the retuned fork sensor is expected to enable dissipation
signals between tip and sample to be acquired with high
sensitivity.
This work was supported by Grants-in-Aid for Scientific
Research (Nos. 24340068, 26630330, and 24246014) from
the Japanese Society for the Promotion of Science.
1T. R. Albrecht, P. Gr€utter, D. Horne, and D. Rugar, J. Appl. Phys. 69, 668
(1991).2F. J. Giessibl, Science 267, 68 (1995).3T. Arai and M. Tomitori, Phys. Rev. Lett. 93, 256101 (2004).4F. J. Giessibl, Appl. Phys. Lett. 78, 123 (2001).5F. J. Giessibl, Phys. Rev. B 56, 16010 (1997).6W. H. J. Rensen, N. F. van Hulst, A. G. T. Ruiter, and P. E. West, Appl.
Phys. Lett. 75, 1640 (1999).7F. J. Giessibl, Appl. Phys. Lett. 73, 3956 (1998).8F. J. Giessibl, Appl. Phys. Lett. 76, 1470 (2000).9A. Castellanos-Gomez, N. Agra€ıt, and G. Rubio-Bollinger,
Nanotechnology 21, 145702 (2010).10R. D. Grober, J. Acimovic, J. Schuck, D. Hessman, P. J. Kindlemann, J.
Hespanha, A. S. Morse, K. Karrai, I. Tiemann, and S. Manus, Rev. Sci.
Instrum. 71, 2776 (2000).11T. Arai and M. Tomitori, Jpn. J. Appl. Phys., Part 1 39, 3753 (2000).12A. J. Weymouth, T. Wutscher, J. Welker, T. Hofmann, and F. J. Giessibl,
Phys. Rev. Lett. 106, 226801 (2011).13J. Rychen, PhD dissertation, Swiss Federal Institute of Technology,
Zurich, 2001.14C. Zener, Phys. Rev. 52, 230 (1937).15S. Hudlet, M. S. Jean, C. Guthmann, and J. Berger, Eur. Phys. J. B 2, 5
(1998).16F. J. Giessibl, Rev. Mod. Phys. 75, 949 (2003).17F. J. Giessibl, F. Pielmeier, T. Eguchi, T. An, and Y. Hasegawa, Phys.
Rev. B 84, 125409 (2011).
043107-4 Ooe et al. Appl. Phys. Lett. 105, 043107 (2014)
This article is copyrighted as indicated in the article. Reuse of AIP content is subject to the terms at: http://scitation.aip.org/termsconditions. Downloaded to IP: 150.65.7.11
On: Fri, 11 Sep 2015 01:31:44