Embed Size (px)
Citation preview
Resonant degenerate four-wave mixing inI2: effect of buffer gas pressure
Peter Barker, Amberyn Thomas, Halina Rubinsztein-Dunlop, Ove Axner,and Nikolai Chekalin
The influence of molecular collisions on the production of the degenerate four-wave mixing signal in I2 ispresented. Measurements were performed on gaseous molecular iodine, I2, contained in a glass cell inwhich pressure, temperature, and species concentration are easily and independently varied. Frequency-doubled outputs from a seeded Nd:YAG laser and an excimer-pumped dye laser were used as excitationsources. We have studied the dependence of signal strength versus buffer gas pressure, with pumpintensity as a third parameter. It is evident from our results that, for pump intensities of less than1 MW@cm2, the pressure dependence of the signal follows that given by a simple two-level model in thehomogeneously broadened regime. In this regime collisional deexcitation becomes significant, leadingto changes in saturation intensity. This is evidenced by a reduction in the signal with an increase inbuffer gas pressure. This behavior is similar to that seen in laser-induced fluorescence. At higherpump intensities, the signal is seen to increase with pressure; this behavior cannot be described by thesimple two-level model.Key words: Nonlinear laser spectroscopy, degenerate four-wave mixing.PACS: 42.65.Hw, 82.80, 42.62.Fi
1. Introduction
New laser-based diagnostic techniques, developedprimarily within the combustion community, offerconsiderable promise for measurements within super-sonic and hypersonic flows. In the past, severalmethods have been proposed for nonintrusive mea-surements in gaseous flows. Some of the importantphysical properties, such as concentration, tempera-ture, velocity, and density of stable and reactivespecies, can bemonitored by the use of these methods.They can provide high spatial and temporal resolu-tion when light pulses of nanosecond or picosecondduration are employed.Linear optical spectroscopic techniques, such as
laser-induced fluorescence 1LIF2 and absorption, have
P. Barker, A. Thomas, and H. Rubinsztein-Dunlop are with theDepartment of Physics, The University of Queensland, Queensland4072, Australia. O. Axner is with the Department of Physics,Chalmers University of Technology and the University of Goteborg,S-412 96 Goteborg, Sweden. N. Chekalin is with V. I. VernadskyInstitute of Geochemistry andAnalytical Chemistry, Kosygin Ulitsa19, Moscow 117975, Russia.Received 8 August 1994; revised manuscript received 10 Novem-
ber 1994.0003-6935@95@183281-09$06.00@0.
r 1995 Optical Society of America.
been employed formeasurements of species concentra-tions and temperatures.1–10 Nonlinear optical diag-nostic methods have also proved valuable. Amongthem, coherent anti-Stokes Raman spectroscopy hasbeen developed as an accurate temperature probe andis also successful for determinations of major speciesconcentrations.11,12 Another closely related nonlin-ear optical process involving the third-order suscepti-bility, x1321v2, is resonant degenerate four-wave mixing1DFWM2. DFWM has been successfully used for de-tections of low concentrations of both atomic andmolecular species, such as Na, Li, Ba, NH3, OH, NH,NO, and NO2.13–19 It finds application in high-resolution spectroscopy 1because of its inherent Dopp-ler-free nature2 and for measurements of ultrafastrelaxation and diffusion phenomena. It has alsobeen demonstrated as a useful method for tempera-ture determination.20–22DFWM is currently being studied for its applicabil-
ity as a diagnostic tool in the study of combustionphenomena and flow fields.16,21 We evaluate thistechnique at the higher pressures 1.50 kPa2 usuallyencountered in such environments. In particular,we are interested in the effects of pressure on theDFWM process in I2 and therefore consider the effectof molecular collisions on the production of theDFWM signal.
20 June 1995 @ Vol. 34, No. 18 @ APPLIED OPTICS 3281
The DFWM signal is created when light is scatteredfrom a spatially modulated population grating. Thisgrating is produced by the interference of three inputlight fields of the same frequency, v. The mostcommon geometry for DFWM is the use of two strongcounter propagating forward, Ef, and backward, Eb,beams that pass colinearly through the medium.A weaker probe beam, Ep, enters the medium andcrosses the strong pumps at a small angle u to thestronger colinear fields. A phase conjugate of theprobe, Ec, is produced by the four-wave mixing pro-cess, which retraces the path of the probe beamexactly. This conjugate field can be collected andconstitutes the DFWM signal. A spatially modu-lated intensity pattern is created where the threeinput fields cross within the medium. If the fre-quency of the light is close to, or at resonance with, anatomic ormolecular transition, a correspondingmodu-lation of amplitude or refractive index results becauseof regions of alternating strong and weak absorption,which occur between the maxima and the minima ofthe generated interference pattern. In this picturethe signal is produced by the Bragg scattering of oneof the strong pump beams by a grating formed by theother pump beam and the probe. Because there aretwo pump beams, two gratings are produced, andeach scatters one of the pump beams back along thedirection of the probe beam to produce a phaseconjugate of the probe beam. This scattered lightconstitutes the DFWM signal.There are similarities between LIF and resonant
DFWM in that both methods are restricted to specieswith a transition resonant with a laser frequency.The greatest advantage of DFWM over LIF is that thesignal is emitted in a coherent directional beam, andso this method can be less affected than LIF byscattered and ambient light.I2 is one of the most spectroscopically studied
diatomic molecules, for which a great amount ofspectroscopic data is available.23 It has a large num-ber of transitions in the visible region, and mostlasers emitting in the visible have access to one ormore of its available transitions. I2 sublimates to afixed, temperature-dependent vapor pressure. Con-centration is easily varied by a change in the ambienttemperature of the cell. I2 has been successfullyused as a seed molecule for flow diagnostics thatutilize LIF.23,24 It is therefore a useful and conve-nient species for studying DFWM processes. DFWMstudies in I2 were performed earlier in the wavelengthregion near 585 nm25,26; in these studies the authorsinvestigated the effects of absorption on the DFWMsignal and in the spectral region near 561 nm,27where the polarization of the signal beam is oppositeto that of the probe beam and one pump beam.When this cross-polarized technique was used, thesignal was recorded without any measurable straylight background.Vander Wall et al.28 previously studied, both theo-
retically and experimentally, the effects of buffer gas
3282 APPLIED OPTICS @ Vol. 34, No. 18 @ 20 June 1995
pressure on DFWM signal intensities, including ef-fects stemming from molecular motion when nonsat-urating pump and probe fields are used. Recently, amore general treatment taking into account bothmolecular motion and arbitrary intensity input fieldswas performed by Lucht et al.29Here we investigate the DFWM process in I2 at
532.4 nm, which lies within the gain profile of theNd:YAG laser. We then follow a more simplifiedapproach than that previously undertaken to modelthe DFWM signal intensities in the presence of buffergas pressure. This approach might prove to be ofparticular use when DFWM experiments are per-formed at pressures above 50 kPa, where collisionalbroadening dominates. At this regime the station-ary absorbermodel is valid. Using this simplemodel,we can account for effects that occur with saturatingpump fields, which were not addressed in Ref. 28.Our simplified model then gives the analytical solu-tions in this regime, which would otherwise requireextensive numerical computation if the more generalapproach developed by Lucht et al.29 were used.The aim of this paper is threefold: First, to com-
pare the spectral features of I2 simultaneously re-corded with two methods: LIF and DFWM in thespectral region covered by the doubled frequencyoutput of a Nd:YAG laser, which is around the 532-nmwavelength. This spectral region is of interest as itcoincides with strong transitions in I2, and, at thesame time, the high-power output and a narrowlinewidth that are attainable when a seeded Nd:YAGlaser is used enable saturation of these transitions.These features are of particular interest when theDFWM technique is to be used for two-dimensionalmapping of flows or when an environment that is to bestudied has limited optical access, so that otheroptical methods such as LIF are more difficult toimplement. Second, we investigate the behavior ofthe DFWM signal with changing buffer gas pressureand laser intensity. Finally, a comparison is madebetween the experimentally obtained results andtheoretical predictions. The theoretical model usedhere is based on the model first developed by AbramsandLind,30 withmodifications that include quenching-type processes.
2. Theory
The basic theory for resonant DFWM for a two levelstationary absorber was developed by Abrams andLind30 and Lam and Abrams.31 In this theory it isassumed that the medium consists of an ensemble ofhomogeneously broadened absorbers. The two en-ergy levels are separated by an energy differenceequal to, or close to, that provided by a monochro-matic field. The reflectivity, R, of the medium can beenvisaged as the ratio of the conjugate signal, Ic, tothe input probe intensity, Ip. This is given as
IcIp
5 R 5 0 b sin1GL2
G cos1GL2 1 a sin1GL202, 112
where the linear coupling coefficient, a, is expressedas
a 5 a0
1 1 21I@Is2
1 1 d231 1 41I@Is243@2. 122
The nonlinear coupling coefficient, b, is representedby
b 5 a0
1i 1 d221I@Is2
1 1 d231 1 41I@Is243@2. 132
The medium is illuminated with pump fields of inten-sity I, and the medium has a saturation intensity Isand absorption coefficient a0. The variable G in Eq.112 is a measure of the degree that nonlinearityexceeds linear absorption and is given by
G 5 1 0b 02 2 a221@2. 142
The saturation intensity, Is, is given as
Is 5 1⁄21e0c"2g1g2@µ122211 1 d22 152
The line-center field absorption coefficient, a0, is
a0 5 vnµ122@2c"e0g2, 162
where v is the frequency of the incident light field, n isthe population difference in the absence of appliedfields, µ12 is the dipole moment for the particulartransition, g1 and g2 are the longitudinal and trans-verse decay rates, respectively, and d is the detuningnormalized by g2.
3. Experiment
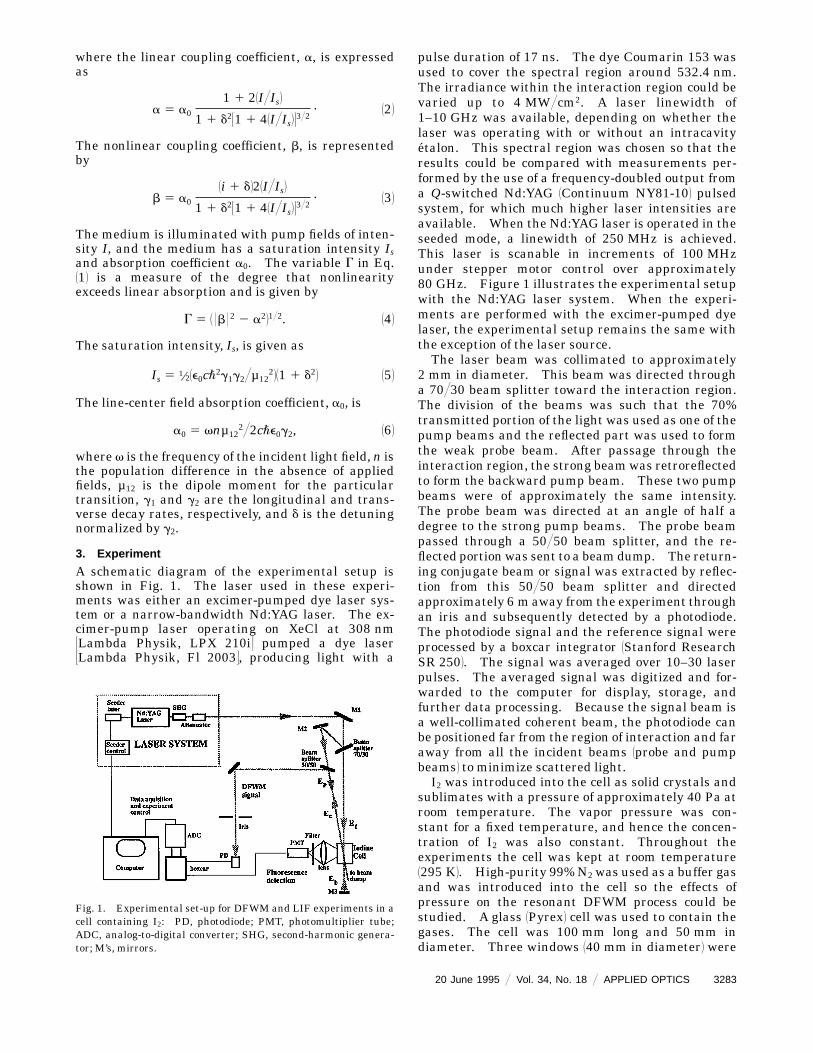
A schematic diagram of the experimental setup isshown in Fig. 1. The laser used in these experi-ments was either an excimer-pumped dye laser sys-tem or a narrow-bandwidth Nd:YAG laser. The ex-cimer-pump laser operating on XeCl at 308 nm3Lambda Physik, LPX 210i4 pumped a dye laser3Lambda Physik, Fl 20034, producing light with a
Fig. 1. Experimental set-up for DFWM and LIF experiments in acell containing I2: PD, photodiode; PMT, photomultiplier tube;ADC, analog-to-digital converter; SHG, second-harmonic genera-tor; M’s, mirrors.
pulse duration of 17 ns. The dye Coumarin 153 wasused to cover the spectral region around 532.4 nm.The irradiance within the interaction region could bevaried up to 4 MW@cm2. A laser linewidth of1–10 GHz was available, depending on whether thelaser was operating with or without an intracavityetalon. This spectral region was chosen so that theresults could be compared with measurements per-formed by the use of a frequency-doubled output froma Q-switched Nd:YAG 1Continuum NY81-102 pulsedsystem, for which much higher laser intensities areavailable. When the Nd:YAG laser is operated in theseeded mode, a linewidth of 250 MHz is achieved.This laser is scanable in increments of 100 MHzunder stepper motor control over approximately80 GHz. Figure 1 illustrates the experimental setupwith the Nd:YAG laser system. When the experi-ments are performed with the excimer-pumped dyelaser, the experimental setup remains the same withthe exception of the laser source.The laser beam was collimated to approximately
2 mm in diameter. This beam was directed througha 70@30 beam splitter toward the interaction region.The division of the beams was such that the 70%transmitted portion of the light was used as one of thepump beams and the reflected part was used to formthe weak probe beam. After passage through theinteraction region, the strong beamwas retroreflectedto form the backward pump beam. These two pumpbeams were of approximately the same intensity.The probe beam was directed at an angle of half adegree to the strong pump beams. The probe beampassed through a 50@50 beam splitter, and the re-flected portionwas sent to a beamdump. The return-ing conjugate beam or signal was extracted by reflec-tion from this 50@50 beam splitter and directedapproximately 6 m away from the experiment throughan iris and subsequently detected by a photodiode.The photodiode signal and the reference signal wereprocessed by a boxcar integrator 1Stanford ResearchSR 2502. The signal was averaged over 10–30 laserpulses. The averaged signal was digitized and for-warded to the computer for display, storage, andfurther data processing. Because the signal beam isa well-collimated coherent beam, the photodiode canbe positioned far from the region of interaction and faraway from all the incident beams 1probe and pumpbeams2 to minimize scattered light.I2 was introduced into the cell as solid crystals and
sublimates with a pressure of approximately 40 Pa atroom temperature. The vapor pressure was con-stant for a fixed temperature, and hence the concen-tration of I2 was also constant. Throughout theexperiments the cell was kept at room temperature1295 K2. High-purity 99%N2 was used as a buffer gasand was introduced into the cell so the effects ofpressure on the resonant DFWM process could bestudied. A glass 1Pyrex2 cell was used to contain thegases. The cell was 100 mm long and 50 mm indiameter. Three windows 140 mm in diameter2 were
20 June 1995 @ Vol. 34, No. 18 @ APPLIED OPTICS 3283
used for optical access. Two of the windows wereplaced on either end of the cell for the resonantexcitation and DFWM experiments. The third win-dow, perpendicular to the strong pump beams, wasused to monitor fluorescence. The probe beam inter-sected the counterpropagating pump beams at thecenter of the cell. Mirrors M1 and M2 were posi-tioned as far away from the cell as possible on anoptical table in order to minimize the angle betweenthe probe and the pump beams. In this way, amaximum overlap volume was obtained for all inputbeams along the entire length of the cell.Spectra of I2 obtained from LIF and DFWM mea-
surements were recorded in the region from 18786.5cm21 to 18788.7 cm21. The dye laser system wasused in this application, as it is easily and quicklyscanned over the region of interest. The study ofpressure dependence of the signal was performed online 1109 of the I2 atlas with both laser systems.32This particular line was chosen as it has the greatestspectral isolation from other lines within the spectralregion accessible with the tuning capabilities of theNd:YAG laser.
4. Pressure Effects in I 2
We are interested in using the DFWM technique in I2at pressures greater than 50 kPa. This means thatwe need to consider only pressure effects that are dueto homogeneous broadening. We call this the high-pressure region and define it to be in the pressurerange where the combined I2 and buffer gas pressureresult in a primarily pressure-broadened linewidth.For I2 in N2, this corresponds to a combined pressureof 10 kPa with an I2 vapor pressure of 40 Pa. Thelow-pressure regime is defined as the region wherethe linewidth is a mixture of both Doppler- andpressure-broadened line shapes or mainly Doppler-broadened line shapes. We assume that at highpressures the mean-free path of the molecules issmall so that the stationary absorber model is valid.30Therefore the primary effect on the variation ofDFWM signal strength is due to a correspondingchange in linewidth through molecular collisions.The effect of molecular collisions on the longitudi-
nal and the transverse relaxation rates takes twoforms. The first effect is caused by collisions thatlead to changes in energy-level populations betweenthe two levels connected by the incident field. Theseinelastic collisions will also alter the populations ofother energy levels within the molecular system.The second effect that also leads to a change inrelaxation rates is due to elastic phase-changingcollisions. These types of collision will affect only thetransverse rate g2. Because the mean translationalenergy of a gas at room temperature is far greaterthan the rovibrational energy separation in the spec-tral region of interest, we assume that state-changingor inelastic collisions are dominant and that g1 and g2are equal over the pressure range considered. There-fore, in order to include the effects of collisionalquenching, we allow the longitudinal g1 and trans-
3284 APPLIED OPTICS @ Vol. 34, No. 18 @ 20 June 1995
verse decay g2 rates to vary with pressure accordingto the formula,
g11,221p2 5 g011,221 gI211,22
1pI22 1 gg11,221pg2. 172
In Eq. 172 the total combined rates are due to theaddition of the natural decay rate g011,22, the pressure-dependent rate that is due to the partial pressure ofI2, gI211,221pI22, and the pressure-dependent rate that isdue to the buffer gas, gg11,221pg2. Both the pressure-dependent decay rates are assumed to vary as
g11,221p2 5 f 1s, m, T2p, 182
where the function f 1s, m, T2 accounts for collisioncross sections s of the species, its mass m, and gastemperature T. Pressure p is in units of kilopascals.This function is considered constant for I2 at constanttemperature T over the buffer gas pressure rangeconsidered here. Hence, for a fixed temperature,both transverse and longitudinal decay rates varylinearly with pressure. When this form is used forthe decay rates, the saturation intensity attains aquadratic dependence on pressure. This is in agree-mentwith experimental data obtained for theP13@R15143,02 B–X transition in I2.23
5. Results and Discussion
The inherent nonlinear dependence on both intensityand absorption coefficients in the production of theDFWM signal means that DFWM is able to providemuch higher-resolution spectra than LIF, even whenthe bandwidth of the laser is larger then the width ofthe excited transition. Figure 2 clearly illustratesthis. It shows simultaneously recorded spectra ofDFWM and LIF in I2 in the spectral region accessiblewith the frequency-doubled output of a Nd:YAG laser.These spectra were obtained with a laser bandwidthof 5–10 GHz at a total cell pressure of 6 kPa.Vibrational and rotational assignment is determinedby the spectroscopic data of Gerstenkorn et al.,33Hutson et al.,34 and Luc.35 DFWM is a Doppler-freetechnique when the angle between the pumps and theprobe beams is small enough so that each beaminteracts with the same velocity group. However,the linewidth of the laser must be less then theDoppler width of the transition. The spectra in Fig.2 were taken at a pressure of 6 kPa. At this pres-sure, I2 is predominantly Doppler broadened1400 MHz–1 GHz2, whereas the laser linewidth ismuch greater than the Doppler width at 5–10 GHz.Therefore, although the experiment employs a Dopp-ler-free geometry, Doppler-free spectra will not beobserved. Another interesting feature evident inFig. 2 is that, for the input intensity of 2 MW@cm2, thetwo methods yield different relative strengths of thespectral lines. The LIF spectrum shows that theconvoluted lines 1115 and 1116 and lines 1100 and1102 are stronger than all other lines in this spectralregion. However, this is not the case in the corre-sponding DFWM spectrum. The reduction in signalof these particular transitions compared with the
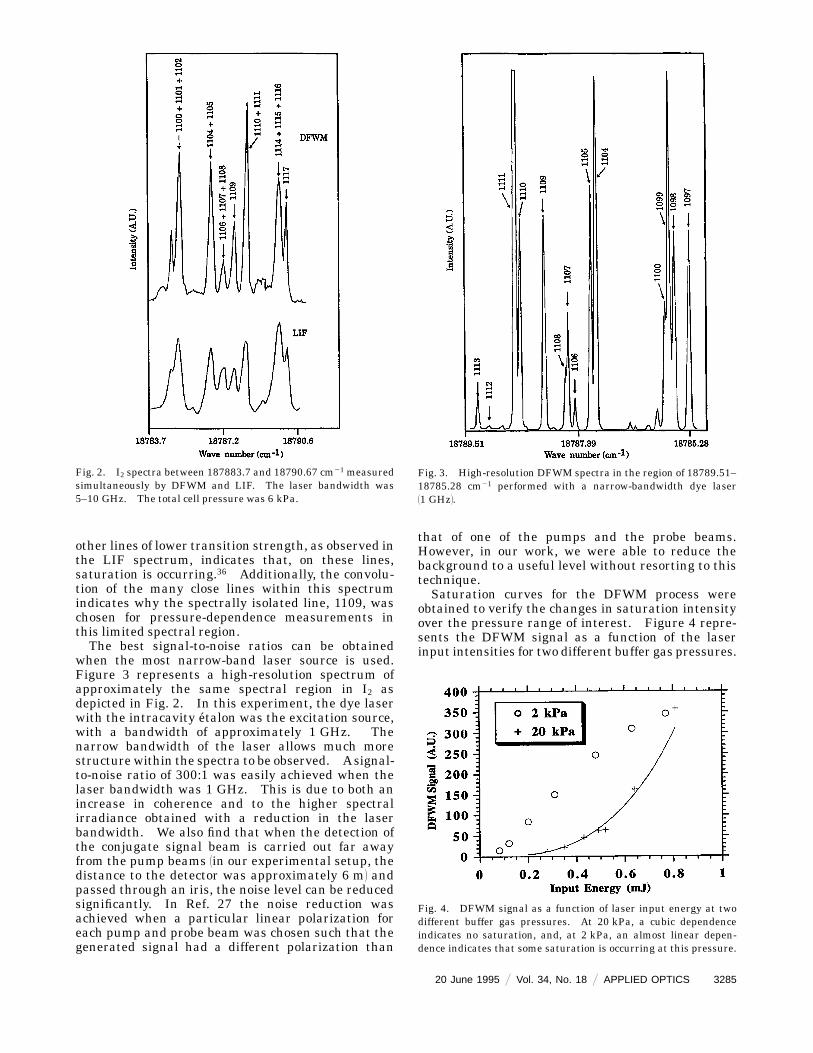
other lines of lower transition strength, as observed inthe LIF spectrum, indicates that, on these lines,saturation is occurring.36 Additionally, the convolu-tion of the many close lines within this spectrumindicates why the spectrally isolated line, 1109, waschosen for pressure-dependence measurements inthis limited spectral region.The best signal-to-noise ratios can be obtained
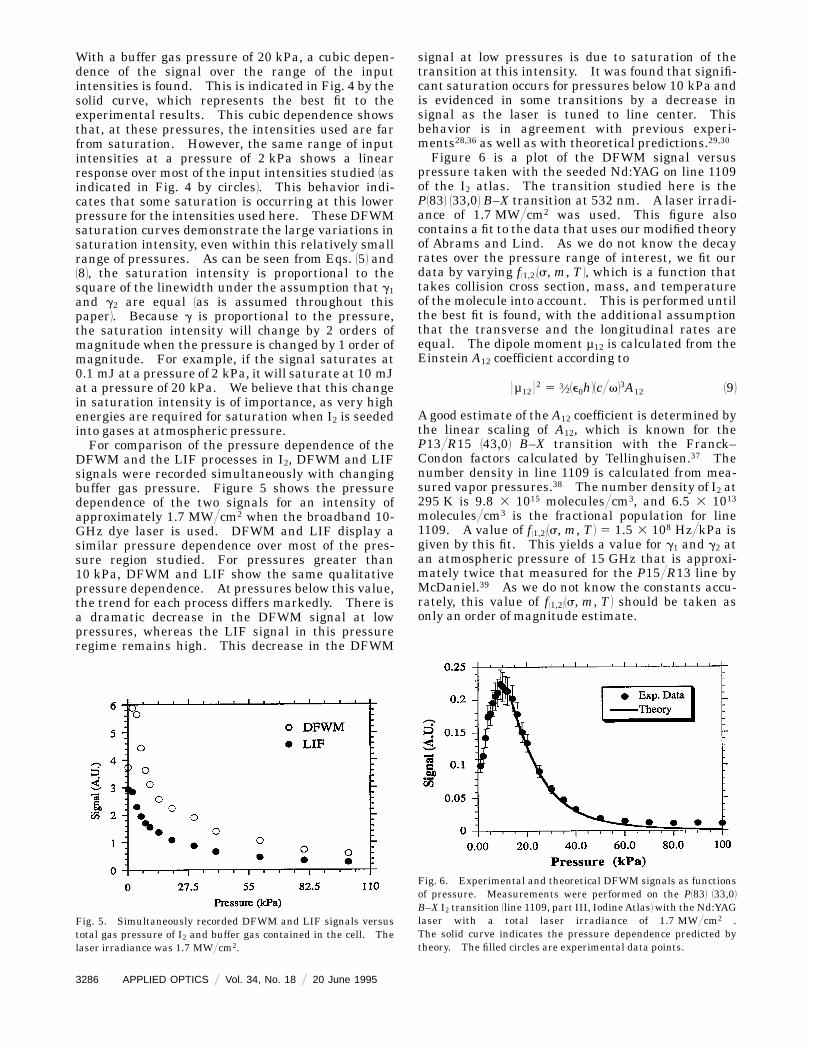
when the most narrow-band laser source is used.Figure 3 represents a high-resolution spectrum ofapproximately the same spectral region in I2 asdepicted in Fig. 2. In this experiment, the dye laserwith the intracavity etalon was the excitation source,with a bandwidth of approximately 1 GHz. Thenarrow bandwidth of the laser allows much morestructure within the spectra to be observed. Asignal-to-noise ratio of 300:1 was easily achieved when thelaser bandwidth was 1 GHz. This is due to both anincrease in coherence and to the higher spectralirradiance obtained with a reduction in the laserbandwidth. We also find that when the detection ofthe conjugate signal beam is carried out far awayfrom the pump beams 1in our experimental setup, thedistance to the detector was approximately 6 m2 andpassed through an iris, the noise level can be reducedsignificantly. In Ref. 27 the noise reduction wasachieved when a particular linear polarization foreach pump and probe beam was chosen such that thegenerated signal had a different polarization than
Fig. 2. I2 spectra between 187883.7 and 18790.67 cm21 measuredsimultaneously by DFWM and LIF. The laser bandwidth was5–10 GHz. The total cell pressure was 6 kPa.
that of one of the pumps and the probe beams.However, in our work, we were able to reduce thebackground to a useful level without resorting to thistechnique.Saturation curves for the DFWM process were
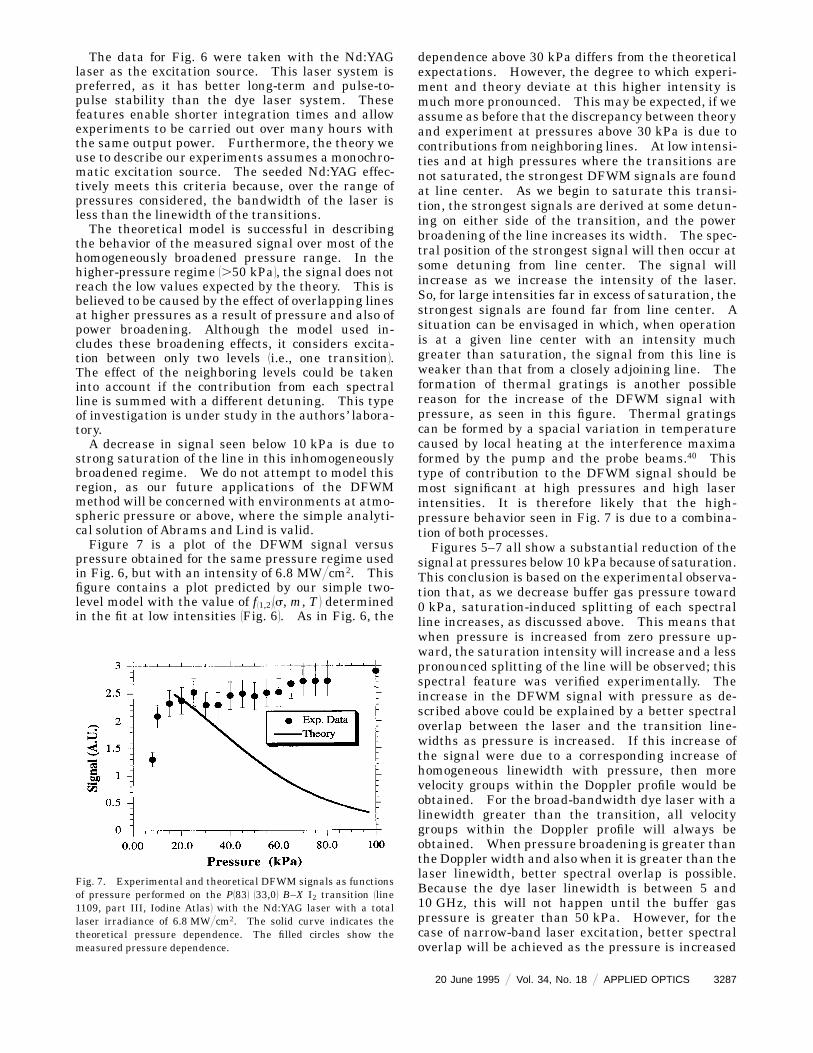
obtained to verify the changes in saturation intensityover the pressure range of interest. Figure 4 repre-sents the DFWM signal as a function of the laserinput intensities for two different buffer gas pressures.
Fig. 3. High-resolution DFWM spectra in the region of 18789.51–18785.28 cm21 performed with a narrow-bandwidth dye laser11 GHz2.
Fig. 4. DFWM signal as a function of laser input energy at twodifferent buffer gas pressures. At 20 kPa, a cubic dependenceindicates no saturation, and, at 2 kPa, an almost linear depen-dence indicates that some saturation is occurring at this pressure.
20 June 1995 @ Vol. 34, No. 18 @ APPLIED OPTICS 3285
With a buffer gas pressure of 20 kPa, a cubic depen-dence of the signal over the range of the inputintensities is found. This is indicated in Fig. 4 by thesolid curve, which represents the best fit to theexperimental results. This cubic dependence showsthat, at these pressures, the intensities used are farfrom saturation. However, the same range of inputintensities at a pressure of 2 kPa shows a linearresponse over most of the input intensities studied 1asindicated in Fig. 4 by circles2. This behavior indi-cates that some saturation is occurring at this lowerpressure for the intensities used here. These DFWMsaturation curves demonstrate the large variations insaturation intensity, even within this relatively smallrange of pressures. As can be seen from Eqs. 152 and182, the saturation intensity is proportional to thesquare of the linewidth under the assumption that g1and g2 are equal 1as is assumed throughout thispaper2. Because g is proportional to the pressure,the saturation intensity will change by 2 orders ofmagnitude when the pressure is changed by 1 order ofmagnitude. For example, if the signal saturates at0.1 mJ at a pressure of 2 kPa, it will saturate at 10 mJat a pressure of 20 kPa. We believe that this changein saturation intensity is of importance, as very highenergies are required for saturation when I2 is seededinto gases at atmospheric pressure.For comparison of the pressure dependence of the
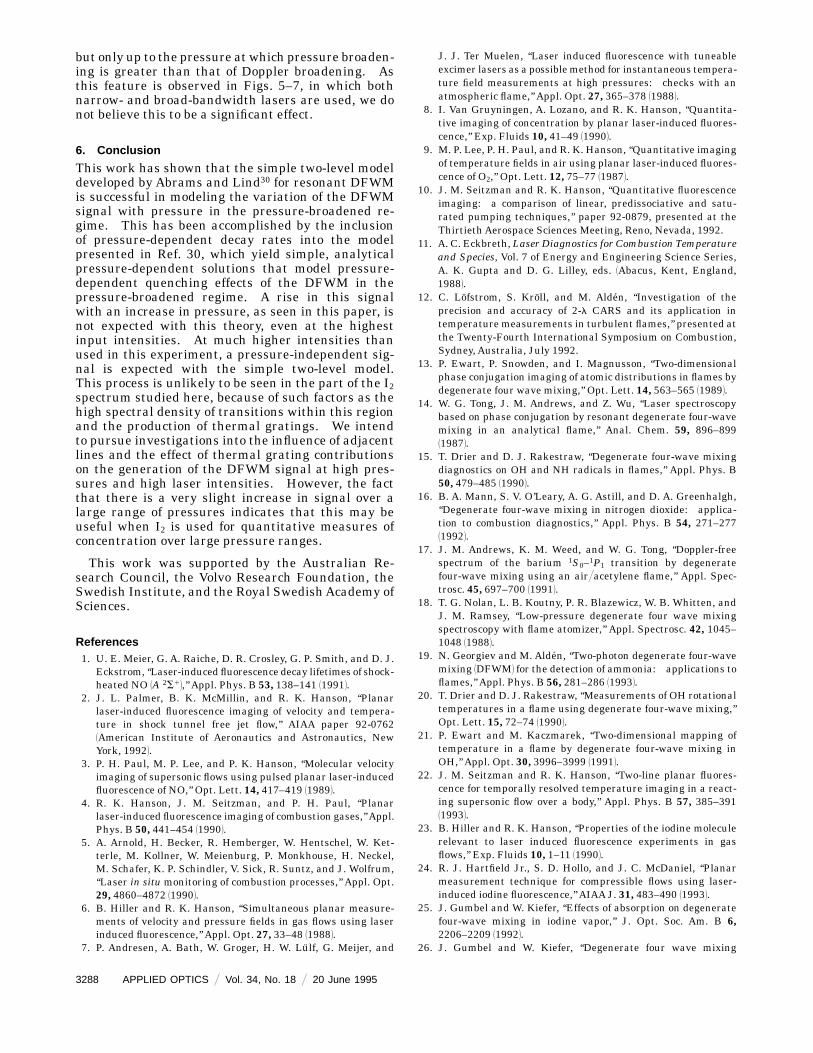
DFWM and the LIF processes in I2, DFWM and LIFsignals were recorded simultaneously with changingbuffer gas pressure. Figure 5 shows the pressuredependence of the two signals for an intensity ofapproximately 1.7 MW@cm2 when the broadband 10-GHz dye laser is used. DFWM and LIF display asimilar pressure dependence over most of the pres-sure region studied. For pressures greater than10 kPa, DFWM and LIF show the same qualitativepressure dependence. At pressures below this value,the trend for each process differs markedly. There isa dramatic decrease in the DFWM signal at lowpressures, whereas the LIF signal in this pressureregime remains high. This decrease in the DFWM
Fig. 5. Simultaneously recorded DFWM and LIF signals versustotal gas pressure of I2 and buffer gas contained in the cell. Thelaser irradiance was 1.7 MW@cm2.
3286 APPLIED OPTICS @ Vol. 34, No. 18 @ 20 June 1995
signal at low pressures is due to saturation of thetransition at this intensity. It was found that signifi-cant saturation occurs for pressures below 10 kPa andis evidenced in some transitions by a decrease insignal as the laser is tuned to line center. Thisbehavior is in agreement with previous experi-ments28,36 as well as with theoretical predictions.29,30Figure 6 is a plot of the DFWM signal versus
pressure taken with the seeded Nd:YAG on line 1109of the I2 atlas. The transition studied here is theP1832 133,02 B–X transition at 532 nm. A laser irradi-ance of 1.7 MW@cm2 was used. This figure alsocontains a fit to the data that uses our modified theoryof Abrams and Lind. As we do not know the decayrates over the pressure range of interest, we fit ourdata by varying f11,221s, m, T2, which is a function thattakes collision cross section, mass, and temperatureof the molecule into account. This is performed untilthe best fit is found, with the additional assumptionthat the transverse and the longitudinal rates areequal. The dipole moment µ12 is calculated from theEinstein A12 coefficient according to
0µ12 02 5 3⁄21e0h21c@v23A12 192
Agood estimate of the A12 coefficient is determined bythe linear scaling of A12, which is known for theP13@R15 143,02 B–X transition with the Franck–Condon factors calculated by Tellinghuisen.37 Thenumber density in line 1109 is calculated from mea-sured vapor pressures.38 The number density of I2 at295 K is 9.8 3 1015 molecules@cm3, and 6.5 3 1013molecules@cm3 is the fractional population for line1109. A value of f11,221s, m, T2 5 1.5 3 108 Hz@kPa isgiven by this fit. This yields a value for g1 and g2 atan atmospheric pressure of 15 GHz that is approxi-mately twice that measured for the P15@R13 line byMcDaniel.39 As we do not know the constants accu-rately, this value of f11,221s, m, T2 should be taken asonly an order of magnitude estimate.
Fig. 6. Experimental and theoretical DFWM signals as functionsof pressure. Measurements were performed on the P1832 133,02B–X I2 transition 1line 1109, part III, IodineAtlas2with the Nd:YAGlaser with a total laser irradiance of 1.7 MW@cm2 .The solid curve indicates the pressure dependence predicted bytheory. The filled circles are experimental data points.
The data for Fig. 6 were taken with the Nd:YAGlaser as the excitation source. This laser system ispreferred, as it has better long-term and pulse-to-pulse stability than the dye laser system. Thesefeatures enable shorter integration times and allowexperiments to be carried out over many hours withthe same output power. Furthermore, the theory weuse to describe our experiments assumes a monochro-matic excitation source. The seeded Nd:YAG effec-tively meets this criteria because, over the range ofpressures considered, the bandwidth of the laser isless than the linewidth of the transitions.The theoretical model is successful in describing
the behavior of the measured signal over most of thehomogeneously broadened pressure range. In thehigher-pressure regime 1.50 kPa2, the signal does notreach the low values expected by the theory. This isbelieved to be caused by the effect of overlapping linesat higher pressures as a result of pressure and also ofpower broadening. Although the model used in-cludes these broadening effects, it considers excita-tion between only two levels 1i.e., one transition2.The effect of the neighboring levels could be takeninto account if the contribution from each spectralline is summed with a different detuning. This typeof investigation is under study in the authors’ labora-tory.A decrease in signal seen below 10 kPa is due to
strong saturation of the line in this inhomogeneouslybroadened regime. We do not attempt to model thisregion, as our future applications of the DFWMmethod will be concerned with environments at atmo-spheric pressure or above, where the simple analyti-cal solution of Abrams and Lind is valid.Figure 7 is a plot of the DFWM signal versus
pressure obtained for the same pressure regime usedin Fig. 6, but with an intensity of 6.8 MW@cm2. Thisfigure contains a plot predicted by our simple two-level model with the value of f11,221s, m, T2 determinedin the fit at low intensities 1Fig. 62. As in Fig. 6, the
Fig. 7. Experimental and theoretical DFWM signals as functionsof pressure performed on the P1832 133,02 B–X I2 transition 1line1109, part III, Iodine Atlas2 with the Nd:YAG laser with a totallaser irradiance of 6.8 MW@cm2. The solid curve indicates thetheoretical pressure dependence. The filled circles show themeasured pressure dependence.
dependence above 30 kPa differs from the theoreticalexpectations. However, the degree to which experi-ment and theory deviate at this higher intensity ismuch more pronounced. This may be expected, if weassume as before that the discrepancy between theoryand experiment at pressures above 30 kPa is due tocontributions from neighboring lines. At low intensi-ties and at high pressures where the transitions arenot saturated, the strongest DFWM signals are foundat line center. As we begin to saturate this transi-tion, the strongest signals are derived at some detun-ing on either side of the transition, and the powerbroadening of the line increases its width. The spec-tral position of the strongest signal will then occur atsome detuning from line center. The signal willincrease as we increase the intensity of the laser.So, for large intensities far in excess of saturation, thestrongest signals are found far from line center. Asituation can be envisaged in which, when operationis at a given line center with an intensity muchgreater than saturation, the signal from this line isweaker than that from a closely adjoining line. Theformation of thermal gratings is another possiblereason for the increase of the DFWM signal withpressure, as seen in this figure. Thermal gratingscan be formed by a spacial variation in temperaturecaused by local heating at the interference maximaformed by the pump and the probe beams.40 Thistype of contribution to the DFWM signal should bemost significant at high pressures and high laserintensities. It is therefore likely that the high-pressure behavior seen in Fig. 7 is due to a combina-tion of both processes.Figures 5–7 all show a substantial reduction of the
signal at pressures below 10 kPa because of saturation.This conclusion is based on the experimental observa-tion that, as we decrease buffer gas pressure toward0 kPa, saturation-induced splitting of each spectralline increases, as discussed above. This means thatwhen pressure is increased from zero pressure up-ward, the saturation intensity will increase and a lesspronounced splitting of the line will be observed; thisspectral feature was verified experimentally. Theincrease in the DFWM signal with pressure as de-scribed above could be explained by a better spectraloverlap between the laser and the transition line-widths as pressure is increased. If this increase ofthe signal were due to a corresponding increase ofhomogeneous linewidth with pressure, then morevelocity groups within the Doppler profile would beobtained. For the broad-bandwidth dye laser with alinewidth greater than the transition, all velocitygroups within the Doppler profile will always beobtained. When pressure broadening is greater thanthe Doppler width and also when it is greater than thelaser linewidth, better spectral overlap is possible.Because the dye laser linewidth is between 5 and10 GHz, this will not happen until the buffer gaspressure is greater than 50 kPa. However, for thecase of narrow-band laser excitation, better spectraloverlap will be achieved as the pressure is increased
20 June 1995 @ Vol. 34, No. 18 @ APPLIED OPTICS 3287
but only up to the pressure at which pressure broaden-ing is greater than that of Doppler broadening. Asthis feature is observed in Figs. 5–7, in which bothnarrow- and broad-bandwidth lasers are used, we donot believe this to be a significant effect.
6. Conclusion
This work has shown that the simple two-level modeldeveloped by Abrams and Lind30 for resonant DFWMis successful in modeling the variation of the DFWMsignal with pressure in the pressure-broadened re-gime. This has been accomplished by the inclusionof pressure-dependent decay rates into the modelpresented in Ref. 30, which yield simple, analyticalpressure-dependent solutions that model pressure-dependent quenching effects of the DFWM in thepressure-broadened regime. A rise in this signalwith an increase in pressure, as seen in this paper, isnot expected with this theory, even at the highestinput intensities. At much higher intensities thanused in this experiment, a pressure-independent sig-nal is expected with the simple two-level model.This process is unlikely to be seen in the part of the I2spectrum studied here, because of such factors as thehigh spectral density of transitions within this regionand the production of thermal gratings. We intendto pursue investigations into the influence of adjacentlines and the effect of thermal grating contributionson the generation of the DFWM signal at high pres-sures and high laser intensities. However, the factthat there is a very slight increase in signal over alarge range of pressures indicates that this may beuseful when I2 is used for quantitative measures ofconcentration over large pressure ranges.
This work was supported by the Australian Re-search Council, the Volvo Research Foundation, theSwedish Institute, and the Royal SwedishAcademy ofSciences.
References1. U. E. Meier, G. A. Raiche, D. R. Crosley, G. P. Smith, and D. J.
Eckstrom, ‘‘Laser-induced fluorescence decay lifetimes of shock-heated NO 1A 2S12,’’ Appl. Phys. B 53, 138–141 119912.
2. J. L. Palmer, B. K. McMillin, and R. K. Hanson, ‘‘Planarlaser-induced fluorescence imaging of velocity and tempera-ture in shock tunnel free jet flow,’’ AIAA paper 92-07621American Institute of Aeronautics and Astronautics, NewYork, 19922.
3. P. H. Paul, M. P. Lee, and P. K. Hanson, ‘‘Molecular velocityimaging of supersonic flows using pulsed planar laser-inducedfluorescence of NO,’’ Opt. Lett. 14, 417–419 119892.
4. R. K. Hanson, J. M. Seitzman, and P. H. Paul, ‘‘Planarlaser-induced fluorescence imaging of combustion gases,’’Appl.Phys. B 50, 441–454 119902.
5. A. Arnold, H. Becker, R. Hemberger, W. Hentschel, W. Ket-terle, M. Kollner, W. Meienburg, P. Monkhouse, H. Neckel,M. Schafer, K. P. Schindler, V. Sick, R. Suntz, and J. Wolfrum,‘‘Laser in situmonitoring of combustion processes,’’ Appl. Opt.29, 4860–4872 119902.
6. B. Hiller and R. K. Hanson, ‘‘Simultaneous planar measure-ments of velocity and pressure fields in gas flows using laserinduced fluorescence,’’ Appl. Opt. 27, 33–48 119882.
7. P. Andresen, A. Bath, W. Groger, H. W. Lulf, G. Meijer, and
3288 APPLIED OPTICS @ Vol. 34, No. 18 @ 20 June 1995
J. J. Ter Muelen, ‘‘Laser induced fluorescence with tuneableexcimer lasers as a possiblemethod for instantaneous tempera-ture field measurements at high pressures: checks with anatmospheric flame,’’ Appl. Opt. 27, 365–378 119882.
8. I. Van Gruyningen, A. Lozano, and R. K. Hanson, ‘‘Quantita-tive imaging of concentration by planar laser-induced fluores-cence,’’ Exp. Fluids 10, 41–49 119902.
9. M. P. Lee, P. H. Paul, and R. K. Hanson, ‘‘Quantitative imagingof temperature fields in air using planar laser-induced fluores-cence of O2,’’ Opt. Lett. 12, 75–77 119872.
10. J. M. Seitzman and R. K. Hanson, ‘‘Quantitative fluorescenceimaging: a comparison of linear, predissociative and satu-rated pumping techniques,’’ paper 92-0879, presented at theThirtiethAerospace Sciences Meeting, Reno, Nevada, 1992.
11. A. C. Eckbreth, Laser Diagnostics for Combustion Temperatureand Species, Vol. 7 of Energy and Engineering Science Series,A. K. Gupta and D. G. Lilley, eds. 1Abacus, Kent, England,19882.
12. C. Lofstrom, S. Kroll, and M. Alden, ‘‘Investigation of theprecision and accuracy of 2-l CARS and its application intemperature measurements in turbulent flames,’’ presented atthe Twenty-Fourth International Symposium on Combustion,Sydney, Australia, July 1992.
13. P. Ewart, P. Snowden, and I. Magnusson, ‘‘Two-dimensionalphase conjugation imaging of atomic distributions in flames bydegenerate four wave mixing,’’ Opt. Lett. 14, 563–565 119892.
14. W. G. Tong, J. M. Andrews, and Z. Wu, ‘‘Laser spectroscopybased on phase conjugation by resonant degenerate four-wavemixing in an analytical flame,’’ Anal. Chem. 59, 896–899119872.
15. T. Drier and D. J. Rakestraw, ‘‘Degenerate four-wave mixingdiagnostics on OH and NH radicals in flames,’’ Appl. Phys. B50, 479–485 119902.
16. B. A. Mann, S. V. O’Leary, A. G. Astill, and D. A. Greenhalgh,‘‘Degenerate four-wave mixing in nitrogen dioxide: applica-tion to combustion diagnostics,’’ Appl. Phys. B 54, 271–277119922.
17. J. M. Andrews, K. M. Weed, and W. G. Tong, ‘‘Doppler-freespectrum of the barium 1S0–1P1 transition by degeneratefour-wave mixing using an air@acetylene flame,’’ Appl. Spec-trosc. 45, 697–700 119912.
18. T. G. Nolan, L. B. Koutny, P. R. Blazewicz, W. B. Whitten, andJ. M. Ramsey, ‘‘Low-pressure degenerate four wave mixingspectroscopy with flame atomizer,’’ Appl. Spectrosc. 42, 1045–1048 119882.
19. N. Georgiev and M. Alden, ‘‘Two-photon degenerate four-wavemixing 1DFWM2 for the detection of ammonia: applications toflames,’’ Appl. Phys. B 56, 281–286 119932.
20. T. Drier and D. J. Rakestraw, ‘‘Measurements of OH rotationaltemperatures in a flame using degenerate four-wave mixing,’’Opt. Lett. 15, 72–74 119902.
21. P. Ewart and M. Kaczmarek, ‘‘Two-dimensional mapping oftemperature in a flame by degenerate four-wave mixing inOH,’’ Appl. Opt. 30, 3996–3999 119912.
22. J. M. Seitzman and R. K. Hanson, ‘‘Two-line planar fluores-cence for temporally resolved temperature imaging in a react-ing supersonic flow over a body,’’ Appl. Phys. B 57, 385–391119932.
23. B. Hiller and R. K. Hanson, ‘‘Properties of the iodine moleculerelevant to laser induced fluorescence experiments in gasflows,’’ Exp. Fluids 10, 1–11 119902.
24. R. J. Hartfield Jr., S. D. Hollo, and J. C. McDaniel, ‘‘Planarmeasurement technique for compressible flows using laser-induced iodine fluorescence,’’ AIAAJ. 31, 483–490 119932.
25. J. Gumbel and W. Kiefer, ‘‘Effects of absorption on degeneratefour-wave mixing in iodine vapor,’’ J. Opt. Soc. Am. B 6,2206–2209 119922.
26. J. Gumbel and W. Kiefer, ‘‘Degenerate four wave mixing
spectroscopy in iodine vapor,’’ Chem. Phys. Lett. 189, 231–235119922.
27. N. Bohm and W. Keifer, ‘‘Polarized degenerate four-wavemixing spectroscopy in iodine vapor,’’ Appl. Spectrosc. 47,246–247 119932.
28. R. L. Vander Wal, R. L. Farrow, and D. J. Rakestraw, ‘‘High-resolution investigation of degenerate four wave mixing ing10, 02 band of nitric oxide,’’ presented at the Twenty-FourthInternational Symposium on Combustion, Sydney, Australia,July, 19922.
29. R. P. Lucht, R. L. Farrow, and D. J. Rakestraw, ‘‘Saturationeffects in gas-phase degenerate four-wave mixing spectros-copy, nonperturbative calculations,’’ J. Opt. Soc. Am. B 10,1508–1520 119932.
30. R. L. Abrams and R. C. Lind, ‘‘Degenerate four wave mixing inabsorbing media,’’ Opt. Lett. 2, 94–96 119782.
31. J. F. Lam and R. L. Abrams, ‘‘Theory of nonlinear opticalcoherences in resonant degenerate four-wave mixing,’’ Phys.Rev. A 26, 1539–1548 119822.
32. S. Gerstenkorn and P. Luc, Atlas du Spectre d’Absorption de laMolecule d’Iode 1Eds. du Centre National de la RechercheSpectroscopique, Paris, 19782, Partie 3, p. 53.
33. S. Gerstenkorn, P. Luc, and J. Verges, ‘‘A test of I2 ground statemolecular constants deduced fromFourier absorption spectros-
copy: the Wood’s resonance series,’’ Rev. Phys. Appl. 18,81–86 119832.
34. J. M. Hutson, S. Gerstenkorn, P. Luc, and J. Sinzelle, ‘‘Use ofcalculated centrifugal distortion constants 1Dv, Hv, Lv, andMv2in the analysis of the B–X system of I2,’’ J. Mol. Spectrosc. 96,266–278 119822.
35. P. Luc, ‘‘Molecular constants and Dunham expansion param-eters describing the B–X system of the iodine molecule,’’ J.Mol. Spectrosc. 80, 41–55 119802.
36. J. P. Woerdman and M. F. H. Schuurmans, ‘‘Effect of satura-tion on the spectrum of degenerate four wavemixing on atomicsodium vapor,’’ Opt. Lett. 6, 239–241 119812.
37. J. Tellinghuisen, ‘‘Intensity factors for I2 B–X band system,’’ J.Quant. Spectrosc. Radiat. Transfer 19, 149–161 119782.
38. D. A. Shirley and W. F. Giaque, ‘‘The entropy of iodine. Heatcapacity from 13 to 327 K. Heat of sublimation,’’ J. Am.Chem. Soc. 81, 4778–4779 119592.
39. J. C. McDaniel, ‘‘Investigation of laser induced fluorescence offor the measurement of density in compressible flows,’’ Ph.D.dissertation 1Department of Aeronautics and Astronautics,Stanford University, Stanford, Calif., 19812.
40. M. Versluis, G. Meijer, and D. W. Chandler, ‘‘Degeneratefour-wave mixing with a tunable excimer laser,’’ Appl. Opt. 33,3289–3295 119942.
20 June 1995 @ Vol. 34, No. 18 @ APPLIED OPTICS 3289


![SECTORIAL FORMS AND DEGENERATE DIFFERENTIAL OPERATORS€¦ · SECTORIAL FORMS AND DEGENERATE DIFFERENTIAL OPERATORS 35 [25]. By our approach we may allow degenerate coefficients](https://img.pdfslide.net/doc/110x75/5e921c5c4d7aaf24746c11ab/sectorial-forms-and-degenerate-differential-operators-sectorial-forms-and-degenerate.jpg)